Article

The Optimal Capacity Estimation of Nature-Based Facilities Considering Land Cover Characteristics

1
Department of Environmental Engineering, University of Seoul, Seoul 02504, Republic of Korea
2
Water Resources Headquarters of Gyeonggi Province, Uijeongbu 12708, Republic of Korea
*
Author to whom correspondence should be addressed.
Water 2025, 17(9), 1323; https://doi.org/10.3390/w17091323
Submission received: 28 February 2025 / Revised: 22 April 2025 / Accepted: 24 April 2025 / Published: 28 April 2025
(This article belongs to the Special Issue Advanced Research in Non-Point Source Pollution of Watersheds)

Abstract

:
Non-point source (NPS) pollution in agricultural land continues to rise despite urbanization in South Korea. NPS pollution management in rural areas has been conducted using Best Management Practices (BMPs) to reduce NPS pollution in rural areas. Among them, nature-based facilities are commonly used to reduce runoff NPS pollution. To design such facilities, it is necessary to determine the Water Quality Volume (WQv), which serves as a key indicator for evaluating the performance of pollution reduction facilities, as well as the estimation of the design rainfall intensity. These are critical factors for the design of the delineation of catchment areas and NPS pollution reduction. However, conventional methods for capacity estimation often rely on total area rather than considering the specific land use distribution, leading to lower pollution reduction efficiency and excessive project costs. Therefore, this study uses actual monitoring data from existing nature-based facilities, and an analysis was performed to establish a method for determining their optimal capacity while accounting for land use characteristics. A regression analysis was conducted based on the land use area ratio, and the results demonstrated that the proposed method yields similar or improved outcomes in terms of water quality improvement and economic feasibility compared to conventional capacity estimation methods. These findings highlight the importance of incorporating diverse land use distributions into capacity estimation for improving NPS pollution management efficiency by enhancing water quality and reducing project costs.

1. Introduction

The major sources of non-point source (NPS) pollution are primarily land-based pollution sources, including roads, developed land, and rural land use. In South Korea, agricultural land area has decreased by approximately 281,000 ha over 17 years, reaching 1,565,000 ha in 2020 due to road construction and urban expansion. However, data from 2018 indicate that land-based sources accounted for 39.3% of BOD and 48.6% of TP among NPS pollution loads in the four major river basins, demonstrating an increasing contribution of agricultural NPS pollution. Therefore, the scientific quantification of agricultural NPS pollution from extensive land use and the establishment of effective management strategies are urgently required.
According to the Ministry of Environment [1] and Lee [2], despite significant financial investments in rural water quality improvement, there has been little progress due to ineffective facility design that fails to consider the characteristics of pollutant inflow. To address these issues, it is necessary to refine the capacity estimation formula by incorporating the scope and characteristics of land use.
The Non-Point Source Pollution Management Manual and the Study on the Improvement of the Non-Point Source Pollution Facility Reporting System classify NPS pollution control facilities into nature-based facilities and mechanical facilities. For nature-based facilities, the required treatment capacity is set to manage at least 5 mm of accumulated runoff depth, whereas mechanical facilities are designed based on an 80% probability rainfall intensity for the region. Additionally, both the Non-Point Source Pollution Manual and the Water Environment Conservation Act stipulate that all NPS pollution control facilities, regardless of type, should be designed to handle a minimum of 5 mm of rainfall converted into accumulated runoff depth [3,4].
Numerous studies have been conducted in this field, and for nature-based facilities designed after 2007, the efficiency levels for the parameters specified by law are reported as 53% for BOD, 60% for TP, and 37% for TN [4].
This study newly proposed a method for determining the capacity of nature-based facilities designed to reduce non-point source (NPS) pollution. NPS pollution originates from numerous unspecified sources and contributes to the deterioration of streamflow and water quality due to stormwater runoff. Unit loads have been widely applied to quantify pollutants in unmonitored areas. In particular, the United States Total Maximum Daily Load (TMDL) program has utilized unit loads to quantify pollutant loads. In Korea, monitoring was conducted over approximately nine years (2008–2016) on 17 types of single land cover types, including both single and composite land uses. Among them, the unit load for bare land was estimated to be the highest. On the other hand, the unit loads for land uses such as paddy fields, dry fields, and forests were approximately 4 to 10 times lower than that of bare land. Therefore, when designing NPS control facilities for areas with composite land use, it is essential to consider land use types, as the pollutant discharge may vary depending on each land use category.
The conventional capacity calculation formula estimates the Water Quality Volume (WQv) based on the runoff coefficient and the drainage area. In the United States, the runoff coefficient for the design rainfall over the target area is typically set based on rainfall depths ranging from 0.5 to 1 inch. Here, 0.5 inches corresponds to the rainfall depth that captures approximately 80% of the annual precipitation, while 1 inch corresponds to approximately 90% of the annual precipitation.
Certainly, there is a capacity calculation formula based on the rational method using the runoff coefficient. However, for nature-based facilities, the design capacity is determined based on the regional rainfall converted to cumulative runoff depth, and is set to treat at least 5 mm of runoff. According to the Non-Point Source Pollution Manual and the Water Environment Conservation, the required capacity—regardless of whether the facility is device-based or nature-based—is specified as the volume necessary to treat a minimum of 5 mm of rainfall, based on cumulative runoff depth derived from local precipitation data [5,6].
As such, non-point source (NPS) pollution exhibits highly variable runoff characteristics depending on the drainage area, land use type, and rainfall events. Therefore, the design capacity of NPS pollution control facilities should reflect the social and environmental characteristics of the region in which they are installed. However, a precise design method based on the drainage area has not yet been established.
Moreover, since the project cost for most NPS control facilities—such as constructed wetlands—is typically estimated based on the drainage area [4], the area is also a major economic consideration. For urban NPS pollution, design formulas that incorporate the volumetric runoff coefficient (Rv), which accounts for the percentage of impervious surface area, have been established to determine appropriate facility capacities according to land cover types [1,3,4]. In contrast, for rural NPS pollution, where land use is more diverse and multiple factors must be considered, no standardized formula has yet been developed.
However, the existing calculation formula is based on a runoff coefficient of 0.7, which generally applies to urbanized areas where land use predominantly consists of impervious surfaces, maintaining a single land cover type. As a result, the estimated runoff load tends to be high. In contrast, rural areas that preserve more natural ecosystems may experience an underestimation of the pollutant load reduction achievable through the installation of non-point source (NPS) pollution control facilities. Therefore, the runoff characteristics are a critical factor in determining the drainage area for NPS control facilities. In particular, it is essential to calculate the runoff volume based on the area associated with each land use type, as it is closely related to the runoff behavior [7].
Therefore, since the drainage areas in rural regions consist largely of pervious surfaces rather than impervious ones, it is considered that considering the runoff volume by land use type can lead to the design of economically efficient and effective facilities by determining an appropriate drainage area.
The drainage area size is not only crucial for the appropriate capacity determination of NPS pollution control facilities but also directly affects project costs. Unlike urban areas, rural drainage areas contain both permeable and impermeable surfaces. By considering the runoff volume of different land use areas within a given drainage basin, it is possible to estimate an appropriate drainage area size, leading to more cost-effective and efficient NPS pollution reduction facilities.
Thus, determining the ideal capacity according to various drainage areas and land use distributions can improve water quality and reduce project costs for non-point source pollution management; therefore, this study aims to develop a methodology for determining the optimal facility capacity in rural areas by applying runoff volume coefficients based on land use within the drainage area.

2. Materials and Methods

2.1. Study Area

This study focuses on rural areas and is based on monitoring data collected from five nature-based facilities during rainfall events. The monitoring data were gathered over the past three years [8,9,10], with two monitoring events per year, totaling six rainfall events for which both inflow and outflow points at each facility were examined. Therefore, for each study area, a total of six monitoring campaigns conducted over a three-year period were used, with each campaign comprising more than six individual monitoring sessions. The geographical location of the study areas and the drainage area for each facility are presented.
The monitoring in rural areas was conducted under the conditions of at least 3 antecedent dry days (ADDs) and a rainfall event of at least 10 mm, with two flow and water quality surveys carried out per event. Based on daily average values, event mean concentrations (EMCs) were analyzed for a total of six rainfall events. The monitored parameters included five water quality indicators—BOD, COD, SS, TN, and TP—as well as flow rate, pollutant load, treatment efficiency (%) before and after facility operation, and runoff volume (m3) generated from the drainage area during rainfall events [8,9,10]. The flow measurement points were located at the inflow and outflow of the facility. Flow measurements were conducted using a propeller-type flow meter and an electromagnetic flow meter, and discharge was calculated based on water level measurements and stage–discharge curves [8,9,10]. Water quality analysis was performed in accordance with the Standard Methods for Water Pollution Process Tests [11].

2.2. Monitoring Survey and Analysis of Observational Data

First, to assess pollutant loads by land use type, the reduction efficiency of facilities, and capacity estimation, the proportion of land use within the drainage area was categorized. The classifications included the following:
  • Forest area ratio (FA/TA, forest surface area/total surface area)
  • Dry field area ratio (DA/TA, dry paddy field area/total surface area)
  • Paddy field area ratio (PA/TA, paddy field area/total surface area)
  • Urban impervious area ratio (IPA/TA, impervious area/total surface area)
These ratios were analyzed accordingly, and the calculation formula is provided in Equation (1).
P e r c e n t a g e   o f   W E D G E U s e % = P A     o r     D A   o r     I P A     o r   F A   o r   E T C   T A   T o t a l   A r e a   ×   100
Secondly, the event means concentration (EMC) was calculated using the observed flow data and corresponding water quality data for each rainfall event, as shown in Equation (2). Here, the EMC is the average concentration (mg/L) for a specific rainfall event.
The total inflow load (pollutant load) is expressed as the product of Qi and Ci, which corresponds to the numerator of Equation (2). Since the EMC simultaneously reflects both water quality and flow rate, it is considered a key factor in assessing non-point source pollution.
E M C   m g L   =   Σ Q i   ×   C i Σ Q i
Q i : flow m 3 h , C i : Contaminant Water Quality m g L .
Thirdly, the efficiency of the facility was assessed. There are several methods for evaluating the performance of non-point source pollution reduction facilities, including the Summation of Loads Method, Removal Efficiency Method, and Mean Concentration Method [1].
The Summation of Loads Method is defined as the efficiency based on the ratio of the total pollutant load at the inflow to the total pollutant load at the outflow. In other words, the removal efficiency is calculated using the total inflow and total outflow loads. This method was used to evaluate the efficiency of non-point source pollution reduction facilities.
E f f i c i e n c y %   o f   S O L = 1 l o a d o u t l o a d
T o t a l   l o a d o u t     a n d     l o a d   =   j = 1 m ( i = 1 n C i V i ) = i = 1 m E M C j × V j

2.3. Correlation Analysis for Deriving the Optimal Capacity Relationship Equation

First, in order to analyze the correlation between rainfall and relevant variables, the Pearson or Spearman correlation method was applied using the cor(x, y, method = “pearson” or “spearman”) function in R programming. The dataset was input into variable x, and correlation coefficients were calculated for different variable combinations. Data from five sites over three years (six measurement events) were analyzed, considering rainfall patterns to identify the most influential correlation factors related to rainfall. The readxl package in R Studio 4.0.3 was used to import datasets, and correlation coefficients and statistical tests were computed using the cor and cor.test functions.
The second analysis focused on land use area ratios. According to Table 1, the R2 value and p-value for the correlation between rainfall and runoff volume were assessed for significance. Based on this, data from five sites over three years (six measurement events) were analyzed, considering rainfall patterns to determine the correlation between runoff volume (m3) during rainfall events and land use area ratios in mixed land cover areas. In R programming, datasets were imported using the readxl package, and correlation coefficients were computed using the cor and cor.test functions. The results were visualized using library(corrplot) to present correlation patterns in a graphical format.
When determining the capacity of non-point source pollution reduction facilities, the primary factors to consider are the rainfall amount and drainage area of the target site. According to the Non-Point Source Pollution Management Manual and the Facility Installation Reporting System, the Water Quality Volume (WQv, m3) corresponding to an accumulated runoff depth of 5 mm is calculated using Equation (5). Equation (5) is applied in cases where no specific design criteria exist, allowing the regional rainfall amount to be converted into accumulated runoff depth. This ensures that at least 5 mm of rainfall is accounted for as the design rainfall volume.
W Q v = P 1 × A
P1: Design rainfall converted into accumulated runoff; A: drainage area.
However, Equation (5) considers only the total area of the drainage basin and does not account for the characteristics of different land uses. Non-point source pollution exhibits significantly different runoff characteristics depending on the drainage area, land use types, and rainfall events. However, Equation (5) fails to reflect these factors.
Therefore, in this study, based on the monitoring results presented in the previous chapter, a multiple regression analysis was developed after verifying the statistical significance and reliability of the independent variables related to the capacity estimation equation that incorporates land use-specific characteristics.
The Pearson correlation coefficient and the Spearman correlation coefficient are commonly used methods for measuring the degree of correlation between variables. The Spearman correlation coefficient is applied when analyzing relationships within ordinal data, while the Pearson correlation coefficient is widely used for continuous variables. The correlation coefficient (r) ranges from −1 to 1, where a value between 0.7 and 1 indicates a strong positive linear relationship, a value between 0.3 and 0.7 suggests a moderate linear relationship, and a value between 0.1 and 0.3 represents a weak linear relationship. If the value is between −0.1 and 0.1, the relationship is considered negligible. When the r-value is negative within these ranges, it indicates a negative linear relationship.
Simple regression analysis is a statistical method used to examine the causal relationship between two variables, whereas multiple regression analysis extends this approach by analyzing the relationship between one dependent variable and two or more independent variables. Both analyses involve developing a mathematical model or regression equation to predict the dependent variable based on independent variables, validating the equation through statistical testing, and ultimately applying it for prediction. A simple regression model, consisting of a single independent variable and a dependent variable, is expressed in Equation (6).
Y   =   a 0   +   a 1 x
Y : dependent variable; x : independent variable.
Multiple regression analysis, which consists of multiple independent variables, is expressed as shown in Equation (7).
Y = a 0 + a 1 × 1 + a 2 × 2 + a 3 × 3 + + a n × n a 0 ,   a 1   e t   a l . ;   r e g r e s s i o n   c o e f f i c i e n t
The difference between the predicted values (fitted values) calculated from the regression equation and the actual measured values in the dataset is referred to as the residual. The extent to which the dependent variable is explained by the regression model is evaluated using F-statistics, the coefficient of determination (R-squared), and the adjusted coefficient of determination (Adjusted R-squared).
To determine an appropriate regression model, multiple regression analysis employs various variable selection methods, including enter (all selection), forward selection, backward elimination, and stepwise selection. The enter method includes all independent variables, even those with no significant impact, which can result in an over fitted or inaccurate model. The forward selection method starts with the most influential variable and sequentially adds other significant variables until only impactful variables remain in the model. The stepwise selection method combines both forward selection and backward elimination, ensuring that once a variable is selected, it either remains in the model or is removed based on statistical significance.
According to Table 2, the regression equations derived from this analysis were based on previously studied independent variables and their relationships with dependent variables. Since multiple regression analysis includes multiple independent variables, the model is expressed as Y = a0 + a1x1 + a2x2 + a3x3 + … + anxn, where the regression coefficients a0 and a1 were determined. The predicted values were verified using fitted value codes, and the difference between the predicted and actual measured values was examined as residuals.
In this study, multiple regression analysis was performed using the lm() function in R, applying the formula lm(data = ?, x ~ y + z + …). The performance of the regression equation, derived from the selected independent variables, was evaluated using the summary() function, employing the forward elimination method. Visualization was conducted using library(corrplot).
The runoff volume was analyzed based on runoff per unit drainage area in the study site. The land use area ratio was calculated as the proportion of paddy fields, dry fields, forests, developed land, and other land types relative to the total area of the study site. An estimation equation was developed to analyze how runoff volume varies across different drainage areas under the same rainfall conditions.

2.4. Suitability Assessment

Numerous studies have conducted watershed models to analyze non-point source (NPS) pollution [12]. The various management scenarios have been studied to control NPS pollutant loads [13]. The characteristics of NPS runoff and load results can be determined, and regions vulnerable to NPS pollution can be identified. These also support the establishment of water quality management, enabling more effective watershed management [14]. Basin modeling is used for hydrological and water quality modeling at the watershed scale [15]. Watershed modeling should reflect various land cover uses, but in general, there is a limit to reflecting the characteristics being discussed [16]. The model is used for hydrological and water quality modeling at the field-scale agricultural watershed and plot levels. APEX is an extended version of the SWAT model and is employed to conduct a detailed analysis of the impacts of agricultural practices. For example, it can be used to simulate hydrological and water quality processes in paddy fields or to assess the effects of agricultural non-point source pollution [17]. By linking the two models, it is possible to perform hydrological and water quality modeling that considers both watershed- and field-scale processes. In this integrated modeling framework, the SWAT model is first used to simulate hydrological and water quality processes at the watershed scale, followed by detailed analyses at the field scale using the APEX model [18]. Monitoring based on direct measurements remains the most accurate method for analyzing flow and water quality that directly affect the stream [19]. However, some studies have emphasized that non-point source pollution varies significantly depending on land use, hydrological processes, and pollutant discharge patterns. As such, rainfall event monitoring is considered essential, and the application of empirical formulas based on this monitoring is recommended. We Studied the capacity and reduction efficiency of facilities by analyzing monitoring data collected at the inflow and outflow points of five rural areas with distinct characteristics.
In this section, the conventional WQv and the WQv-LU equations were applied to the Songya Stream watershed, the designated study area. This region was selected due to its rural non-point source pollution characteristics, its exceedance of river and water quality standards, its gentle slope, and the absence of interfering factors such as environmental infrastructure, making it a high-priority area for non-point source pollution management. The selected area is the Songya Stream watershed in Andong City, as shown in Figure 1.
After fixing the cumulative runoff depth at 5 mm and estimating the facility capacity based on the drainage area, the changes in pollutant load before and after facility implementation in the Songya watershed were analyzed. This included a comparison of the pollutant load reduction and cost savings between the WQv-LU and the conventional WQv approaches. The validity of the proposed equation in this study was evaluated using the chart in Figure 2.
The final evaluation of the applicability of WQv and WQv-LU was conducted by comparing the pre- and post-facility results using FDCs and LDCs at the downstream points of each sub-watershed and the confluence areas, to assess improvements in stream water quality and pollutant load within the study area.
At this stage, the project cost is estimated by considering various factors such as the type and capacity of the reduction facility and whether land acquisition is required. Table 3 presents the criteria according to the type of facility and the area. The approximate project cost based on the facility type and capacity is calculated with reference to Table 4.

3. Results and Discussion

3.1. Monitoring Results

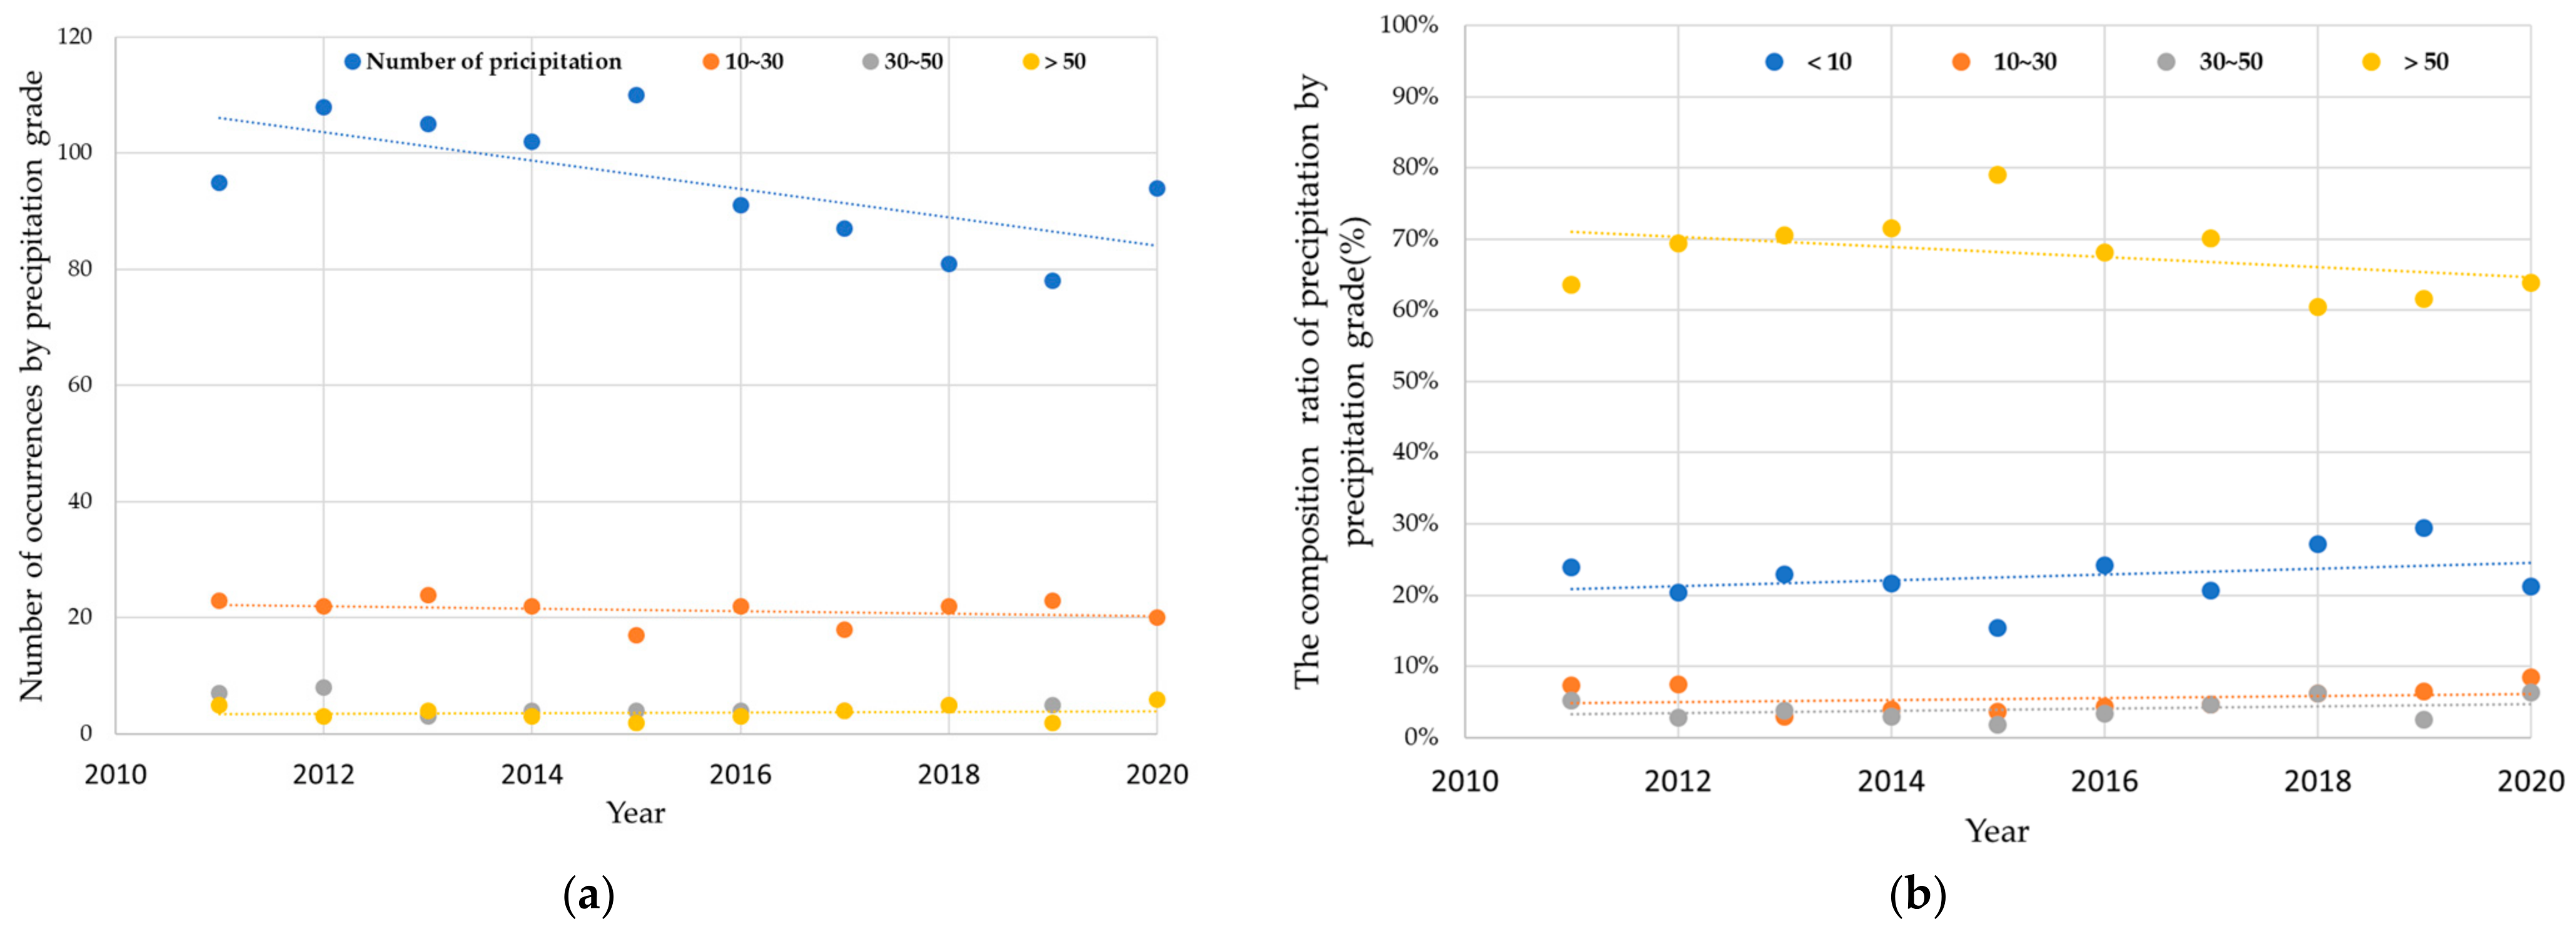
Rainfall trends over the past three years were analyzed using data from weather observation stations in the five study areas. The study regions exhibited the highest annual frequency of 10–30 mm rainfall events, rather than events exceeding 50 mm. However, while the total annual rainfall showed a decreasing trend, the frequency of rainfall events exceeding 50 mm has been increasing since 2015.
Unlike total rainfall, the frequency of 10–30 mm rainfall events and those exceeding 50 mm demonstrated an inverse relationship in their fluctuations. Due to the increasing unpredictability of rainfall trends caused by climate change, the challenges associated with non-point source pollution and its management have become increasingly significant, as shown in Figure 3.
The five study sites all exhibit characteristics of rural areas, particularly with paddy fields and dry fields covering a larger area than developed land. Accordingly, the non-point source pollution reduction facilities in each study site function as nature-based facilities with retention capabilities. These facilities, including constructed wetlands and retention basins, are primarily operated to manage organic pollutants such as agricultural runoff and pesticides from farmland in rural areas.
The total drainage area across the five study sites averaged 203.03 ha. As shown in Table 5, the average land cover distribution was as follows: paddy fields (43.7 ha, 42.1%), dry fields (33.5 ha, 16.4%), developed land (47.62 ha, 12.9%), forested areas (66.52 ha, 21.5%), and other land types (11.69 ha, 7.2%). The analysis indicated that the proportion of agricultural land, particularly paddy and dry fields, was relatively high.
According to Table 6, the pollutants generated in Area A are planned to be collected and directed into the system at the discharge outlet within the site by installing an overflow weir and screening facilities. The pollutants from agricultural complex are planned to be collected at the discharge outlet of the complex and directed into the system. Additionally, to maintain a certain water level in the constructed wetland and prevent the wilting of planted vegetation due to summer droughts and evaporation, it is planned to directly intake and utilize water from the nearby Yongsulcheon Stream.
The land use status of Area B consists of a total target area of 125.7 ha, comprising 73.1 ha of dry fields, 11.2 ha of paddy fields, 16.2 ha of forest, 6.6 ha of residential land, and 18.6 ha of other land uses. Among the land uses in the watershed, dry and paddy fields account for approximately 67% of the total area, indicating a high proportion of agricultural land. The non-point source pollutants generated in the upstream area of Area B are planned to flow along the Jukrimcheon Stream and be directed into the artificial wetland near the collection point by a movable weir. Additionally, it is planned to directly intake and utilize water from the nearby Jukrimcheon Stream.
The land use status of Area C consists of a total target area of 87.87 ha, including 32.81 ha of residential land, 40.36 ha of agricultural land, 4.00 ha of other land uses, and 10.70 ha of forest. Within the watershed, agricultural land accounts for approximately 45.93% of the total area. In Area C, the artificial wetland is designed to receive runoff water collected through collection facilities and an inflow pumping station. The water will then sequentially pass through a sedimentation pond, a shallow wetland, a deep wetland, another shallow wetland, and a final sedimentation pond before being discharged into the Juksancheon Stream.
Area D has a drainage area equivalent to that of a nearby lake, and an artificial wetland was designed to reduce the need for treatment ponds, utilizing natural purification techniques before inflow into the lake. A key characteristic of this watershed is that it consists mostly of impervious surfaces and has an extensive agricultural hinterland.
Area E is a unique region where stormwater pipelines and the surrounding urban and rural environments are significantly influenced, with more than 50% of the area consisting of forested land. Due to sediment blockage issues caused by forested areas, an underground storage tank was designed to address this problem.
Area A, where an artificial wetland has been installed, experienced six rainfall events, with total rainfall ranging from 11.0 mm to 51.5 mm. The rainfall duration varied between 4 and 14 h, and the average rainfall intensity was recorded between 1.4 mm/h and 3.6 mm/h. The antecedent dry period for all events was analyzed to be at least three days.
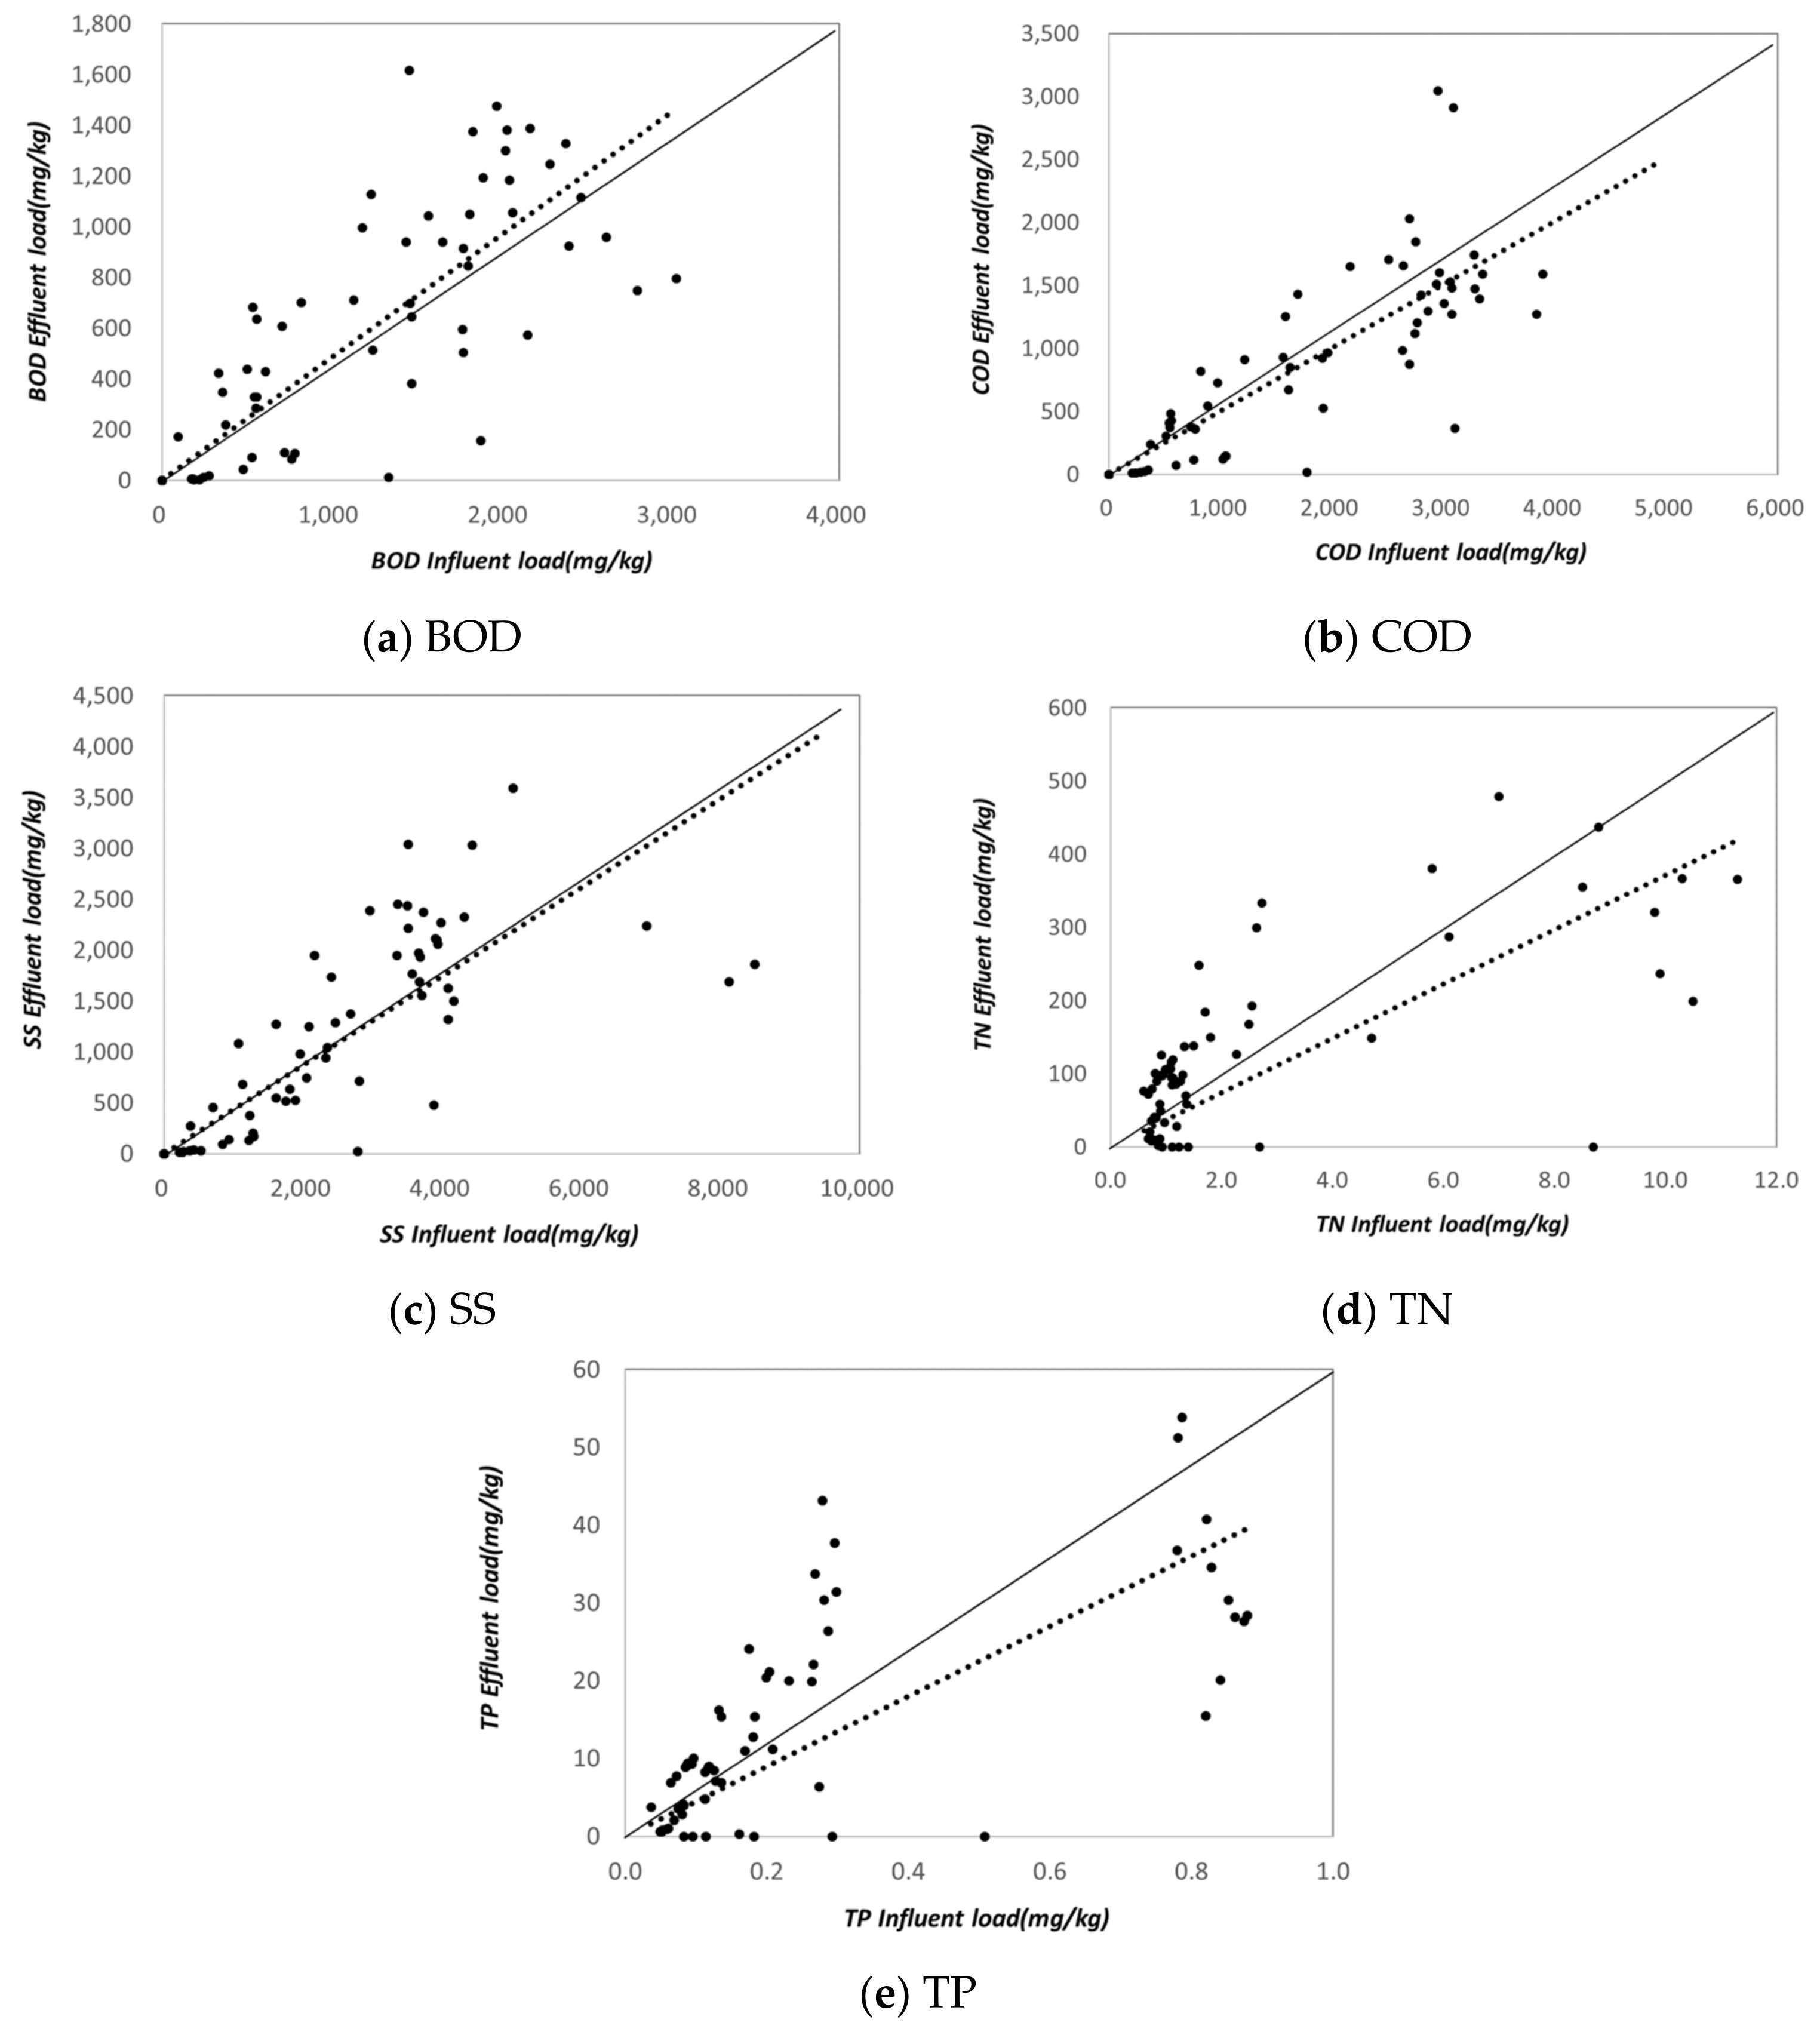
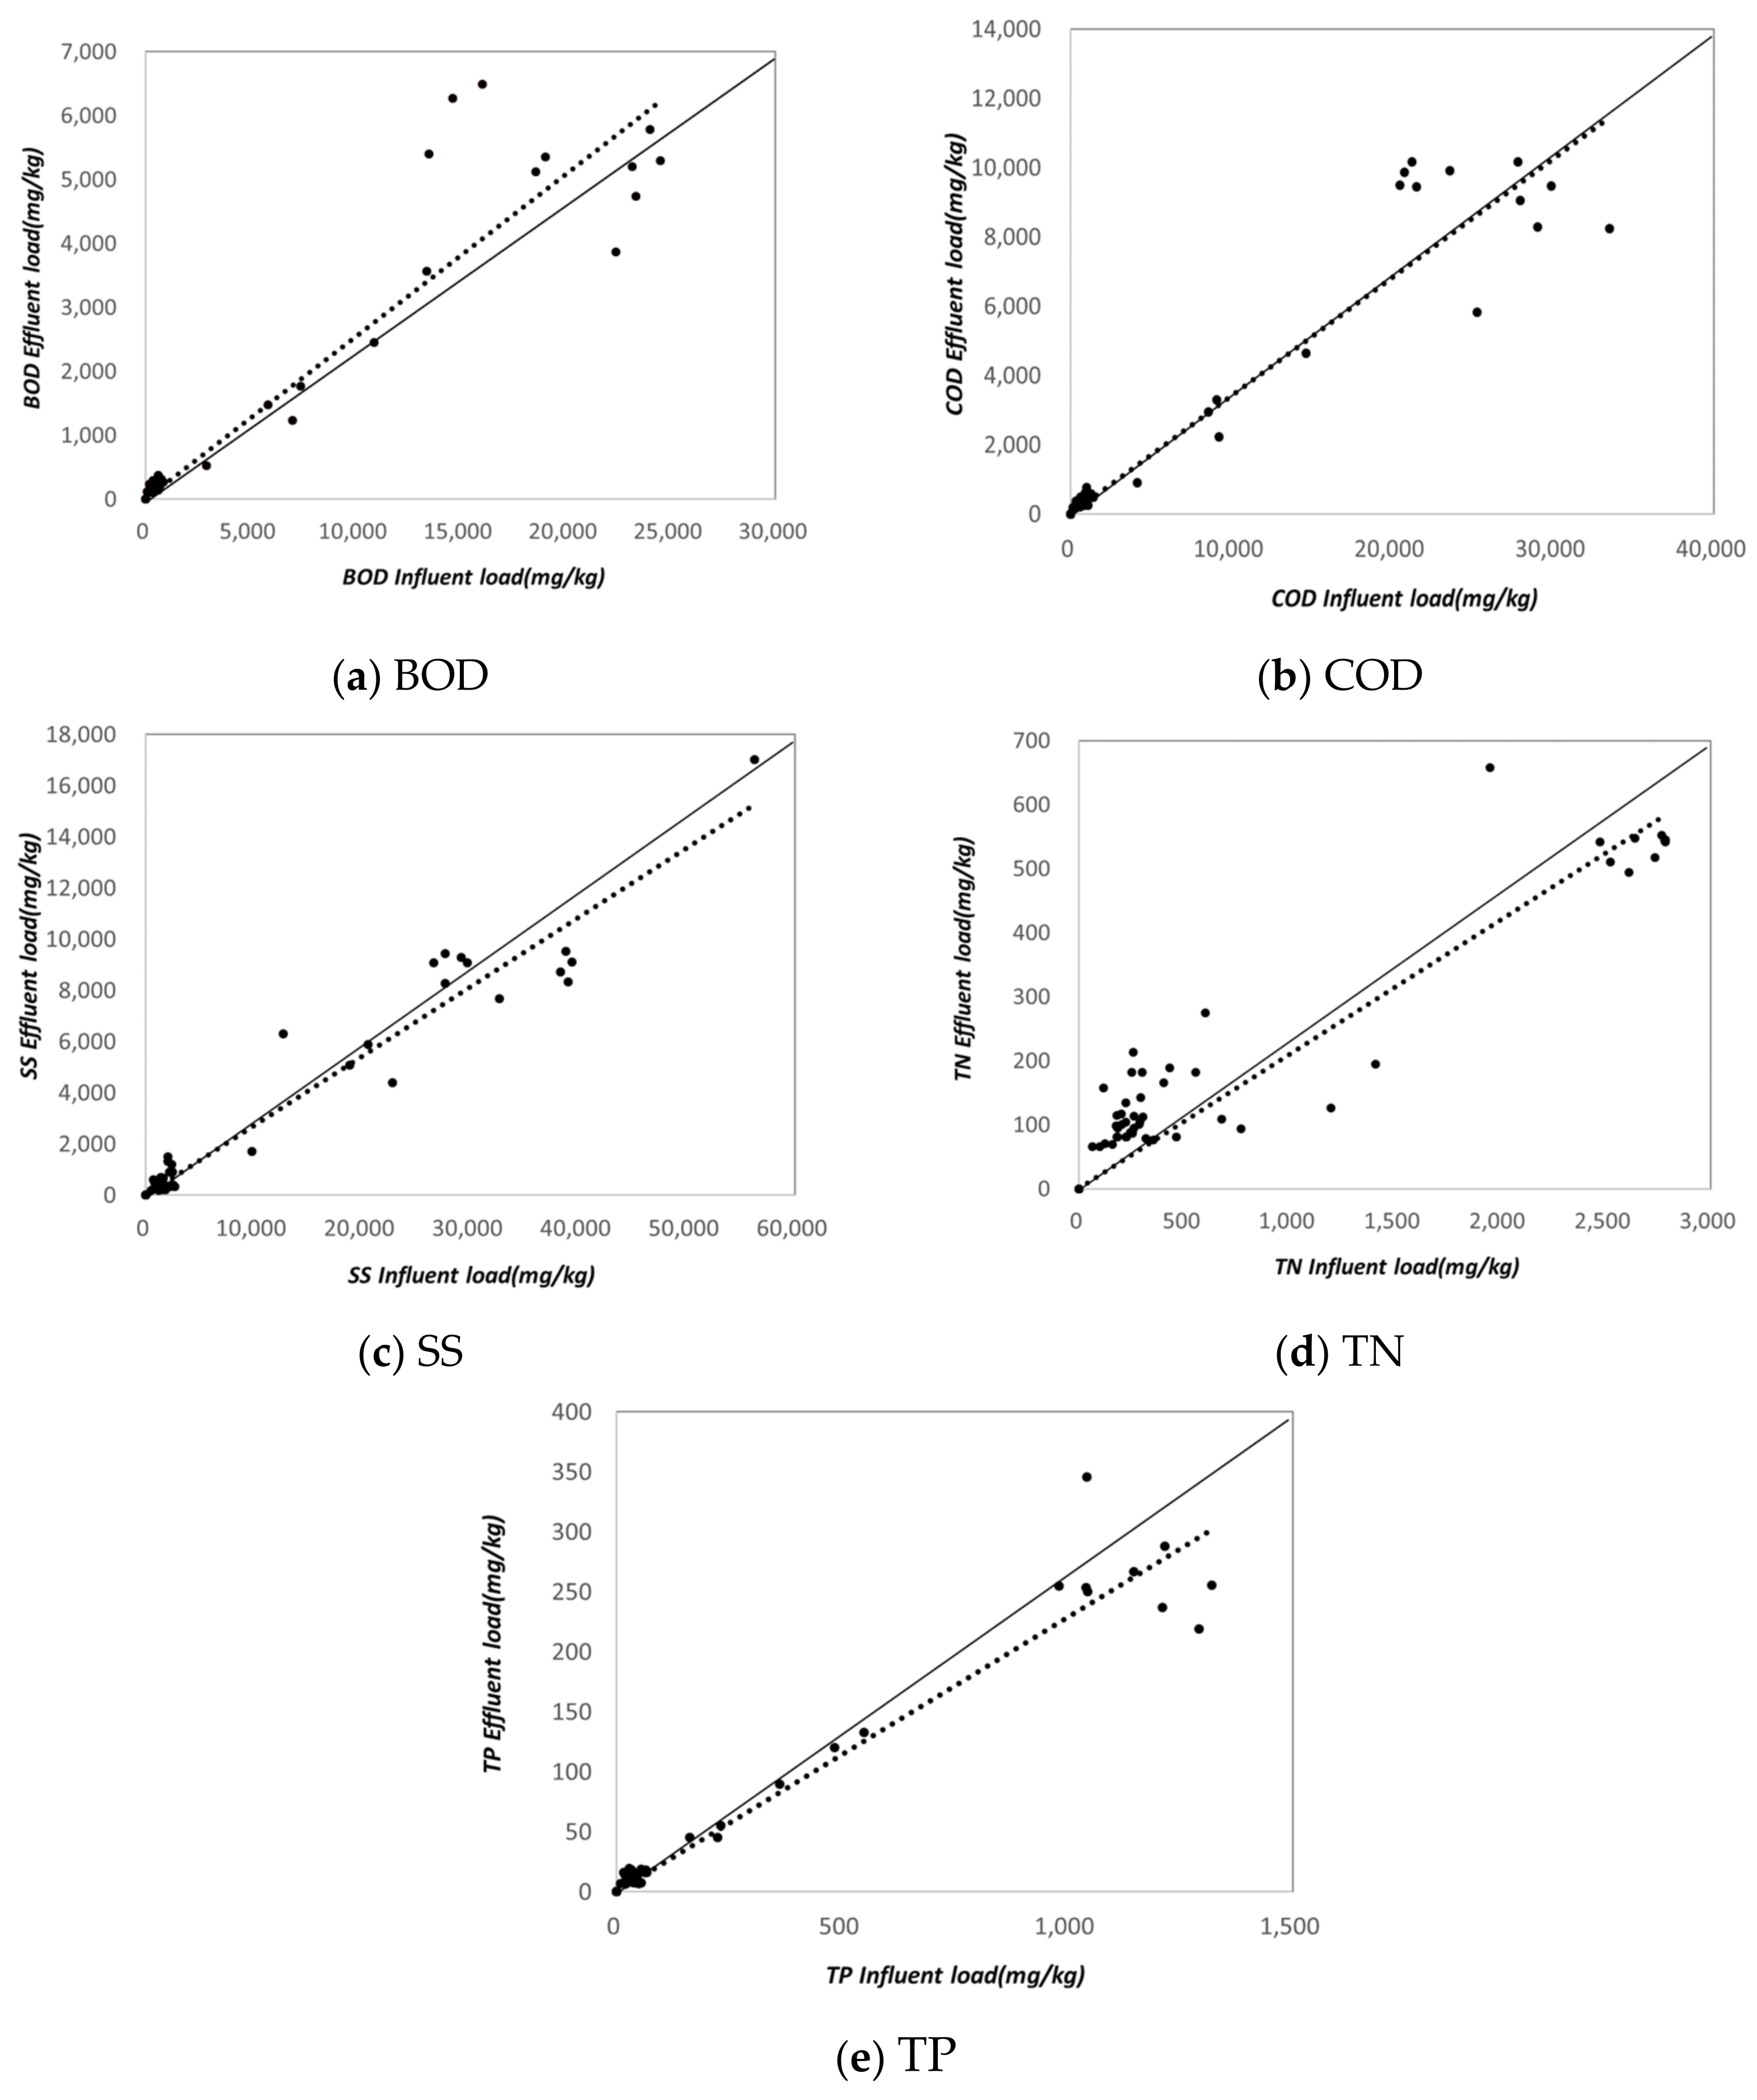
The average influent water quality was measured as BOD 14.3–16.1 mg/L, COD 19.7–23.8 mg/L, TOC 3.7–8.2 mg/L, SS 23.4–41.3 mg/L, TN 2.31–2.37 mg/L, and TP 0.18–0.29 mg/L. The average effluent water quality was recorded as BOD 11.2–12.5 mg/L, COD 14.6–23.7 mg/L, TOC 3.0–6.7 mg/L, SS 19.9–29.8 mg/L, TN 0.99–2.04 mg/L, and TP 0.08–0.12 mg/L, as shown Figure 4.
The average influent water quality of the artificial wetland in Area B was measured as BOD 7.2–8.6 mg/L, COD 14.2–14.3 mg/L, TOC 3.9–14.6 mg/L, SS 19.9–22.3 mg/L, TN 4.23–5.15 mg/L, and TP 0.14–0.30 mg/L. The average effluent water quality was analyzed as BOD 4.1–9.2 mg/L, COD 8.2–13.9 mg/L, TOC 3.2–11.0 mg/L, SS 12.6–21.4 mg/L, TN 2.78–3.06 mg/L, and TP 0.09–0.13 mg/L.
The artificial wetland in Area B was monitored twice until June 2020. The EMCs (Event Mean Concentrations)of inflow and outflow pollutants calculated from the monitoring data were as follows. Influent EMCs were BOD 8.1 mg/L, COD 14.4 mg/L, TOC 9.3 mg/L, SS 21.4 mg/L, TN 4.65 mg/L, and TP 0.22 mg/L. Effluent EMCs were BOD 6.6 mg/L, COD 11.1 mg/L, TOC 6.9 mg/L, SS 17.1 mg/L, TN 2.92 mg/L, and TP 0.11 mg/L. In Figure 4, the solid line represents an R2 value of 1, while the dashed line represents the R2 value for the respective substance. The R2 value for TP is higher than that of the other substances, indicating that the efficiency of TP is relatively higher.
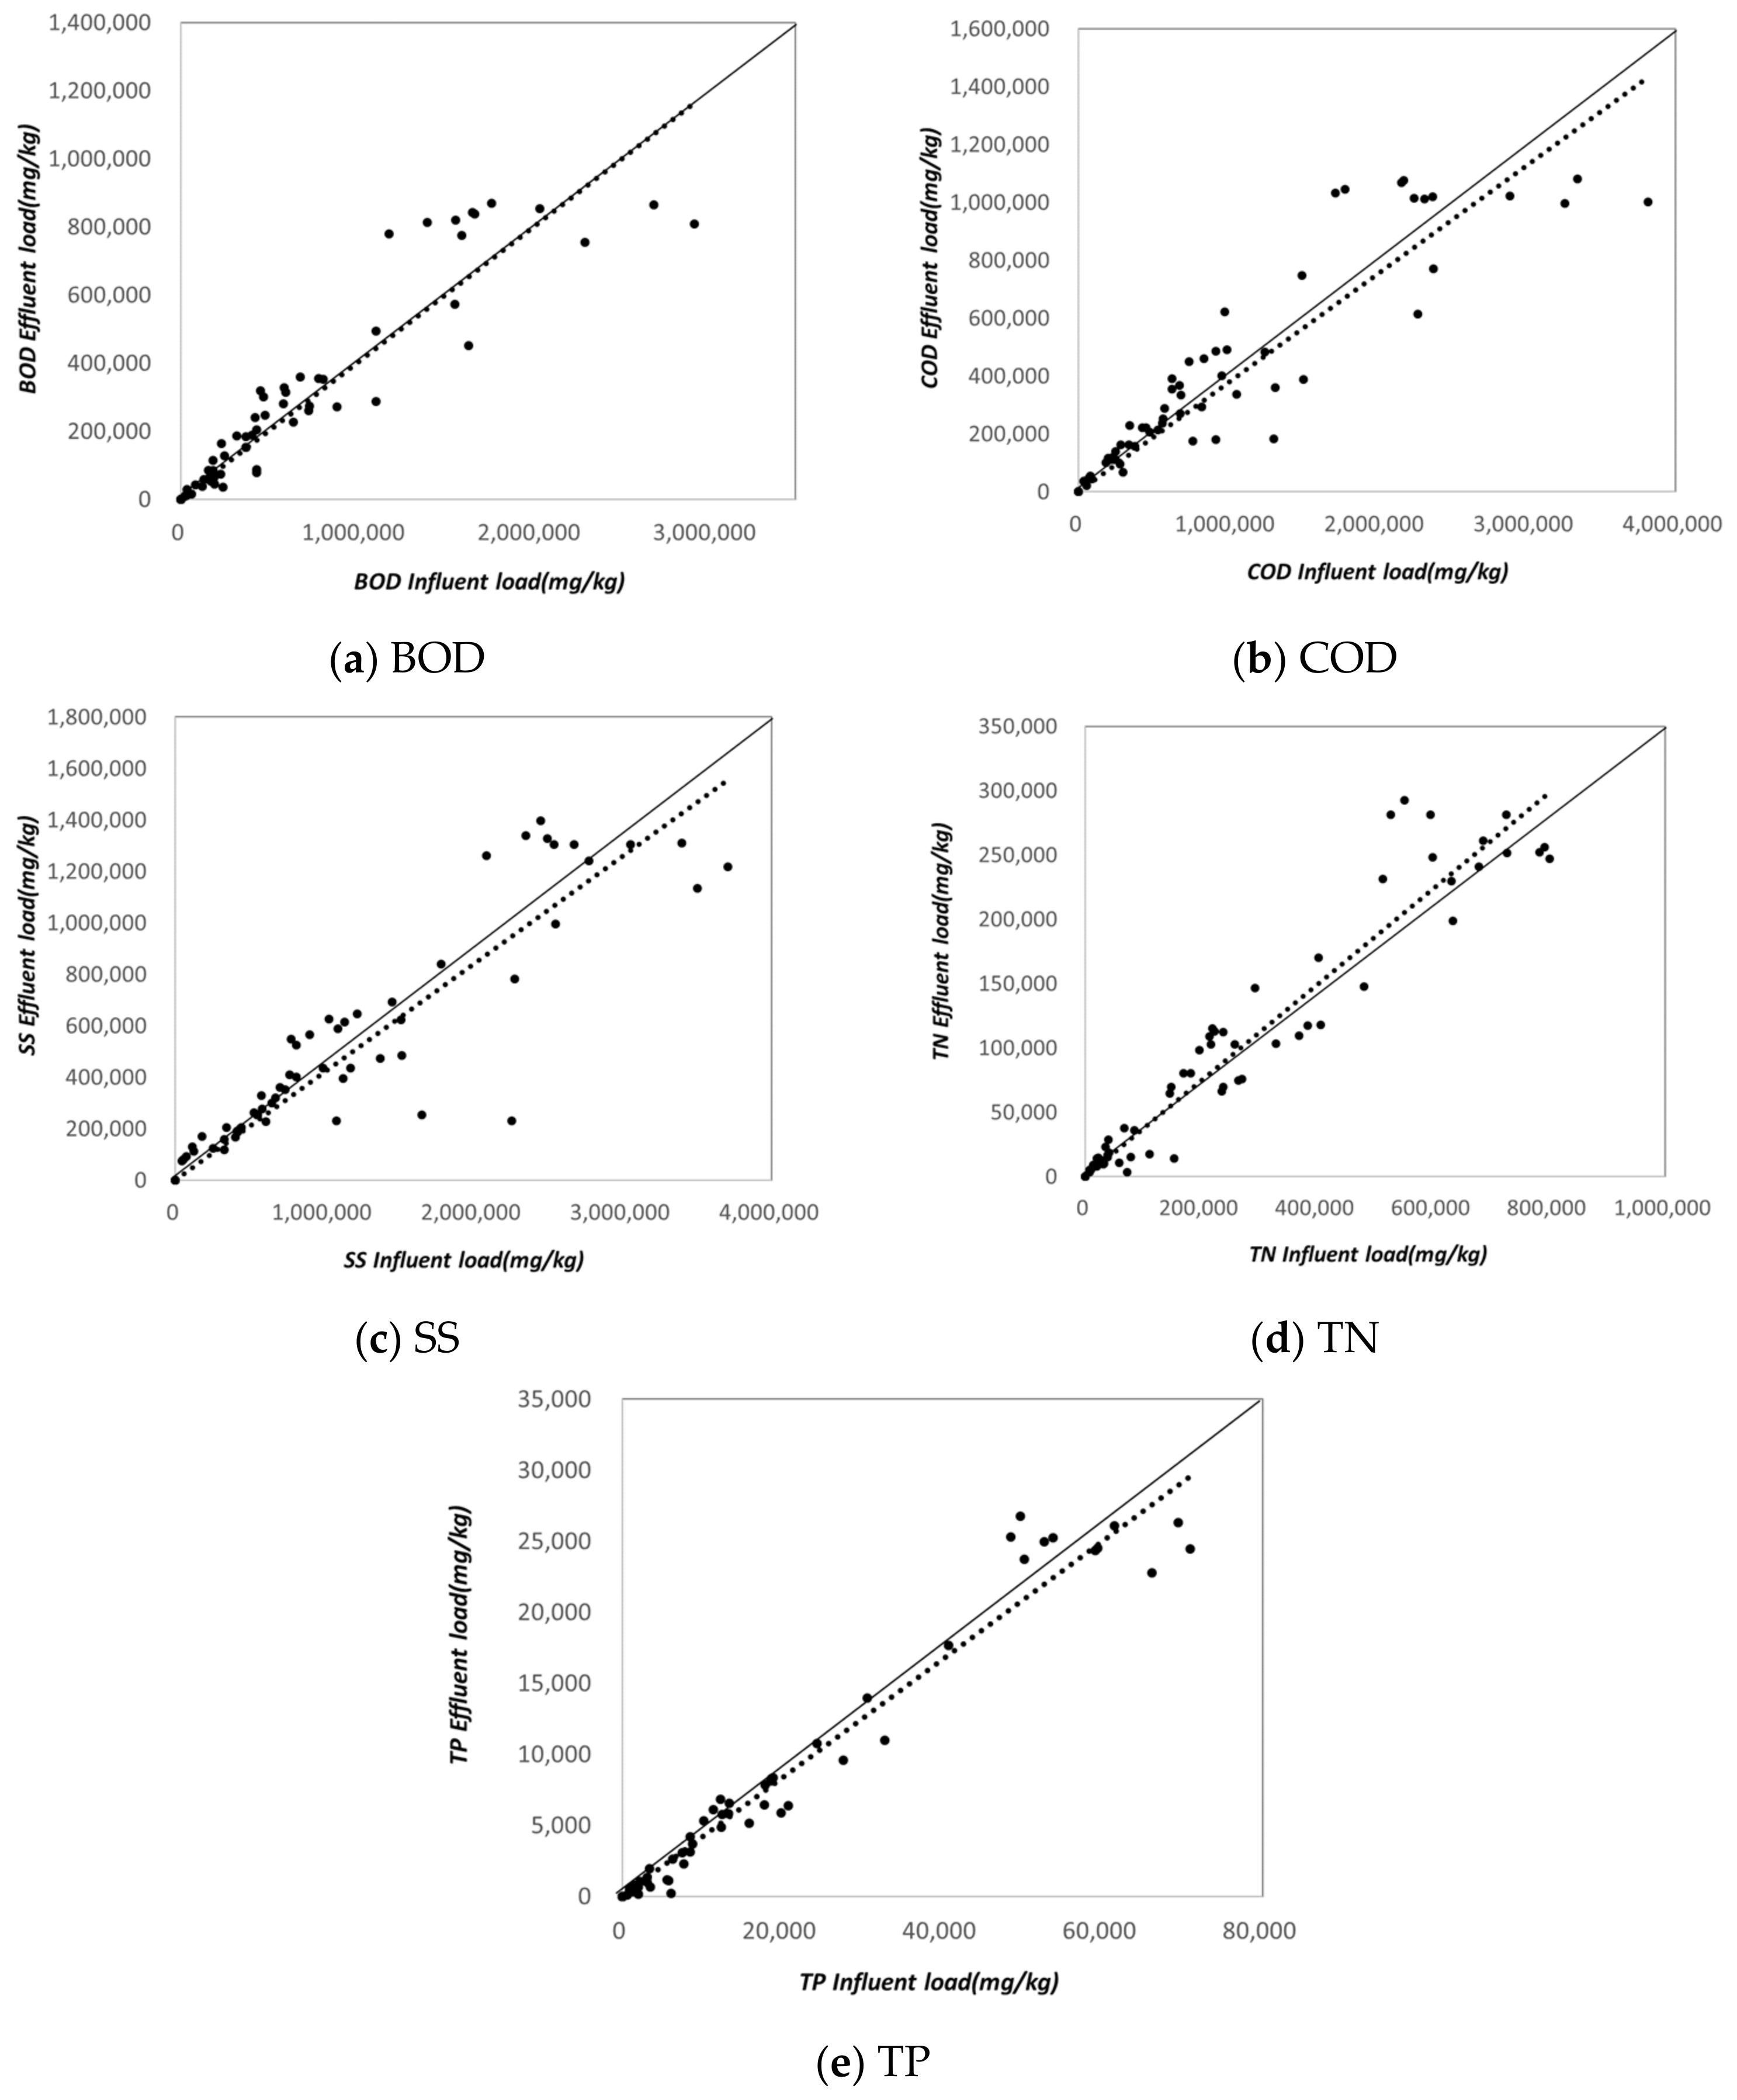
Despite heavy rainfall, the low concentration of influent water is attributed to missing the initial runoff inflow from the drainage area during monitoring. According to Figure 5, the efficiency of pollutant load reduction in the Juksancheon watershed facility in Anseong City showed a high correlation coefficient, with most R2 values exceeding 0.9 for different parameters. Particularly, SS exhibited the highest efficiency, which can be attributed to the characteristics of the Juksancheon watershed, where a high proportion of farmland and forested areas contribute to the drainage area. Thus, the results reflect the characteristics of the runoff water entering the system.
The average influent water quality of the artificial wetland in Area C was measured as BOD 3.4–9.4 mg/L, COD 5.1–19.8 mg/L, TOC 3.1–3.4 mg/L, SS 7.4–33.9 mg/L, TN 1.04–2.20 mg/L, and TP 0.09 mg/L. The average effluent water quality was analyzed as BOD 1.2–3.0 mg/L, COD 2.7–6.5 mg/L, TOC 2.8–3.1 mg/L, SS 5.7–9.5 mg/L, TN 0.36–0.63 mg/L, and TP 0.02–0.03 mg/L.
The overall average influent concentrations were recorded as BOD 6.3 mg/L, COD 12.5 mg/L, TOC 3.2 mg/L, SS 20.5 mg/L, TN 1.66 mg/L, and TP 0.09 mg/L, while the corresponding effluent concentrations were BOD 2.2 mg/L, COD 4.6 mg/L, TOC 3.0 mg/L, SS 7.6 mg/L, TN 0.48 mg/L, and TP 0.03 mg/L. According to Figure 4, the efficiency of pollutant load reduction in the Area C facility showed a high correlation coefficient (R2 > 0.9) for most parameters, indicating a strong relationship between influent and effluent quality. Notably, TN and TP reduction efficiencies were higher compared to other regions, as shown Figure 6. This characteristic is likely due to the Wangsong Lake watershed, where the proportion of farmland is significantly high. The results suggest that organic matter from agricultural activities adheres to soil particles and is washed into the water system during rainfall events, contributing to the observed pollutant reduction trends.
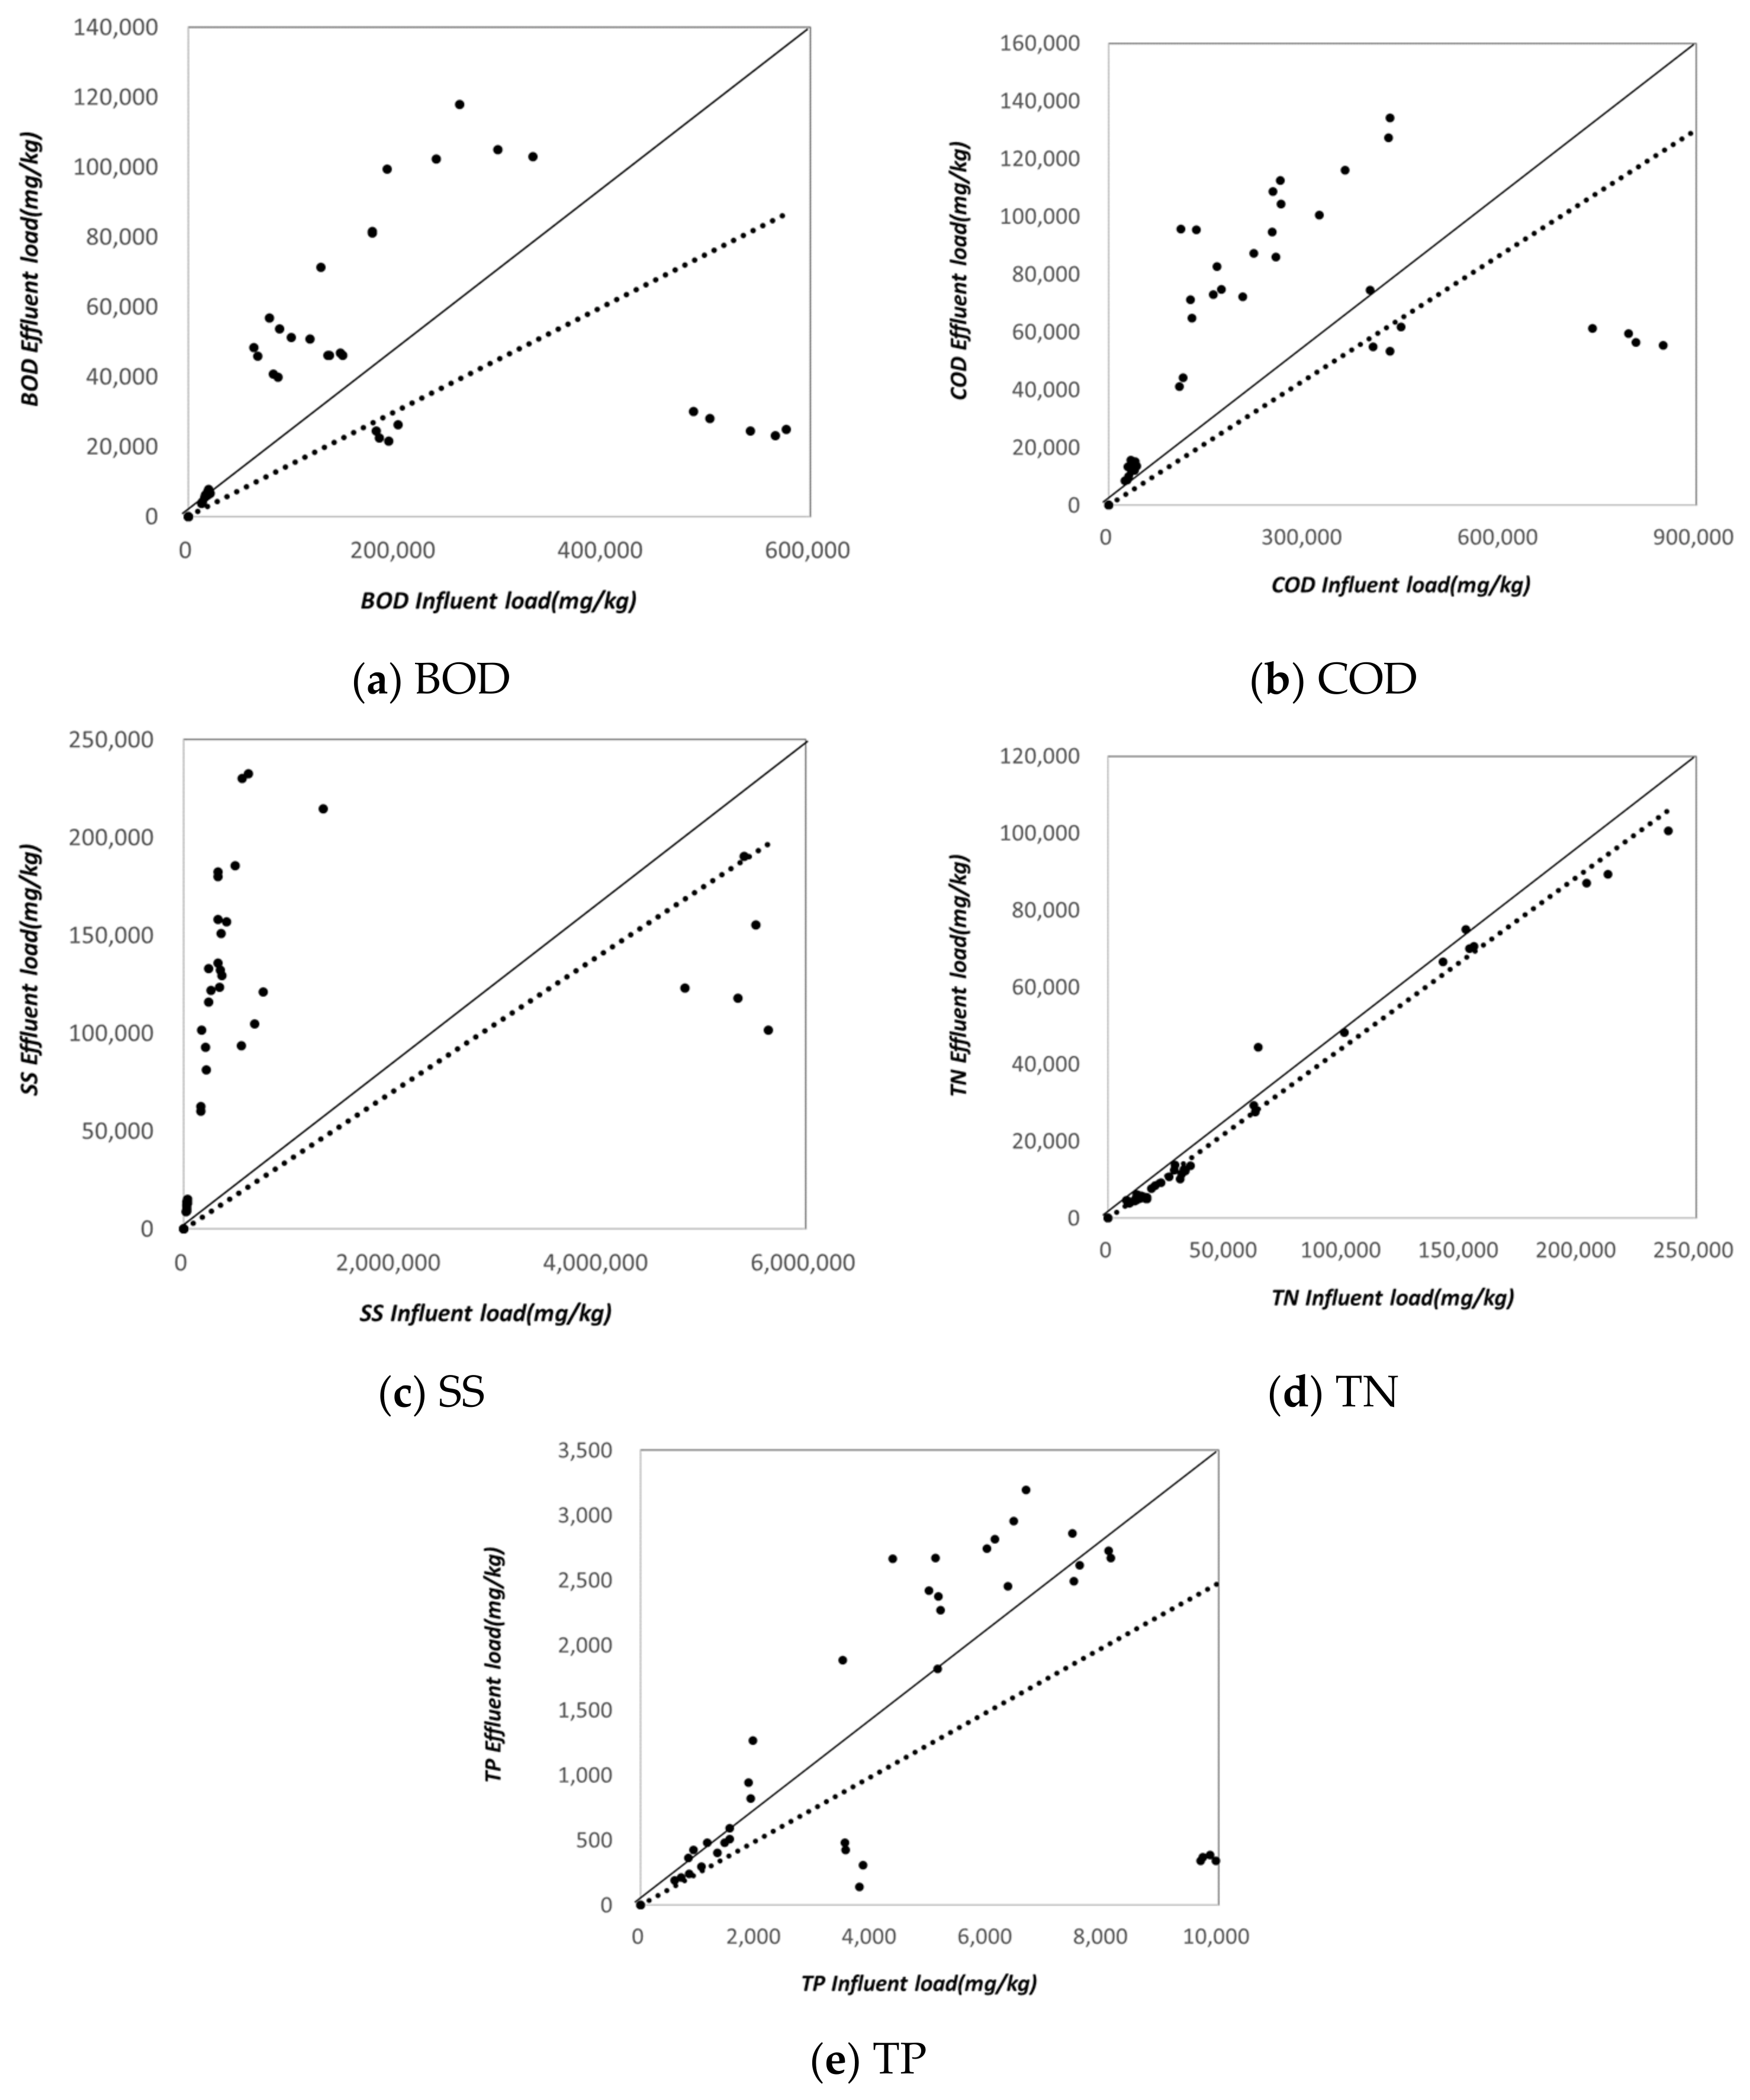
Based on the monitoring results of the Seohyeon-ro detention facility in Seongnam-si, removal efficiencies were analyzed as followsBOD 75.0%, COD 72.5%, TOC 87.4%, SS 77.5%, TN 58.6%, and TP 76.5%. In Figure 6, the solid line represents an R2 value of 1, while the dashed line represents the R2 value for the respective substance. Unlike the other four study sites, relatively low R2 values were observed for each parameter. Notably, SS, which is the primary target of detention facilities, showed the lowest correlation, suggesting that more detailed monitoring considering rainfall-related factors such as antecedent dry days is necessary. However, as shown in Figure 7, the facility was designed based on an influent BOD concentration of 34%, and the monitoring results meet the established design criteria.

3.2. Correlation Analysis for Deriving the Appropriate Capacity Estimation Equation

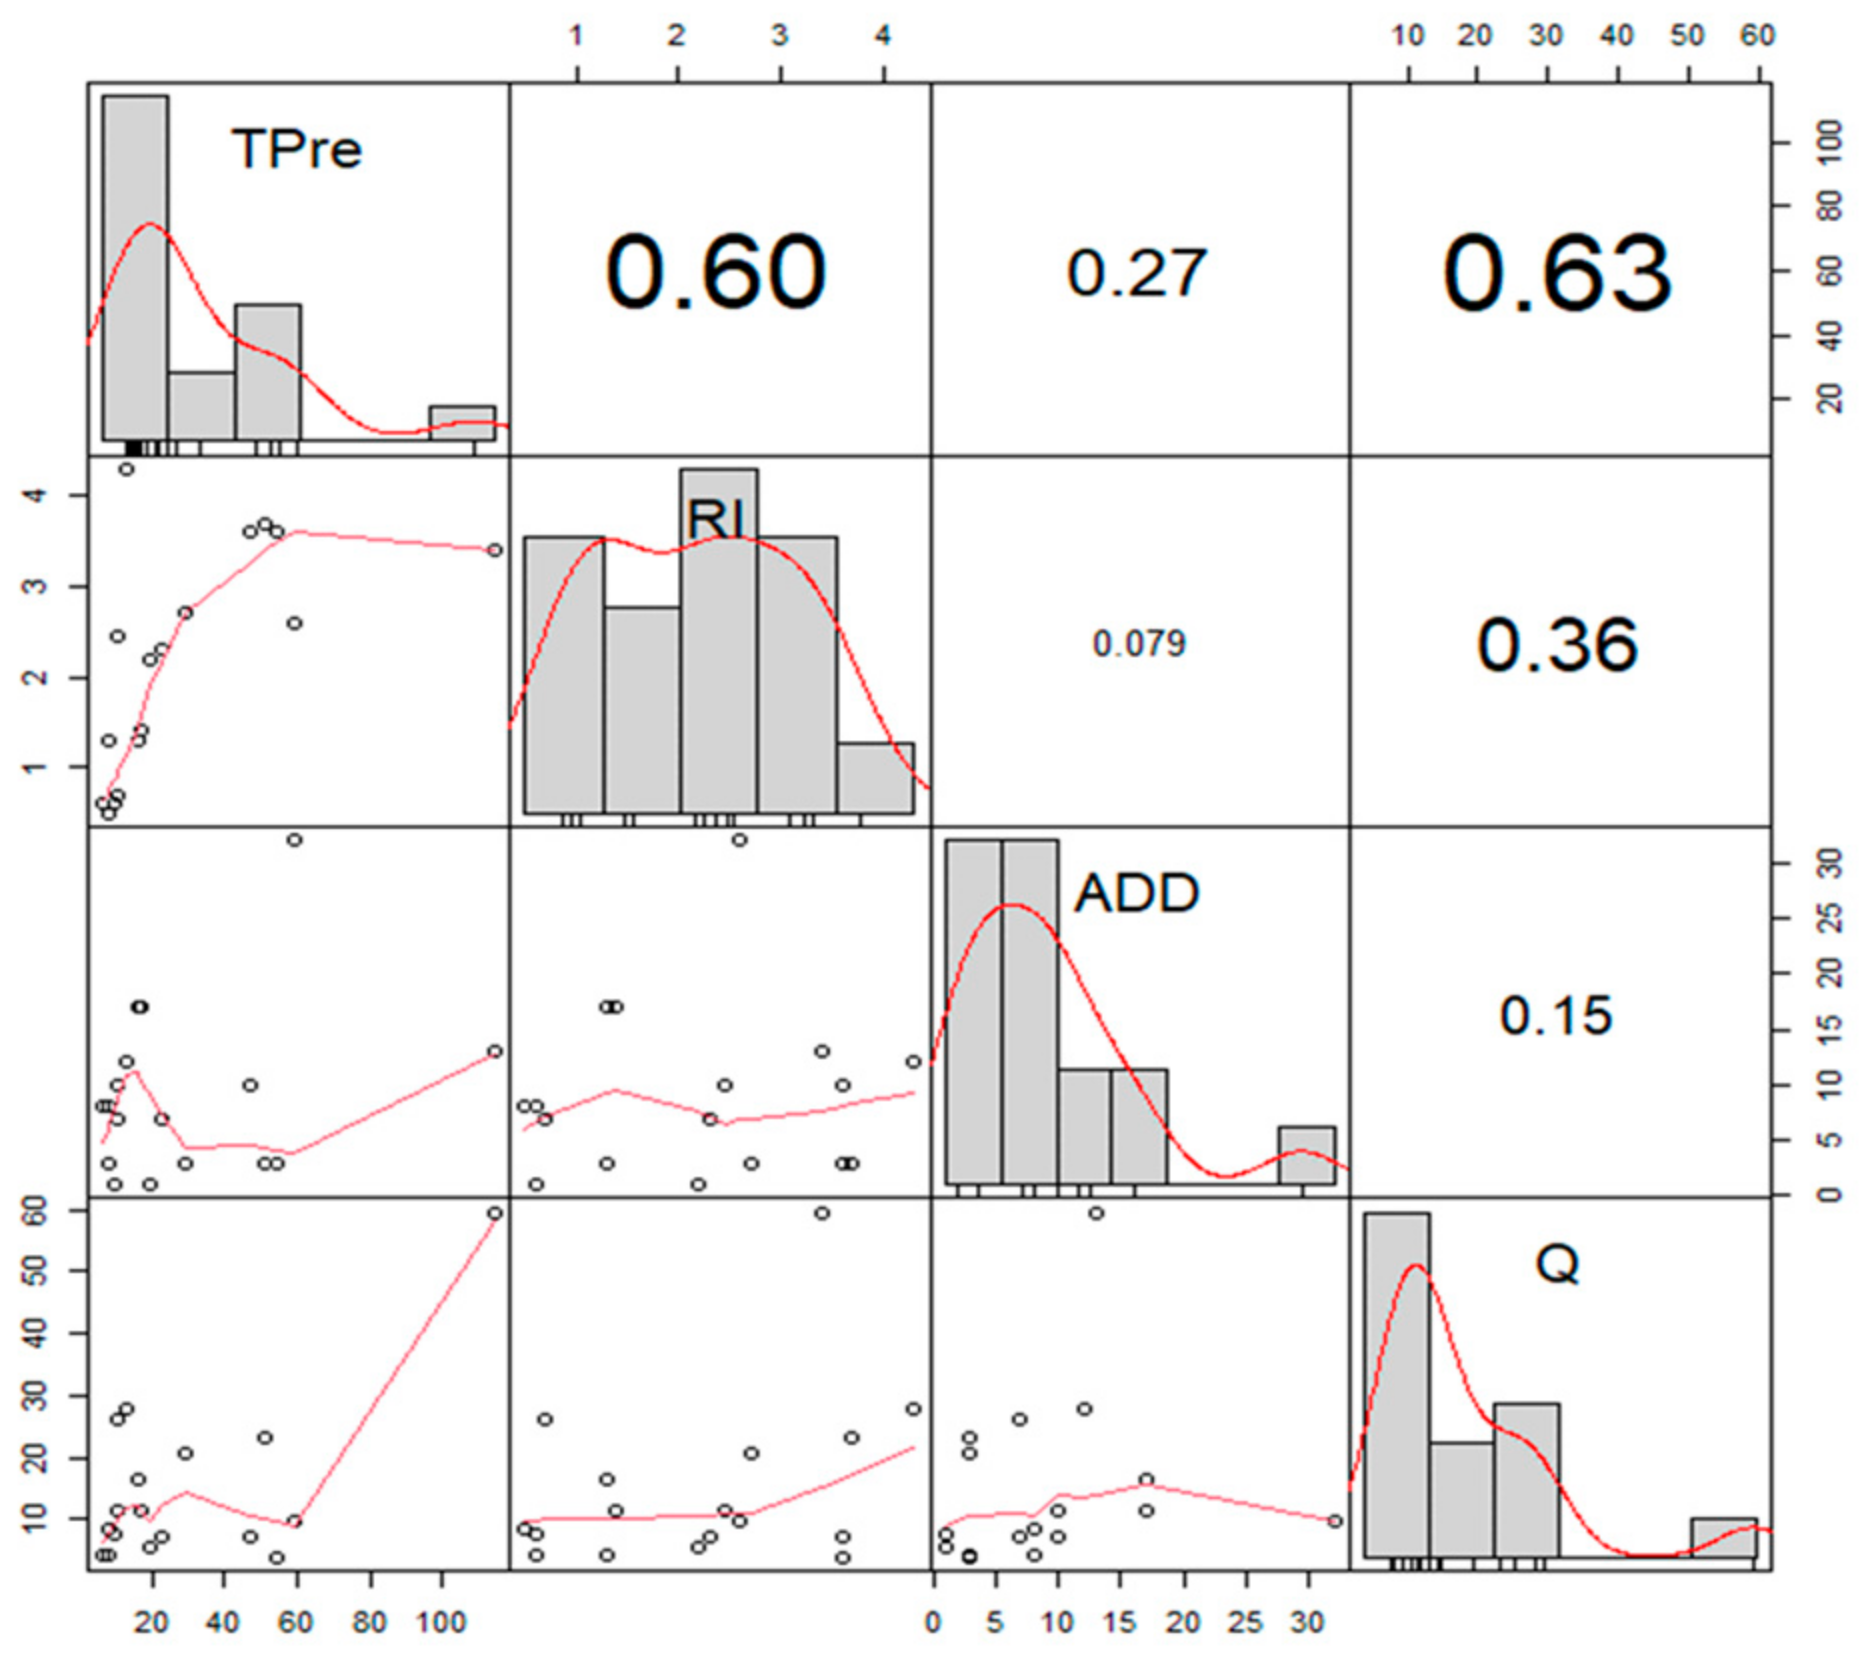
An analysis was conducted on the correlation between facility outflow volume and relevant influencing factors. First, the relationship between total precipitation and total outflow was examined. The results indicated that total precipitation (Tpre) had a significant impact on outflow (Q), with R2 = 0.630 and p-value < 0.05. This confirms that precipitation significantly affects outflow volume.
Additionally, rainfall intensity (RI) also exhibited a significant influence on outflow, with R2 = 0.600 and p-value < 0.05. Thus, it was observed that as precipitation and rainfall intensity increased, outflow volume also increased.
On the other hand, antecedent dry days (ADDs) showed a relatively low correlation with total precipitation, with R2 = 0.270. In other words, no positive or negative correlation was found between ADDs (the dry period preceding rainfall) and total precipitation.
As shown in Figure 8, the histograms of total precipitation and rainfall intensity exhibit a similar trend to that of outflow volume, further supporting these findings.
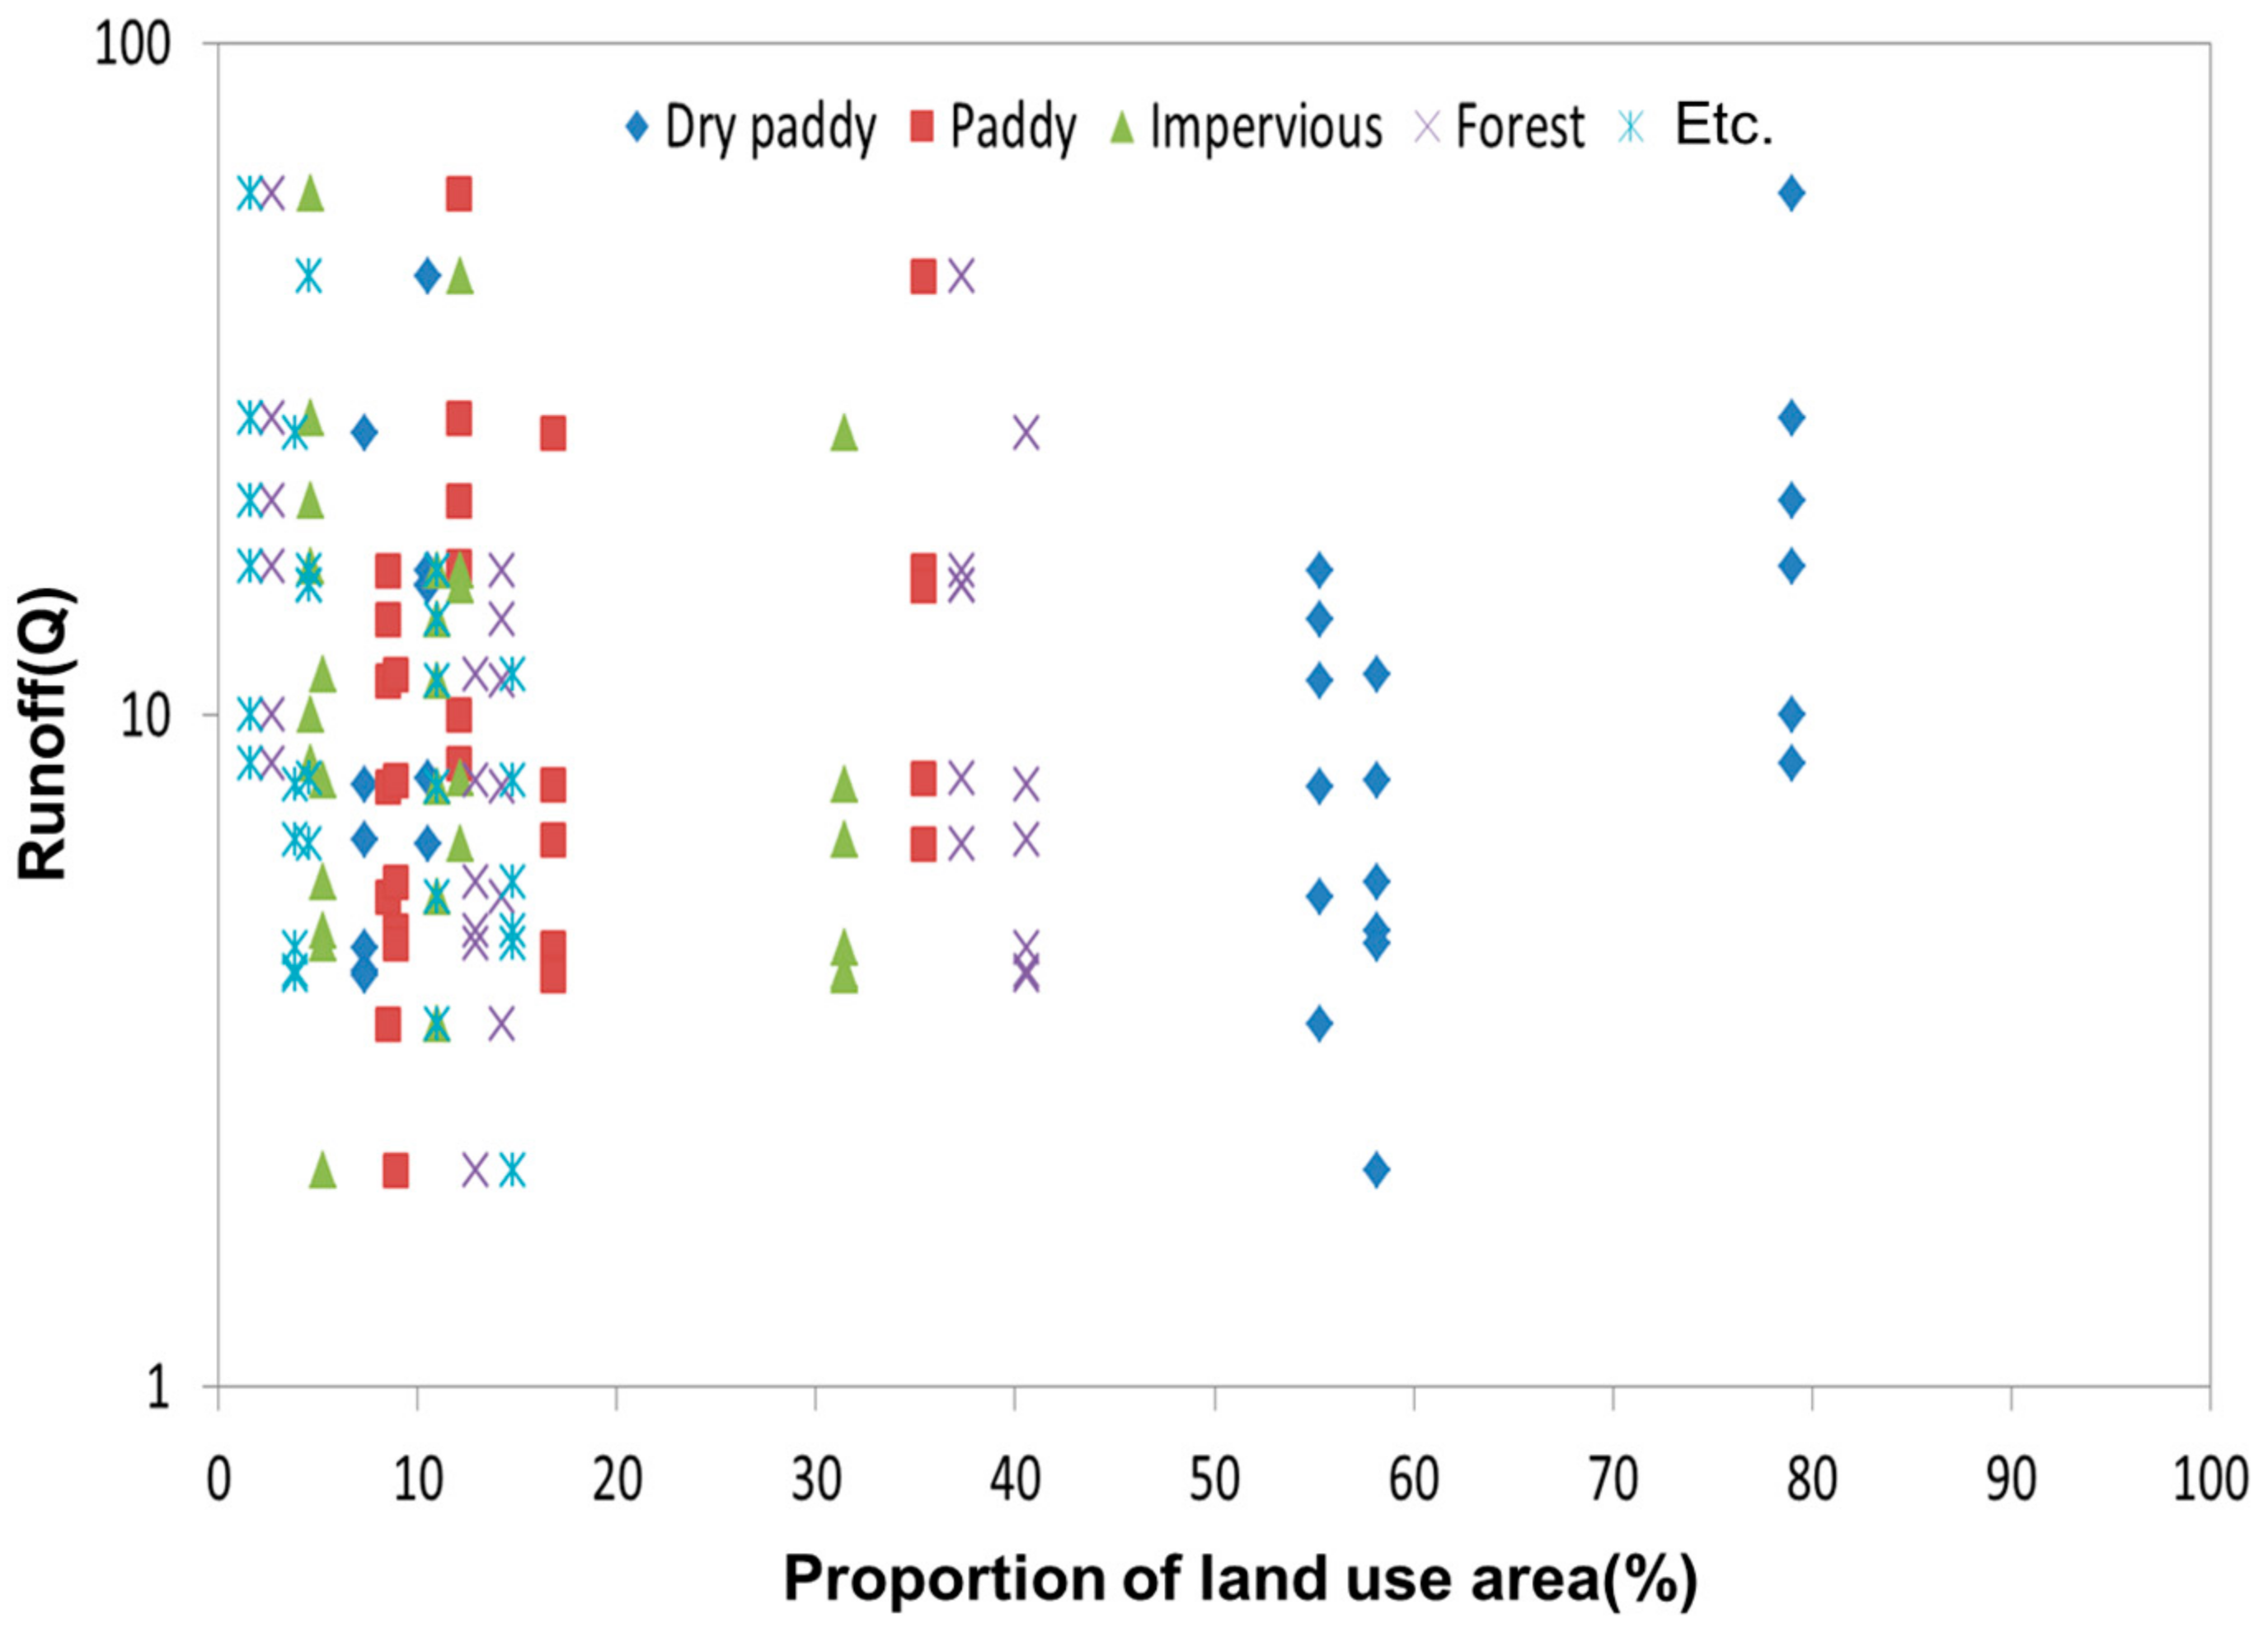
An analysis was conducted on land use, area ratio, and runoff volume in relation to precipitation. Figure 9 presents a graph analyzing runoff based on land use area ratio. The results showed that land use classification produced varying outcomes. However, when the utilization ratio of each land use type was below 20% of the total area, runoff was observed. When the utilization ratio ranged from 20% to 30%, runoff occurred from fields, rice paddies, residential areas, and forests. However, when the utilization ratio exceeded 50%, runoff was observed only from fields.
These findings indicate that total runoff volume varied depending on the land use ratio within the total area. Therefore, the land use ratio can be considered an influencing factor in determining runoff volume.
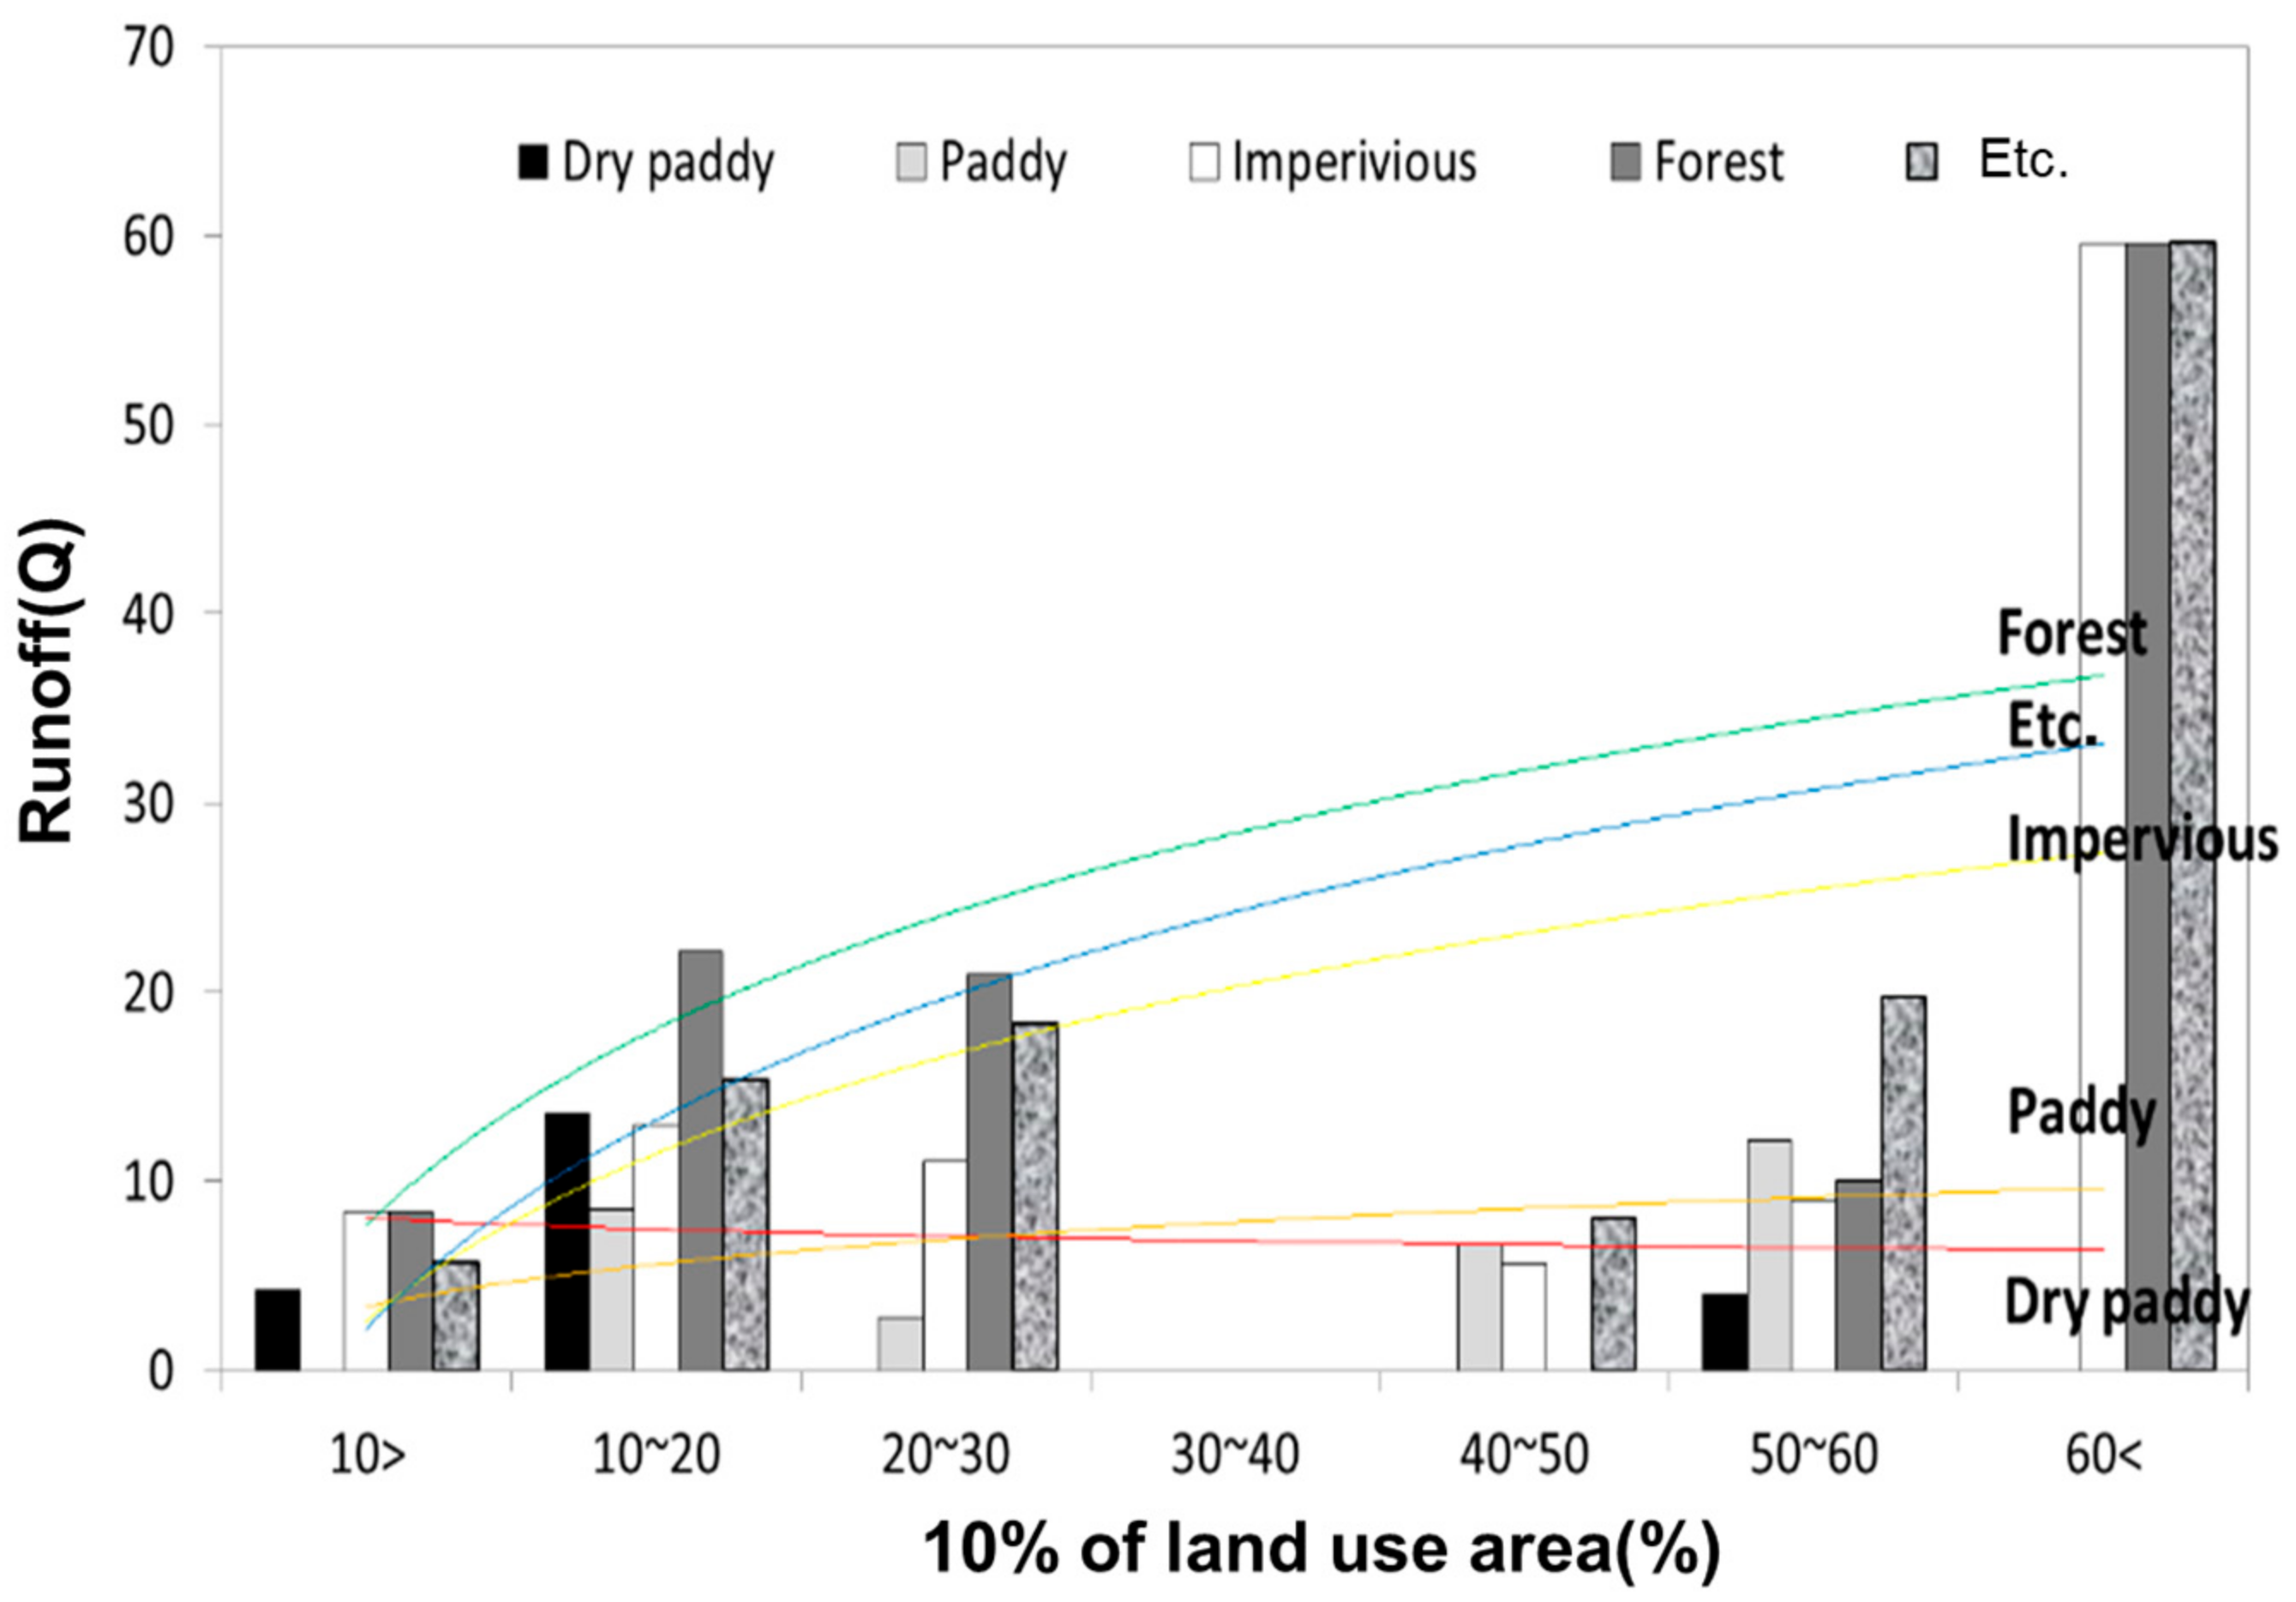
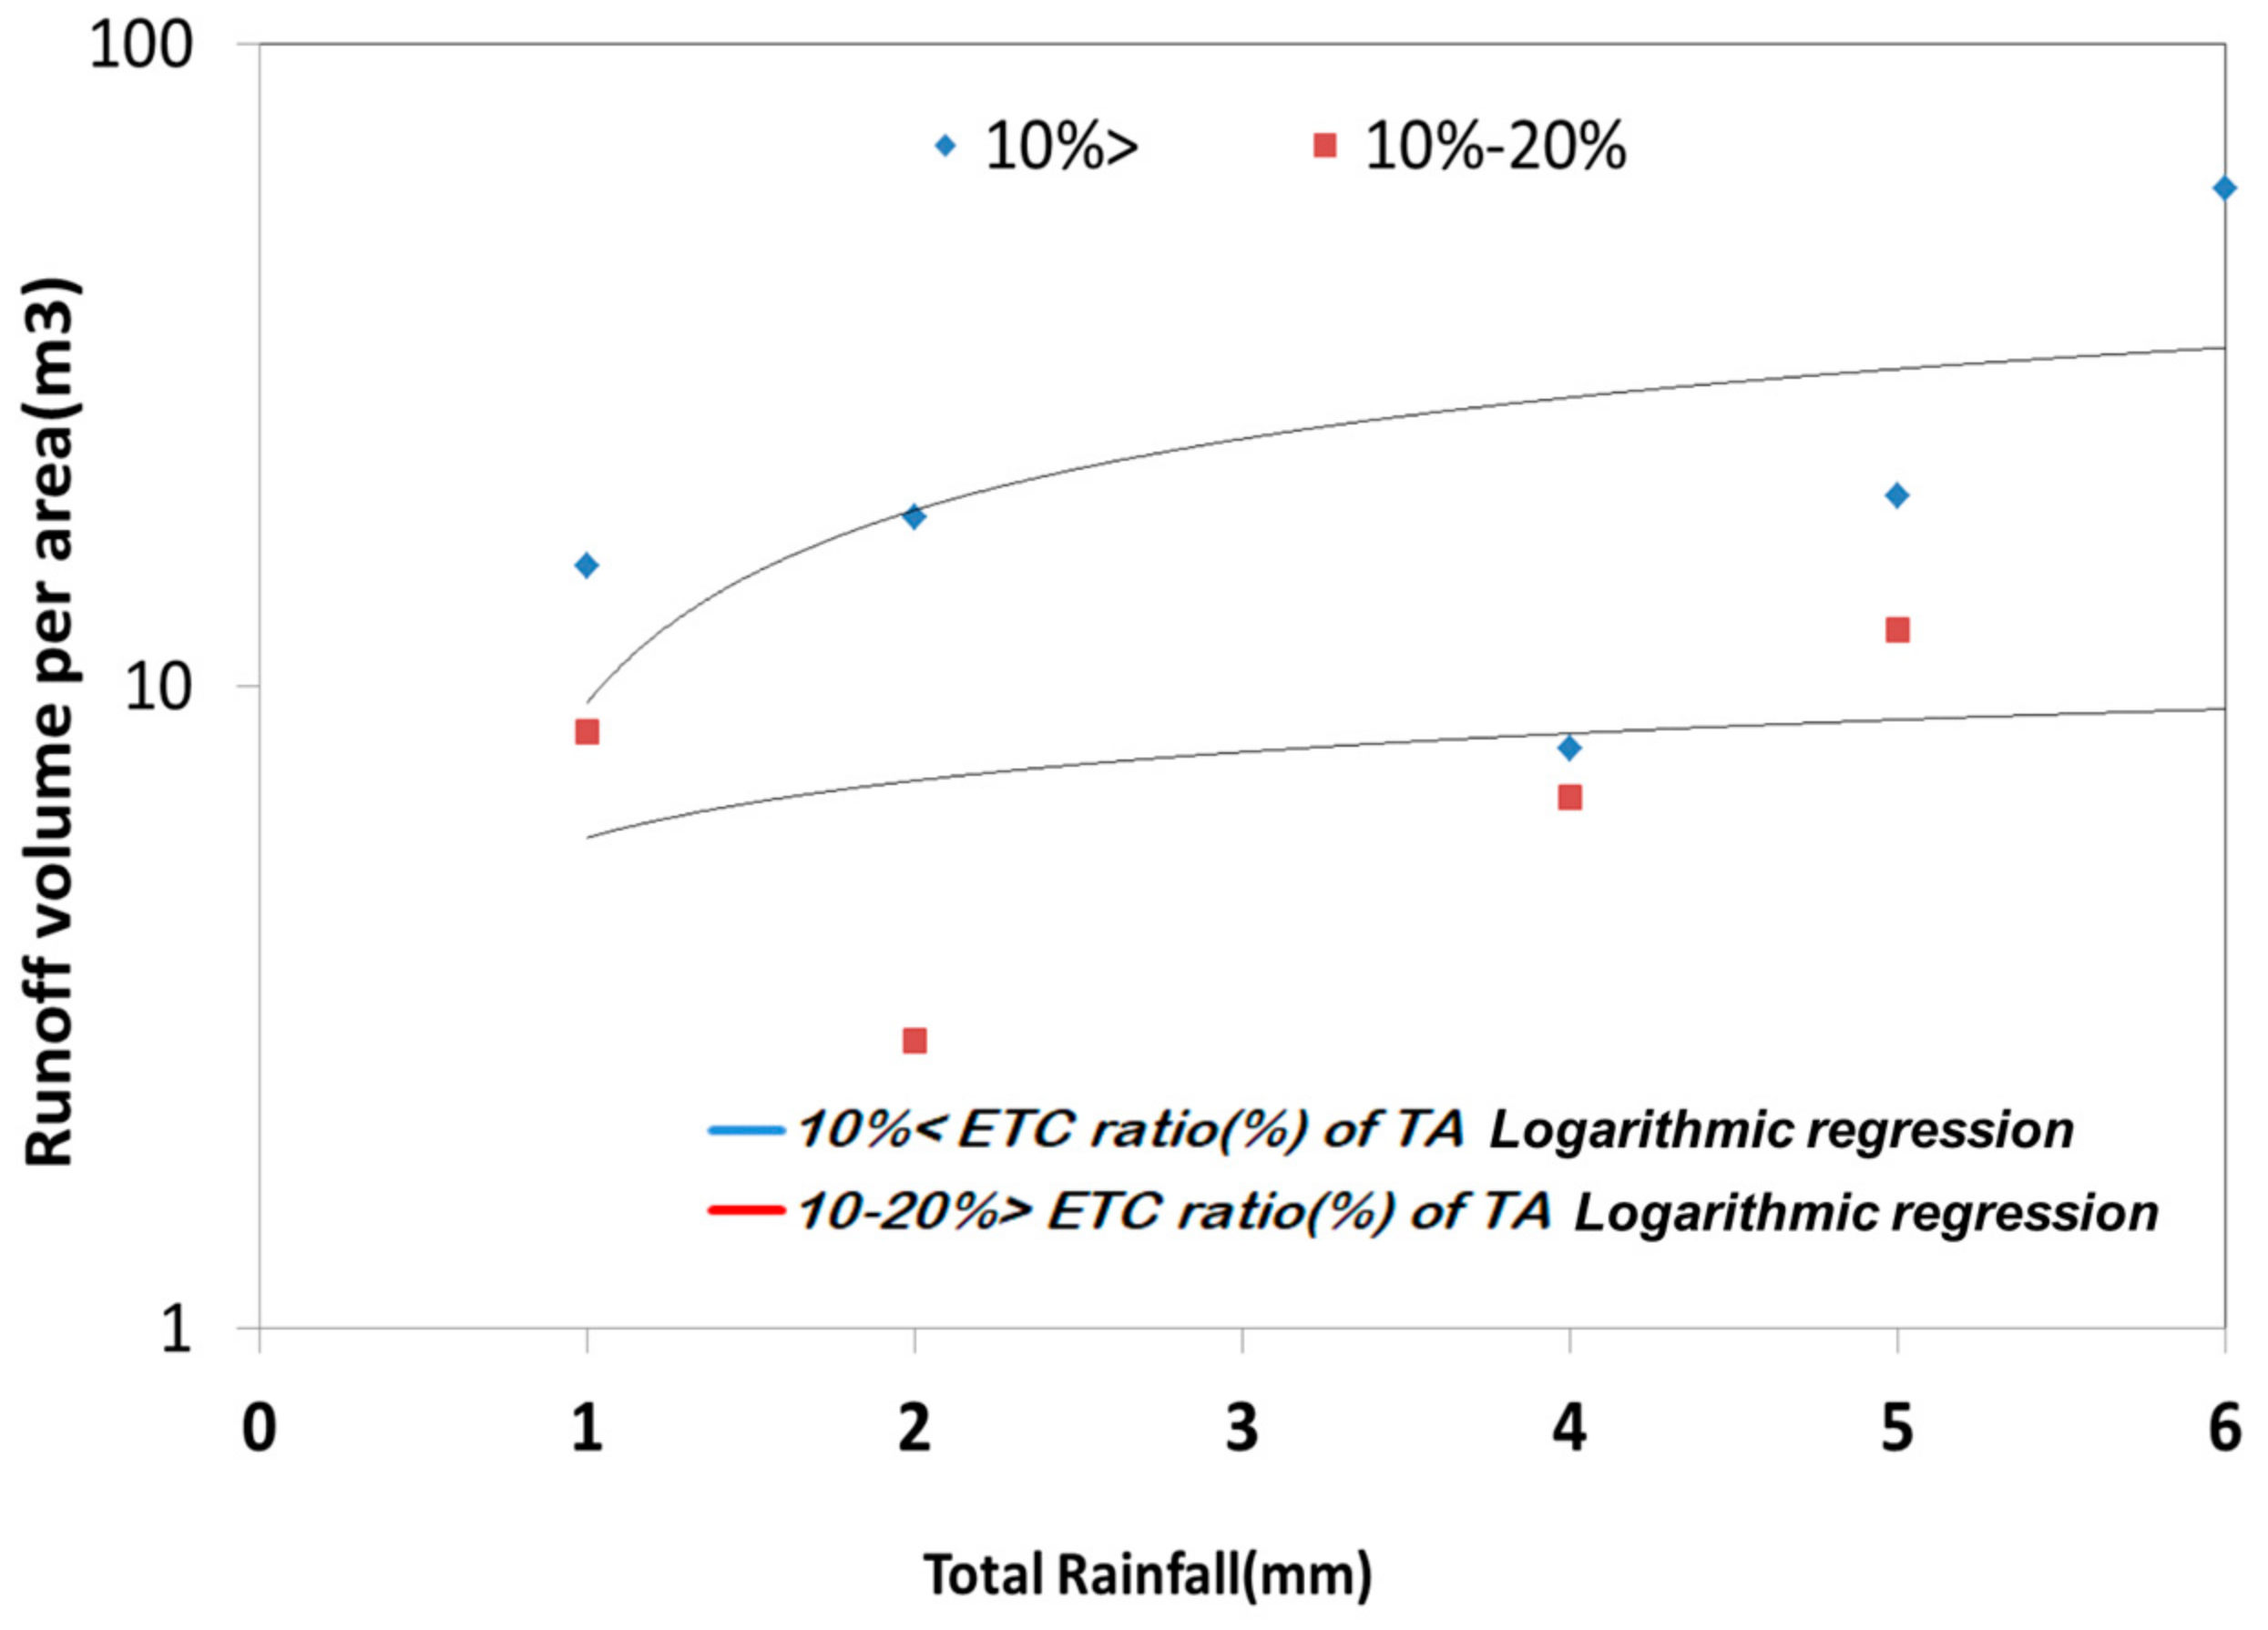
When the land use ratio was below 10% of the total area, runoff occurred in a diverse manner. Therefore, runoff volume was analyzed based on different rainfall classifications within this below-10% range, where the most data could be obtained.
Figure 10 illustrates the runoff volume categorized by land use type according to different rainfall ranges. Rainfall intensity was classified into the following categories: less than 10 mm, 10–20 mm, 20–30 mm, 30–40 mm, 40–50 mm, 50–60 mm, and above 50 mm.
The results indicate that as rainfall classification increased, runoff volume also increased in the order of forests, miscellaneous land, and residential areas. However, the runoff volume from rice paddies and fields showed a relatively lower increase compared to forests, miscellaneous land, and residential areas.
At this point, residential areas exhibited faster runoff rates compared to other land use types, whereas forests and miscellaneous land, due to their permeable surfaces, tended to retain water before runoff occurred. This trend aligns with previous studies, which demonstrated that as total precipitation increased, runoff from these land types occurred more gradually [20].
These findings confirm that even under the same drainage area and rainfall conditions, the characteristics of runoff vary depending on land use type. Furthermore, different rainfall classifications exhibit distinct runoff patterns, highlighting the diverse nature of runoff behavior based on land use.
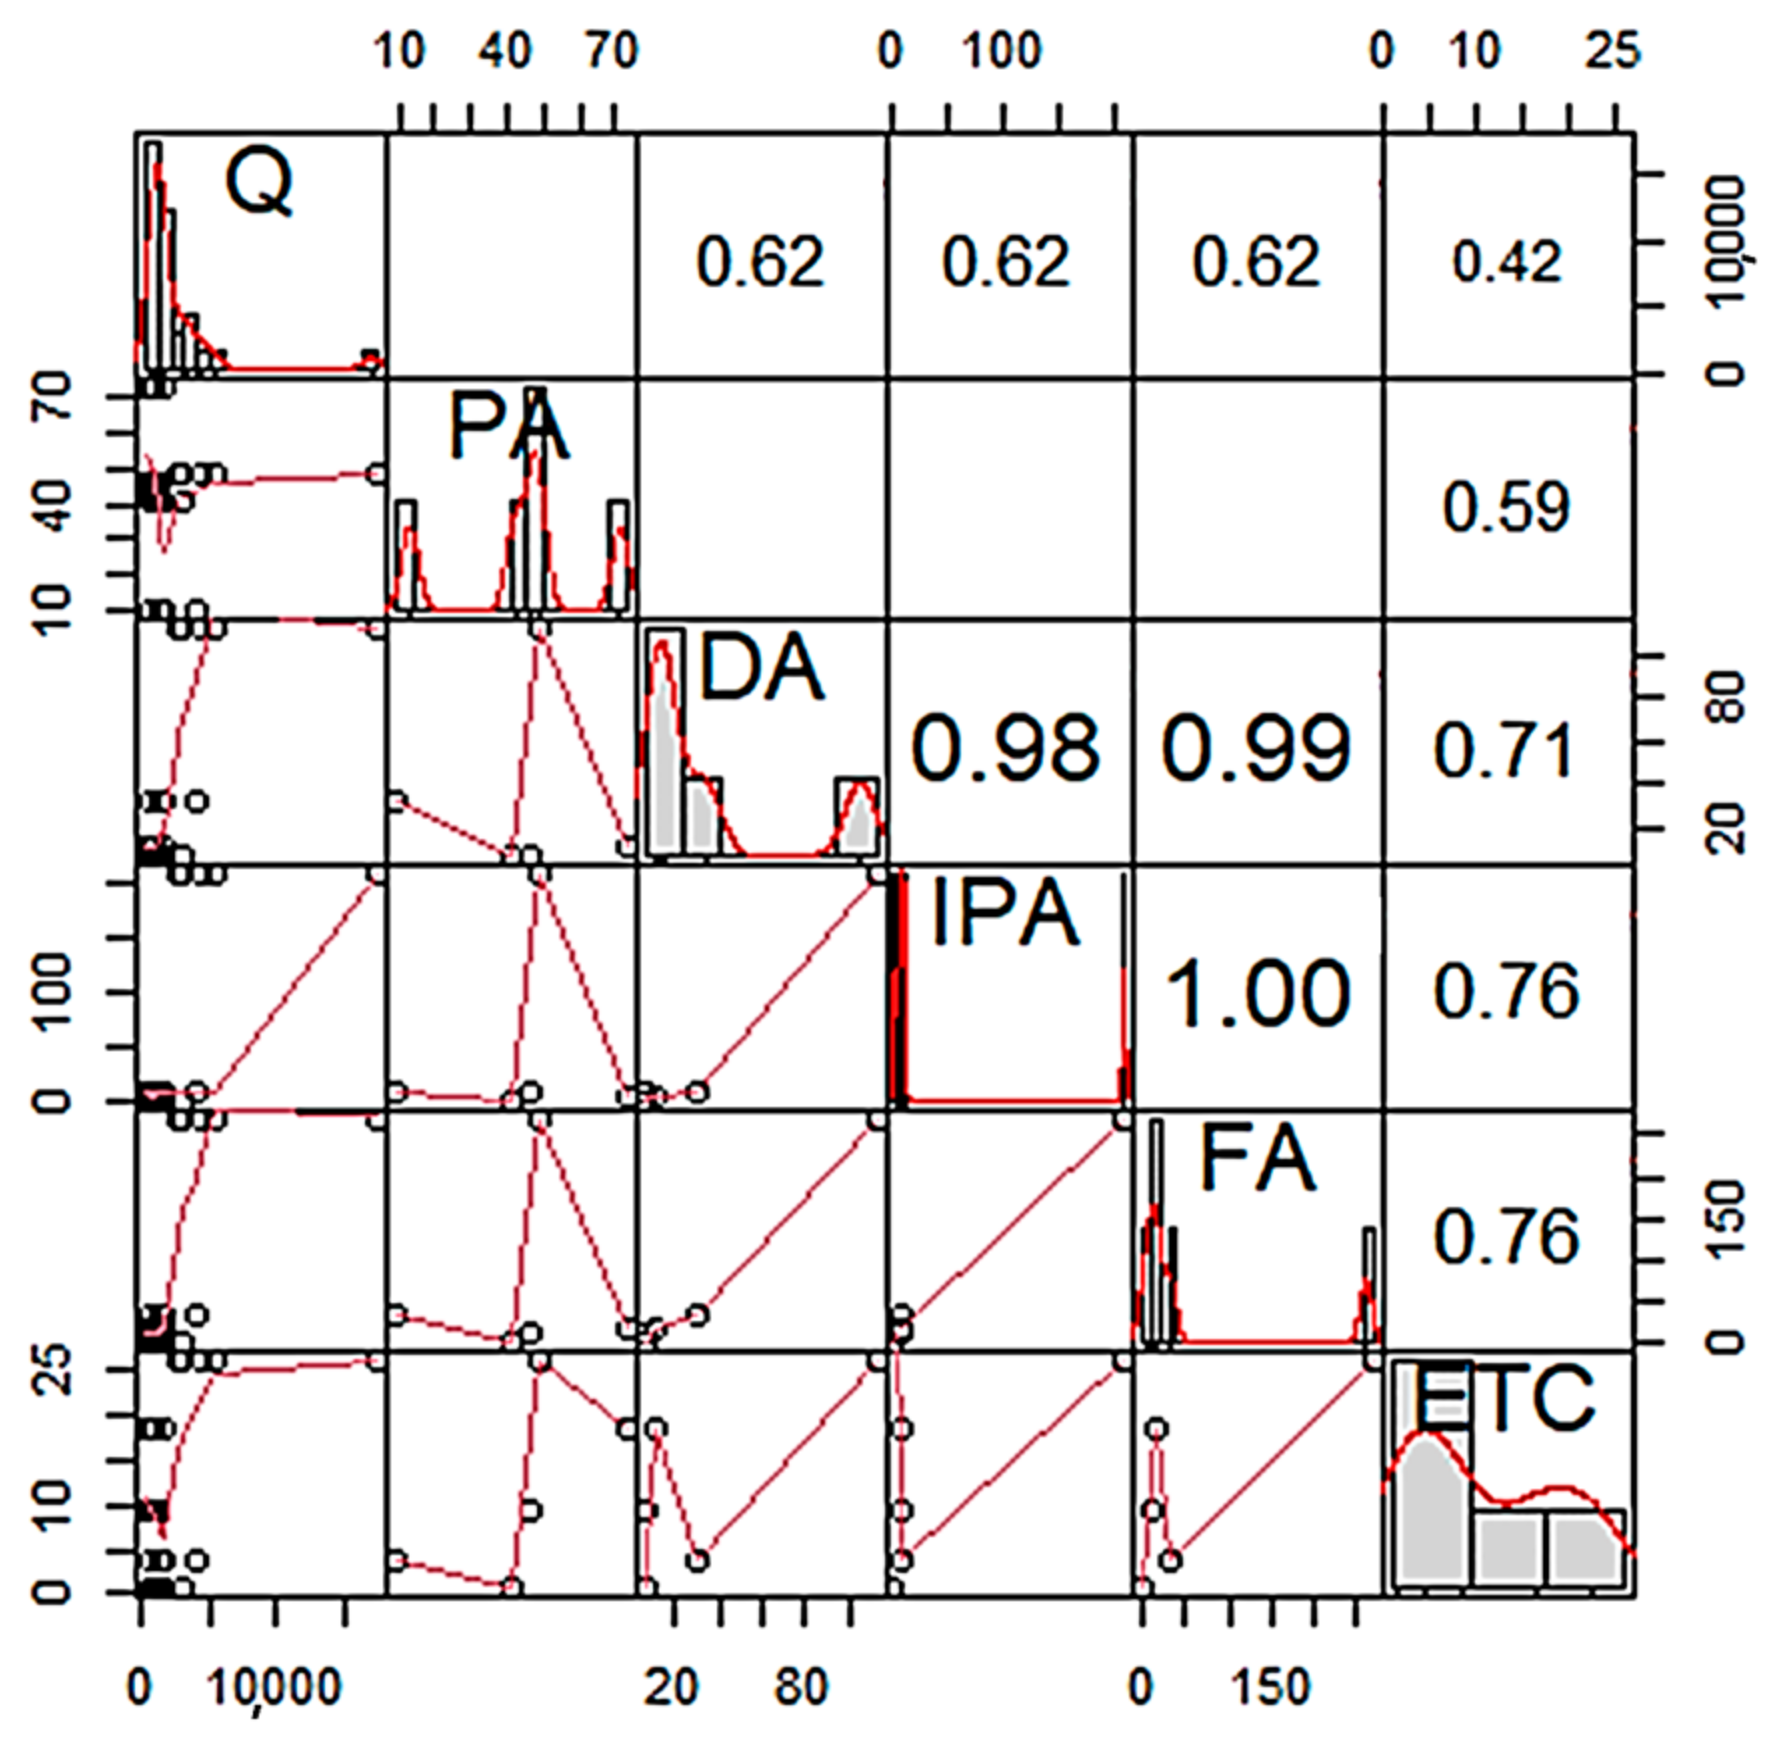
Thus, the variation in runoff volume occurring in the drainage area during rainfall was identified based on the land use area ratio. To analyze the correlation, a correlation analysis was conducted between the land use area ratio and the runoff volume during rainfall.
As shown in Figure 10, the variables that exhibited the strongest correlation with runoff volume were fields (DA), residential areas (IPA), and forests (FA), with R2 = 0.62 and p < 0.05, indicating statistical significance. In contrast, rice paddies (PA) and miscellaneous land (ETC) showed a moderate correlation, with R2 = 0.42 and p < 0.05, also indicating statistical significance.
However, as shown in Figure 11, rice paddies retain irrigation water, which delays runoff during rainfall events. Due to this characteristic, no negative correlation was observed, as the stored irrigation water prevents immediate runoff.

3.3. Equation for Estimating Optimal Capacity

A regression analysis was conducted to derive a regression model that explains the relationship between land use area ratio and runoff volume. To determine the most suitable model, the stepwise selection–elimination method was applied, with variables selected based on their statistical significance while minimizing the Akaike Information Criterion (AIC) to penalize model complexity.
As a result, the final runoff regression model was derived, as presented in Equation (8), demonstrating a high explanatory power (R2 = 0.965).
Additionally, the residual analysis confirmed that the model satisfied the three key assumptions of normality, homoscedasticity, and independence.
Q = 2.663 DA − 10.983 PA + 26.358 IPA + 4.879 FA − 9.627 ETC
where DA: dry field area percentage (%)—PA: paddy area percentage (%)—IPA: impervious area percentage (%)—FA: forest area percentage (%)—ETC: other land use percentage (%).
This regression equation represents the relationship between land use percentages and runoff volume (Q). The coefficients indicate the impact of each land use type on runoff, with impervious areas (IPA) contributing the most positively to runoff, while paddy fields (PA) and other land uses (ETC) show a negative correlation.
Among all land use types, residential areas (IPA) and miscellaneous land (ETC) exhibited the highest correlation coefficients with runoff volume. This result indicates that as the impervious surface area increases, the runoff volume requiring management also increases during rainfall events.
On the other hand, fields (DA) showed a negative correlation, meaning that an increase in the area of rice paddies did not correlate with an increase in runoff volume.
These findings suggest that the type and quantity of pollutants in runoff vary depending on land use characteristics.
In recent years, awareness of the importance and challenges of non-point source pollution has grown, leading to the exploration of various mitigation strategies. When applying control facilities, differences arise depending on land use type, surface sediment accumulation, rainfall amount, and rainfall intensity. As a result, the importance of on-site monitoring has been increasingly recognized [21,22].
Therefore, this study is considered highly reliable, as it reflects the results of field-monitored data.
In particular, non-point source pollution control facilities were installed to reduce the pollutant load discharged during the initial rainfall. As a result, the facility-specific monitoring conducted in this study provides insight into pollutant concentrations during the early stages of rainfall runoff.
The initial rainfall is known to exhibit relatively high pollution levels compared to the total precipitation. This phenomenon is attributed to the first flush effect, and the characteristics of rice paddies as a land use type appear to have influenced the observed results. This is because rice paddies have a relatively shorter time of concentration when discharging into rivers but exhibit a lower runoff rate compared to impervious surfaces such as residential areas [23].
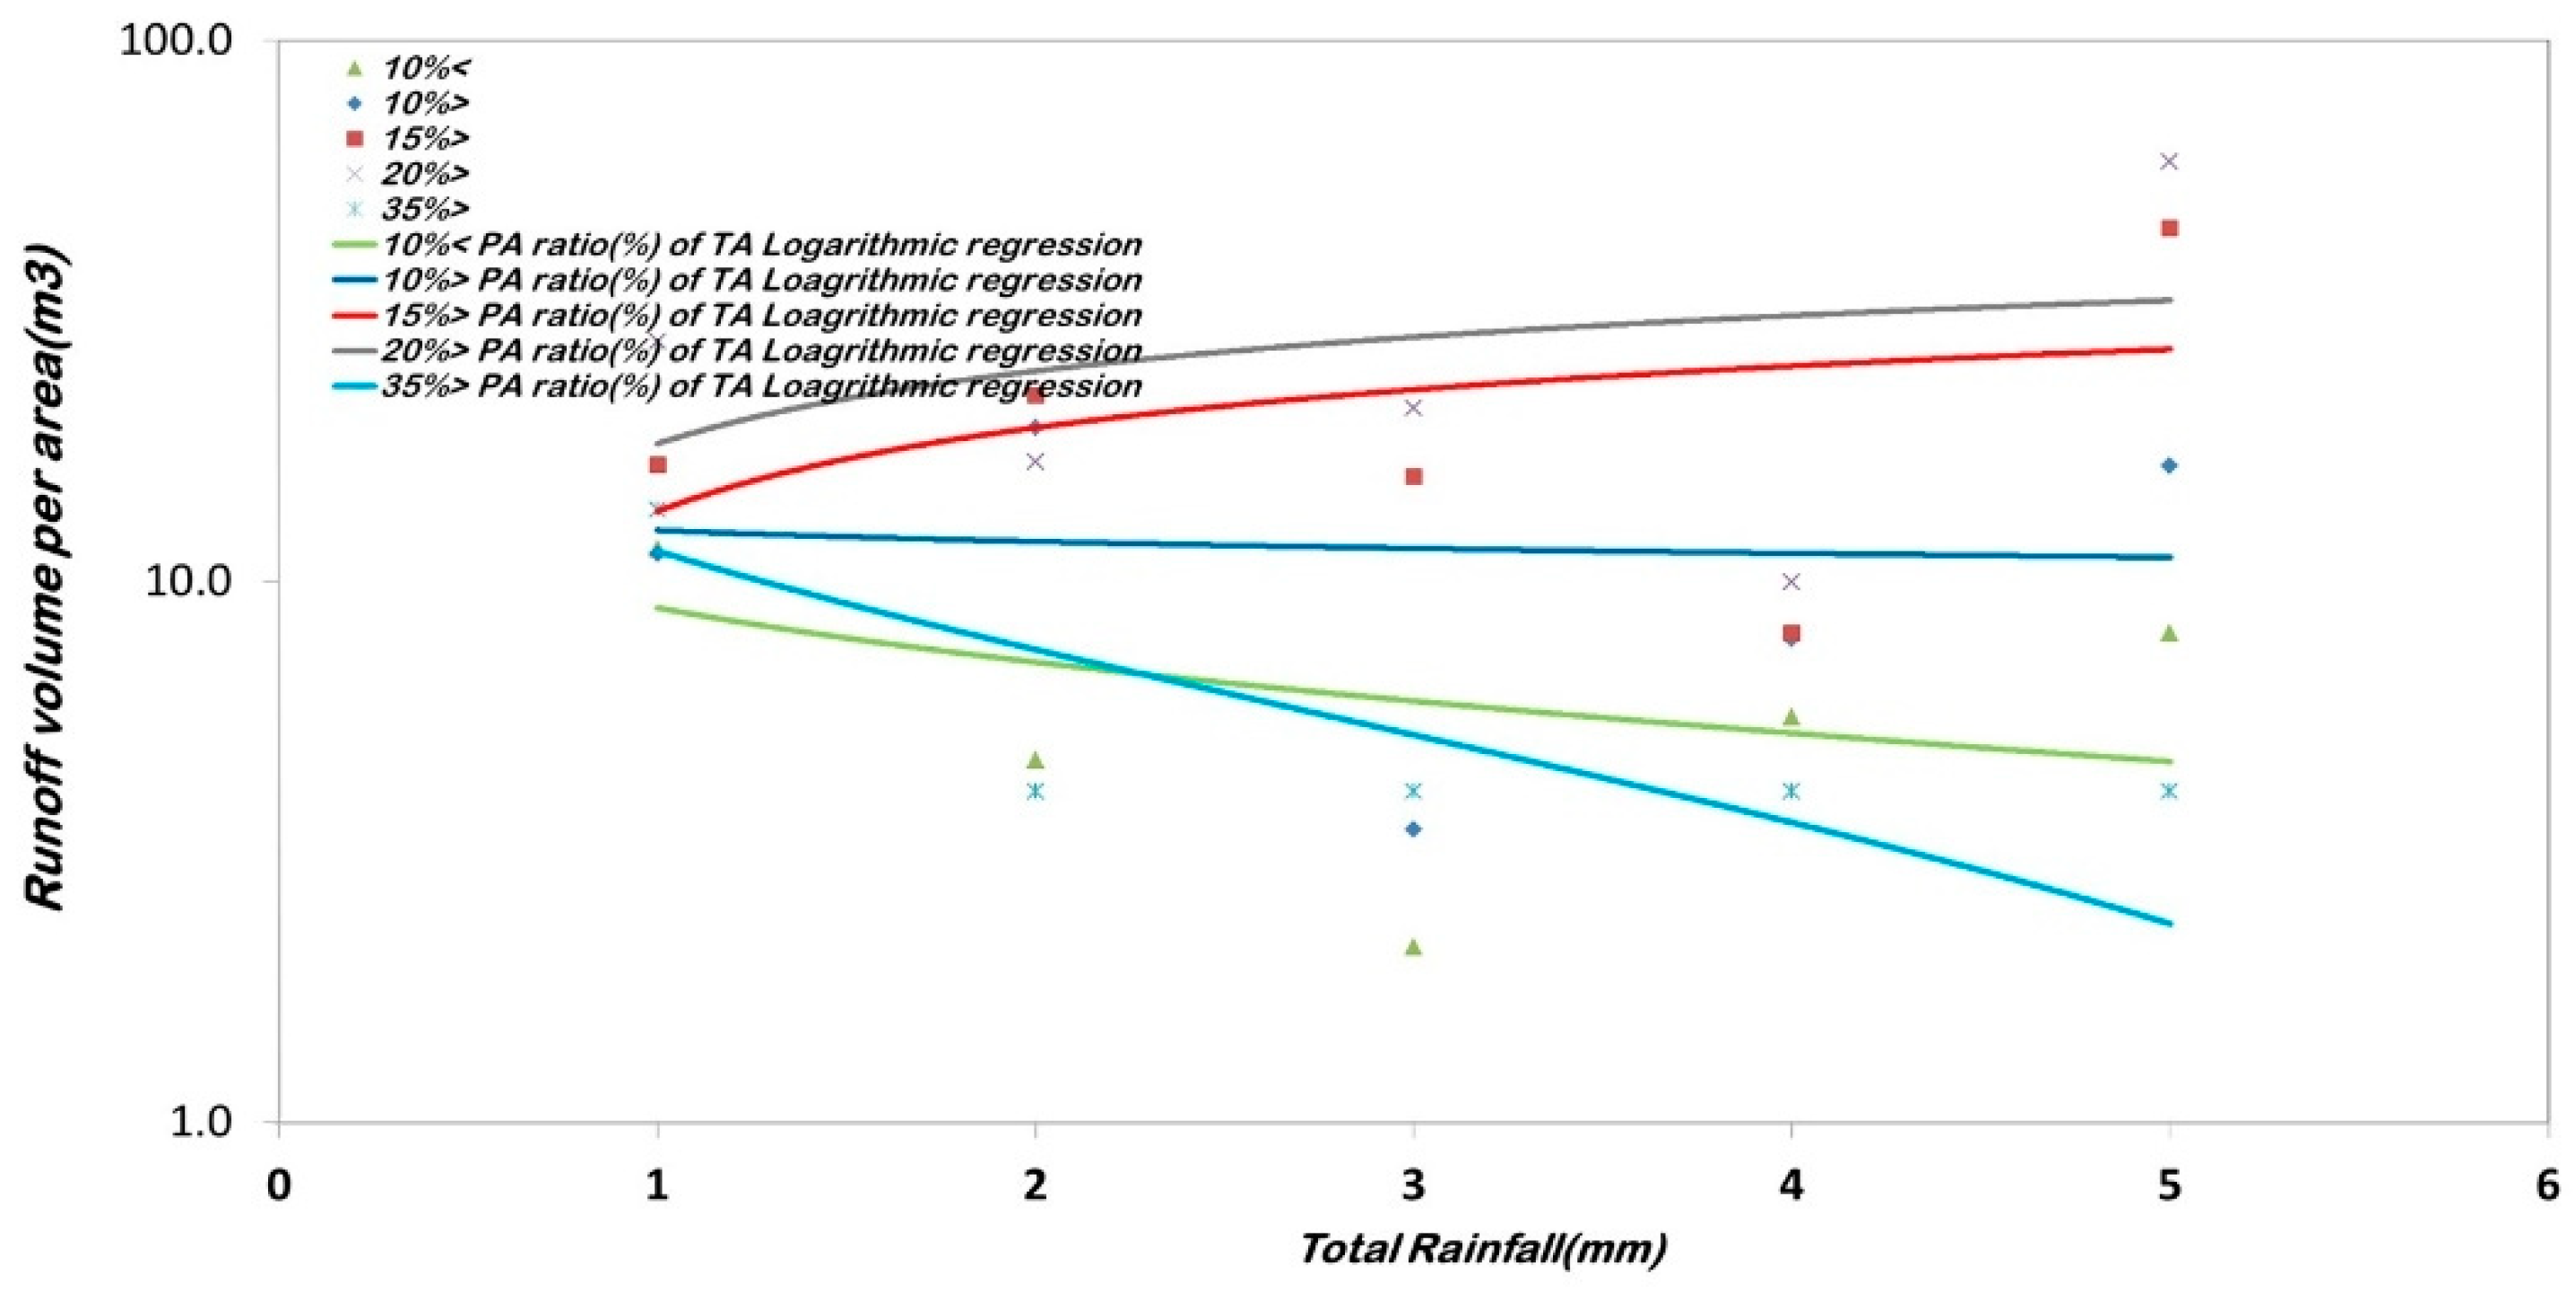
An analysis of runoff volume based on rainfall classification was conducted for five study areas according to total precipitation levels.
As shown in Figure 12, when the proportion of rice paddies exceeded 20% of the total area, runoff volume began to decrease at a total rainfall of 15–20 mm. However, when the total precipitation exceeded 50 mm, the runoff volume increased.
According to the Technical Guidelines for Total Water Pollution Load Management [24], floodgate management for crop cultivation can be applied to reduce non-point source pollution loads. In particular, research by the National Institute of Agricultural Sciences [25] reported that proper installation and management of drainage floodgates reduced runoff by 33.8%. Additionally, monitoring data from the Agricultural Environmental Conservation Project [26] indicated that floodgate management significantly reduced phosphorus levels in runoff.
Therefore, in the study area, the influence of floodgates may have affected early rainfall runoff, and runoff generation was observed when precipitation exceeded 50 mm.
When applying the derived correlation equation, it is valid for areas where rice paddies constitute at least 20%of the total land area. However, for rainfall exceeding 50 mm, the application of this formula may be limited. If rainfall conditions fall outside this range, additional water quality monitoring and watershed modeling should be conducted to develop more precise equations.
Nevertheless, since the empirical formula was derived based on field monitoring data from drainage areas where non-point source pollution reduction facilities are in operation, it is expected to be suitable for application in rural areas of South Korea [27,28].
Additionally, as shown in Figure 13, the proportion of miscellaneous land (ETC) in relation to rainfall classification was analyzed. Unlike rice paddies, the monitored proportion of miscellaneous land was 20%, as indicated in the legend of Figure 13. It was observed that as the proportion of miscellaneous land increased, runoff volume also increased with increasing rainfall classification.
However, when the proportion of miscellaneous land was below 10%, runoff volume initially increased with higher total rainfall but began to decrease at 30–35 mm of precipitation. In contrast, when the proportion of forested areas was 10–20%, runoff volume sharply decreased at 15–20 mm of rainfall, followed by an increase at 30–35 mm.
As total precipitation increased, the runoff trend continued to rise in land use areas where the proportion ranged from 10 to 20%. Although runoff volume varied depending on the proportion of miscellaneous land in the study area, the overall trend showed an initial decrease at a certain precipitation level, followed by a continuous increase beyond that point.
In the proposed regression equation, miscellaneous land (ETC) exhibited a negative value, indicating that the equation is most suitable for cases where the proportion of miscellaneous land is below 20% and rainfall is less than 30 mm. Although this is an empirical equation derived from non-point source pollution monitoring, limitations may arise when applying it to areas with different conditions. However, if capacity estimation is performed based on land use characteristics and precipitation patterns, it is expected to enhance the efficiency of non-point source pollution management.

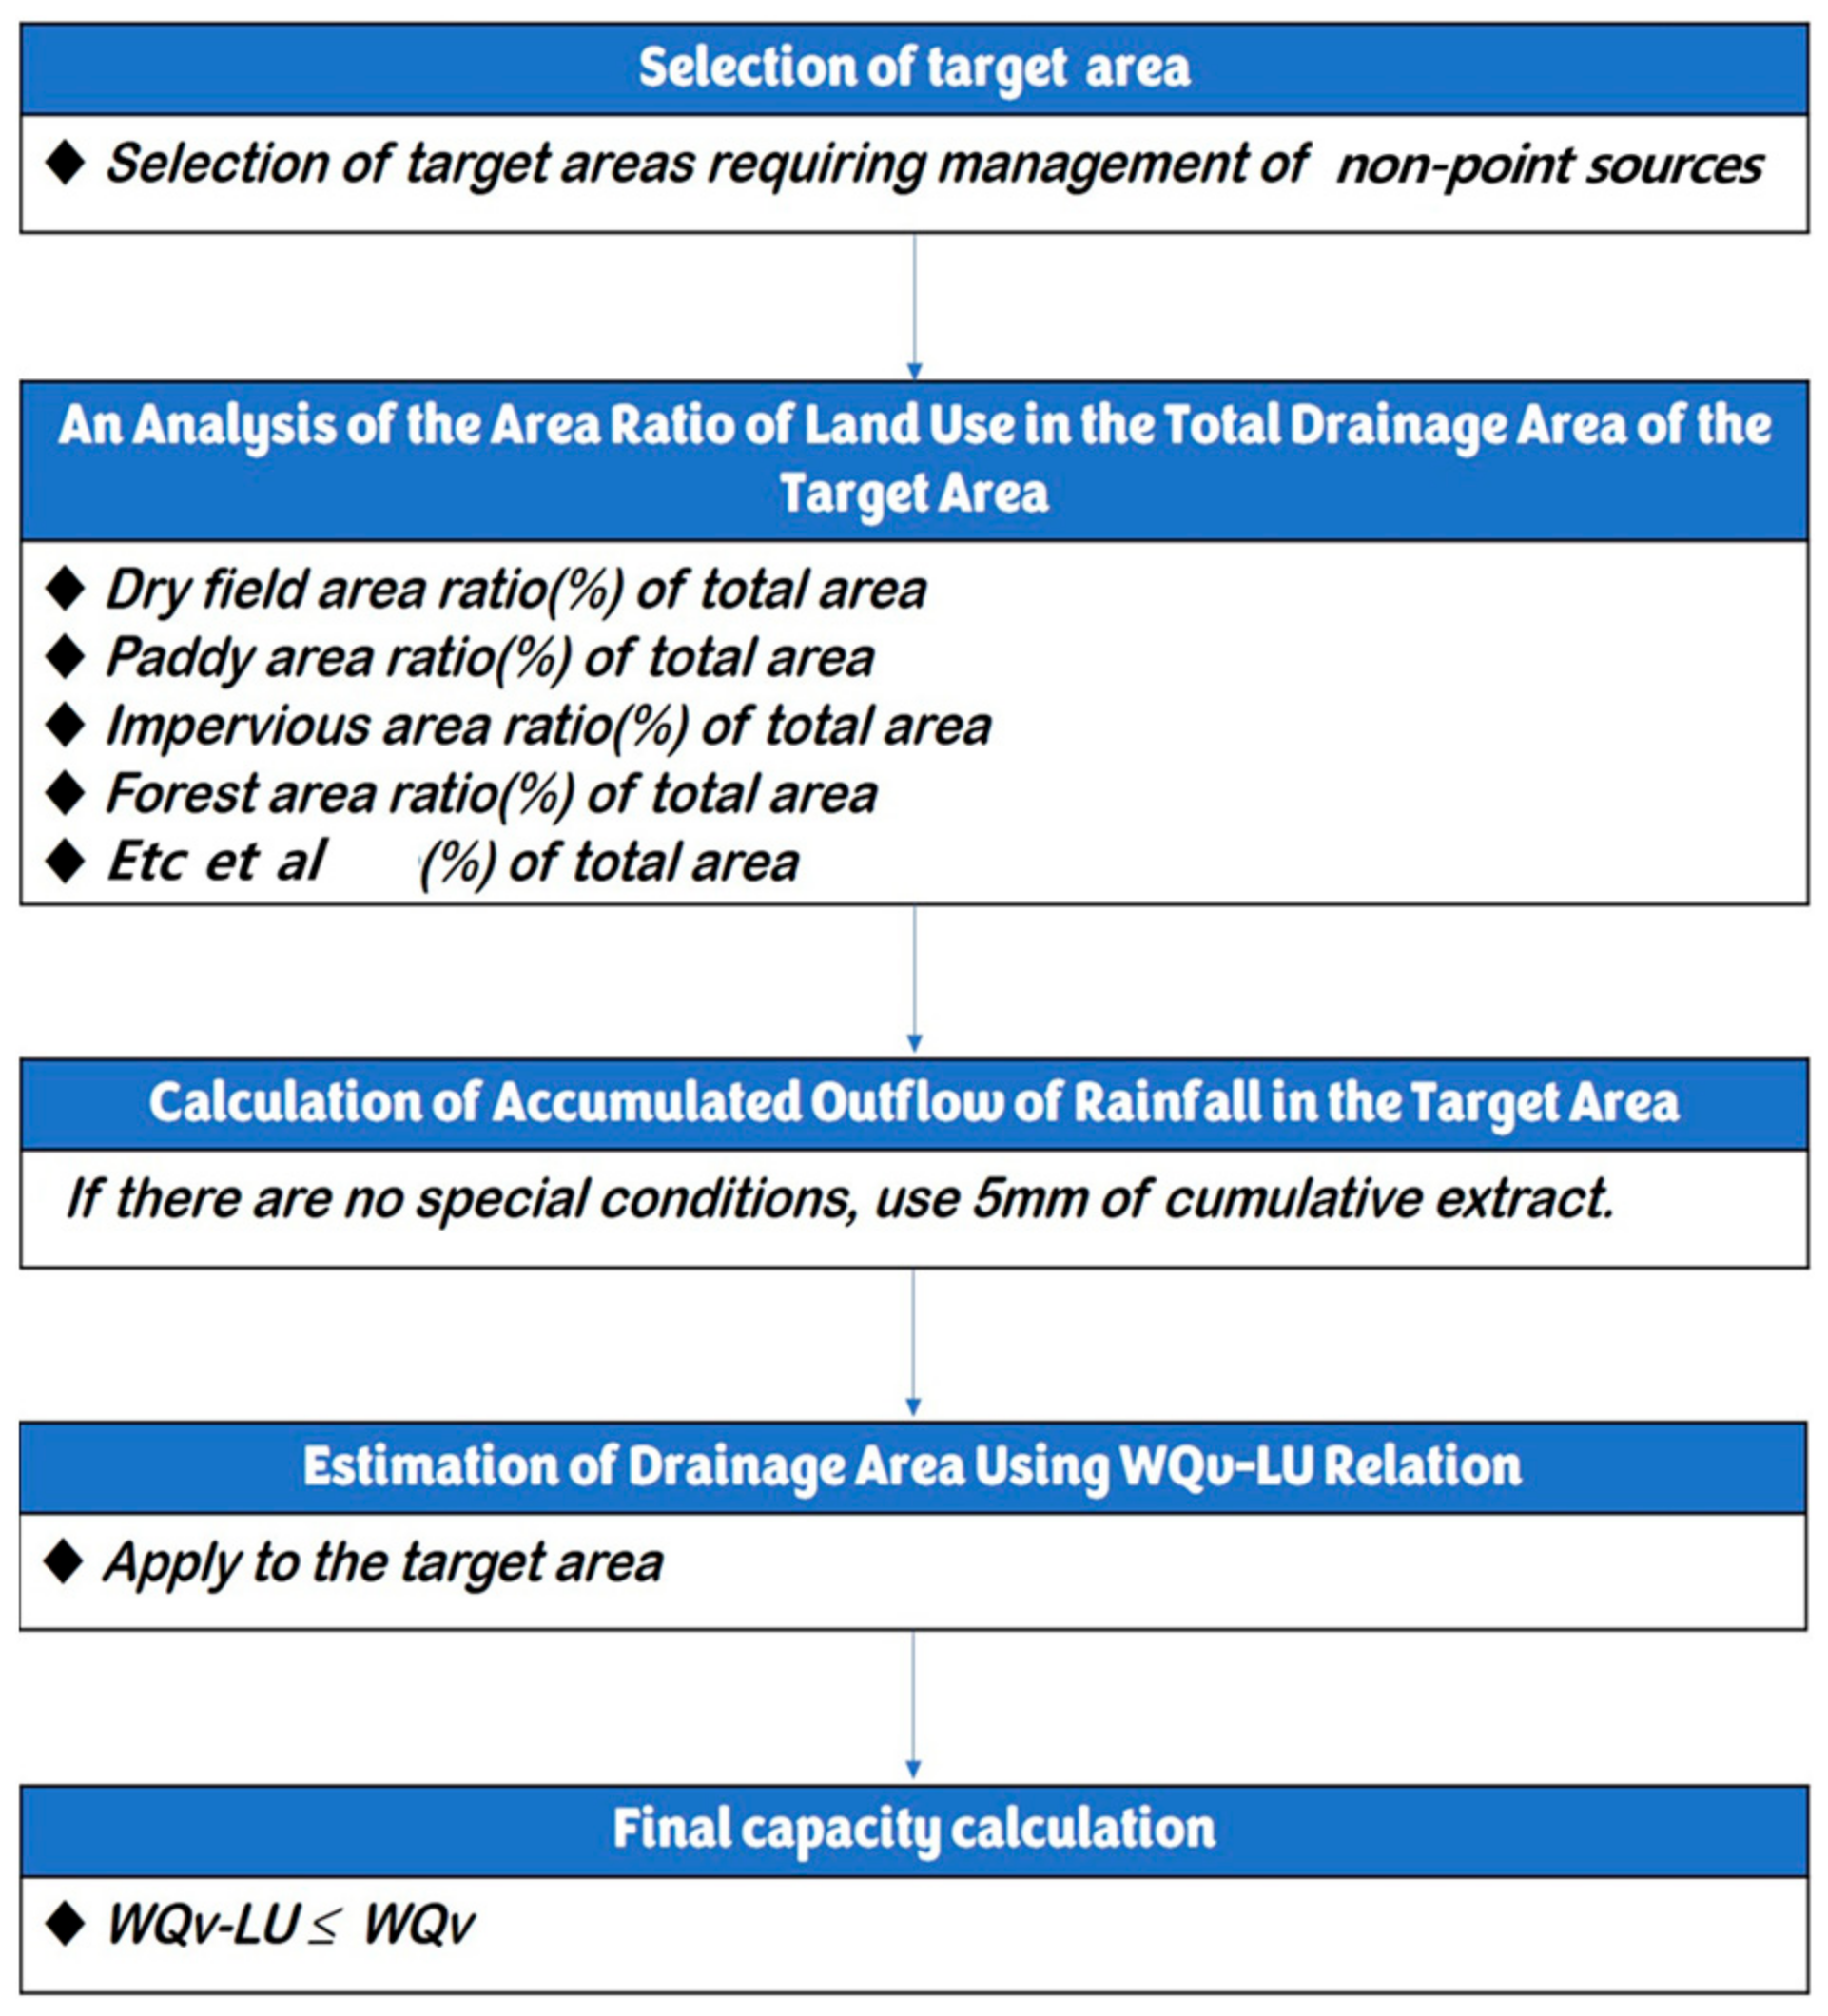
3.4. Appropriateness of the Optimal Capacity Equation

First, the area ratios for land use types such as rice paddies, fields, developed land, forests, and others were applied to both the WQv and WQv-LU equations. The resulting coefficients were then applied to the sub-watershed areas. The sub-watershed areas used in the analysis are shown in the Table 7.
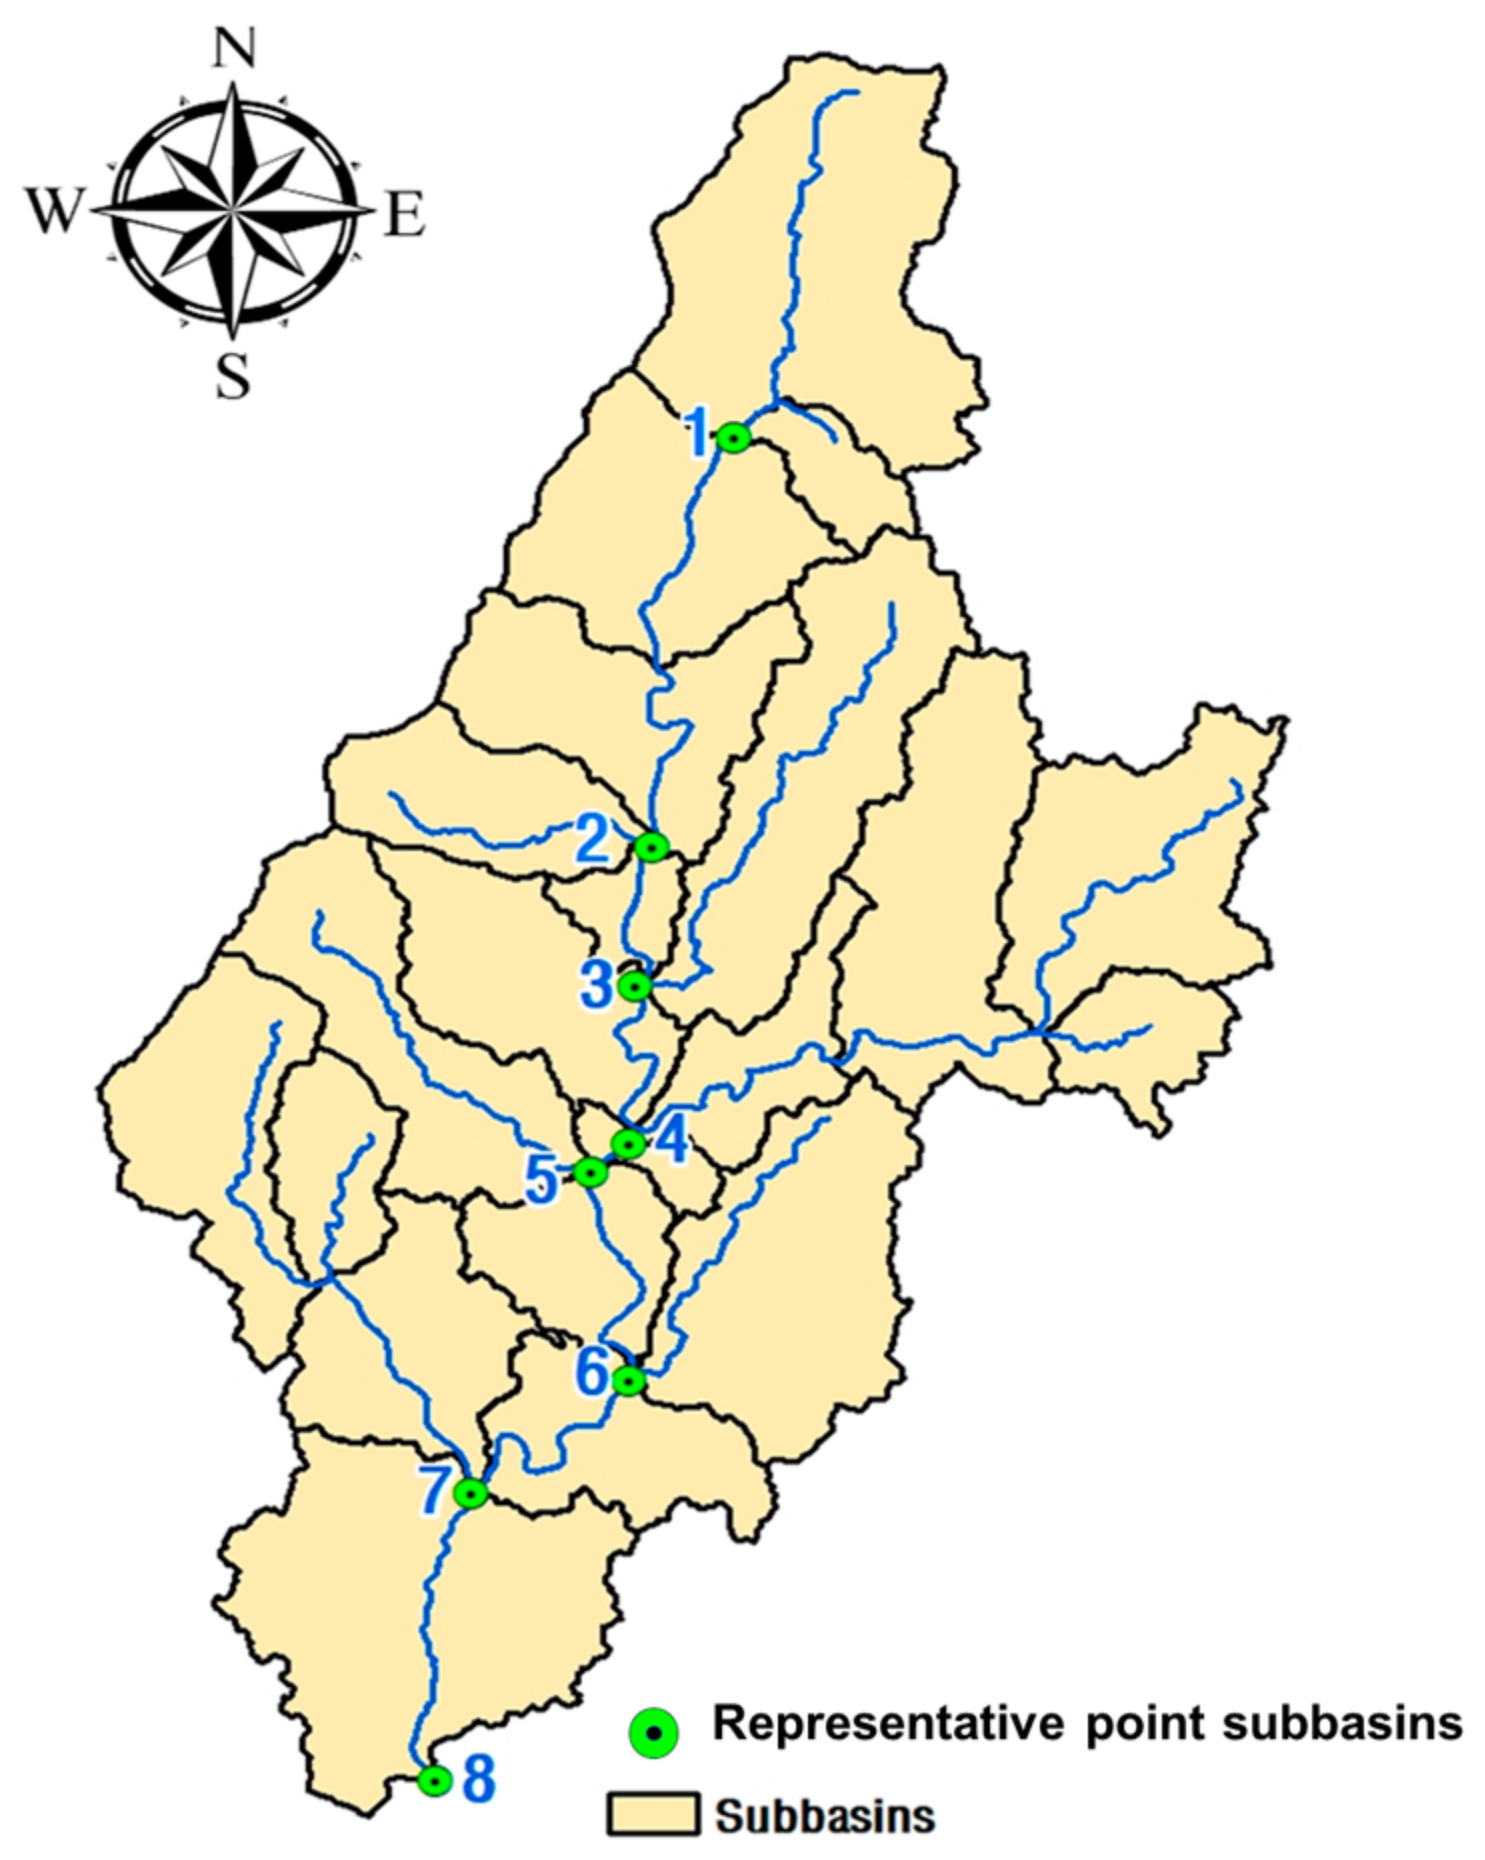
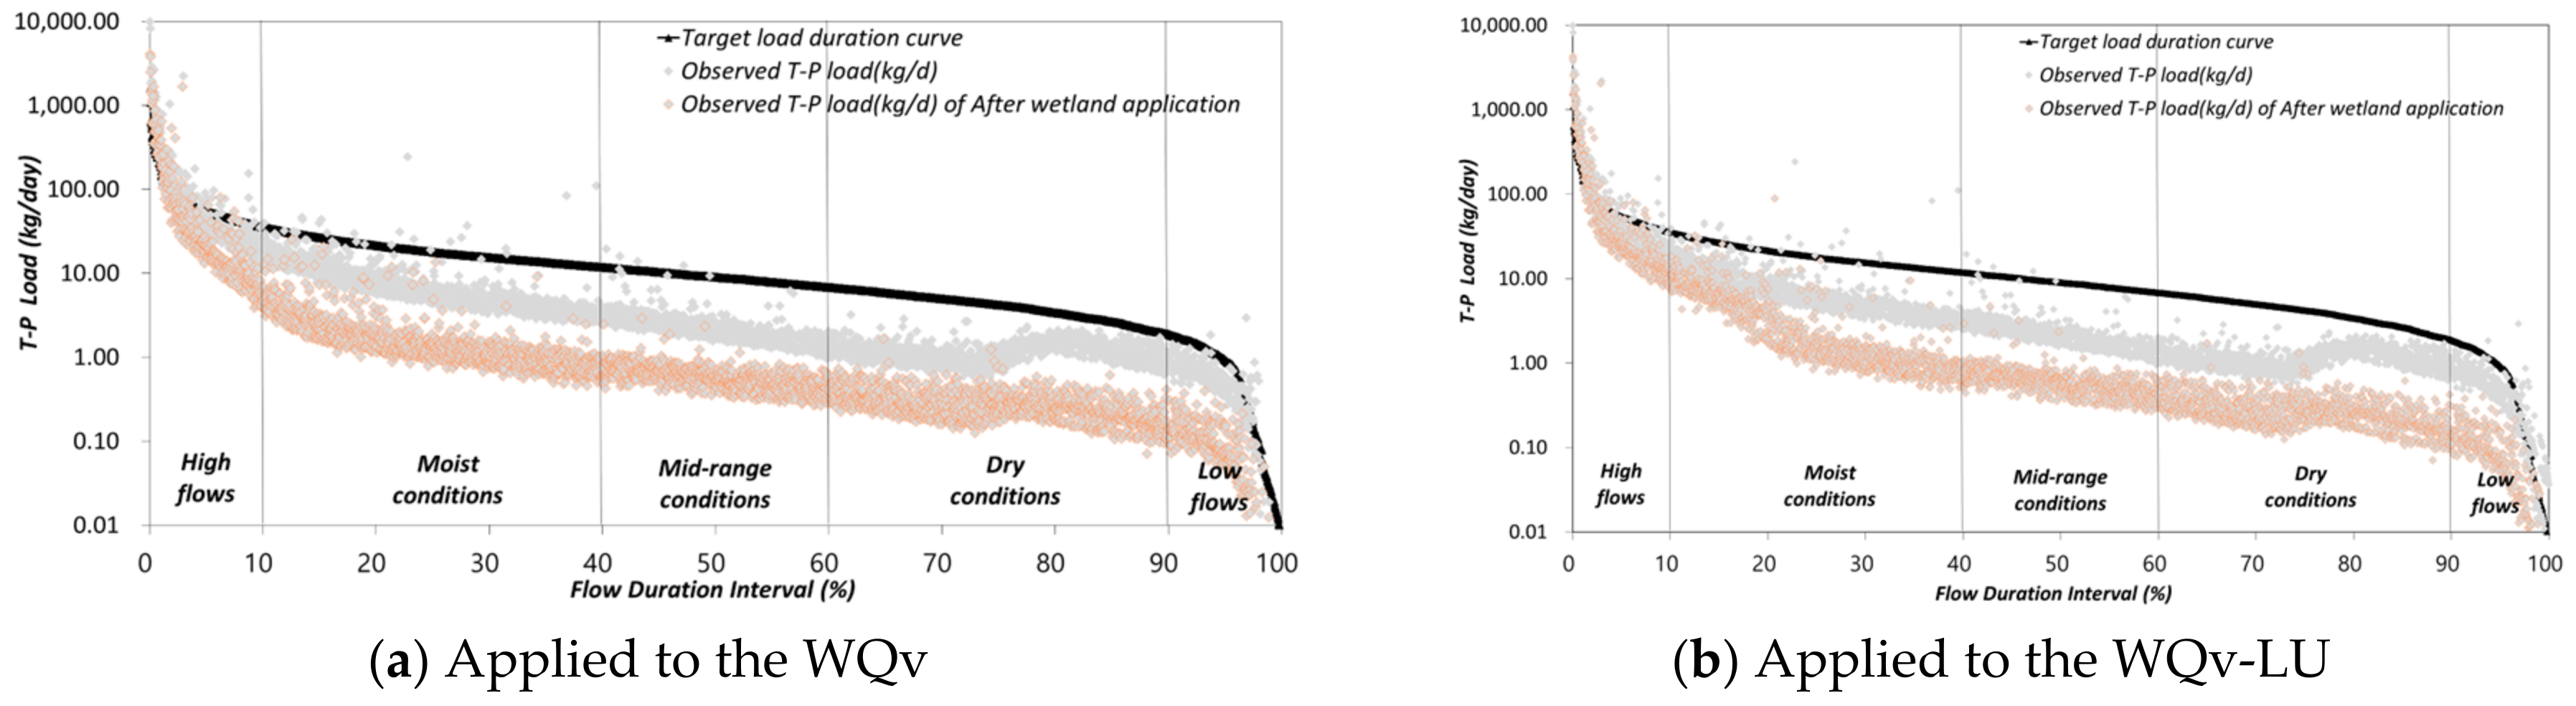
Water quality and pollutant load results were derived at Songya Point 8, the downstream confluence point of the sub-watersheds in the study area. The facility capacity was applied using the estimation equation developed in this study. As a result, the TP load at the downstream end of the Songya Point 8was found to decrease after facility implementation, as shown by the LDC (Load Duration Curve) analysis as shown Figure 14.
In the flow management range of 10–60%, where non-point source pollution has the greatest impact in the Songya watershed, water quality improved by 50.3% for BOD and 67.0% for TP, while pollutant loads were reduced by 43.6% for BOD and 63.0% for TP, compared to the pre-application conditions. These results indicate that applying facility capacity using the proposed equation showed slightly lower improvement efficiency in water quality and pollutant load reduction compared to the WQv method. Specifically, WQv resulted in improvements of BOD 50.3%and TP 75.6%in water quality, and BOD 56.4%and TP 76.4%in pollutant load, demonstrating somewhat higher effectiveness than WQv-LU (Water Quality Volume–Land Use).
As shown in Figure 14, although the cost associated with WQv was higher, the WQv-LU equation also achieved the target TP concentration of 0.2 mg/L within the 10–60% flow range.
As shown in Figure 14, differences in pollutant load reduction resulting from the two capacity estimation equations were observed at the downstream 8 point in the Songya watershed, the location of which is presented in Figure 1.
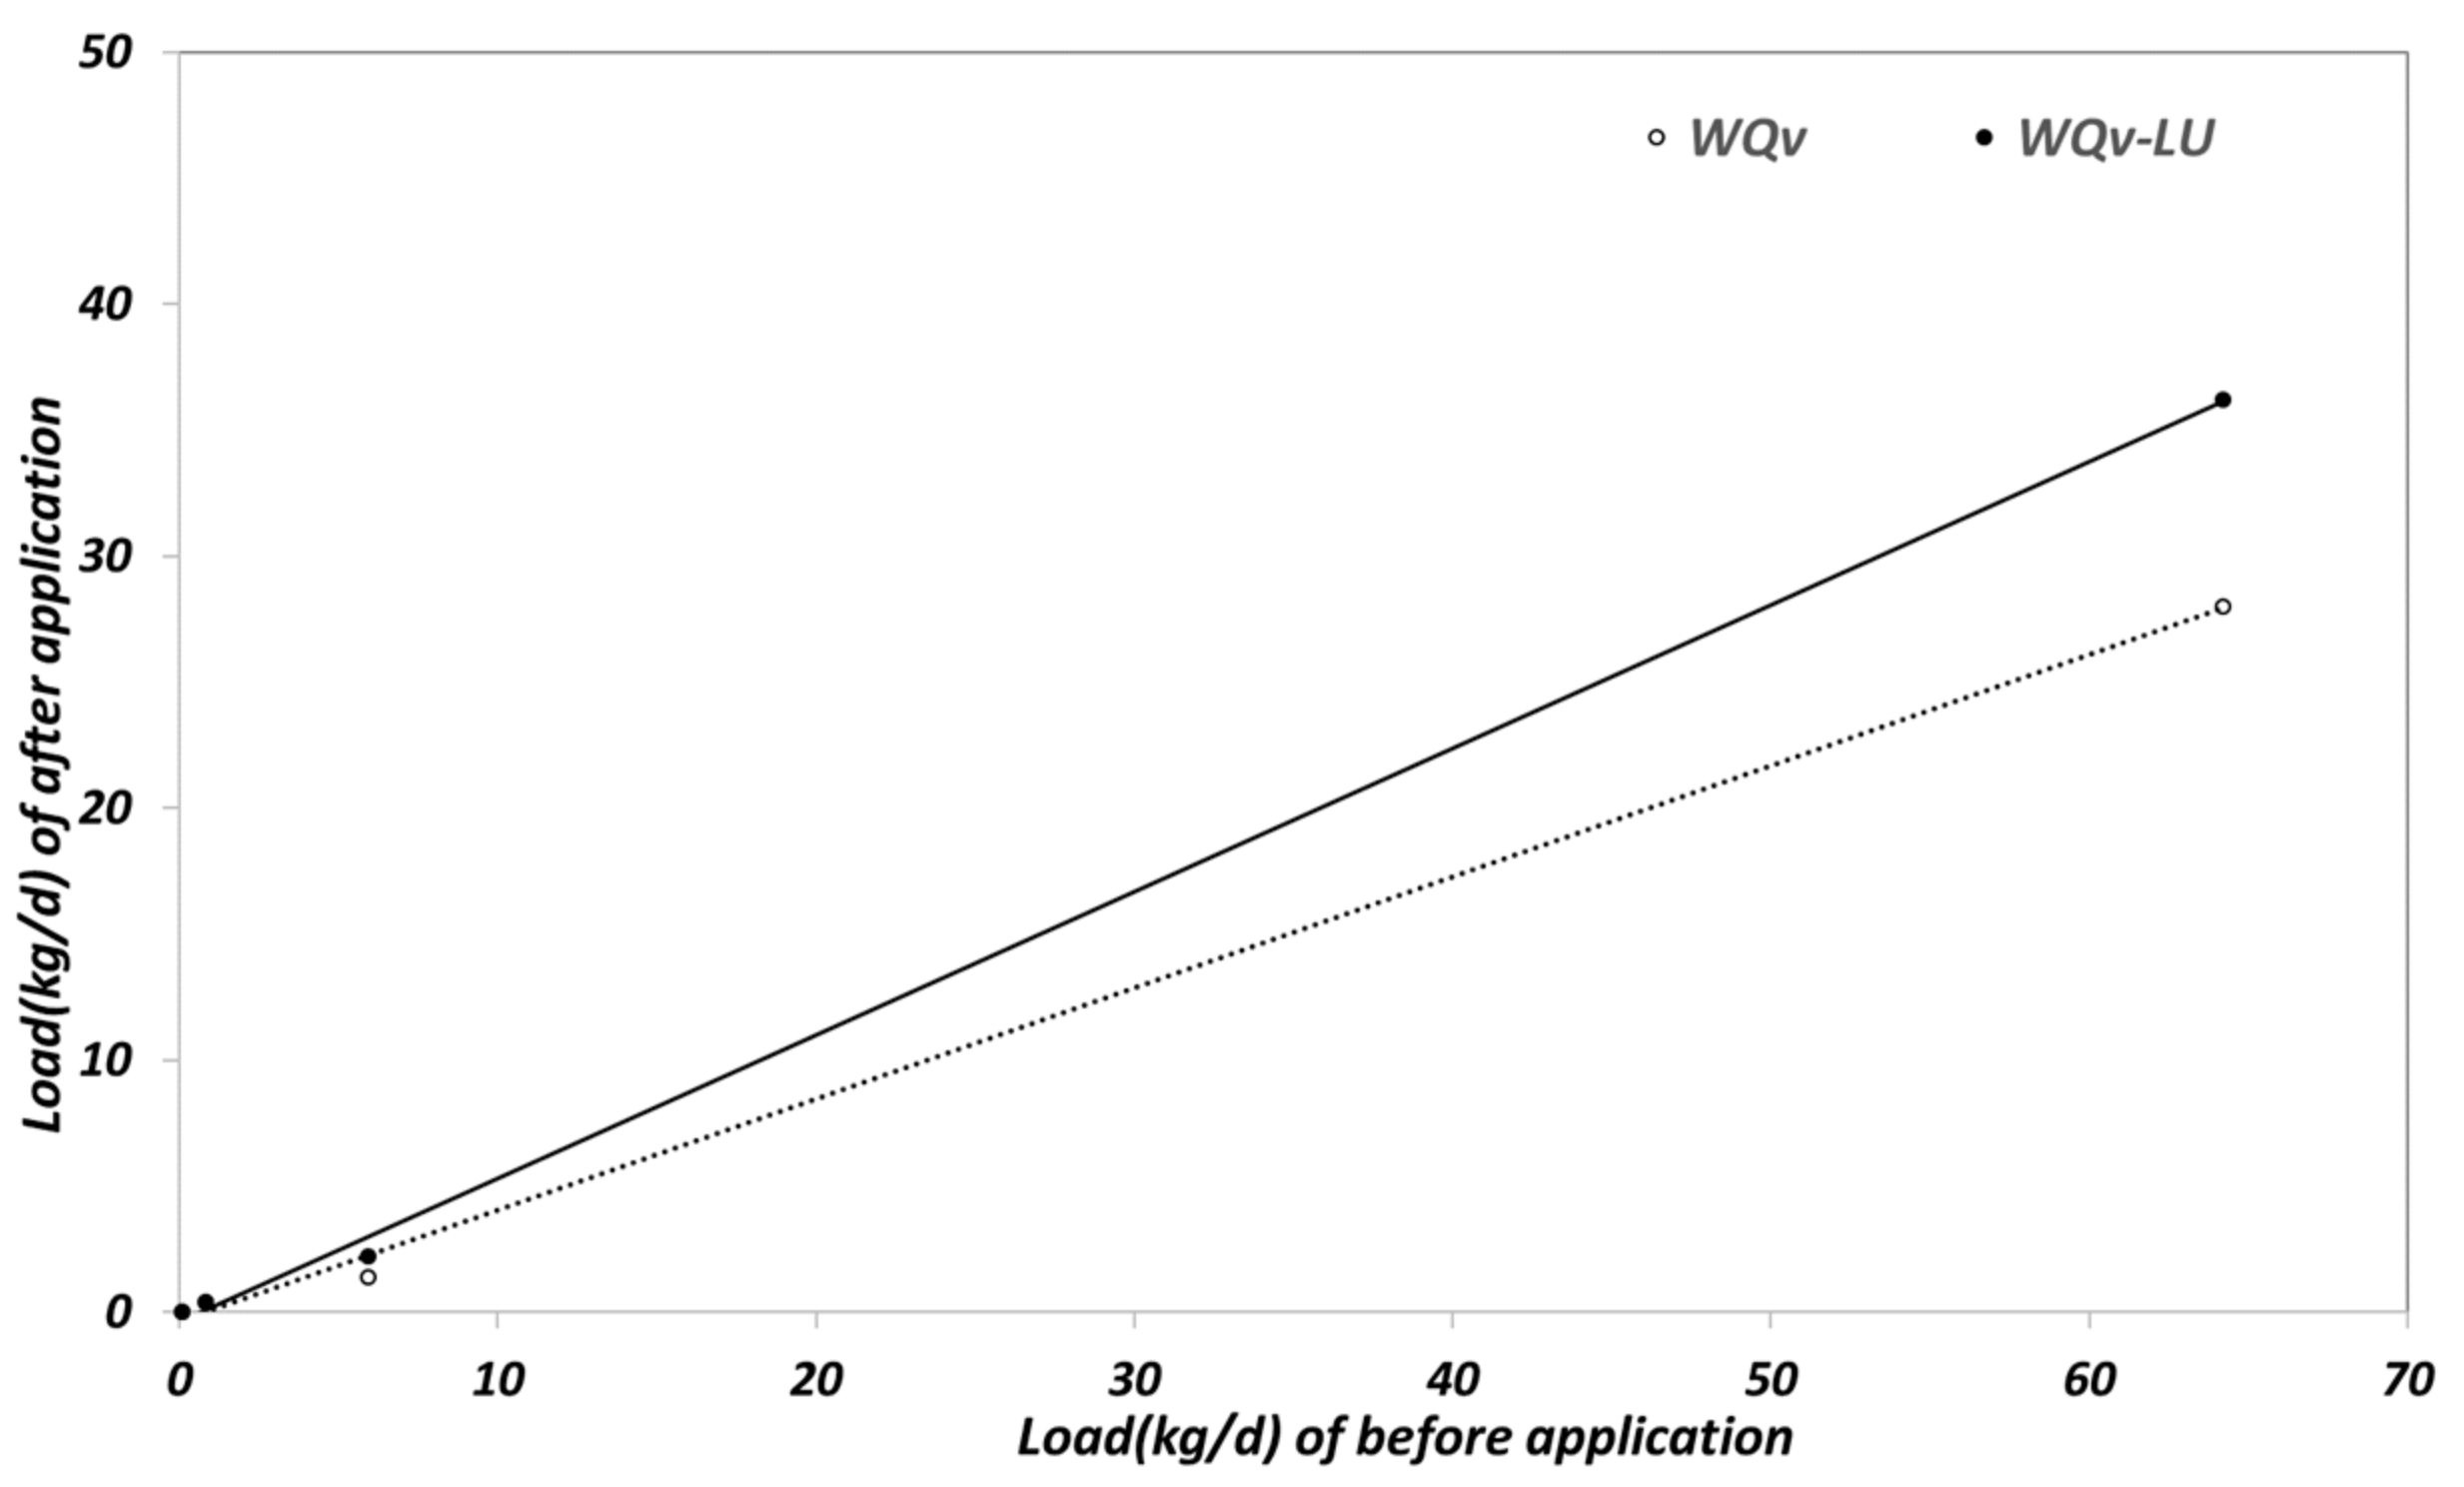
The validity of the proposed equation was evaluated by comparing it with the conventional Water Quality Volume (WQv) equation [29,30]. The results indicated that when the design was based on an accumulated runoff depth of 5 mm [20,22,23], similar improvements in water quality and pollutant load reduction were observed [2,30,31] (Figure 15).
Table 8 presents a comparison between the WQv method and the WQv-LU equation proposed in this study, showing the ratio of efficiency between the two approaches. Since the comparison is based on a ratio [32,33], a value close to 1.0 indicates that the effectiveness of the two equations converges.
The results demonstrate that the WQv-LU equation converges with the WQv method when applied under the same area and rainfall conditions, particularly when the accumulated runoff depth exceeds 5 mm. Therefore, setting 5 mm as the reference standard for application is deemed appropriate.
Despite a reduction in total drainage area, the equation maintained similar pollutant load reduction efficiency, indicating its validity. However, as this equation is empirically derived, it may have limitations based on the specific characteristics of the study area. To enhance its applicability, further monitoring and validation across different study areas should be conducted.
Additionally, this equation incorporates a coefficient for drainage area extent, a key variable in capacity estimation. As a result, when estimating capacity in rural areas with a high proportion of permeable surfaces, this method provides a more detailed calculation based on land use area coefficients, rather than relying solely on impervious surface criteria used in urban WQv models.
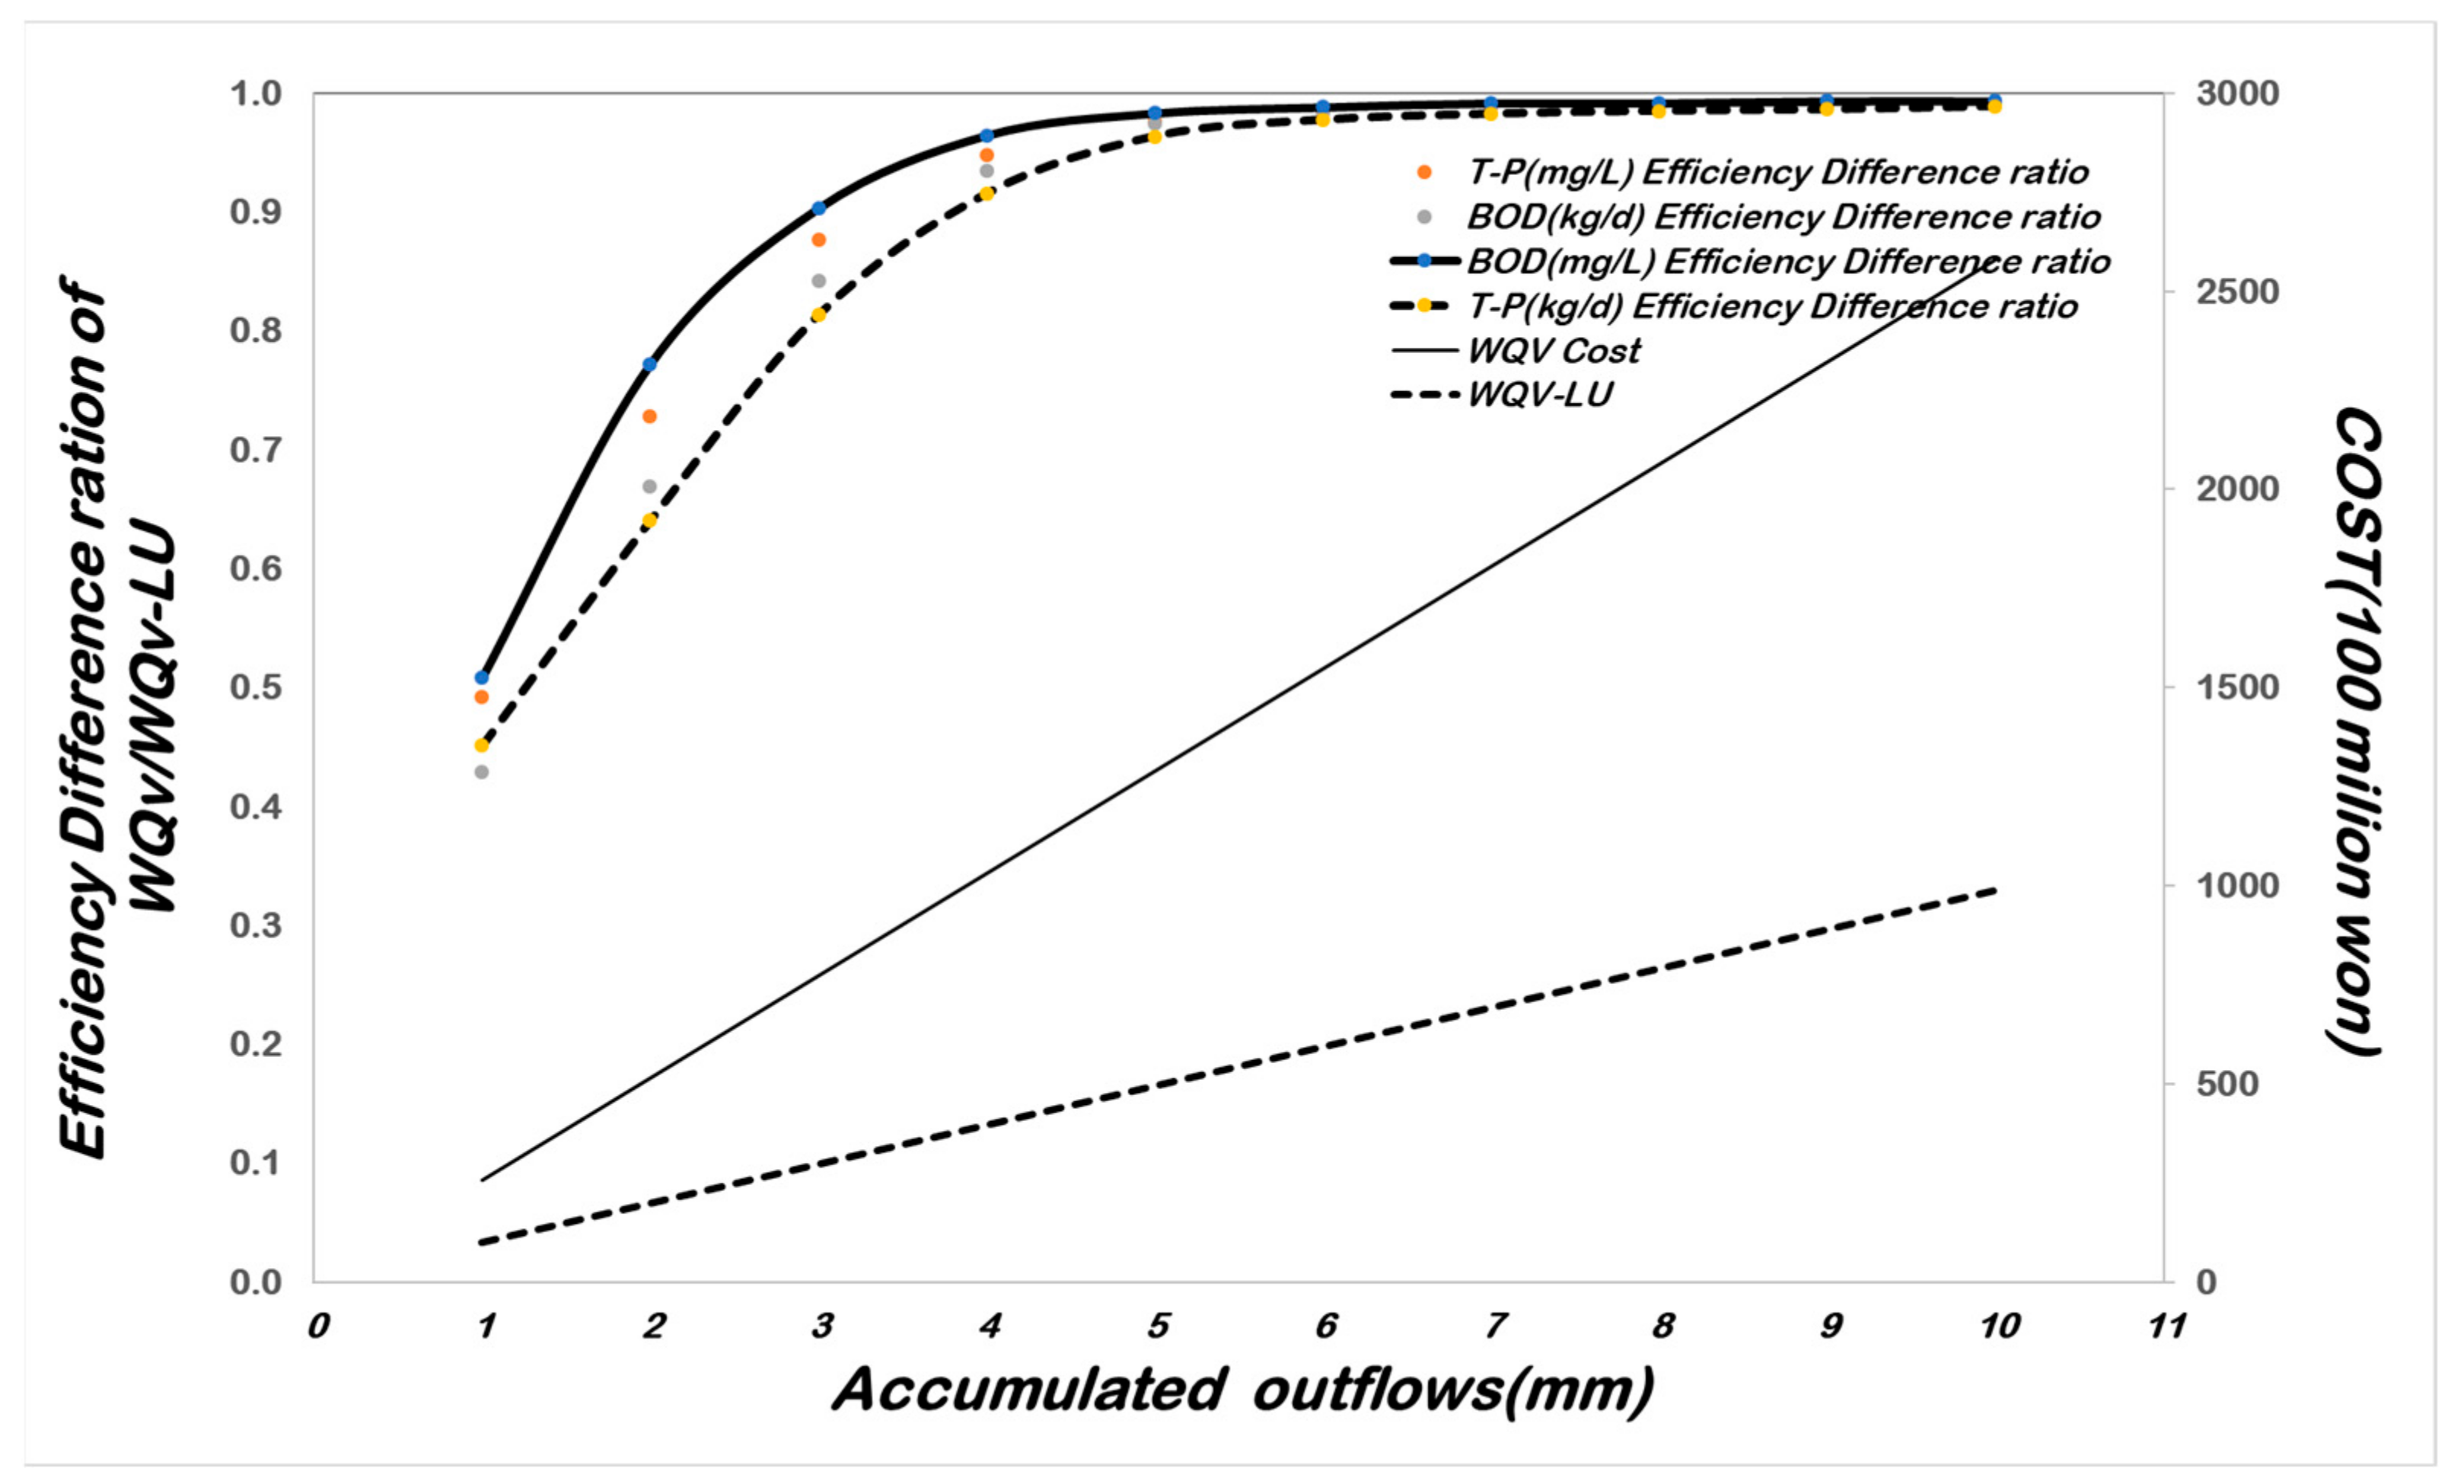
From a cost perspective, the proposed equation also demonstrated significant cost savings compared to the WQv method. As shown in Table 8 and Figure 16, cost differences increased as accumulated runoff depth and capacity increased. At an accumulated runoff depth of 5 mm, the proposed equation resulted in a cost reduction of approximately KRW 79.5 billion.
The cost estimation for non-point source pollution control facilities is approximately KRW 170,000 per drainage area unit. Over the past three years (2018–2020), the average project budget for such facilities in the study area was approximately KRW 2 billion [23]. The proposed equation allows for a 61.7% reduction in facility capacity estimation costs compared to the WQv method, as shown in Table 8.
Thus, even under the same accumulated runoff depth conditions, the proposed WQv-LU equation achieves similar effectiveness beyond 5 mm, as shown in Figure 16, while significantly reducing economic costs.
In this study, two capacity estimation equations were developed for determining the appropriate facility capacity, and both were found to be suitable.
First, the equations were evaluated by comparing and analyzing their results on stream water quality and pollutant loads against those obtained using previously established methods. Although the improvement effects were assessed to be lower than those of existing equations, the results may vary across different flow ranges, and the water quality met the required standards.
Second, the proposed equations offer cost-saving benefits. While showing comparable efficiency, the new equation allows for a more precise estimation of effective treatment area based on the proportion of land use within the drainage area. Since the final cost of non-point source pollution reduction facilities is determined based on site-specific conditions, the proposed equation presents an economic advantage in terms of cost efficiency.

4. Conclusions

This study examined a natural facility capacity estimation equation for rural areas with diverse land use characteristics. Over the past three years (2018–2020), monitoring data on inflow and outflow volumes from nationwide facilities were analyzed to select rural areas with distinctive characteristics. Among them, five natural treatment facilities that met the efficiency criteria for non-point source pollution reduction were analyzed.
The study presented results on total rainfall, rainfall intensity, drainage area, land use types and their ratios, facility inflow and outflow volumes, and flow-weighted mean concentrations. Additionally, regional characteristics of rural areas, such as slope, elevation, and land use features, were further examined.
By applying statistical analysis, the land use ratio within the drainage area, which had the highest p-value, was identified as the most significant factor influencing runoff volume and pollutant loads in rural non-point source pollution areas. Based on this, a multiple regression equation was developed.
The correlation between drainage area and land use ratio for the selected facilities showed a high R2 value of 0.64. The resulting regression equation demonstrated statistical significance, with R2 = 0.965 (p-value < 0.05). A residual analysis confirmed that the equation satisfied the three key assumptions: normality, homoscedasticity, and independence.
Exceptionally, rice paddies exhibited a negative correlation, while forests had an R2 of 0.42, though both were statistically significant, with p-values < 0.05.
Since rural areas primarily consist of rice paddies and farmland, the negative correlation for the rice paddy area was further analyzed. The results indicated that as the proportion of rice paddies increased, runoff volume exhibited a negative correlation.
To determine the cause, runoff volume was analyzed based on total precipitation and the proportion of rice paddies. In areas where rice paddies accounted for more than 20% of the total area, runoff volume began to decrease at 15–20 mm of rainfall but increased when precipitation exceeded 50 mm.
These findings suggest that drainage management practices (e.g., floodgate control) commonly used in rural areas may have influenced early rainfall runoff. Additionally, runoff generation was observed when precipitation exceeded 50 mm.
Thus, the proposed equation is applicable when the proportion of rice paddies is at least 20% of the total area. However, for precipitation above 50 mm, the equation may have limitations, requiring additional water quality monitoring and watershed modeling for a more precise analysis.
Since this equation is derived from empirical data collected through rainfall monitoring at drainage areas where non-point source pollution control facilities are in operation, it is considered suitable for application in rural areas of South Korea.
Regarding the economic feasibility and practical application, the economic analysis demonstrated that, under the same accumulated runoff depth conditions, the proposed equation required a smaller capacity than WQv, achieving similar pollutant reduction efficiency while reducing costs.
When designing non-point source pollution control facilities, selecting the entire sub-watershed as the drainage area may lead to overestimated capacity calculations, causing the pollution reduction load to exceed actual pollutant discharge. This would reduce overall efficiency.
Therefore, when applying facilities in small watershed tributaries, proper estimation of the target watershed area and setting an appropriate accumulated runoff depth standard will be crucial for efficient non-point source pollution management.

Author Contributions

Conceptualization, J.K.; D.K.; methodology, J.K.; software, J.K.; formal analysis, J.K.; investigation, J.K.; resources, J.K.; data curation, J.K.; writing—original draft preparation, J.K.; writing—review and editing, J.K.; visualization, J.K.; supervision, D.K.; project administration, D.K. All authors have read and agreed to the published version of the manuscript.

Funding

This research received no external funding.

Data Availability Statement

The original contributions presented in this study are included in the article. Further inquiries can be directed to the corresponding authors.

Conflicts of Interest

The authors declare no conflict of interest.

References

  1. Ministry of Environment, Korea. The 3rd Comprehensive Measures for Stormwater Runoff; Ministry of Environment: Seoul, Republic of Korea, 2018. [Google Scholar]
  2. Lee, Y.J. Estimation of Non-Point Source Pollutant Loads Using HSPF and SWMM Models in a Mixed Land Use Watershed. Master’s Thesis, Konkuk University Graduate School, Seoul, Republic of Korea, 2014. [Google Scholar]
  3. Ministry of Environment, Korea. Third-Year Report on Monitoring and Maintenance of Non-Point Source Pollution Reduction Facilities in the Han River Basin; Ministry of Environment: Seoul, Republic of Korea, 2007.
  4. Ministry of Environment, Korea. Installation and Management Operation Manual for Non-Point Source Pollution Reduction Facilities; Ministry of Environment: Seoul, Republic of Korea, 2020.
  5. Ministry of Environment, Republic of Korea. Guidelines for the Implementation of Nonpoint Pollution Reduction Projects with National Subsidies; Ministry of Environment: Sejong, Republic of Korea, 2024.
  6. Ministry of Environment, Republic of Korea. Enforcement Rule of the Water Environment Conservation Act; Ministry of Environment: Sejong, Republic of Korea, 2025.
  7. National Institute of Environmental Research (NIER), Korea. Customized Policy Support Study for Non-Point Source Pollution Management and Water Circulation Improvement (III); Report No. NIER-RP2018-248; NIER: Incheon, Republic of Korea, 2016. [Google Scholar]
  8. Korea Environment Corporation. Study on the Maintenance of Non-Point Pollution Reduction Pilot Facilities and Efficiency Evaluation of National Subsidy Projects; Korea Environment Corporation: Incheon, Republic of Korea, 2018. [Google Scholar]
  9. Korea Environment Corporation. Study on the Maintenance of Non-Point Pollution Reduction Pilot Facilities and Efficiency Evaluation of National Subsidy Projects; Korea Environment Corporation: Incheon, Republic of Korea, 2019. [Google Scholar]
  10. Korea Environment Corporation. Study on the Maintenance of Non-Point Pollution Reduction Pilot Facilities and Efficiency Evaluation of National Subsidy Projects; Korea Environment Corporation: Incheon, Republic of Korea, 2020. [Google Scholar]
  11. Korea Ministry of Government Legislation. Standard Methods for Water Pollution Process Tests. National Law Information Center. Available online: https://www.law.go.kr (accessed on 23 April 2022).
  12. Kim, Y. Assessment of the Non-Point Source Pollution Control Strategies for Water Quality Improvement in the Haeban Stream of West Nakdong River Watershed. J. Wetl. Res. 2024, 26, 1–9. [Google Scholar]
  13. Park, B.K.; Ahn, K.H.; Kim, E.J.; Kang, M.J.; Park, J.D.; Park, J.H.; Jeong, J.H.; Kim, Y.S.; Rhew, D.H.; Lee, G.M. Decision of Prioritization of Catchments and Determination of Control Target for Non-Point Source Pollution Management (II); Report No. NIER-RP2014-319; National Institute of Environmental Research: Incheon, Republic of Korea, 2014. [Google Scholar]
  14. Kang, S.-H. Non-Point Source Pollutants Runoff Modeling and Its Management Using Quasi-Distributed DEM—Focused on the Oshipchon of Samcheok. In Proceedings of the 2005 Annual Conference of the GIS Association of Korea, Seoul, Republic of Korea, 1 April 2005; pp. 43–53. [Google Scholar]
  15. Kim, S.J.; Woo, S.Y.; Lee, J.W.; Kim, Y.W.; Lee, H.P.; Hong, E.M.; Song, I.H. Development of integrated techniques linking water quality, hydrology, and aquatic ecology considering watershed environmental changes. Water Future 2020, 53, 6–16. [Google Scholar]
  16. Jung, S.H.; Rhee, H.-P.; Hwang, H.S.; Yoon, C.G. Study on Development of Paddy-RCH Method to Consider Discharge Characteristics of Paddy Field in Watershed Model HSPF. J. Korean Soc. Environ. Eng. 2019, 41, 311–320. [Google Scholar] [CrossRef]
  17. Jung, C.G.; Park, J.Y.; Lee, J.W.; Jung, H.; Kim, S.J. The applicability of SWAT-APEX model for agricultural nonpoint source pollution assessment. J. Korean Soc. Agric. Eng. 2011, 53, 35–42. [Google Scholar]
  18. Zhu, J.; Zhang, X.; Chen, Y. Development and testing of an integrated APEX-SWAT-GW model for simulations of agro-hydrological processes in a groundwater-fed plain in China. Environ. Model. Softw. 2023, 168, 105748. [Google Scholar] [CrossRef]
  19. Lee, B.S.; Jung, Y.J.; Park, M.J.; Gil, K.I. Study on the Characteristics of Non-Point Source Pollution Discharge in Rural Areas of the Gyeongan Stream Watershed. J. Korean Soc. Water Environ. 2008, 24, 169–173. [Google Scholar]
  20. Lee, D.G.; Kang, M.S.; Kim, K.W.; Jeon, S.M.; Ryu, J.H.; Lee, H.J. Impact of Optimal Management Practices on Non-Point Source Pollution Reduction in Rural Watersheds; Korean Society of Agricultural Engineers: Seoul, Republic of Korea, 2017; Volume 2017, p. 232. [Google Scholar]
  21. Lee, D.G. Development of the HSPF-MASA-CREAMS-PADDY Integrated System Considering Agricultural Reservoirs and Rice Paddies. J. Korean Soc. Agric. Eng. 2018, 60, 1–12. [Google Scholar]
  22. Choi, Y.Y.; Jung, S.Y.; Choi, J.W. Analysis of Non-Point Source Pollutant Characteristics in Initial Rainfall Runoff by Land Use Type. J. Korean Soc. Environ. Sci. 2011, 20, 417–426. [Google Scholar]
  23. Ministry of Environment. Technical Guidelines for Total Water Pollution Load Management; Ministry of Environment: Sejong, Republic of Korea, 2019.
  24. National Institute of Agricultural Sciences, Korea. Installation of Rice Paddy Drainage Outlets Reduces Nutrient Runoff and Improves Water Quality; National Institute of Agricultural Sciences: Jeonbuk, Republic of Korea, 2021. [Google Scholar]
  25. Agricultural Environmental Conservation, Korea. Annual Report on Agricultural Environmental Conservation; Agricultural Environmental Conservation: Boryeong, Republic of Korea, 2021. [Google Scholar]
  26. Ministry of Agriculture, Food and Rural Affairs, Korea. 2020 Agricultural Environmental Conservation Program Implementation Guidelines; Ministry of Agriculture, Food and Rural Affairs: Sejong, Republic of Korea, 2020.
  27. Son, J.K.; Kim, C.H.; Yoon, S.W.; Gong, M.J.; Choi, D.K.; Kang, D.H.; Park, M.J.; Kang, B.H. Study on the Characteristics and Improvement Measures of Non-Point Source Pollution from Rural Domestic Sewage. J. Korean Soc. Rural Plan. 2018, 24, 37–46. [Google Scholar] [CrossRef]
  28. Song, S.H.; Jang, M.H.; Kim, J.S.; Kim, M.S.; Kim, B.B.; Kwak, J.Y.; Park, K.Y.; Kim, S.H. Study on the Development of Non-Point Source Pollution Management Plan for Rural Areas; Final Report; Ministry of Environment: Sejong, Republic of Korea, 2014. [Google Scholar]
  29. Song, J.Y.; Shin, M.H.; Won, C.H.; Jang, J.R.; Choi, J.D. Analysis of Runoff and Non-Point Source Pollutant Characteristics from Sloped Farmland Using Artificial Rainfall; Korean Society of Agricultural Engineers: Seoul, Republic of Korea, 2013; Volume 2013, p. 76.
  30. Yoon, C.K. Development of Optimal Management Techniques for Reducing Non-Point Source Pollution in Rice Paddies. Rural. Resour. 2010, 52, 15–28. [Google Scholar]
  31. Lee, S.H.; Kim, I.H.; Cho, H.J. Analysis of Non-Point Source Pollution Reduction Efficiency According to Artificial Wetland Types. Appl. Ecol. Environ. Res. 2014, 1, 102–108. [Google Scholar]
  32. Lee, J.Y. Characteristics and Correlation Analysis of Non-Point Source Pollutant Runoff from Artificial Grasslands during Rainfall Events. J. Korean Wetl. Soc. 2009, 11. [Google Scholar]
  33. Kang, M.-A.; Choi, B.-W.; Yoo, J.-J. Characteristics of Pollutant Loads from Non-Point Sources during Rainfall Events: A Case Study on Cherry Tree Cultivation Area. J. Korean Geo-Environ. Soc. 2010, 20, 401–407. [Google Scholar]
Figure 1. Application of WQv-LU to the Songya watershed.
Water 17 01323 g001
Figure 2. Flow chart Load duration curves were used to analyze water quality and pollutant loads at downstream Point 8 of the Songya Stream, based on the target criteria of the corresponding mid-level watershed. The stream environmental standard is classified as Grade III (Fair), and the “Good Water” target for the Songya Stream watershed was set based on a TP concentration of 0.2 mg/L, from which the reference load (kg/day) was derived.
Water 17 01323 g002
Figure 3. Analysis of precipitation characteristics of Suwon Stream basin. (a) Number of occurrences by precipitation grade. (b) The composition ratio of precipitation to the number of precipitation occurrences by precipitation grade.
Water 17 01323 g003
Figure 4. Monitoring results of A area (2018–2020).
Water 17 01323 g004
Figure 5. Results of monitoring of B area (2018–2020).
Water 17 01323 g005
Figure 6. Results of monitoring of Uiwang City Wangsong Lake basin (2018–2020).
Water 17 01323 g006
Figure 7. Results of monitoring of D area (2018–2020).
Water 17 01323 g007
Figure 8. Correlation between rainfall and runoff ggplot results.
Water 17 01323 g008
Figure 9. Runoff according to proportion of land use area.
Water 17 01323 g009
Figure 10. Runoff according to 10% land use (%).
Water 17 01323 g010
Figure 11. The result of ggplot of the correlation between the land use area ratio and the outflow.
Water 17 01323 g011
Figure 12. The runoff volume of paddies by total rainfall grade (m3).
Water 17 01323 g012
Figure 13. The runoff volume of ETC by total rainfall grade (m3). * Legend for x-axis—1: 10–15 mm, 2: 15–20 mm, 3: 25–30 mm, 4: 30–35 mm, 5: 50 mm.
Water 17 01323 g013
Figure 14. Songya watershed WQv-LU application of TP (kg/d) (2010–2020).
Water 17 01323 g014
Figure 15. WQv and WQv-LU of load (kg/d).
Water 17 01323 g015
Figure 16. Comparison and analysis of WQv and WQv-LU.
Water 17 01323 g016
Table 1. Correlation analysis criteria and correlation.
CriteriaCorrelation
±0.9≤Very high correlation
±0.7 ≤ ~ < ±0.9High correlation
±0.4 ≤ ~ < ±0.7Rather high correlation
±0.2 ≤ ~ < ±0.4Low correlation
±0.2<Very little correlation
Table 2. Process to increase the reliability of multiple regression equations in R.
TypeContents
Select allSelect a term model for all independent variables
Forward selectionSelect a model using only the independent variables that affect it
Select a stepSelection using a combination of variables, including forward selection by default, and, incidentally, the rear removal method
Table 3. The site required per type of facility.
TypeArtificial Wetland
(per m3)
Filtration
Facility
(m3/h)
Storage Facilities
(per m3)
Soil Land
(per m3)
Highly Efficient Human-Made Wetlands
(per m3)
Area1.5~2 m20.1~0.2 m20.2~0.3 m21.0~1.2 m25~9 m2
Table 4. Project expenses according to facility type and capacity.
TypeArtificial Wetland
(per m2)
Storage Facilities
(per m3)
Soil Land
(per m2)
Highly Efficient Human-Made Wetlands
(per m2)
CostKRW 170,000 KRW 134,000,000 KRW 130,000 KRW 200,000
Table 5. Land use of target area.
LocationLand Use (%)
PADAIPAFAEA
A55.38.511.014.211.0
B58.28.95.312.914.8
C10.535.412.237.34.6
D79.0 12.14.62.71.6
E7.316.831.440.63.9
PA: Paddy Area, DA: Dry paddy Area, IPA: Impervious Area, FA: Forest Area, EA: Etc at al. Area.
Table 6. Characteristics of Artificial Wetland (continued).
LocationTypeContents
AArea (m2)83.7 ha
Wetland area (m2)5912 m2
Volume (m3)4180
TypeArtificial wetland
BArea (m2)125.7 ha
Wetland area (m2)14,098 m2
Volume (m3)9690
TypeArtificial wetland
CArea (m2)10,138
Wetland area (m2)4630
Volume (m3)5000
TypeArtificial wetland
Table 7. Land use ratios and ranking of subbasins.
SubbasinsLand Use Ratio (%)Land Use Ranking
PADAFAIPAETCPervious Area (ha)Impervious Area (ha)Pervious Area (%)Impervious Area (%)
Songya 117.16.164.03.59.31620650.870.035
Songya 218.45.467.52.66.1357101.100.003
Songya 320.212.856.32.48.3719190.890.001
Songya 418.712.160.32.56.31727482.150.001
Songya 516.18.263.42.79.5545173.480.006
Songya 617.29.260.14.58.9668350.870.001
Songya 713.78.665.82.49.51129311.460.001
Table 8. Comparison and analysis of WQv and WQv-LU.
Accumulated Out-Flows
(mm)
Difference of Efficiency (%) Cost (KRW 100 Million)
Con. (mg/L)Load (kg/d)WQv WQv-LU Reduction
BODTPBODTP
51.0 1.9 1.5 2.9 1289.1494.2795.0
Disclaimer/Publisher’s Note: The statements, opinions and data contained in all publications are solely those of the individual author(s) and contributor(s) and not of MDPI and/or the editor(s). MDPI and/or the editor(s) disclaim responsibility for any injury to people or property resulting from any ideas, methods, instructions or products referred to in the content.

