

From Data to Action: Rainfall Factor-Based Soil Erosion Assessment in Arid Regions Through Integrated Geospatial Modeling

 ,
,  , , ,
, , ,  and
and
Abstract
1. Introduction
2. Materials and Methods
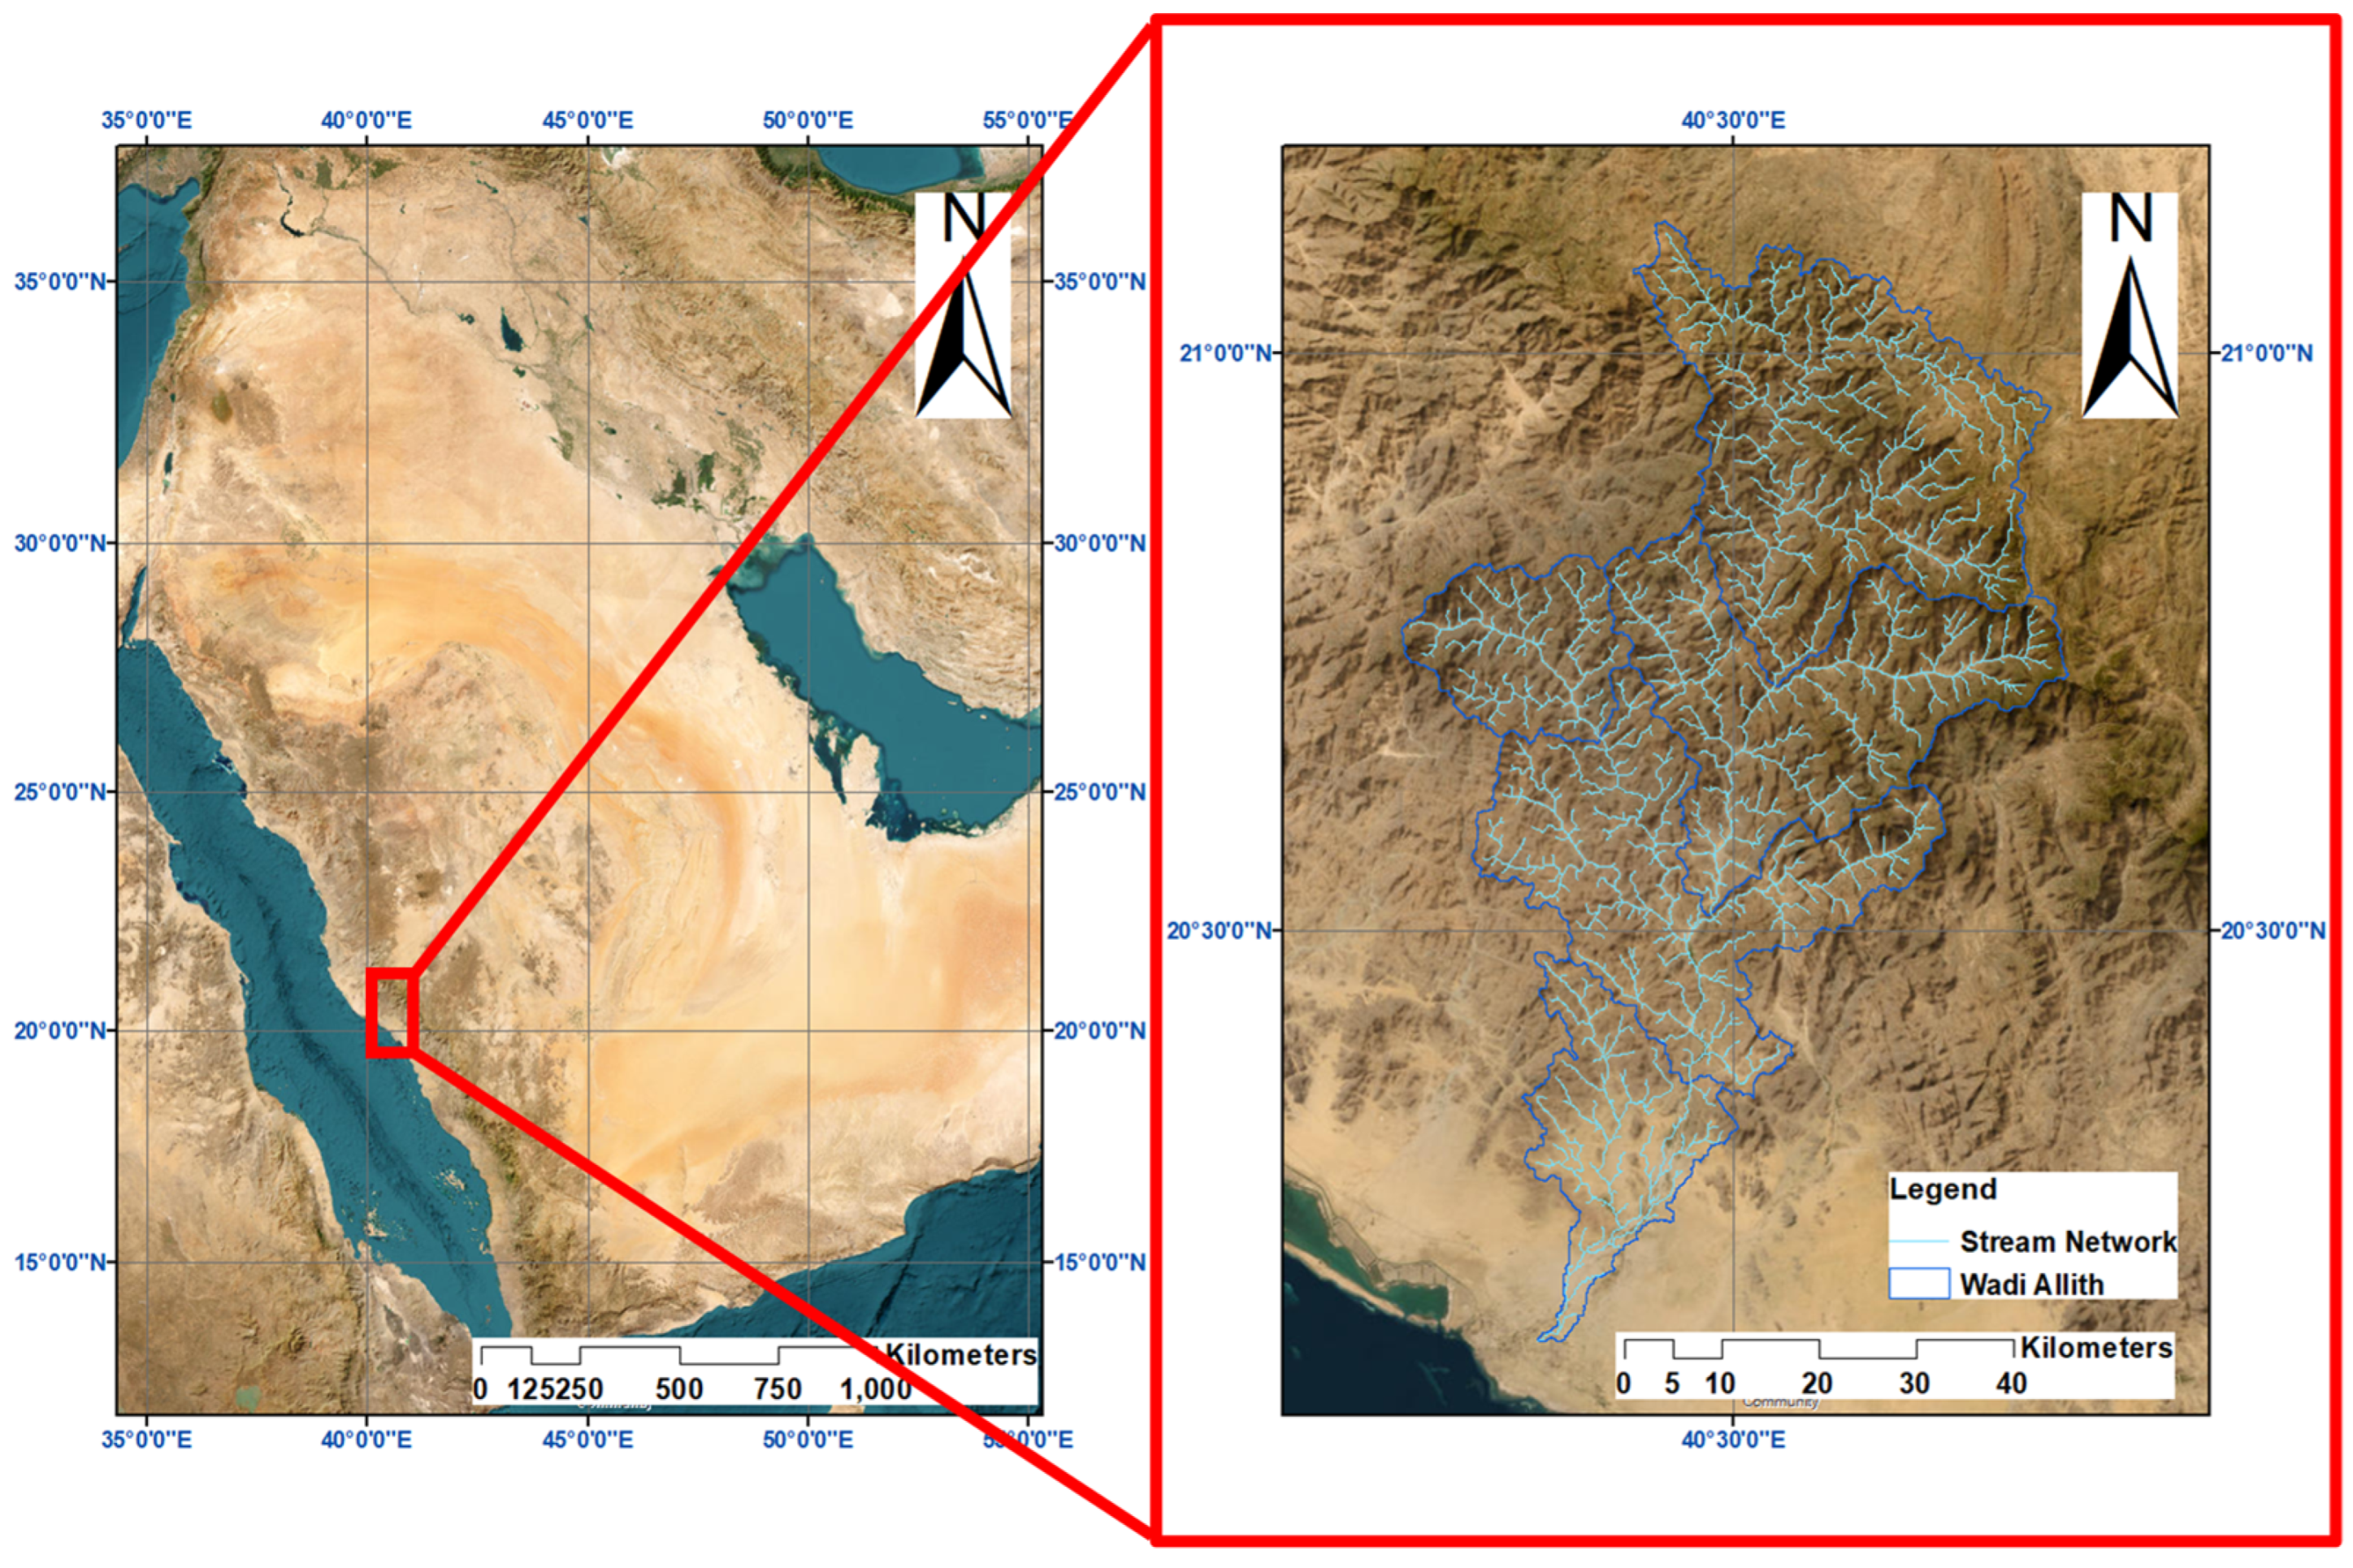
2.1. Study Area
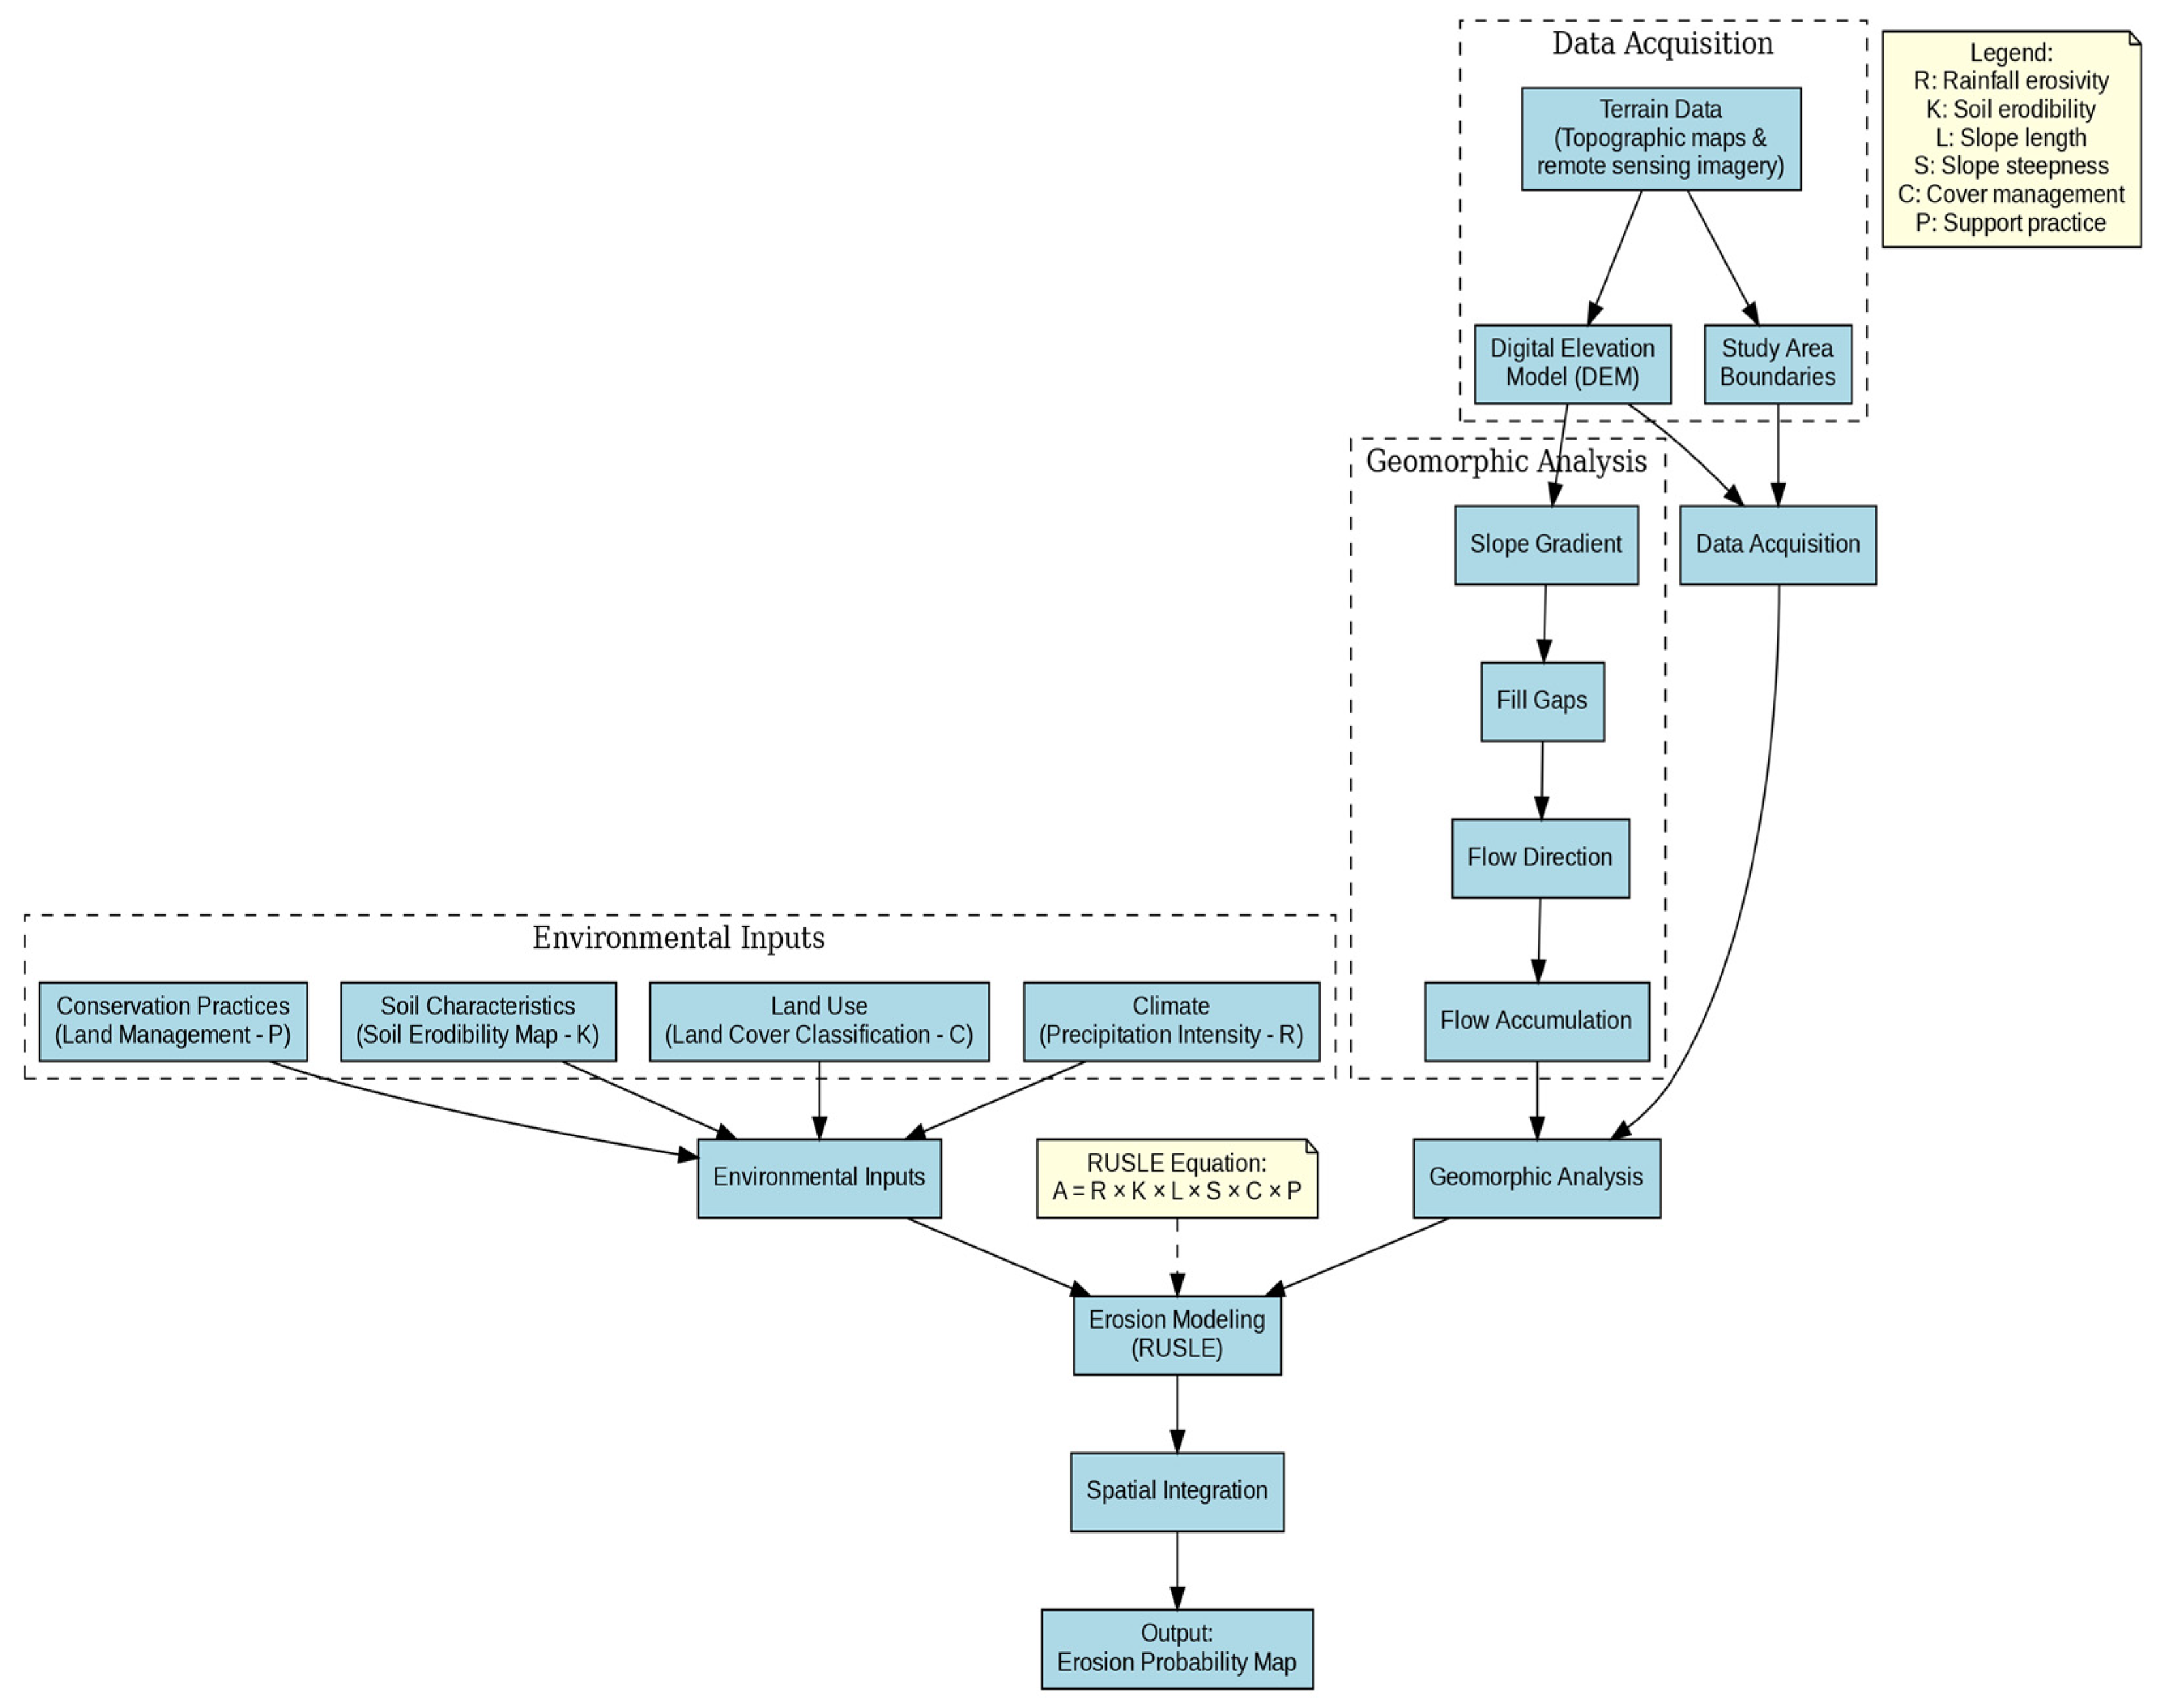
2.2. Methodological Framework
2.3. Data Collection
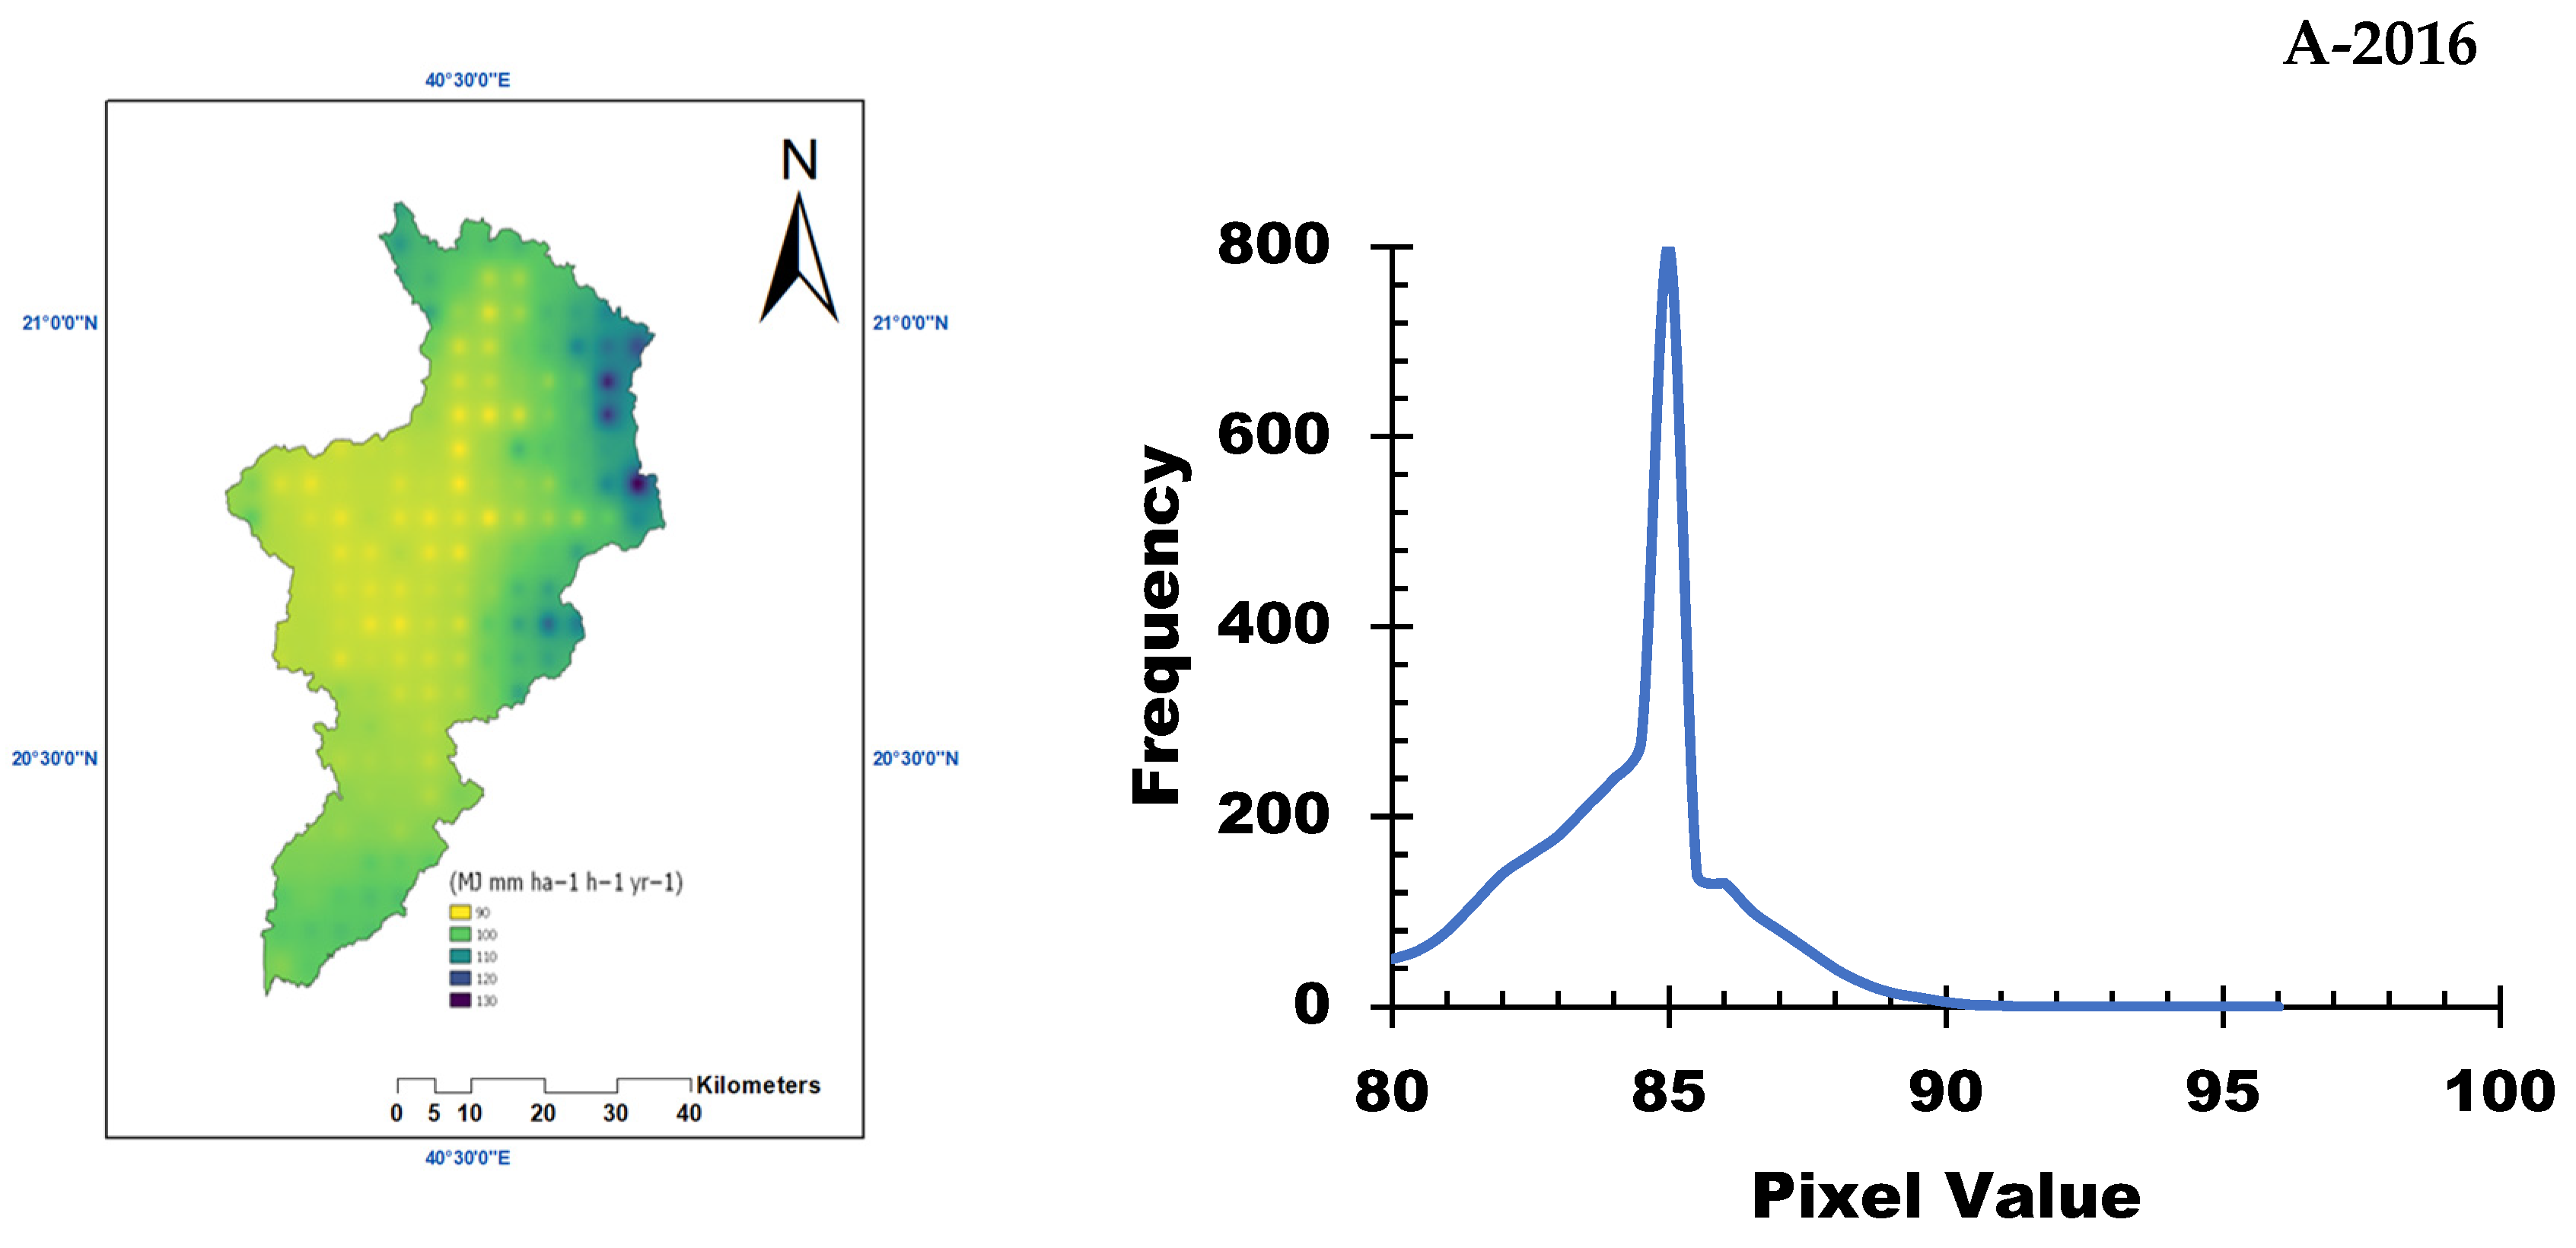
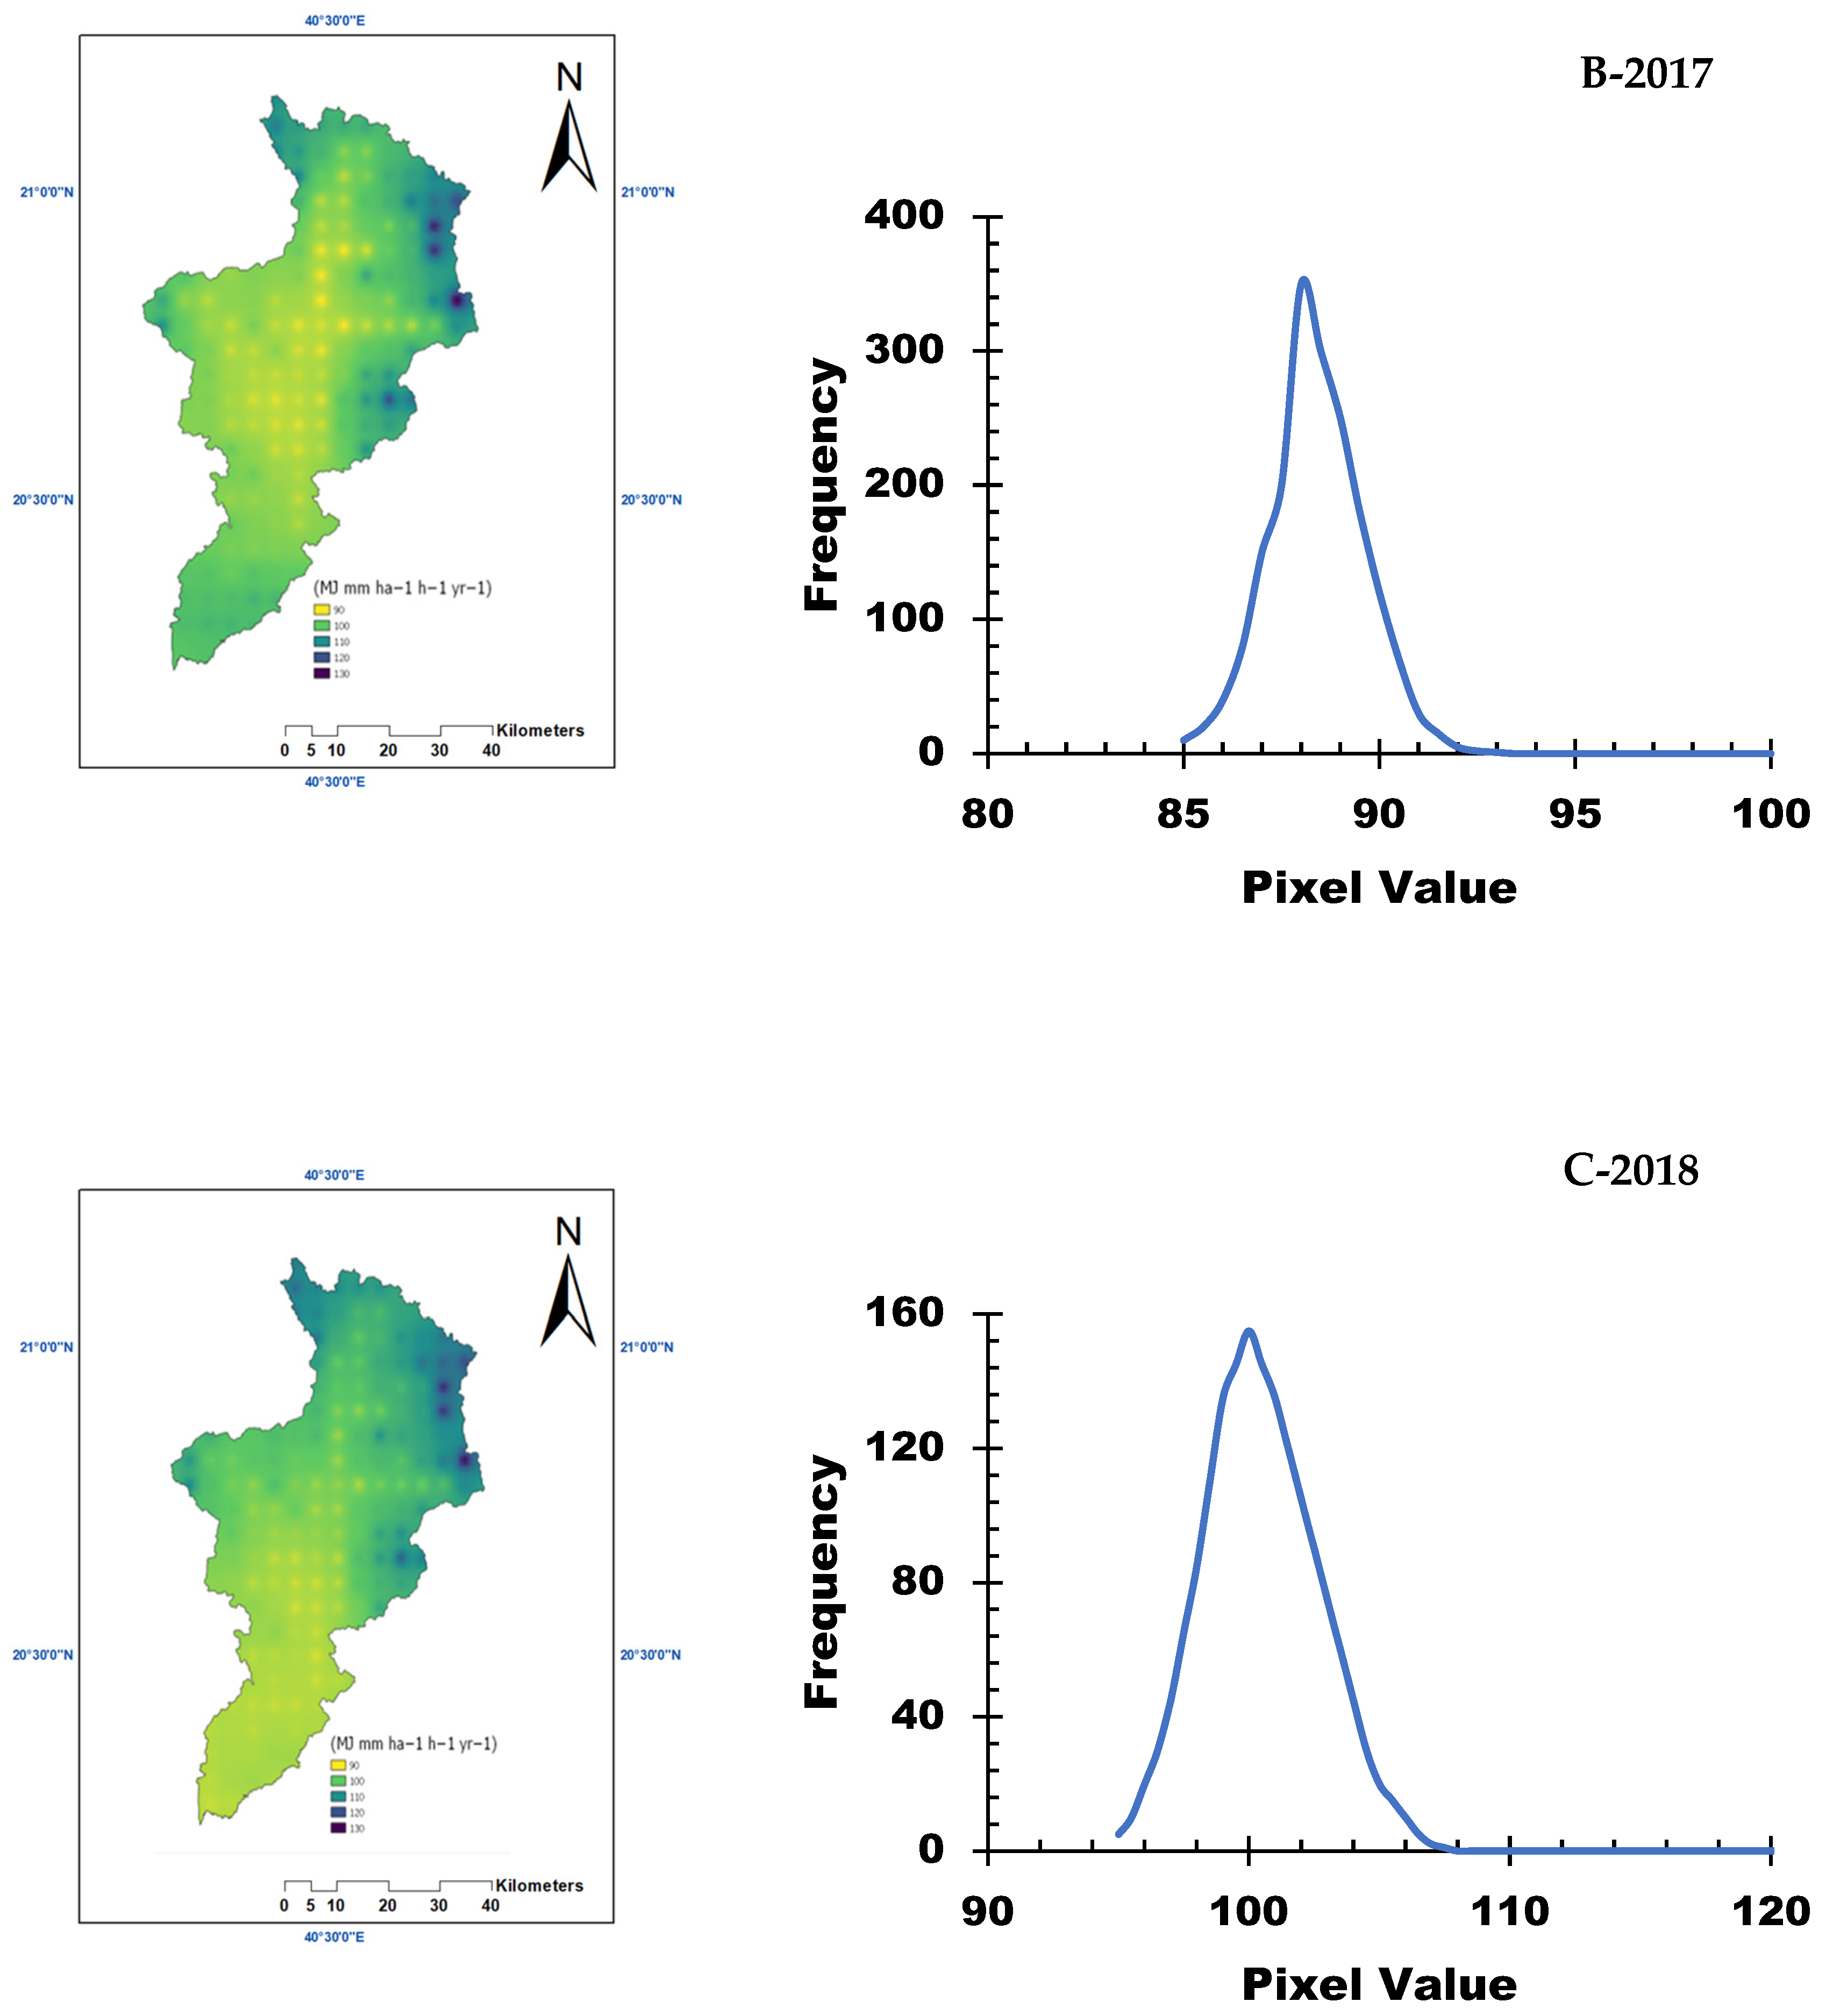
2.3.1. Rainfall Erosivity Factor (R)
2.3.2. Soil Erodibility Factor (K)
2.3.3. Slope Length and Slope Steepness (LS)
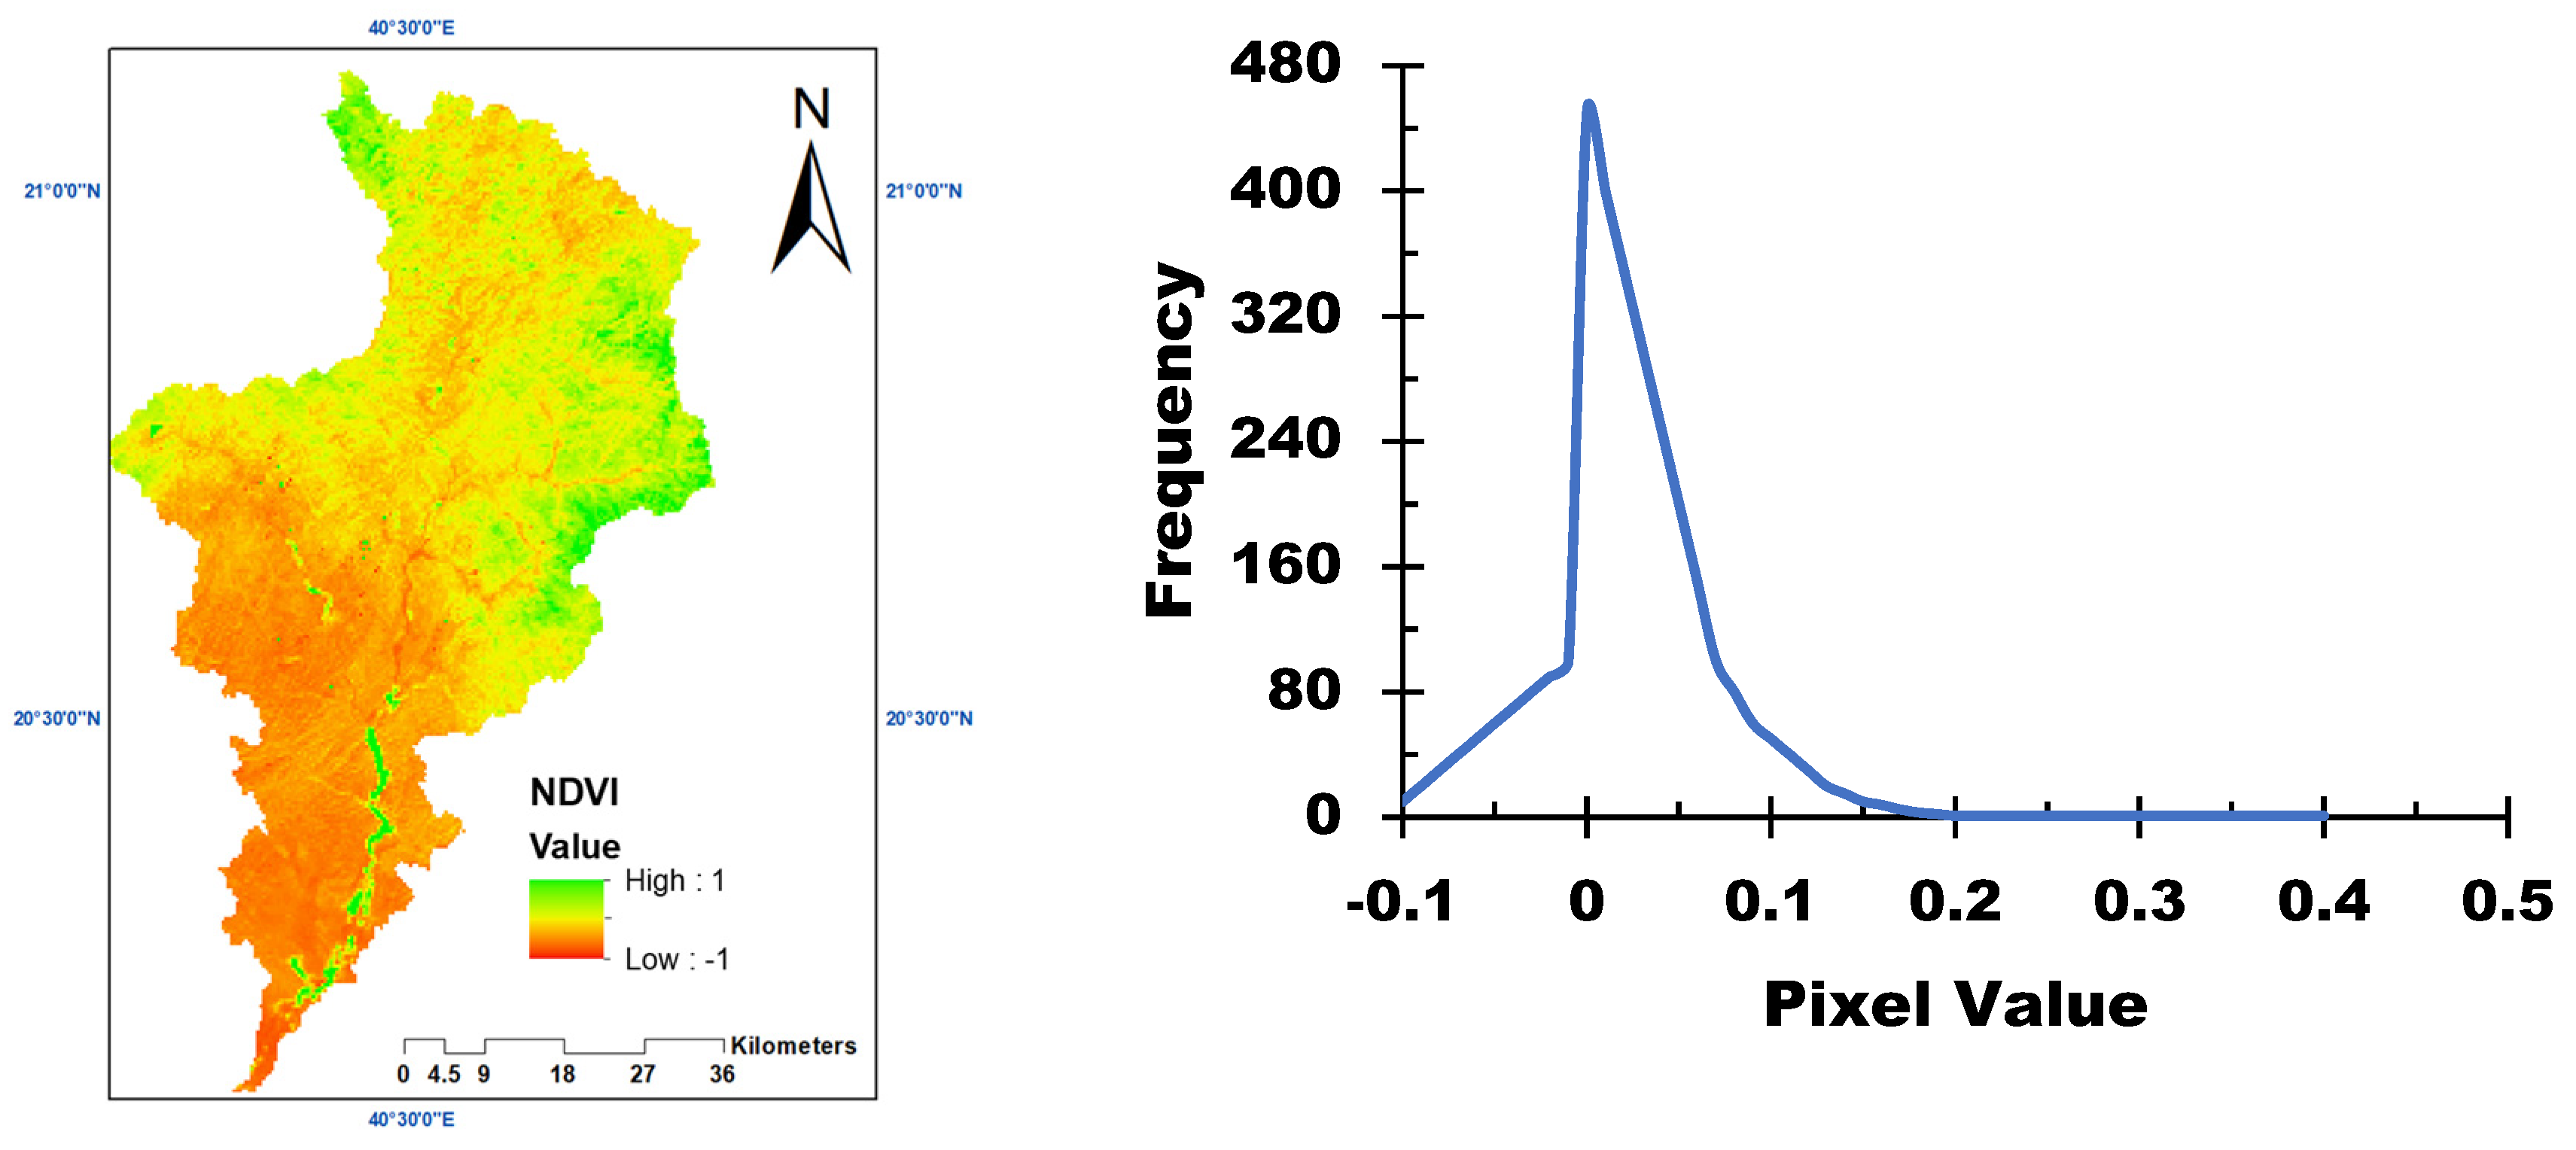
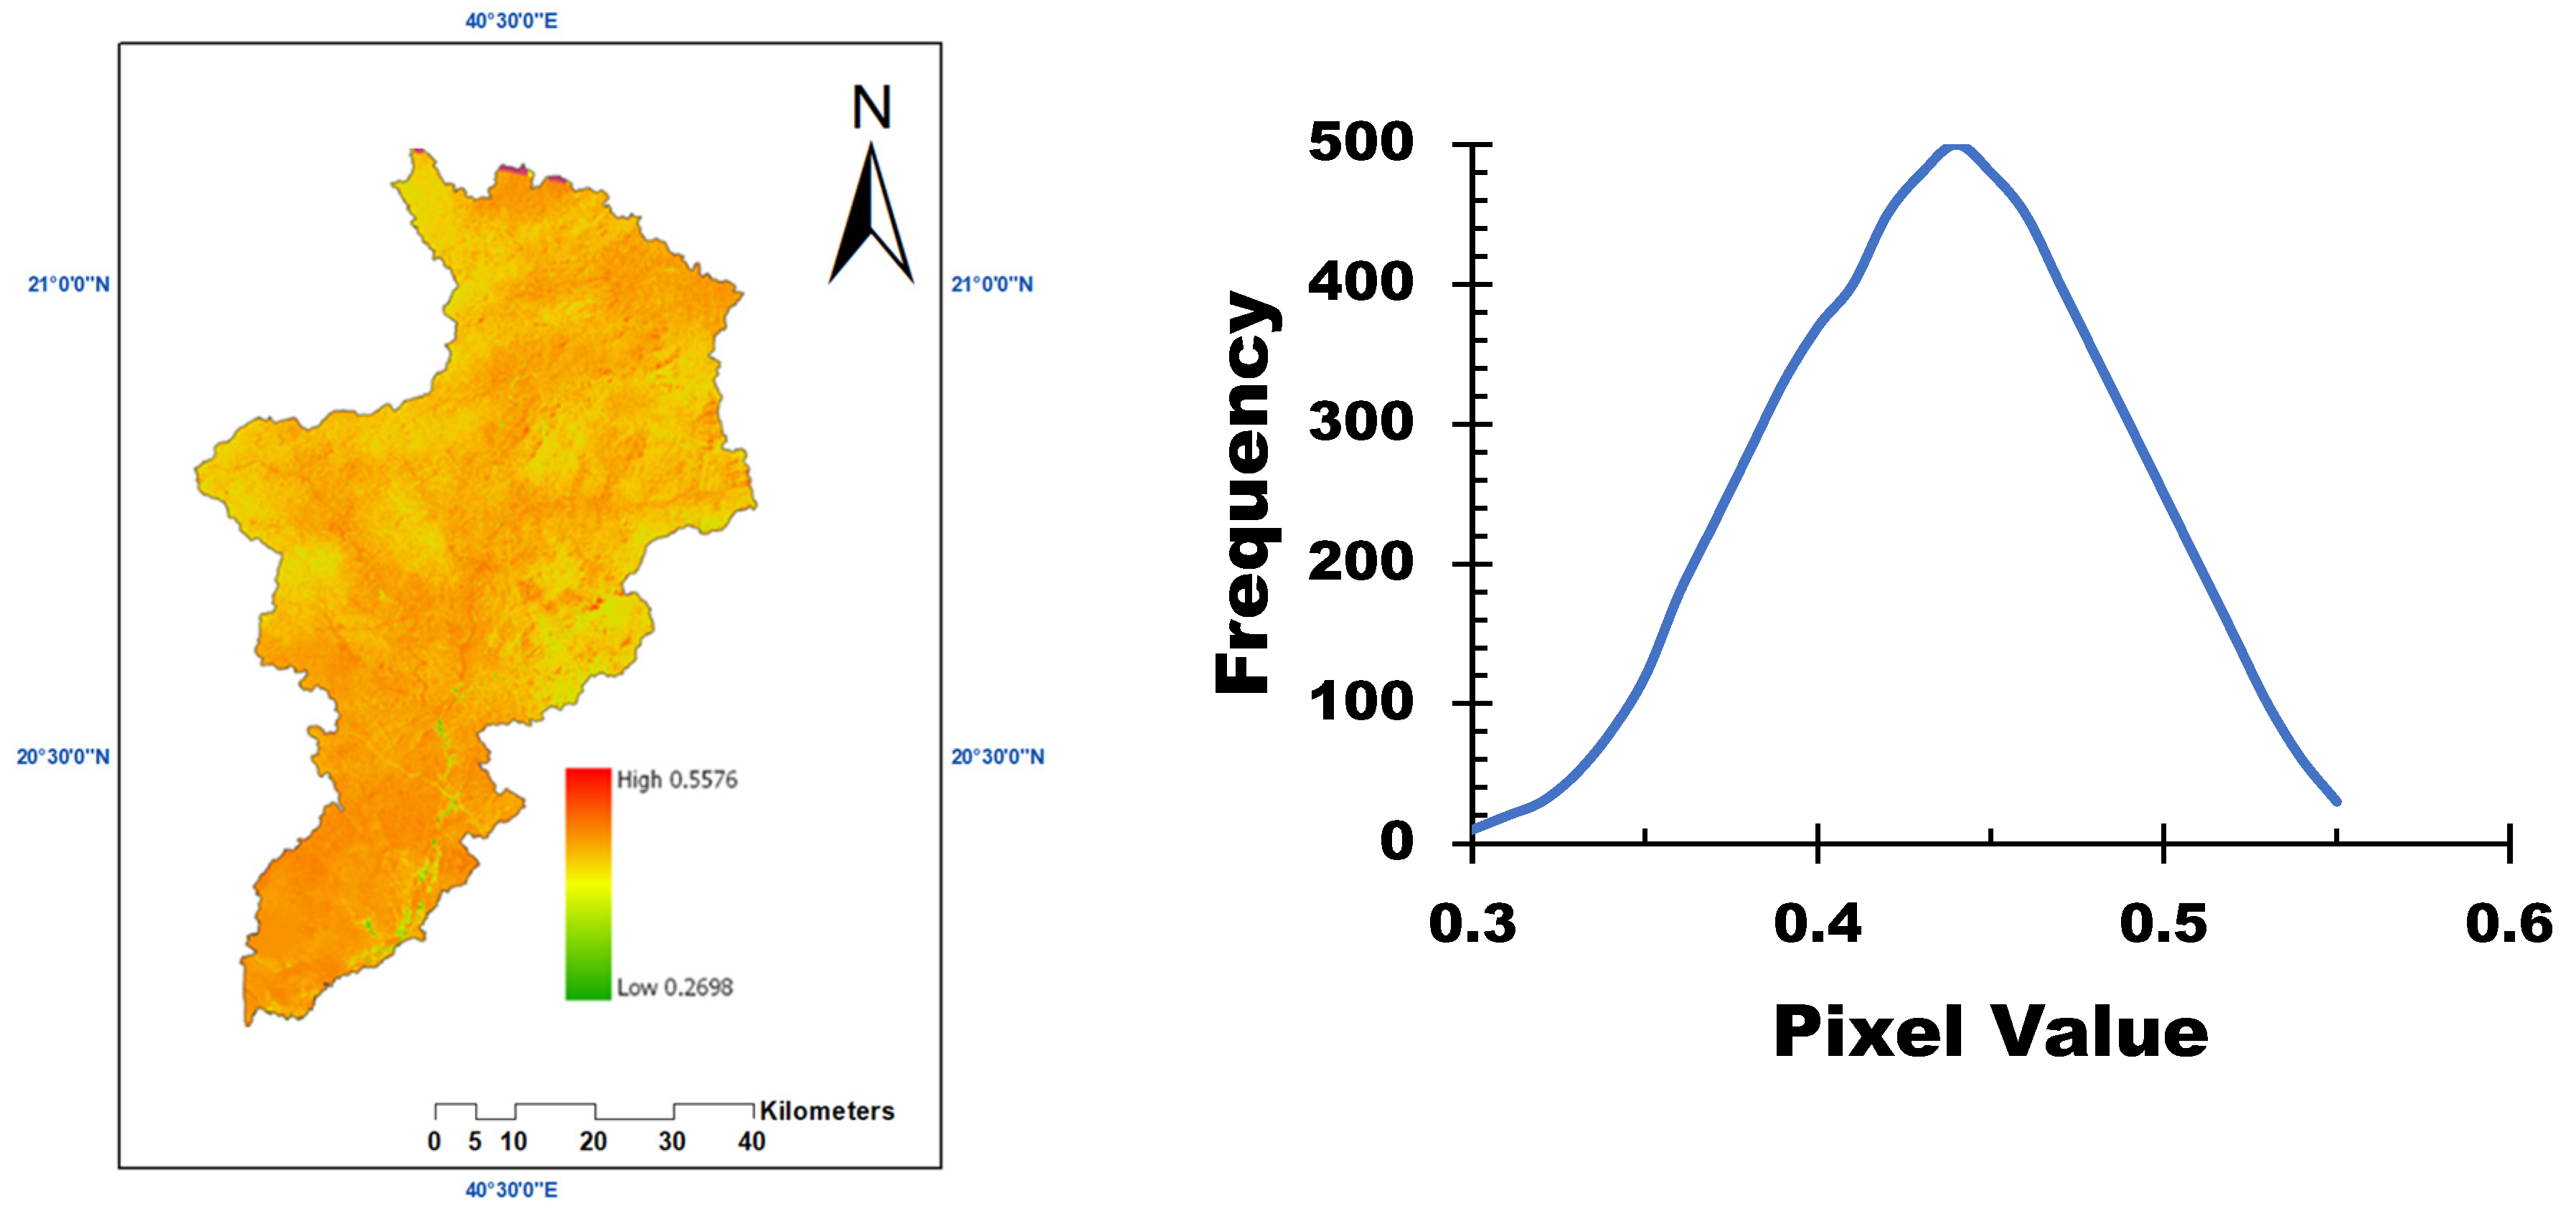
2.3.4. Crop Management Practices (C)
2.3.5. P-Factor (P)
3. Results
4. Discussion
5. Conclusions and Recommendations
Author Contributions
Funding
Data Availability Statement
Conflicts of Interest
References
- Bahrawi, J.A.; Elhag, M.; Aldhebiani, A.Y.; Galal, H.K.; Hegazy, A.K.; Alghailani, E. Soil erosion estimation using remote sensing techniques in Wadi Yalamlam Basin, Saudi Arabia. Adv. Mater. Sci. Eng. 2016, 2016, 9585962. [Google Scholar] [CrossRef]
- Ejaz, N.; Elhag, M.; Bahrawi, J.; Zhang, L.; Gabriel, H.F.; Rahman, K.U. Soil Erosion Modelling and Accumulation Using RUSLE and Remote Sensing Techniques: Case Study Wadi Baysh, Kingdom of Saudi Arabia. Sustainability 2023, 15, 3218. [Google Scholar] [CrossRef]
- Chaabani, A.; Adem, E.; Elfeki, A.; Farran, M.M.; Shults, R.; Elhag, M. Hydrogeological mapping of fracture networks using earth observation data to improve rainfall–runoff modeling in arid mountains, Saudi Arabia. Open Geosci. 2024, 16, 20220679. [Google Scholar] [CrossRef]
- Salvadore, E.; Bronders, J.; Batelaan, O. Hydrological modelling of urbanized catchments: A review and future directions. J. Hydrol. 2015, 529, 62–81. [Google Scholar] [CrossRef]
- Kumar, V.; Sharma, K.V.; Caloiero, T.; Mehta, D.J.; Singh, K. Comprehensive overview of flood modeling approaches: A review of recent advances. Hydrology 2023, 10, 141. [Google Scholar] [CrossRef]
- Wischmeier, W.H.; Smith, D.D. Predicting Rainfall-Erosion Losses from Cropland East of the Rocky Mountains: Guide for Selection of Practices for Soil and Water Conservation; Agricultural Research Service, US Department of Agriculture: Washington, DC, USA, 1965.
- Wischmeier, W.H.; Smith, D.D. Predicting Rainfall Erosion Losses: A Guide to Conservation Planning; Department of Agriculture, Science and Education Administration: Washington, DC, USA, 1978.
- Renard, K.G. Predicting Soil Erosion by Water: A Guide to Conservation Planning with the Revised Universal Soil Loss Equation (RUSLE); US Department of Agriculture, Agricultural Research Service: Washington, DC, USA, 1997.
- Panagos, P.; Borrelli, P.; Poesen, J.; Ballabio, C.; Lugato, E.; Meusburger, K.; Montanarella, L.; Alewell, C. The New Assessment of Soil Loss by Water Erosion in Europe. Environ. Sci. Policy 2015, 54, 438–447. [Google Scholar] [CrossRef]
- Williams, J.; Berndt, H. Sediment yield prediction based on watershed hydrology. Trans. ASAE 1977, 20, 1100–1104. [Google Scholar] [CrossRef]
- Dinka, M.O. Quantification of soil erosion and sediment yield for ungauged catchment using the RUSLE model: Case study for Lake Basaka catchment in Ethiopia. Lakes Reserv. Res. Manag. 2020, 25, 183–195. [Google Scholar] [CrossRef]
- Stocking, M.; Elwell, H. Soil erosion hazard in Rhodesia. Rhod. Agric. J. 1973, 70, 93–101. [Google Scholar]
- Sestras, P.; Mircea, S.; RoȘCA, S.; Bilașco, Ș.; Sălăgean, T.; Dragomir, L.O.; Herbei, M.V.; Bruma, S.; Sabou, C.; Marković, R. GIS based soil erosion assessment using the USLE model for efficient land management: A case study in an area with diverse pedo-geomorphological and bioclimatic characteristics. Not. Bot. Horti Agrobot. Cluj-Napoca 2023, 51, 13263. [Google Scholar] [CrossRef]
- Shahin, M.; Shahin, M. Erosion and sedimentation in drainage basins and in storage reservoirs. In Water Resources and Hydrometeorology of the Arab Region; Springer: Berlin/Heidelberg, Germany, 2007; pp. 333–367. [Google Scholar]
- Elhag, M.; Hidayatulloh, A.; Bahrawi, J.; Chaabani, A.; Budiman, J. Using inconsistencies of wadi morphometric parameters to understand patterns of soil erosion. Arab. J. Geosci. 2022, 15, 1299. [Google Scholar] [CrossRef]
- Bracken, L.J.; Turnbull, L.; Wainwright, J.; Bogaart, P. Sediment connectivity: A framework for understanding sediment transfer at multiple scales. Earth Surf. Process. Landf. 2015, 40, 177–188. [Google Scholar] [CrossRef]
- Banerjee, D.; Ganguly, S. A review on the research advances in groundwater–surface water interaction with an overview of the phenomenon. Water 2023, 15, 1552. [Google Scholar] [CrossRef]
- Balasubramanian, A. Soil Erosion–Causes and Effects. Centre for Advanced Studies in Earth Science; University of Mysore: Mysore, India, 2017. [Google Scholar]
- Valentin, C.; Poesen, J.; Li, Y. Gully erosion: Impacts, factors and control. Catena 2005, 63, 132–153. [Google Scholar] [CrossRef]
- Al-Ahmadi, F.; Hames, A. Comparison of four classification methods to extract land use and land cover from raw satellite images for some remote arid areas, Kingdom of Saudi Arabia. Earth sciences 2009, 20, 167–191. [Google Scholar] [CrossRef]
- Albishi, M.; Bahrawi, J.; Elfeki, A. Empirical equations for flood analysis in arid zones: The Ari-Zo model. Arab. J. Geosci. 2017, 10, 51. [Google Scholar] [CrossRef]
- Kebede, B.; Tsunekawa, A.; Haregeweyn, N.; Adgo, E.; Ebabu, K.; Meshesha, D.T.; Tsubo, M.; Masunaga, T.; Fenta, A.A. Determining C-and P-factors of RUSLE for different land uses and management practices across agro-ecologies: Case studies from the Upper Blue Nile basin, Ethiopia. Phys. Geogr. 2021, 42, 160–182. [Google Scholar] [CrossRef]
- Habib, M. Evaluation of DEM interpolation techniques for characterizing terrain roughness. Catena 2021, 198, 105072. [Google Scholar] [CrossRef]
- Fick, S.E.; Hijmans, R.J. WorldClim 2: New 1-km spatial resolution climate surfaces for global land areas. Int. J. Climatol. 2017, 37, 4302–4315. [Google Scholar] [CrossRef]
- Harris, I.; Jones, P.D.; Osborn, T.J.; Lister, D.H. Updated high-resolution grids of monthly climatic observations–the CRU TS3. 10 Dataset. Int. J. Climatol. 2014, 34, 623–642. [Google Scholar] [CrossRef]
- Lee, J.-H.; Heo, J.-H. Evaluation of estimation methods for rainfall erosivity based on annual precipitation in Korea. J. Hydrol. 2011, 409, 30–48. [Google Scholar] [CrossRef]
- Neitsch, S.; Arnold, J.; Kiniry, J.; Williams, J. Erosion Soil and Water Assessment Tool Theoretical Documentation; Texas Agricultural Eksperiment Station: College Station, TX, USA, 2000.
- Durigon, V.; Carvalho, D.; Antunes, M.; Oliveira, P.; Fernandes, M. NDVI time series for monitoring RUSLE cover management factor in a tropical watershed. Int. J. Remote Sens. 2014, 35, 441–453. [Google Scholar] [CrossRef]
- Tian, P.; Zhu, Z.; Yue, Q.; He, Y.; Zhang, Z.; Hao, F.; Guo, W.; Chen, L.; Liu, M. Soil erosion assessment by RUSLE with improved P factor and its validation: Case study on mountainous and hilly areas of Hubei Province, China. Int. Soil Water Conserv. Res. 2021, 9, 433–444. [Google Scholar] [CrossRef]
- Chen, T.; Niu, R.-q.; Li, P.-x.; Zhang, L.-p.; Du, B. Regional soil erosion risk mapping using RUSLE, GIS, and remote sensing: A case study in Miyun Watershed, North China. Environ. Earth Sci. 2011, 63, 533–541. [Google Scholar] [CrossRef]
- Mohamadi, M.A.; Kavian, A. Effects of rainfall patterns on runoff and soil erosion in field plots. Int. Soil Water Conserv. Res. 2015, 3, 273–281. [Google Scholar] [CrossRef]
- Bajabaa, S.; Masoud, M.; Al-Amri, N. Flash flood hazard mapping based on quantitative hydrology, geomorphology and GIS techniques (case study of Wadi Al Lith, Saudi Arabia). Arab. J. Geosci. 2014, 7, 2469–2481. [Google Scholar] [CrossRef]
- de Lima, J.L.; Singh, V.P.; de Lima, M.I.P. The influence of storm movement on water erosion: Storm direction and velocity effects. Catena 2003, 52, 39–56. [Google Scholar] [CrossRef]
- Huang, Y.; Chen, X.; Li, F.; Zhang, J.; Lei, T.; Li, J.; Chen, P.; Wang, X. Velocity of water flow along saturated loess slopes under erosion effects. J. Hydrol. 2018, 561, 304–311. [Google Scholar] [CrossRef]
- Hategekimana, Y.; Allam, M.; Meng, Q.; Nie, Y.; Elhag, M. Quantification of soil losses along the coastal protected areas in Kenya. Land 2020, 9, 137. [Google Scholar] [CrossRef]
- Adebayo, W.G. Resilience in the face of ecological challenges: Strategies for integrating environmental considerations into social policy planning in Africa. Sustain. Dev. 2025, 33, 203–220. [Google Scholar] [CrossRef]
- Elhag, M.; Kojchevska, T.; Boteva, S. EPM for soil loss estimation in different geomorphologic conditions and data conversion by using GIS. IOP Conf. Ser. Earth Environ. Sci. 2019, 221, 012079. [Google Scholar] [CrossRef]
- Alharthi, A.; El-Sheikh, M.A.; Elhag, M.; Alatar, A.A.; Abbadi, G.A.; Abdel-Salam, E.M.; Arif, I.A.; Baeshen, A.A.; Eid, E.M. Remote sensing of 10 years changes in the vegetation cover of the northwestern coastal land of Red Sea, Saudi Arabia. Saudi J. Biol. Sci. 2020, 27, 3169–3179. [Google Scholar] [CrossRef] [PubMed]
- Noamen, B.; Hamza, M.H.; Slama, T.; Sebei, A.; Ouerghi, S.; Elsheikh, R.; Rebai, N.; Hasanean, H.; Almazroui, M.; Elhag, M. Assessment of Machine Learning Techniques in Mapping Land Use/Land Cover Changes in a Semi-Arid Environment. Earth Syst. Environ. 2025, 1–21. [Google Scholar]


| Soil Characteristics | ms (Sand) % of Topsoil | msilt (Silt) % in Topsoil | mc (Clay) % in Topsoil | orgC Organic Carbon % of Topsoil | fcsand | fcl-si | forgc | fhisand | KUSLE | K |
|---|---|---|---|---|---|---|---|---|---|---|
| I | 58.9 | 16.2 | 24.9 | 0.97 | 0.200001 | 0.7563137 | 0.9271688 | 0.9942353 | 0.1394383 | 0.018364024 |
| Yh | 50.4 | 29 | 20.6 | 0.3 | 0.2000315 | 0.8512848 | 0.9956723 | 0.9989999 | 0.16937732 | 0.022306993 |
| Zg | 47.8 | 8.5 | 43.8 | 0.38 | 0.2000041 | 0.5797959 | 0.993131 | 0.9994194 | 0.11509817 | 0.015158429 |
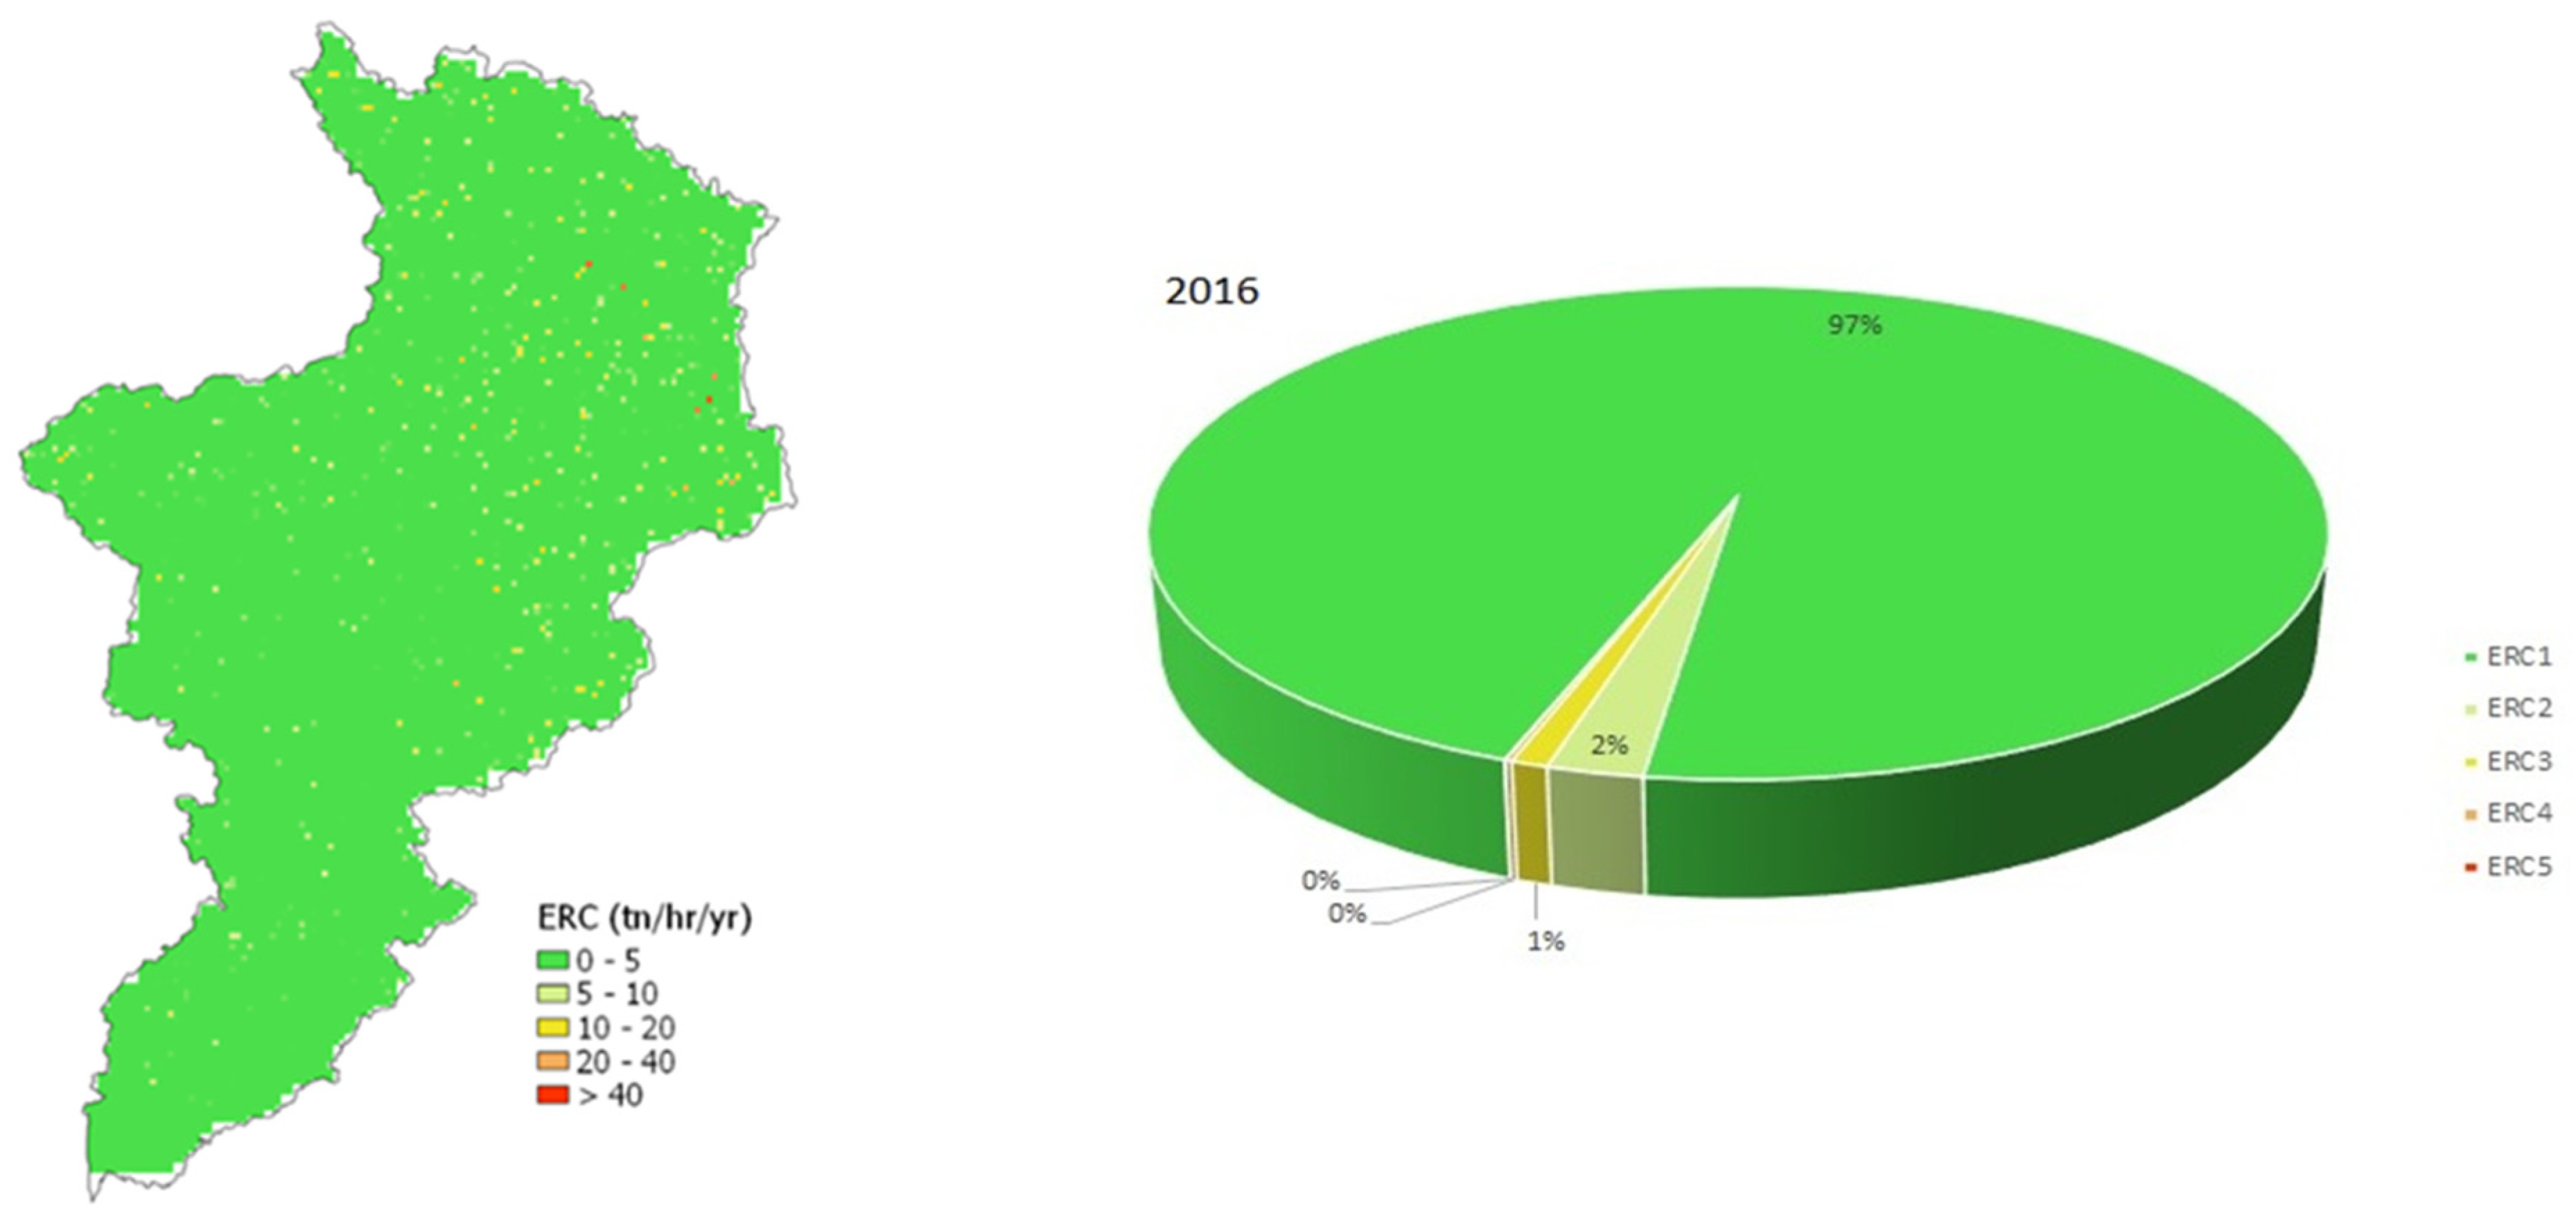
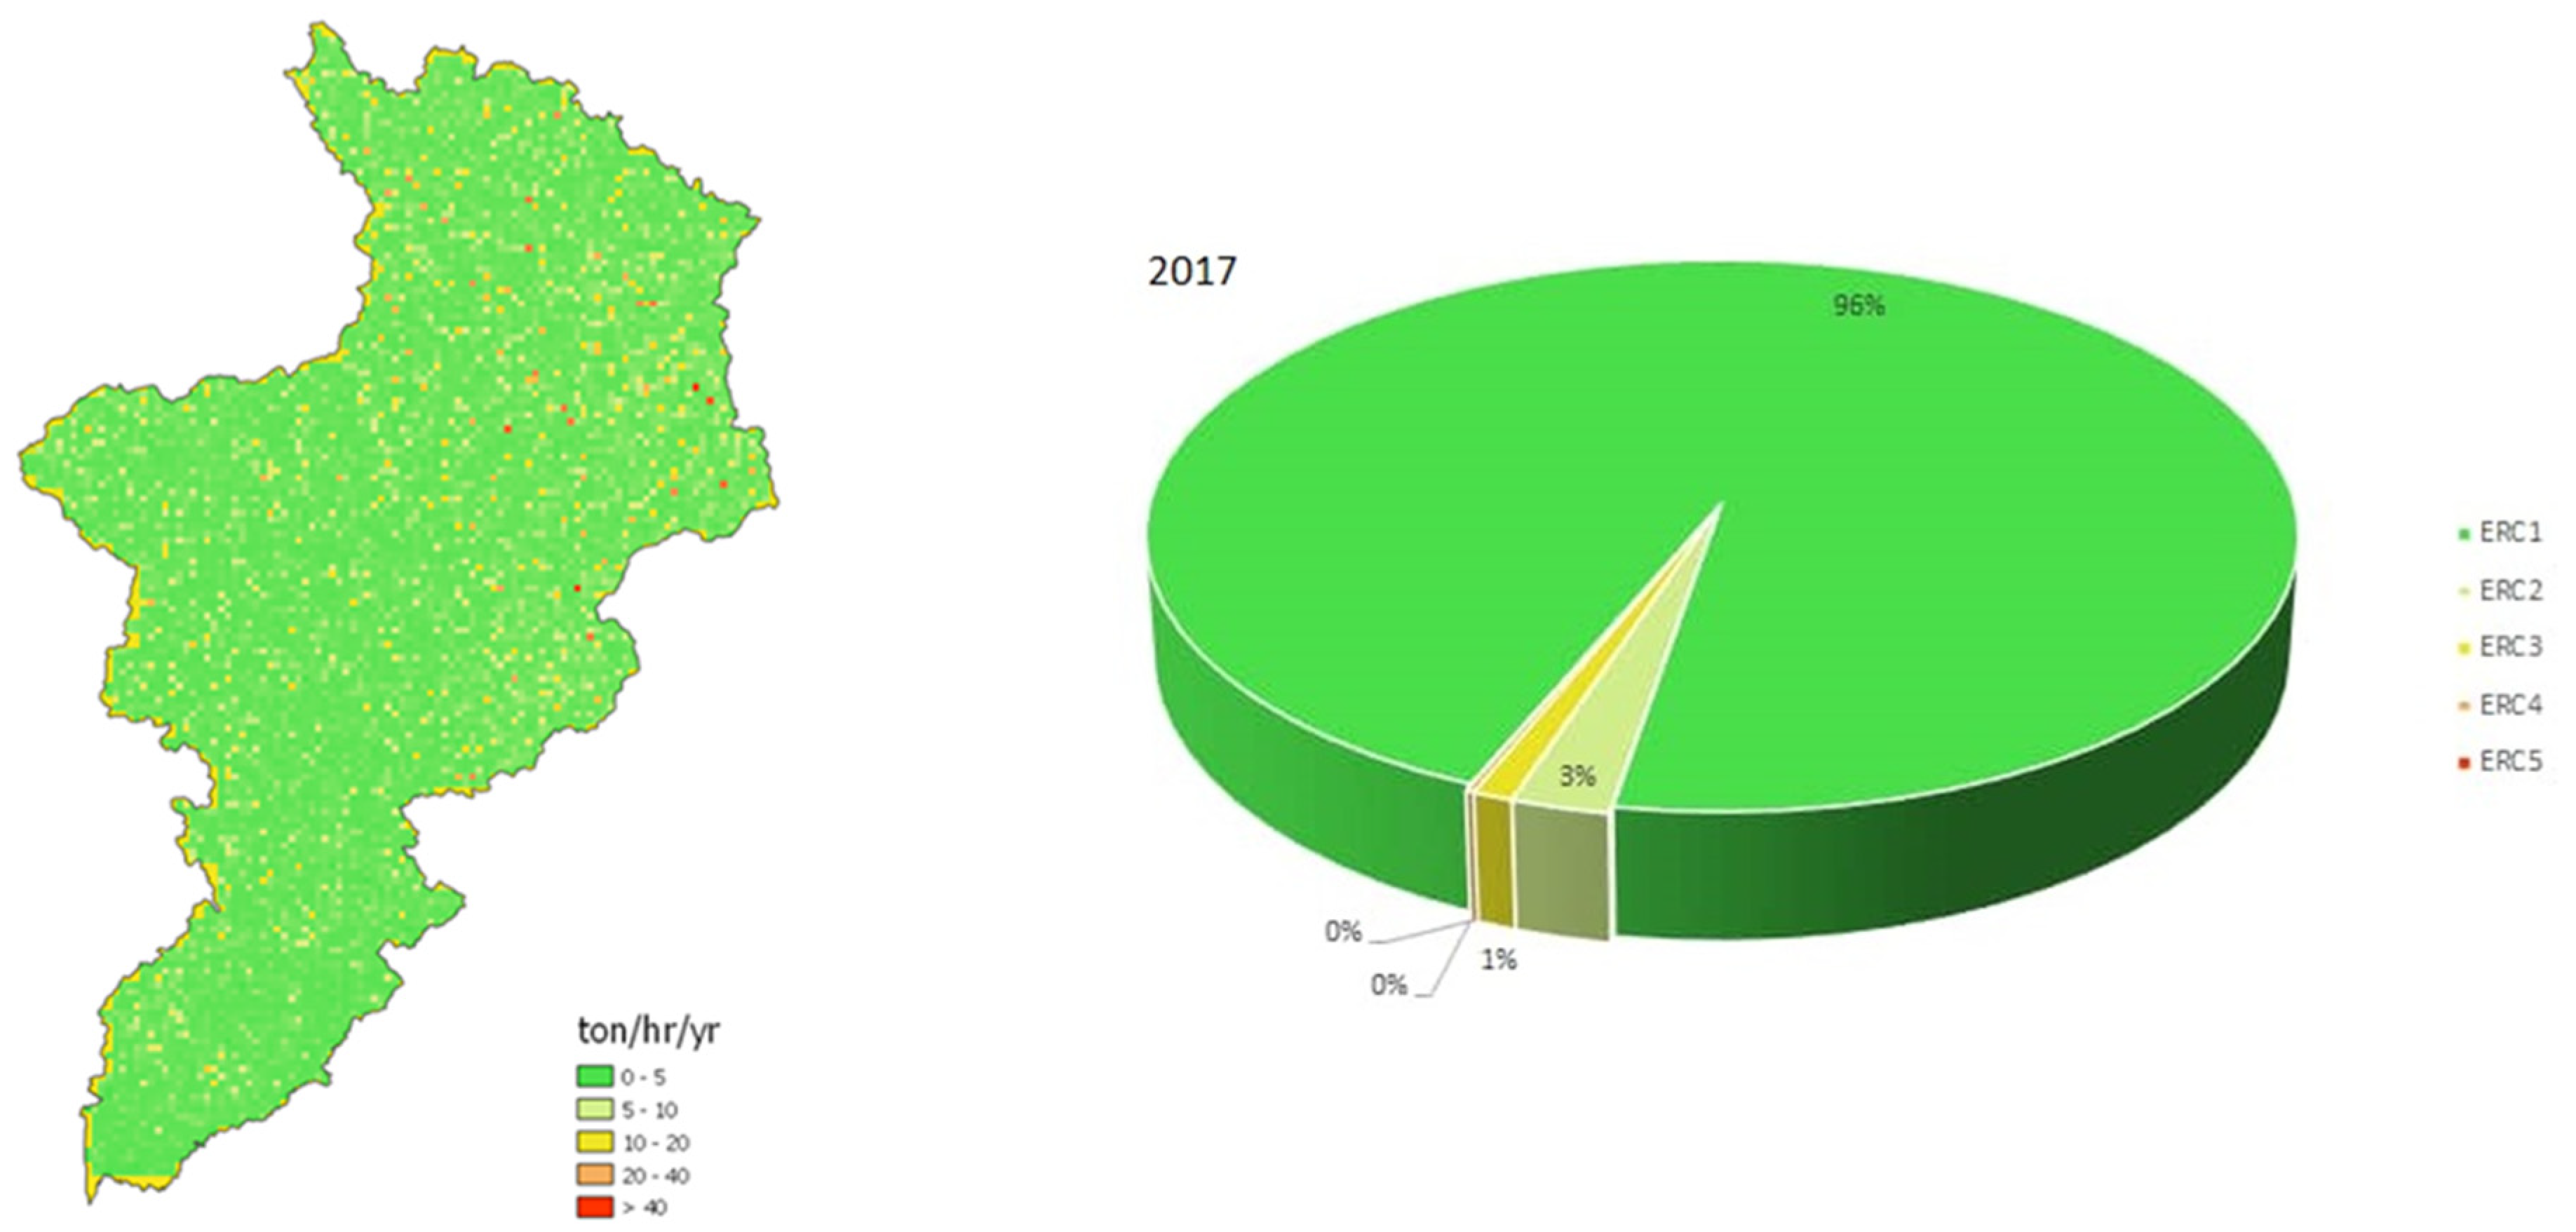
| Erosion Class | ERC 1 | ERC 2 | ERC 3 | ERC 4 | ERC 5 |
|---|---|---|---|---|---|
| Erosion (tons/hectare/year) | 0–5 | 5–10 | 10–20 | 20–40 | >40 |
| Classification | Very slight | Slight | Moderate | Severe | Very severe |
Disclaimer/Publisher’s Note: The statements, opinions and data contained in all publications are solely those of the individual author(s) and contributor(s) and not of MDPI and/or the editor(s). MDPI and/or the editor(s) disclaim responsibility for any injury to people or property resulting from any ideas, methods, instructions or products referred to in the content. |
© 2025 by the authors. Licensee MDPI, Basel, Switzerland. This article is an open access article distributed under the terms and conditions of the Creative Commons Attribution (CC BY) license (https://creativecommons.org/licenses/by/4.0/).
Share and Cite
Elhag, M.; Hamza, M.H.; Ouerghi, S.; Elsheikh, R.; Zhang, L.; Diani, K. From Data to Action: Rainfall Factor-Based Soil Erosion Assessment in Arid Regions Through Integrated Geospatial Modeling. Water 2025, 17, 1692. https://doi.org/10.3390/w17111692
Elhag M, Hamza MH, Ouerghi S, Elsheikh R, Zhang L, Diani K. From Data to Action: Rainfall Factor-Based Soil Erosion Assessment in Arid Regions Through Integrated Geospatial Modeling. Water. 2025; 17(11):1692. https://doi.org/10.3390/w17111692
Chicago/Turabian StyleElhag, Mohamed, Mohamed Hafedh Hamza, Sarra Ouerghi, Ranya Elsheikh, Lifu Zhang, and Khadija Diani. 2025. "From Data to Action: Rainfall Factor-Based Soil Erosion Assessment in Arid Regions Through Integrated Geospatial Modeling" Water 17, no. 11: 1692. https://doi.org/10.3390/w17111692
APA StyleElhag, M., Hamza, M. H., Ouerghi, S., Elsheikh, R., Zhang, L., & Diani, K. (2025). From Data to Action: Rainfall Factor-Based Soil Erosion Assessment in Arid Regions Through Integrated Geospatial Modeling. Water, 17(11), 1692. https://doi.org/10.3390/w17111692