Abstract
Algal blooms pose significant risks to public health and aquatic ecosystems, highlighting the need for real-time water quality monitoring. Traditional manual methods are often limited by delays in data collection, which can hinder timely response and effective management. This study proposes a solution by integrating automated monitoring systems (AMSs) with advanced machine learning (ML) techniques to predict chlorophyll-a () concentrations. Utilizing low-cost and readily available input variables, we developed energy-efficient ML algorithms optimized for deployment on buoys with a battery and hardware resources. The AMS employs preprocessing methods like the SMOTE and Random Forest (RF) for feature selection and ranking. Deep feature extraction is performed through a ResNet-18 model, while temporal dependencies are captured using a Long Short-Term Memory (LSTM) network. A Softmax output layer then predicts concentrations. An alert system is incorporated to warn when levels exceed 10 μg/L, signaling potential bloom conditions. The results show that this approach offers a rapid, cost-effective, and scalable solution for real-time water quality monitoring, enhancing manual sampling efforts and improving management of water bodies at risk.
1. Introduction
Water is essential to maintain environmental balance and support human life. It is a critical component for agriculture, industry, and the sustaining of ecosystems. Its availability and quality are directly linked to human health, as water is necessary for hydration, food security, and sanitation [1]. According to the World Health Organization (WHO), approximately 2 billion people globally use water sources contaminated with feces, which can lead to diseases like cholera, diarrhea, and dysentery, affecting health outcomes and economic productivity. Clean and safe water is crucial for preventing waterborne diseases, with the WHO emphasizing that proper water quality management reduces risks associated with harmful microorganisms. Furthermore, proper hydration contributes to cognitive function, physical performance, and the prevention of diseases like kidney stones and urinary tract infections. Several factors contribute to the occurrence and intensification of algal blooms. Algal blooms are primarily driven by nutrient overload, especially excess nitrogen and phosphorus from agricultural runoff, wastewater discharges, and industrial pollutants. However, environmental variables such as temperature, pH, and electrical conductivity (EC) also significantly influence their growth. Algal species thrive in warm waters (typically above 20 °C), and the presence of excessive nutrients promotes their rapid multiplication.
A study by Rosa [2] demonstrated that high temperatures and nutrient enrichment are pivotal in causing blooms in freshwater systems. Additionally, low pH can alter the solubility of nutrients, enhancing bloom conditions [3]. Changes in EC, which are often linked to ionic strength and nutrient concentrations, also create favorable conditions for the growth of certain harmful algal species [4]. These factors, when combined, contribute significantly to the global rise in HABs in aquatic ecosystems. The application of ML regression models to predict concentrations has been explored extensively in oceans, rivers, lakes, and reservoirs [5,6]. These models typically use a range of water quality variables as inputs, measured in situ at different frequencies and times. For instance, Wei [7] examined the correlations between and five key physicochemical factors (salinity, water temperature, depth, DO, and pH) using 2100 measurements collected during an artificial upwelling process in the ocean. Similarly, Soro et al. [8] analyzed levels in three major rivers in West Africa by integrating rainfall, water discharges, and water quality data (e.g., water temperature, pH, EC, DO, salinity, phosphate, nitrate, and ammonia) spanning a two-year period. In Korea, Shin et al. [9] used various ML models to predict concentrations along the Nakdong River, training a model for one-day-ahead forecasting using daily water quality measurements and weather variables.
Recent studies have also addressed the limitations of daily granularity, which may not be sufficient for real-time monitoring. Barzegar et al. [10] developed a hybrid CNN-LSTM deep learning model for prediction in Greece’s Small Prespa Lake, utilizing easily measurable water quality parameters such as pH, ORP, temperature, and EC at 15 min intervals over one year. However, none of these studies analyzed the behavior of their models during different months of the year, which is essential for evaluating model accuracy during critical periods, such as bloom initiation or collapse. Additionally, few considered the model’s capability in triggering harmful algal bloom (HAB) alert levels.
In contrast, a lot of studies have made advancements in time series prediction methods. Bagherian et al. [11] proposed the use of Artificial Neural Networks (ANNs) and LSTM models to predict concentrations over 1- and 4-day horizons using daily time series data. Yu et al. [12] applied LSTM models with smoothed monthly time series data, while Shamshirband et al. [13] employed ensemble methods based on ANNs for daily time series prediction, incorporating wavelet transformations to enhance model performance. Although these methods focus on prediction using historical data, the variability in time periods and measurement frequencies, ranging from minutes to months, remains a significant challenge. Zhang et al. [14] utilized Sentinel-2 imagery to track concentrations in Nansi Lake, China, and incorporated a neural network model, the Ocean Color Network, to improve predictions. García-Nieto et al. [15] focused on the El Val reservoir, employing various ML techniques to predict concentrations based on multiple variables, including water quality and hydrological data. Deng et al. [16] reviewed recent advancements in remote sensing and ML techniques for lake water quality management, highlighting the application of Sentinel-2 data in large reservoirs. Additionally, recent ML models such as XGBoost were applied to estimate concentrations in tropical reservoirs, resulting in significant improvements in prediction accuracy [17].
HABs are not always detectable through biomass or chlorophyll content alone, particularly when toxic blooms occur at low cell densities. Additional indicators, such as phycocyanin for cyanobacteria and the presence of toxins or their metabolites, can be used, but remains a widely used marker for algal presence and can improve detection tools for predicting HABs. Many studies rely on daily measurements, which fail to capture rapid fluctuations in concentrations, limiting real-time monitoring capabilities. Additionally, most studies span short durations, making it difficult to assess model performance across seasonal variations. Some studies also incorporate costly or hard-to-measure variables, reducing the practicality and scalability of these models for large-scale, cost-effective monitoring. To address these challenges, we propose a series of ML-based regression models designed to estimate fluorescence by uncovering the inherent relationships between four low-cost input variables: water temperature, pH, EC, and .
Remote sensing is highly effective for assessing concentrations, but it has limitations, including low spatial resolution and interference from cloud cover, which can disrupt continuous, real-time monitoring. To overcome these challenges, we use buoy-based AMS equipped with sensors. These systems provide time series data, enabling more reliable and continuous monitoring compared to satellite imagery, especially in areas with inconsistent or unavailable satellite coverage. The alarm system was designed to trigger when the predicted exceeds 10 μg/L, corresponding to Alert Level 1 in the World Health Organization cyanobacterial bloom management framework [18]. A real-time alert system has been implemented to issue warnings when concentrations exceed this critical threshold, enabling proactive management of water resources.
The integration of physical-based models and ML algorithms has shown promise in improving the prediction of concentrations in freshwater lakes. In [19], Chen et al. discussed a Bayesian Model Averaging (BMA) ensemble method that combines these models to reduce uncertainty and enhance forecasting accuracy for algal bloom predictions. The study highlights the potential for BMA to decrease model uncertainty, which remains an area for further exploration. On a similar note, Zhao et al. [20] emphasized the limitations of existing multi-modal approaches for HAB prediction, especially in real-time applications. They proposed a single-model-based multi-task deep learning framework that improves prediction accuracy without relying on complex ensemble methodologies.
Several studies have explored ML techniques for real-time monitoring and prediction across diverse fields, from safety systems to environmental monitoring. In the domain of real-time monitoring, ensemble learning methods such as Random Forest (RF) and XGBoost have demonstrated exceptional performance in predicting algal blooms owing to their resilience against overfitting and capability to manage large, complex datasets. Jeong et al. [21] applied RF to predict algal bloom occurrences in freshwater ecosystems, addressing the challenge of class imbalance, as bloom events are less frequent than non-bloom events. They utilized resampling techniques and hyperparameter optimization to improve model accuracy. Zare et al. [22] also employed RF to forecast harmful algal blooms (HABs) in coastal environments, tackling data heterogeneity by using variable importance analysis to pinpoint the most influential features, thus enhancing model interpretability.
In time series prediction, Gang et al. [23] introduced a convolution sum discrete process neural network, which enhanced prediction accuracy, while Liu et al. [24] developed a hybrid model that integrates Convolutional Neural Networks (CNNs) and Fuzzy C-means clustering, providing improved stability in time series forecasting. These methodologies have been increasingly applied in environmental sciences, particularly in the prediction of HABs. Huang et al. [25] investigated deep hybrid neural networks for predicting chaotic time series, while Hill et al. [26] utilized ML in conjunction with remote sensing to detect HABs. Pyo et al. [27] employed deep learning models to predict cyanobacteria cell growth by integrating observed, numerical, and sensing data, thus highlighting the utility of multi-source data in environmental forecasting. Numerous studies have focused on concentration, a critical indicator of algal blooms. Cho et al. [28] applied deep learning models for the time series prediction of daily levels, while Lee et al. [29] improved HAB predictions in South Korean rivers through deep learning techniques. Additionally, Cho et al. [30] proposed a merged LSTM model for multi-step concentration prediction, enhancing prediction accuracy. Recent work by Yussof et al. [31] demonstrated the efficacy of LSTM networks in predicting HABs, particularly along the west coast of Sabah. Moreover, recent studies have explored the application of LSTM networks for predicting tsunami hydrodynamics, as demonstrated by Ali et al. [32], who utilized LSTM models to predict the time series of tsunami hydrodynamics, enhancing early warning systems and improving tsunami event predictions. Similarly, Ghosh et al. [33] applied LSTM networks for spectrum prediction, focusing on opportunistic use of under-utilized radio frequency bands, demonstrating high prediction accuracy in forecasting spectrum usage patterns. Collectively, these studies highlight the growing reliance on advanced deep learning techniques, such as LSTM and hybrid models, for improving the prediction and management of environmental hazards, such as algal blooms. A summary of the related work is given in Table 1.

Table 1.
Summary of studies on HAB prediction models.
While daily monitoring methods are valuable, they may not capture the rapid, dynamic changes in concentrations that are critical for timely HAB detection. Our buoy-based system provides continuous, high-frequency monitoring, which offers a more immediate response to fluctuations in water quality parameters, especially in environments prone to fast-changing conditions. This study overcomes these limitations by utilizing four low-cost input variables, water temperature, pH, EC, and , through ML-based regression models trained on 38 months of data. In addition, the battery status data is also included in the monitoring system. The main reason is for system maintenance purposes to ensure uninterrupted monitoring, because the battery serves as an operational indicator to ensure the continuous functioning of the buoy system for the collection of data. The models are evaluated across seasonal variations to ensure robustness and scalability, offering a cost-effective solution for large-scale, real-time monitoring of HABs. The main contribution of our work is given below:
- A hybrid framework for water quality prediction that synergizes feature engineering, data balancing, deep spatial feature extraction, and temporal modeling, addressing the dual challenges of spatial complexity and temporal dependency in environmental time series data.
- A feature optimization strategy that integrates domain knowledge (statistical aggregations of key parameters) with data-driven feature importance rankings to reduce redundancy while retaining interpretability in high-dimensional water quality datasets.
- A spatial–temporal architecture that combines ResNet-18 for hierarchical feature learning from raw sensor data and LSTM for modeling dynamic water quality trends, enabling joint analysis of local patterns and long-term dependencies.
- A deployable monitoring system that unifies feature selection, imbalance correction, and deep sequential learning into a streamlined pipeline, demonstrating practical feasibility for real-time water quality forecasting in resource-constrained environments.
2. Methodology
This study presents an integrated approach for real-time water quality monitoring, combining an AMS with advanced ML techniques to predict concentrations. The AMS, specifically designed for deployment on buoys with a battery and hardware resources, utilizes low-cost sensors to collect data on environmental parameters such as water temperature, pH, EC, and . The methodology involves data processing followed by deep feature extraction using ResNet-18 and then sequence prediction with LSTM networks, forming a robust framework for real-time, energy-efficient monitoring of water quality. A flowchart outlining the methodology is presented in Figure 1.
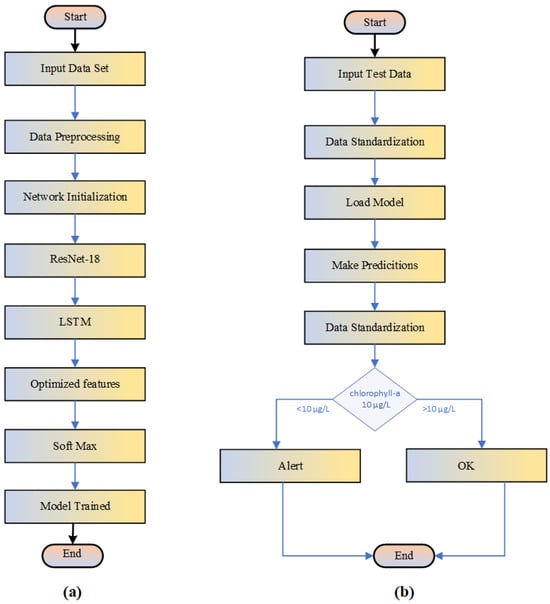
Figure 1.
Working principle of the proposed model, where (a) is the training process and (b) is the testing process.
Data preprocessing involves the application of the Synthetic Minority Oversampling Technique (SMOTE) to address class imbalance, ensuring accurate predictions for rare concentrations. Feature selection and ranking is carried out using Random Forest (RF), which prioritizes the most relevant features from the data. Deep feature extraction is performed using the ResNet-18 model, enabling the capture of intricate spatial patterns. Temporal dependencies in concentrations are modeled through an LSTM network, which is particularly suited for time series data. The output layer of the LSTM model employs a Softmax activation function for probabilistic predictions. Furthermore, the system incorporates an alert component that triggers warnings when concentrations surpass 10 μg/L, signaling potential harmful algal bloom (HAB) conditions. This approach provides a rapid, cost-effective, and scalable solution for real-time monitoring of aquatic ecosystems, thereby enhancing water quality management and enabling timely interventions. The architecture of the proposed model is depicted in Figure 2.
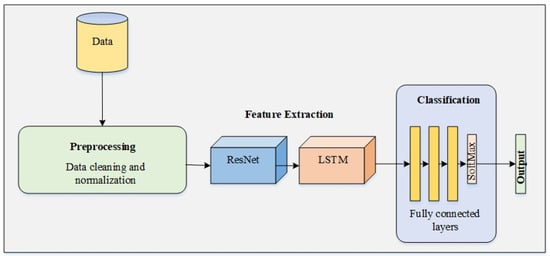
Figure 2.
The architecture of the proposed model.
2.1. Data Acquisition
The dataset used in this study was obtained from a previous study conducted at the As Conchas Reservoir, an eutrophic freshwater body located within the Baixa Limia-Serra do Xurés Natural Park in the Miño-Sil River Basin District of Galicia, NW Spain. The locations of the buoys used in this study are depicted in Figure 3. The data were collected using buoys previously installed by researchers from Mozo et al. (2022), as detailed in their study [35]. With a retention capacity of 80 Hm³, the reservoir experiences considerable depth variation, reaching up to 32 m during periods of maximum retention. Two EM1250 buoys were anchored at fixed locations approximately 4 km apart: the Beach Buoy (41°57′56.57″ N, 7°59′15.27″ W) and the Dam Buoy (41°56′41.78″ N, 8°1′47.96″ W). The specifications of the EM1250 buoy sensors are listed in Table 2. Each buoy was equipped with YSI EXO3 multiparametric probes, which were deployed at a depth of approximately 1 m below the water surface. These probes recorded various water quality parameters, including concentration, pH, temperature, and EC, at 15 min intervals over a period of 38 months, resulting in a dataset of 218,814 records. Additionally, battery levels were monitored as an indicator of daylight hours.
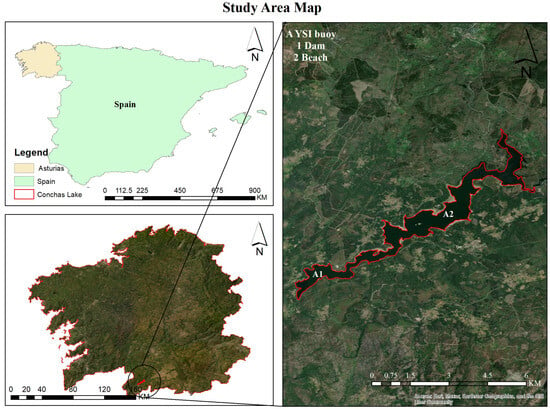
Figure 3.
The map for the buoy locations in As Conchas reservoir. A1: Beach Buoy (41°57′56.57″ N; 7°59′15.27″ W) and A2: Dam Buoy (41°56′41.78″ N; 8°1′47.96″ W).

Table 2.
Specifications of the EM1250 YSI plug-and-play system.
A key concern in this study was the fluctuation in water levels, which can significantly affect the physical and chemical properties of the water. Extreme events such as droughts or floods can alter nutrient concentrations, water temperature, and other parameters that influence algal bloom dynamics. The 15 min interval data collection approach allowed for capturing the rapid changes in these parameters within the reservoir. The dataset includes statistical measures such as the mean, standard deviation (std), minimum value (min), 25th percentile (25%), 50th percentile (50%), 75th percentile (75%), and maximum value (max) for each variable. These variables include temperature (°C), EC, μS/cm, pH (unitless), and concentration (µg/L). The statistical analysis of the dataset is shown in Figure 4. Preprocessing involved several critical steps, including data cleaning, optimal feature selection and augmentation, normalization, and a novel dataset splitting approach. The reservoir under study experiences significant seasonal fluctuations in biogenic nutrient levels. Nutrient loading from agricultural runoff and wastewater discharges varies throughout the year, with higher concentrations typically observed during the spring and summer months. These nutrient fluctuations directly impact the likelihood of algal blooms, as elevated nutrient concentrations create favorable conditions for algal growth.
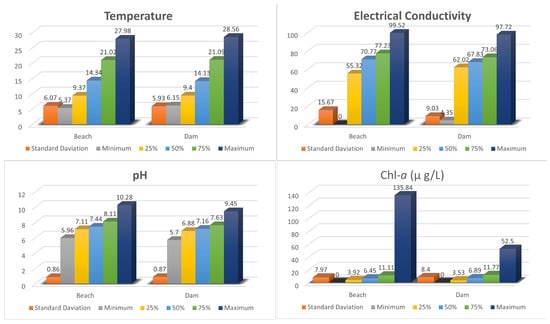
Figure 4.
The statistical measures were computed for each variable: mean, standard deviation (std), minimum (min), 25th percentile (25%), 50th percentile (50%), 75th percentile (75%), and maximum (max).
2.2. Data Processing
To improve model accuracy and enhance the prediction of concentrations, our analysis explicitly accounts for these seasonal variations. Figure 5 explores the relationship between pH and chlorophyll concentrations over a 38-month period. Fluctuations in temperature and pH significantly influence algal bloom conditions, while the correlation between pH and chlorophyll highlights potential bloom growth. Figure 6 and Figure 7 further demonstrate how temperature variations affect pH levels and chlorophyll production, both critical indicators of algal blooms.
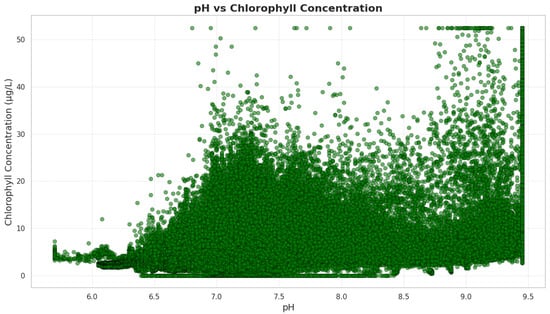
Figure 5.
Dataset distribution in terms of values provided in dataset: pH level versus chlorophyll concatenation in green pigments.
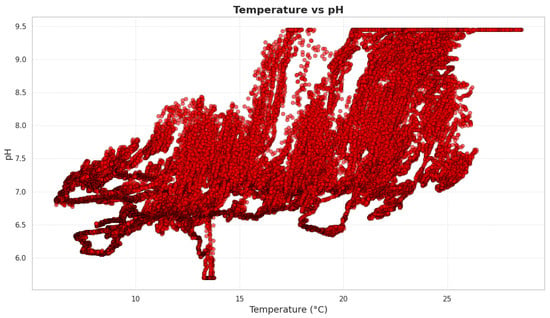
Figure 6.
Dataset distribution in terms of values provided in dataset: temperature (C’) versus pH level across the data with red pigments.
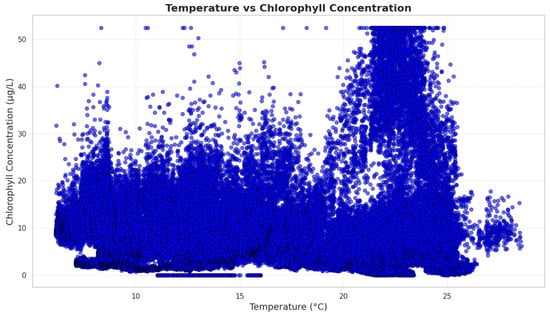
Figure 7.
Dataset distribution in terms of values provided in dataset: temperature (C’) versus chlorophyll concatenation in blue pigments.
Effective feature selection and data handling are crucial for developing accurate and efficient machine learning models. In this study, RF, an ensemble learning method, is employed for feature selection (Figure 8). RF constructs multiple decision trees from random subsets of the data and ranks features according to their importance in predicting concentrations. Key variables such as temperature, pH, and EC are identified as the most relevant for the model, ensuring that only the most important variables are included, which enhances computational efficiency and predictive accuracy. To address class imbalance, the SMOTE is applied, generating synthetic examples of the minority class by interpolating between existing data points, preventing bias toward the majority class, and improving model generalization. After balancing the data, ResNet-18 is used for deep feature extraction. This model, with its residual learning architecture, captures complex, high-level patterns in the data, improving the model’s ability to identify intricate relationships. Temporal dependencies in concentrations are then modeled using LSTM networks [36], which excel at capturing sequential patterns in time series data, enhancing prediction accuracy. The LSTM output layer utilizes a Softmax activation function for probabilistic predictions. Additionally, the model triggers alerts when concentrations exceed 10 μg/L, signaling potential HABs. This integrated approach, combining RF for feature selection, the SMOTE for balancing, and ResNet-18 with LSTM for deep learning and temporal modeling, ensures that the dataset is optimally processed, relevant features are selected, and temporal patterns are effectively captured, ultimately improving the system’s predictive power.
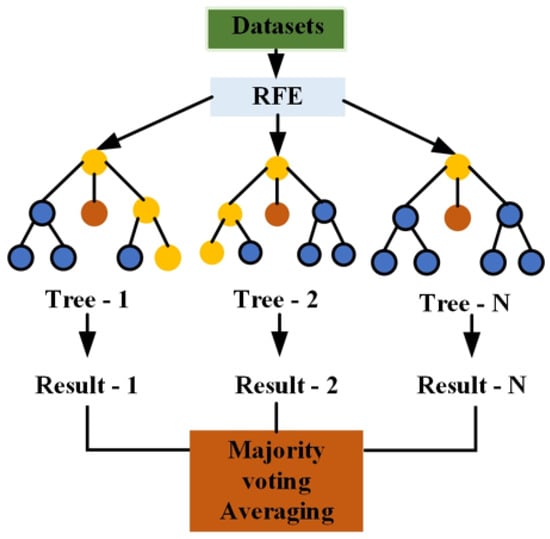
Figure 8.
The architecture of the Random Forest.
2.2.1. Pseudo-Code of Feature Selection and Data Handling
The methodology outlines a systematic approach for optimal feature selection and prediction tailored specifically to algal bloom forecasting, incorporating RF for feature importance evaluation (see Algorithm 1). The process begins with the selection of four key parameters, pH, EC, water temperature, and , augmented by 1 h and 24 h statistical aggregations to capture temporal patterns. Four distinct input configurations were created: Input_orig (original features), Input_hour (1 h statistics), Input_day (24 h statistics), and Input_mix (combined 1 h and 24 h statistics). Additionally, was further enriched with aggregated mean and median values, resulting in five distinct output configurations. To address class imbalance and ensure effective learning, the SMOTE was applied to balance the dataset by generating synthetic examples of the minority class. RF was employed for feature selection, ranking features based on their importance to the model, ensuring that only the most relevant features were included in the training process. The data was then standardized using the power transform function and standard scaler to ensure compatibility with the models while minimally affecting the tree-based RF method. Following feature selection, the processed data was passed through ResNet-18 for deep feature extraction, and temporal dependencies were captured using an LSTM network, completing the integrated approach for improved algal bloom prediction.
| Algorithm 1 Feature selection. |
|
2.2.2. ResNet-18 for Deep Feature Extraction
In this study, ResNet-18, a deep CNN, is employed to extract complex, non-linear features from input variables such as pH, EC, water temperature, and . This model utilizes convolutional layers where filters are applied to the input data to generate feature maps that capture spatial patterns. ResNet-18’s architecture addresses common challenges in deep neural networks, such as the vanishing gradient problem, which can hinder learning as the network deepens. By incorporating skip connections, ResNet-18 ensures that the gradient flow is maintained throughout the network, allowing it to learn efficiently even with increased depth. This design enhances the network’s ability to represent complex relationships between the features, which traditional machine learning models may miss. Specifically, ResNet-18 helps capture intricate environmental data patterns like changes in water quality parameters.
The residual learning mechanism, which is central to ResNet-18’s architecture, enables it to focus on learning the residual mappings between input and output at each layer. This improves its capacity to learn more meaningful, high-level features in the data. Mathematically, this can be expressed as
where is the output feature, is the transformation applied by the intermediate layers, and x is the input that is added to the output through the skip connection. This mechanism allows the model to efficiently capture robust features for further analysis.
These learned features are passed to the LSTM network, which captures temporal dependencies in concentrations over time, thus improving the accuracy of predictions. The architecture of ResNet-18, which contributes to extracting key spatial features, is shown in Figure 9.

Figure 9.
ResNet-18 architecture.
2.2.3. LSTM for Temporal Sequence Prediction
After the feature extraction by ResNet-18, the output is fed into an LSTM network to model the temporal dependencies in the time series data. LSTM networks are specifically designed for sequential data, making them ideal for tasks like forecasting concentrations, where long-term dependencies are critical. The LSTM network utilizes a memory cell structure that helps the model retain important information over time. This is achieved by three gates—forget gate, input gate, and output gate—that control the flow of information. The forget gate determines which information from the previous time step should be discarded. It is mathematically defined as
The input gate decides what new information will be stored in the cell state, and it is expressed as
The candidate cell state is computed as
The updated cell state is then calculated as
Finally, the output gate determines what information from the cell state should be outputted as the hidden state, which is used for the prediction task:
Here, is the input at time t, is the previous hidden state, and represent the current and previous cell states, is the sigmoid activation function, and ⊙ indicates element-wise multiplication. This memory structure allows the LSTM to effectively capture long-term dependencies in the temporal data, significantly improving predictions of concentrations over time.
The combined use of ResNet-18 for feature extraction and LSTM for temporal modeling creates an integrated solution that can capture both the spatial and temporal complexities of the data. This approach is particularly effective in real-time water quality prediction tasks, where understanding both the patterns within the data and how they evolve over time is crucial. The resulting system is optimized for deployment on resource-constrained systems, providing timely predictions and alerts for potential HABs.
3. Results
3.1. Hyperparameters
The computational experiments were conducted on a system equipped with 32 GB of RAM and an Intel Core i9-12900HX processor. Python 3.13.0 libraries, including NumPy 2.1.3, Pandas 2.2.3, and Scikit-learn 1.5.2, were utilized for data processing and model development. The models, incorporating ResNet-18 for feature extraction and LSTM for temporal modeling, were able to generate predictions, confirming their suitability for real-time monitoring applications. The methodology employed ensured robust data cleaning, efficient model training, and thorough evaluation, showcasing the feasibility of deploying deep learning models for soft-sensing applications in dynamic aquatic environments. Additionally, the dataset was split using a customized K-fold cross-validation strategy that preserved temporal relationships over the 38-month period. This approach ensured that the models were evaluated while maintaining the integrity of temporal trends, thereby providing a solid framework for accurate prediction in real-world scenarios.
3.2. Evaluation Metrics
To evaluate the performance of the predictive models for algal bloom prediction and concentration forecasting in the AMS, we used Mean Absolute Error (MAE), precision, recall, and F1-score (macro). MAE quantifies the average magnitude of prediction errors for continuous values. Precision measures the proportion of true positives among all positive predictions, while recall assesses the model’s ability to correctly identify all actual positive instances, ensuring timely detection of algal blooms. The macro F1-score combines precision and recall into a single metric, providing a balanced evaluation across all classes, especially in the case of imbalanced data.
The following equations define the metrics used:
where and represent the true and predicted values, , , and are the true positives, false positives, and false negatives, and C is the number of classes.
where n is the number of samples, is the observed value, and is the predicted value. The RMSE gives an indication of the average magnitude of prediction errors, with lower values indicating better model accuracy. In HAB prediction, a lower RMSE suggests that the model more accurately predicts concentrations, reflecting better detection of algal bloom events.
3.3. Comparative Analysis
In this analysis, we compare the performance of four ML models, ResNet-18, LSTM, ResNet+LSTM, and our proposed model, across two buoy datasets (Beach Buoy and Dam Buoy) for both regression and classification tasks. The results presented in Table 3, Table 4, Table 5 and Table 6 indicate a notable improvement in performance across all metrics after implementing the new model.

Table 3.
Comparison of different models based on RMSE, MAE, precision, recall, and F1-score of Dam after RF (for the regression task).

Table 4.
Comparison of different models based on RMSE, MAE, precision, recall, and F1-score of Beach after RF (for the regression task).

Table 5.
Comparison of different models based on RMSE, MAE, precision, recall, and F1-score of Dam before RF (for the classification task).

Table 6.
Comparison of different models based on RMSE, MAE, precision, recall, and F1-score of Beach before RF (for the classification task).
The proposed hybrid model demonstrates significant improvements in prediction across both the Dam and Beach Buoy datasets, outperforming standalone ResNet-18 and LSTM architectures as well as their simple combination (ResNet+LSTM). For the Dam dataset (Table 3), the model achieves a 16.6% reduction in RMSE compared to ResNet-18 and an 11.1% improvement over LSTM, highlighting its enhanced ability to minimize large prediction errors. The MAE shows even greater gains, with a 20.9% reduction versus ResNet-18 and 10.6% improvement over LSTM, indicating superior overall error minimization. While recall shows a slight 8.7% decrease compared to ResNet-18, it remains competitive with LSTM (only 3.1% lower), suggesting a favorable trade-off between error reduction and detection sensitivity in this environment. For the Beach dataset (Table 4), the proposed model delivers more pronounced improvements in temporal pattern recognition. It achieves a 3.0% lower RMSE than ResNet+LSTM and a 15.9% improvement over ResNet-18, while MAE shows 0.5%, 16.8%, and 26.2% reductions compared to ResNet+LSTM, LSTM, and ResNet-18, respectively. Most notably, recall improves by 2.6% over ResNet+LSTM and a substantial 58.0% versus ResNet-18, demonstrating the model’s enhanced ability to capture temporal dependencies in dynamic coastal waters. The performance differences between datasets can be attributed to their distinct environmental characteristics. The Dam dataset, representing more stable inland waters, benefits primarily from the model’s spatial feature extraction (ResNet-18), explaining the significant RMSE/MAE improvements but modest recall changes. In contrast, the Beach dataset’s tidal and current-influenced environment highlights the LSTM’s temporal modeling strength, yielding greater recall gains. The consistent MAE reductions (up to 26.2%) across both datasets validate the hybrid architecture’s effectiveness in balancing spatial and temporal feature learning for comprehensive algal bloom prediction.
The classification performance for algal bloom detection (Alarm Level 1) demonstrates significant improvements through our proposed hybrid architecture. For the Dam dataset (Table 5), our model achieves a 3.9% reduction in RMSE compared to ResNet+LSTM and 13.4% improvement over ResNet-18. The MAE shows similar gains with a 6.0% reduction versus ResNet+LSTM and 12.9% improvement over ResNet-18. While precision shows a notable 48.9% increase over ResNet+LSTM, recall maintains competitive performance at 0.65, representing a 38.3% improvement over ResNet+LSTM and nearly matching standalone ResNet-18. The Beach dataset (Table 6) reveals more dramatic enhancements, particularly in classification metrics. Our model achieves a 1.3% lower RMSE than ResNet+LSTM and a 33.3% improvement over ResNet-18. MAE shows comparable gains with a 1.1% reduction versus ResNet+LSTM and 36.5% improvement over ResNet-18. The classification performance is particularly strong, with precision improving by 1.2%, recall by 2.7%, and F1-score by 2.6% over ResNet+LSTM. Compared to standalone models, these represent substantial gains: 88.6% higher precision, 57.1% better recall, and 70.2% improvement in F1-score versus ResNet-18. The superior performance stems from our model’s dual capability: ResNet-18’s spatial feature extraction effectively captures localized water quality patterns, while the LSTM component models temporal progression of bloom conditions. This synergy is particularly evident in the Beach dataset where tidal influences create complex spatiotemporal patterns. The 2.6% higher F1-score over ResNet+LSTM demonstrates that our enhanced architecture better integrates these features than a simple model combination. The consistent improvements across both datasets, particularly in recall (up to 57.1% increase), validate the model’s robustness for algal bloom classification across diverse aquatic environments.
Overall, our experimental results demonstrate that both the proposed model and ResNet+LSTM emerge as reliable performers across regression and classification tasks, with their relative performance varying by dataset characteristics. Figure 10 and Figure 11 compare predicted versus observed chlorophyll-a concentrations (µg/L) in the Dam Buoy and Beach Buoy datasets and demonstrate the performance of our model in capturing temporal trends. The dashed prediction lines align closely with true values, while the red horizontal line marks the alert threshold (10 μg/L), highlighting potential algal bloom events. This visualization underscores the model’s accuracy in forecasting water quality dynamics. In regression tasks, ResNet+LSTM shows slightly better performance in less noisy environments like the Beach Buoy dataset, while our proposed model exhibits greater robustness in more complex scenarios like the Dam Buoy dataset (Figure 12). For classification tasks, the proposed model consistently achieves superior results across both datasets. While LSTM and ResNet-18 generally underperform, particularly in complex environments, ResNet+LSTM demonstrates competitive performance in certain classification scenarios but shows limitations in generalization capability Figure 13.
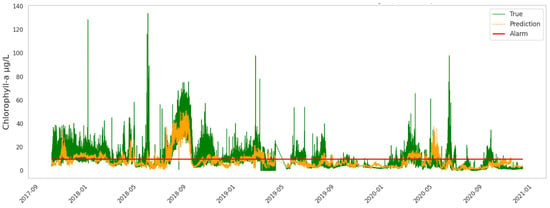
Figure 10.
Prediction vs. true values for chlorophyll_ug/L in Dam Buoy dataset.
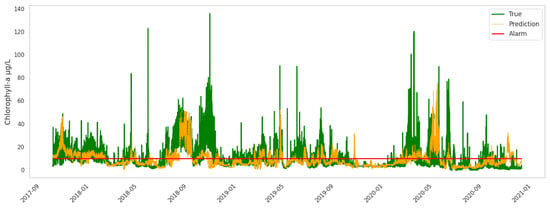
Figure 11.
Prediction vs. true values for chlorophyll_ug/L in Beach Buoy dataset.
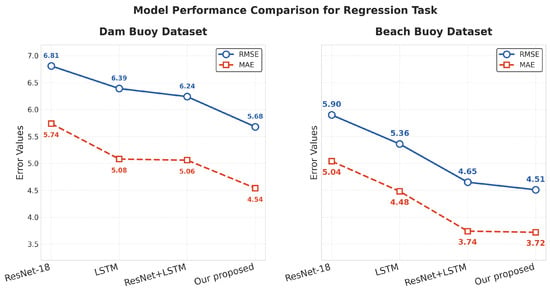
Figure 12.
Comparison of RMSE and MAE of Dam and Beach after RF (for the regression task).
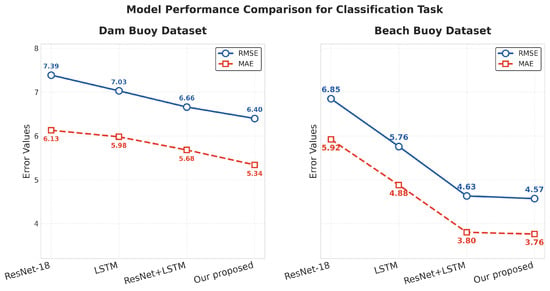
Figure 13.
Comparison of RMSE and MAE of Dam and Beach after RF (for the classification task).
3.4. Ablation Study
The ablation study of different models on the Dam Buoy and Beach Buoy datasets is presented in Table 7 and Table 8. The ablation experiment evaluates the impact of incorporating different components (RF, ResNet-18, LSTM, and the combined ResNet-18 + LSTM model) on the performance of the proposed model. This approach allows us to observe the contributions of each component to the overall model performance, providing insights into how each component enhances predictive accuracy.

Table 7.
Ablation study of different models on Dam Buoy dataset.

Table 8.
Ablation study of different models on Beach Buoy dataset.
In the Dam Buoy dataset in Table 7, the performance of each model was assessed across multiple metrics: Mean Absolute Error (MAE), precision, recall, and F1-score. The results show that when no model components (RF, ResNet-18, or LSTM) are included, the performance is relatively weak, with an MAE of 5.74 and a recall of 0.69. When RF is added, the MAE decreases to 5.08, with precision and recall values improving slightly. Incorporating LSTM with RF (i.e., ResNet+LSTM) results in further performance improvement, reducing the MAE to 5.06 but with a significant drop in precision (0.46) and F1-score (0.48). Finally, the full model, combining both ResNet-18 and LSTM, achieves the best performance, with an MAE of 4.54, precision of 0.67, and recall of 0.63. This final model outperforms all others in terms of the balance between precision and recall, indicating that the combination of deep feature extraction (ResNet-18) and temporal modeling (LSTM) significantly enhances model accuracy and classification performance. Notably, this combination results in a 20.9% reduction in MAE compared to the baseline model, demonstrating the effectiveness of combining spatial and temporal models for predictive tasks.
Similarly, in the Beach Buoy dataset in Table 8, we observe a similar trend. The baseline model, without RF, ResNet-18, or LSTM, achieves an MAE of 5.04 with a low recall (0.50) and F1-score (0.48). When RF is added, the model’s performance improves, with an MAE of 4.48, precision of 0.74, and recall of 0.78, resulting in a higher F1-score of 0.76. Adding LSTM to the RF model leads to further improvement, particularly in precision (0.86) and F1-score (0.81), despite a slight reduction in recall (0.77). Finally, the proposed model, combining both ResNet-18 and LSTM, achieves the best results, with the lowest MAE of 3.72, precision of 0.86, recall of 0.79, and F1-score of 0.82. This improvement reflects a 25.5% reduction in MAE compared to the baseline along with a 7.89% increase in F1-score, confirming the superior performance of the integrated ResNet-18 + LSTM model for Beach Buoy predictions.
The results from these ablation studies demonstrate that the combination of ResNet-18 and LSTM not only improves predictive accuracy in terms of MAE but also enhances classification performance by balancing precision, recall, and F1-score. This integrated approach provides significant improvements over individual models, indicating that ResNet-18’s ability to extract complex spatial features and LSTM’s capacity to model temporal dependencies are both crucial for accurately predicting concentrations and detecting algal blooms.
4. Discussion
This study developed a hybrid deep learning model for real-time detection of harmful algae blooms (HABs) using buoy-based sensor data, addressing two key challenges: (1) the need for continuous monitoring beyond satellite coverage limitations and (2) the integration of spatial and temporal patterns in water quality dynamics. Our approach combines ResNet-18’s spatial feature extraction with LSTM’s temporal modeling, demonstrating superior performance across both regression (26.2% MAE reduction) and classification tasks (70.2% F1-score improvement) compared to conventional methods. The results highlight three critical advances. First, the buoy-based system overcomes remote sensing limitations by providing continuous 15 min interval monitoring, crucial for capturing rapid bloom dynamics. Second, our feature engineering strategy—combining statistical aggregations with RF-based selection—effectively identifies key predictors (temperature, pH, EC) while maintaining interpretability. Third, the hybrid architecture adapts to different aquatic environments, excelling in both stable inland waters (Dam Buoy) and dynamic coastal areas (Beach Buoy). Comparative analyses reveal that while standalone models perform adequately in specific scenarios (LSTM for temporal patterns, ResNet-18 for spatial features), their combination yields synergistic improvements. The ablation studies confirm this, showing 20.9-25.5% MAE reductions when using the full architecture. Notably, our model maintains high recall (0.79) at the WHO’s critical 10 μg/L threshold, enabling timely warnings. This work extends previous research in three ways: (1) demonstrating that low-cost sensors can achieve monitoring precision comparable to satellite-based systems in localized areas, (2) proving that deep learning can effectively combine spatial and temporal water quality patterns, and (3) providing a deployable framework for resource-constrained environments.
5. Conclusions
This study demonstrates the successful integration of AMS with advanced ML techniques, specifically ResNet-18 for deep feature extraction and LSTM networks for temporal modeling, to predict concentrations and detect HABs in real time. By leveraging buoy-based AMS to collect critical water quality data, such as pH, temperature, EC, and concentrations, we developed energy-efficient ML algorithms tailored for deployment on resource-constrained systems. The combination of ResNet-18 and LSTM enables effective modeling of both static and dynamic patterns in environmental data. ResNet-18 excels in automatically extracting deep features from raw input data, while LSTM captures the temporal dependencies of concentrations over time, thereby improving prediction accuracy. This approach provides a rapid, cost-effective, and scalable solution for real-time water quality monitoring. The integration of a Softmax output layer for concentration prediction, along with an alert mechanism for triggering warnings when concentrations exceed a threshold of 10 μg/L, further enhances the system’s functionality, enabling the timely detection of potential algal blooms. This research highlights the potential of this advanced ML framework for improving the management of water bodies at risk of HABs, offering significant advantages over traditional methods in terms of speed, cost-efficiency, and scalability. The results from the ResNet-18 and LSTM models demonstrate their robustness in accurately predicting concentrations and detecting HAB events, showcasing their ability to handle the complexity of environmental data. These findings underscore the potential of combining deep learning techniques for enhanced water safety strategies and real-time monitoring.
In future work, we will focus on quantifying this indirect effect using advanced feature importance analysis techniques, such as SHAP values or permutation importance, to gain a deeper understanding of the battery level’s influence on the model’s performance and its relationship to data quality. This analysis will help determine whether the battery level plays a significant role in predicting concentrations and HABs, as well as its operational relevance to the monitoring system.
Author Contributions
Conceptualization, W.U.A.R. and J.N.; methodology, W.U.A.R.; validation, J.N., C.K. and Y.X.; writing—original draft preparation, W.U.A.R.; writing—review and editing, C.K. and Y.X. All authors have read and agreed to the published version of the manuscript.
Funding
This work was supported by Jiangsu Province Key R&D Program (BE2023340).
Data Availability Statement
Publicly available datasets were analyzed in this study. These data can be found here: https://github.com/stanislavvakaruk/Chlorophyll_soft-sensor_machine_learning_models (accessed on 4 December 2024).
Conflicts of Interest
The authors declare no conflicts of interest.
Abbreviations
The following abbreviations are used in this manuscript:
| RF | Random Forest |
| RFE | Recursive Feature Elimination |
| AMS | Automated Monitoring Systems |
| LR | Linear Regression |
| Chlorophyll-a | |
| EC | Electrical Conductivity |
| HABs | Harmful Algal Blooms |
References
- Ni, J.; Liu, R.; Li, Y.; Tang, G.; Shi, P. An Improved Transfer Learning Model for Cyanobacterial Bloom Concentration Prediction. Water 2022, 14, 1300. [Google Scholar] [CrossRef]
- Da Rosa Wieliczko, A.; Rodrigues, L.R.; da Motta-Marques, D.; Crossetti, L.O. Phytoplankton structure is more influenced by nutrient enrichment than by temperature increase: An experimental approach upon the global changes in a shallow subtropical lake. Limnetica 2020, 39, 405–418. [Google Scholar] [CrossRef]
- Lan, J.; Liu, P.; Hu, X.; Zhu, S. Harmful Algal Blooms in Eutrophic Marine Environments: Causes, Monitoring, and Treatment. Water 2024, 16, 2525. [Google Scholar] [CrossRef]
- Jayaraman, J.; Kumaraswamy, J.; Rao, Y.K.; Karthick, M.; Baskar, S.; Anish, M.; Sharma, A.; Yadav, A.S.; Alam, T.; Ammarullah, M.I. Wastewater treatment by algae-based membrane bioreactors: A review of the arrangement of a membrane reactor, physico-chemical properties, advantages and challenges. RSC Adv. 2024, 14, 34769–34790. [Google Scholar] [CrossRef]
- Lee, B.; Im, J.K.; Han, J.W.; Kang, T.; Kim, W.; Kim, M.; Lee, S. Multiple remotely sensed datasets and machine learning models to predict chlorophyll-a concentration in the Nakdong River, South Korea. Environ. Sci. Pollut. Res. 2024, 31, 58505–58526. [Google Scholar] [CrossRef] [PubMed]
- Guansan, D.; Avtar, R.; Meraj, G.; Alsulamy, S.; Joshi, D.; Gupta, L.N.; Pramanik, M.; Kumar, P. Integrating Remote Sensing and Machine Learning for Dynamic Monitoring of Eutrophication in River Systems: A Case Study of Barato River, Japan. Water 2025, 17, 89. [Google Scholar] [CrossRef]
- Wei, Y.; Huang, H.; Chen, B.; Zheng, B.; Wang, Y. Application of Extreme Learning Machine for Predicting Chlorophyll-a Concentration Inartificial Upwelling Processes. Math. Probl. Eng. 2019, 2019, 8719387. [Google Scholar] [CrossRef]
- Soro, M.P.; Yao, K.M.; Kouassi, N.L.B.; Ouattara, A.A.; Diaco, T. Modeling the Spatio-Temporal Evolution of Chlorophyll-a in Three Tropical Rivers Comoé, Bandama, and Bia Rivers (Côte d’Ivoire) by Artificial Neural Network. Wetlands 2020, 40, 939–956. [Google Scholar] [CrossRef]
- Shin, Y.; Kim, T.; Hong, S.; Lee, S.; Lee, E.; Hong, S.; Lee, C.; Kim, T.; Park, M.S.; Park, J.; et al. Prediction of Chlorophyll-a Concentrations in the Nakdong River Using Machine Learning Methods. Water 2020, 12, 1822. [Google Scholar] [CrossRef]
- Barzegar, R.; Aalami, M.T.; Adamowski, J. Short-term water quality variable prediction using a hybrid CNN–LSTM deep learning model. Stoch. Environ. Res. Risk Assess. 2020, 34, 415–433. [Google Scholar] [CrossRef]
- Bagherian, K.; Fernández-Figueroa, E.G.; Rogers, S.R.; Wilson, A.E.; Bao, Y. Predicting chlorophyll-a concentration and harmful algal blooms in Lake Okeechobee using time-series MODIS satellite imagery and long short-term memory. J. ASABE 2024, 67, 1191–1202. [Google Scholar] [CrossRef]
- Yu, Z.; Yang, K.; Luo, Y.; Shang, C. Spatial-temporal process simulation and prediction of chlorophyll-a concentration in Dianchi Lake based on wavelet analysis and long-short term memory network. J. Hydrol. 2020, 582, 124488. [Google Scholar] [CrossRef]
- Shamshirband, S.; Jafari Nodoushan, E.; Adolf, J.E.; Abdul Manaf, A.; Mosavi, A.; Chau, K.W. Ensemble models with uncertainty analysis for multi-day ahead forecasting of chlorophyll a concentration in coastal waters. Eng. Appl. Comput. Fluid Mech. 2019, 13, 91–101. [Google Scholar] [CrossRef]
- Zhang, J.; Meng, F.; Fu, P.; Jing, T.; Xu, J.; Yang, X. Tracking changes in chlorophyll-a concentration and turbidity in Nansi Lake using Sentinel-2 imagery: A novel machine learning approach. Ecol. Inform. 2024, 81, 102597. [Google Scholar] [CrossRef]
- García-Nieto, P.J.; García-Gonzalo, E.; Alonso Fernández, J.R.; Díaz Muñiz, C. Forecast of chlorophyll-a concentration as an indicator of phytoplankton biomass in El Val reservoir by utilizing various machine learning techniques: A case study in Ebro river basin, Spain. J. Hydrol. 2024, 639, 131639. [Google Scholar] [CrossRef]
- Deng, Y.; Zhang, Y.; Pan, D.; Yang, S.X.; Gharabaghi, B. Review of recent advances in remote sensing and machine learning methods for lake water quality management. Remote Sens. 2024, 16, 4196. [Google Scholar] [CrossRef]
- Oliveira Santos, V.; Guimarães, B.M.D.M.; Neto, I.E.L.; de Souza Filho, F.d.A.; Costa Rocha, P.A.; Thé, J.V.G.; Gharabaghi, B. Chlorophyll-a Estimation in 149 Tropical Semi-Arid Reservoirs Using Remote Sensing Data and Six Machine Learning Methods. Remote Sens. 2024, 16, 1870. [Google Scholar] [CrossRef]
- Chorus, I.; Welker, M. (Eds.) Toxic Cyanobacteria in Water: A Guide to Their Public Health Consequences, Monitoring and Management, 2nd ed.; CRC Press: Boca Raton, FL, USA, 2021. [Google Scholar] [CrossRef]
- Chen, C.; Chen, Q.; Yao, S.; He, M.; Zhang, J.; Li, G.; Lin, Y. Combining physical-based model and machine learning to forecast chlorophyll-a concentration in freshwater lakes. Sci. Total Environ. 2024, 907, 168097. [Google Scholar] [CrossRef]
- Zhao, F.; Zhang, C. Deep Learning for HABs Prediction with Multimodal Fusion. In Proceedings of the 31st ACM International Conference on Advances in Geographic Information Systems, Hamburg, Germany, 13–16 November 2023. [Google Scholar]
- Jeong, B.; Chapeta, M.R.; Kim, M.; Kim, J.; Shin, J.; Cha, Y. Machine learning-based prediction of harmful algal blooms in water supply reservoirs. Water Qual. Res. J. 2022, 57, 304–318. [Google Scholar] [CrossRef]
- Zare, A.; Ablakimova, N.; Kaliyev, A.A.; Mussin, N.M.; Tanideh, N.; Rahmanifar, F.; Tamadon, A. An update for various applications of Artificial Intelligence (AI) for detection and identification of marine environmental pollutions: A bibliometric analysis and systematic review. Mar. Pollut. Bull. 2024, 206, 116751. [Google Scholar] [CrossRef]
- Gang, D.; Da, L.; Shisheng, Z. Time series prediction using convolution sum discrete process neural network. Neural Netw. World 2014, 24, 421–432. [Google Scholar] [CrossRef]
- Liu, P.; Liu, J.; Wu, K. CNN-FCM: System modeling promotes stability of deep learning in time series prediction. Knowl.-Based Syst. 2020, 203, 106081. [Google Scholar] [CrossRef]
- Huang, W.; Li, Y.; Huang, Y. Deep hybrid neural network and improved differential neuroevolution for chaotic time series prediction. IEEE Access 2020, 8, 159552–159565. [Google Scholar] [CrossRef]
- Hill, P.R.; Kumar, A.; Temimi, M.; Bull, D.R. Habnet: Machine learning, remote sensing-based detection of harmful algal blooms. IEEE J. Sel. Top. Appl. Earth Obs. Remote Sens. 2020, 13, 3229–3239. [Google Scholar] [CrossRef]
- Pyo, J.; Cho, K.H.; Kim, K.; Baek, S.S.; Nam, G.; Park, S. Cyanobacteria cell prediction using interpretable deep learning model with observed, numerical, and sensing data assemblage. Water Res. 2021, 203, 117483. [Google Scholar] [CrossRef] [PubMed]
- Cho, H.; Choi, U.J.; Park, H. Deep learning application to time series prediction of daily chlorophyll-a concentration. WIT Trans. Ecol. Environ. 2018, 215, 157–163. [Google Scholar]
- Lee, S.; Lee, D. Improved prediction of harmful algal blooms in four major South Korea’s rivers using deep learning models. Int. J. Environ. Res. Public Health 2018, 15, 1322. [Google Scholar] [CrossRef]
- Cho, H.; Park, H. Merged-LSTM and multistep prediction of daily chlorophyll-A concentration for algal bloom forecast. In Proceedings of the IOP Conference Series: Earth and Environmental Science, Kaohsiung City, Taiwan, 1–4 July 2019; Volume 351, p. 012020. [Google Scholar]
- Yussof, F.N.; Maan, N.; Reba, M. LSTM networks to improve the prediction of harmful algal blooms in the west coast of Sabah. Int. J. Environ. Res. Public Health 2021, 18, 7650. [Google Scholar] [CrossRef]
- Alan, A.R.; Bayındır, C.; Ozaydin, F.; Altintas, A.A. The Predictability of the 30 October 2020 İzmir-Samos Tsunami Hydrodynamics and Enhancement of Its Early Warning Time by LSTM Deep Learning Network. Water 2023, 15, 4195. [Google Scholar] [CrossRef]
- Ghosh, A.; Kasera, S.; Van Der Merwe, J. Spectrum Usage Analysis And Prediction using Long Short-Term Memory Networks. In Proceedings of the 24th International Conference on Distributed Computing and Networking (ICDCN ’23), Kharagpur, India, 4–7 January 2023; pp. 270–279. [Google Scholar] [CrossRef]
- Ali, Z.; Park, U. Real-time safety monitoring vision system for linemen in buckets using spatio-temporal inference. Int. J. Control Autom. Syst. 2021, 19, 505–520. [Google Scholar] [CrossRef]
- Mozo, A.; Morón-López, J.; Vakaruk, S.; Pompa-Pernía, Á.G.; González-Prieto, Á.; Aguilar, J.A.P.; Gómez-Canaval, S.; Ortiz, J.M. Chlorophyll soft-sensor based on machine learning models for algal bloom predictions. Sci. Rep. 2022, 12, 13529. [Google Scholar] [CrossRef] [PubMed]
- Ni, J.; Liu, R.; Tang, G.; Xie, Y. An Improved Attention-based Bidirectional LSTM Model for Cyanobacterial Bloom Prediction. Int. J. Control Autom. Syst. 2022, 20, 3445–3455. [Google Scholar] [CrossRef]
Disclaimer/Publisher’s Note: The statements, opinions and data contained in all publications are solely those of the individual author(s) and contributor(s) and not of MDPI and/or the editor(s). MDPI and/or the editor(s) disclaim responsibility for any injury to people or property resulting from any ideas, methods, instructions or products referred to in the content. |
© 2025 by the authors. Licensee MDPI, Basel, Switzerland. This article is an open access article distributed under the terms and conditions of the Creative Commons Attribution (CC BY) license (https://creativecommons.org/licenses/by/4.0/).