
Tracing Experiments and Flow Characteristic Analyses in Carbonate Geothermal Reservoirs: A Case Study of the Juancheng Geothermal Field, North China

 , ,
, , 
Abstract
1. Introduction
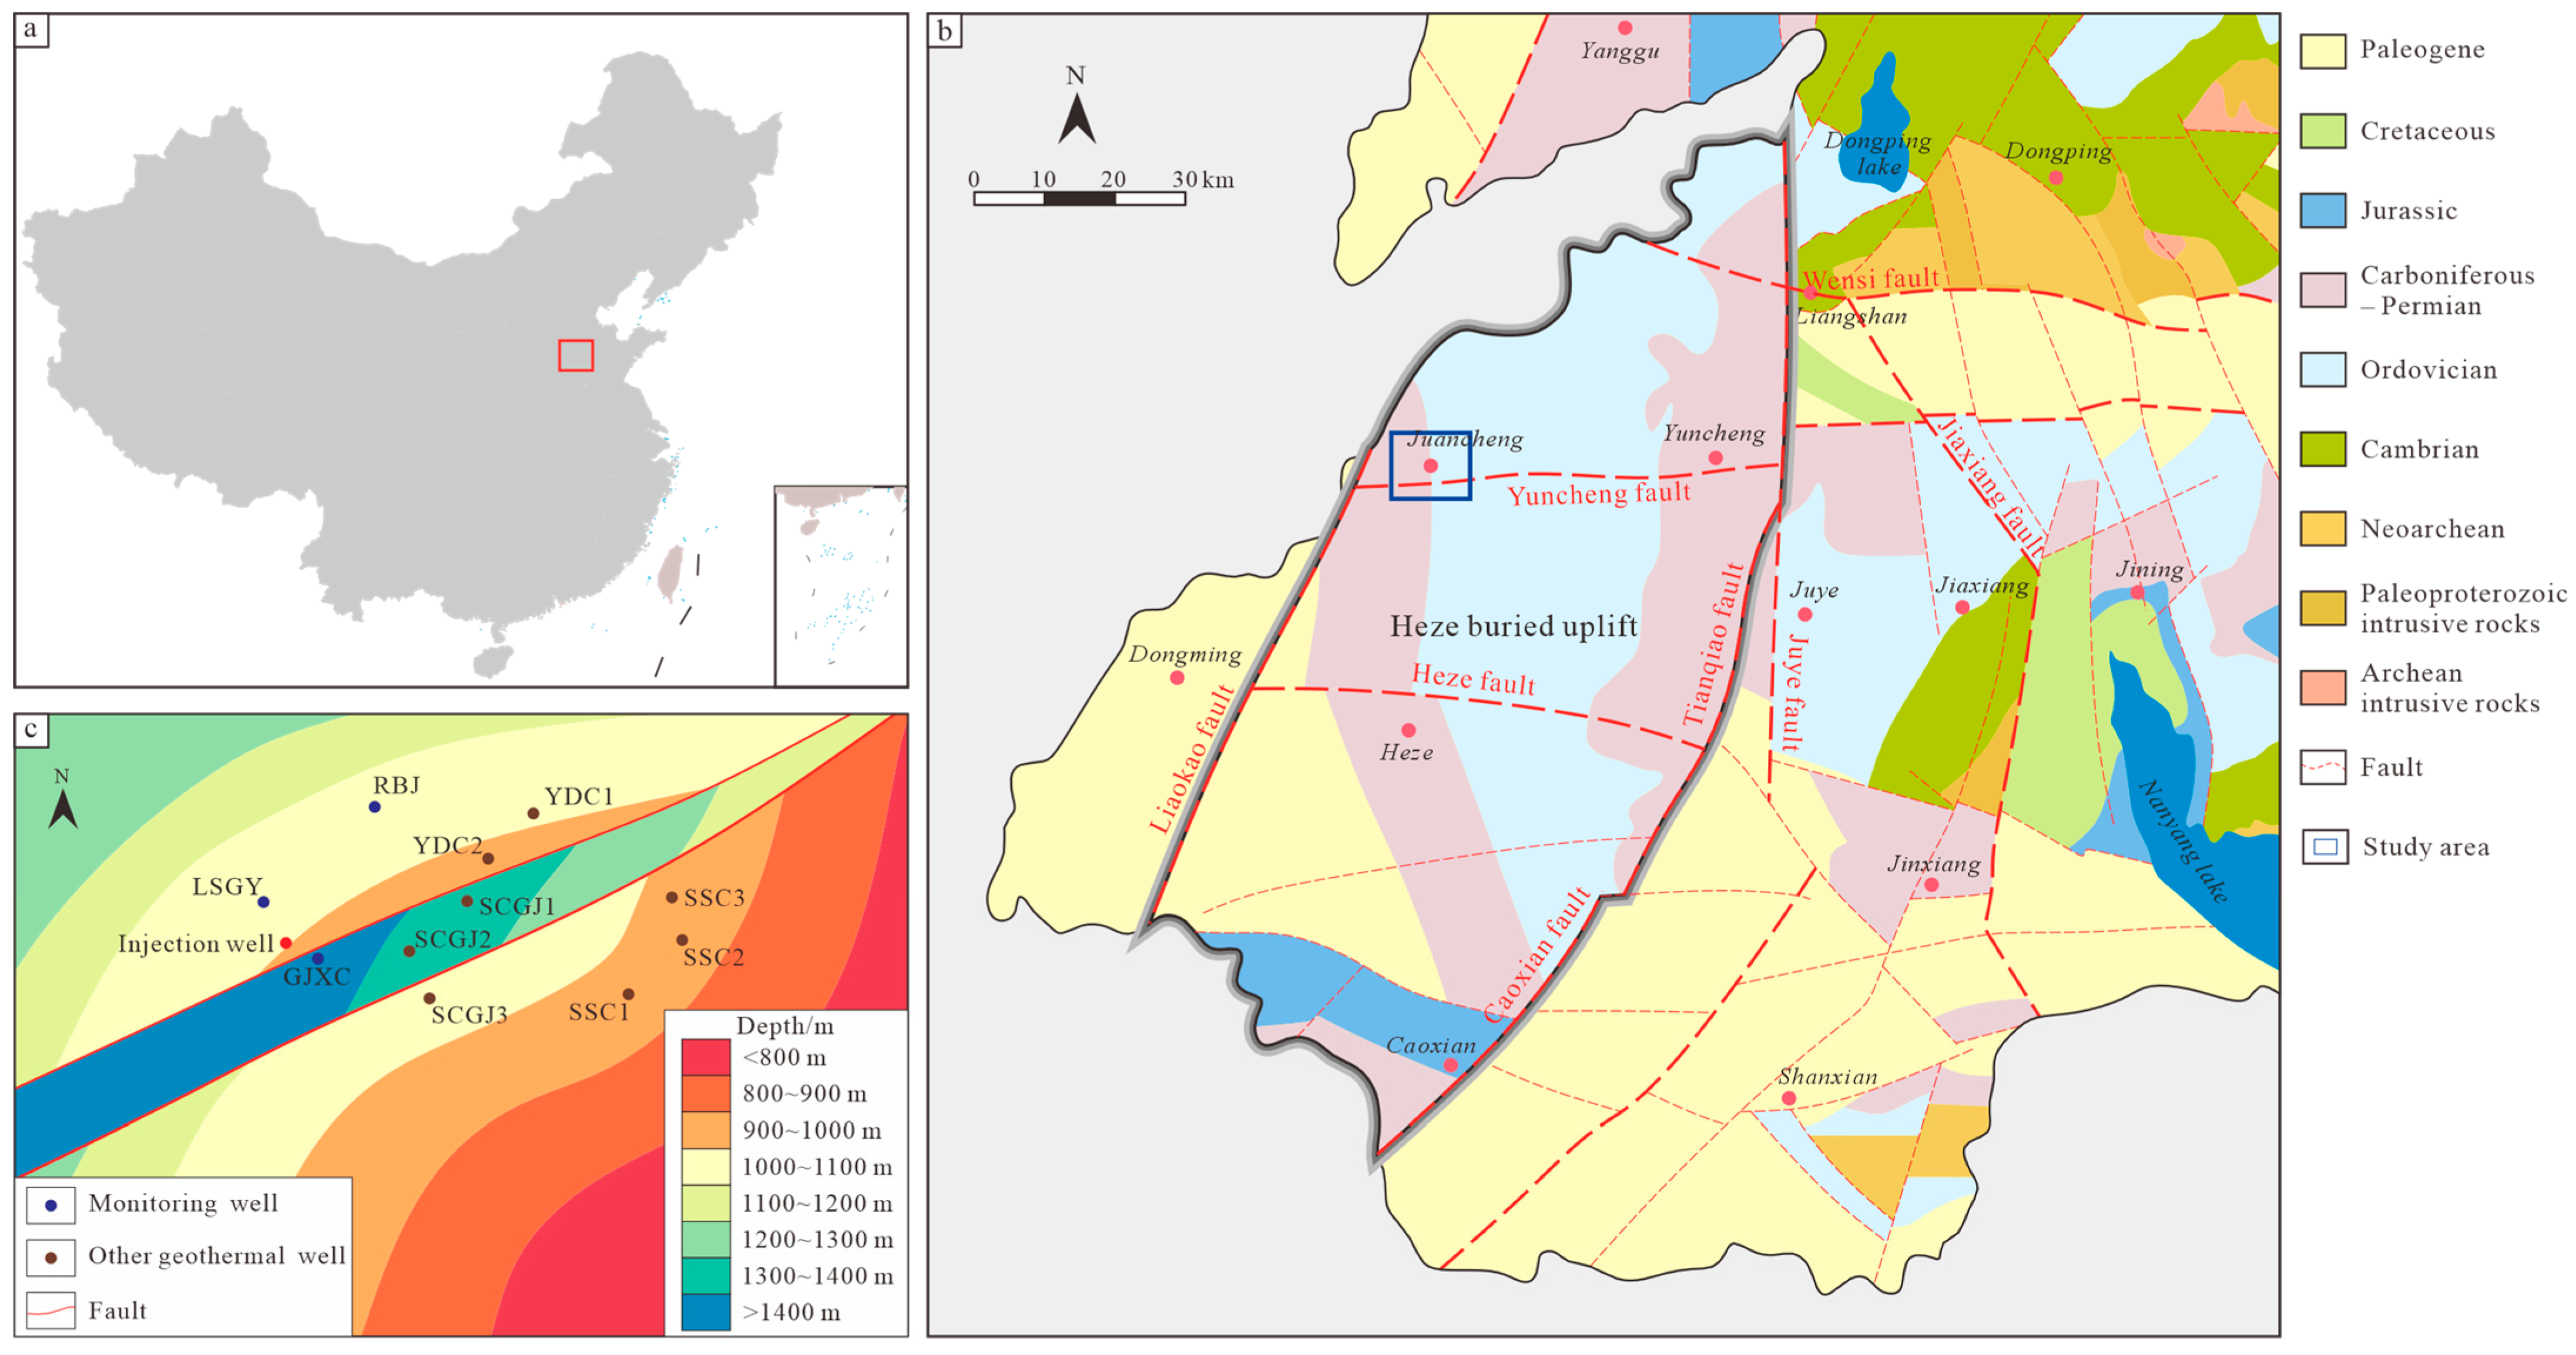
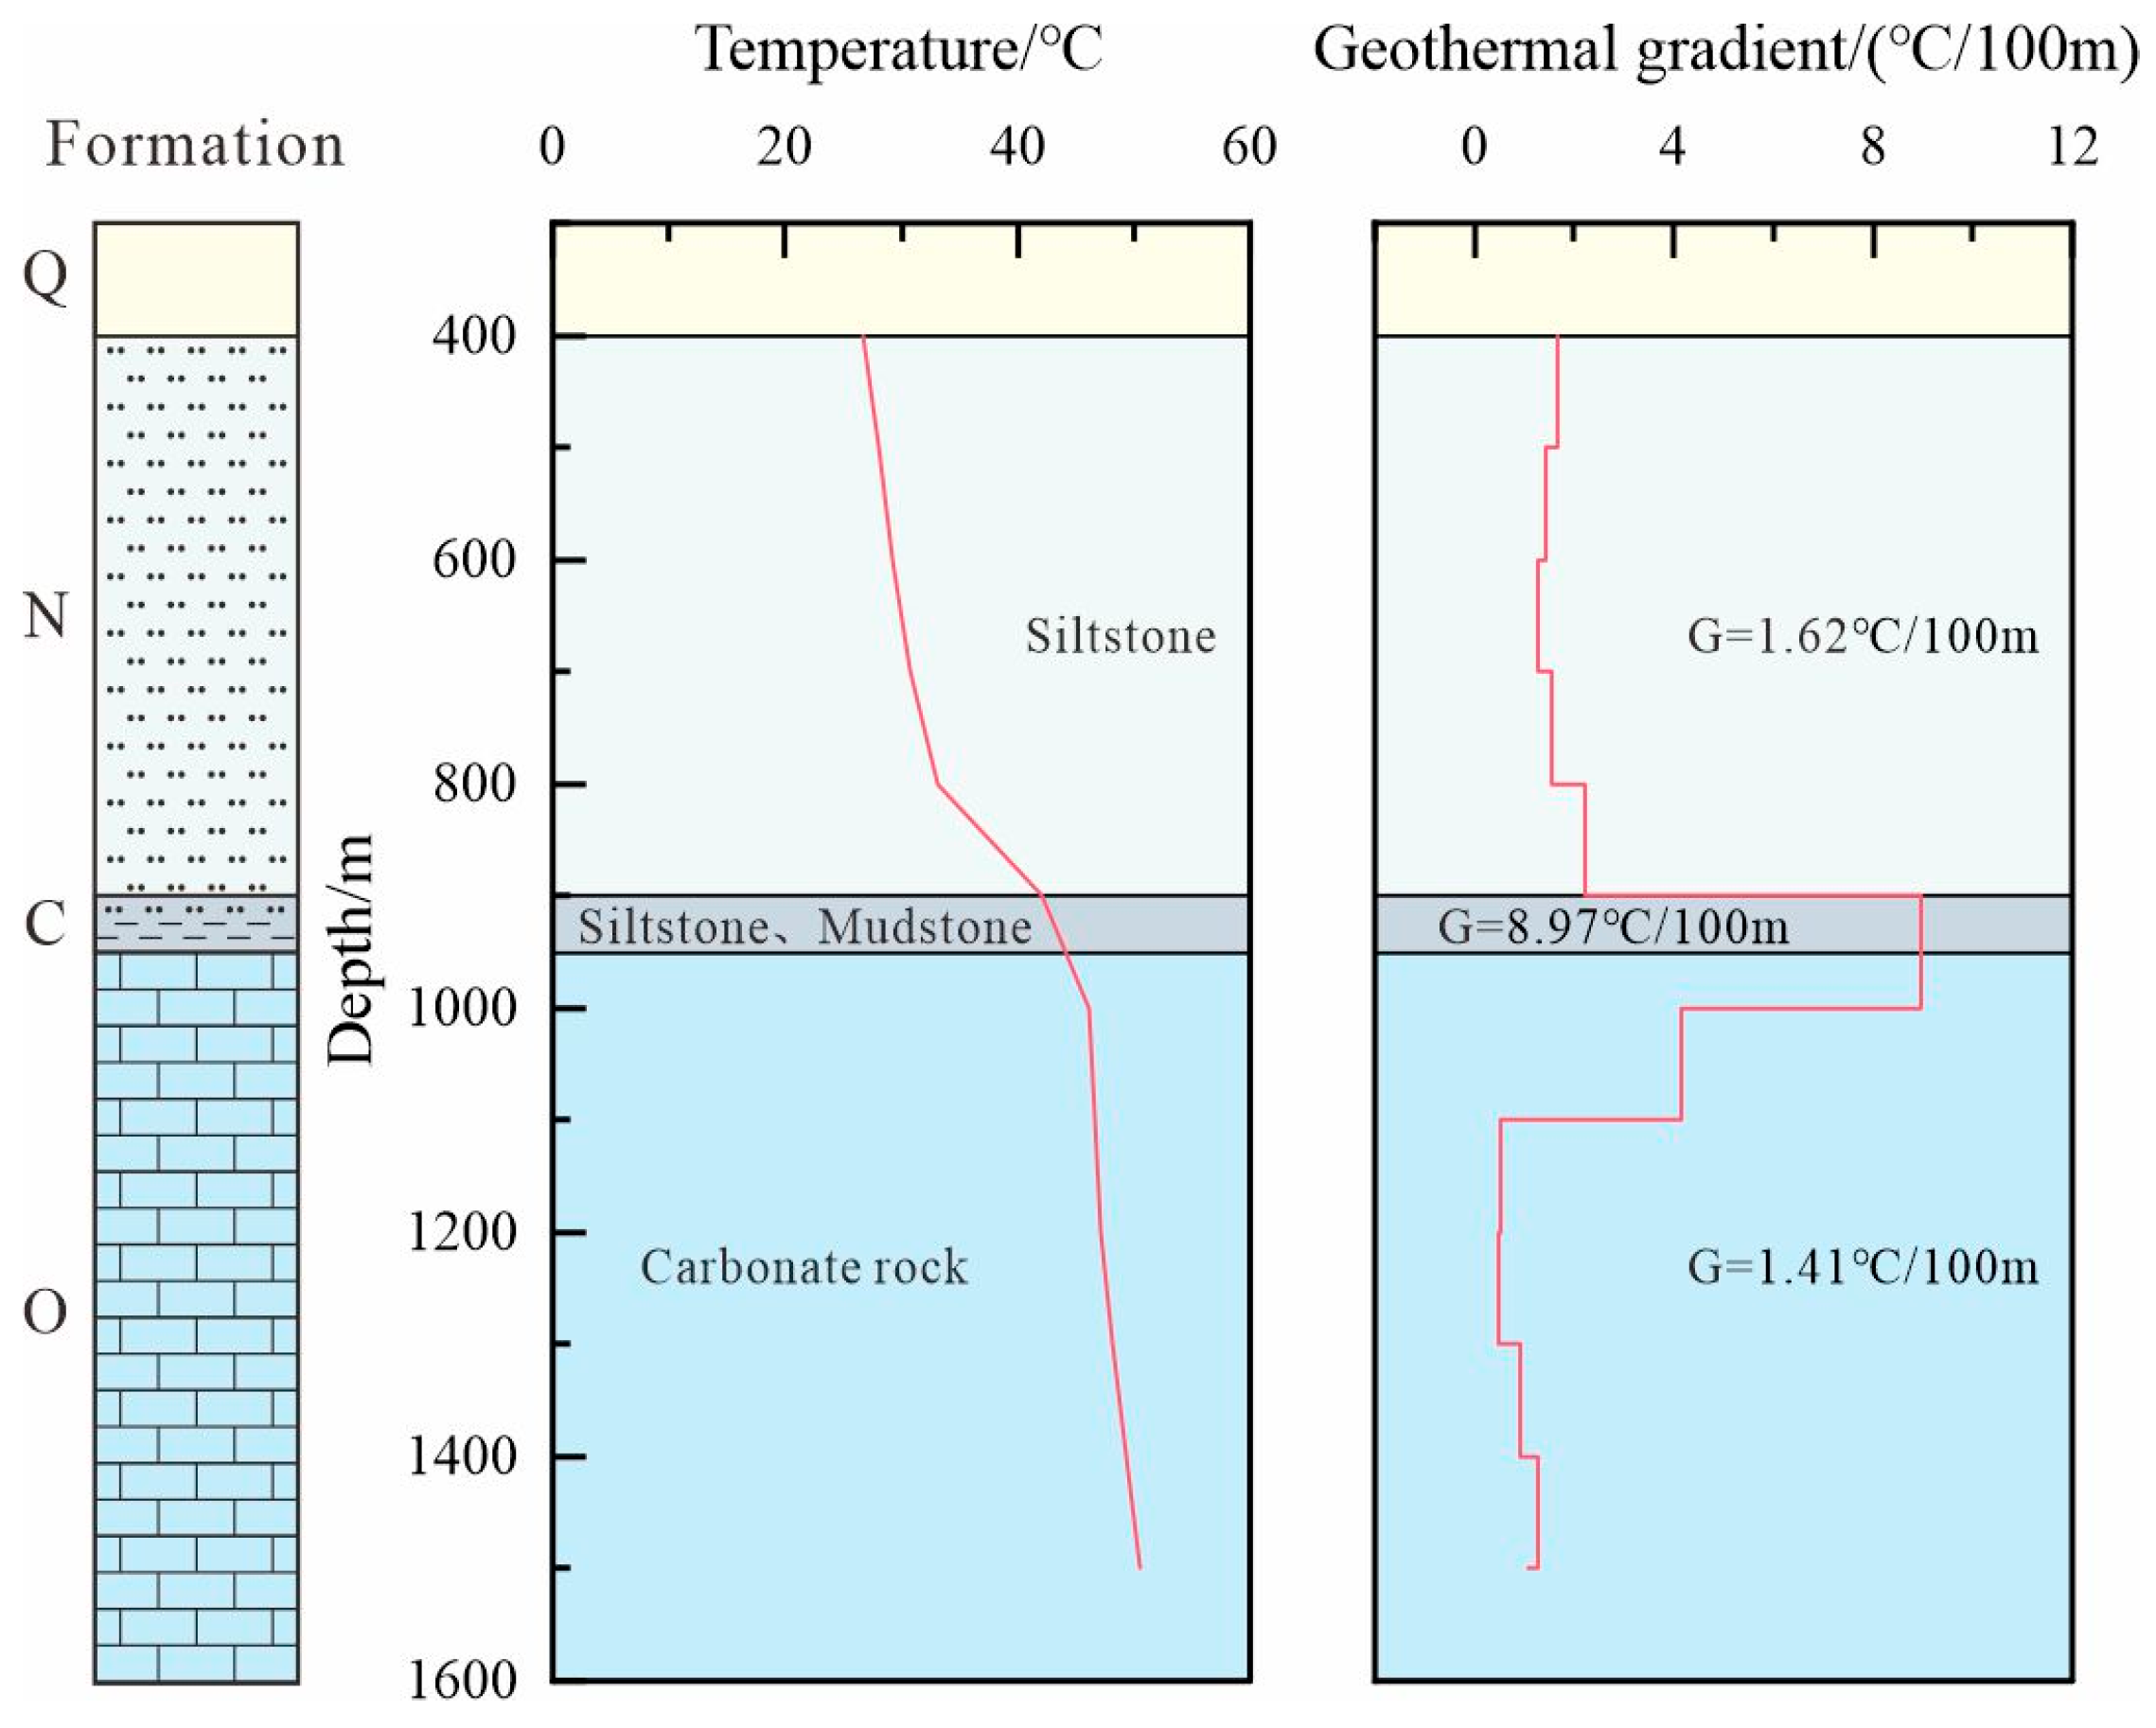
2. Geologic Setting
3. Tracing Experiment Procedure
3.1. Tracer Selection
3.2. Tracer Injection, Sampling, and Detection
3.3. Characteristics of Monitoring and Injection Wells
4. Results
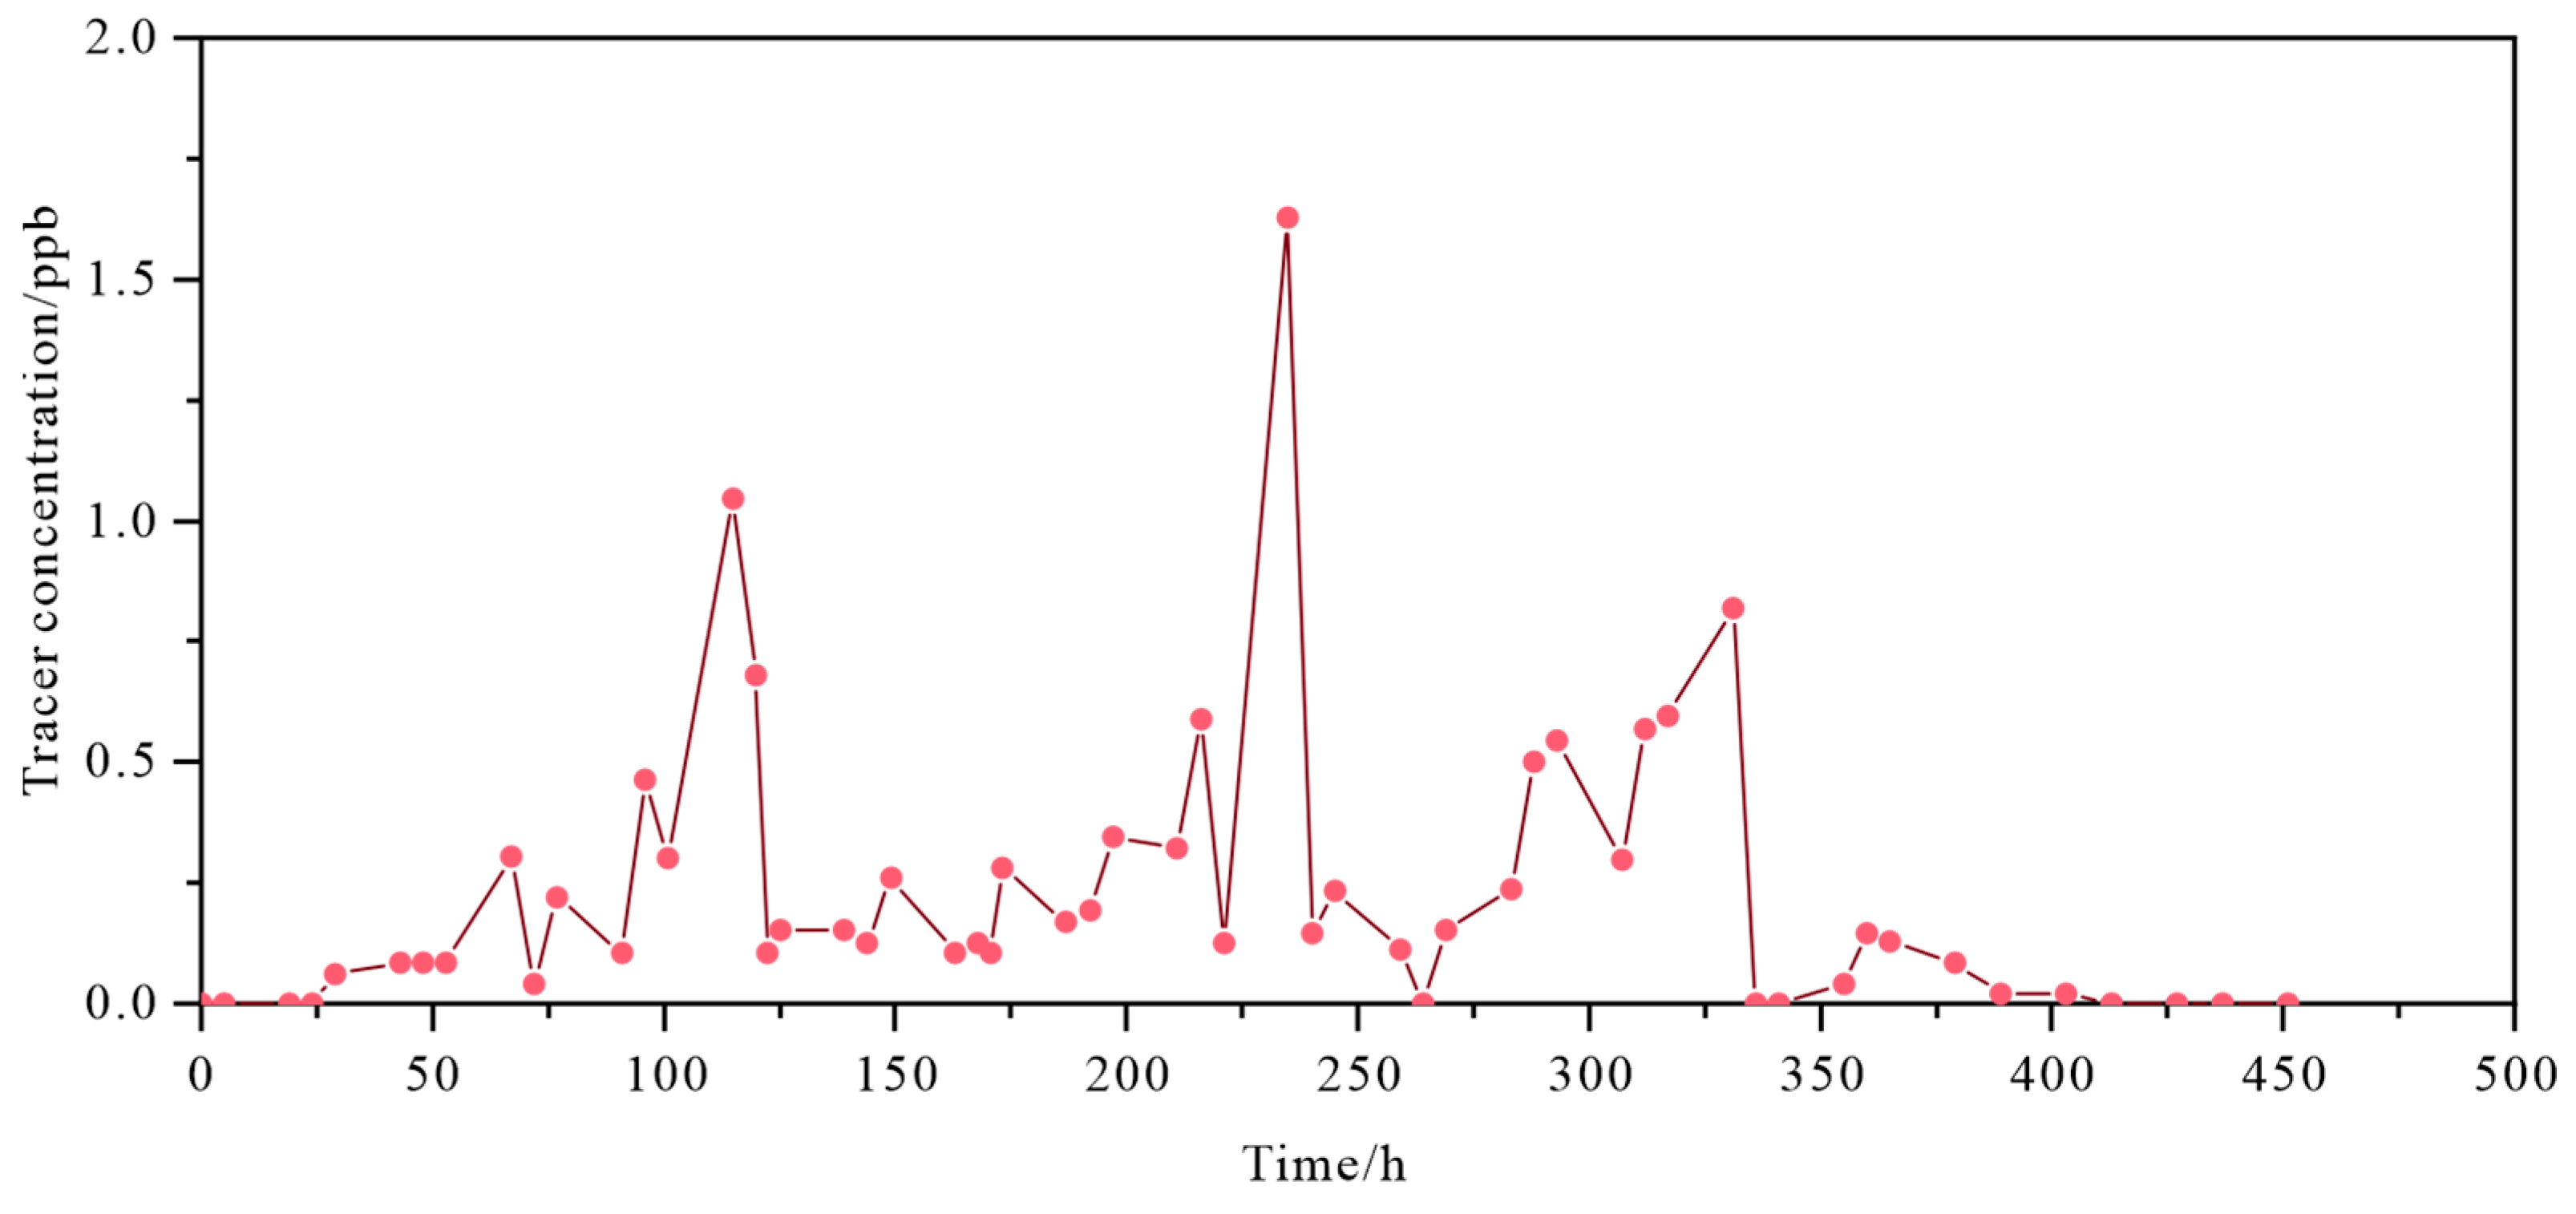
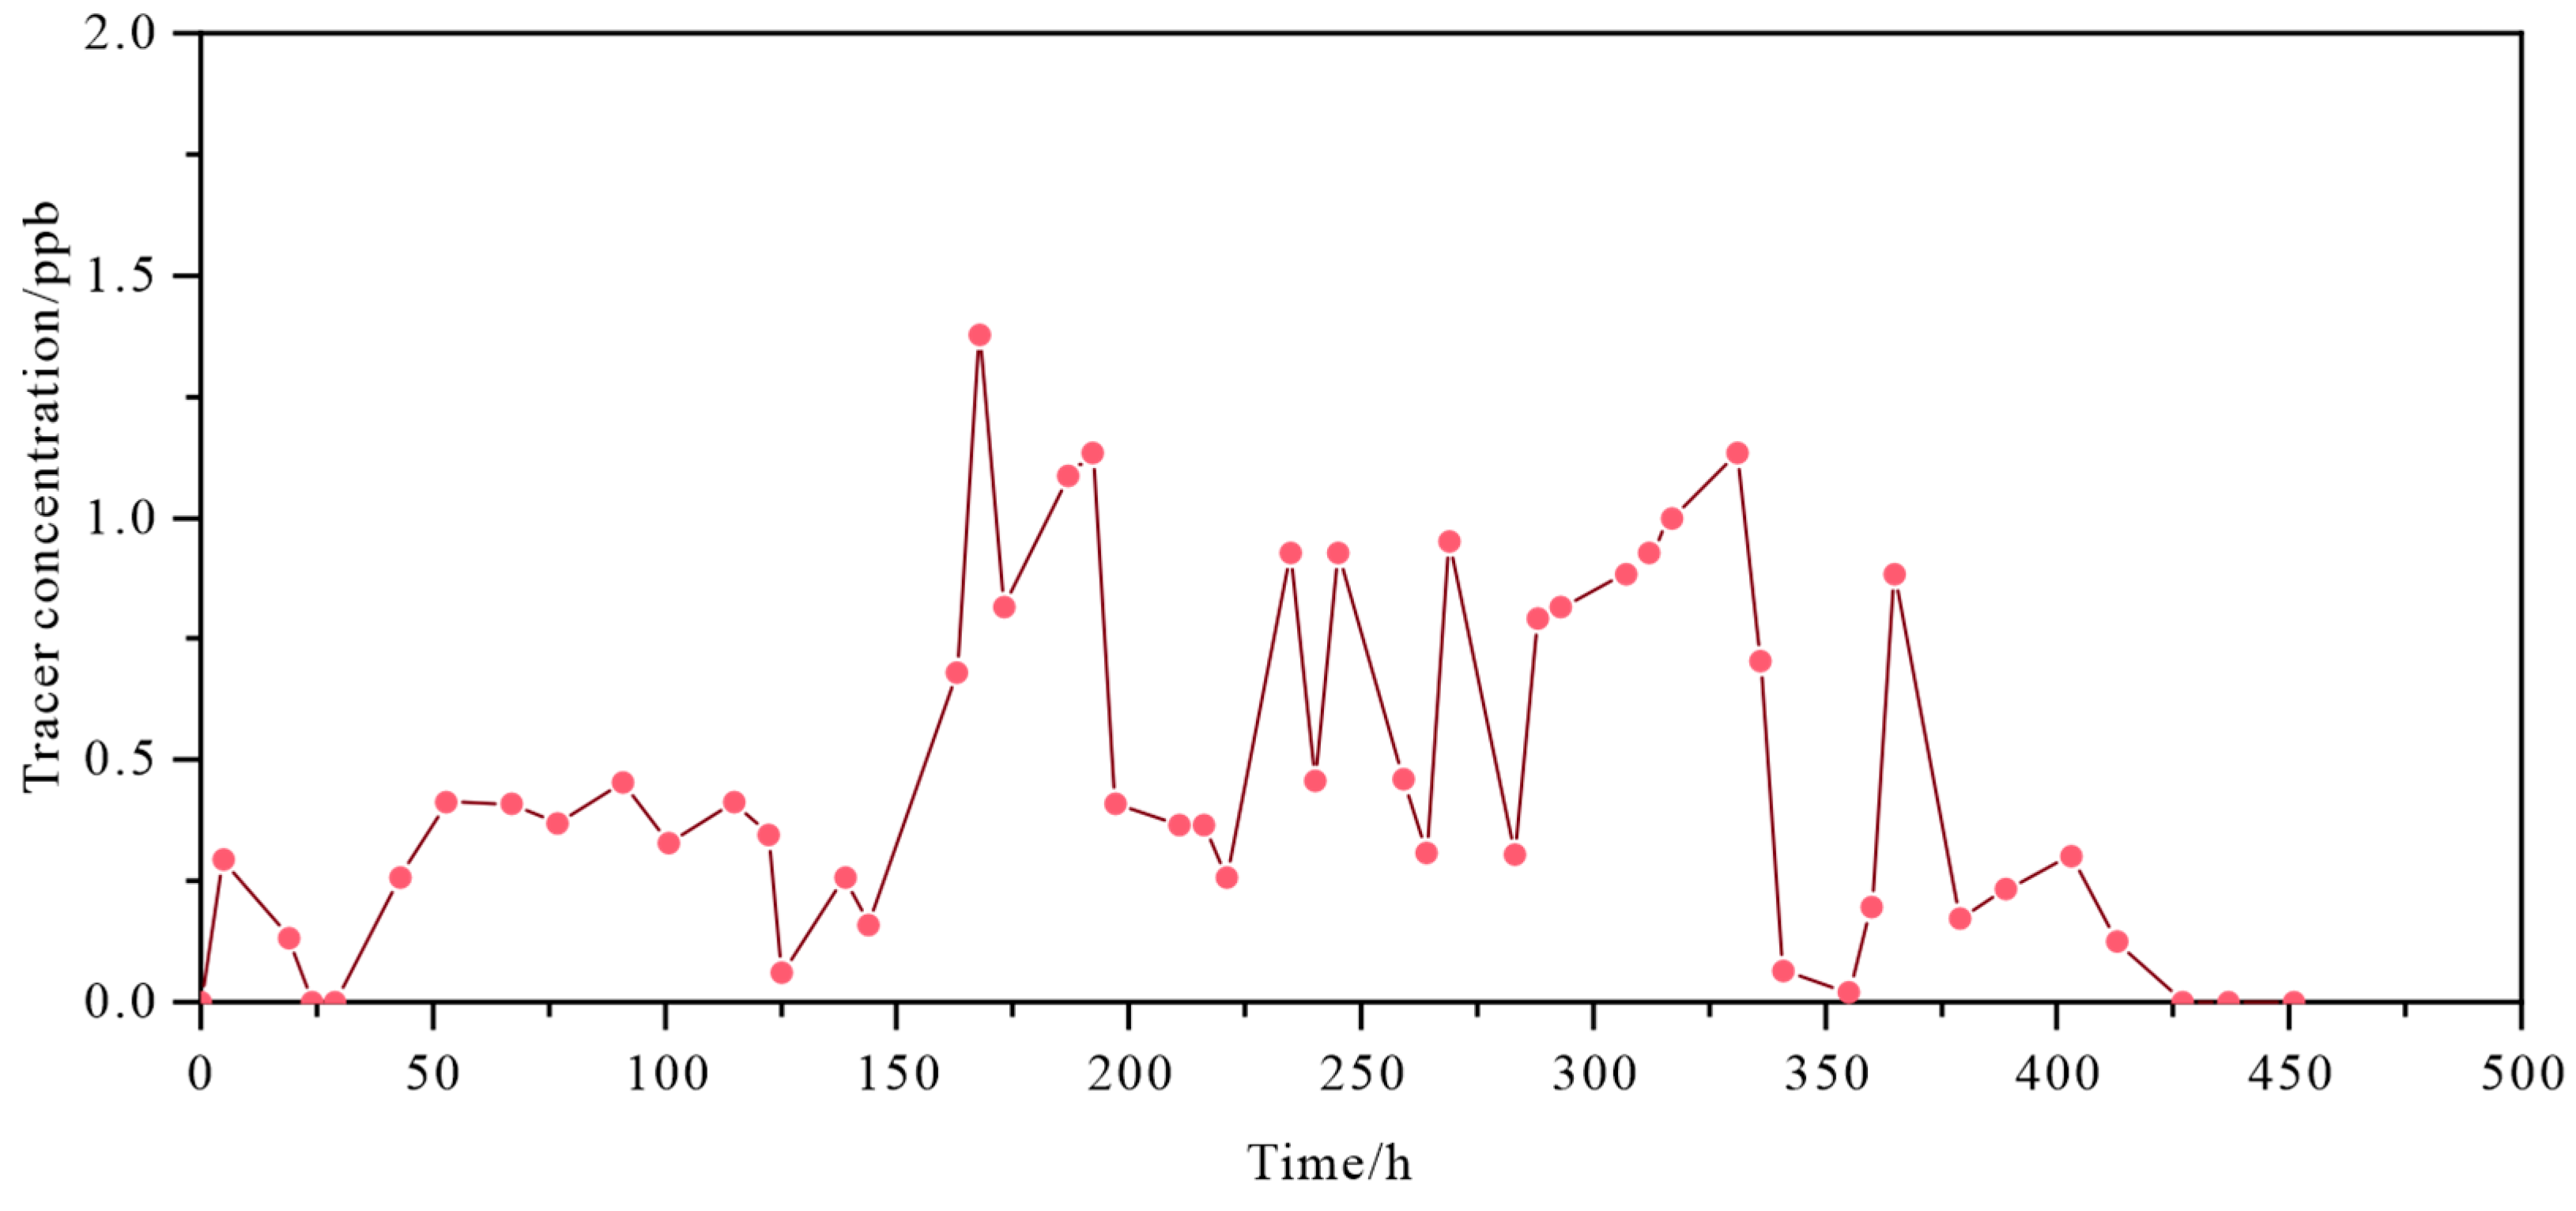
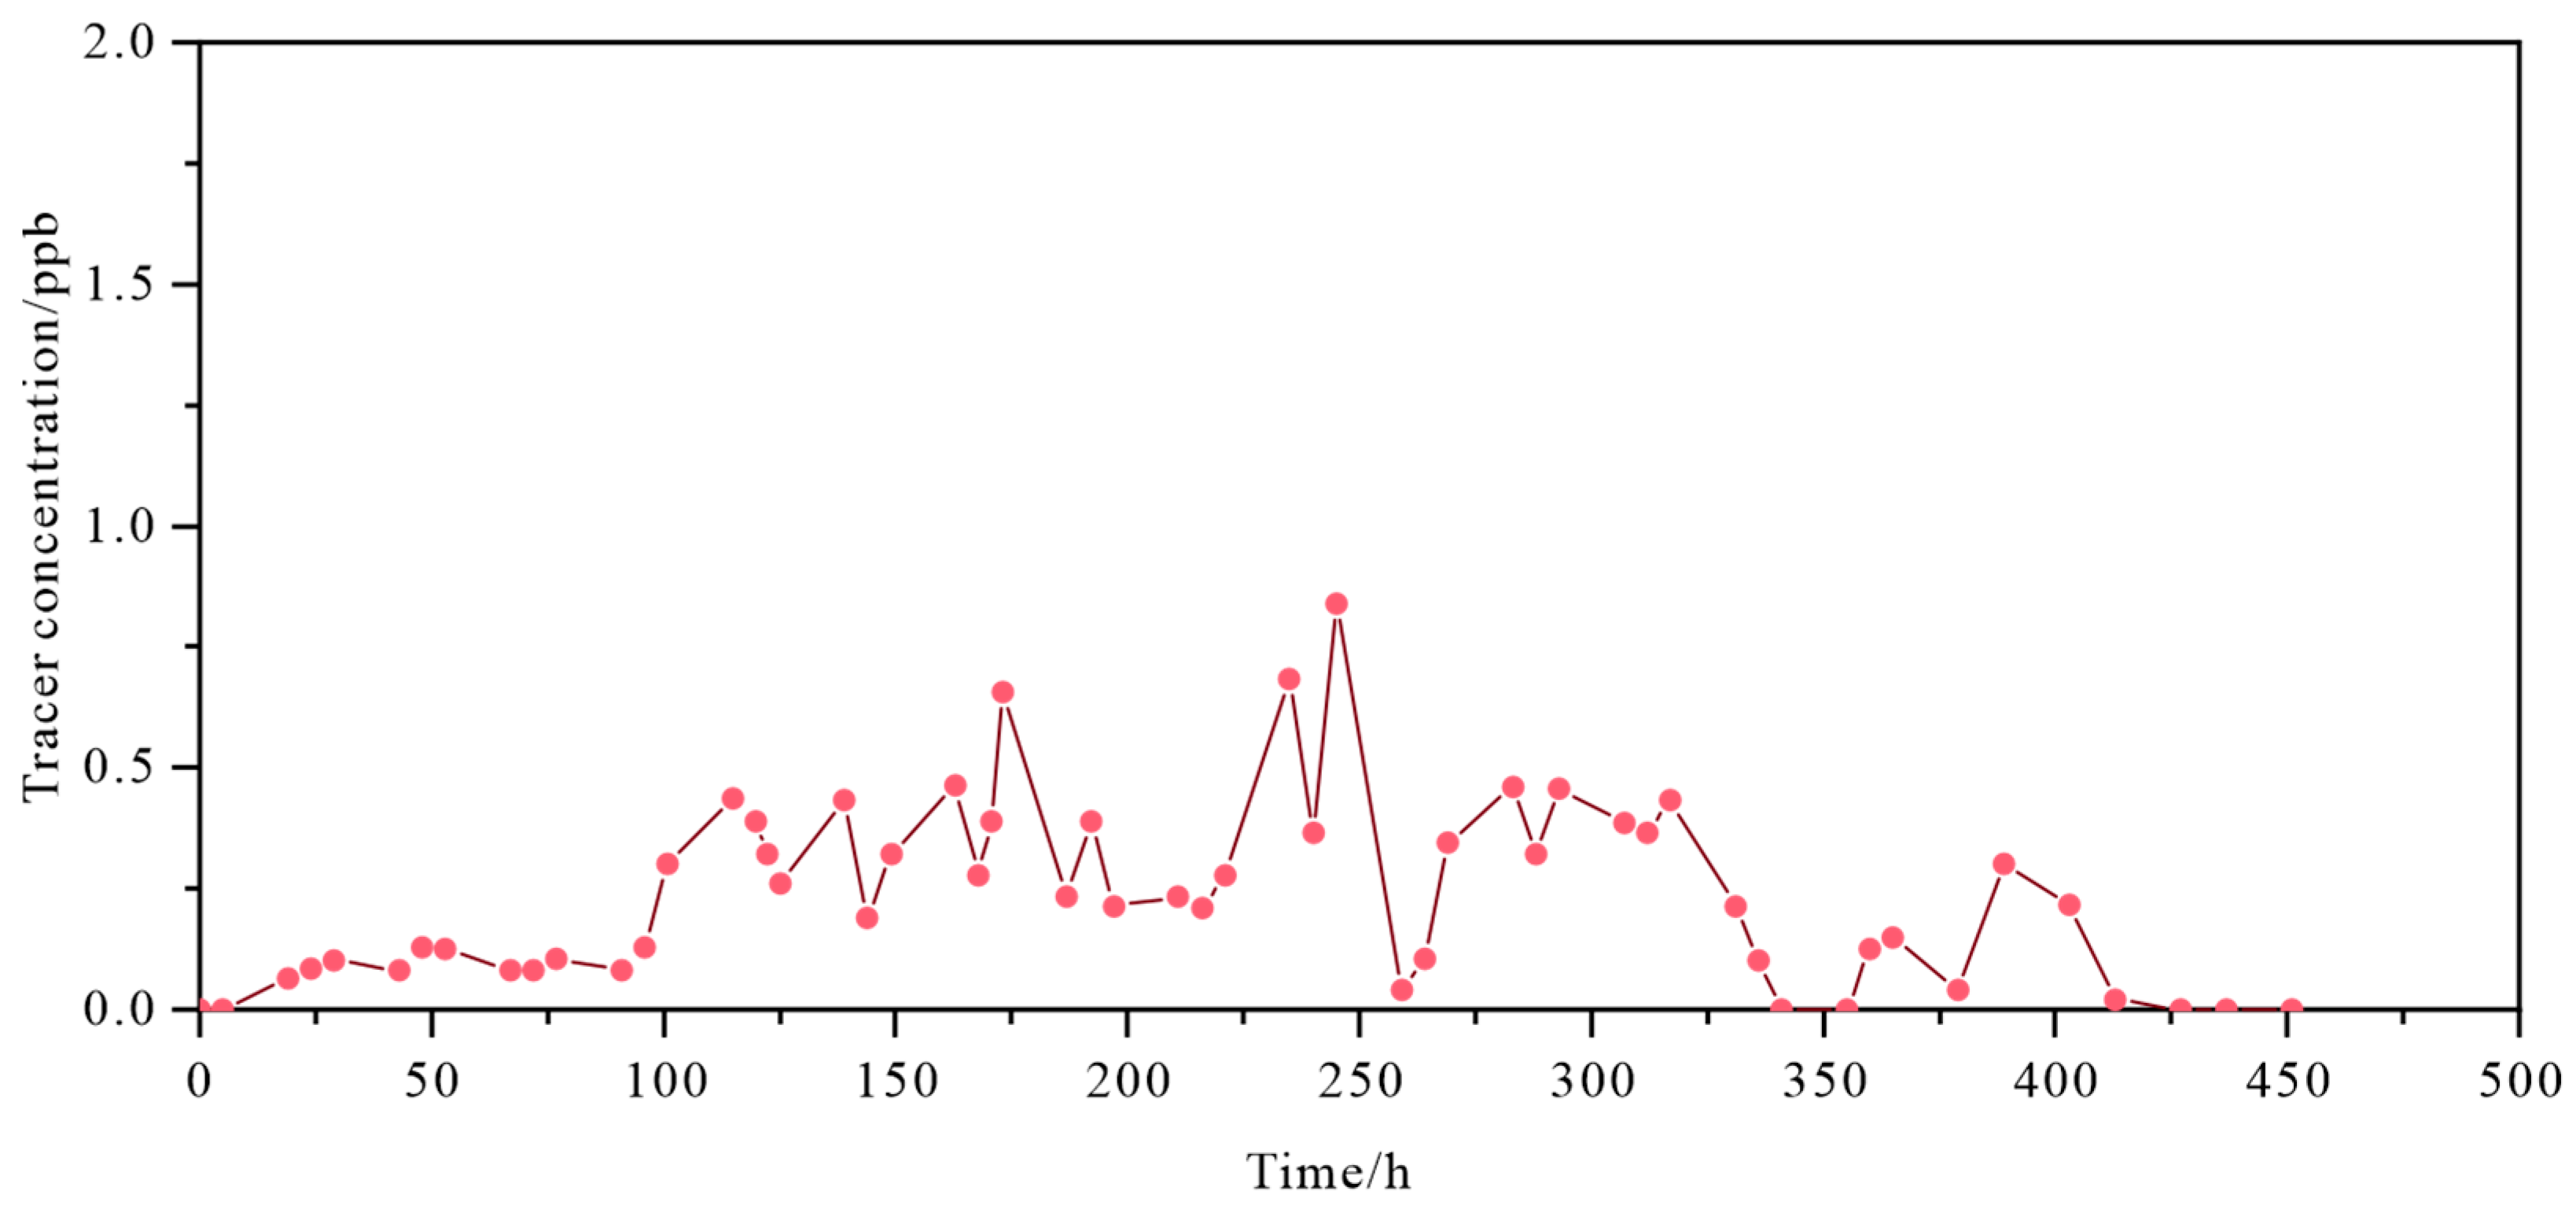
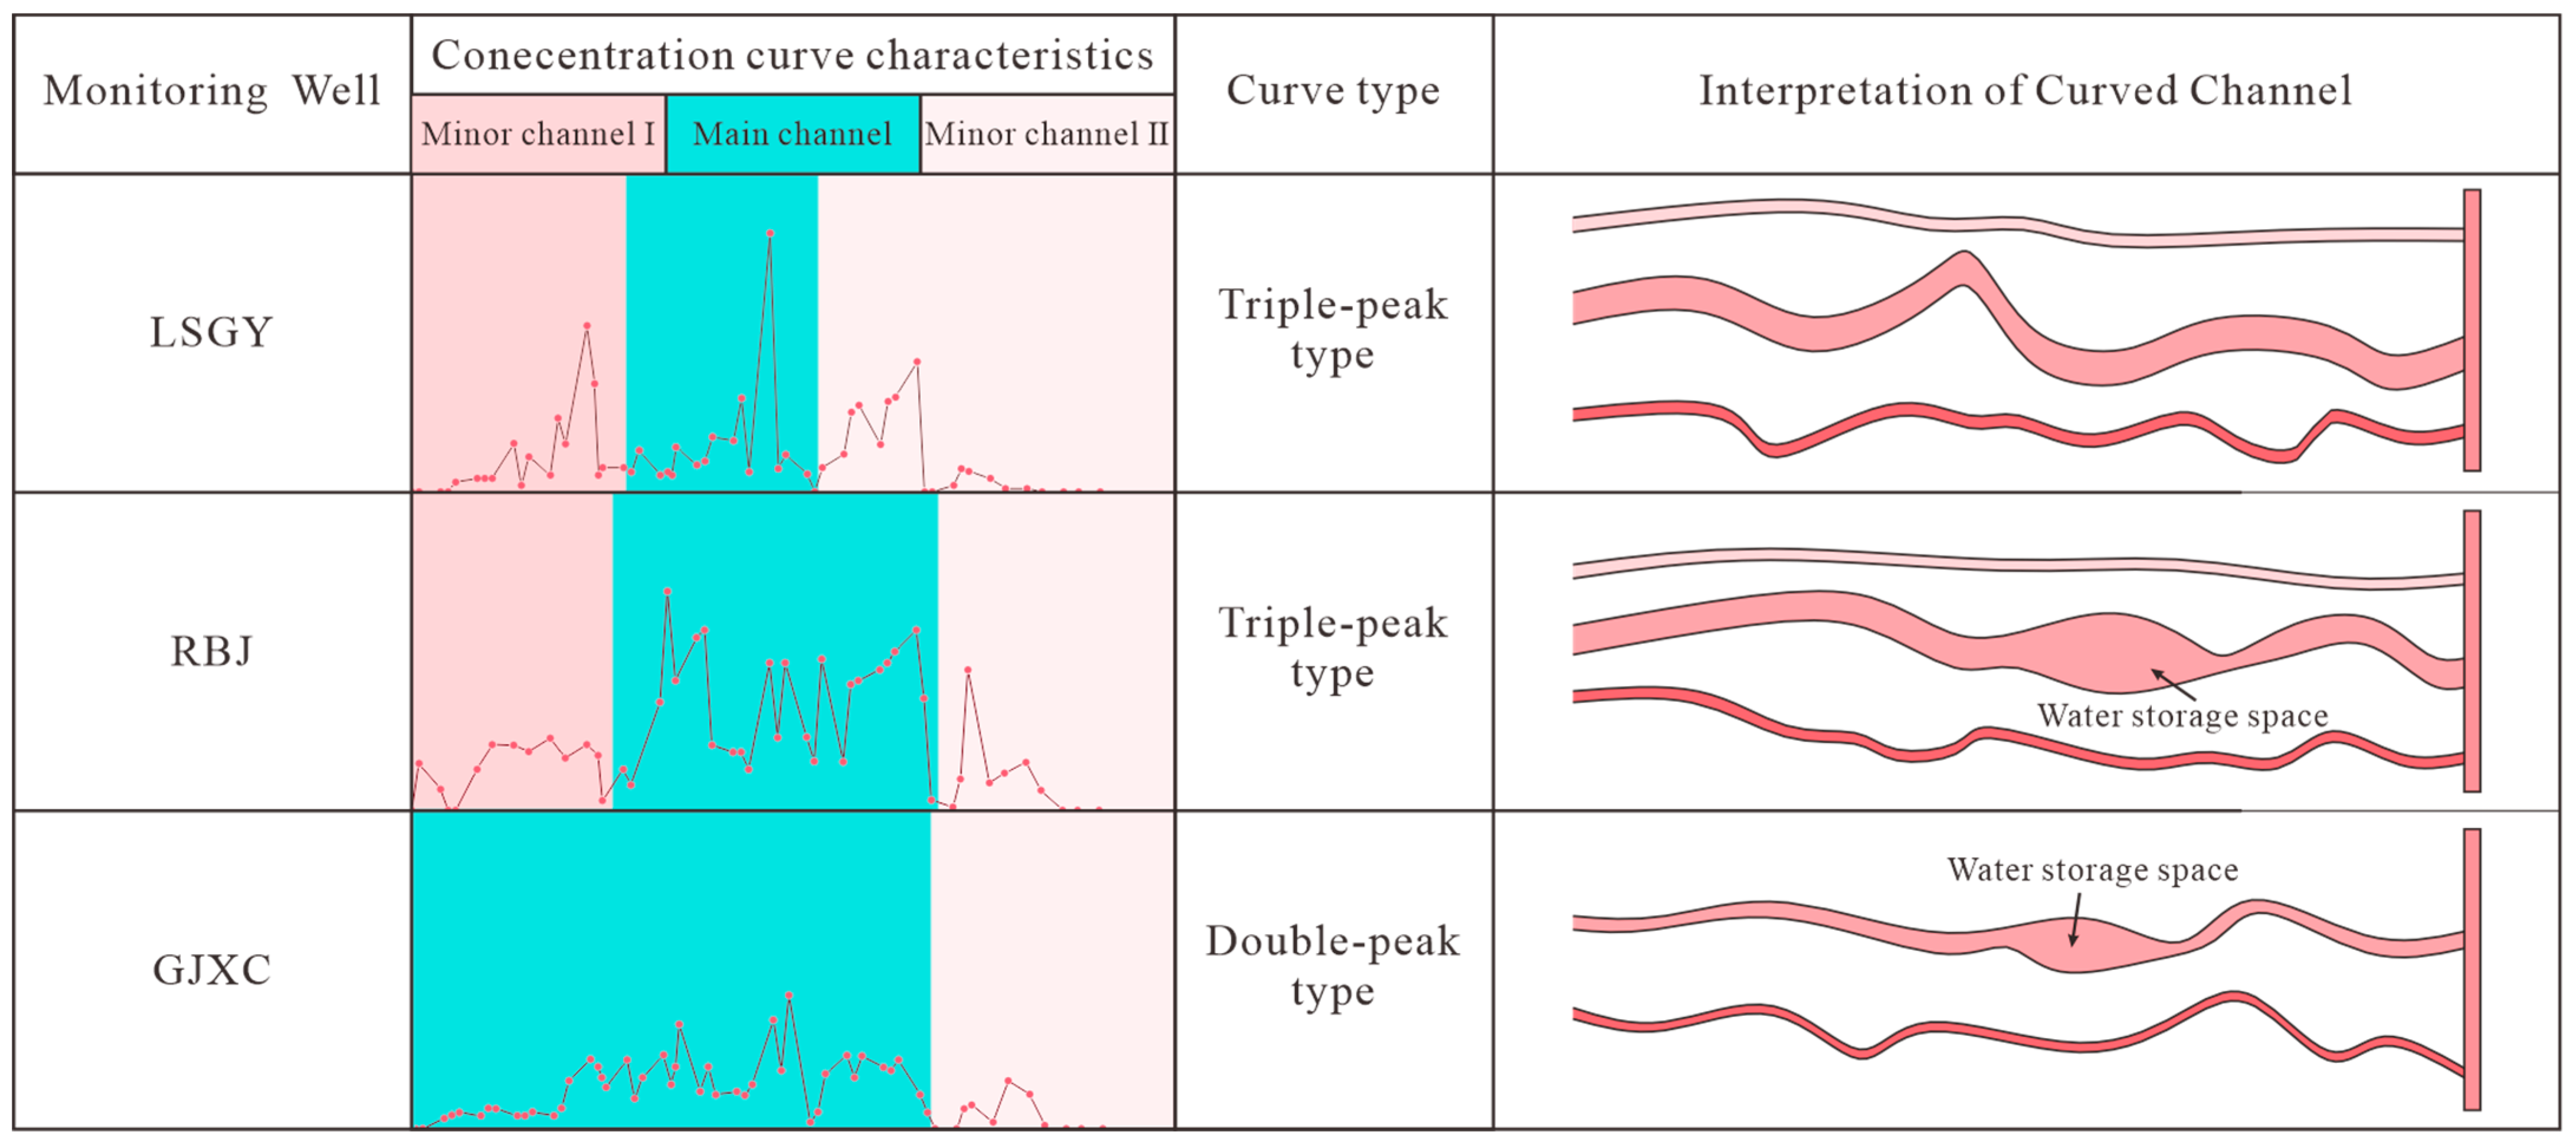
4.1. Characteristics of Concentration–Time Curves
4.2. Tracer Seepage Velocity
5. Discussion
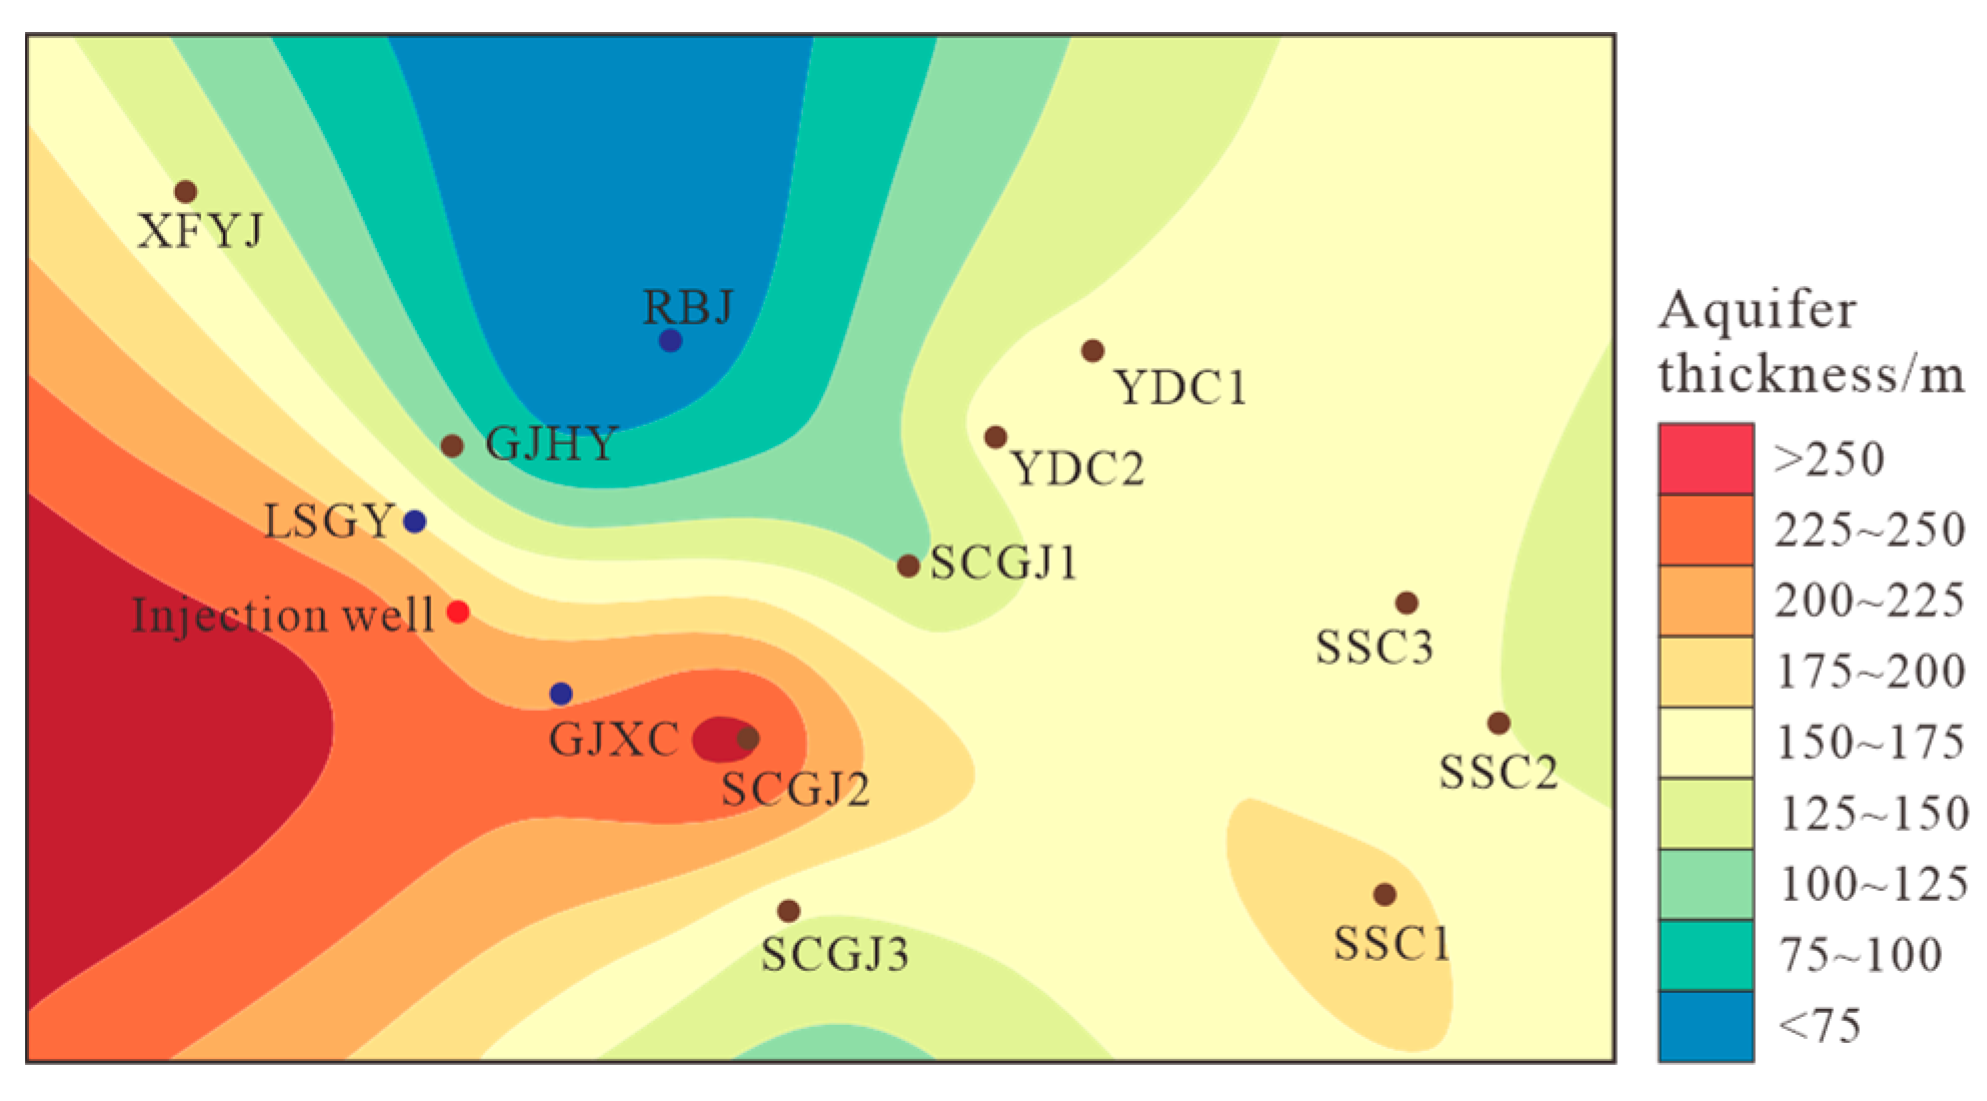
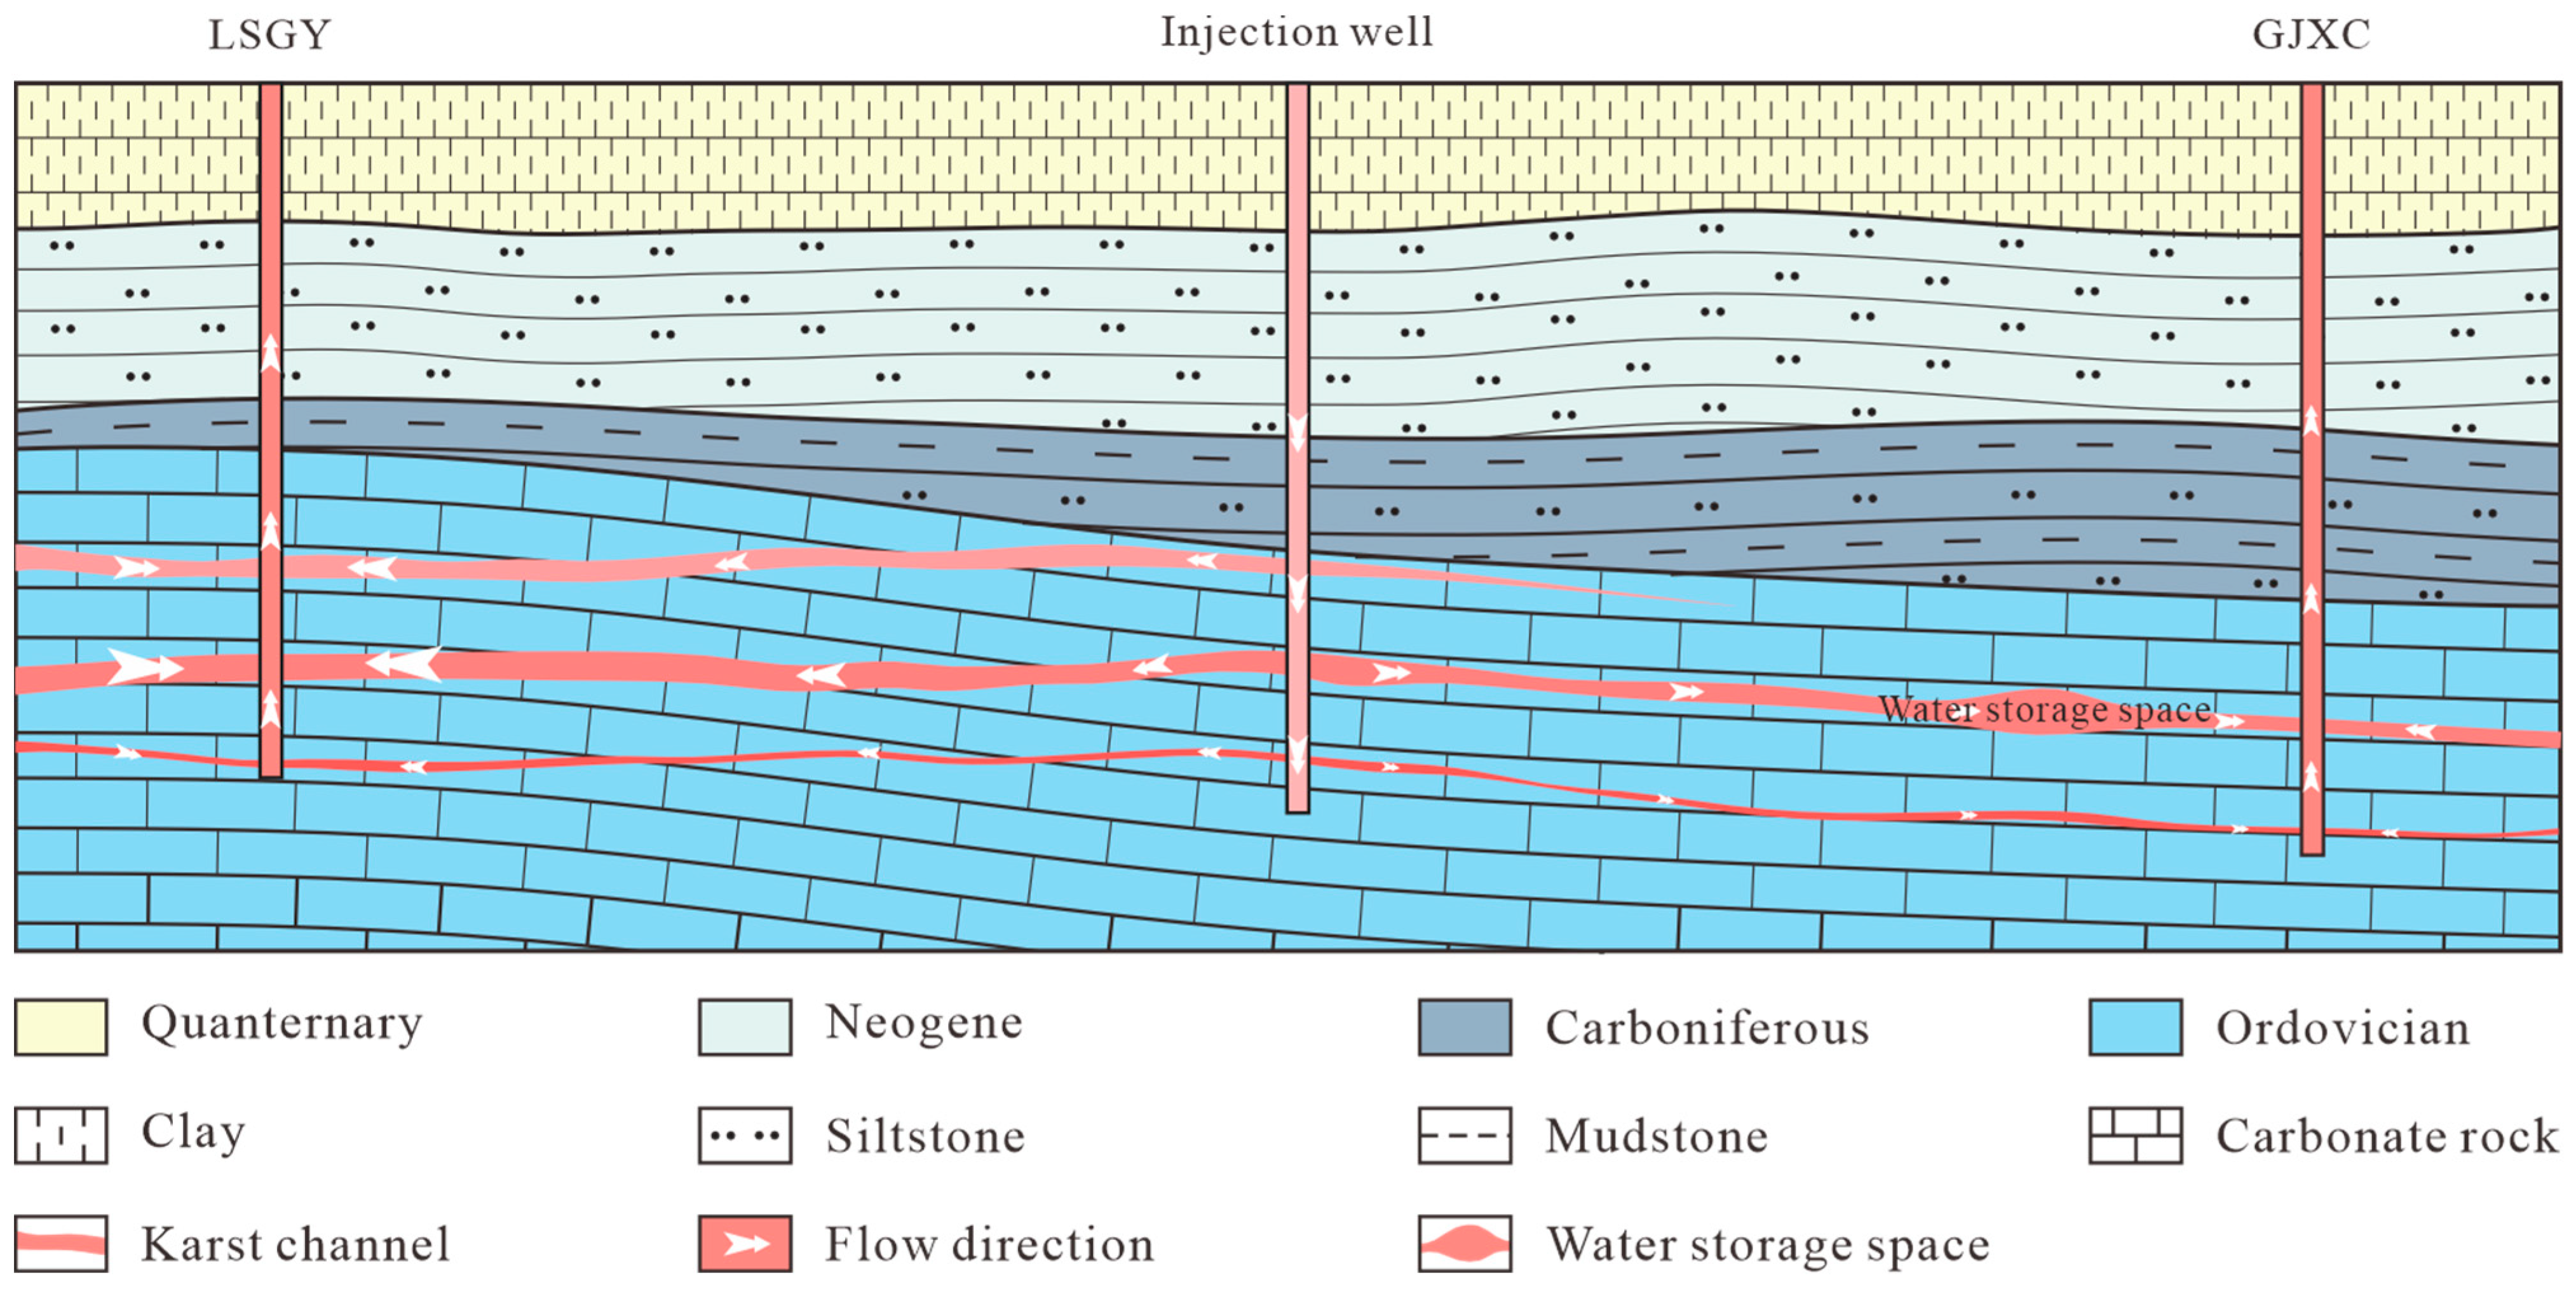
5.1. Geometric Characteristics of Ordovician Karst Channels
5.2. Structural Analysis of the Ordovician Karst Flow Channel System
5.3. Control Mechanism of Structural Faults and Burial Depth on Karst Thermal Reservoir Seepage Channels
5.4. Geothermal Water Seepage and Productivity Development Potential
5.5. Well Deployment Optimization Strategy and Economic Exploitation of Geothermal Resources
6. Conclusions
Author Contributions
Funding
Data Availability Statement
Acknowledgments
Conflicts of Interest
References
- Zhao, Z.H.; Liu, G.H.; Tan, X.F.; Zhang, P.P. Theoretical model of geothermal tail water reinjection based on the equivalent flow channel model. Hydrogeol. Eng. Geol. 2017, 44, 158–164. [Google Scholar]
- Pang, J.M.; Pang, Z.H.; Kong, Y.L.; Lou, L.; Wang, Y.C.; Wang, S.F. Interwell connectivity in a karstic geothermal reservoir through tracer tests. Chin. J. Geol. 2014, 49, 915–923. [Google Scholar]
- Yin, X.X.; Shen, J.; Zhao, Y.T.; Liu, D.L.; Zhao, S.M.; Zong, Z.H. Study on tracer test of carbonate geothermal reservoir under centralized pumping and re-injection conditions. Acta Geol. Sin. 2021, 95, 1984–1994. [Google Scholar]
- Kumagai, N.; Tanaka, T.; Kitao, K. Characterization of Geothermal Fluid Flows at Sumikawa Geothermal Area, Japan, Using Two Types of Tracers and an Improved Multi-Path Model. Geothermics 2004, 33, 257–275. [Google Scholar] [CrossRef]
- Kocabas, I. Geothermal Reservoir Characterization via Thermal Injection Backflow and Interwell Tracer Testing. Geothermics 2005, 34, 27–46. [Google Scholar] [CrossRef]
- Xue, Y.Z.; Zhang, Y.G.; Ma, Y.J.; Xue, C. Reinjection tracer test of karst geothermal reservoir in the southeastern margin of Ordos Basin. Pet. Reserv. Eval. Dev. 2023, 13, 757–764, 780. [Google Scholar]
- Ren, Y.; Kong, Y.; Pang, Z.; Wang, J. A Comprehensive Review of Tracer Tests in Enhanced Geothermal Systems. Renew. Sustain. Energy Rev. 2023, 182, 113393. [Google Scholar] [CrossRef]
- Jia, Y.Y.; Su, Y.C.; Sui, S.Q.; Jia, W.M.; Li, Z.F.; Yang, Z.B.; Wang, Q.; Gao, F.; Ji, H.C.; Bao, Z.D. Lithofacies paleogeography characteristics and evolution of the Ordovician in western Shandong-eastern Henan area. J. Palaeogeogr. 2023, 25, 133–147. [Google Scholar]
- Kang, F.X. Comprehensive Evaluation of Geothermal Clean Energy in Shandong Province; Science Press: Beijing, China, 2018. [Google Scholar]
- Liu, B.B.; Kang, F.X.; Liu, X.; Shi, Q.M.; Zheng, T.T.; Qin, P.; Gao, Z.J. Constraint of thermal breakthrough on rational well spacing of karst thermal reservoir: A case study of Heze geothermal field. Acta Geol. Sin. 2024, 98, 3149–3168. [Google Scholar]
- Kang, F.X.; Zheng, T.T.; Shi, M.; Sui, H.B.; Xu, M.; Jiang, H.Y.; Zhong, Z.N.; Qin, P.; Zhang, B.J.; Zhao, J.C. Occurrence rules and enrichment mechanism of geothermal resources in Shandong Province. Front. Earth Sci. 2024, 31, 67–94. [Google Scholar]
- Kang, F.X.; Ma, Z.M.; Shi, Q.P.; Liu, X.; Huang, H.W. Renewable capacity of Karst geothermal water and production-reinjection balanced resources evaluation: A case study of Heze Buried Uplift geothermal fields. Earth Sci. 2023, 48, 1118–1137. [Google Scholar]
- Maloszewski, P.; Herrmann, A.; Zuber, A. Interpretation of Tracer Tests Performed in Fractured Rock of the Lange Bramke Basin, Germany. Hydrogeol. J. 1999, 7, 209–218. [Google Scholar] [CrossRef]
- Shook, G.M.; Shannon, L.; Wylie, A. Tracers and Tracer Testing: Design, Implementation, Tracer Selection, and Interpretation Methods; Idaho National Lab. (INL): Idaho Falls, ID, USA, 2004. [Google Scholar]
- Goldscheider, N.; Meiman, J.; Pronk, M.; Smart, C. Tracer Tests in Karst Hydrogeology and Speleology. Int. J. Speleol. 2008, 37, 27–40. [Google Scholar] [CrossRef]
- Aydin, H.; Balaban, T.Ö.; Bülbül, A.; Merey, Ş.; Tarcan, G. Determining the Most Representative Reservoir Model for the Shallow Depth Salihli Geothermal Reservoir in Turkey Using Tracer Test. Heat Mass Transf. 2022, 58, 1105–1118. [Google Scholar] [CrossRef]
- Shook, G.M. Systematic Method for Tracer Test Analysis: An Example Using Beowawe Tracer Data. In Proceedings of the Thirtieth Workshop on Geothermal Reservoir Engineering, Stanford, CA, USA, 31 January–2 February 2005. [Google Scholar]
- Ozen, T.; Bulbul, A.; Tarcan, G. Reservoir and Hydrogeochemical Characterizations of the Salihli Geothermal Fields in Turkey. In Proceedings of the Proceedings World Geothermal Congress, Bali, Indonesia, 25–30 April 2010; pp. 25–29. [Google Scholar]
- Pei, J.J.; Xie, Y.Q.; Zhang, C.; Ong, J.T. Tracing tests in corrosional hill area: A case study of Xinhua county, Hunan province. Corros. Sin. 2000, 4, 366–371. [Google Scholar]
- Sui, S.Q.; Yang, Z.B.; Zhao, Y.J.; Jia, Y.Y.; Su, Y.C.; Wang, Q.; Gao, F.; Ji, H.C.; Bao, Z.D. Evolution and main controlling factors of the Ordovician karst thermal reservoir in western Shandong-eastern Henan area. J. Palaeogeogr. 2023, 25, 1364–1378. [Google Scholar]

| Parameter | LGSY | SSC1 | SSC2 | SSC3 | SGGJ1 | SGGJ2 | SCGJ3 | YDC1 | YDC2 | |
|---|---|---|---|---|---|---|---|---|---|---|
| High drawdown | Water yield/m3/d | 109 | 120 | 121 | 127 | 100 | 89 | 120 | 115 | 123 |
| Drawdown/m | 18 | 28 | 57 | 8 | 69 | 54 | 46 | 37 | 39 | |
| Hydraulic conductivity/m/d | 5.32 | 1.71 | 1.07 | 6.72 | 0.08 | 0.46 | 1.27 | 1.45 | 1.45 | |
| Medium drawdown | Water yield/m3/d | 95 | 102 | 79 | 89 | 91 | 78 | 85 | 85 | 114 |
| Drawdown/m | 16 | 22 | 35 | 5 | 57 | 44 | 33 | 28 | 33 | |
| Hydraulic conductivity/m/d | 5.19 | 1.83 | 1.07 | 7.60 | 0.08 | 0.49 | 1.20 | 1.36 | 1.56 | |
| Low drawdown | Water yield/m3/d | 72 | 75 | 60 | 73 | 87 | 64 | 60 | 76 | 95 |
| Drawdown/m | 12 | 14 | 19 | 3 | 52 | 35 | 18 | 21 | 25 | |
| Hydraulic conductivity/m/d | 5.14 | 2.00 | 1.41 | 8.56 | 0.09 | 0.49 | 1.45 | 1.58 | 1.68 | |
| Average hydraulic conductivity/m/d | 5.1 | 2.0 | 1.4 | 8.6 | 0.1 | 0.5 | 1.5 | 1.6 | 1.7 | |
Disclaimer/Publisher’s Note: The statements, opinions and data contained in all publications are solely those of the individual author(s) and contributor(s) and not of MDPI and/or the editor(s). MDPI and/or the editor(s) disclaim responsibility for any injury to people or property resulting from any ideas, methods, instructions or products referred to in the content. |
© 2025 by the authors. Licensee MDPI, Basel, Switzerland. This article is an open access article distributed under the terms and conditions of the Creative Commons Attribution (CC BY) license (https://creativecommons.org/licenses/by/4.0/).
Share and Cite
Jia, Y.; Li, K.; Du, L.; Zhu, C.; Gao, F.; Cui, L.; Shen, Y.; Fu, H. Tracing Experiments and Flow Characteristic Analyses in Carbonate Geothermal Reservoirs: A Case Study of the Juancheng Geothermal Field, North China. Water 2025, 17, 1677. https://doi.org/10.3390/w17111677
Jia Y, Li K, Du L, Zhu C, Gao F, Cui L, Shen Y, Fu H. Tracing Experiments and Flow Characteristic Analyses in Carbonate Geothermal Reservoirs: A Case Study of the Juancheng Geothermal Field, North China. Water. 2025; 17(11):1677. https://doi.org/10.3390/w17111677
Chicago/Turabian StyleJia, Yanyu, Kefu Li, Li Du, Chuanqing Zhu, Fei Gao, Long Cui, Yaorong Shen, and Haowei Fu. 2025. "Tracing Experiments and Flow Characteristic Analyses in Carbonate Geothermal Reservoirs: A Case Study of the Juancheng Geothermal Field, North China" Water 17, no. 11: 1677. https://doi.org/10.3390/w17111677
APA StyleJia, Y., Li, K., Du, L., Zhu, C., Gao, F., Cui, L., Shen, Y., & Fu, H. (2025). Tracing Experiments and Flow Characteristic Analyses in Carbonate Geothermal Reservoirs: A Case Study of the Juancheng Geothermal Field, North China. Water, 17(11), 1677. https://doi.org/10.3390/w17111677