Article

Spatiotemporal Evolution and Driving Factors of Groundwater in Beijing Sub-Center

1
School of Water Resources and Hydropower Engineering, North China Electric Power University, Beijing 102206, China
2
Guizhou Transmission and Transform Electricity Engineering Co., Ltd., Guiyang 550002, China
*
Author to whom correspondence should be addressed.
Water 2025, 17(11), 1668; https://doi.org/10.3390/w17111668
Submission received: 28 April 2025 / Revised: 22 May 2025 / Accepted: 29 May 2025 / Published: 30 May 2025

Abstract

:
Tongzhou District is the urban sub-center of Beijing, and the importance of groundwater resources is increasingly prominent. Based on groundwater level data from 1980 to 2020 and water usage data from various sectors in Tongzhou District between 2011 and 2020, this paper utilizes continuous wavelet transform (CWT), geostatistical models, and grey relational analysis (GRA) to explore the spatiotemporal evolution patterns and influencing factors of groundwater levels in Tongzhou District. The study reveals that the groundwater level evolution in Tongzhou District exhibits two primary cycles, and it predicts that the groundwater level at Liyuan Station will decrease and eventually rebound. From 1980 to 2020, the overall trend of groundwater levels in Tongzhou District showed a decline. However, the groundwater levels in the central and southern regions exhibited an upward trend from 2000 to 2020. The groundwater level is mainly influenced by spatial structural factors, with minimal impact from external random factors. Domestic water consumption, water usage in the tertiary sector, and industrial water usage have the greatest impact on groundwater levels, attributed to the rapid growth of the population and regional economy. Agricultural water usage has the least grey relational grade, which is related to changes in agricultural development planning in the study area, as well as reductions in the area of crop planting and the actual utilization area of facility agriculture.

1. Introduction

Groundwater is an important freshwater resource [1]. In recent years, global warming and frequent extreme rainfall events have significantly impacted groundwater recharge patterns [2], as precipitation is the primary source of recharge for most groundwater systems. This has led to significant fluctuations in the groundwater level in Tongzhou District, Beijing. Furthermore, Tongzhou District serves as the urban sub-center of Beijing, where rapid urbanization is underway [3], and water usage across various sectors has changed accordingly, increasing the importance of groundwater resources [4]. The combined effects of these factors have resulted in dramatic and dynamic changes in the groundwater level. Therefore, in order to better understand the spatiotemporal evolution of groundwater levels and the influencing factors in Beijing’s urban sub-center, this study systematically examines the spatiotemporal variation of groundwater levels in Tongzhou District from 1980 to 2020, as well as the impact of water usage by different sectors on groundwater levels. This research aims to provide technical support for the sustainable utilization of groundwater resources in Beijing’s urban sub-center.
The study of temporal variation characteristics of groundwater levels is based on long-term groundwater level time series, from which trends can be identified to predict future changes. Wavelet analysis, as a time-frequency localization method, enables the extraction of non-stationary and stochastic signal features in hydrological time series. It can accurately reveal both the time-frequency characteristics of a single time series and the cross-correlation relationships between multiple time series in the time-frequency domain [5]. In previous studies, some scholars have combined continuous wavelet transform with cross-wavelet transform and wavelet coherence methods to analyze the multi-time scale variation characteristics of groundwater levels and the correlation with influencing factors of groundwater levels [6,7,8]. Other researchers have combined independent component analysis with continuous wavelet transform to quantify the impact of natural driving factors on the spatiotemporal evolution of groundwater head [9]. Additionally, some scholars proposed a physically constrained wavelet-assisted statistical model for predicting groundwater dynamics and analyzing the correlation between precipitation and groundwater levels [10].
With the continuous exploitation of groundwater, the dynamic changes in groundwater in Tongzhou District have become more pronounced. Against the backdrop of increasing imbalances in water supply and demand, the use of CWT offers accurate predictions of groundwater level fluctuations and holds significant value for water resource management in the region. Although continuous wavelet and wavelet coherence analyses can effectively identify correlations between driving factors and groundwater levels, these methods typically assess only one factor at a time, making them cumbersome for analyzing multiple drivers simultaneously.
The studies of the spatial evolution of groundwater levels are based on the groundwater level data from different monitoring stations in the study area. Spatial interpolation methods are then used to obtain the spatial distribution of groundwater levels. Kriging interpolation, a geostatistical interpolation method, is a regression algorithm that spatially models and predicts random processes based on covariance functions. It is widely applied in various fields such as geosciences, meteorology, and environmental sciences for spatial interpolation of observational data, and is commonly used in groundwater level spatial interpolation as well [11]. In previous studies, some scholars have used various geostatistical interpolation methods, including Kriging interpolation, and compared the advantages, disadvantages, and accuracy of these methods through cross-validation [12,13]. Other researchers have combined the Kriging method with deep learning methods and machine learning models such as Gaussian process models to estimate the spatial distribution of groundwater levels and predict groundwater salinity [14,15]. Some scholars have studied the impact of sampling point density on the error of different groundwater level spatial interpolation methods [16]. Other researchers, when evaluating groundwater reserves, applied geostatistical interpolation methods to calculate water depth and chemical samples at observation points [17]. In studies on geostatistical interpolation of groundwater in Beijing, some scholars have used the Kriging interpolation method to investigate the variation of groundwater levels and nitrate nitrogen in the Mishunhuai area of Beijing from 2014 to 2019. Other researchers have combined Kriging interpolation with the XGBoost model to analyze the spatiotemporal evolution of groundwater depth and its influencing factors in Beijing from 2018 to 2023 [18,19].
Currently, in both domestic and international research on Kriging spatial interpolation of groundwater, studies often compare various interpolation methods and incorporate emerging artificial intelligence technologies. Existing studies on the spatial interpolation of groundwater levels in Beijing have analyzed the spatiotemporal evolution patterns of groundwater levels in the city, providing valuable insights. However, these studies are limited by short groundwater level time series and sparse sampling point density, which affects the accuracy of spatial interpolation. Therefore, this paper conducts a geostatistical spatial interpolation study based on groundwater level data from 26 monitoring stations in Tongzhou District from 1980 to 2020, yielding higher precision interpolation results and revealing the groundwater spatial evolution patterns at a more macro temporal scale.
The analysis of relevant influencing factors is an important part of groundwater dynamic analysis. Currently, research in this area mainly focuses on the impacts of hydrogeological conditions, climate change, land use change, groundwater extraction, and the correlation between surface water and groundwater. Some scholars have combined the grey relational analysis and path analysis methods to analyze the relevant influencing factors of groundwater levels, with the irrigation area of cultivated land showing the highest correlation [20]; other researchers have used principal component analysis and grey relational analysis to study the influencing factors of groundwater levels, concluding that the correlation between extraction factors and evaporation factors is the highest [21]; some scholars have used grey relational analysis to identify and rank the driving factors of groundwater levels in the North China Plain, finding that groundwater extraction has the greatest impact on groundwater levels [22]. Additionally, some researchers have concluded through grey relational analysis that the main factors affecting groundwater levels in the lower reaches of the Yellow River are river flow and river water levels [23]. It can be seen that the grey relational analysis (GRA) method is widely used in the analysis of factors influencing groundwater levels. Its calculation is simple, and it can simultaneously rank the impact of different driving factors, making it suitable for analyzing the effects of multiple driving factors on groundwater levels.
In the existing research on the spatiotemporal evolution patterns and driving factors of groundwater levels in Tongzhou District, there are issues such as short time series and insufficient sampling point density, as well as a lack of studies on groundwater driving factors that are valuable for water resource optimization. Therefore, this study uses the groundwater level time series from 26 monitoring points in Tongzhou District from 1980 to 2020, providing a longer time series and higher sampling point density, which enables a more accurate understanding of the spatiotemporal evolution patterns of groundwater levels. Additionally, human activity factors, such as water use by various departments and GDP, are incorporated into the analysis of groundwater driving factors, offering technical support for the optimized allocation of water resources in Tongzhou District.
Under the conditions of long-term groundwater extraction and the rapid construction of the Beijing urban sub-center, the groundwater levels in Tongzhou District exhibit uneven spatial changes. In some areas, groundwater levels have risen, while in others they continue to decline. Additionally, groundwater levels are significantly influenced by extreme precipitation, resulting in noticeable changes on a temporal scale. On the one hand, studying the spatiotemporal evolution patterns of groundwater levels helps to understand the trends of groundwater level changes and the status of groundwater resources, which is crucial for assessing the sustainability of groundwater resource utilization. On the other hand, analyzing the impact of external factors on groundwater levels is a key element in regional water resource management. Only by analyzing the evolution trends of groundwater levels and related influencing factors can we effectively and reasonably regulate the different factors affecting groundwater levels, thereby improving water resource utilization efficiency.
This paper is based on continuous wavelet transform, grey relational analysis, and geostatistical models in ArcGIS 10.2 to systematically analyze the spatiotemporal evolution patterns and influencing factors of groundwater levels at 26 monitoring stations in the sub-center of Beijing from 1980 to 2020 (with measurements taken every 5 days). The findings are as follows: (1) Continuous wavelet transform was used to analyze groundwater level data, studying the temporal evolution patterns of groundwater levels in Tongzhou District across multiple time scales. (2) Based on the geostatistical model, suitable interpolation models and variogram models for each groundwater index were selected to investigate the block effect of groundwater levels and analyze the spatial variation intensity and causes. (3) Grey relational analysis was applied to examine the correlation between the water use volume of various departments, the driving factors of water use by these departments, and the groundwater levels, analyzing the uncertainty effects of departmental water use on groundwater levels.
Beijing primarily relies on groundwater as its main water source, and the long-term excessive extraction of groundwater has been a concern. Tongzhou District, as the urban sub-center of Beijing, plays a crucial role in sharing the capital’s urban functions and holds significant strategic importance. Against the backdrop of accelerating infrastructure transformation and frequent extreme precipitation events, the groundwater levels in Tongzhou District have undergone notable changes. The evolution of groundwater levels is closely related to water security and ecological safety. Therefore, studying groundwater level changes and driving factors in Tongzhou District allows for the quantitative analysis and assessment of the current status of groundwater resources, providing valuable references for regional water resource allocation.

2. Materials and Methods
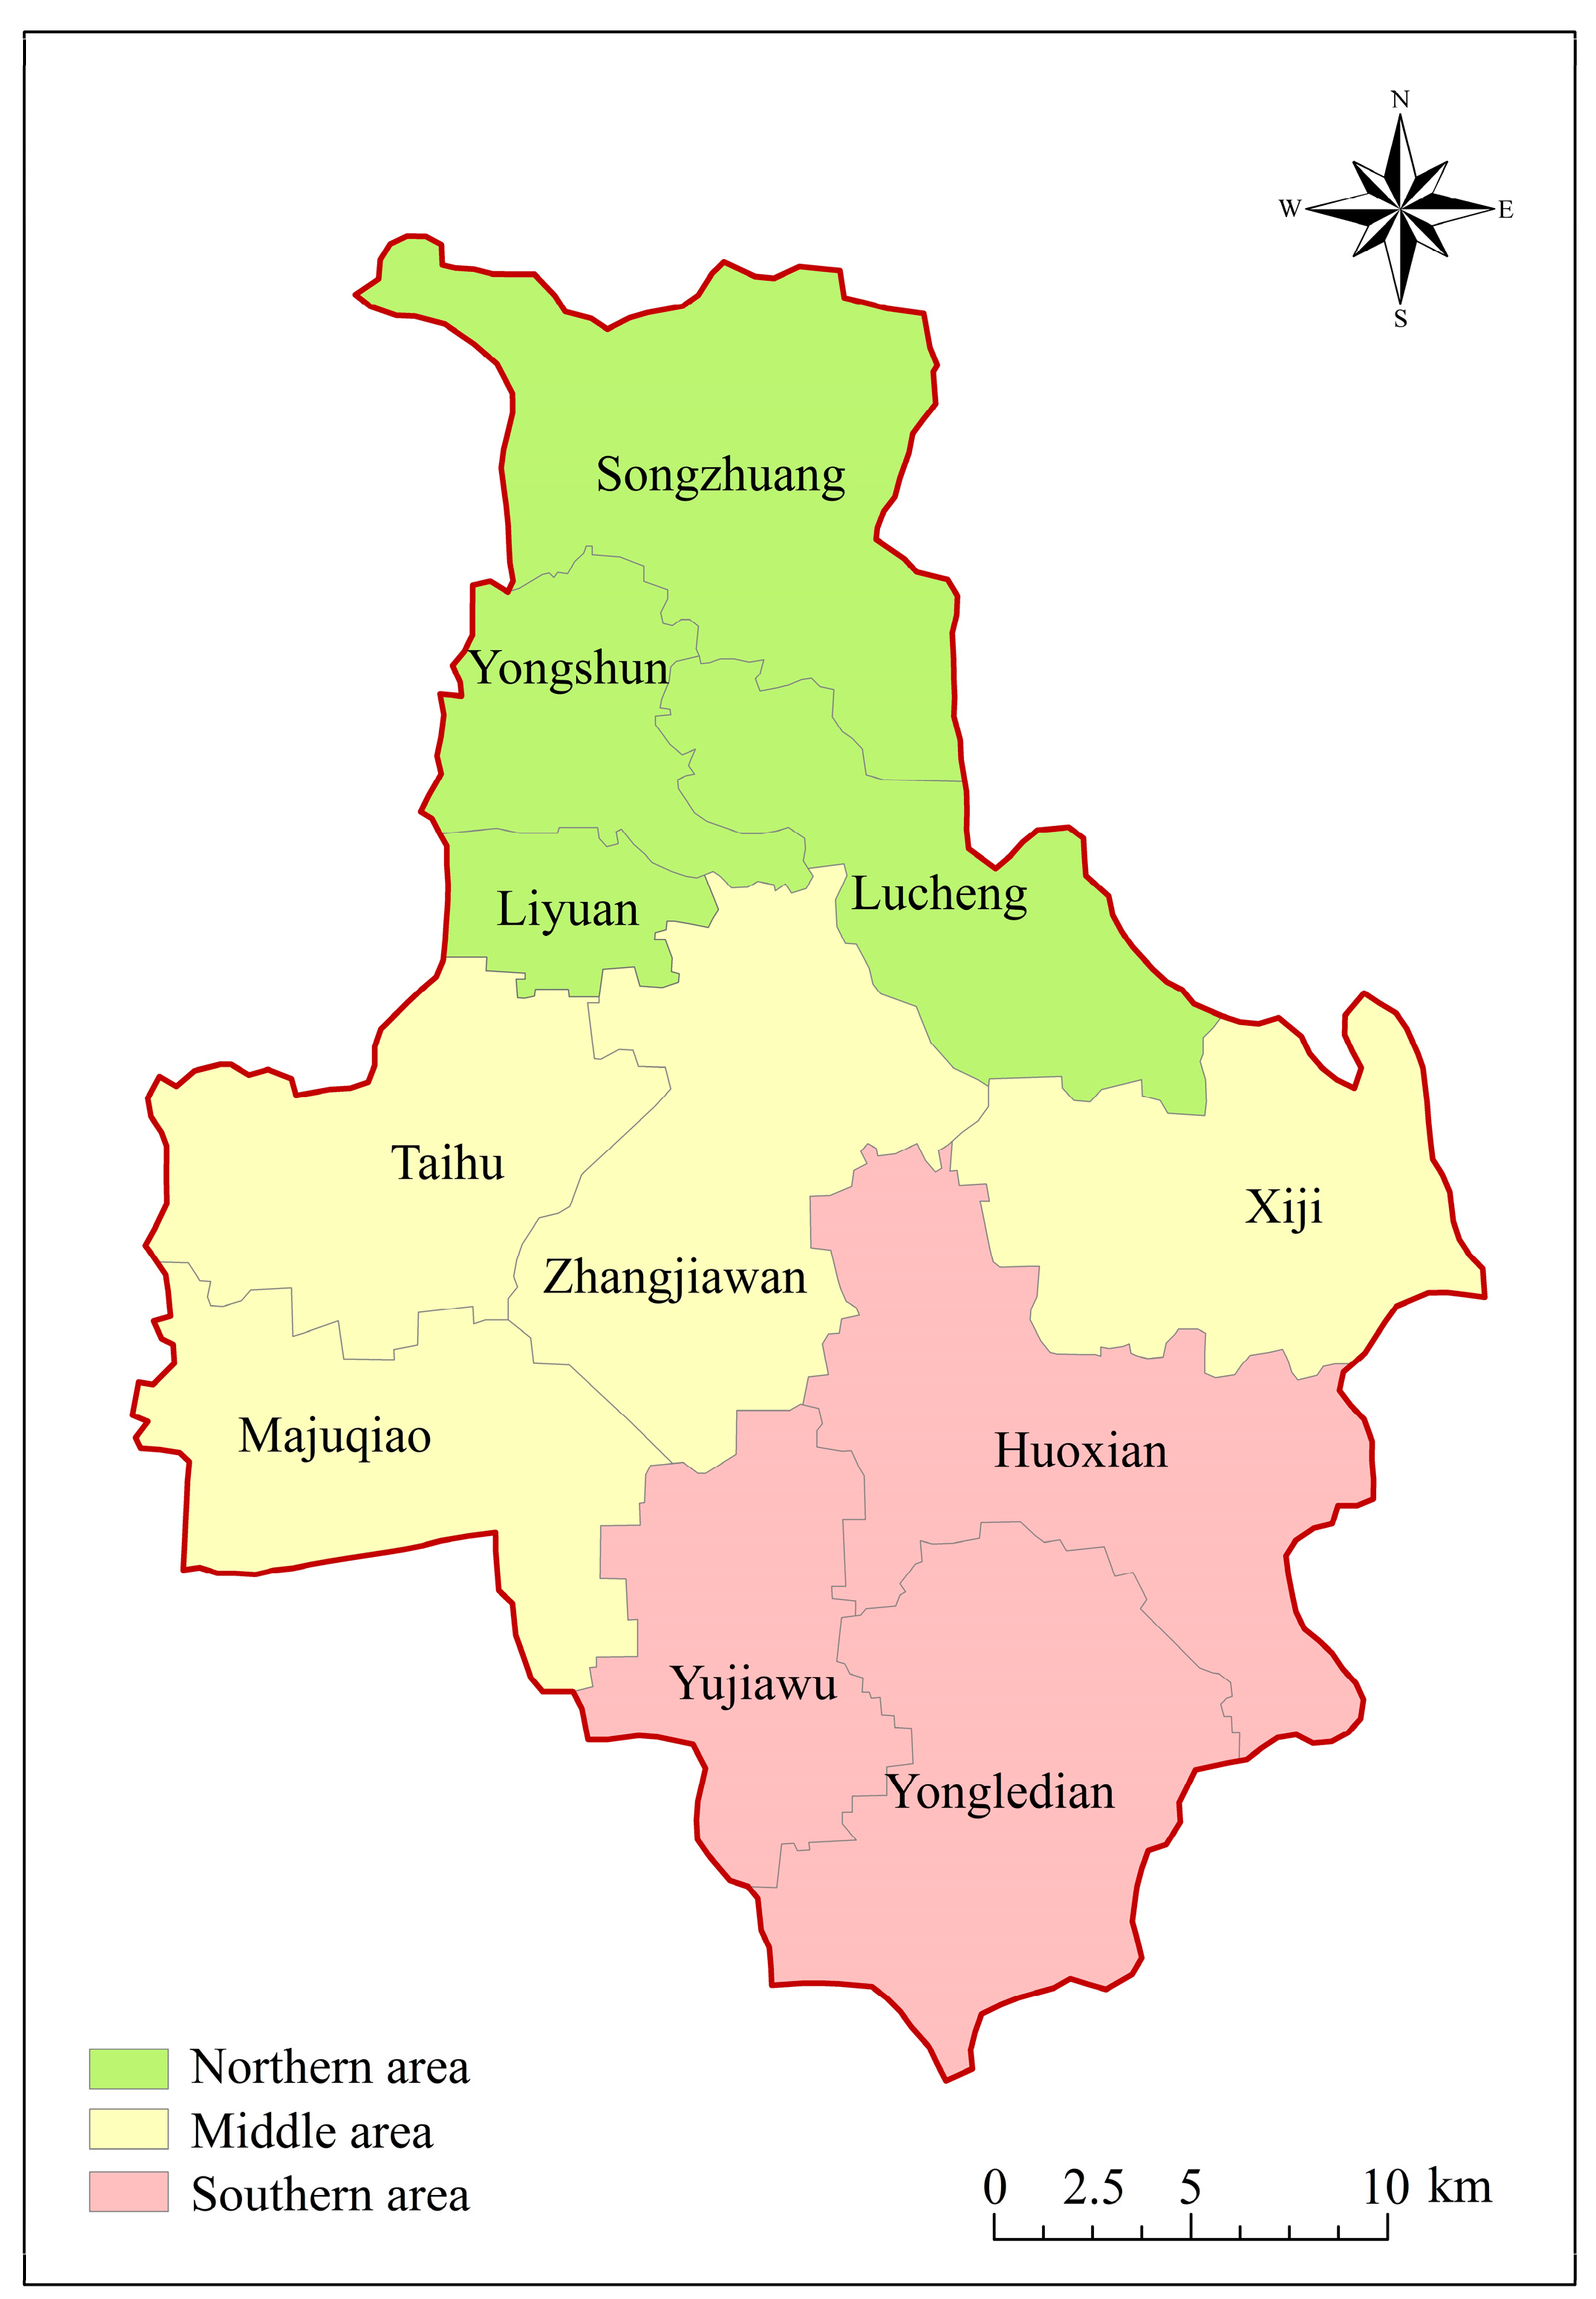
2.1. Study Area

The sub-center of Beijing (Tongzhou District) is located in the southeastern part of the Beijing Plain, at the northern end of the Grand Canal, and lies in the middle and lower parts of the alluvial fans of the Chaobai River and Yongding River. It borders the Chaoyang, Daxing, and Shunyi districts. Its geographical coordinates are between 39°36′–40°02′ N and 116°32′–116°56′ E, with a total area of approximately 906 km2 (Figure 1). The permanent population is 1.845 million (as of the end of 2023). The district administers four subdistricts and 11 towns. Tongzhou District is located in the warm temperate continental semi-humid monsoon climate zone [24], with an average annual temperature of 11.3 °C and an average annual precipitation of about 546.8 mm [25]. Precipitation is concentrated in the summer months, particularly July and August (Figure 2). The topography of Tongzhou is generally flat, with a slope from northwest to southeast, with elevations ranging from 1 to 69 m. The district is home to 13 rivers, with a total length of 245.3 km. The main rivers include the North Canal, Chaobai River, Liangshui River, and Fenggangjian River.
The entire Tongzhou District is covered by Quaternary deposits, consisting of clay and sand layers. The region is characterized by alternating layers of sand, gravel, and clay, with more sand aquifers, and the clay layers between the sand are thin and discontinuous. Overall, the thickness of the Quaternary sediments gradually increases from west to east, and the aquifers are composed of clay and sand layers, exhibiting a multi-layered structure with alternating sand and clay layers [26].
The groundwater is mainly composed of pore water from loose Quaternary sediments, such as those deposited by the Chaobai River and Yongding River alluvial fans. The aquifer consists mainly of multi-layered sand layers, including medium sand, fine sand, silt, and clay, with gravel deposits in the northern part. The primary recharge sources for the groundwater include atmospheric precipitation, river and canal infiltration, runoff inflow, and irrigation return flow [27]. The flow direction is mainly controlled by the topography, flowing from the north and northwest to the southeast. The groundwater discharge in the region is mainly due to agricultural irrigation, urban water usage, and industrial and agricultural water extraction, as well as evaporation and lateral runoff [28].
The groundwater level data from 1980 to 2020 and the water usage data from various sectors used in this study are sourced from the Beijing Water Affairs Bureau.

2.2. Method

2.2.1. Continuous Wavelet Transform (CWT)

Wavelet transform can be divided into two categories: one is the discrete wavelet transform, which is suitable for signal denoising and data compression, and the other is the continuous wavelet transform, which is suitable for signal feature extraction [29]. This study uses the continuous wavelet transform. For a continuous function f(x), its continuous wavelet transform is given by
W f ( a , b ) = 1 a R f ( t ) ψ ¯ ( t b a ) d t
In the formula, W f ( a , b ) represents the wavelet transform coefficients, where a is the scale factor, b is the translation factor, and Ψ ¯ ( t b a ) is the complex conjugate of Ψ ( t b a ) .
The choice of the mother wavelet function is a prerequisite for continuous wavelet transform. Commonly used mother wavelets such as the Mexican hat wavelet, Haar wavelet, Morlet wavelet, and Meyer wavelet can all serve as the mother wavelet function. In this study, the Morlet wavelet is chosen as the mother wavelet function because it provides a good balance in the local time-frequency domain. Additionally, as a complex wavelet, it can capture both phase and amplitude information of the time series [30].
The wavelet variance can determine the dominant period in the time series. The calculation formula is as follows:
V a r ( a ) = | W f ( a , b ) | 2 d b
In the formula, V a r ( a ) denotes the wavelet variance, and W f ( a , b ) represents the signal function.

2.2.2. Geostatistical Model

The geostatistical model, also known as Kriging interpolation, is an interpolation method based on spatial autocorrelation. It uses the original data and the structure of the semivariance function to provide unbiased estimation of unknown sampling points for regional variation. It can be further divided into ordinary Kriging, simple Kriging, universal Kriging, co-kriging, and others. This study, based on the ArcGIS 10.2 platform, employs the ordinary Kriging interpolation method to perform spatial interpolation analysis of groundwater level data [31].
The general formula for the semivariogram function in Kriging interpolation is as follows:
γ ( h ) = 1 2 N ( h ) i = 1 N ( h ) [ Z ( x i ) Z ( x i + h ) ] 2
In the formula, γ(h)—semivariogram function; N(h)—number of sample points; h—spatial distance between sample points; Z(xi)—variable value at position xi; Z(xi + h)—variable value at a distance h from position xi.
Selection of Optimal Interpolation Model: common semivariogram models include the Spherical Model, Exponential Model, and Gaussian Model [32]. In this study, the semivariogram function model is selected through cross-validation. The optimal model selection criteria are based on minimizing the mean prediction error (ME) closest to 0, minimizing the root mean square error (RMSE), and ensuring that the average standard error (ASE) is closest to the RMSE. The calculation formulas are as follows:
M E = 1 n i = 1 n [ z ( x i ) z ( x 0 i ) ]
A S E = 1 n i = 1 n σ [ z ( x i ) ]
R M S E = 1 n i = 1 n [ z ( x i ) z ( x 0 i ) ] 2
In the formula, n—number of monitoring points; z(xi)—predicted value at the i-th monitoring point; z(x0i)—measured value at the i-th monitoring point; σ[z(xi)]—prediction standard error.
The model with the smallest cross-validation error is selected as the one with the highest accuracy. The validation criteria include minimizing the mean error (ME), the root mean square error (RMSE), and ensuring that the average standard error (ASE) is minimal and close to the RMSE [33,34].
The nugget effect is defined as the ratio of the nugget value C0 to the sill value C0 + C, and is expressed as follows:
N E = C 0 / ( C 0 ) + C
The nugget effect reflects the degree of spatial correlation of a regionalized variable. Generally, when the nugget effect is <25%, it indicates strong spatial correlation; when 25% < nugget effect < 75%, it indicates moderate spatial correlation; and when the nugget effect > 75%, it indicates weak spatial correlation [35].

2.2.3. Grey Relational Analysis

Grey relational analysis (GRA) is an important mathematical method in modern geography. Essentially, it is a geometric comparison of the data series reflecting the variation characteristics of various factors [36]. The steps for calculating the grey relational grade are as follows [37]:
  • Let X′ = (x1, x2, …, xn) represent the series of the i-th influencing factor in the t-th period, and Y′ = (y1, y2, …, yn) represent the groundwater level series corresponding to the i-th influencing factor in the t-th period. To eliminate the effect of the dimension, the original data are normalized as follows:
X i = X i / ( 1 n i = 1 n X i )
Y i = Y i / ( 1 n i = 1 n Y i )
In the formula, Xi—the normalized value of the i-th influencing factor in the t-th period; i = 1, 2, …, n; Yi—the normalized value of the i-th influencing factor’s corresponding groundwater level in the t-th period, m.
2.
Calculate the maximum and minimum absolute differences between the corresponding values in the two series:
Δ max = max { | X i Y i | }
Δ min = min { | X i Y i | }
3.
Calculate the grey relational coefficient:
ξ i ( t ) = Δ min + ρ Δ max | X i Y i | + ρ Δ max
In the formula, ξi(t)—the grey relational coefficient of the i-th influencing factor in the t-th period; ρ—distinguishing coefficient, where 0 < ρ < 1, typically taken as ρ = 0.5.
4.
Compute the grey relational grade:
γ i = 1 n i = 1 n ξ i ( t )
In the formula, γi—the grey relational grade of the i-th influencing factor.
This paper uses the Kriging interpolation method in geostatistical interpolation to analyze the spatial distribution and temporal variability of groundwater in Tongzhou District. Continuous wavelet transform is employed to explore the periodic patterns of groundwater levels in Tongzhou District at different time scales. The grey relational analysis method is used to investigate the correlation between the groundwater level series and the water consumption of various departments in Tongzhou District, identifying external factors that influence groundwater levels.

3. Results

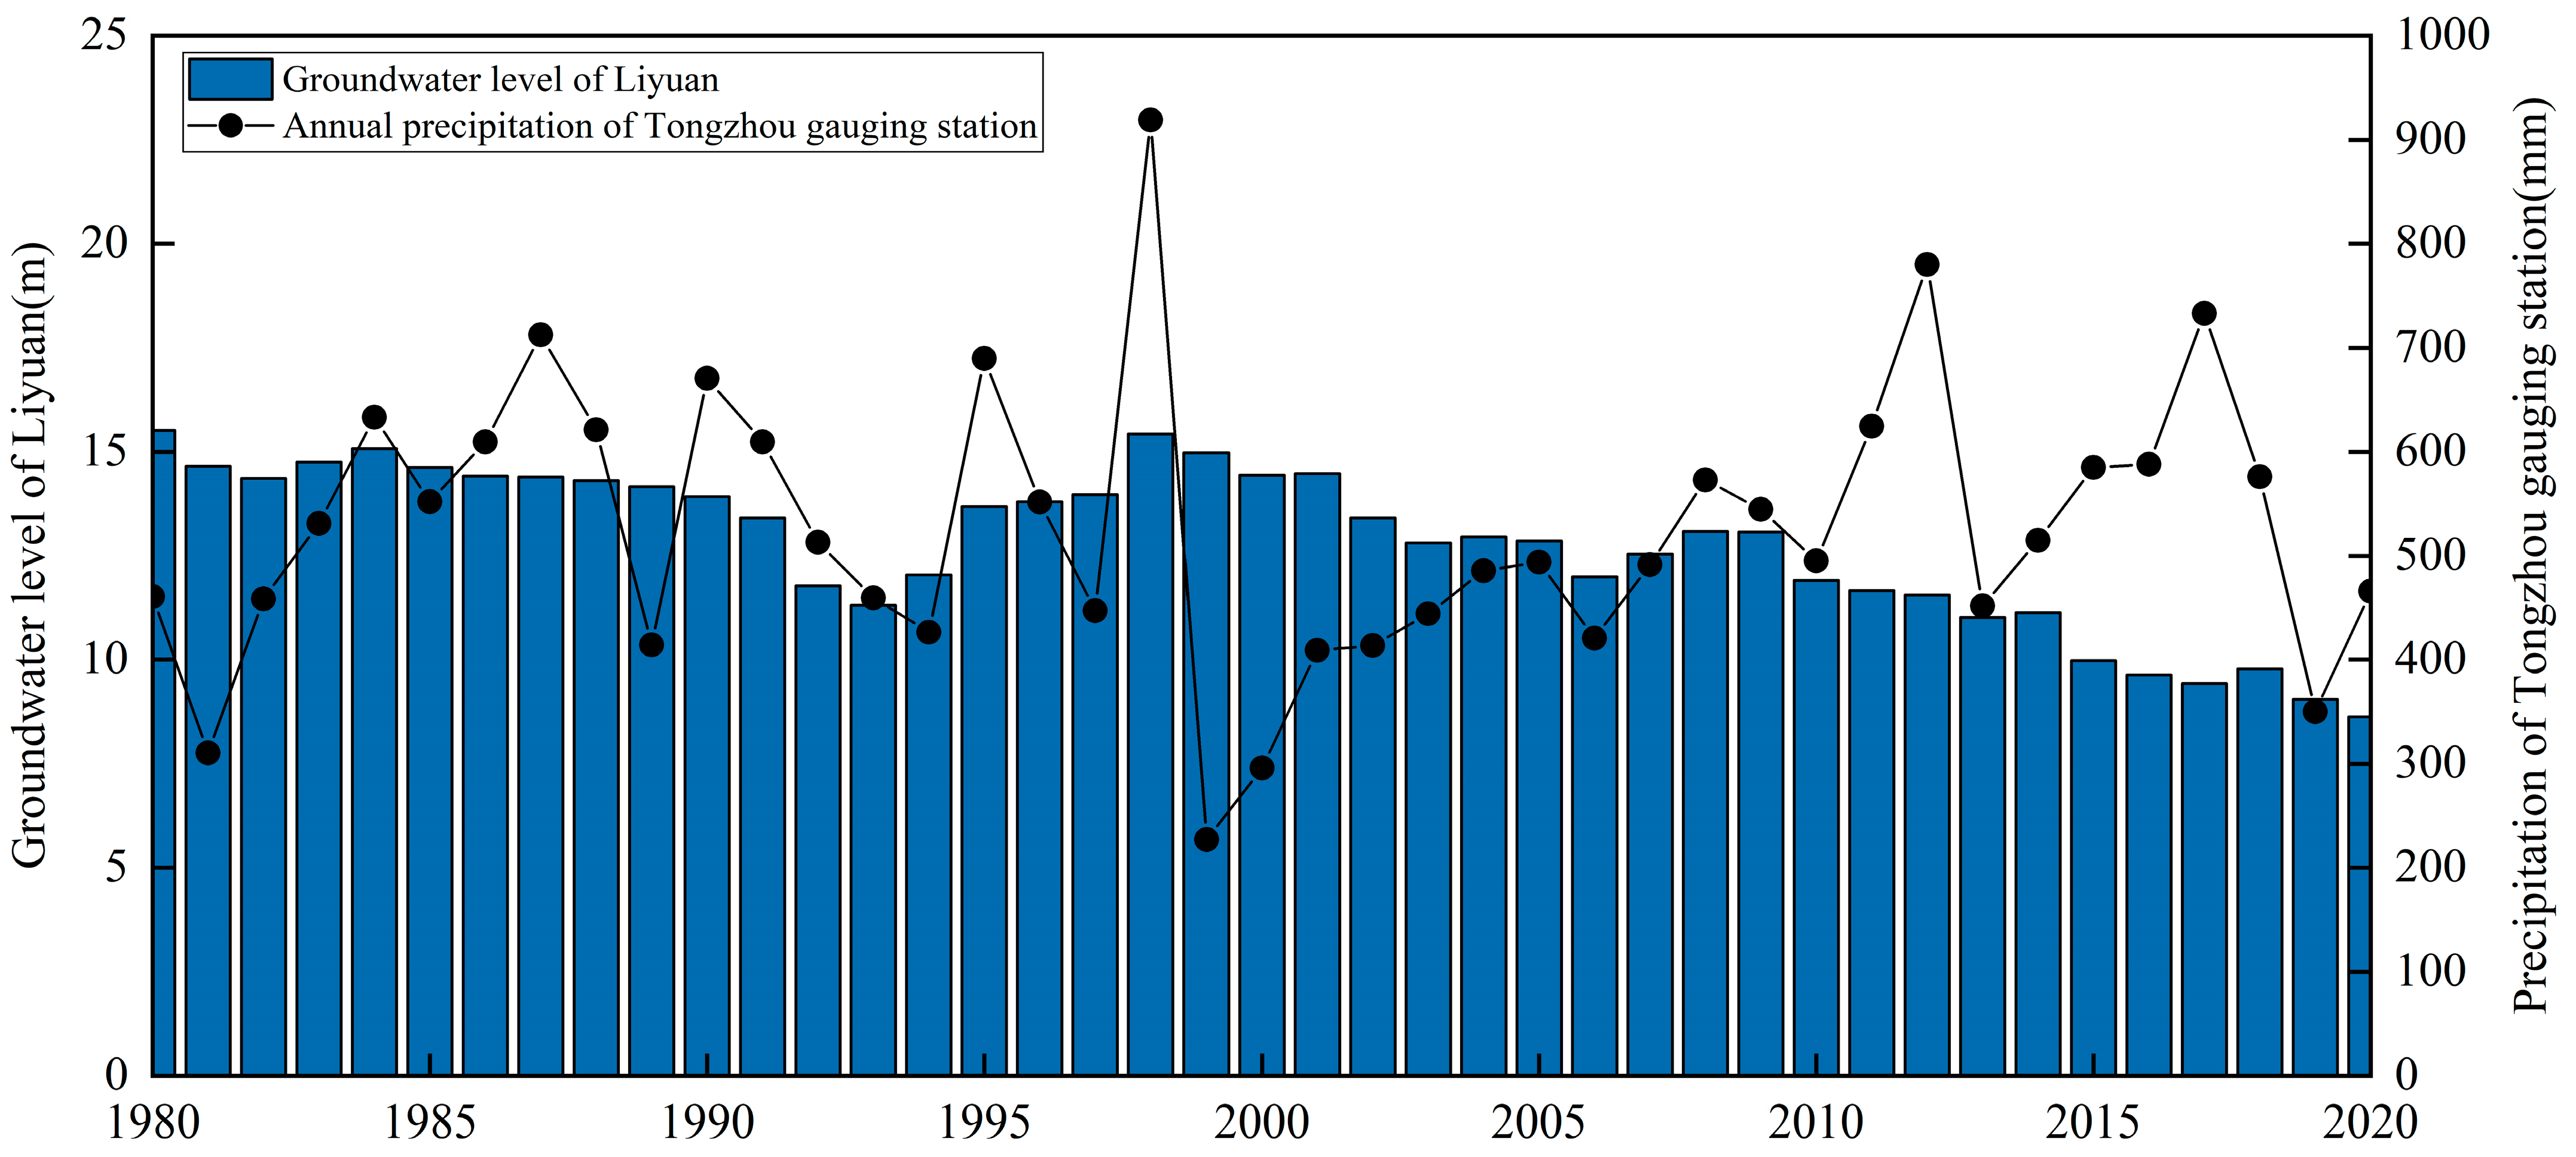
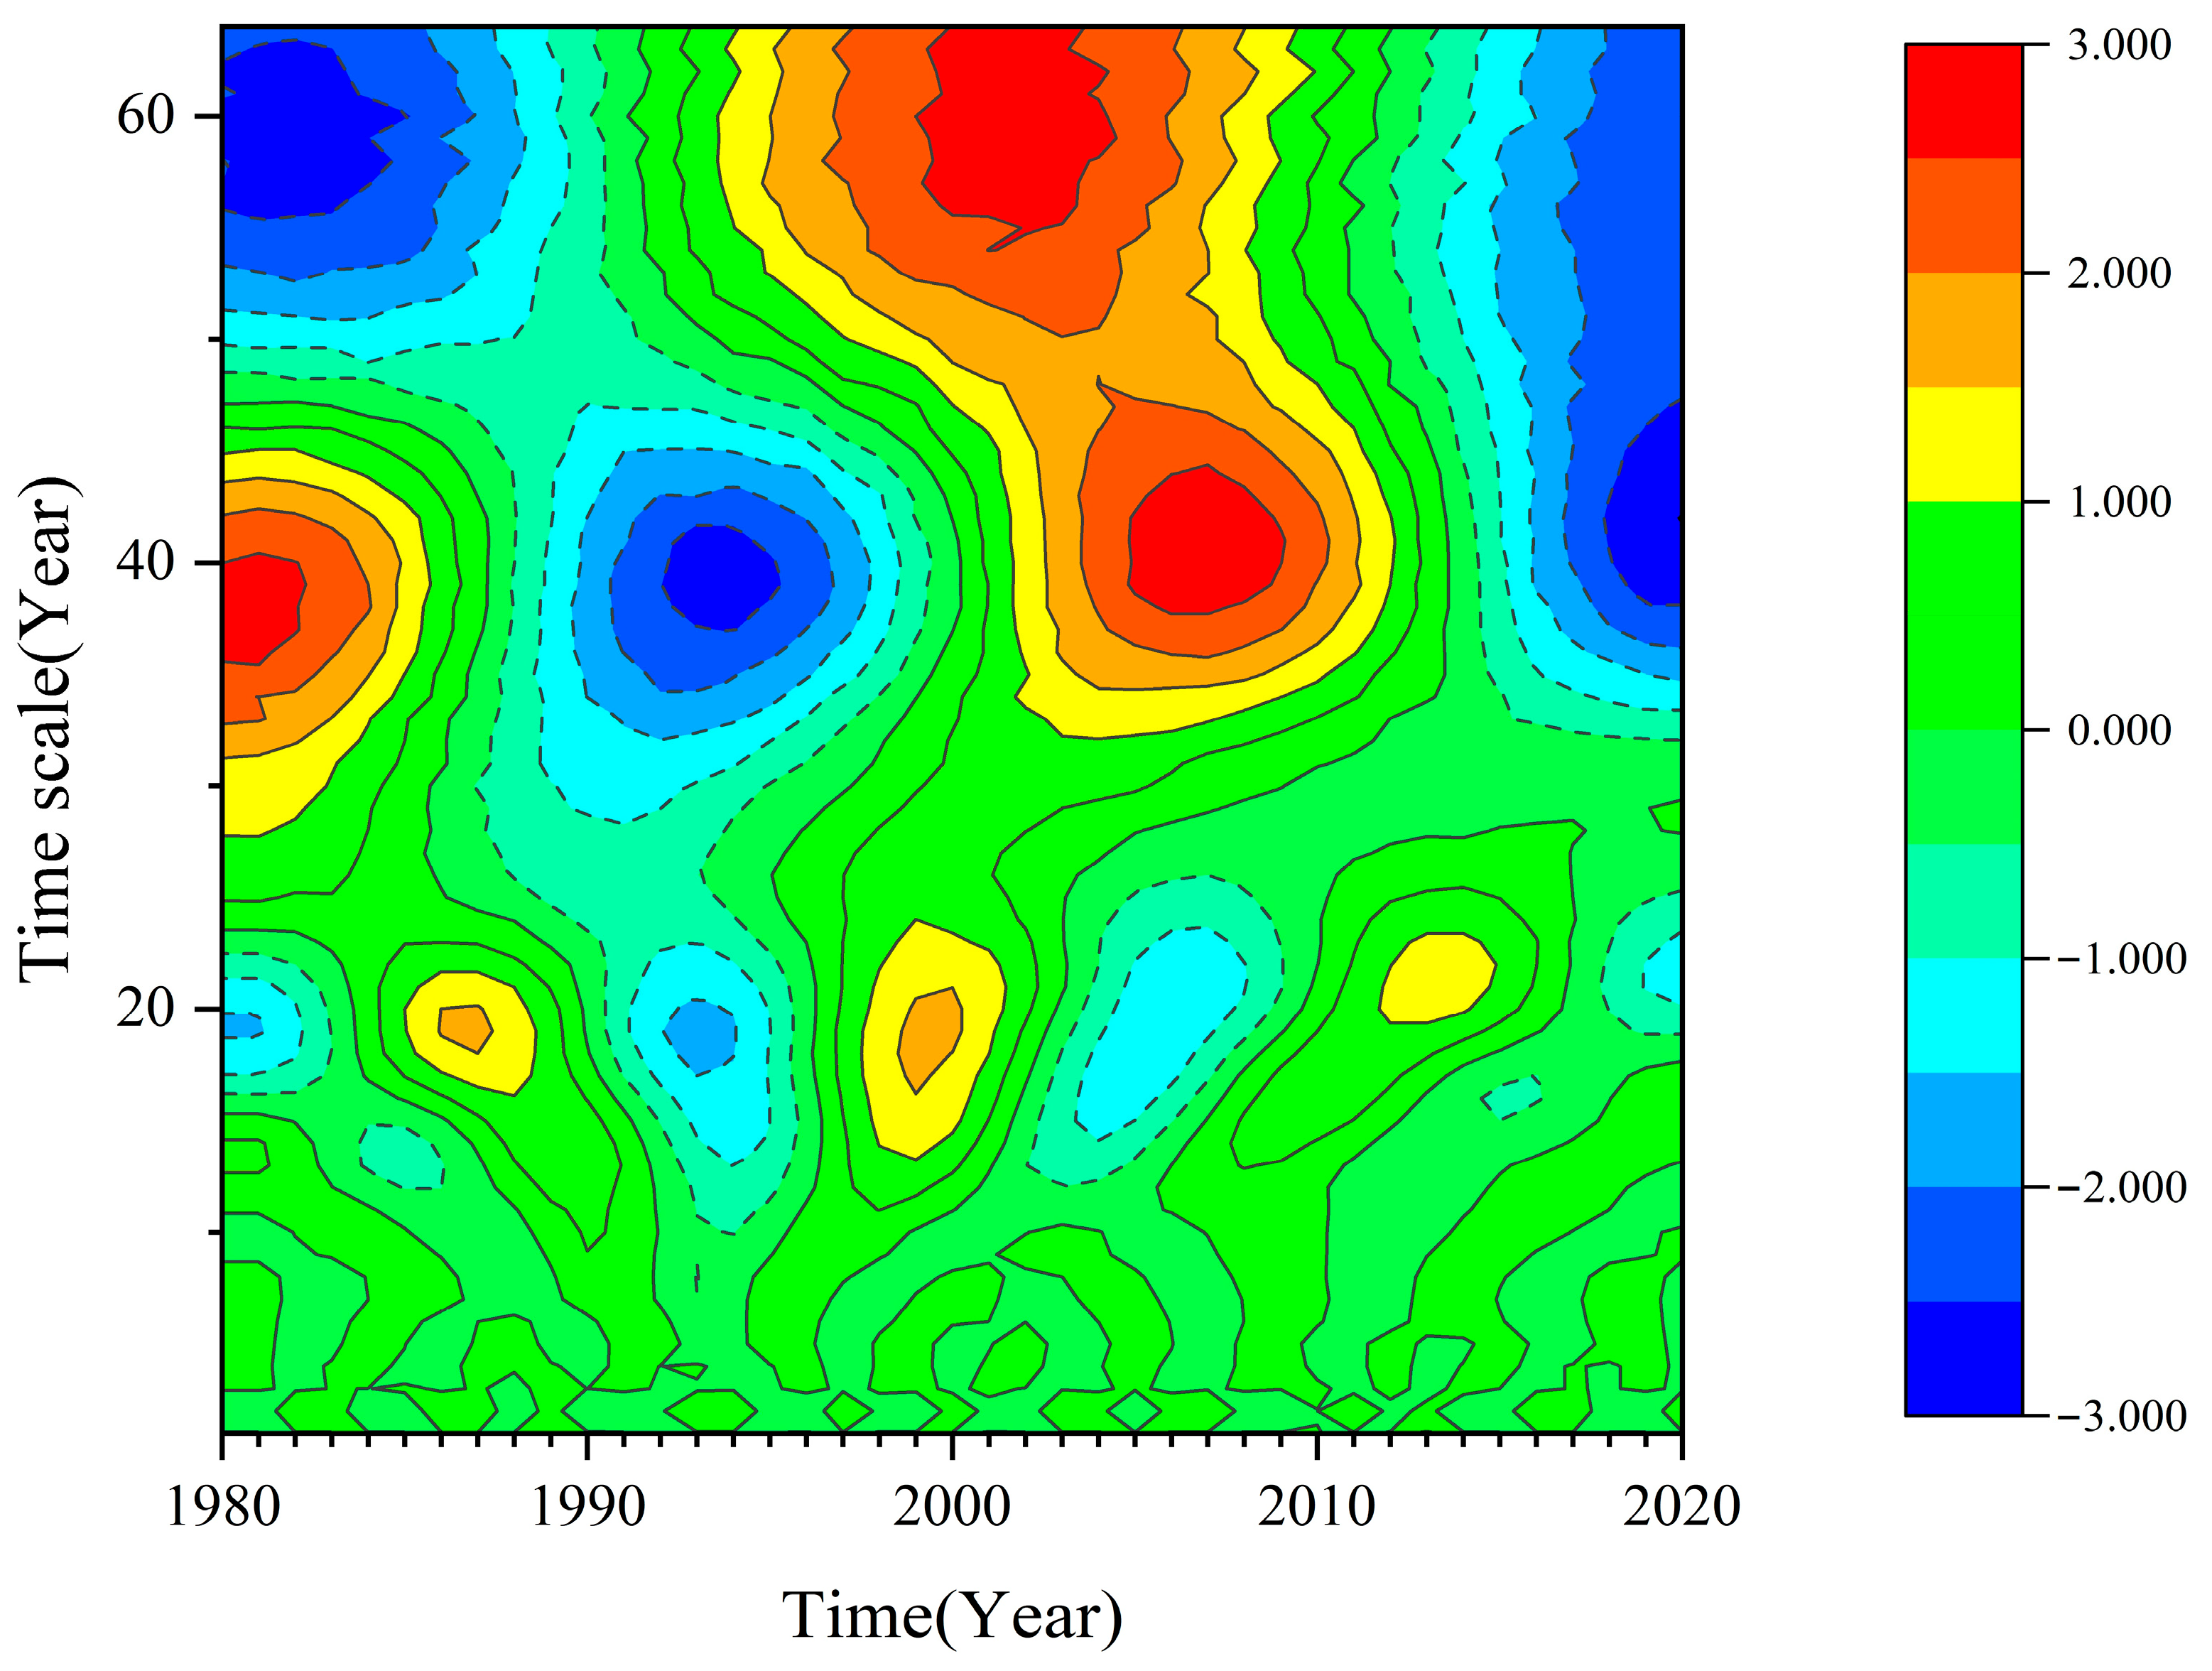
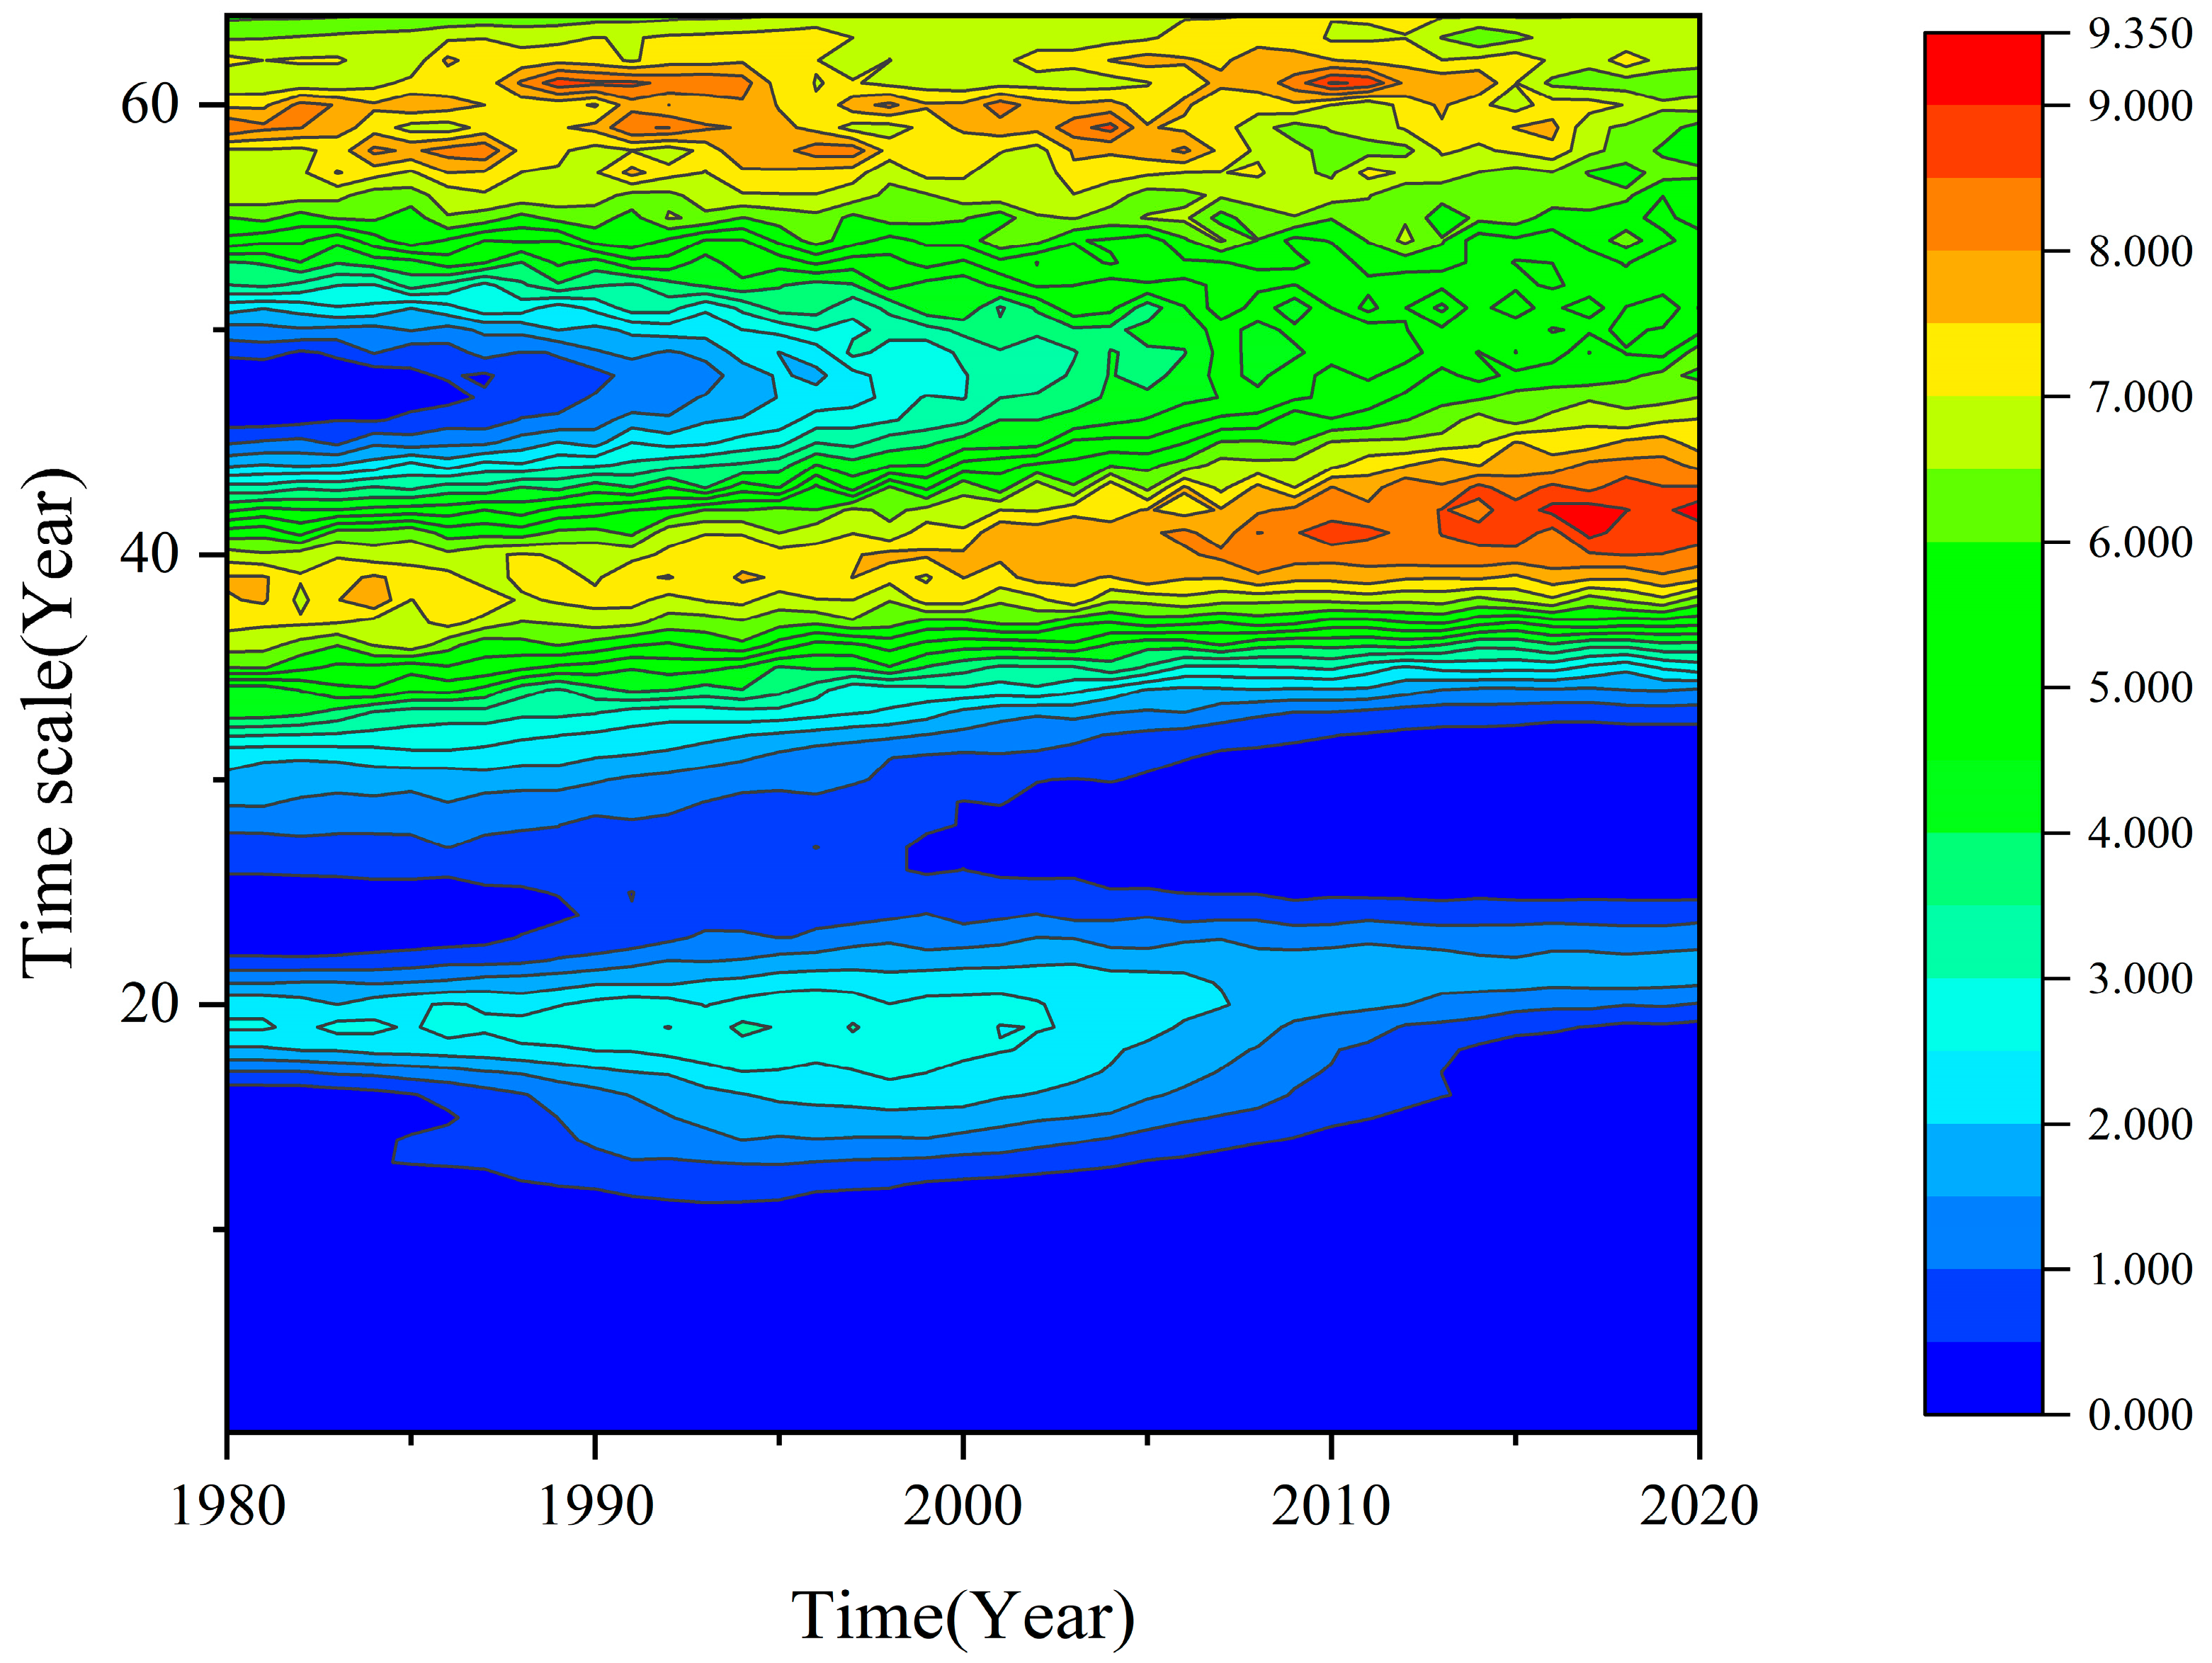
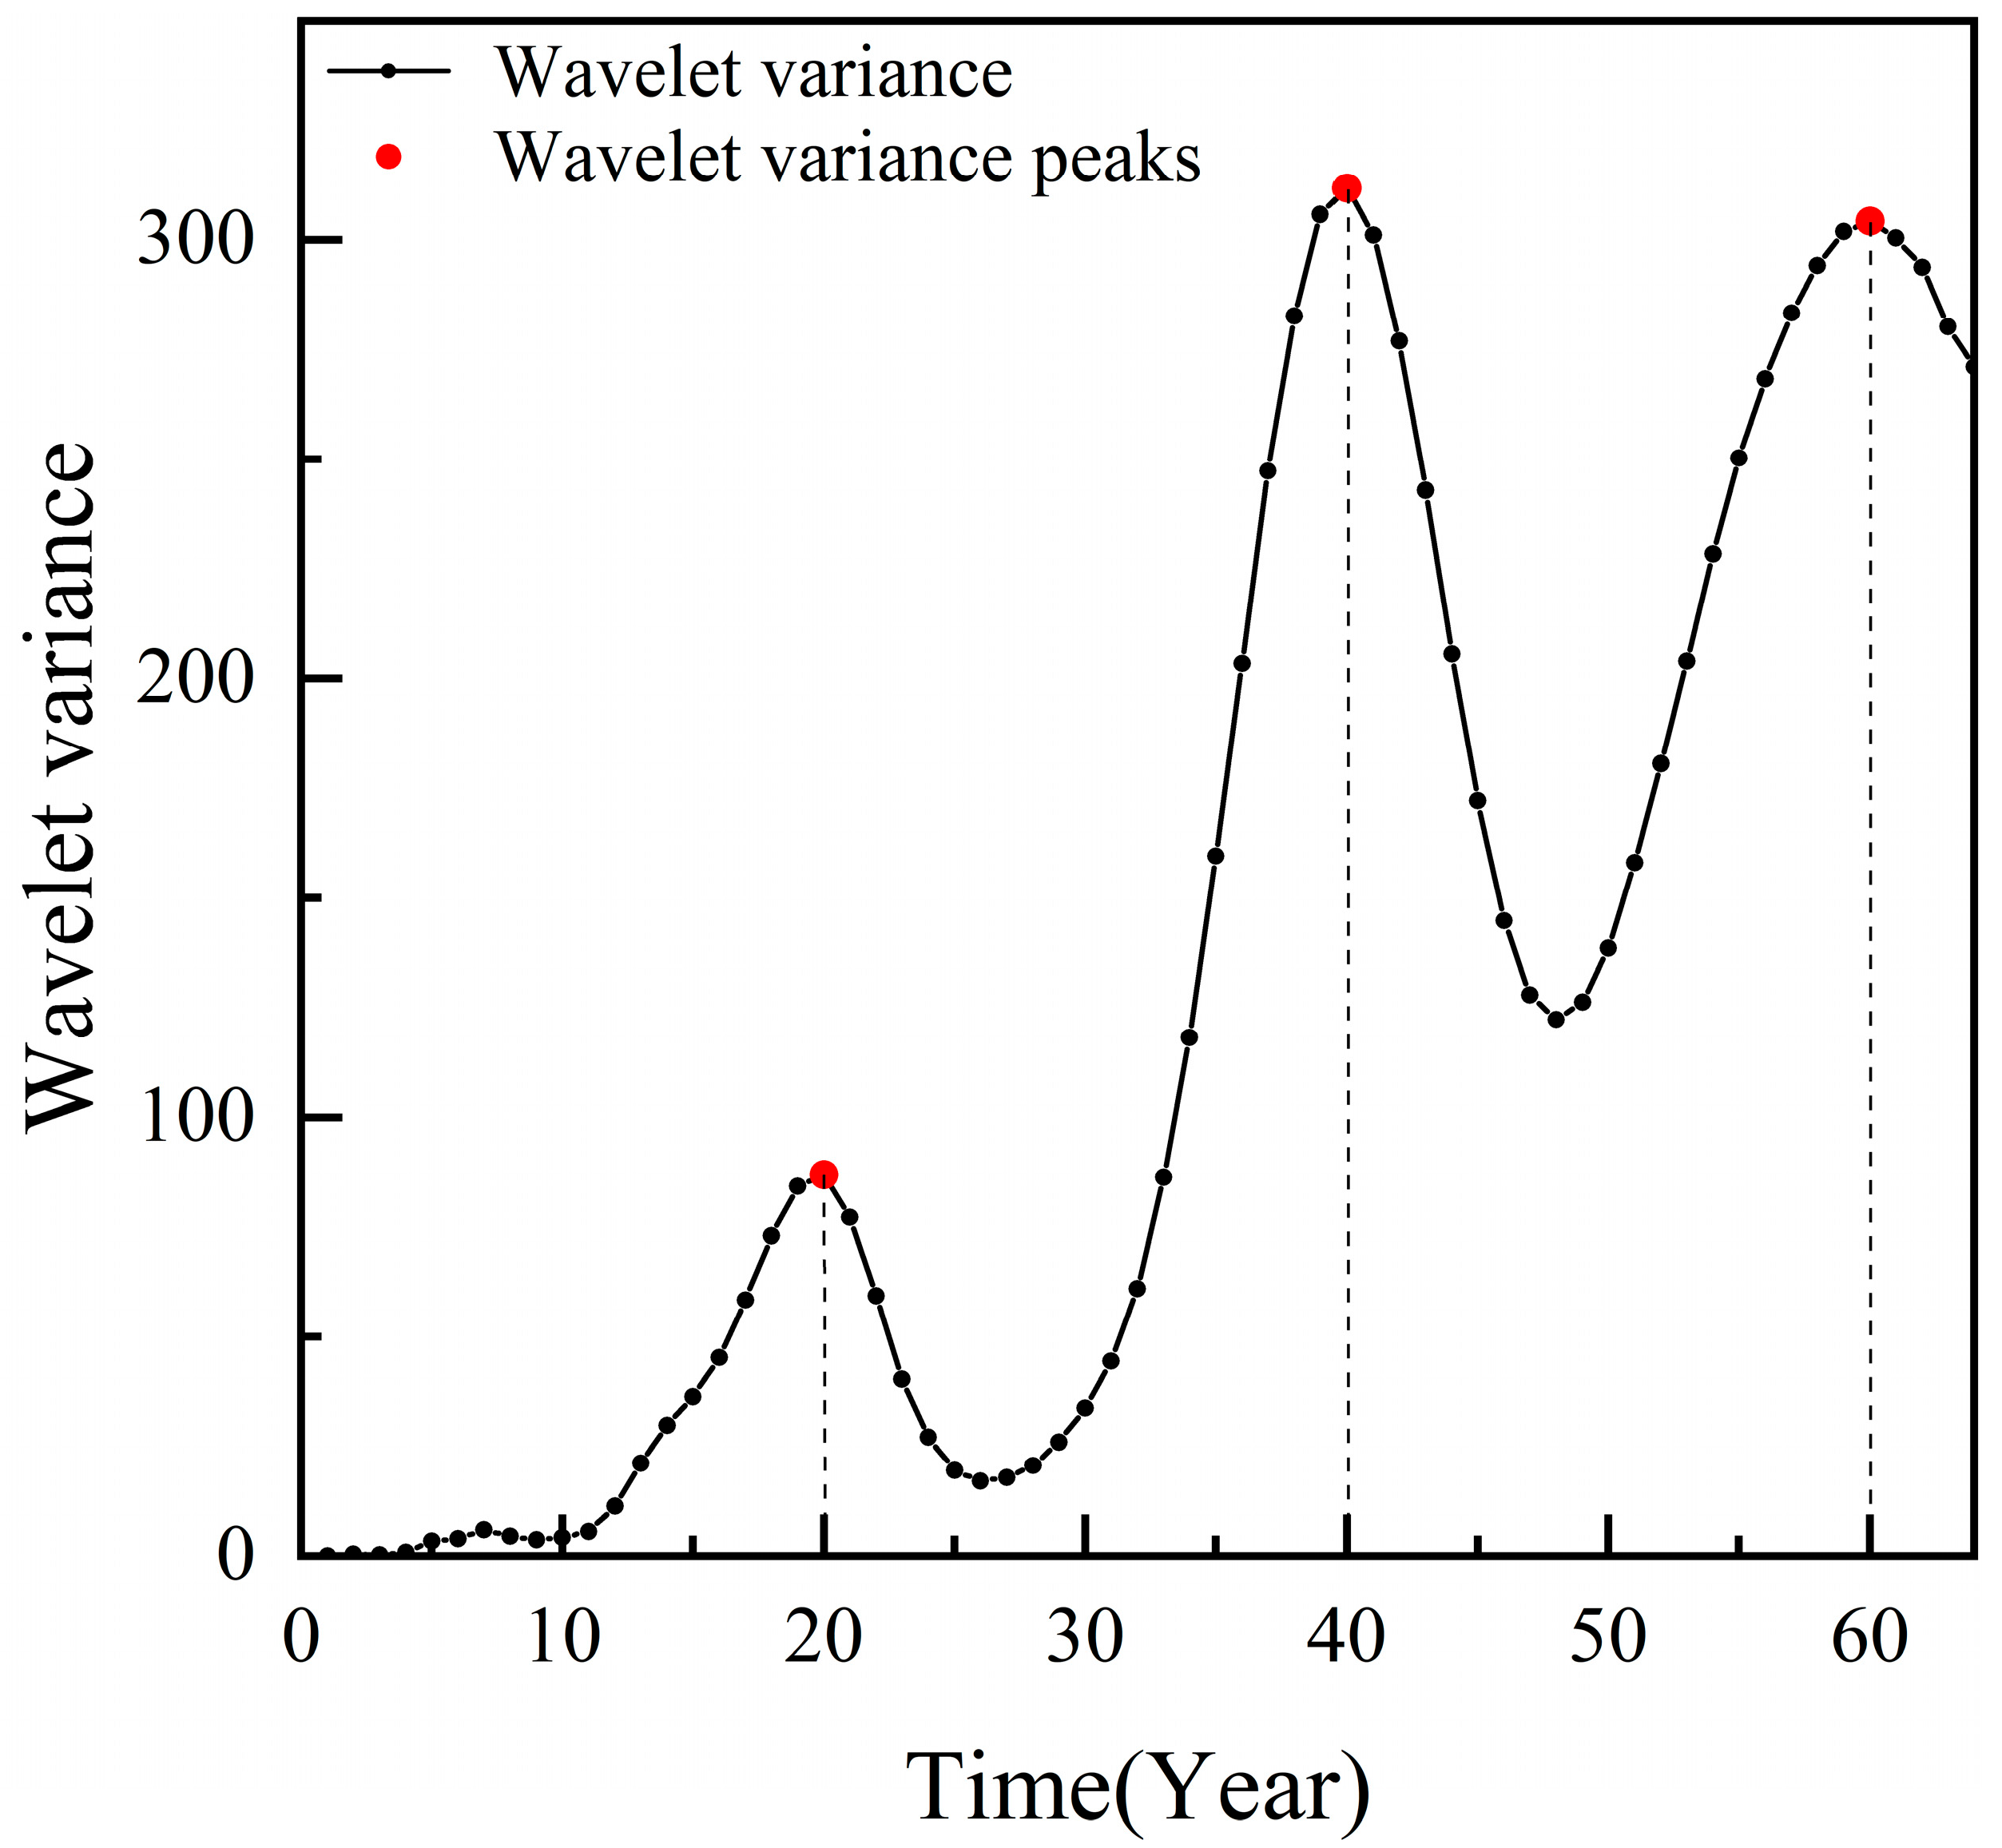
3.1. Continuous Wavelet Transform of Groundwater Level

To analyze the periodic patterns of groundwater levels at different time scales in the study area, wavelet analysis is performed on the annual average groundwater levels from 1980 to 2020 at the Liyuan Station, a typical groundwater monitoring station in Tongzhou District, using the Morlet wavelet from the continuous wavelet transform method based on Matlab software (2018a). As shown in the contour map of the real part of the wavelet coefficients for the groundwater level in Figure 3, the groundwater level from 1980 to 2020 exhibits periodic variations at multiple characteristic time scales. The main periodic variations are observed at time scales of 50–64 years, 30–47 years, and 20 years. Among them, the 50–64-year time scale exhibits one full cycle of wet–dry oscillation across the entire region; the 30–47-year time scale exhibits one and a half cycles of wet–dry oscillation across the entire region; and the 20-year time scale shows multiple less distinct periodic variations with poorer regularity.
Figure 4 shows the contour map of the square modulus of the wavelet coefficients for the groundwater level series. As seen in Figure 4, the intensity distribution of the groundwater level from 1980 to 2020 at different time scales varies. The 30–47-year time scale has relatively strong energy and a more distinct periodic distribution, with its cycle showing a relatively uniform pattern across the entire region, becoming most noticeable after 2010. The energy at the 50–64-year time scale is relatively weak but still exhibits a global pattern. The 20-year time scale has weak energy and a more scattered and irregular periodic pattern.
Figure 5 shows the wavelet variance of the groundwater level at Liyuan Station. Three significant peaks are observed, corresponding to time scales of 60, 40, and 20 years. The peak at the 40-year time scale is the largest, with the longest oscillation period, corresponding to the primary period of groundwater level variations. The peaks at the 60-year and 20-year time scales gradually decrease, with the fluctuation energy also diminishing, corresponding to the second and third main periods of groundwater level variations, respectively. From the above analysis, it can be concluded that the groundwater level variations from 1980 to 2020 are dominated by three main periods at characteristic time scales of 60 years, 40 years, and 20 years.
Based on the results of the wavelet variance test, it can be seen that the wavelet variance value at the 40-year characteristic time scale is slightly larger than that at the 60-year characteristic time scale, and the energy fluctuation at the 20-year time scale is too small. Therefore, only the real part of the wavelet coefficients for the four main periods at the 40-year and 60-year characteristic time scales are plotted, as shown in Figure 6.
In the wavelet coefficient real part variation line, the sections less than 0 represent the dry period, while the sections greater than 0 represent the wet period, and the points where the value equals 0 are mutation points. As shown in Figure 6, the average cycle of annual average groundwater level changes and the characteristics of wet and dry period variations differ at different time scales. From Figure 6a, the average variation cycle of groundwater levels at the 40-year characteristic time scale is approximately 26 years, which includes two wet–dry transition periods. It can also be predicted that in the future the groundwater level at Liyuan Station will remain in the dry period, with the decreasing trend gradually diminishing. From Figure 6b, the average variation cycle of groundwater levels at the 60-year characteristic time scale is about 40 years, including approximately one incomplete wet–dry transition period. By 2020, the groundwater level had not yet reached the minimum point. It is also predicted that after 2020, for the next 20 years, the groundwater level at Liyuan will remain in a dry period, although the downward trend will continue to decrease.

3.2. Geostatistical Model Analysis

3.2.1. Cross-Validation of the Semivariogram Model

The Kriging interpolation method in geostatistics was applied to spatially analyze the groundwater level fluctuations in the study area for the periods 1980–1990, 1990–2000, 2000–2010, and 2010–2020. The prerequisite for the ordinary Kriging method is that the data should follow a normal distribution. Given the small sample size, the S-W test in SPSS 24 software was used to test the groundwater level data for each time period. A p-value greater than 0.05 and a normal Q-Q plot with scatter points near the line are considered to indicate normal distribution. Based on the ArcGIS platform, the normal Q-Q plots of the average groundwater level and groundwater level fluctuations for each period showed scatter points near the line, and the S-W test results, as shown in Table 1, confirmed that the data follows a normal distribution.
The optimal criteria for the model evaluation include the mean error (ME) being closest to 0, the root mean square error (RMSE) being minimal, and the average standard error (ASE) being closest to the RMSE. From the cross-validation results in Table 2, it can be seen that for the periods 1980–1990, 2000–2010, and 2010–2020, the Gaussian model was selected for groundwater level fluctuations, while for 1990–2000, the Spherical model was used.

3.2.2. Analysis of Spatial Variability of Groundwater Levels

According to the research by Men Baohui et al. on the precipitation time scale patterns in Beijing, it is known that Beijing’s precipitation exhibits quasi-periodic fluctuations with a cycle of 7 to 15 years [38]. To couple with the precipitation cycle, this study divides the groundwater level series from 1980 to 2020 into four groups, with each stage spanning 10 years. The groundwater level variation over each 10-year period from 1980 to 2020 is then processed using geostatistical interpolation (based on ArcGIS 10.2 platform). Figure 7 shows the results of Kriging interpolation for groundwater level fluctuations at Liyuan Station in Tongzhou District for the periods 1980–1990, 1990–2000, 2000–2010, and 2010–2020. From Figure 7, the following can be observed:
During 1980–1990, the groundwater level across the entire Tongzhou District showed a decline, with the most significant decrease occurring in Yongledian Town in the south. The smallest decline occurred in the areas at the junction of Liyuan Town, Lucheng Town, and Zhangjiawan Town. During 1990–2000, the groundwater level fluctuations gradually decreased in the central regions (Zhangjiawan Town, Liyuan Town, and Lucheng Town) radiating outwards. The areas with the most significant decline were Taihu Town, Majia Bridge Town, Songzhuang Town, and Yongledian Town. During 2000–2010, there was a notable recovery in groundwater levels in the central region, especially in Lucheng Town, Majia Bridge Town, and the eastern part of Xiji Town, while the northern and southern regions experienced a decline. During 2010–2020, the areas with the most significant recovery in groundwater levels were the central and southern regions, with the most notable recovery occurring in Majia Bridge Town and Lucheng Town.
Table 3 presents the parameters of the semivariogram model for the interpolation results of groundwater level fluctuations and calculates the nugget effect. From Table 3 it can be observed that during 1980–1990, 2000–2010, and 2010–2020, the groundwater level fluctuations in the study area exhibited strong spatial correlation, mainly influenced by spatial structural factors with little influence from external random factors. In contrast, during 1990–2000, the groundwater levels in the study area showed moderate spatial correlation, with the groundwater level fluctuations being influenced by both structural factors such as terrain and landforms and external random factors like human activities and climate.

3.3. Grey Relational Analysis of Driving Factors for Groundwater Level

This study uses the grey relational analysis method to analyze the factors affecting groundwater levels and explore the impact of water usage in various sectors and their driving factors on groundwater levels. To quantify the impact of water usage in different sectors on groundwater levels, the water usage data for each township in the study area from 2011 to 2020 was collected and divided into the northern, central, and southern regions, as shown in Figure 8. Grey relational analysis was performed using Formulas (8)–(13) to calculate the grey relational grades between the water usage in various sectors and the groundwater levels. The grey relational grades for domestic water usage (γ01), tertiary sector water usage (γ02), industrial water usage (γ03), and agricultural water usage (γ04) are shown in Figure 9.
Overall, the grey relational grade for domestic water usage (γ01) from 2011 to 2020 was the highest, at 0.779, followed by the grey relational grade for tertiary sector water usage (γ02) at 0.774 and industrial water usage (γ03) at 0.717. According to the Beijing Tongzhou District Statistical Yearbook (2021) [39], the permanent population of Tongzhou District at the end of 2020 was 1.84 million, an increase of 47.2% from 2011; the district’s GDP in 2020 was 110.3 billion yuan, a growth of 139.3% from 2011. This indicates that the rapid growth in population and regional economy, along with a significant improvement in living standards, has resulted in a simultaneous increase in the demand for water resources. This in turn leads to a higher grey relational grade between domestic water usage, tertiary sector water usage, industrial water usage, and groundwater levels. Therefore, groundwater levels are more significantly influenced by water usage in these sectors. On the other hand, the grey relational grade for agricultural water usage (γ04) was the lowest, at 0.429, indicating a decreasing trend in the influence of agricultural water usage on the regional groundwater level. This is related to the shift in the agricultural development plan of the study area. According to the Beijing Tongzhou District Statistical Yearbook (2021), the sown area for crops in the district in 2020 was 9.304 million m2, a decrease of 82.0% compared to 2011, and the actual area for facility agriculture was 1.6584 million m2, a decrease of 33.7% from 2011.
From a regional perspective, the grey relational grades for domestic water usage, tertiary sector water usage, and industrial water usage in the southern region were all lower than those in the northern and central regions, indicating that groundwater levels in the southern region were less influenced by these types of water usage compared to the northern and central regions. This can be attributed to the fact that some rural areas in the southern region still have inadequate infrastructure and public service facilities, and socio-economic development is slower than in the northern and central regions. Additionally, the grey relational grade for agricultural water usage in the southern region was higher, 0.035 higher than in the northern region and 0.034 higher than in the central region, indicating that agricultural water usage in the southern region has a greater impact on groundwater levels than in the northern and central regions. This is linked to the fact that the southern region has a larger agricultural area, including grain fields, facility agriculture, and vegetable fields.
To further analyze the impact of specific driving factors within each sector’s water usage on groundwater levels, the grey relational grades between groundwater levels and the driving factors of water usage in various sectors were calculated using Formulas (8)–(13). The driving factors selected for the years 2011–2020 include per capita domestic water usage, population, industrial water usage per unit of GDP, the proportion of industrial GDP, the proportion of tertiary sector GDP, industrial water usage per unit of GDP in the tertiary sector, the proportion of agricultural GDP, and the total sown area for crops, as shown in Figure 10.
The results of the grey relational grades for the driving factors of water usage in various sectors are shown in Table 4. The ranking of grey relational grades for groundwater levels is as follows: the proportion of tertiary sector GDP (γ5) > per capita domestic water usage (γ1) > population (γ2) > the proportion of industrial GDP (γ4) > industrial water use per 10,000 CNY GDP (γ3) > tertiary sector water use per 10,000 CNY GDP (γ6) > the proportion of agricultural GDP (γ7) > total sown area for crops (γ8). The grey relational results indicate that the proportion of tertiary sector GDP (γ5) had the highest grey relational grade of 0.92, followed by per capita domestic water usage (γ1) with a grey relational grade of 0.87, while the total sown area for crops had the lowest grey relational grade of 0.60. From the classification of factors, domestic water usage and tertiary industry water usage driving factors had a higher grey relational grade with groundwater levels, followed by industrial water usage, and agricultural water usage had the smallest impact, indicating that domestic water usage and tertiary sector water usage have a more significant effect on groundwater levels than industrial and agricultural water usage.

4. Discussion

4.1. Rationality of the Groundwater Level Spatiotemporal Evolution Pattern

This study obtained the spatiotemporal evolution pattern of groundwater levels through continuous wavelet transform and Kriging interpolation. Based on the results of continuous wavelet transform, the observed periods at the 40-year and 60-year time scales indicate that the groundwater level at the typical site in Tongzhou District, Liyuan Station, is in a dry period, but the downward trend of the groundwater level has slowed. According to the Kriging interpolation results in this study, from 2000 to 2020, the groundwater level in most areas of Tongzhou District continued to decrease, consistent with the conclusions of the continuous wavelet transform. However, some areas experienced a rebound in groundwater levels during this period. The reasons for the groundwater level rebound were explored. According to the study by Wei Ling et al. (2014), the Xihe Irrigation Area in Tongzhou District is the largest recycled water recharge area in Beijing [40]. Since large-scale recycled water recharge began in 2004, the declining trend of groundwater levels in the irrigation area has slowed, and after 2008 the groundwater level started to rise. The rebound areas identified in this study are located within the Xihe Irrigation Area, where the utilization of recycled water has replenished groundwater resources, leading to the observed rise in groundwater levels. In the study on the dynamic changes of groundwater levels in Beijing by Zhu Qian et al. (2024), a slight rebound in groundwater levels was also observed in Tongzhou District, indicating a general improvement in the groundwater resource situation in Beijing [19]. In the future, more systematic and in-depth studies can be conducted on the spatiotemporal evolution patterns of groundwater.

4.2. Analysis of the Driving Mechanism of Groundwater Level Changes

According to the Kriging interpolation results from Section 3.2, the groundwater level rose between 2010 and 2020, and the nugget effect increased compared to the previous period, indicating a higher degree of spatial variation caused by external random factors such as human activities and climate. During this period, the driving factors of groundwater levels in Tongzhou District became more complex than in the past. On the one hand, Tongzhou District experienced several extreme rainfall events between 2010 and 2020, such as the heavy rain on 21 July 2012 (the heaviest rainfall since the founding of the People’s Republic of China), the heavy rain on 17 May 2019 (the first red rainstorm warning in Beijing in 2019), and the extreme rainfall on 29 August 2020 (a once-in-60-years event). On the other hand, the completion of the South-to-North Water Diversion Project’s Tongzhou Branch in 2017 increased the scale of water supply from this project, altering the water supply structure. According to the results of the grey correlation analysis in Section 3.3, the grey correlation coefficients for tertiary industry water use and domestic water use were the highest. This was due to the development of the Beijing urban sub-center in Tongzhou District from 2010 to 2020, which promoted industrial and agricultural structural adjustments, with a rapid growth in the tertiary industry, the gradual exit of the manufacturing industry, a reduction in industrial water use, and an increase in water use in the tertiary industry. Rainfall, recycled water supplementation, changes in urban water supply structure, and adjustments in industrial structure were all driving factors contributing to the rebound in groundwater levels in Tongzhou District. In the future, strengthening water-saving management and controlling the growth of water use in various water-using sectors will create favorable conditions for groundwater resource conservation.

5. Conclusions

Based on groundwater level data from Tongzhou District from 1980 to 2020 and sectoral water usage data from 2011 to 2020, this study employs continuous wavelet transform, geostatistical interpolation, and grey relational analysis to investigate the spatiotemporal evolution characteristics of groundwater levels, the periodic patterns of groundwater level fluctuations at different time scales, and the correlation between groundwater levels and various driving factors. The main conclusions are as follows:
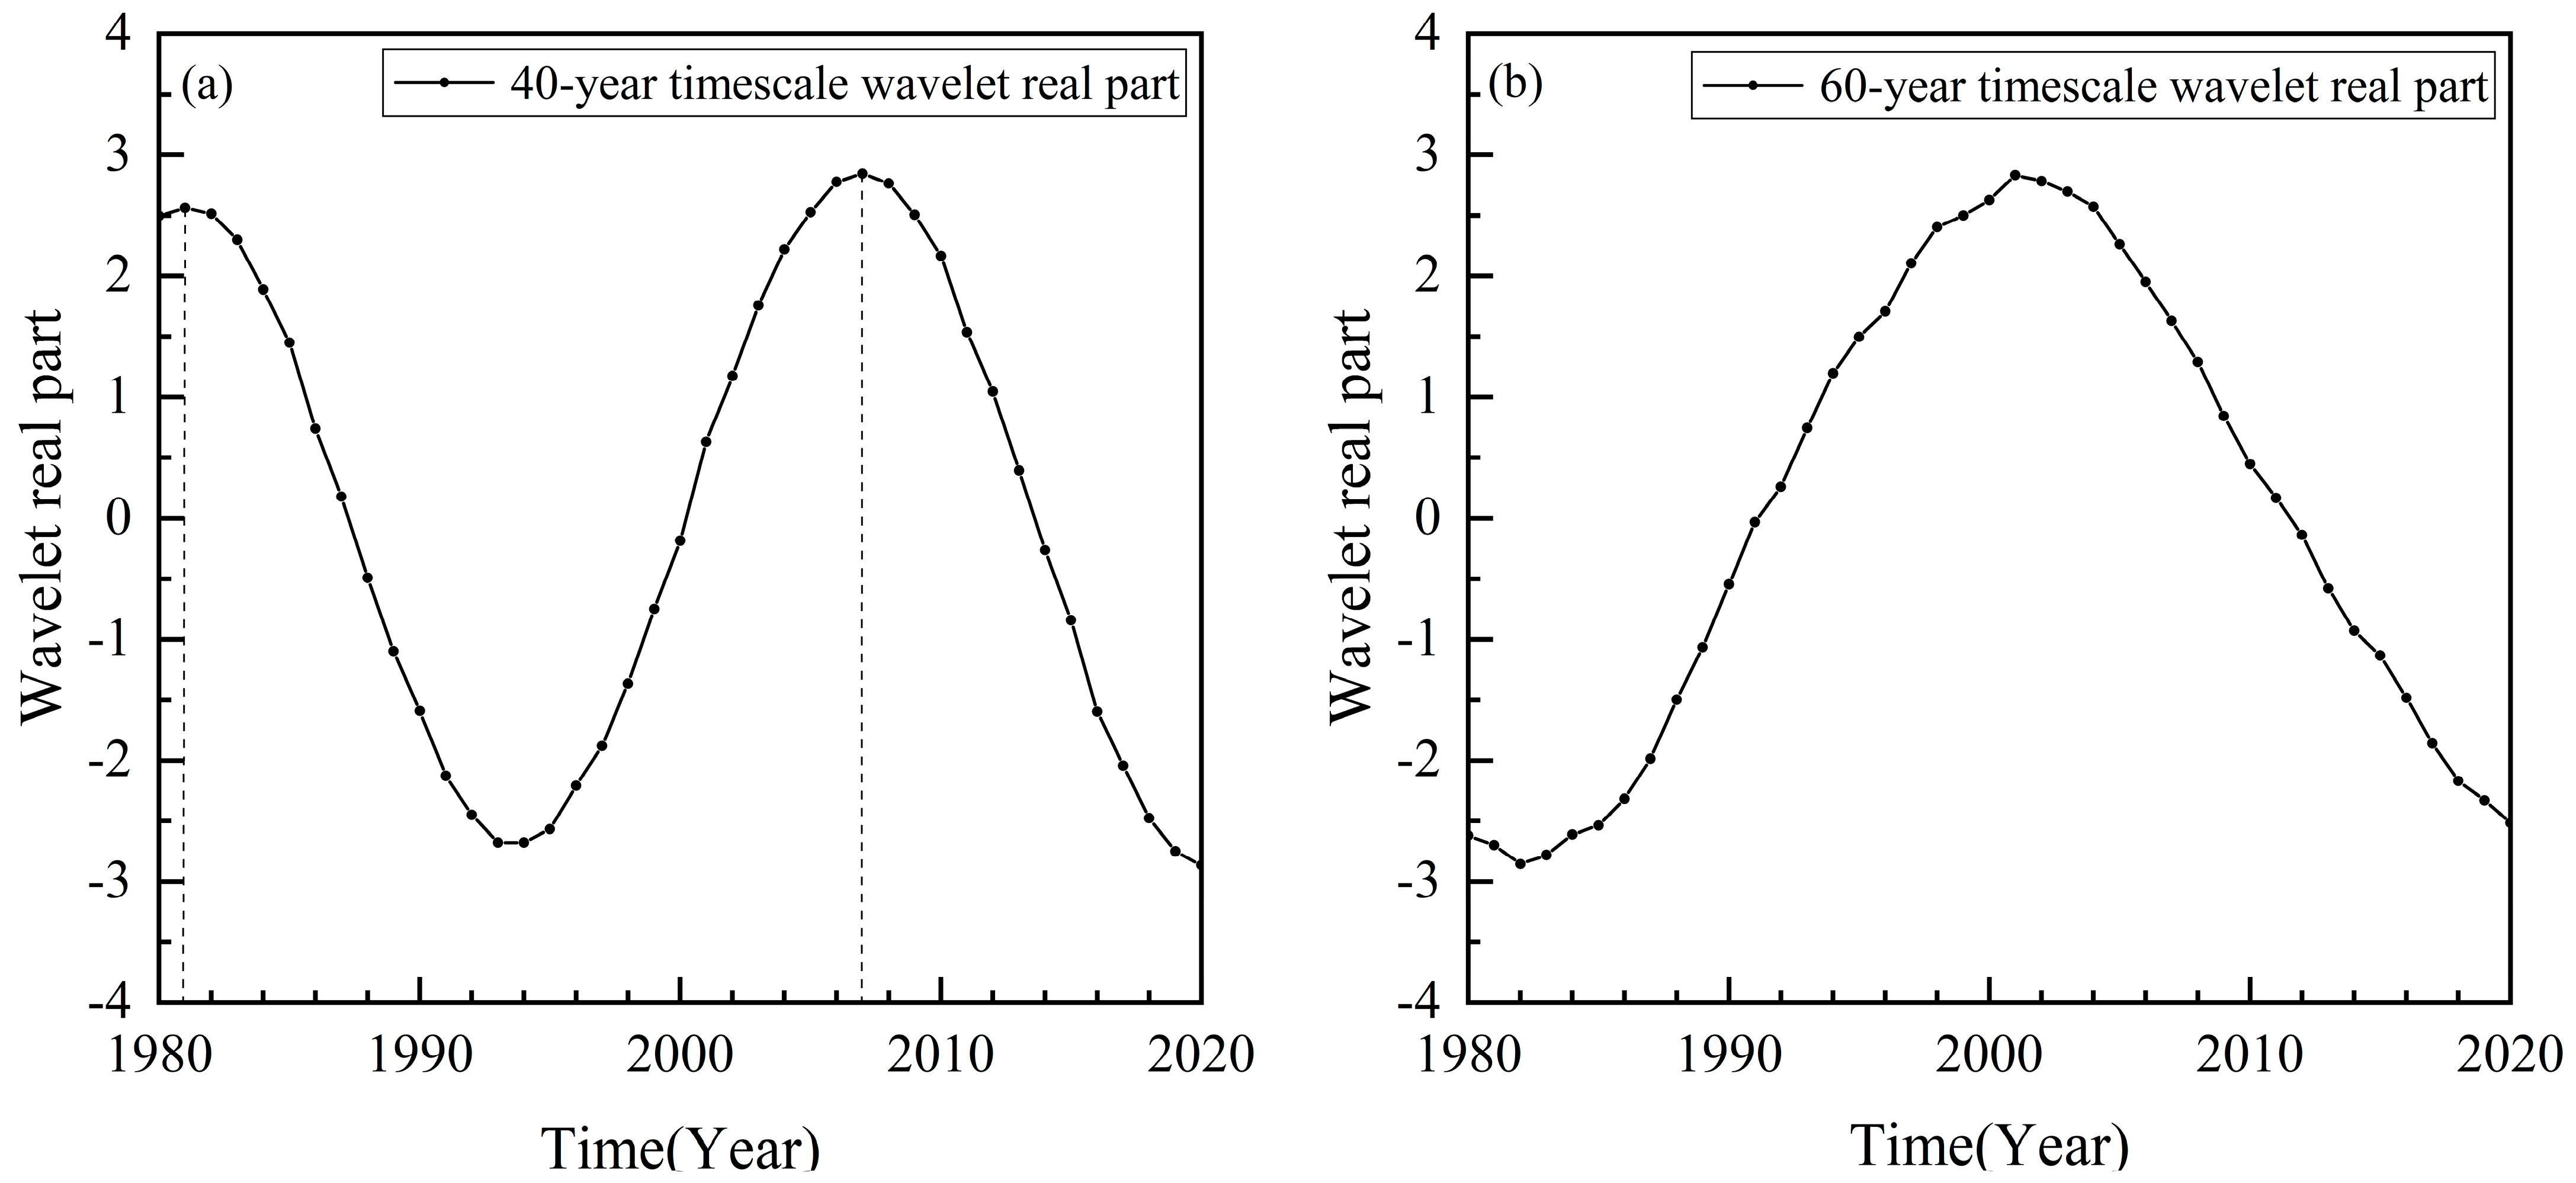
  • The groundwater level variations from 1980 to 2020 are primarily governed by three main cycles corresponding to characteristic time scales of 60, 40, and 20 years. At the 50–64-year time scale, there is one full wet–dry oscillation observed across the entire study area. At the 30–47-year time scale, there are approximately 1.5 wet–dry cycles across the region. The 20-year time scale exhibits multiple less-distinct fluctuations, indicating weaker periodicity. At the 40-year characteristic time scale, the average cycle duration is around 26 years, showing two full wet–dry transitions. The average variation cycle of groundwater levels at the 60-year characteristic time scale is around 40 years, experiencing one incomplete wet–dry transition period. It can also be predicted that, after 2020, the groundwater level at Liyuan Station will remain in a dry period, but the decreasing trend will gradually slow down.
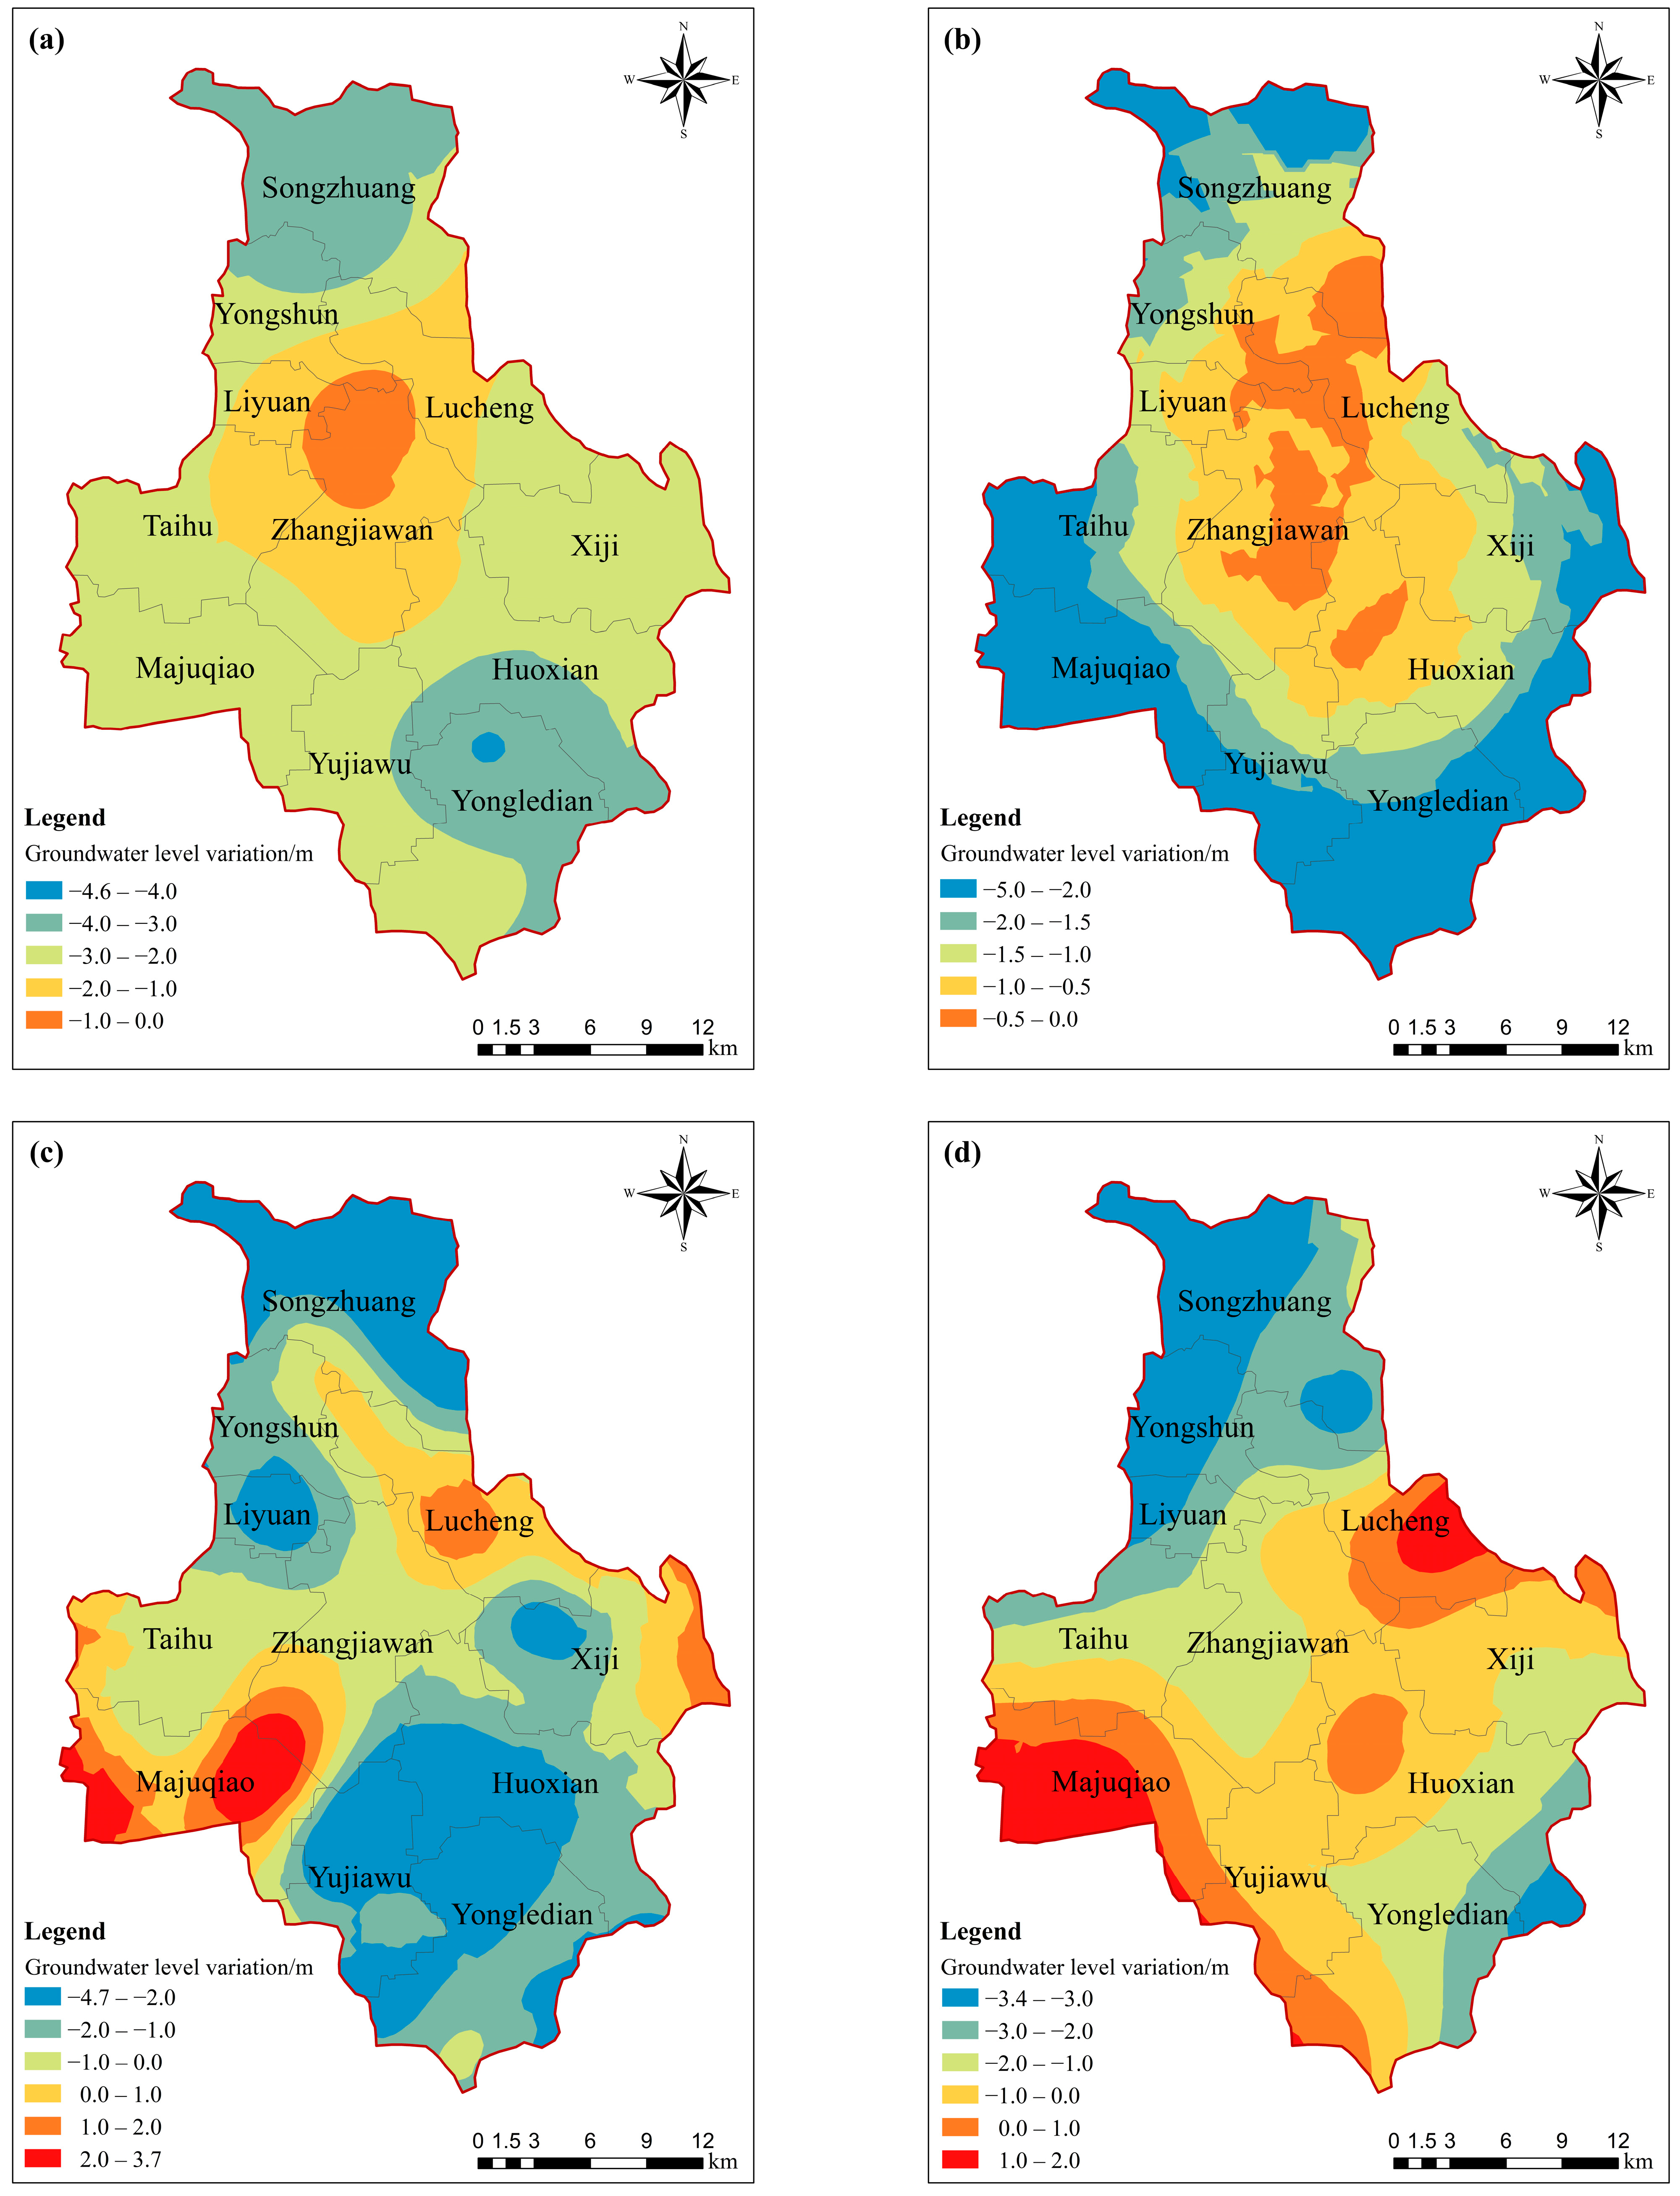
  • From 1980 to 2000, groundwater levels in Tongzhou District declined across the entire region, with the central area experiencing a smaller rate of decline compared to the northern and southern regions. Between 2000 and 2010, groundwater levels in central areas such as Lucheng Town, Majuqiao Town, and the eastern part of Xiji Town rebounded significantly, while declines continued in the northern and southern regions. From 2010 to 2020, the most notable groundwater level decline occurred in the northern region, while increases were observed in Majuqiao Town and Lucheng Town. During the periods 1980–1990, 2000–2010, and 2010–2020, groundwater level variations exhibited strong spatial correlation, primarily influenced by structural spatial factors and less affected by random external factors. From 1990 to 2000, groundwater level variations showed moderate spatial correlation, influenced by both structural factors such as topography and geomorphology, and stochastic external factors such as human activities and climate.
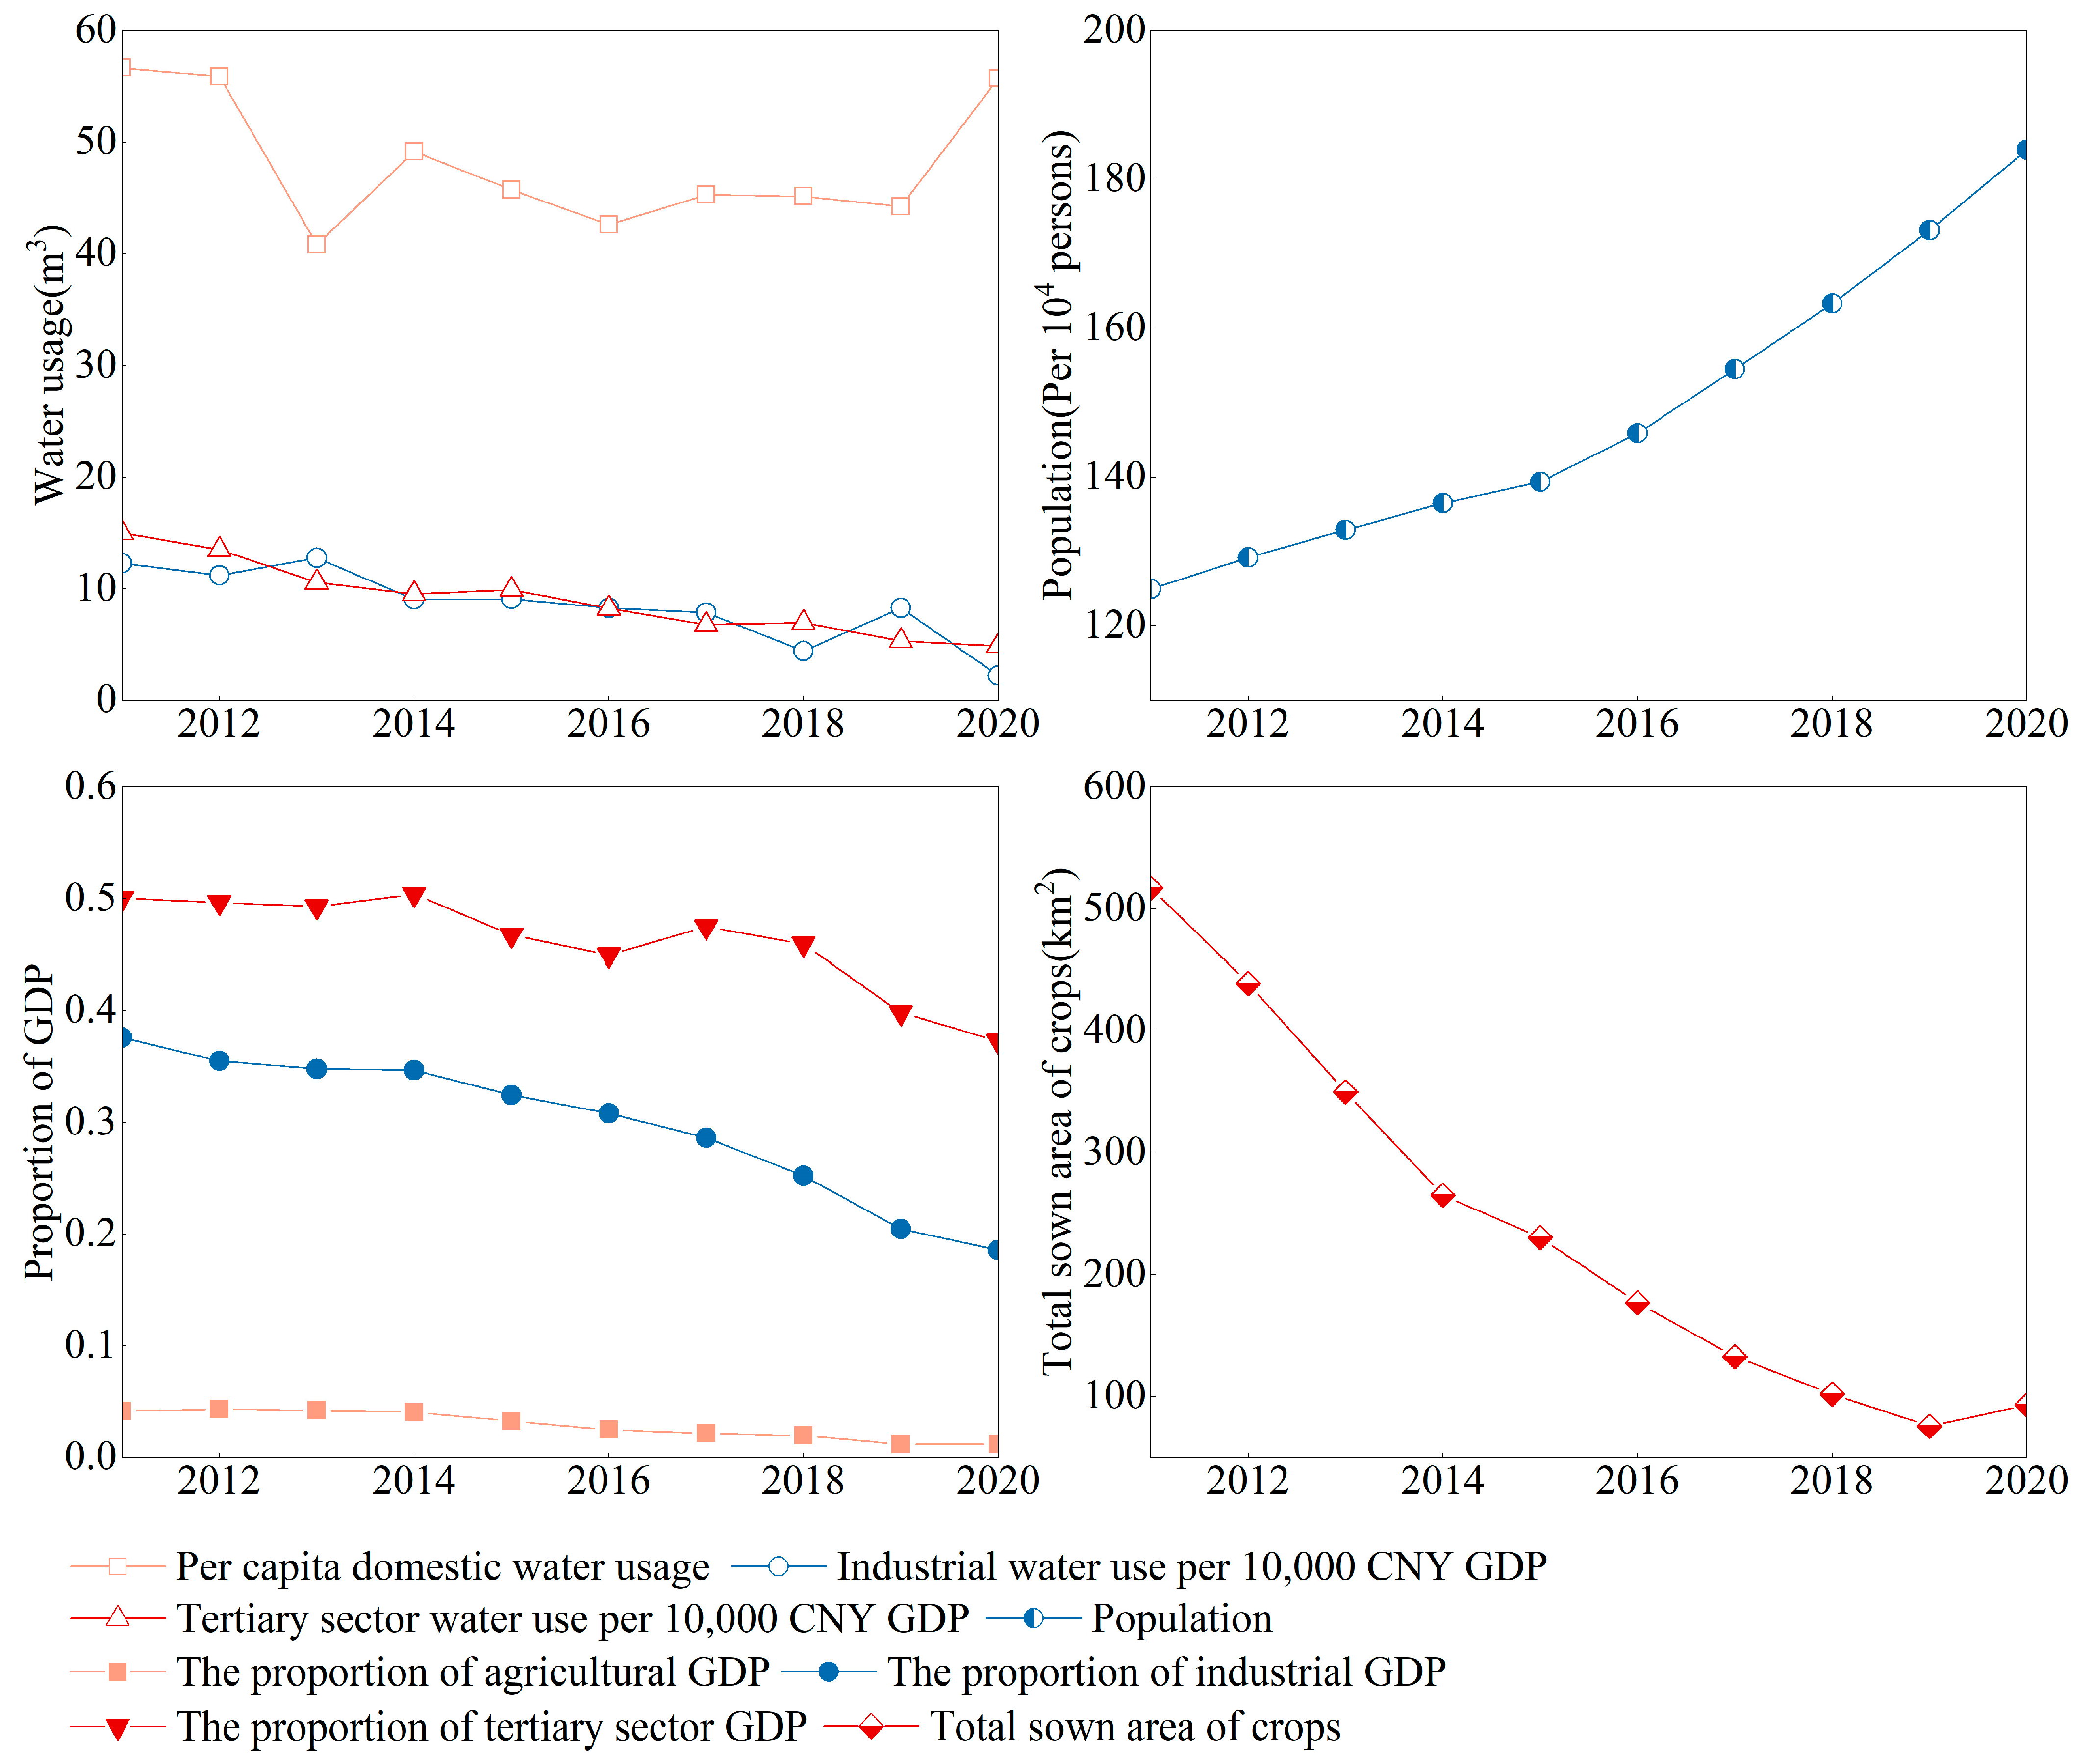
  • From 2011 to 2020, the grey relational grades of water usage in the study area were ranked as follows: domestic water usage (γ01) > tertiary sector water usage (γ02) > industrial water usage (γ03). Due to rapid population growth and regional economic development, living standards improved significantly, leading to a synchronized increase in water demand. As a result, domestic, tertiary sector, and industrial water usages show a strong correlation with groundwater level changes, indicating a significant impact from these sectors on groundwater resources. Agricultural water usage (γ04) had the lowest grey relational grade, suggesting a decreasing influence on groundwater levels during this period. This trend is associated with changes in agricultural development planning in the region, including reductions in both total crop sown area and actual area used for facility agriculture.

Author Contributions

Conceptualization, S.Y.; methodology, X.X. and X.G.; software, X.X., X.G. and S.Y.; validation, X.X. and X.G.; formal analysis, X.X. and X.G.; investigation, Y.D.; resources, S.Y.; data curation, S.Y.; writing—original draft preparation, X.X. and X.G.; writing—review and editing, S.Y., N.Z. and Y.D.; visualization, X.X., X.G. and Y.D.; supervision, S.Y. and N.Z.; project administration, S.Y. and N.Z.; funding acquisition, S.Y. All authors have read and agreed to the published version of the manuscript.

Funding

This research was funded by National Natural Science Foundation of China, grant number 52479040.

Data Availability Statement

The data presented in this study are available on reasonable request from the corresponding author due to the non-public nature of Beijing sub-center-related data.

Conflicts of Interest

Author X.G. was employed by the company Guizhou Transmission and Transform Electricity Engineering Co., Ltd. The remaining authors declare that the research was conducted in the absence of any commercial or financial relationships that could be construed as a potential conflict of interest.

References

  1. Tziritis, E.; Panagopoulos, A. Geo-environmental approaches for the analysis and assessment of groundwater resources at the catchment scale. Water 2022, 14, 1085. [Google Scholar] [CrossRef]
  2. Yin, Z.; Xu, Y.; Zhu, X.; Zhao, J.; Yang, Y.; Li, J. Variations of groundwater storage in different basins of China over recent decades. J. Hydrol. 2021, 598, 126282. [Google Scholar] [CrossRef]
  3. Xue, F.; Zhang, N.; Xia, C.; Zhang, J.; Wang, C.; Li, S.; Zhou, J. Spatial evaluation of urban ecological resilience and analysis of driving forces: A case study of Tongzhou District, Beijing. Acta Ecol. Sin. 2023, 43, 6810–6823. (In Chinese) [Google Scholar]
  4. Lin, X.; Li, W.; Wang, H.; Ming, D.; Han, L. Analysis of the groundwater storage variations and their driving factors in the three eastern coastal urban agglomerations of China. Remote Sens. Nat. Resour. 2022, 34, 262–271. (In Chinese) [Google Scholar]
  5. Zhao, Z.; Luo, Z.; Huang, L.; Xing, L.; Li, H.; Sun, H. Research on the response mechanism of groundwater level to rainfall in the western suburb of Jinan based on wavelet analysis. Carsologica Sin. 2023, 42, 931–939. (In Chinese) [Google Scholar]
  6. Guo, L.; Gong, H.; Zhu, F.; Guo, X.; Zhou, C.; Qiu, L. Cyclical characteristics of groundwater level and precipitation based on wavelet analysis. Geogr. Geo-Inf. Sci. 2014, 30, 35–38+127. (In Chinese) [Google Scholar]
  7. Yang, P.; Zhang, S.; Guo, B.; Yang, C.; Feng, Q.; Lv, Y.; Xie, L. Characteristic of groundwater level dynamic variation and the potential influence factors in different aquifer categories in Rizhao area, Shandong province. J. Jilin Univ. (Earth Sci. Ed.) 2024, 54, 967–979. (In Chinese) [Google Scholar] [CrossRef]
  8. Zhang, H.; Rui, X.; Zhou, Y.; Sun, W.; Xie, W.; Gao, C.; Ren, Y. Analysis of the response of shallow groundwater levels to precipitation based on different wavelet scales—A case study of the Datong Basin, Shanxi. Water 2024, 16, 2920. [Google Scholar] [CrossRef]
  9. Tsai, J.-P.; Hsiao, C.-T. Spatiotemporal analysis of the groundwater head variation caused by natural stimuli using independent component analysis and continuous wavelet transform. J. Hydrol. 2020, 590, 125405. [Google Scholar] [CrossRef]
  10. Gordu, F.; Nachabe, M.H. A physically constrained wavelet-aided statistical model for multi-decadal groundwater dynamics predictions. Hydrol. Process. 2021, 35, e14308. [Google Scholar] [CrossRef]
  11. Dadhich, A.P.; Goyal, R.; Dadhich, P.N. Assessment and prediction of groundwater using geospatial and ANN modeling. Water Resour. Manag. 2021, 35, 2879–2893. [Google Scholar] [CrossRef]
  12. Gong, G.; Mattevada, S.; O’Bryant, S.E. Comparison of the accuracy of kriging and IDW interpolations in estimating groundwater arsenic concentrations in Texas. Environ. Res. 2014, 130, 59–69. [Google Scholar] [CrossRef]
  13. Shrestha, N.; Mittelstet, A.; Young, A.R.; Gilmore, T.E.; Gosselin, D.C.; Qi, Y.; Zeyrek, C. Groundwater level assessment and prediction in the Nebraska Sand Hills using LIDAR-derived lake water level. J. Hydrol. 2021, 600, 126582. [Google Scholar] [CrossRef]
  14. Wang, Q.; Sun, J.; Yang, Y.; Zhang, J.; Wang, G.; Ma, E.; Liu, J.; Zhao, X. A comparative study of Kriging and deep learning methods for shallow groundwater level estimation: A case study of the Shenzhen-Shanwei Special Cooperation Zone. Bull. Geol. Sci. Technol. 2024, 43, 291–301. (In Chinese) [Google Scholar] [CrossRef]
  15. Tao, C.; Dan, P.; Mat, G. Gaussian process machine learning and Kriging for groundwater salinity interpolation. Environ. Model. Softw. 2021, 144, 105170. [Google Scholar] [CrossRef]
  16. Celicourt, P.; Gumiere, S.J.; Lafond, J.A.; Gumiere, T.; Gallichand, J.; Rousseau, A.N. Automated Mapping of Water Table for Cranberry Subirrigation Management: Comparison of Three Spatial Interpolation Methods. Water 2020, 12, 3322. [Google Scholar] [CrossRef]
  17. Shyam, M.; Meraj, G.; Kanga, S.; Sudhanshu; Farooq, M.; Singh, S.K.; Sahu, N.; Kumar, P. Assessing the Groundwater Reserves of the Udaipur District, Aravalli Range, India, Using Geospatial Techniques. Water 2022, 14, 648. [Google Scholar] [CrossRef]
  18. Zhang, Y.; Shi, Y.; Sun, C.; An, T.; He, W.; Fan, Q.; Luo, Z.; Shi, H. Effect of Groundwater Level Rise Rebound on Nitrate Nitrogen in Miyun-Huairou-Shunyi Recharge Area. Environ. Pollut. Control 2023, 45, 1496–1501. (In Chinese) [Google Scholar] [CrossRef]
  19. Zhu, Q.; Zhao, H.; Wang, J.; Liu, T. Analysis of dynamic changes and influencing factors of groundwater level in Beijing. Beijing Water 2024, 03, 49–54. (In Chinese) [Google Scholar] [CrossRef]
  20. Wang, W.; Tian, H.; Yang, G.; Liu, B.; Pan, Y.; Ding, G.; Xu, X.; Dan, Y.; Cui, M.; Gao, Y. Dynamic variation of groundwater level and its influencing factors in typical oasis irrigated areas in Northwest China. Open Geosci. 2023, 15, 20220493. [Google Scholar] [CrossRef]
  21. Yan, B.; Li, X.; Hou, J.; Bi, P.; Sun, F. Study on the dynamic characteristics of shallow groundwater level under the influence of climate change and human activities in Cangzhou, China. Water Sci. Technol. Water Supply 2020, 21, 797–814. [Google Scholar] [CrossRef]
  22. Li, X.; Li, G.; Zhang, Y. Identifying major factors affecting groundwater change in the North China Plain with Grey Relational Analysis. Water 2014, 6, 1581–1600. [Google Scholar] [CrossRef]
  23. Zhang, M.; Ping, J.; Mei, X.; Leng, W.; Li, H.; Zhao, J.; Liu, J. The trend of groundwater recharge in the secondary perched reaches of the Yellow River in the past 50 years. Front. Environ. Sci. 2023, 11, 1310181. [Google Scholar] [CrossRef]
  24. Zuo, B.; Xu, Z.; Ren, M.; Li, P. Precipitations in Tongzhou District Beijing from 1966–2016. J. Beijing Norm. Univ. (Nat. Sci.) 2019, 55, 556–563. (In Chinese) [Google Scholar] [CrossRef]
  25. Li, B.; Yu, L.; Pan, X.; Jun, Q.; Zhang, Y.; Zhao, L.; Yang, M. Temporal and spatial characteristics of precipitation in Tongzhou District, Beijing. J. Beijing Norm. Univ. (Nat. Sci.) 2020, 56, 566–572. (In Chinese) [Google Scholar]
  26. Du, D.; Liu, H.; Zhou, J.; Zhang, J.; Miao, J.; Li, Y.; Cao, X.; Ye, M. Study of the characteristics and influencing factors of land subsidence in the Tongzhou district of Beijing. Acta Geol. Sin. 2022, 96, 712–725. (In Chinese) [Google Scholar] [CrossRef]
  27. Wang, X.; Li, B.; Li, Y.; Jiang, X.; Jiang, C.; Gao, J. Hydrochemistry of groundwater in quaternary aquifers in Tongzhou of Beijing and the underlying determinants. J. Irrig. Drain. 2022, 41, 92–97+104. (In Chinese) [Google Scholar] [CrossRef]
  28. Wang, Q.; Guo, X.; Duan, X.; Wang, S.; Zuo, R.; Wang, J.; Liu, X.; Zhai, Y.; Meng, L. Identification and correlation of sensitive indicators for groundwater quality in South water recharge areas. J. Beijing Norm. Univ. (Nat. Sci.) 2023, 59, 288–298. (In Chinese) [Google Scholar]
  29. Bahmani, R.; Solgi, A.; Ouarda, T.B.M.J. Groundwater level simulation using gene expression programming and M5 model tree combined with wavelet transform. Hydrol. Sci. J. 2020, 65, 1430–1442. [Google Scholar] [CrossRef]
  30. Zhao, J.; Li, G.; Zhu, Z.; Hao, Y.; Hao, H.; Yao, J.; Bao, T.; Liu, Q.; Yeh, T.C.J. Analysis of the spatiotemporal variation of groundwater storage in Ordos Basin based on GRACE gravity satellite data. J. Hydrol. 2024, 632, 130931. [Google Scholar] [CrossRef]
  31. Liu, J.; Song, M.; Zang, C.; Yin, R. Research on variation of groundwater depth and key influencing factors in Songliao Plain. J. North China Univ. Water Resour. Electr. Power (Nat. Sci. Ed.) 2021, 42, 58–65. (In Chinese) [Google Scholar] [CrossRef]
  32. Thakur, B.; Kaur, S.; Verma, V.K.; Biswas, A. Geostatistical evaluation and network optimization for precision groundwater resource mapping and management in Punjab State, India. Hydrogeol. J. 2025, 33, 591–609. [Google Scholar] [CrossRef]
  33. Sun, Y.; Kang, S.; Li, F.; Zhang, L. Comparison of interpolation methods for depth to groundwater and its temporal and spatial variations in the Minqin oasis of northwest China. Environ. Model. Softw. 2009, 24, 1163–1170. [Google Scholar] [CrossRef]
  34. Theodossiou, N.; Latinopoulos, P. Evaluation and optimisation of groundwater observation networks using the Kriging methodology. Environ. Model. Softw. 2006, 21, 991–1000. [Google Scholar] [CrossRef]
  35. Liu, Y.; Sun, G.; Mao, W.; Cheng, X.; Zhu, Y.; Yang, J. Geostatistical analysis of spatial variability of soil water and salt in Hetao Irrigation District. J. Irrig. Drain. 2022, 41, 101–109. (In Chinese) [Google Scholar] [CrossRef]
  36. Wang, Y.; Wu, X.; Liu, Z.; Shi, L. Characteristics and trend prediction of groundwater chemical evolution under the influence of sea water in the Jiaojia Gold Mining Area, China. Mine Water Environ. 2024, 43, 53–72. [Google Scholar] [CrossRef]
  37. Bian, J.; Sun, X. Comparison of three methods for uncertainty analysis of hydrologic models. J. China Hydrol. 2012, 32, 24–27+20. (In Chinese) [Google Scholar]
  38. Men, B.; Zhang, T. Component analysis and stochastic simulation of precipitation series in Beijing during the last 300 years. J. Hydraul. Eng. 2022, 53, 686–696+711. (In Chinese) [Google Scholar] [CrossRef]
  39. Beijing Tongzhou Statistical Yearbook 2021. Available online: https://www.bjtzh.gov.cn/bjtz/xxfb/202112/1502482.shtml (accessed on 24 March 2025).
  40. Wei, L.; Hao, S.; Wang, C.; Cao, L.; Chen, B. Effect of reclaimed water reuseage on groundwater level in Tongzhou District based on GIS. J. Irrig. Drain. 2014, 33, 301–305. (In Chinese) [Google Scholar] [CrossRef]
Figure 1. (a) The location of the study area in China; (b) the location of the study area in Beijing; (c) spatial distribution of meteorological stations in study area.
Water 17 01668 g001
Figure 2. Interannual variations in groundwater level and precipitation at representative sites of the study area.
Water 17 01668 g002
Figure 3. Contour map of the real part of wavelet coefficients for groundwater level at Liyuan station.
Water 17 01668 g003
Figure 4. Contour map of the magnitude squared of wavelet coefficients for groundwater level at Liyuan station.
Water 17 01668 g004
Figure 5. Wavelet variance plot of groundwater level at Liyuan station.
Water 17 01668 g005
Figure 6. (a) Temporal evolution of the real part of wavelet coefficients for groundwater level at Liyuan station at the 40-year timescale; (b) Temporal evolution of the real part of wavelet coefficients for groundwater level at Liyuan station at the 60-year timescale.
Water 17 01668 g006
Figure 7. (a) Kriging interpolation map of groundwater level variation during 1980–1990; (b) Kriging interpolation map of groundwater level variation during 1990–2000; (c) Kriging interpolation map of groundwater level variation during 2000–2010; (d) Kriging interpolation map of groundwater level variation during 2010–2020.
Water 17 01668 g007
Figure 8. Regional division of the study area.
Water 17 01668 g008
Figure 9. Grey relational analysis results.
Water 17 01668 g009
Figure 10. The driving factors of water usage in various sectors.
Water 17 01668 g010
Table 1. S-W test results.
Time1980–19901990–20002000–20102010–2020
Significance0.1590.4420.6520.538
Table 2. Model cross-validation results.
TimeModelMERMSEASE
1980–1990Spherical model−0.0620.8600.692
Exponential model−0.0560.9120.733
Gaussian model−0.0650.8500.685
1990–2000Spherical model−0.00031.3191.098
Exponential model0.0121.3231.100
Gaussian model−0.0101.3261.083
2000–2010Spherical model0.0232.1871.811
Exponential model0.0532.2141.827
Gaussian model−0.0122.1731.720
2010–2020Spherical model0.1791.2820.995
Exponential model0.1601.3451.042
Gaussian model0.1851.2510.996
Table 3. The model parameters of the groundwater level fluctuation semivariogram.
YearSemivariogramNuggetPartial SillSillNugget Effect (%)
1980–1990Gaussian model0.1650.7260.89118.519
1990–2000Spherical model0.7850.3081.09371.821
2000–2010Gaussian model0.2083.8794.0875.089
2010–2020Gaussian model0.2091.3671.57613.261
Table 4. The grey relational grade of sub-driving factors for groundwater level variation.
Driving FactorsSub-Driving FactorsGrey Relational Grade
Domestic water usagePer capita domestic water usage (γ1)0.87
Population (γ2)0.83
Industrial water usageIndustrial water use per 10,000 CNY GDP (γ3)0.76
The proportion of industrial GDP (γ4)0.81
Tertiary sector water usageThe proportion of tertiary sector GDP (γ5)0.92
Tertiary sector water use per 10,000 CNY GDP (γ6)0.72
Agricultural water usageThe proportion of agricultural GDP (γ7)0.64
Total sown area for crops (γ8)0.60
Disclaimer/Publisher’s Note: The statements, opinions and data contained in all publications are solely those of the individual author(s) and contributor(s) and not of MDPI and/or the editor(s). MDPI and/or the editor(s) disclaim responsibility for any injury to people or property resulting from any ideas, methods, instructions or products referred to in the content.

