Article

Damage Mechanisms of Stabilized/Solidified Sediments in Dry–Wet Cycles: Insights from Microporous Structure Evolution

1
School of Safety Science and Engineering, Chongqing University of Science and Technology, Chongqing 401331, China
2
School of Resource and Safety Engineering, Chongqing University, Chongqing 400044, China
3
Duodao Branch of Natural Resources and Urban-Rural Construction Bureau of Jingmen City, Jingmen 448000, China
4
School of Intelligent Manufacturing & Transportation, Chongqing Vocational Institute of Engineering, Chongqing 402260, China
*
Authors to whom correspondence should be addressed.
Water 2025, 17(11), 1667; https://doi.org/10.3390/w17111667
Submission received: 7 May 2025 / Revised: 27 May 2025 / Accepted: 28 May 2025 / Published: 30 May 2025

Abstract

Stabilized/solidified (S/S) sediments are eroded by dry–wet cycles (DWs) when applied in an atmospheric environment. The microporous structures of S/S sediments, including their size, shape, and distributions, are sensitive to DWs and closely related to their macro properties. Therefore, multiscale micropore measurements, including scanning electron microscopy (SEM), mercury intrusion porosimetry (MIP), and nitrogen adsorption porosimetry (NAP), were conducted on S/S sediment samples subjected to different DWs to elucidate the micro-damage mechanisms of S/S sediments under DWs, in conjunction with unconfined compression strength (UCS) tests. The results indicated that, as DWs increased, the strength of the S/S sediments decreased, and pores/cracks developed due to the expansion of the calcium silicate hydrate (CSH) skeleton pore structures and the shrinkage of the sediment aggregate pore structures. Pores that accounted for most of the volume were those in the sediment aggregates in the range of 102 nm < d < 104 nm (d represents the pore diameter), while smaller pores in the range of d < 102 nm contributed 90% of the pore area. Pores in the CSH skeletons (d > 104 nm) increased with DWs, while those in the sediment aggregates decreased with DWs due to the expansion and shrinkage forces originating from the sediment particles with pore sizes of d < 10 nm. The plastic deformation of the pores in the CSH skeletons and sediment aggregates jointly controlled the strength of S/S sediments, and the adjustment of those pores gradually reduced the decrease rate of UCS. The revealed damage mechanisms of S/S during DWs provide theoretical foundations for optimizing S/S additives and expanding the engineering applications of the S/S sediments.

1. Introduction

The Earth accumulates a significant amount of sediment each year, which is neither suitable for direct use as planting soil due to contamination nor adequate for use as engineering materials because of its mechanical weakness. Therefore, one of the primary methods to mitigate the substantial presence of sediments is the use of stabilization/solidification (S/S) technology. Owing to the physical and chemical solidification reactions between sediments and additives, such as cement, lime, waste gypsum, and fly ash, S/S sediments can enhance their mechanical properties significantly (which is called solidification), promote their contaminant sealing capacity immensely (which is called stabilization), and meet engineering requirements [1,2,3,4,5,6,7,8,9]. S/S sediments have been widely utilized in construction engineering, such as in dam projects, subgrade projects, river remediation, concrete production, brick production, etc. [10].
To enhance the application of S/S sediments in engineering, scholars have conducted extensive research. Zhang et al. pointed out that S/S-contaminated sediments are a remedial measure, using the addition of cement to contaminated sediments to deal with harmful substances [11]. Dalmacija et al. also noted that, in the context of dealing with heavy metals such as Pb and Cb, the S/S additives were modified from cement to bentonite, bentonite lime, fly ash, zeolite, or a combination of zeolite and fly ash for S/S processing [12]. Hwang et al. developed a novel blended S/S binder composed of MgO and auxiliary cementitious materials; this innovative binder not only stabilized heavy metals in contaminated sediments but also facilitated the storage of carbon dioxide through mineral carbonation reactions [13]. To facilitate the utilization of sediments, coarse aggregates in the S/S additives were replaced by broken glass from beverage bottles, bottom ash from coal combustion, and waste incineration; however, when the substitution rate was greater than or equal to 33%, the unconfined compressive strength (UCS) of the S/S sediments decreased accordingly [3]. The addition of alkali slag waste and silica fume also leads to an improvement in the S/S additives, mainly in reducing the cement content [14]. Wang et al. proposed that the addition of calcium carbide residue (CCR) could promote hydration, thereby enhancing the undrained shear strength (USS) of S/S sediments in a short time, and that the addition of Class-F pulverized fly ash (PFA) was conducive to strength development in the later stage of maintenance [15]. Adding a small amount of biochar or incinerated sewage sludge ash into cement or lime as additives could also enhance chemical remediation in marine sediments [3,16]. However, extant research predominantly concentrates on the standard performance of S/S sediments, while insufficient attention has been given to the influence of the atmospheric environment on S/S sediments.
Currently, global climate variation persists. Environmental changes are likely to alter the characteristics of S/S sediments and even weaken their S/S performance. Alternating occurrences of dry and wet conditions are highly prevalent in the atmospheric environment, as exemplified by the water level fluctuations in dam construction and subgrade projects in low-lying areas. Since S/S sediments are considered to have a three-phase body, the size, shape, and distribution of pores are critical factors for the S/S sediment structure and are closely associated with their performance. Under DWs, the shape, size, volume, and specific surface area of pores in S/S sediments are supposed to change, resulting in performance degradation in S/S sediments [17]. Some research findings have provided indirect evidence of such changes: Cheng et al. found that DWs in marine environments often enhance the porosity of concrete and expedite the penetration of harmful ions [18]; Zha et al. discovered that after being subjected to DWs, the compaction stage of the stress–strain curve of red-bed argillaceous siltstone lengthened with more pronounced nonlinear characteristics, while the UCS and elastic modulus decreased significantly [19]; Pu et al. found that DWs reduce the dynamic compressive strength and lower the elastic limit strength of sandstone [20]. As analyzed above, it can be foreseen that DWs will degrade the macro performance of S/S sediments and erode their micropore structures, since the properties of S/S sediments are not very different from concrete, siltstone, sandstone, etc. Therefore, a study on the damage mechanisms of S/S sediments based on the micropore structure under DWs is necessary.
To select appropriate methods for analyzing the micropore structure of S/S sediments during DWs, the pore characteristics of S/S sediments need to be referenced. Under the influence of self-weight and microbial fermentation in different environments, sediments develop pores of different sizes. According to the classification of soil pore size, pores with a size less than 2 nm are defined as micropores, and those greater than 2 nm are defined as mesopores and macropores [21]. Based on our previous study, the pore sizes of S/S sediments encompass micropores, mesopores (2 nm < d < 50 nm), and macropores (d > 50 nm) [21]. The pore size measuring range of mercury intrusion porosimetry (MIP) is 0.006~300 µm, which covers the primary pore size range of S/S sediments. However, MIP involves introducing mercury into the pores under high pressure, which can damage micropores and mesopores when applied to weak materials like S/S sediments. Therefore, the microstructure of S/S sediments is yet to be clearly uncovered. Fortunately, nitrogen adsorption porosimetry (NAP) measures pore sizes from 7 nm to 1000 nm by utilizing the adsorption and desorption of nitrogen gas on the specimen in liquid nitrogen, without applying high pressure to micropores; this method is well-established in materials science [22]. MIP is more accurate for macropores of S/S sediments, while NAP is more accurate for micropores and mesopores [21]. Therefore, MIP and NAP are used in combination for the quantitative analysis of pores in S/S sediments, with scanning electron microscopy (SEM) being employed for the qualitative analysis of pore structures in the present study.
So far, current studies have not elucidated how DWs modify these pores or how DWs degrade the macro performance of S/S sediments. Therefore, this study aims to investigate the damage mechanisms of S/S sediments in light of the micropore structure under DWs. Multiscale micropore measurements including SEM, MIP, and NAP were conducted on S/S sediment specimens subjected to different DWs, in conjunction with UCS tests. Changes in the shape, size, volume, and specific surface area of pores in S/S sediments under DWs were analyzed. The pore damage mechanisms were revealed through UCS, SEM, MIP, and NAP analyses by ascertaining the evolution principles of pores in different size ranges, combined with the UCS changes during DWs. The study’s findings provide a theoretical basis for optimizing S/S additives and widening the engineering applications of S/S sediments.

2. Materials and Methods

2.1. Materials

The sediments were collected from a lake in Yichang City, Hubei Province, China. The collected sediments were black in color, had a flowing-plastic consistency, were fine-grained, and contained a substantial amount of organic matter. The pH of the sediments was measured using a digital pH meter, yielding a value of 6.3, indicative of weak acidity. The particle size composition of the soil was determined using the screening method (>0.075 mm) and densitometer method (<0.075 mm); most of the particles were fine (81.3%). The content of organic matter was determined using the potassium dichromate oxidation method, and the content was 4.0%. The basic physical properties of the sediments are presented in Table 1. Based the above basic characteristics of the sediments, the collected sediments were classified as lacustrine clayey–silty biogenic sediments, by comprehensively referring to relative standards including ISO 14688-1:2017 (clayey–silty sediments) [23], ISO 5667-12:2017 (weakly acidic organic-rich lacustrine sediment) [24], ASTM D4823-19 (lacustrine sediment) [25], ISO 19901-8:2015 (biologically dominated lacustrine sediments) [26], and Chinese local standards DB42/T 1255-2017 (inland freshwater lake sedimentary deposits in still water) [27].
For simplification and to clarify the impact mechanisms of DWs, the sediments were solidified using cement only, which is the most widely used S/S additive. The cement was “Three Gorges” 525 ordinary Portland cement produced by the Yichang Gezhouba Cement Plant (Yichang, China), and its chemical composition is presented in Table 2.

2.2. Sample Preparations

2.2.1. Sample Molding

S/S sediment samples were prepared using a 40 mm cubic mold. The sample preparation process was as follows: ① the water content of the original sediments was reduced to 80% by preloading; ② 15% (the most commonly used mix ratio of S/S additives) of the cement was added to the sediments, according to the wet mass ratio; ③ the cement and sediments were mixed evenly with a mixer; ④ the mixture was loaded into the mold within 30 min, with half of the mixture loaded once; ⑤ each half of the sample was vibrated on a shaking table to eliminate bubbles, and the sample surface was then scraped flat with a scraper; ⑥ the mold was placed in a constant-temperature (25 °C) and -humidity (95%) chamber (CTH chamber, Guangzhou SHPAC Environmental Instrument Co., Ltd., Guangzhou, China) for 3 days of curing; ⑦ the sample was removed from the mold.

2.2.2. Sample Curing and DWs

After demolding, the samples were placed in the CTH chamber and cured for 25 days to expedite the formation of a cemented structure. Based on preliminary tests, the strength of the S/S sediments remained unstable after the standard 28-day curing period, due to incomplete pozzolanic or hydration reactions. This implies that the weakening effect of DWs and the cement solidification reactions occurred concurrently. To precisely understand the influence of DWs, S/S sediment samples were cured in the chamber until the UCS no longer increased—180 days in the present study. Then, DWs were imposed on the cured S/S sediment samples. In accordance with the occurrence of DWs in real engineering conditions and the literature [28], the number of DWs was set to 0, 3, 6, 12, and 18, respectively; the maximum number of DWs was also confirmed by previous tests, which showed that the UCS decrease rate of the S/S sediments was very small by the 18th DW. One DW was implemented referring to ASTM D5589-03 [29] as follows: samples were first dried in an oven at 50 °C for 24 h, then immersed in distilled water for 24 h, constituting one dry–wet cycle (DW).

2.2.3. Freeze-Drying of the Sample

Before conducting SEM, MIP, and NAP tests, the samples must be completely dried. Commonly used drying methods include the oven-drying method, air-drying method, replacement method, freeze-drying method, etc. Traditional air-drying or oven-drying methods cause significant shrinkage of the samples, leading to a substantial reduction in pore content. In severe cases, the remaining pore volume obtained using the traditional method is only a third of the original pore volume. The freeze-drying method involves rapidly freezing the water in the sample in a low-temperature environment, directly converting the water in the sample pores into non-expansive crystals. Subsequently, a vacuum is applied to directly sublimate the water from the crystalline state. This process avoids pore shrinkage due to dehydration, better preserves the initial structure of the sample, and fully removes the pore liquid. Therefore, the freeze-drying method can ensure the reliability of SEM, MIP and NAP test results. The experimental process of the freeze-drying method was as follows: ① the S/S sediment specimen was trimmed to approximately 1 cm3; then, ② the samples were placed in low-temperature liquid nitrogen with a boiling point of −196 °C for 20 min of rapid cooling to convert free water into non-expansive crystals, in a liquid nitrogen biological container (Chengdu Jin Feng Liquid Nitrogen Container Co., Ltd., Chengdu, China, Figure 1a); finally, ③ the cooled samples were placed in the freeze-dryer (Changzhou Zhongleng Refrigeration Equipment Co., Ltd., Changzhou, China) and continuously evacuated for 24 h to directly sublimate the crystalline ice (Figure 1b).

2.3. Tests

Tests including UCS, SEM, MIP, and NAP were conducted separately on samples at specified DWs. UCS tests on S/S sediments were mainly utilized to assist in the interpretation of micro tests. At least 3 parallel tests were conducted under different cycles to adopt the average value as the final UCS value. The UCS test was carried out on a strain-controlled universal testing machine (Jinan Liangong Testing Technology Co., Ltd., Jinan, China) with a loading rate of 0.08 mm/min, following ASTM D4219-02 [30]. Details of the micro tests, including SEM (for qualitative analysis of pore morphology), MIP (for quantitative analysis of larger pores), and NAP (for quantitative analysis of smaller pores), are as follows.

2.3.1. SEM

The Zeiss Ultra Plus (Carl Zeiss AG, Auberkheim, Germany), manufactured by Zeiss in Germany, was employed for the SEM test. The fundamental principle of this instrument is to acquire the surface morphology image and relevant information of the sample by utilizing the secondary electron or backscattered electron signals generated from the interaction between the focused electron beam and the sample surface. The magnification of the images ranged from 12 to 1,000,000 times (for secondary electrons), which can clearly reveal the micropore structures of S/S sediments. Images with a magnification of 500 times were collected to analyze the micro-damage process of DWs on S/S sediments because the micro-constituents of S/S sediments could be most clearly observed at this magnification.

2.3.2. MIP

The apparatus utilized for the MIP test in the present study was the Autopore IV 9500 series automatic mercury porosimeter (Micromeritics Instrument Corporation, ATL., GA., USA). It had a mercury pressure range of 0~60,000 kPa and a pore size measurement range of 0.006~300 µm, which varied depending on the measured materials. The MIP test is a common technique for studying the microstructure of porous media. Its principle is that non-infiltrating liquid will only flow into a specified number of solid pores under specific external pressure, due to the repulsion between the pore surface and mercury molecules. Mercury is a non-invasive fluid for S/S sediments; thus, the MIP test is suitable for the analysis of S/S sediments. During the MIP test, the freeze-dried samples were immersed in mercury, and mercury was gradually forced into the sample pores under pressure. Based on the intrusion/extrusion curves, the pore size, pore volume, and pore area can be calculated using the Washburn Equation [31].

2.3.3. NAP

NAP was conducted using a NOVO Touch LX2 nitrogen adsorption pore analyzer (Quantachrome Instruments, MIA., FL., USC) from Quantachrome Ins. NAP is based on the principle that the pore surface of a sample placed in a pressured gas system will undergo physical adsorption at low temperatures. In the NAP test, the freeze-dried samples were ground in a mortar (without sieving). Subsequently, ground samples weighing approximately 3000 mg each were placed in separate glass tubes, and the tubes were then immersed in liquid nitrogen. As the pressure applied by the NAP apparatus increased, the adsorbate (nitrogen gas) at liquid nitrogen temperature was gradually adsorbed into the micropores of the adsorbent (S/S sediments). Conversely, with a decrease in pressure, nitrogen gas was gradually desorbed from those pores. Based on the adsorption/desorption isotherms, the pore size, pore volume, and pore area can be calculated using the Kelvin formula, Hauser formula, and BET multi-point method [32]. Moreover, NAP can distinguish the pore types of S/S sediments according to the shape of the adsorption/desorption isotherm [33]. In this study, the pressure applied by the apparatus ranged from 0 MPa to 0.13 MPa with a resolution of 7.8 × 10⁻⁹ MPa, and the ideal pore size range of 0.35 nm < r < 500 nm (r represents the radius) varied depending on the measured materials and operation controls.

3. Results

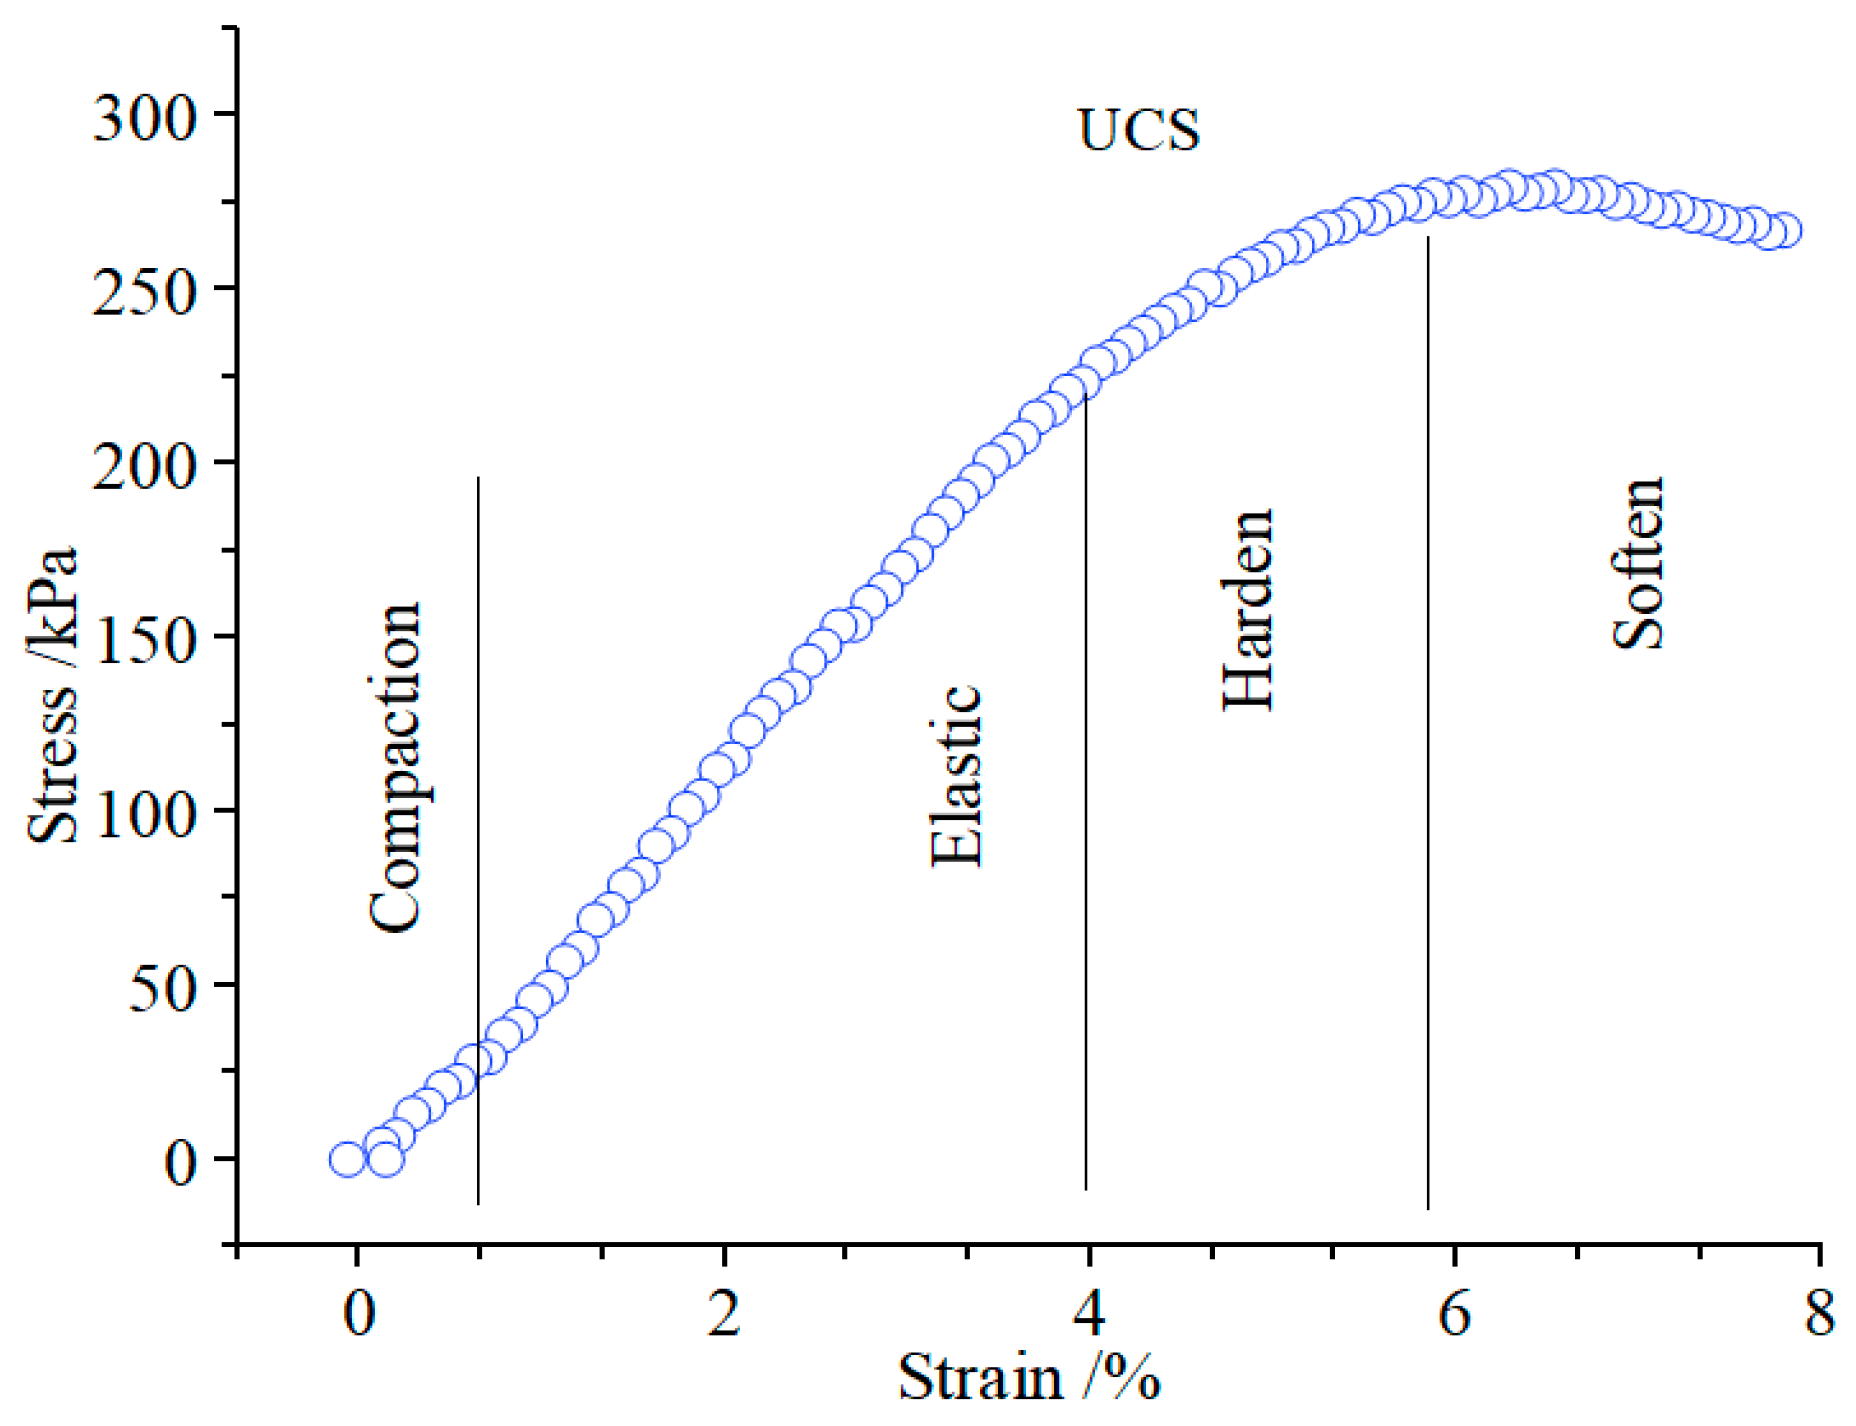
3.1. Macro Performance Analysis Using the UCS Test

As presented in Figure 2, the strain–stress curves of S/S sediments were typical strain-softening curves, which sequentially exhibited stages of compaction, elasticity, strain hardening, and strain softening. The compaction stage in the curve corresponded to the mild adjustment of weak microstructures, such as cracks. The elastic stage represented the elastic deformation of the solidification skeleton structures within S/S sediments. As the stress increased, the solidification skeleton structure yielded, and the sediment aggregates between the solidification skeletons began to support them, leading to the onset of the hardening stage. With the continuous increase in stress, the solidification skeletons and the sediment aggregates between them gradually suffered damage until reaching the UCS point, after which the softening stage ensued. The softening stage represented the deformation of the damaged solidification skeletons and sediment aggregates.
The strength development of S/S sediments is shown in Figure 3. In Figure 3, the numbers in parentheses on the strength–curing curve stand for the curing days and the corresponding UCS values; the numbers in parentheses on the strength–DW curve indicate the number of DWs and the corresponding UCS values. As presented in Figure 3, the UCS of S/S sediments increased with curing time during standard curing (at a constant temperature of 25 °C and a humidity of 95%). Before the 60th day, the UCS rose sharply as the curing time elapsed. Subsequently, the rate of UCS increase declined. By the 180th day, the increase in UCS had nearly ceased. This suggested that the enhancement of S/S sediment strength due to solidification reactions halted at around the 180th day, and the strength remained stable after 180 days of standard curing. Consequently, the specimens for dry–wet cycle simulations were those cured for 180 days under standard conditions. The UCS of the S/S sediments decreased monotonically with the progression of DWs. At the third DW, the S/S sediments lost nearly 25% of their strength. From the 6th DW to the 12th DW, the UCS continued to decrease, yet the rate of decrease was significantly smaller. By the 18th DW, the rate of strength decrease in S/S sediments declined to a minimal level, with only 20 kPa of strength lost from the 12th DW. It also proved that the maximum number of DWs determined as 18 was rational. By overall counting, nearly 50% of the strength was lost during the 18 DWs. Therefore, studying the damage mechanisms of S/S sediments during DWs using micropore measurements is necessary to provide theoretical support for performance promotion.

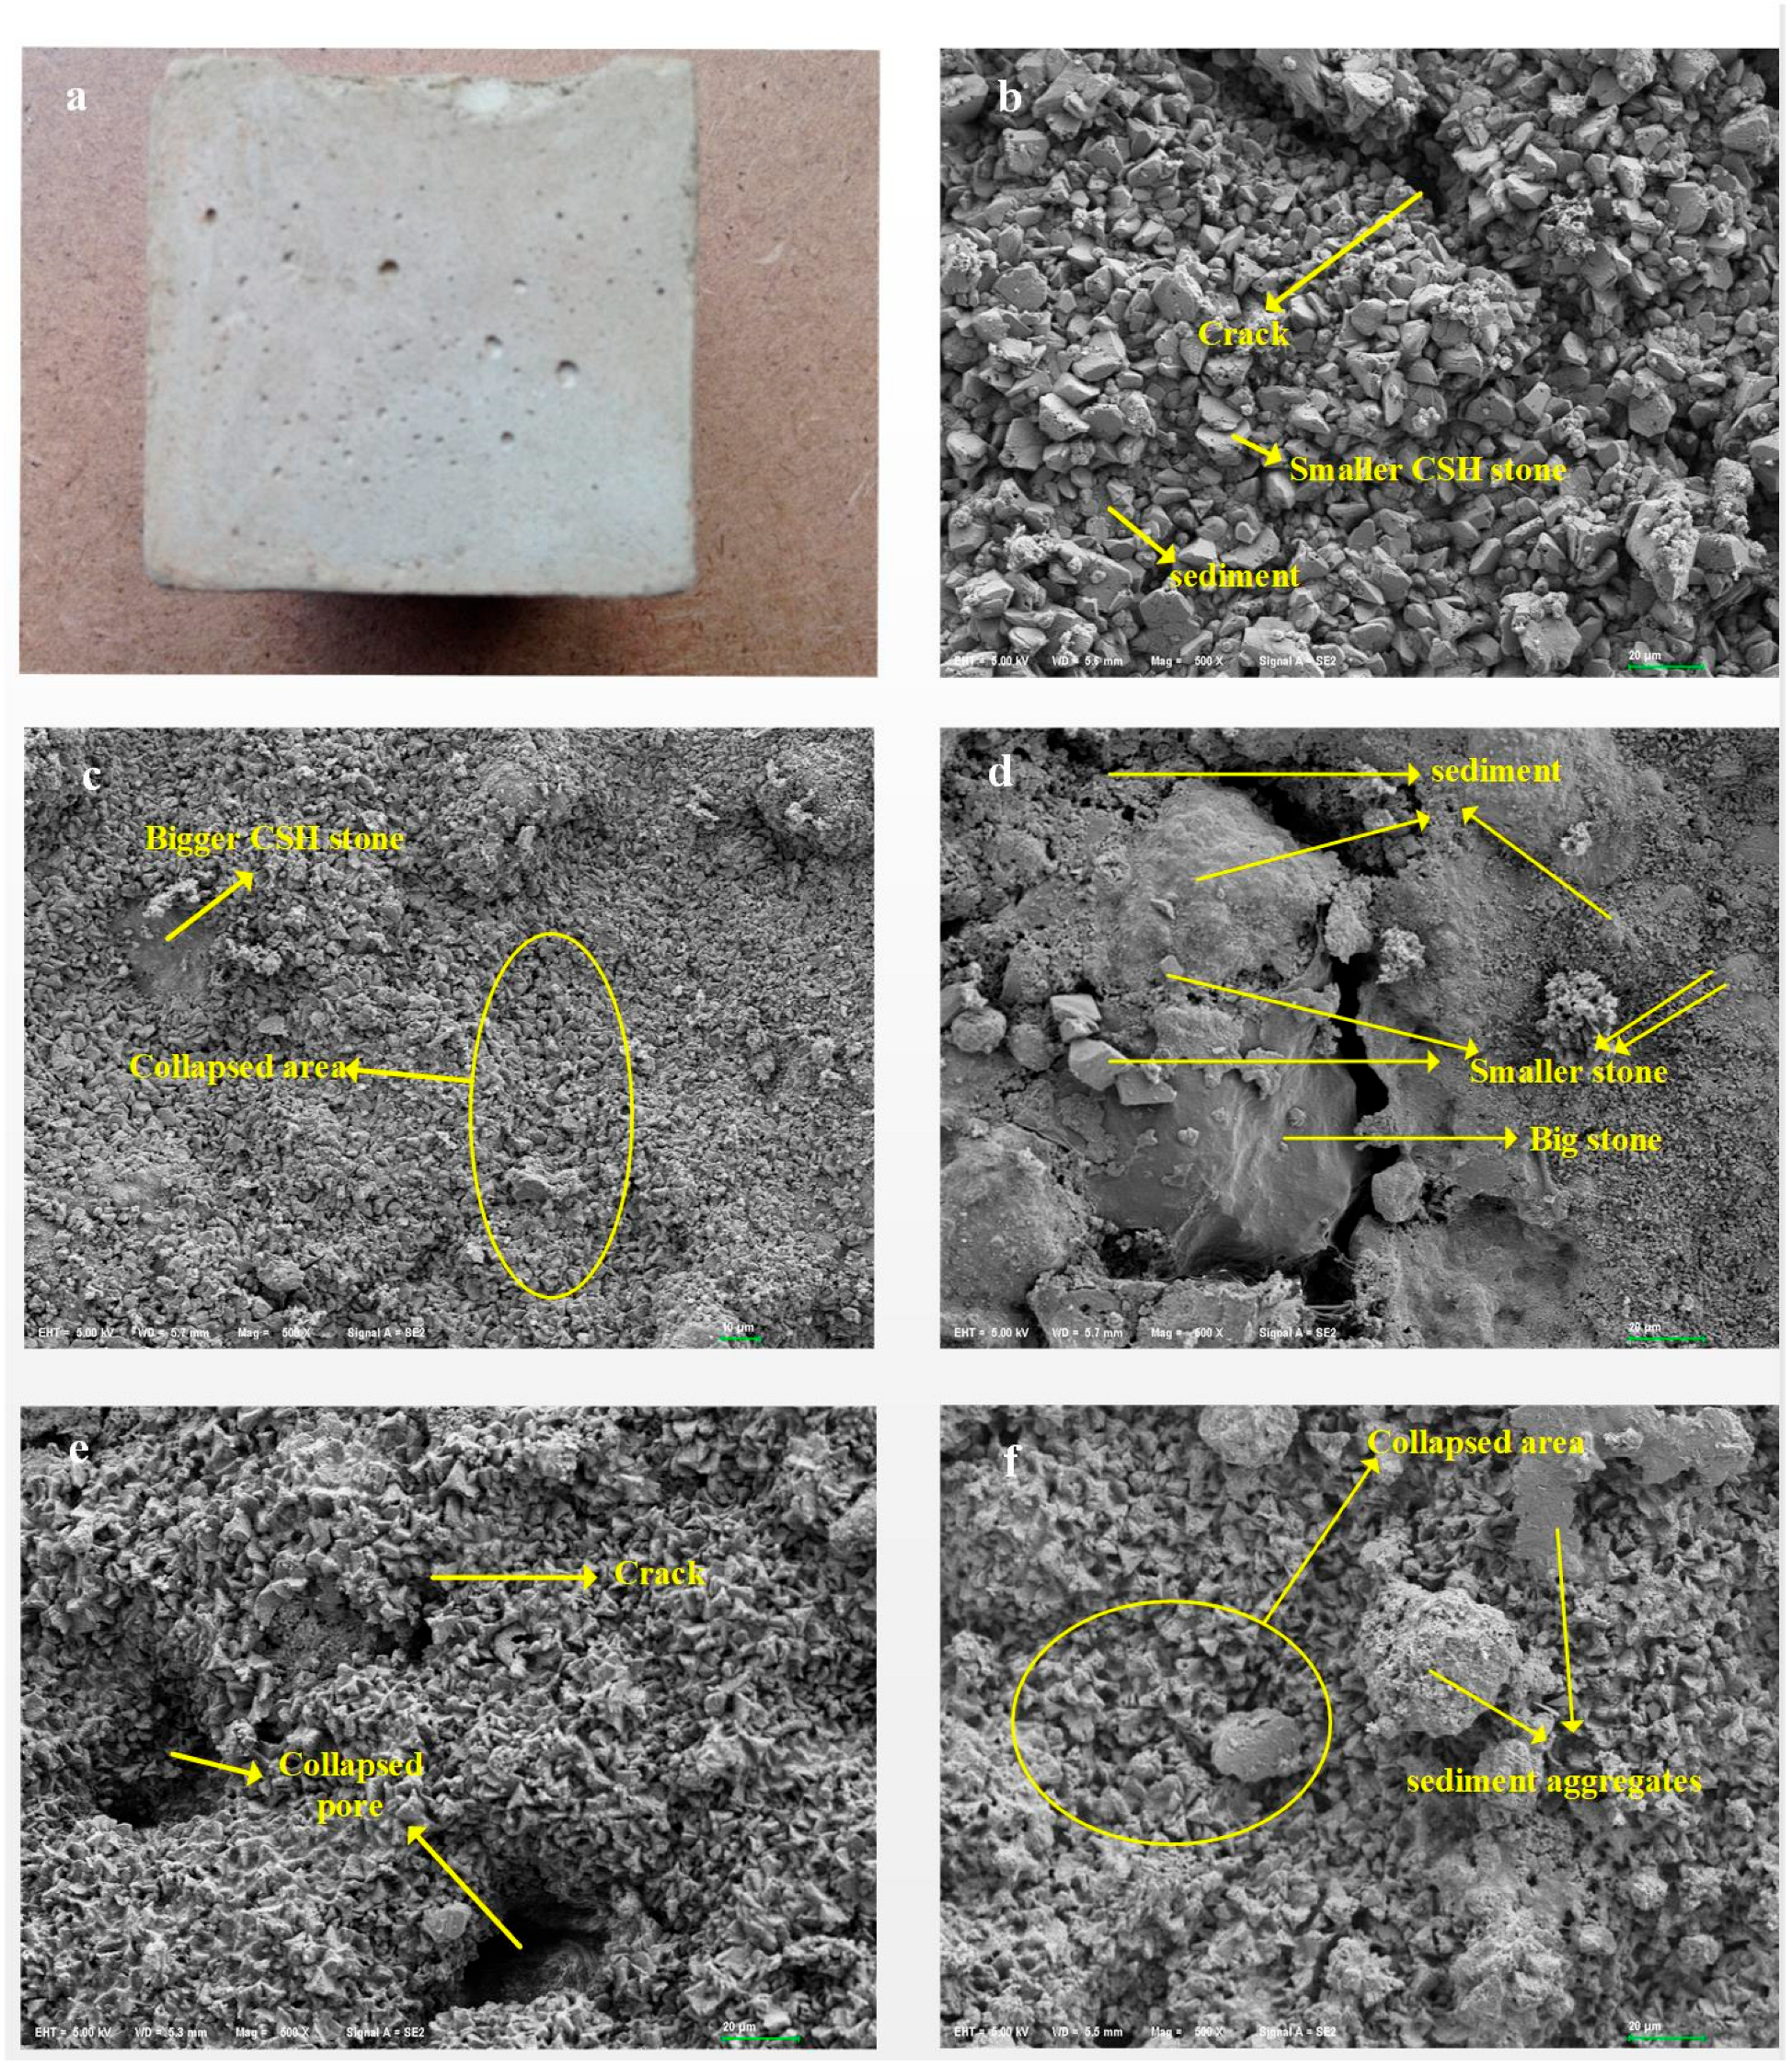
3.2. Qualitative Pore Structure Analysis Using SEM

S/S sediments were formed by solidification reactions between cement and dredged sediments. During solidification, cement and sediments were mixed as uniformly as possible. In the mixture, solidification reactions occurred, including hydration reactions, pozzolanic reactions, carbonization reactions to form the solidification skeleton, and ion-exchange granulation reactions to form the sediment aggregates. Through these reactions, solidification products such as the solidification skeletons composed of calcium silicate hydrate (CSH), calcium hydroxide (Ca(OH)2), and calcium carbonate (CaCO3), as well as sediment aggregates composed of sediment particles joined by ionic bonds, were generated. Since the solidification skeleton components are mostly composed of CSH, the solidification skeleton is labeled as the “CSH skeleton” for better understanding. As depicted in Figure 4, CSH structures of varying sizes were formed. Sediments embedded within larger CSH skeletons were granulated, and sediment aggregates and larger CSH structures were covered by smaller CSH structures. Pores within CSH skeletons, inside and among sediment aggregates, were the primary pores observed in these images.
As presented in Figure 4b, when S/S sediments had undergone no DWs, smaller CSH structures adhered closely to the surface, and the overall structure of S/S sediments appeared stable, although some original cracks were observable. As shown in Figure 4c, at the third DW, loosened regions were detected because of the wet-swelling and dry-shrinkage effects of DWs. As presented in Figure 4d, at the sixth DW, cracks between sediment aggregates and larger CSH structures were clearly visible. As shown in Figure 4e, at the 12th DW, collapsed pores were observed, indicating that a part of the internal structure of S/S sediments had been reconstructed. As depicted in Figure 4f, when S/S sediments underwent the 18th DW, collapsed areas were noted, suggesting that the entire internal structure of S/S sediments had been reconstructed.

3.3. Quantitative Pore Structure Analysis Using MIP

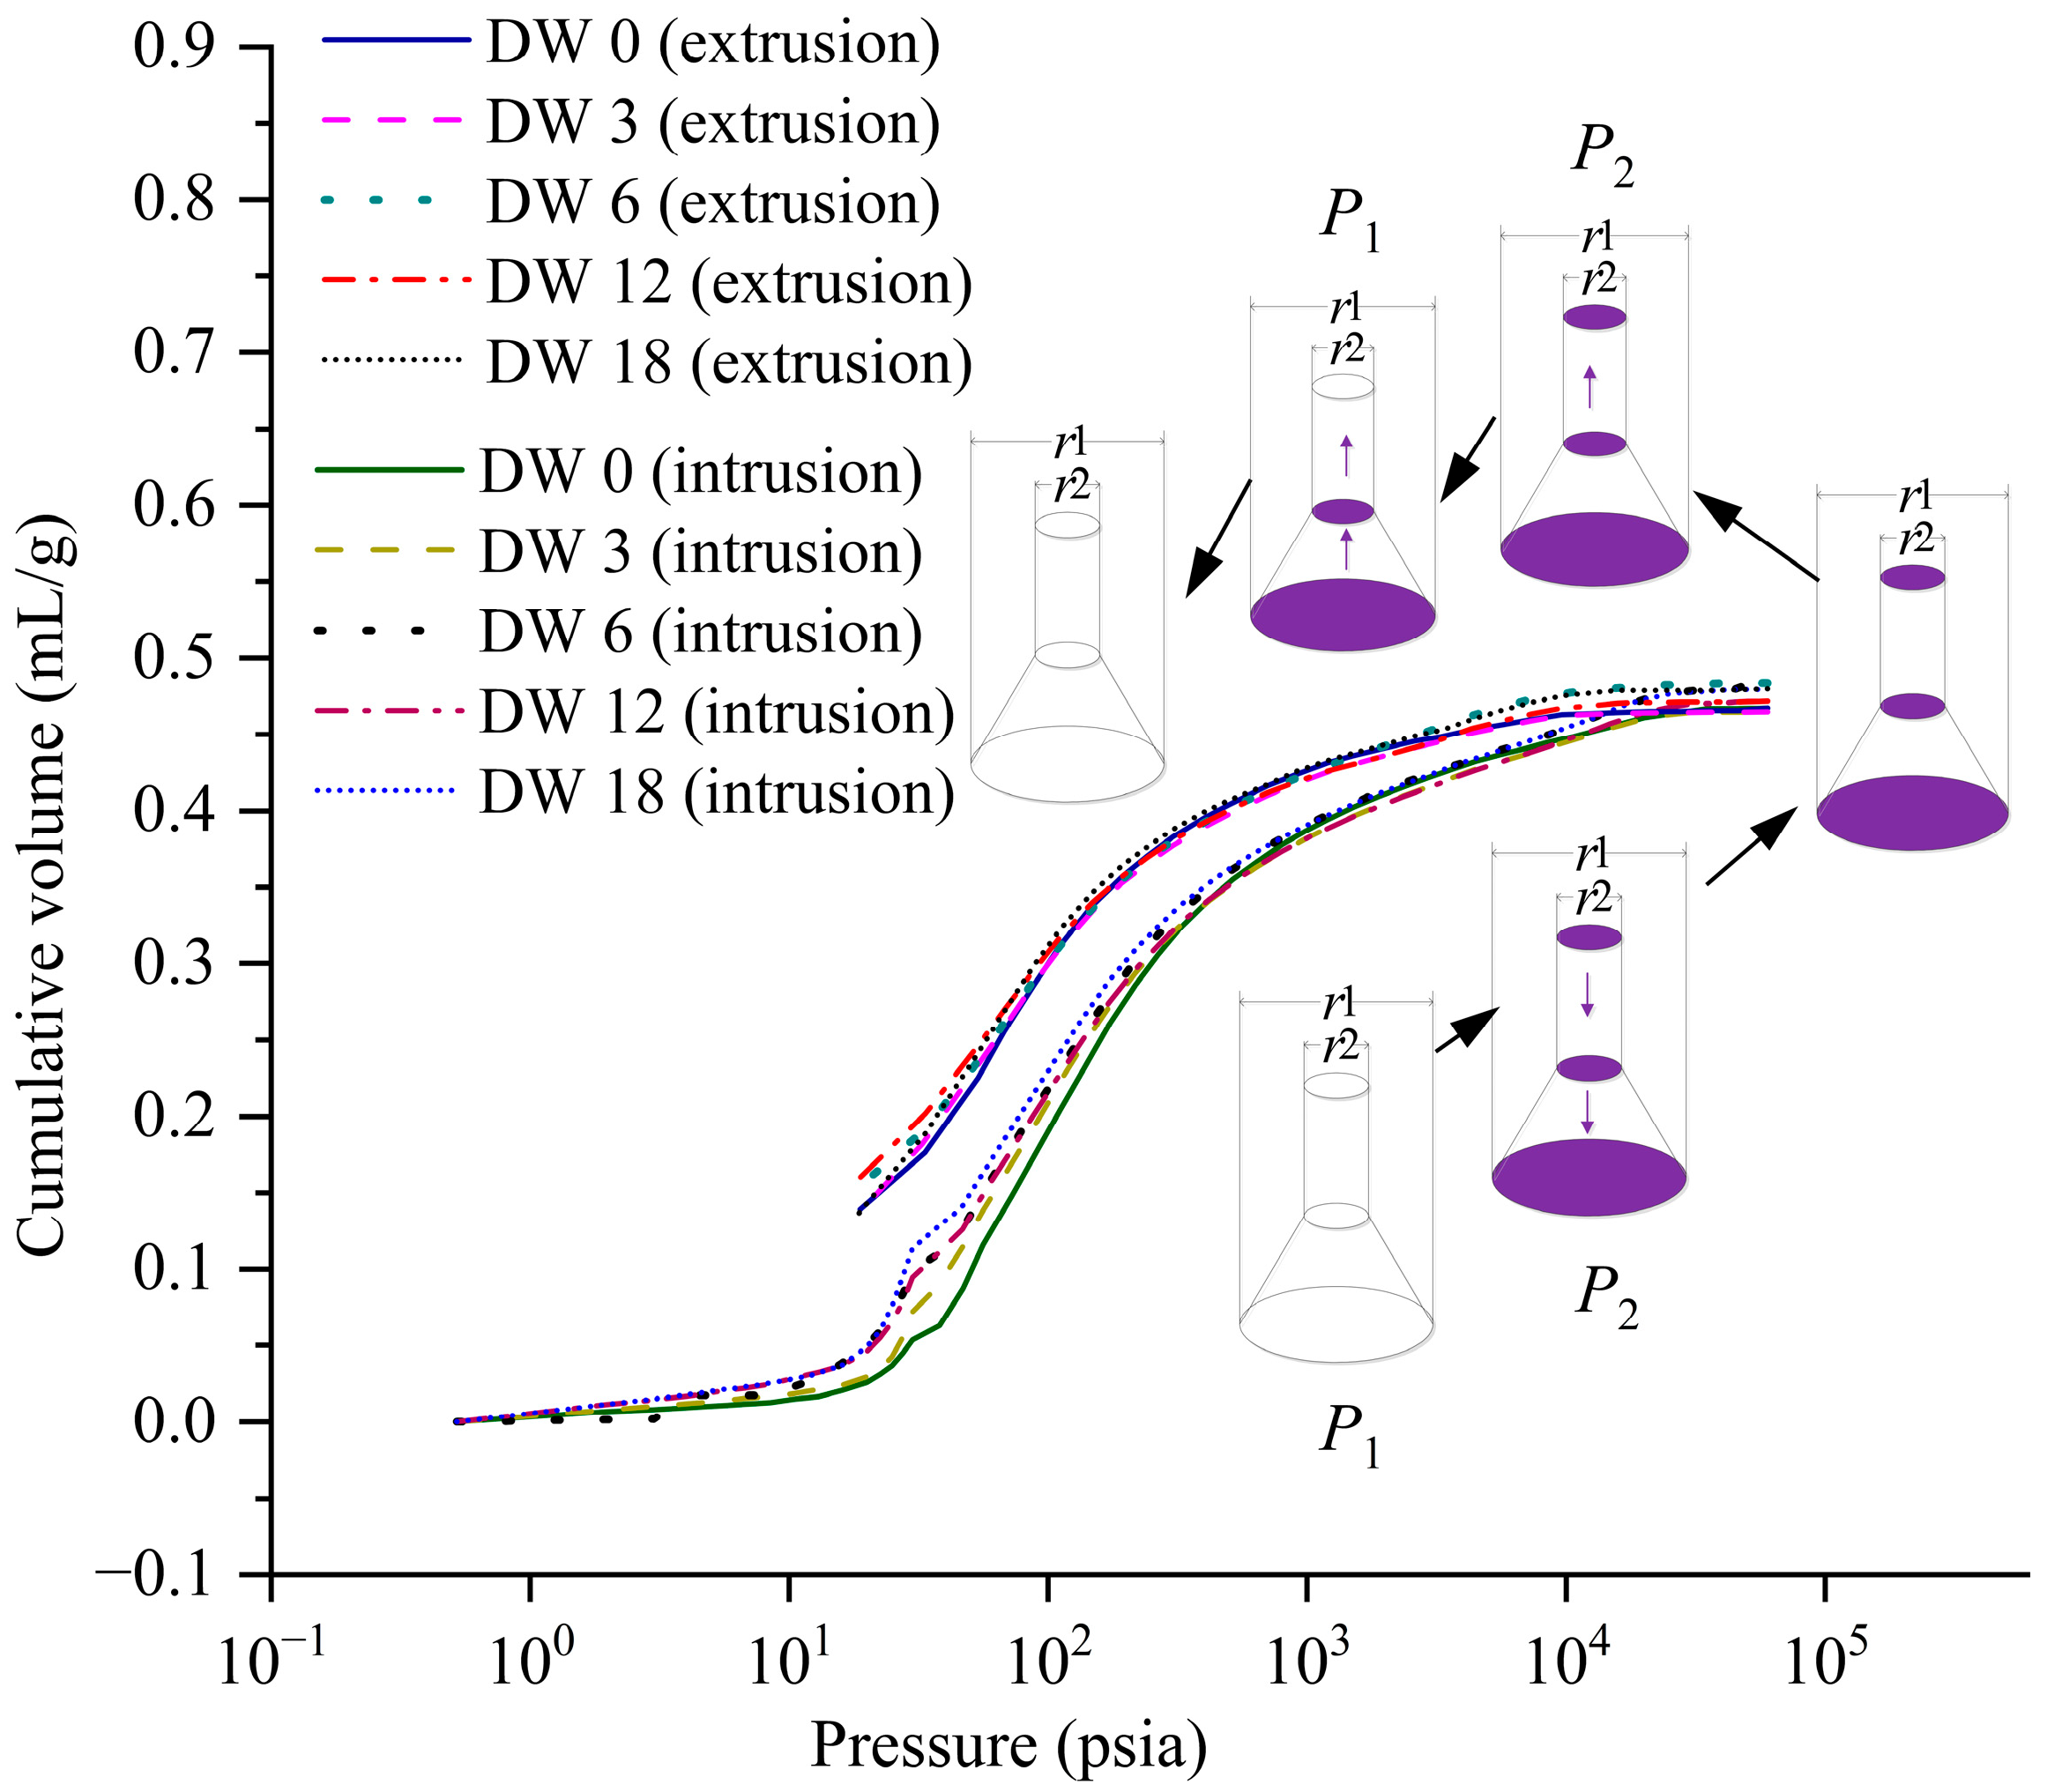
3.3.1. Intrusion–Extrusion Characteristics of S/S Sediments

The intrusion–extrusion curves of S/S sediments are presented in Figure 5. In the intrusion stage, the threshold value at which the intrusion volume began to increase with pressure was approximately 20 psia. Beyond this threshold, the intrusion volume increased sharply with pressure until the pressure reached approximately 3 × 10² psia, indicating that the pore volume in this range was quite large. Subsequently, the intrusion volume continued to increase to 104 psia at a lower rate, suggesting that the pore volume in this range was much smaller. Finally, the intrusion volume remained stable with no significant increase up to the saturated pressure P0. The extrusion volume decreased monotonically as the pressure decreased. In the extrusion stage, the curves overlapped with the intrusion curves when the pressure was greater than 104 psia, because no intrusion occurred in this range. Thereafter, the extrusion curves were consistently above the intrusion curves, forming hysteresis loops.
Hysteresis loops were induced by the presence of bottleneck pores within S/S sediments, as depicted in Figure 5. For bottleneck pores, the radius of the cavity r1 is larger than the radius of the throat r2. The cavity end is closed, whereas the throat end is open. The intrusion and extrusion of Hg were assumed to occur only through the throat end for bottleneck pores. The relationship between pore size and pressure can be described by the Washburn Equation, as presented in Equation (1). From Equation (1), it can be seen that the larger the pore size, the lower the pressure required to retain Hg; conversely, the smaller the pore size, the higher the pressure. The pressures corresponding to r1 and r2 were P1 and P2, respectively, as shown in Figure 5, where P1 < P2. During the intrusion, the cavity of bottleneck pores would not be filled with Hg until the pressure reached P2. During extrusion, Hg within the throat was extruded when the pressure decreased to P2, while Hg within the cavity was extruded when the pressure was lower than P1. Thus, hysteresis loops were formed, as shown in Figure 5.
P   r = 2 γ c o s θ
where P is the pressure (psia), r is the radius of the pores (nm), γ is the H g surface tension (485.00 dynes/cm), and θ is the contact angle (130.00°).

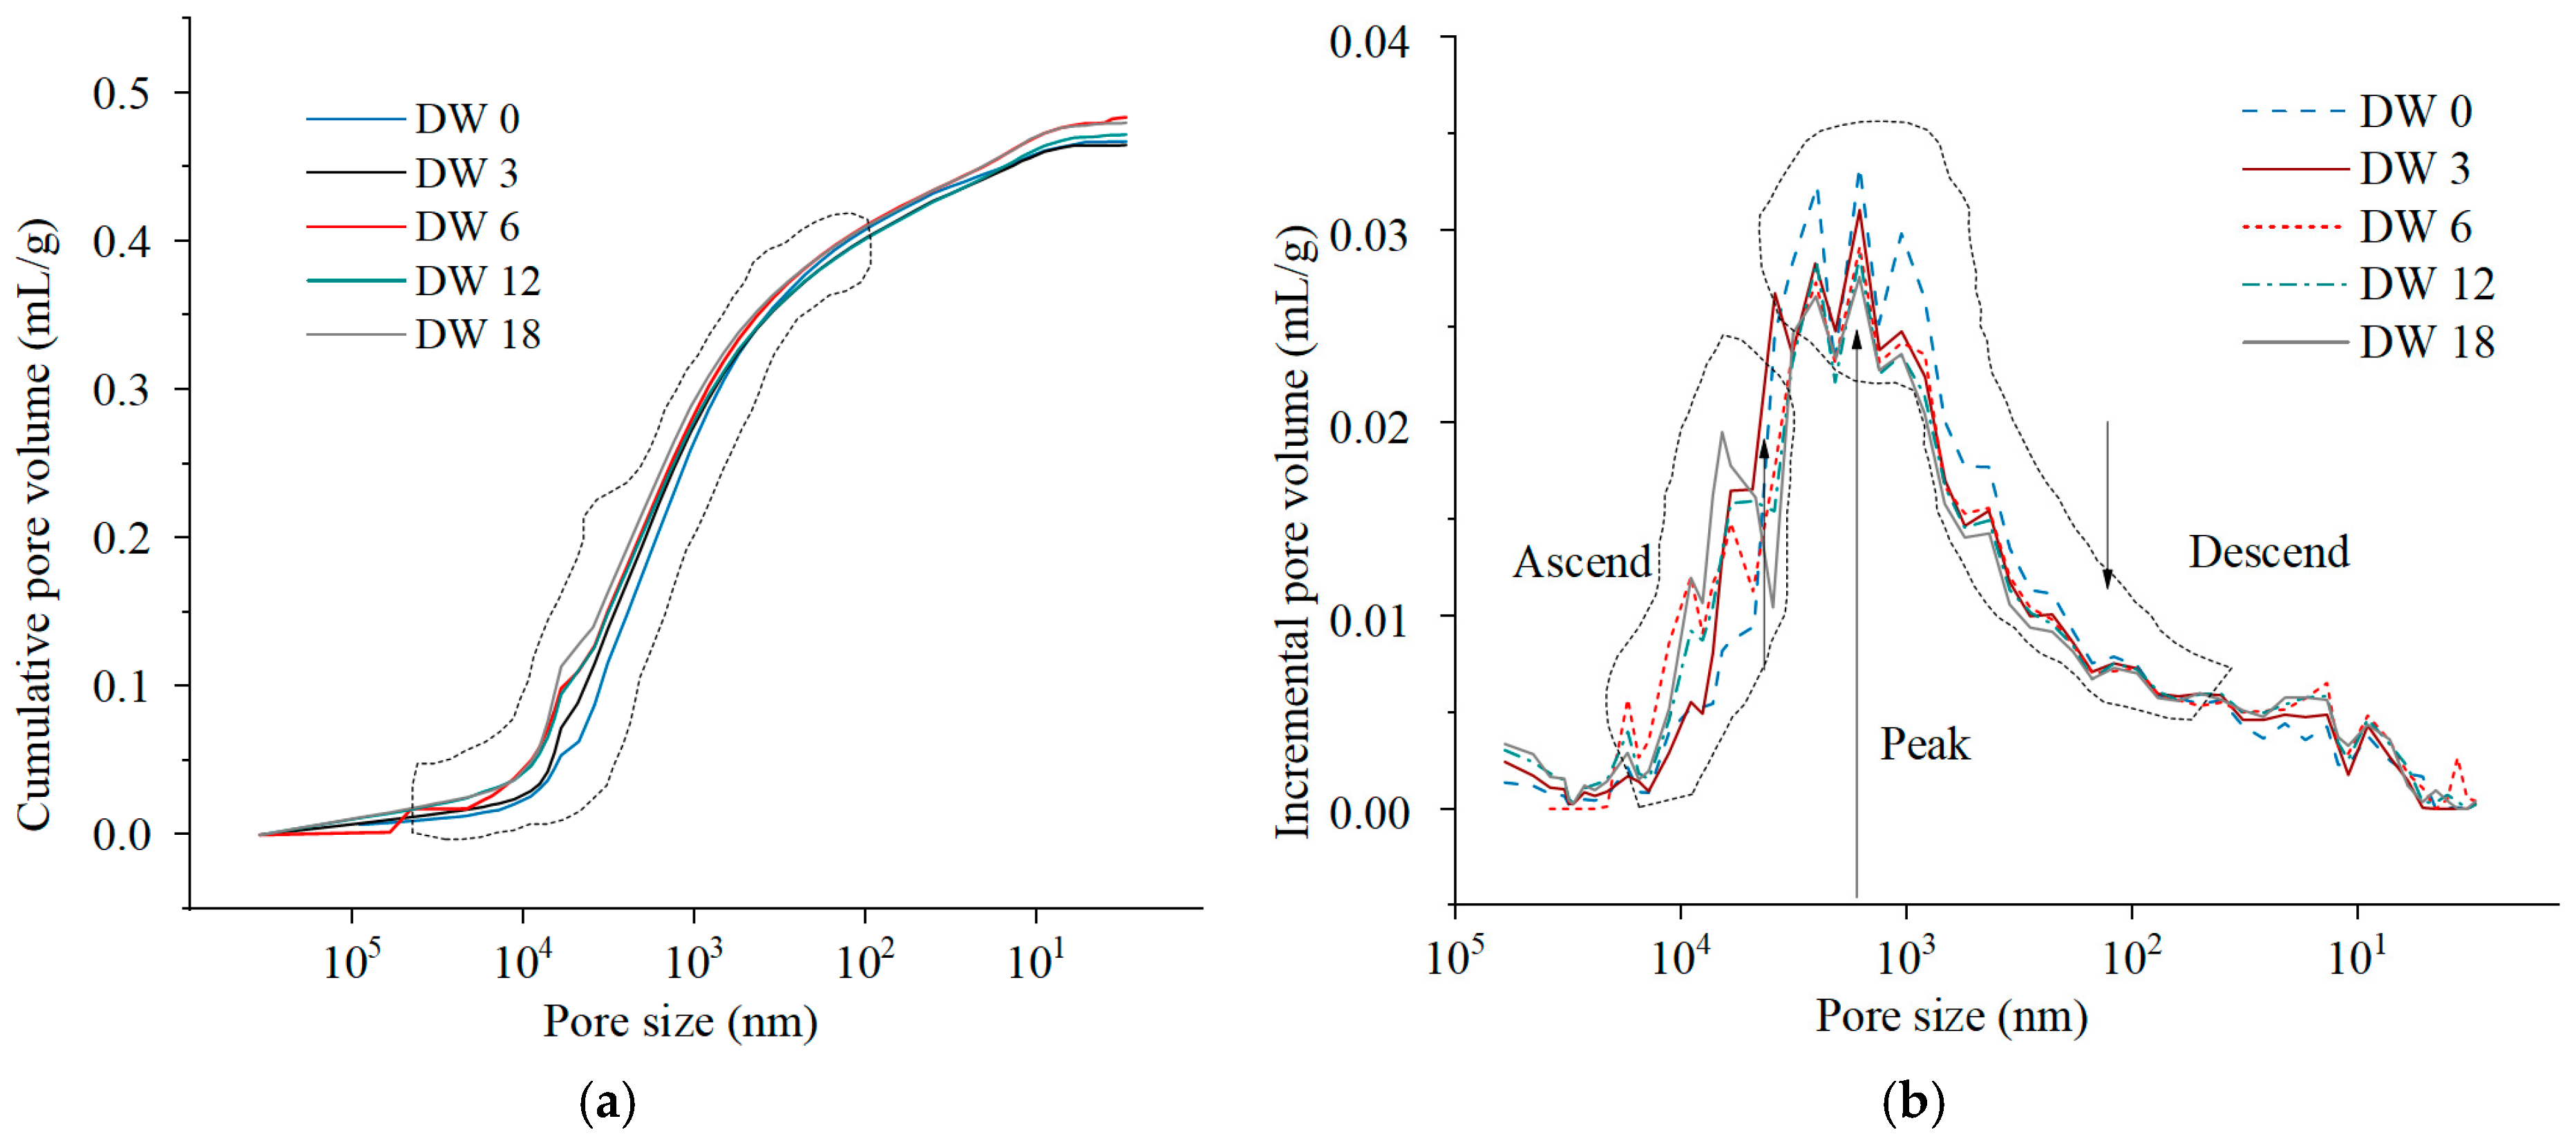
3.3.2. Pore Volume Evolution Characteristics During DWs Using MIP

Pore volume distributions were derived using the Washburn Equation (Equation (1)), as presented in Figure 6. In the cumulative pore volume curves shown in Figure 6a, the pore volume was significantly affected and monotonously increased during DWs in the range of 3 × 10⁴ nm to 102 nm, while the differences at different DWs were not regular in the ranges of 3 × 10⁴ nm < d and d < 102 nm. In the incremental pore volume curves depicted in Figure 6b, these incremental curves exhibited a single-peak pattern, with the peak position at around 2 × 10³ nm. The change in pore volume was non-monotonous but sectionalized. From 3 × 10⁴ nm to 3 × 10³ nm, the pore volume was gradually increased by DWs. Subsequently, the pore volume decreased sharply until the peak position. At the peak position, the pore volumes at different DWs were all smaller than that at DW 0. After the peak position, the pore volume was consistently decreased by DWs to approximately 102 nm. As shown in Figure 6b, the differences in incremental volume at different DWs for pores smaller than 80 nm were no longer regular, indicating that the high pressure of mercury had damaged those smaller pores, which is why NAP was employed.
The pore volume statistics are presented in Table 3. The main distribution ranges were 102 nm < d < 103 nm (where d is the pore diameter) and 103 nm < d < 104 nm. At the third DW, the pore size distribution was close to the initial state (DW 0). At the sixth DW, the pore size distribution was distinctly different: the total pore volume was much larger, the pore volumes in the ranges of 102 nm < d < 103 nm and 103 nm < d < 104 nm decreased, and the pore volumes in the ranges of d > 104 nm and d < 102 nm increased. From the 12th to the 18th DW, the pore size distributions were no longer very different.
Regarding the total pore volume, the variation in volume ranged from 0.002 mL/g to 0.017 mL/g. For pores in which d > 104 nm, the variation in volume ranged from 0.003 mL/g to 0.021 mL/g. For pores in which 103 nm < d < 104 nm, the variation in volume ranged from 0.003 mL/g to 0.008 mL/g. For pores in which 102 nm < d < 103 nm, the variation in volume ranged from 0.015 mL/g to 0.025 mL/g. For pores in which d < 102 nm, the variation in volume ranged from 0.004 mL/g to 0.014 mL/g. Since the pore volumes in the ranges of d > 104 nm and d < 102 nm were much smaller than those in the ranges of 102 nm < d < 103 nm and 103 nm < d < 104, and the variation ranges were not particularly different among the four distribution ranges, it can be concluded that the most severely affected pores were those in the ranges of d > 104 nm and d < 102 nm.

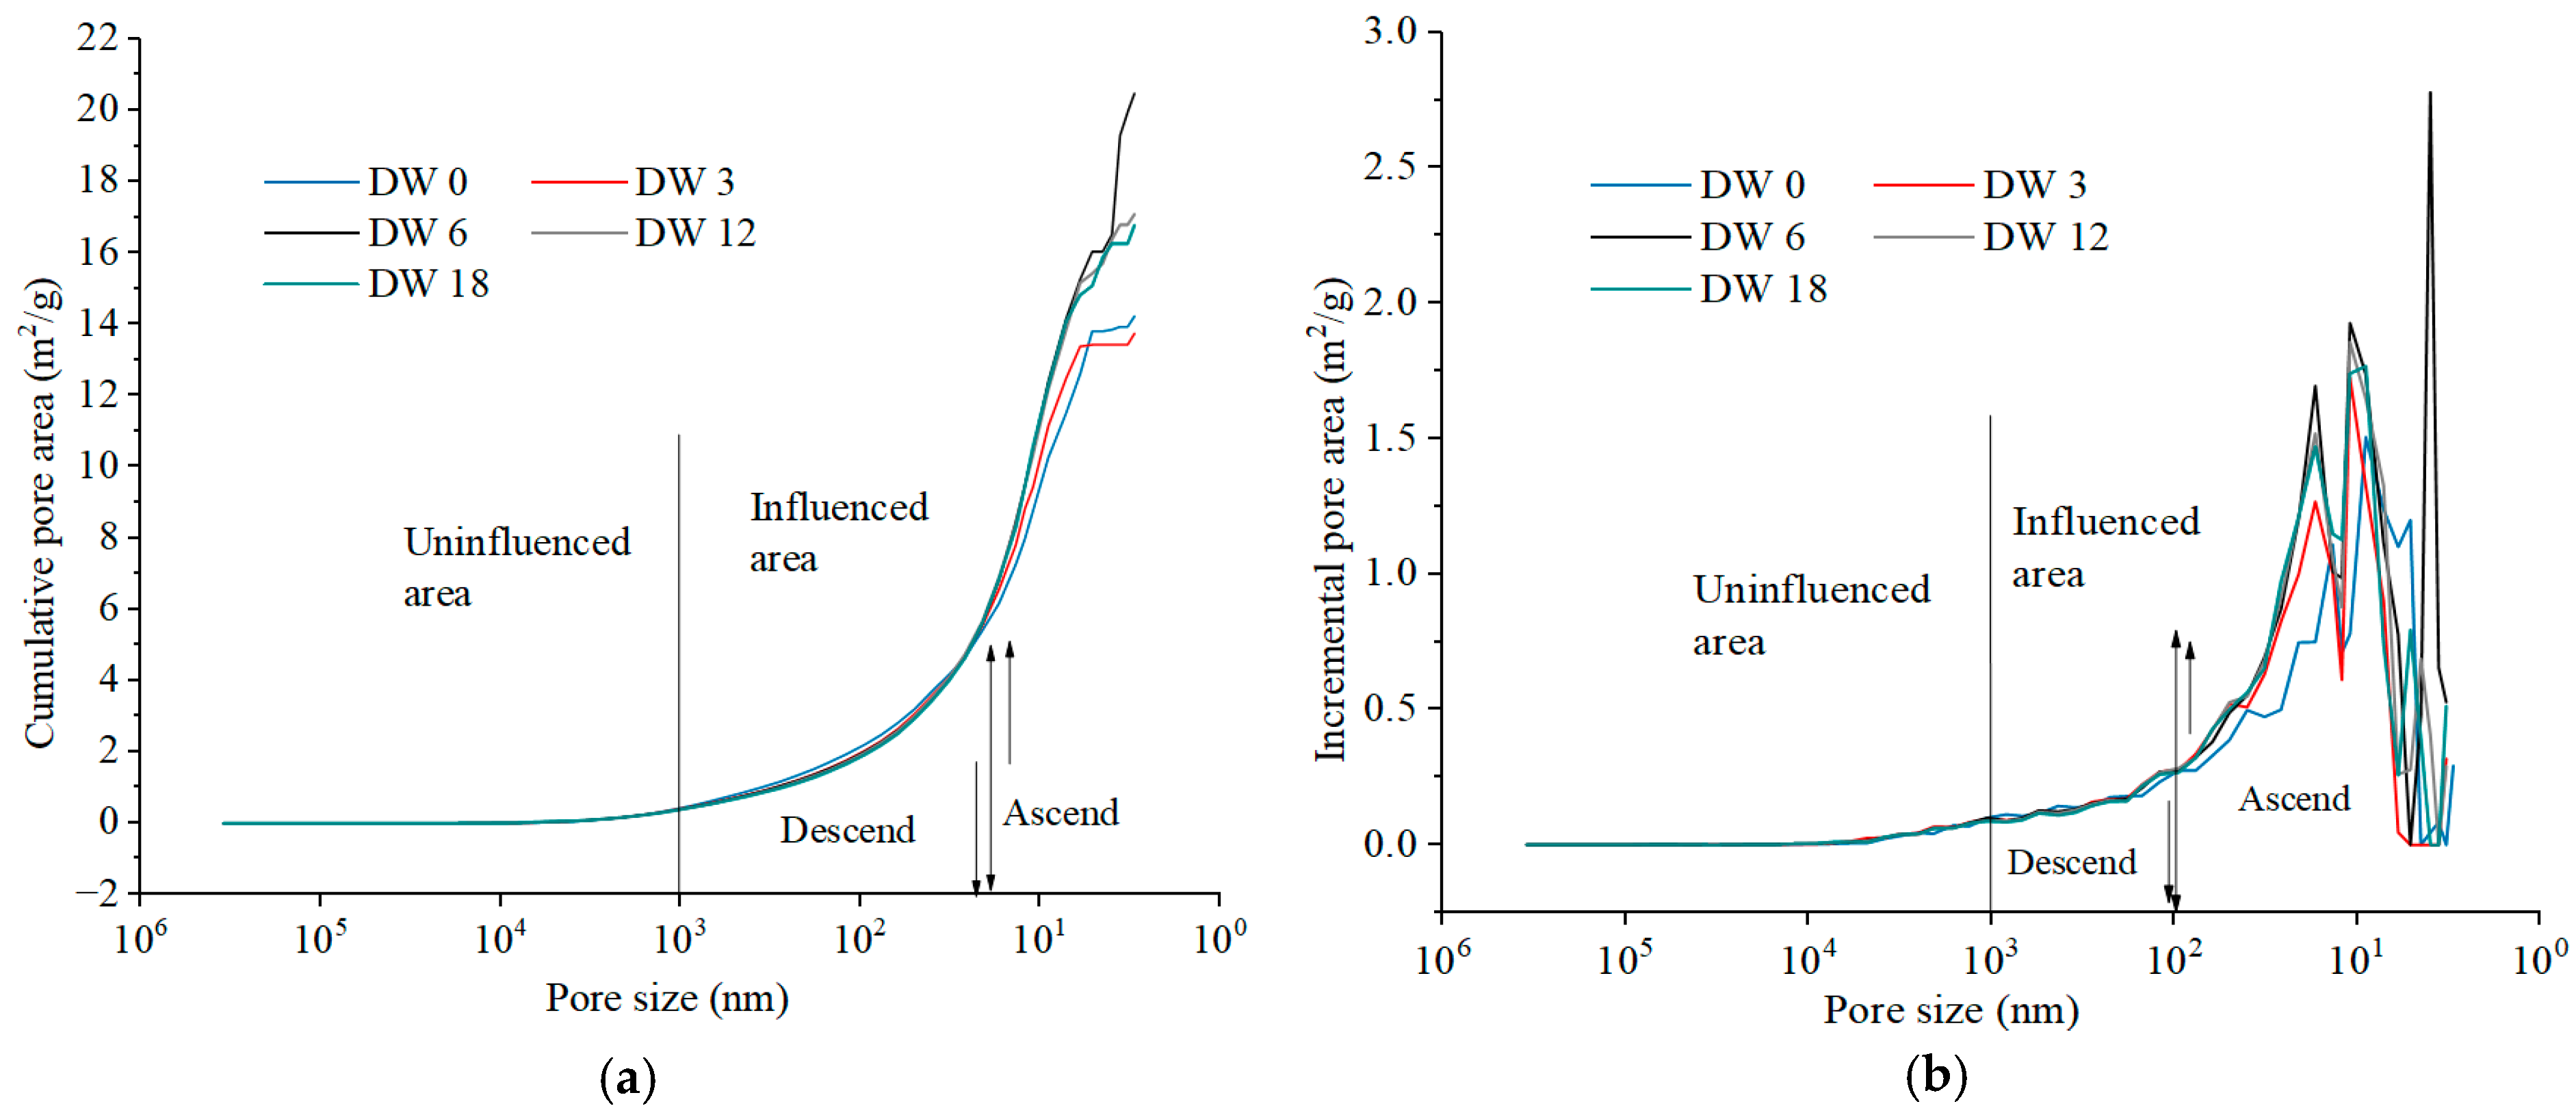
3.3.3. Pore Surface Area Evolution Characteristics During DWs Using MIP

Pore surface area distributions were derived using Equation (2), which was developed from the Washburn Equation, as shown in Figure 7. In the cumulative pore area distributions presented in Figure 7a, only pores within the range of d < 103 nm were affected by DWs. For pores in the range of 20 nm < d < 103 nm, the pore areas decreased due to DWs, while for pores in the range of d < 20 nm, the pore areas increased as a result of DWs. In the incremental pore area distributions depicted in Figure 7b, similar to the cumulative area distributions, pore areas were altered by DWs only for pores in the range of d < 103 nm. The difference was that the pore areas increased due to DWs at d = 103 nm and then began to decrease at d = 102 nm, whereas the cumulative pore areas continued to increase until d = 20 nm.
d S = P d V γ c o s θ
where P is the pressure (psia), γ is the H g surface tension (485.00 dynes/cm), θ is the contact angle (130.00°), d S is the pore surface area in a certain pressure range (m2/g), and d V is the intrusion volume in a certain pressure range (mL/g).
Pore area statistics are presented in Table 4. The dominant distribution ranges of pore areas, listed sequentially, were d < 102 nm, 102 nm < d < 103 nm, 103 nm < d < 104 nm, and d > 104 nm. Nearly 90% of the pore areas are distributed in the range of d < 102 nm. At the third DW, the pore area distributions did not change significantly compared to the initial state. At the sixth DW, the pore areas in the range of 102 nm < d < 103 nm and 103 nm < d < 104 nm decreased slightly, while those in the range of d < 102 nm and d > 104 nm increased sharply by more than 50%. From the 12th to the 18th DW, the pore areas in the range of 102 nm < d < 103 nm and 103 nm < d < 104 nm decreased continuously, while those in the range of d < 102 nm and d > 104 nm decreased sharply by approximately 20%. Thus, it can be concluded that the pores mainly affected were those in the range of d < 102 nm and d > 104 nm, where the pore areas increased initially. Moreover, when compared with the pore volume distributions of S/S sediments in Table 3, pores in the range of d < 102 nm accounted for a large proportion of pore areas but a small proportion of pore volumes in S/S sediments at each DW.

3.4. Quantitative Micropore Structure Analysis Using NAP

3.4.1. Adsorption/Desorption Characteristic of S/S Sediments

Adsorption/desorption isothermals of S/S sediments are presented in Figure 8. As depicted in Figure 8, the adsorption volume increased monotonically with the pressure increase at liquid nitrogen temperature. When P / P 0 < 0.3 ( P —pressure; P 0 —saturated vapor pressure), the adsorption volume increased very slightly with the increase in pressure. When 0.3 < P / P 0 < 0.85 , the rate of increase in the adsorption volume gradually rose with the pressure increase. When P / P 0 > 0.85 , the adsorption volume increased sharply with the pressure increase up to the saturated vapor pressure P 0 . According to the IUPAC classification [34], the adsorption isothermal was classified as Type 3, indicating that the sorption between the adsorbent (S/S sediments) and the adsorbate (nitrogen gas) was very weak, and the adsorption of nitrogen was mainly produced by micropore filling through nitrogen capillary condensation. In this case, nitrogen condensed inside the pores and pore sizes can be determined based on the Kelvin formula, as shown in Equation (3). According to Equation (3), in the lower pressure range, the corresponding capillary condensation radius was as small as the nitrogen molecule size, resulting in very little condensation—with an adsorption volume close to 0. In the higher pressure range, pores were gradually filled by capillary condensation with the pressure increase, as shown in Figure 8.
r k = 2 t v m cos Φ / ( R T l n p / p 0 )
where r k is the capillary meniscus curvature radius (nm), T = 77.3°K, v m = 34.65 mL/g, t = 8.85 dyne/cm, Φ = 0°, R = 8.315 × 10⁷ erg (degree. gram molecule), p / p 0 is the relative pressure, r is the pore size (nm), and r k increases monotonously with p / p 0 .
As depicted in Figure 8, the desorption volume increased monotonically with the pressure decrease at liquid nitrogen temperature, which was in synchronization with the adsorption volume isothermal. However, most portions of the desorption isothermals were above the intrusion isothermal before P / P 0 decreased to about 0.425 (blue squares), giving rise to the formation of the hysteresis loop. According to the IUPAC classification [28], the hysteresis loop in this case was classified as Type H3, as shown in Figure 8. This type of hysteresis loop represented the particle slit pore structure in S/S sediments, implying that the solidification particles and sediment particles inside S/S sediments were distributed as sheets, and pores were slits, as shown in Figure 8. For this kind of pore structure, as shown in Figure 8, r 1 = and   r 2 = during the adsorption stage, while r 1 = r 0 and   r 2 = during the desorption stage. Here, r 0 is the radius of capillary condensation pores formed between the slits during adsorption. Consequently, the pressure for desorption was much lower than that for adsorption, and the pressure for capillary condensation during adsorption was high because r 1 is very large.

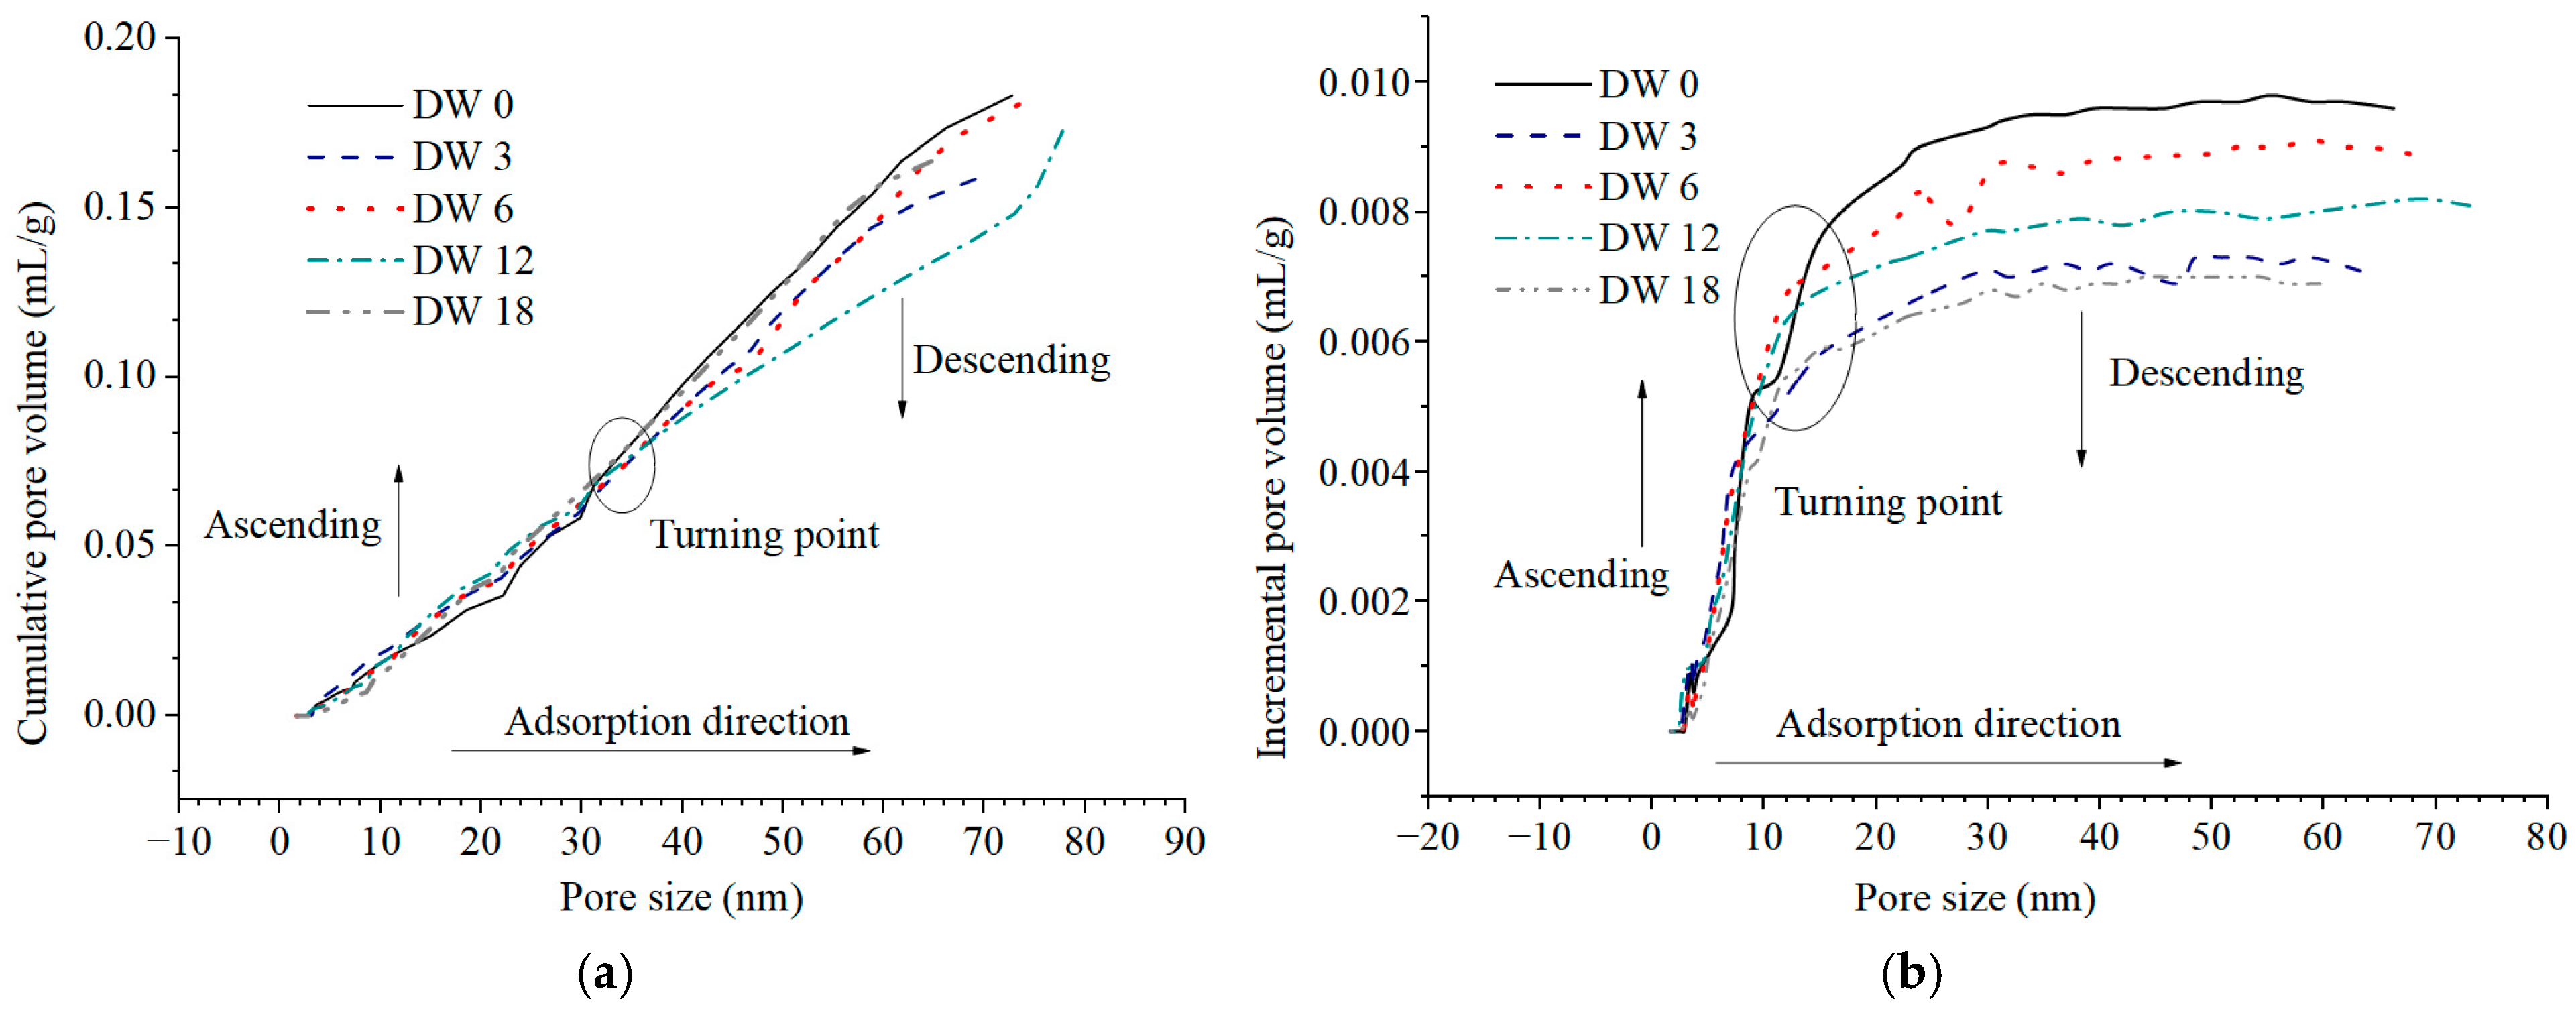
3.4.2. Pore Volume Evolution Characteristics During DWs Using NAP

The pore volume evolution characteristics of S/S sediments during DWs are presented in Figure 9. As depicted in Figure 9a, the cumulative pore volume increased nearly linearly with pore size. There was a turning point at approximately 30 nm. Prior to this turning point, the pore volume of the initial S/S sediments (at DW 0) was smaller than that of all other S/S sediments at different DWs. After the turning point, the pore volume of the initial S/S sediments was larger than that of all the other S/S sediments. As shown in Figure 9b, the incremental pore volume of sediments increased sharply initially before 20 nm, and then the curve bent, with the increasing rate gradually decreasing until it became stable. Similar to the cumulative pore volume curves, there was a turning point at about 10 nm for S/S sediments at different DWs. Before the turning point, the pore volume of the initial S/S sediments was smaller than that of the others. After the turning point, the initial S/S sediments had a larger pore volume than the others.
It can be clearly concluded from Figure 9 that the pore volume of S/S sediments was altered by DWs. For pores smaller than 10 nm, they expanded. As a result, the pore volume of S/S sediments increased with the progression of DWs. From 10 nm to 30 nm, the pores were gradually compressed. Consequently, the pore volume of S/S sediments gradually decreased during DWs and eventually became equal to that of the initial S/S sediments. For pores larger than 30 nm, they were continuously compressed, and the pore volume of S/S sediments gradually declined during DWs.
According to the IUPAC classification, pores are classified as micropores, mesopores, and macropores, as counted in Table 5. As shown in Table 5, the primary pores within S/S sediments were mesopores, accounting for nearly 70% of the total pore volume, with macropores accounting for approximately 30%. Micropores smaller than 2 nm were not detected using NAP. The total pore volume decreased during DWs, with the proportion of mesopores increasing and the proportion of macropores decreasing. Thus, it can be concluded that under the influence of DWs, the pore volume of S/S sediments decreased as a result of macropore compression.

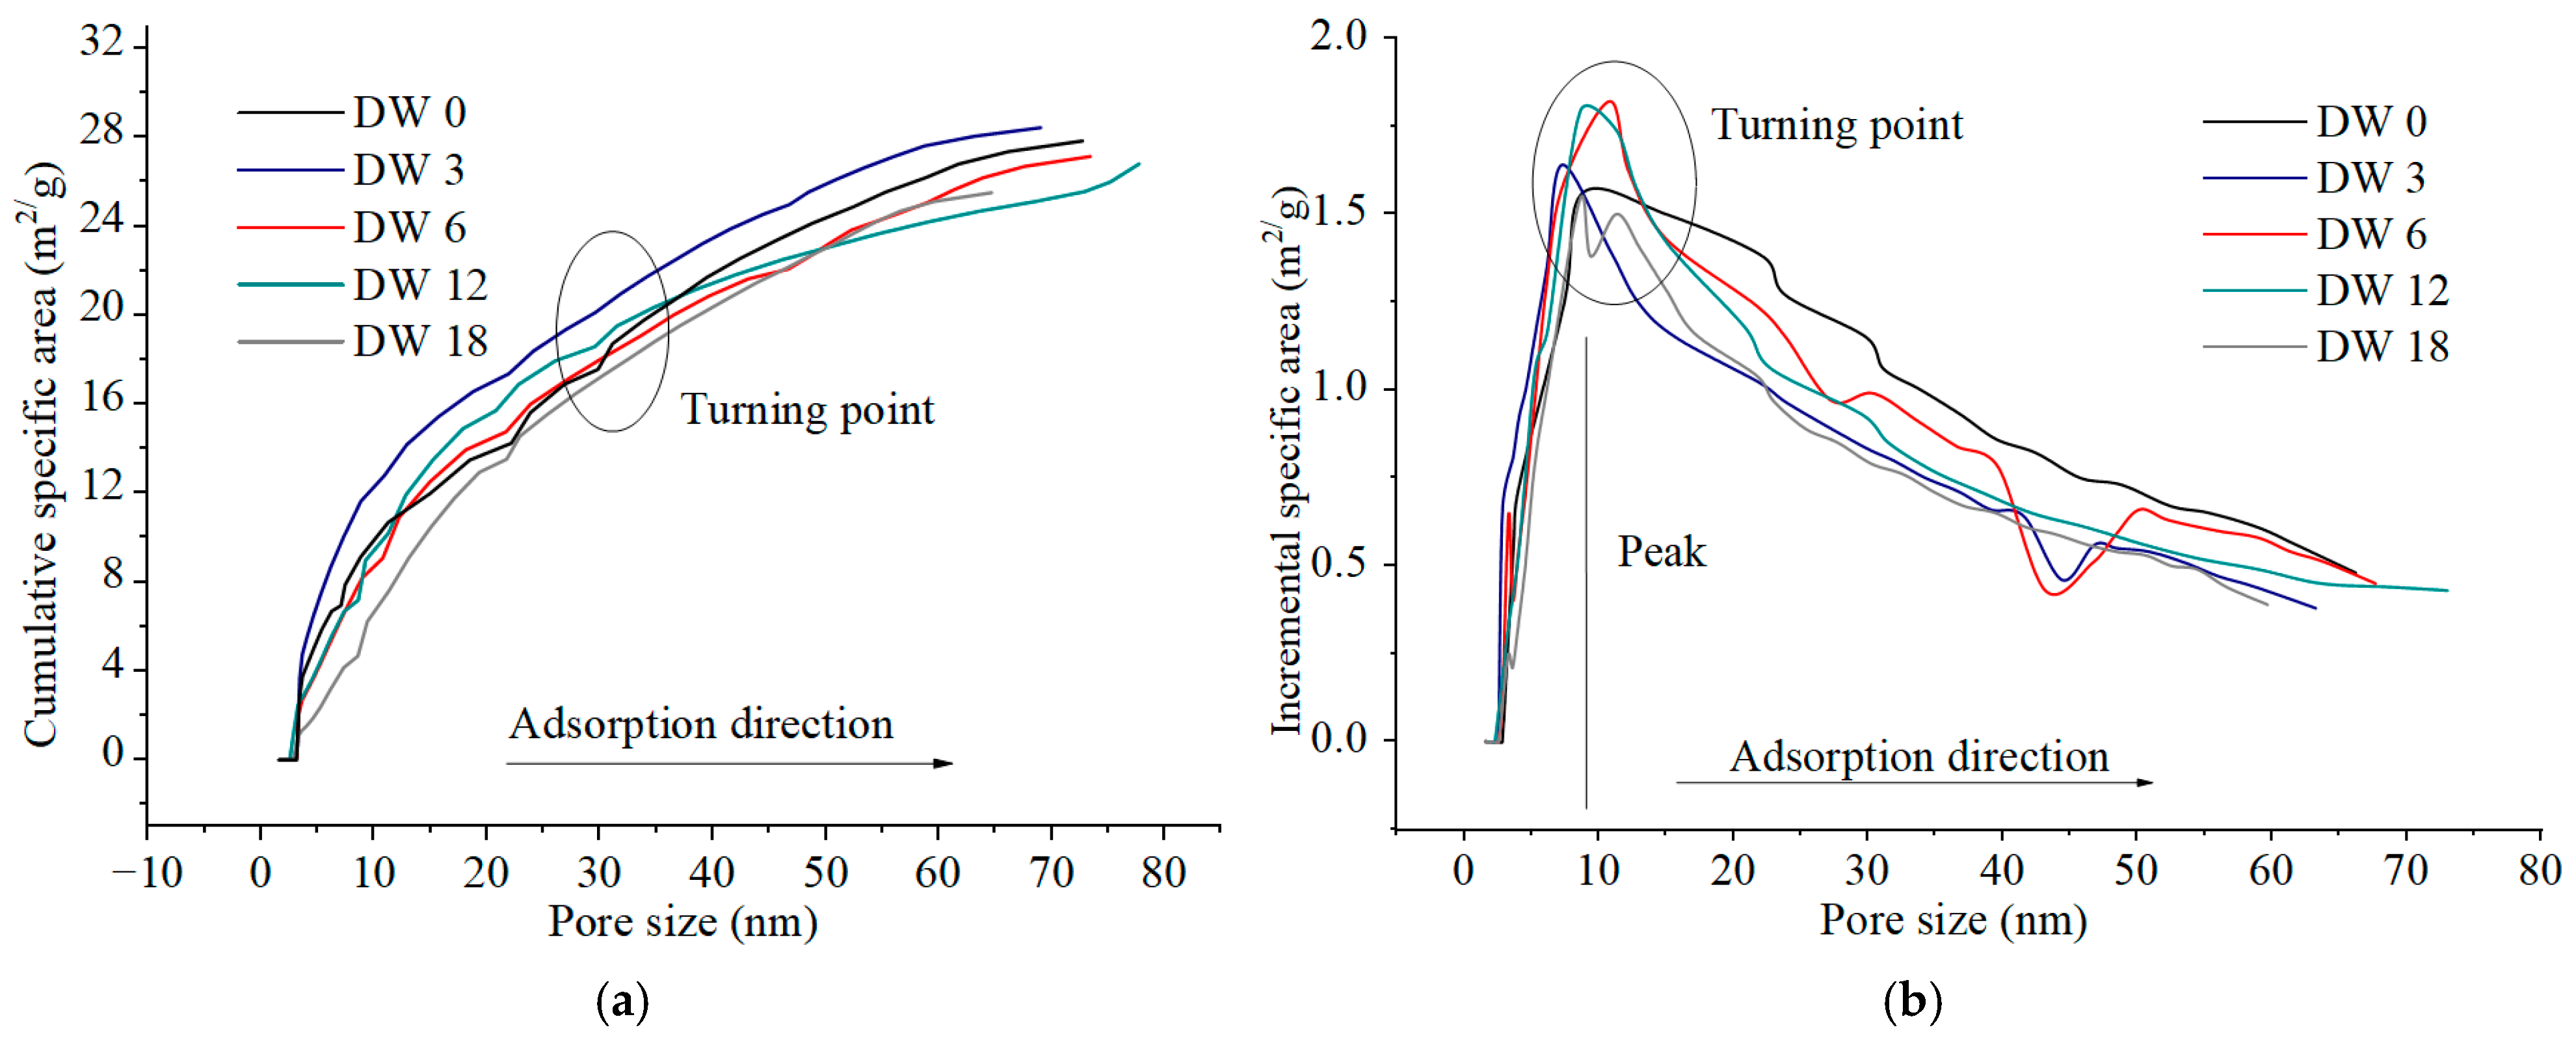
3.4.3. Pore Area Evolution Characteristics in DWs Using NAP

The specific area was obtained using the BET multi-point method, as shown in Equation (4). By linear fitting of x and x / V i 1 x , we obtained V m = 1 / ( a + b ) , where a = ( ( C 1 ) ) / ( V m C ) was the gradient of the fitted straight line, and b = 1 / ( V m C ) was the intercept.
x / ( V i 1 x ) = 1 / ( V i 1 x ) + C 1 x / ( V m C ) S B E T M = 4.36 × V m
where x is the N2 pressure P / P 0 (0.05 < x < 0.30), V m is the N2 volume needed to form the unimolecular layer (mL/g), V i is the adsorbed N2 for every gram of material at the specified pressure in adsorption isothermals (mL/g), C is the BET constant (which did not need to be determined), and S B E T M is the specific area (m2/g).
The pore area evolution characteristics during DWs are presented in Figure 10. As depicted in Figure 10a, the cumulative pore area of S/S sediments increased gradually with pore size, and the rate of increase gradually decreased. Similar to the cumulative pore volume curves of S/S sediments, there was also a turning point at approximately 30 nm. Prior to this turning point, the pore area of the initial S/S sediments was smaller than that of other S/S sediments. After the turning point, the pore area of the initial S/S sediments was larger than that of other S/S sediments. The cumulative pore area of S/S sediments at the third DW was an exception, being consistently larger than those of other S/S sediments. As shown in Figure 10b, the incremental pore area of S/S sediments increased sharply with pore size initially and then gradually decreased starting from 10 nm. Similarly, there was a turning point at about 10 nm where the peak occurred. Before the turning point, the pore area of the initial S/S sediments was smaller than that of other S/S sediments. After the turning point, the pore area of the initial S/S sediments was larger than that of other S/S sediments.
It can be concluded from Figure 10 that the pore area of S/S sediments was altered by DWs in a manner similar to the pore volume. For pores smaller than 10 nm, they expanded. As a result, the pore area of S/S sediments increased with the progression of DWs. In the range from 10 nm to 30 nm, the pores were gradually compressed. Consequently, the pore area of S/S sediments gradually decreased during DWs and eventually reached the same level as that of the initial S/S sediments. For pores larger than 30 nm, they were continuously compressed, and the pore area of S/S sediments gradually declined during DWs until the end of the process.
There were certain differences when compared to the pore volume evolution of S/S sediments. At the third DW, the pore area was larger than that of all other S/S sediments, as shown in Figure 10a, while the pore volume was smaller than most of the other S/S sediments, as shown in Table 5. Thus, it is deduced that pores of S/S sediments at the third DW were compressed, leading to a decrease in pore volume, and then fragmented and split into smaller pores, leading to an increase in pore area. For S/S sediments subjected to more DWs, the pores were compressed, resulting in a decrease in both pore volume and pore area. For S/S sediments at the 18th DW, the pore area was smaller than that of all other S/S sediments for pores smaller than 30 nm. This suggested that the pores of S/S sediments were perforated and interconnected after continuous expansion/compression alternation, which could be corroborated by the decrease in pore volume of smaller pores (less than 10 nm) shown in Figure 9.
The pore area statistics of total pores, micropores, mesopores, and macropores are tabulated in Table 6. Mesopores accounted for more than 85% of the pore area. The total pore area of S/S sediments decreased during DWs, except the third DW. As analyzed above, this was because the pores were compressed and fragmented into smaller pores. The proportion of mesopore areas increased during DWs, while that of macropores decreased, except in the third DW. In the third DW, the area of mesopores was the biggest, while that of macropores was the smallest. So, it could be deduced that some of the bigger pores were compressed into smaller pores. The pore area evolution was generally synchronized with the pore volume evolution. This implies that the primary impact of DWs was expansion and compression, rather than other reactions such as fragmentation or perforation.

4. Damage Mechanisms of S/S Sediments Under DWs

During DWs, expansion forces were generated in the wet stage as a result of the swelling of sediment particles, and shrinkage forces were generated in the dry stage due to the shrinkage of sediment particles. These expansion and compression forces alternated. During each DW, pores of different sizes exhibited different deformation responses; some were expanded while others were compressed. Through UCS, SEM, MIP, and NAP analyses, the damage mechanisms of S/S sediments subjected to DWs were deduced, as shown in Figure 11.

4.1. Generation and Transmission of Expansion and Shrinkage Forces

As illustrated in Figure 11a, expansion and shrinkage forces inherently arise in clay minerals such as montmorillonite and illite within sediment particles. During the wet stage of DWs, the generated expansion force acts internally on sediment aggregates, causing the pores within sediment aggregates to expand; subsequently, the expansion force from sediment aggregates acts on the CSH skeleton, causing pores inside the CSH components to shrink and pores around the CSH skeleton to expand. In the dry stage of DWs, the produced shrinkage force reduces the size of pores among sediment particles inside the aggregates. However, the shrinkage force of sediment aggregates does not act on the CSH skeleton, because the S/S sediment samples are nearly in a load-free state. When the deformation in the previous wet stage is in the elastic stage, the prior deformation recovers; when the deformation in the prior wet stage is in the plastic stage, most of the previous deformation remains, while the embedded elastic deformation recovers. Most of the time, deformations within the pore structures of sediment aggregates and the CSH skeleton are plastic. Therefore, with an increase in the DWs and the accumulation of plastic deformation, those pore structures are continuously deformed and damaged, leading to the formation of cracks visible in SEM images.

4.2. Identification of Micropores

Most of the time, the deformation in sediment particles was elastic. As shown in Figure 9b and Figure 10b, the volume and area of pores in the range of 0~10 nm under different DWs showed no obvious changes, as the deformation recovered after each DW. Therefore, combined with previous studies, it is deduced that pores in the range of 0~10 nm were those inside the sediment particles, as shown in Figure 11b.
The adjustment of the CSH skeleton due to expansion forces damaged the connection points of the CSH structure. Thus, even though the strength of CSH components was higher than the induced expansion force (stress), the deformation inside the CSH components transmitted from the sediment aggregates was plastic. As shown in Figure 9b and Figure 10b, the volume and area of pores in the range of 10~102 nm gradually decreased during DWs, indicating the accumulation of plastic deformation. Therefore, combined with previous studies [35], it is deduced that pores in this range were those inside CSH components (as shown in Figure 11b), which were continuously compressed by expansion forces.
As previously discussed, expansion and shrinkage forces generated by sediment particles directly acted on sediment aggregates, causing either expansion or compression during DWs. When these forces surpassed the structural strength of the sediment aggregates, they yielded, resulting in plastic deformation. Unlike the CSH skeleton, sediment particles within the aggregates were bonded by ionic bonds formed during ion-exchange granulation reactions during solidification. Consequently, sediment aggregates were not in a load-free state during the shrinkage stage, which led to the generation of plastic deformation. As shown in Table 3 and Table 4, the volume and area of pores in the ranges of 102~103 nm and 103~104 nm generally decreased during DWs overall, while increasing during some of the DWs. However, when considering these two ranges together, as illustrated in Figure 11c, the pore volume and area in the combined range of 102~104 nm showed a monotonic decrease as the number of DWs increased. From this, it can be deduced that pores within this size range were located within the spaces between sediment particles in the aggregates (as shown in Figure 11b), and that sediment aggregates undergo gradual compression during DWs.
As also analyzed above, each DW caused the CSH skeletons to expand, with the accumulation of plastic deformation gradually leading to structural damage. As presented in Table 3 and Table 4, the volume and area of pores larger than 104 nm increased alongside an increase in the number of DWs, except at DW 12, which indicates that parts of the CSH structure were damaged (adjusted) from DW 6 to DW 12. Therefore, it can be deduced that pores larger than 104 nm are those located among the CSH structures, as shown in Figure 11b.

4.3. Damage Mechanisms of S/S Sediment During DWs

As shown in Figure 3, the UCS of S/S sediments exhibited a development pattern consistent with the evolution of pores within S/S sediments. In the early stages of DWs, plastic deformation rapidly occurred in the pores within sediment aggregates and the CSH skeleton, causing severe damage to some aggregate and CSH structures. Consequently, the UCS decreased sharply. During the medium stages of DWs, the pores within sediment aggregates and the CSH skeleton underwent sufficient deformation. The expansion/shrinkage forces generated by sediment particles and acting within sediment aggregates or on the CSH skeleton were no longer strong enough to destroy the pore structure, owing to the accumulation of plastic deformation. As a result, the reduction rate of UCS significantly slowed down. In the late stages of DWs, plastic deformation accumulated to a critical threshold, and the pore deformation within the structures was so substantial that the expansion/shrinkage forces acting on sediment aggregates and the CSH skeleton were too weak to cause further significant damage. Therefore, the UCS reduction rate became extremely small during these stages.
The UCS of S/S sediments was jointly controlled by the CSH skeletons and sediment aggregates. In the early stages from DW 0 to DW 3, the volume and area of sediment aggregate pores (104 nm > d > 102 nm) decreased rapidly, while the volume and area of CSH skeleton pores (d > 104 nm) did not notably change, as shown in Figure 11c,d. The UCS decrease from DW 0 to DW 3 was very sharp, as shown in Figure 3. It is concluded that the loss of support from sediment aggregates to the CSH skeleton led to a notable strength reduction in the S/S sediments. In the medium stages from DW 3 to DW 12, the volume and area of CHS skeleton pores increased, while those of sediment aggregate pores decreased, as shown in Figure 11c,d. As a result, the expansion force acting on the CSH skeleton and the shrinkage force acting inside the sediment aggregates were much smaller. Consequently, the UCS continued to decrease but at a much slower rate, as shown in Figure 3. In the late stages from DW 12 to DW 18, the volume and area of CSH skeleton pores kept increasing, while the volume of sediment aggregate pores increased and the area of sediment aggregate pores decreased, as shown in Figure 11c,d. The inconformity between the volume and area development of sediment aggregates indicated damage to the pores inside the sediment aggregates, as shown in Figure 11e. Under these conditions, minimal expansion forces were transmitted to the CSH skeleton, and the volume and area of CSH skeleton pores remained unchanged. As a result, the UCS of S/S sediments tended to stabilize.
In conclusion, expansion and shrinkage forces generated by DWs expand pores in the CSH skeleton while compressing pores in sediment aggregates, with damage to the S/S sediments stemming from the tensile failure of the CSH skeleton and compressive failure of sediment aggregates. To enhance the performance of the S/S sediments in the present study, more additive components should be added in combination to improve the tensile strength of the solidification skeleton and compressive strength of the sediment aggregates.

5. Conclusions

The micropore structure of S/S sediments was sensitive to DWs, which could lead to macro-performance degradation in the atmospheric environment. Based on the lacustrine clayey–silty biogenic sediments collected in the present study, UCS, SEM, MIP, and NAP tests were performed on S/S sediment specimens subjected to different DWs to investigate the macroscopic degradation, micropore structure evolution, and damage mechanisms of S/S sediments during DWs, aiming to better optimize S/S additives. The following conclusions were drawn from this study:
(1)
The strength of S/S sediments declined as the number of DWs increased, as did the rates of decline.
(2)
The primary micropores were those within the sediment particles, CSH component, and sediment aggregates and among the CSH skeletons. Due to the expansion/shrinkage forces that originated from the sediment particles in DWs, pores in the sediment aggregates and CHS skeletons gradually collapsed and were reconstructed due to DWs, leading to structural damage in the S/S sediment and a decrease in UCS.
(3)
Pores in the sediment aggregates in the range of 102 nm < d < 104 nm accounted for a larger proportion, those among the CSH skeleton (d > 104) and those in the CSH components and sediment particles accounted for a minor proportion (d < 102 nm), and pores in the range of d < 102 contributed 90% of the pore area. Pores in the CSH skeleton were expanded by DWs, while pores in sediment aggregates were gradually compressed. Under the joint control of the CSH skeleton and sediment aggregates, the UCS of the S/S sediments gradually decreased due to DWs, though the decrease rate also slowed.
(4)
Due to the expansion and shrinkage elastic deformation in sediment particles with pores in the range of d < 10 nm, the CSH component joints with pores in the range of 10 nm < d < 102 nm were gradually destroyed, leading to plastic deformation and damage of the sediment aggregates and CSH skeletons.
(5)
With the damage and reconstruction of sediment aggregates and CSH skeletons, the S/S sediments were adjusted. As a result, the expansion and shrinkage forces acting on the sediment aggregates and CSH skeletons gradually became weaker, leading to a slower decrease in UCS.
In the next stage of in-depth study, based on the principles and mechanisms obtained in the present study, more additive components, such as nano-silicon, metakaolin, etc., will be incorporated to enhance performance in the solidification of the sediments collected in the present study. Using similar tests such as the UCS test, SEM, MIP, and NAP, the strength degradation principle, micropore structure evolution principle, and strength enhancement mechanisms (tensile strength enhancement for solidification skeletons and compressive strength enhancement for sediment aggregates, etc.) will be studied, aiming to ascertain the optimal combination of additives for practical engineering applications.

Author Contributions

Conceptualization, Y.L.; methodology, K.L. and H.W.; validation, H.W. and W.L.; formal analysis, W.L. and T.Z.; investigation, Y.L. and S.W.; resources, Y.W.; data curation, K.L., Y.W. and J.R.; writing—original draft preparation, K.L., Y.L. and H.W.; writing—review and editing, Y.L. and H.W.; visualization, H.W. and T.Z.; supervision, W.L.; protect administration, S.W.; funding acquisition, H.W. and S.W. All authors have read and agreed to the published version of the manuscript.

Funding

This research was funded by the National Natural Science Foundation for Young Scholars of China (No. 52304125) and the Science and Technology Research Program of Chongqing Municipal Education Commission (No. KJQN202301530).

Data Availability Statement

Data will be made available on request.

Conflicts of Interest

The authors declare no conflicts of interest. The funders had no role in the design of the study; in the collection, analyses, or interpretation of data; in the writing of the manuscript; or in the decision to publish the results.

Abbreviations

The following abbreviations are used in this manuscript:
S/SStabilized/solidified
UCSUnconfined compression strength
DWsDry–wet cycles
SEMScanning electron microscope
MIPMercury intrusion porosimetry
NAPNitrogen adsorption porosimetry

References

  1. Liu, H.; Kong, T.; Qiu, L.; Xu, R.; Li, F.; Kolton, M.; Lin, H.; Zhang, L.; Lin, L.; Chen, J.; et al. Solar-driven, self-sustainable electrolysis for treating eutrophic river water: Intensified nutrient removal and reshaped microbial communities. Sci. Total Environ. 2021, 764, 144293. [Google Scholar] [CrossRef] [PubMed]
  2. Cui, X.; Meng, H.; Liu, Z.; Sun, H.; Zhang, X.; Jin, Q.; Wang, L. Development, Performance, and Mechanism of Fluidized Solidified Soil Treated with Multi-Source Industrial Solid Waste Cementitious Materials. Buildings 2025, 15, 864. [Google Scholar] [CrossRef]
  3. Wang, L.; Tsang, D.C.W.; Poon, C.S. Green remediation and recycling of contaminated sediment by waste-incorporated stabili-zation/solidification. Chemosphere 2015, 122, 257–264. [Google Scholar] [CrossRef] [PubMed]
  4. Jiang, L.; Zhao, X.; Wang, H. Synthesis and Property Characterization of Low-Activity Waste-Derived Quaternary Cementitious Materials. Buildings 2025, 15, 1426. [Google Scholar] [CrossRef]
  5. Zhang, Q.; Chen, X.; Luan, L.; Sha, F.; Liu, X. Technology and Equipment of Deep-sea Mining: State of the Art and Perspectives. Earth Energy Sci. 2025, 1, 65–84. [Google Scholar] [CrossRef]
  6. Zhang, W.-L.; Zhao, L.-Y.; McCabe, B.A.; Chen, Y.-H.; Morrison, L. Dredged marine sediments stabilized/solidified with cement and GGBS: Factors affecting mechanical behaviour and leachability. Sci. Total Environ. 2020, 733, 138551. [Google Scholar] [CrossRef] [PubMed]
  7. Banoune, B.; Melbouci, B.; Rosquoët, F.; Langlet, T. Treatment of river sediments by hydraulic binders for valorization in road construction. Bull. Eng. Geol. Environ. 2016, 75, 1505. [Google Scholar] [CrossRef]
  8. Tang, I.Y.; Yan, D.Y.S.; Lo, I.M.C.; Liu, T. Pulverized fuel ash solidification/stabilization of waste: Comparison between beneficial reuse of contaminated marine mud and sediment. J. Environ. Eng. Landsc. Manag. 2015, 23, 202–210. [Google Scholar] [CrossRef]
  9. De Gisi, S.; Labianca, C.; Todaro, F.; Notarnicola, M. Stabilization/Solidification of Contaminated Marine Sediment. In Low Carbon Stabilization and Solidification of Hazardous Wastes; Elsevier: Amsterdam, The Netherlands, 2022; pp. 113–127. [Google Scholar]
  10. Dubois, V.; Abriak, N.E.; Zentar, R.; Ballivy, G. The use of marine sediments as a pavement base material. Waste Manag. 2009, 29, 774–782. [Google Scholar] [CrossRef]
  11. Zhang, Y.; Labianca, C.; Chen, L.; De Gisi, S.; Notarnicola, M.; Guo, B.; Sun, J.; Ding, S.; Wang, L. Sustainable ex-situ remediation of contaminated sediment: A review. Environ. Pollut. 2021, 287, 117333. [Google Scholar] [CrossRef]
  12. Dalmacija, M.B.; Prica, M.D.J.; Dalmacija, B.D.; Roncevic, S.D.; Rajic, L.M. Correlation between the results of sequential extraction and effectiveness of immobilization treatment of lead-and cadmium-contaminated sediment. Sci. World J. 2010, 10, 1–19. [Google Scholar] [CrossRef] [PubMed]
  13. Hwang, K.; Seo, J.; Phan, H.Q.H.; Ahn, J.; Hwang, I. MgO-based binder for treating contaminated sediments: Characteristics of metal stabilization and mineral carbonation. CLEAN–Soil Air Water 2014, 42, 355–363. [Google Scholar] [CrossRef]
  14. Cho, H.; Shim, J.H.; Park, J.Y. Performance evaluation of solidification/stabilization of dredged sediment using alkali-activated slag. Desalin. Water Treat. 2016, 57, 10159–10168. [Google Scholar] [CrossRef]
  15. Silitonga, E. Stabilization/Solidification of Polluted Marine Dredged Sediment of Port en Bessin, France, Using Hydraulic Binders and Silica Fume. In Proceedings of the 1st Nommensen International Conference on Technology and Engineering, Medan, Indonesia, 11–12 July 2017. [Google Scholar]
  16. Todaro, F.; Vitone, C.; Notarnicola, M. Stabilization and Recycling of Contaminated Marine Sediments. In Proceedings of the 7th International Symposium on Deformation Characteristics of Geomaterials, Strathclyde’s Technology & Innovation Centre, Glasgow, UK, 26–28 June 2019. [Google Scholar]
  17. Li, J.-S.; Zhou, Y.-F.; Wang, Q.-M.; Xue, Q.; Poon, C.S. Development of a novel binder using lime and incinerated sewage sludge ash to stabilize and solidify contaminated marine sediments with high water content as a fill material. J. Mater. Civ. Eng. 2019, 31, 04019245. [Google Scholar] [CrossRef]
  18. Cheng, S.; Shui, Z.; Gao, X.; Lu, J.; Sun, T.; Yu, R. Degradation progress of Portland cement mortar under the coupled effects of multiple corrosive ions and drying-wetting cycles. Cem. Concr. Compos. 2020, 111, 103629. [Google Scholar] [CrossRef]
  19. Zha, F.; Huang, K.; Kang, B.; Sun, X.; Su, J.; Li, Y.; Lu, Z. Deterioration characteristic and constitutive model of red-bed argillaceous siltstone subjected to drying-wetting cycles. Lithosphere 2022, 2022, 8786210. [Google Scholar] [CrossRef]
  20. Pu, H.; Yi, Q.; Jivkov, A.P.; Bian, Z.; Chen, W.; Wu, J. Effect of dry-wet cycles on dynamic properties and microstructures of sandstone: Experiments and modelling. Int. J. Min. Sci. Technol. 2024, 34, 655–679. [Google Scholar] [CrossRef]
  21. Wang, H.-X.; Wu, Z.-Z.; Tan, Y.-Z.; Cui, X.-Z.; Zuo, Q.-J.; Wang, L.-H.; Lu, L.-Q. Characteristics of the micro pore structures of stabilized/solidified sediments during freeze-thaw cycles. Constr. Build. Mat. 2019, 211, 1–22. [Google Scholar]
  22. Li, J.-S.; Zhou, Y.; Chen, X.; Wang, Q.; Xue, Q.; Tsang, D.C.; Poon, C.S. Engineering and microstructure properties of contaminated marine sediments solidified by high content of incinerated sewage sludge ash. J. Rock Mech. Geotech. Eng. 2021, 13, 643–652. [Google Scholar] [CrossRef]
  23. ISO 14688-1:2017; Geotechnical Investigation and Testing—Identification and Classification of Soil—Part 1: Identification and Description. International Organization for Standardization: Geneva, Switzerland, 2017.
  24. ISO 5667-12:2017; Part 12: Guidance on Sampling of Bottom Sediments from Rivers, Lakes and Estuarine Areas. International Organization for Standardization: Geneva, Switzerland, 2017.
  25. ASTM D4823-95; Standard Guide for Core Sampling Submerged, Unconsolidated Sediments. ASTM International: West Conshohocken, PA, USA, 2019.
  26. ISO 19901-8:2023; Oil and Gas Industries Including Lower Carbon Energy—Offshore Structures. International Organization for Standardization: Geneva, Switzerland, 2023.
  27. DB 42/T 1255-2017; Technical Specification for Inland Freshwater Lake Sedimentary Deposits in Still Water. Hubei Provincial Market Supervision Administration: Wuhan, China, 2017.
  28. Kamei, T.; Ahmed, A.; Shibi, T. The use of recycled bassanite and coal ash to enhance the strength of very soft clay in dry and wet environmental conditions. Constr. Build. Mater. 2013, 38, 224–235. [Google Scholar] [CrossRef]
  29. ASTM D559-03; Standard Test Methods for Wetting and Drying Compacted Soil-Cement Mixtures. ASTM International: West Conshohocken, PA, USA, 2003.
  30. ASTM D4219-02 (2003); Standard Test Method for Unconfined Compressive Strength Index of Chemical-Grouted Soils. ASTM International: West Conshohocken, PA, USA, 2003.
  31. Sasanian, S.; Newson, T.A. Use of mercury intrusion porosimetry for microstructural investigation of reconstituted clays at high water contents. Eng. Geol. 2013, 158, 15–22. [Google Scholar] [CrossRef]
  32. Abbaslou, R.M.; Vosoughi, V.; Dalai, A.K. Comparison of nitrogen adsorption and transmission electron microscopy analyses for structural characterization of carbon nanotubes. Appl. Surf. Sci. 2017, 419, 817–825. [Google Scholar] [CrossRef]
  33. Ojha, S.P.; Misra, S.; Tinni, A.; Sondergeld, C.; Rai, C. Pore connectivity and pore size distribution estimates for Wolfcamp and Eagle Ford shale samples from oil, gas and condensate windows using adsorption-desorption measurements. J. Pet. Sci. Eng. 2017, 158, 454–468. [Google Scholar] [CrossRef]
  34. Qi, L.; Tang, X.; Wang, Z.; Peng, X. Pore characterization of different types of coal from coal and gas outburst disaster sites using low temperature nitrogen adsorption approach. Int. J. Min. Sci. Technol. 2017, 27, 371–377. [Google Scholar] [CrossRef]
  35. Wang, H.; Wu, S.; Jing, X.; Liu, K.; Ren, L. Strength and Stiffness Degradation Mechanisms of Stabilized/Solidified Sediments by Freeze–Thaw Cycles. Front. Earth Sci. 2022, 10, 905482. [Google Scholar] [CrossRef]
Figure 1. Freeze-drying of S/S sediments. (a) Rapid cooling in liquid nitrogen tank; (b) drying in freeze-dryer.
Water 17 01667 g001
Figure 2. Typical stress–strain curves of S/S sediments.
Water 17 01667 g002
Figure 3. Strength development of S/S sediments.
Water 17 01667 g003
Figure 4. Microstructure and damage process of S/S sediments during DWs. (a) DW 0 (unmagnified); (b) DW 0; (c) DW 3; (d) DW 6; (e) DW 12; (f) DW 18.
Water 17 01667 g004
Figure 5. Intrusion–extrusion curves of S/S sediments during DWs.
Water 17 01667 g005
Figure 6. Pore volume distributions using MIP. (a) Cumulative pore volume; (b) incremental pore volume.
Water 17 01667 g006
Figure 7. Pore surface area distributions of S/S sediments during DWs using MIP. (a) Cumulative pore area; (b) incremental pore area.
Water 17 01667 g007
Figure 8. Adsorption/desorption isothermals of S/S sediments.
Water 17 01667 g008
Figure 9. Pore volume distributions using NAP. (a) Cumulative pore volume; (b) incremental pore volume.
Water 17 01667 g009
Figure 10. Pore area distributions from NAP. (a) Cumulative pore area; (b) incremental pore area.
Water 17 01667 g010
Figure 11. Pore damage mechanisms of S/S sediments in DWs. (a) Micropore structure of S/S sediments; (b) pore pattern corresponding to different pore sizes; (c) pore structure evolutions of those in the CSH skeletons; (d) pore structure evolutions of those in sediment aggregates; (e) damage course of pores in sediment aggregates.
Water 17 01667 g011
Table 1. Basic physical/chemical properties of sediments.
PropertyValue
Initial water content, Wi (%)178
Plastic limit, WP (%)73
Liquid limit, WL (%)34
Plasticity index39
Total organic content (%)4.0
pH6.3
Sand particle fraction (d > 0.75 mm) (%)18.7
Silt particle fraction (0.75 mm > d > 0.005 mm) (%)38.1
Clay particle fraction (0.005 mm > d) (%)43.2
Table 2. Chemical composition of Portland cement/%.
CompositionSiO2Fe2O3Al2O3TiO2CaOMgOSO3Na2OK2OLoi 1
Percentage 23.354.037.920.3355.762.092.820.310.223.16
Note(s): 1 Loss on ignition.
Table 3. Pore volume statistics using MIP (mL/g).
DWsTotald > 104 nm104 nm > d > 103 nm103 nm > d > 102 nmd < 102 nm
00.4670.0240.2420.1420.059
30.4650.0270.2500.1250.063
60.4840.0450.2390.1270.073
120.4720.0420.2370.1220.070
180.4800.0440.2500.1170.070
Table 4. Pore area statistics using MIP (m2/g).
DWsTotald > 104 nm104 nm > d > 103 nm103 nm > d > 102 nmd < 102 nm
014.222390.0040.4321.72212.065
313.741290.0040.4091.56911.758
620.472470.0100.3911.56618.506
1217.082440.0070.3851.53415.157
1816.774750.0080.3881.47614.903
Table 5. Pore volume statistics from NAP.
DWs TotalMicropores
(r < 2 nm)
Mesopores
(2 nm < r < 50 nm)
Macropores
(r > 50 nm)
0Volume (mL/g)0.183200.1280.0552
Proportion /%100069.86930.131
3Volume (mL/g)0.158500.12230.0362
Proportion /%100077.1608822.83912
6Volume (mL/g)0.180600.11770.0629
Proportion /%100065.1716534.82835
12Volume (mL/g)0.148300.10810.0402
Proportion /%100072.8927827.10722
18Volume (mL/g)0.163800.1290.0348
Proportion /%100078.7545821.24542
Table 6. Pore area statistics from NAP (mL/g).
DWs TotalMicropores
(r < 2 nm)
Mesopores
(2 nm < r < 50 nm)
Macropores
(r > 50 nm)
0Volume (m2/g)27.84024.373.47
Proportion /%100087.5359212.46408
3Volume (m2/g)28.43026.092.34
Proportion /%100091.769268.23074
6Volume (m2/g)27.14023.173.97
Proportion /%100085.3721414.62786
12Volume (m2/g)25.56023.12.46
Proportion /%100090.375599.62441
18Volume (m2/g)25.51023.162.35
Proportion /%100090.787939.21207
Disclaimer/Publisher’s Note: The statements, opinions and data contained in all publications are solely those of the individual author(s) and contributor(s) and not of MDPI and/or the editor(s). MDPI and/or the editor(s) disclaim responsibility for any injury to people or property resulting from any ideas, methods, instructions or products referred to in the content.

