Abstract
Exploring the secular tendency to intensification of short-interval rainfall intensities, such as those associated with convective storms, requires rainfall data having sufficient accuracy and temporal resolution. Light rainfalls also exhibit secular change, and documenting these imposes considerable demands on data quality. Tipping-bucket rain gauges are the most widely deployed globally for data collection, but they cannot record rainfall amount or rainfall rate instantaneously. Both require data to be collected over some finite time interval, the accumulation time (AT), during which one or more buckets must fill and tip. Relatively short ATs, such as when analysing 15 min rainfall amounts and rates, are associated with increased uncertainty in TBRG data. Quantifying the resulting uncertainty forms the subject of the present work. Worst-case rainfall depth and rainfall rate errors that would arise in TBRG data for constant rainfall rates of 5, 10, 20, 30, 40, and 50 mm h−1 are determined for ATs from 5 min to 50 min. Errors frequently considerably exceed the 1–2% accuracy levels claimed by many manufacturers of TBRGs. The errors found pose challenges for the detection of secular change in rainfall rates. The present results point to the need for fuller analysis of errors in TBRG data for short-duration rainfalls and for gauge specifications to specify uncertainty separately for rainfall depth and rainfall rate.
1. Introduction
Secular changes in rainfall regimes have been studied using daily or multi-day data (Karl and Knight 1998, Zeder and Fischer 2020, and Robinson et al., 2021 [1,2,3]). However, there is widespread interest in the influence of climate variability and change on the intensity of rainfall, particularly in short-duration rainfall events and over short periods within longer events. Variations of short-term intensity have been linked to temperature changes and increased atmospheric water-holding capacity (Chen et al., 2013, Chiappa et al., 2024, Fu and Wu 2024, and Haslinger et al., 2025 [4,5,6,7]). Some studies have suggested that short-term (sub-daily or sub-hourly) intensities have increased, and are increasing at a more rapid rate, than those for longer-duration rainfalls, such as daily totals (Tamm et al., 2023) [8]. In addition to documenting changes in rainfall as a signal of changes in atmospheric conditions, there is concern with some of the practical and societal consequences of possible increases in short-duration rainfall events. These include increased occurrence and/or severity of urban flash flooding (Dougherty and Rasmussen 2020) [9] and riverine flooding (Haslinger et al., 2025) [7]. Urban flooding itself is a complex intermingling of rainfall intensity effects and those of urban sprawl and runoff efficiency (Faccini et al., 2018) [10], and intensification in urban areas can show very large rates of scaling with temperature (Yan et al., 2024) [11]. The factors contributing to these high scaling rates are not yet clear. Cultural heritage and historic buildings are susceptible to impacts from intensifying, short-duration rainfalls (Tett et al., 2023) [12]. Adverse health outcomes linked to rainfall changes have also been documented (He et al., 2024 and Ji 2024 [13,14]). Intense rainfall and its secular change is also of concern in relation to various forms of severe and damaging erosion such as post-wildfire debris flows, where 15 min rainfalls have explanatory power (Thomas et al., 2024 and Zhao et al., 2025 [15,16]). Secular changes in both relatively extreme and intense rainfall events as well as in more frequent, lower-intensity events have been documented, and further study of both is needed to build a comprehensive understanding of changes in the water cycle. Liu et al. (2011) [17] reported a decline in small showers in observations from China, while Li et al. (2022) [18], in contrast, reported an increase over the Tibetan Plateau. Huang and Wen (2013) [19] reported regionally divergent trends in light rainfall over the Northern Hemisphere. Fu and Wu (2024) [6] reported a decline in light rain frequency but an increase in light rain intensity in the global tropics and a decrease in the intensity of heavy falls over the same region. Between 1998 and 2019, they found a 23 ± 2% increase in the intensity of light rains, defined by Fu and Wu (2024) [6] as rainfalls at rates below the 95th percentile of tropical rainfall rates, which they specify as 5.28 mm h−1. Rainfalls above this intensity were grouped as ‘heavy’. They reported that median rainfall rates for the global tropics were <1 mm h−1. Light rainfall events, with small totals delivered at low intensity, are evidently quite frequent in many areas; they may be of increasing or decreasing frequency of occurrence, but they may be increasing in intensity, and it seems clear that global and regional trends in the incidences of short-duration and low-intensity rainfalls warrant further study. All such rainfall events have importance in landscapes and ecosystems, beyond their clear relevance for understanding the climate system and the hydrological cycle as well as the directions and rates of secular changes that may be occurring.
The focus of the present study is on the assessment of rainfall over short time periods, which need not involve low-intensity rainfall. An important though somewhat neglected aspect of short-duration rainfalls is the extent to which sufficiently accurate data are available, for sub-daily and especially for sub-hourly intervals, such as 5 min, 10 min, or 15 min. Short-duration measures of rainfall such as these have been widely extracted from rainfall data and used as measures of intensity in order to characterise rainfall events (Lafuente et al., 2018, Berti et al., 2020, Kean and Staley 2021, and Zhao et al., 2025 [16,20,21,22]). Durations as short as 30 s or 1 min have been adopted in studies of signal attenuation on wireless data links (Ahuna et al., 2016 and Siles and Ayllon 2024 [23,24]), but these may rely on disdrometer or weighing rain gauge data rather than TBRGs. High-quality 5 min rainfall data are available from some USDA research catchments where again weighing gauges are used (Buda et al., 2011 [25]), and such data can be aggregated to also yield 15 min totals (Buda et al., 2024 [26]). There are many other devices that are able to record rainfall depths and/or rainfall rates. Dunkerley (2023) [27] provided an extensive review and commentary on this topic. The focus of the present study is on the suitability of data collected using tipping-bucket rain gauges (TBRGs; the most widely deployed globally) for the analysis of secular rainfall trends, particularly for durations of <1 h.
Possible Limitations to the Applicability of Tipping-Bucket Rainfall Data
It is not appropriate to review here the many aspects of TBRG performance, as these are generally well known. Examples include errors resulting from turbulence in the airflow around a gauge, as well as splash and evaporative losses. One important parameter is the sensitivity of a TBRG, the amount of rain needed to trigger a bucket tip event. This is often 0.2 mm, though larger and smaller values are also in use. This sensitivity influences the time-lag once rain begins, before a bucket can fill, overbalance, and tip, and before a signal can be generated by the TBRG marking the start of rain or the arrival of 0.2 mm of rain. Likewise, at the end of rain a bucket may be almost full and yet fail to tip, so that the end of rain would appear to have been at the time of the previous tip event, and the rainfall depth appears smaller than the true value. Consequently, during a short-duration rainfall event, there may be a delay of one bucket-filling time before the start of rain is signalled, and the end of rain may be signalled one bucket-filling time too early. Thus, the duration of such an event may be underestimated by two bucket-filling times. At the same time, the amount or depth of rain in the event may also be underestimated if a bucket remains almost full at the end of rain. Thus, the recorded depth is subject to an uncertainty of up to one bucket tip. If rain is only recorded over relatively long periods of time (accumulation time, hereafter AT) such as one day, these effects are of limited significance. However, over ATs such as 5 min or 15 min, they may introduce important uncertainties, as will be shown below. Importantly, when measures such as the maximum 5 or 15 min rainfall depth are extracted from the record of a long event, similar timing and quantisation uncertainties arise, because tip events do not in general coincide precisely with clock-min. Whilst a 5 min period may include five tip events, for instance, these may all have occurred in just one minute, resulting in large uncertainty in the estimated rainfall duration and hence in the apparent rainfall rate. Uncertainty is also attached to rainfall data that are logged only as 15 min totals, rather than separately timed tip events, since some rain may have fallen during the AT prior to the first tip and after the last tip (e.g., Siles and Ayllon 2024) [24].
A fundamental aspect of TBRGs therefore is that all data collected are influenced by the time taken to fill and tip the buckets and by the AT over which the data collection is continued. Bucket-filling time can be long for low-intensity rain, and it is shorter for more intense rain. It can also be short if prior rain has left a bucket almost full. Inevitably, though, the fundamental discretisation of rainfall data collected by TBRGs means that neither rainfall depth (mm) nor rainfall rate (mm h−1) can be measured instantaneously. Rather, each must be based on a finite measurement duration. An AT is needed for one or more tips to occur and to reflect either of these key rainfall parameters. It is often proposed that the maximum resolution in rainfall data collected by a TBRG can be achieved by studying the durations of individual inter-tip times (ITTs), rather than using data aggregated to longer ATs (Costello and Williams 1991) [28]. However, a bucket tip can only indicate that 0.2 mm of rainfall accumulated over some preceding time period, whose duration depends on the rainfall rate during that earlier time, which is not precisely knowable (Western et al., 2011) [29]. Some smoothing of the ITT rainfall rates is therefore needed, but this can introduce unwanted artefacts (Wang et al., 2008) [30].
Accuracy in rainfall data is important if secular changes are to be reliably identifiable, as well as for areas of practical application such as those mentioned earlier. In their study of light rainfalls in the global tropics, Fu and Wu (2024) [6] for instance employed areally based remotely sensed data (TRMM and IMERG) with a time resolution of 0.5–3 h. Commonly, manufacturers of TBRGs designed for ground-based, point observations (often relied upon for ground-truth in assessments of remotely sensed data) specify that their gauges have accuracies of 1% to a few% (Table 1). Rarely do the specifications mention the ATs to which the accuracy specifications are intended to be applicable, even though, as just noted, all TBRG data must have an associated AT, the duration of which will affect uncertainty in rainfall measurements. The listing in Table 1 includes specifications of 27 different models of TBRG collected from manufacturers’ data sheets. Company names are deliberately not included. The table shows that manufacturers’ TBRG specifications are provided in a variety of forms. A few manufacturers indicate that the accuracy specifications only apply above a minimum intensity, in each case 25 mm h−1 (Nos. 21, 22 in Table 1). Others limit their accuracy claims to moderate intensities, generally <25 mm h−1, and do not indicate what performance can be expected above this intensity (Nos. 6, 15). Most, however, specify that their accuracy specifications apply to all intensities from zero up to some maximum, often 100–200 mm h−1, with reduced accuracy at intensities higher than this. Some specify accuracy only at a single intensity, at which the TBRG was factory-calibrated, and do not indicate what accuracy levels apply at lower or higher intensities (Nos. 1, 5, 9, 16, 26, 27). Only one manufacturer (No. 19) specifies separate accuracy levels for rainfall amount and rainfall rate. Most claim accuracy in the range ±1% to ±2%, though some list larger uncertainties of 5–7%, without explicitly stating whether these figures apply to depth, to rainfall rate, or to both. No manufacturer specifies minimum ATs for the listed accuracy levels to be achievable. This has the potential to mislead users regarding the accuracy levels of data that they collect.

Table 1.
Sensitivity and accuracy levels claimed on manufacturers’ data sheets for 27 commercially available TBRGs. Data were derived from data sheets publicly available online. The manufacturers are based in Europe, the Americas, Asia, Oceania, and elsewhere but are not identified for reasons of commercial sensitivity.
Consider as a simple and idealised example a hypothetical 10 min period of rain at the moderately intense rainfall rate of 6 mm h−1, recorded using a common form of TBRG (0.2 mm sensitivity, collecting area 323.65 cm2 from a funnel of 203 mm diameter). Under these conditions, the filling time for a single bucket would be about 2.0 min. If a bucket was empty at the start of the rain, and another remained almost full but untipped at the end of the rain, then the duration of rain between first and last tips would be shorter than the actual rain duration by 4.0 min. The true rain duration remains unknown, since the initial and final condition of the buckets cannot be known from logged data. Further, the filled bucket remaining at the end of rain would be unmeasured, so that the total rainfall amount (theoretically 1.0 mm) would be recorded as having only caused four tips not five, so that just 0.8 mm would be indicated in the rainfall data.
In this simple example, the error in rainfall depth is 0.2 mm/1.0 mm or 20%. The erroneous apparent mean rainfall rate would be 0.8 mm/6 min, or 8 mm h−1. Given that the true rainfall rate was 6 mm h−1, this is an overestimate by 33%. Of course, steps could be taken to allocate some of the water reflected in the first tip to earlier min (Western et al., 2011) [29], and some similar adjustment could perhaps be made for the bucket left almost full at the end of rain. However, it is possible that the rain did actually end just as the bucket filled, so any correction procedure remains uncertain. Nevertheless, taking these results simply as illustrative of the kinds of uncertainties that can exist in TBRG data—a 20% error in rainfall depth and a 33% error in rainfall rate—it is difficult to see how to interpret manufacturers’ stated accuracies of 1% to 2%, as none indicate the ATs to which these accuracies are intended to apply. As an example, the specifications of TBRG No. 4 (Table 1) list an uncertainty of 1% in rainfall rates for rates up to 50 mm h−1, but with no stipulated AT. The results presented below suggest that achieving this level of uncertainty in rain at a constant 10 mm h−1 would require that measurements were continued for >50 min. Reaching 1% accuracy with just 15 min of data collected with this type of gauge seems unachievable. Further examples are presented below, using different ATs and more intense rainfall, to illustrate the range of possible uncertainties in short-duration rainfalls or using short ATs.
Molini et al. (2001) [31] previously estimated the uncertainty of TBRG rainfall rate data by simulating the response of a TBRG to a synthetic time series of very low-intensity and intermittent rainfall. They reported errors of ~30% for event-based analyses and errors of >100% for individual sampling periods (ATs). Yu et al. (1997) [32] had likewise pointed to substantial errors linked to the limitations of TBRG data. Nevertheless, manufacturers of TBRGs continue to make claims for greater accuracy in TBRG data than appear to be possible, at least for short ATs. The present work seeks to quantify errors in estimated rainfall depth and estimated rainfall rate separately, for a range of moderate to high rainfall rates and for a range of short to long ATs. In so doing, the aim is to see how typical TBRG accuracy specifications align with errors that are possible for the rainfall rates and ATs examined.
2. Materials and Methods
The uncertainty analysis was undertaken for rains having six different notionally constant rainfall rates of 5 mm h−1, 10 mm h−1, 20 mm h−1, 30 mm h−1, 40 mm h−1, and 50 mm h−1, across ATs having durations from 5 min to 50 min. The rainfall rates explored are classified according to the terminology of the American Meteorological Society (https://glossary.ametsoc.org/wiki/Rain, accessed on 10 April 2025) as being ‘moderate’ (5 mm h−1) and ‘heavy’ (10, 20, 30, 40, and 50 mm h−1).
The calculations assume a hypothetical TBRG perfectly calibrated to the nominal sensitivity of 0.2 mm, with both buckets tipping with precisely the same equivalent volume of water. Moreover, the TBRG buckets are assumed to empty completely with no residual water retained by surface tension effects and to suffer no splash or evaporative losses. This idealised behaviour is unlikely to be realised in the real world, but it makes error calculations feasible. At 30 mm h−1 and above, the systematic dynamic under-catch errors that arise with TBRGs add to the sources of uncertainty in rainfall data (Duchon and Biddle 2010) [33]. For the present analysis, these additional sources of uncertainty, which depend upon the characteristics of each individual TBRG, are excluded from the analysis. This is decided on to focus on the effect of inherent TBRG timing and quantisation behaviour on the estimation of depth and rainfall rate in short-period data.
For a depth of rainfall that is an integral multiple of gauge sensitivity, for the hypothetical TBRG analysed, there would always be the correct number of tips. However, if the first bucket to receive water is already partially full from prior rain, the last bucket to receive water would fill to the same extent but not tip. For a rainfall depth that is not an integral multiple of gauge sensitivity, the final bucket would hold more water than the initial bucket, but the number of tips would be the same as for the previous case, leaving some water that would not be recorded until a subsequent rainfall. The resulting uncertainty in the rainfall amount for any AT of continuous rain cannot exceed one bucket tip volume and would often be less. Here, the unmeasured rain—the additional water in the final bucket—is calculated from the following formula:
where RDT is the true or correct rainfall depth (mm) during a nominated AT, RDU is the unrecorded rainfall depth (mm), and INT indicates that the integer part is extracted.
The logged or recorded rainfall depth (mm), RDL, that would be shown in TBRG data is then calculated from the formula:
RDT for every AT from 5 min to 50 min is calculated from the formula:
where RRT is the actual rainfall rate (mm h−1), and AT is the accumulation time (minutes).
The uncertainty in rain depth cannot exceed one bucket, as noted above. The error (uncertainty) in measured rainfall depth RDerr (%) is determined using the formula:
where RDL indicates the rainfall depth (mm) recorded by a TBRG, and RDT is the true rainfall depth (mm). RDerr takes a negative value (rainfall depth is underestimated).
The uncertainty in estimated rainfall rate is a little more difficult to estimate, since the uncertainty in rain duration is itself influenced by the rainfall rate, which determines the bucket-filling time and hence the possible error in rainfall duration. The uncertainty in estimated rainfall duration, and hence rainfall rate, is therefore not constant, but will be smaller in rainfall of higher intensity.
Calculations were made for each nominated intensity using ATs from 5 min to >1 h; however, only data for ATs up to 50 min are evaluated in the current paper.
Bucket-filling time TF (minutes) is calculated from the formula:
and the worst-case reduction in AT (AT*) in minutes is then determined as AT* = AT − 2TF. AT* is referred to hereafter as the apparent AT. The rainfall depth during the AT* is estimated as just outlined. The apparent rainfall rate (RRA) (mm h−1) is calculated from the formula:
where AT* denotes the reduced AT, allowing for two missed filling times.
The error percentage for rainfall rate (Ierr) is found using the formula:
where RRA is the apparent rainfall rate (mm h−1), and RRT is the true rainfall rate (mm h−1).
The relationship between apparent AT (i.e., AT*) and error is plotted for all apparent ATs separately for each rainfall rate (5, 10, 20, 30, 40, and 50 mm h−1). The relationship between error in rainfall rate (%) and AT* is fitted using a power regression model of the formula:
where ‘a’ is the value of AT* when Ierr = 1, and ‘b’ is the power regression model rate coefficient.
3. Results
Results are presented first for the errors in rainfall depth and then for the errors in rainfall rates.
3.1. Rainfall Depths
The maximum uncertainty in tip counts in any AT is one bucket depth, which is most commonly 0.2 mm. The largest depth errors calculated according to Equation (2) for several combinations of I and AT analysed here were 0.17 mm, which is close to one bucket tip. An error of this size was found for a rainfall rate of 5 mm h−1 and an AT of 50 min. This amounts to a depth error of 4.1%. The same error (0.17 mm) was found for other rainfall rates, including 50 mm h−1. Depth errors of zero were found for many combinations of intensity and AT, owing to the true rainfall for an AT being integrally divisible by 0.2, the TBRG sensitivity. This is unlikely to occur in natural rainfall, where true rainfall depths in particular ATs would be far less likely to be exact multiples of 0.2 mm, and for short rainfall events, durations would not be an integral number of minutes. In natural rainfall, of course, the true depth would not be known unless measured by a co-located gauge providing greater depth resolution, such as a weighing gauge.
3.2. Rainfall Rates
In all cases, large errors in rainfall rate were found for shorter ATs, as would be anticipated. The results are summarised in Table 2.
Table 2.
Errors in apparent rainfall rates for 6 nominated, constant rainfall rates of 5–50 mm h−1 with apparent rainfall rates estimated from 7 ATs (accumulation durations) having durations in the range 5 min to 50 min.
For rain at moderate intensity (5 mm h−1), worst-case errors in rainfall rate (Ierr) included 84.6% (for a 10 min AT) and 41.2% (15 min AT), declining to 6.2% (for a 50 min AT).
At the heavier intensity of 10 mm h−1, the corresponding worst-case errors in rainfall rate include 26.3% (for a 10 min AT) and 14.3% (15 min AT), declining to 3.4% (for a 50 min AT). At 20 mm h−1, the worst-case errors included 9.1% (for a 10 min AT) and 8.7% (15 min AT), declining to 2.1% (for a 50 min AT). At 30 mm h−1, the worst-case errors included 8.7% (for a 10 min AT) and 4.2% (15 min AT), declining to 1.6% (for a 50 min AT).
At the highest intensities examined, 40 mm h−1 and 50 mm h−1, errors were smaller, but at 40 mm h−1 they only declined to 1% for an AT of >~40 min, and at 50 mm h−1, errors exceeded 1% only for ATs of <30 min.
In many combinations of rainfall rate and AT, therefore, even the 15 min AT worst-case errors are considerably poorer than is suggested by the accuracy claims of TBRG manufacturers. In most cases examined, an AT of 40–50 min is required to approach an error magnitude of 1%. If dynamic under-catch errors are included, the potential error in rainfall rate becomes considerably larger, particularly for the higher intensities, and importantly, dynamic errors in rain of constant intensity cannot be reduced by lengthening the AT.
The fitted power regression models for each rainfall rate exhibit some scatter related to the quantisation inevitable with TBRGs. Nevertheless, all regression models showed correction coefficients of >0.95 (Table 3). Figure 1 presents scatterplots overlaid by the fitted power regression model for three rainfall rates.
Table 3.
Power model regression equations fitted to the relationship between Ierr (Equation (5)) and the apparent accumulation time AT* for six rainfall rates from 5 mm h−1 to 50 mm h−1. See text for details.
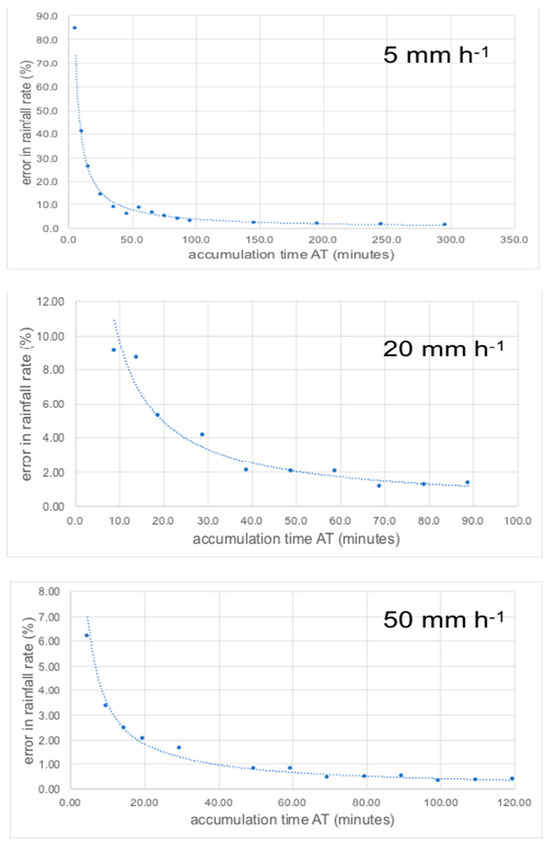
Figure 1.
Power regression models of the relationship between error in rainfall rates (IERR, Equation (4)) and the accumulation time, for three rainfall rates of 5 mm h−1, 20 mm h−1, and 50 mm h−1. Note that the scales of each axis differ among the three graphs.
The power regression coefficient ‘a’ indicates the value of AT* for which the error% for rainfall rate is 1. The value of ‘a’ was regressed against intensity (mm h−1) to establish the AT* needed to achieve an error of ~1%. These data were satisfactorily fitted by a power function regression model which was:
where RRT is rainfall rate (mm h−1) and for which r2 = 0.99. Thus, for a rainfall rate of 27 mm h−1, the ‘a’ coefficient would be 63.5, and just over 1 h would be required to approach 1% uncertainty.
Errors in circumstances that would not coincide with the worst-case uncertainty also need to be evaluated. We assume that multiple short-duration rainfall events, or multiple data collected as falling within a nominated short AT, are analysed. Then it is certain that the depth uncertainty would tend to 0.5 buckets, not 1 bucket as in the worst case. Likewise, the rain duration uncertainty would tend to one bucket-filling time, rather than the worst case of two bucket-filling times. This is because, for instance, the final bucket would not always be almost full but not yet tipped; in some data, the final bucket would be almost empty, and in some, it would be near half full. Thus, in multiple data, the mean degree of bucket fullness should approach 0.5. Analyses were carried out, therefore, for the mean error that would be expected in a set of data, rather than the error associated with a single short-duration event or a single AT, such as 15 min in a rainfall event that recorded the largest rainfall rate. The results are summarised in Table 4, and key results are highlighted here. As would be anticipated, the mean error to be expected from a set of ATs was smaller than the worst-case errors just presented for single ATs. Uncertainty for an AT of 5 min remained >2% for all rainfall rates from 5 mm h−1 to 40 mm h−1. At the higher intensities (20, 30, 40, and 50 mm h−1) some of the longer ATs achieved errors of ≤1%. For instance, at 50 mm h−1, an AT of ≥12 min achieved an uncertainty of ≤1.0%. At 20 mm h−1, this level of uncertainty was only reached for ATs ≥ 30 min. At 5 mm h−1, 1% uncertainty required an AT of >40 min. Evidently, achieving accuracy akin to that specified in typical TBRG data sheets (Table 1) can require long ATs.
Table 4.
Errors in apparent rainfall rates for 6 nominated, constant rainfall rates of 5–50 mm h−1 with apparent rainfall rates estimated from 7 ATs (accumulation durations) having durations in the range 5 min to 50 min. The data are based on a reduced uncertainty of only one bucket-filling time and hence are smaller than those listed in Table 2. Refer to text for details.
The relationships between error (%) and AT* were similar to those presented for the worst-case data (Figure 1) but are not included here for reasons of space.
4. Discussion
The results presented above show that for single short periods of rainfall, such as showers, or intra-event periods of short duration within longer enclosing events, uncertainty in the measurement of depth and rainfall rate can be substantial, even at quite high intensities such as 20–40 mm h−1. Typical error values for rainfall rate (Equation (7)) were tabulated above for ATs of 10 min and 15 min because it is over ATs such as these that concern exists about the secular intensification of rainfall that is linked to higher temperatures. Even at 20 mm h−1, worst-case errors in estimated rainfall rates in the range of ~4% to ~7% were demonstrated. Typical manufacturers’ accuracy specifications (Table 1) do not appear to be applicable to short-duration TBRG data of this kind. This is in part because TBRG specifications neglect to refer to the AT that inherently determines the uncertainty of TBRG data. Nor, in most cases, are the specifications limited to intensities greater than, for instance, 30 mm h−1, where uncertainty would be smaller except for the growing errors arising from dynamic under-catch that become rapidly worse at higher intensities. The errors documented in the present study extend to quite high intensities, such that even at 50 mm h−1, worst-case uncertainty exceeds 1% for all ATs of <~30 min duration. Larger uncertainties arise for short durations such as 15 min. This poses challenges for the confident detection of secular change in short-duration rainfalls such as those that result in urban flash flooding. Additionally, the error estimates derived here are for rain at constant intensity and with no intermittency during the AT. These conditions would often not be met in natural rainfall, and this would tend to add further sources of error to TBRG data, particularly through erroneous estimates of rainfall duration.
Rainfall depth errors (Equation (4)) were not presented here in detail. The fixed rainfall rates (10 mm h−1, 20 mm h−1, and so on) used in data analysis are all integrally divisible by the notional TBRG sensitivity used (0.2 mm). Furthermore, the ATs used were also all an exact number of minutes (5 min, 10 min, and so on). Thus, in many cases the true rainfall depth (Equation (3)) was itself an integral multiple of the gauge sensitivity. For example, for a rainfall rate of 20 mm h−1 and an AT of 15 min, the true rainfall depth would be 5.0 mm. In such a case, the depth error estimated from Equation (4) is zero. In natural rainfall, the depth of rain in a 15 min AT would be unlikely to be precisely 5.0 mm. Therefore, for many combinations of rainfall rate and AT analysed here, the error is smaller than would be likely in natural rainfall for the same AT.
The results presented above also assume a perfectly calibrated TBRG and do not include any under-catch error. This form of error arises at many intensities owing to continued, unmeasured inflow of water to a bucket as it tips. Such errors can reach 10–30% or more at high intensities, considerably larger than the uncertainty arising from the timing and quantisation mechanisms discussed in the present study. Many authors report that dynamic under-catch errors begin at quite low intensities, in the range 15–30 mm h−1 (Marsalek 1981, Humphrey 1997, and Sypka 2019 [34,35,36]). Uncorrected under-catch errors would drive uncertainty levels even further beyond the claims of manufacturers’ specifications.
The largest TBRG errors presented in the present study are worst-case errors. In other words, they quantify the uncertainty in rainfall depth and rainfall rate that could arise if one bucket remained untipped at the end of rain or the AT and was missed in the recording of depth and the maximum of two bucket-filling times were missed in the estimation of rainfall duration. However, the depth uncertainty in any AT can vary between almost zero and almost one bucket volume. Likewise, the uncertainty in rain duration could vary between almost zero and almost two bucket-filling times. In analysing rainfall data from a large sample of ATs, therefore, it is reasonable to suppose that the uncertainty might average approximately 0.5 bucket volumes, and the rain duration uncertainty might average approximately one bucket-filling time, rather than two. Thus, often, at random, the errors could be smaller than the worst-case values presented here. This has important implications for the study of short-term rainfall rates in the study of secular change. Analysing, for instance, the single maximum 15 min intensities in each rain hour or day would be likely to inadvertently target periods when, as shown above, rainfall rate is most overestimated owing to the nature of TBRG errors. The rainfall rate would then appear significantly higher than the true rainfall rate. On the other hand, if many such 15 min periods were analysed together, then according to the Central Limit Theorem, calculated mean rainfall rates would approach the true value, because many of the errors would be smaller than the worst-case errors. The variance in the data would however be increased by any 15 min periods in the data when the errors approached the worst-case value. This could make it difficult to establish statistically significant secular changes in short-duration rainfall rates.
It is also worth emphasising that under the conditions assumed here, the TBRG depth error always takes the form of an underestimate of rainfall, whilst the duration error tends always to increase the apparent rainfall rate by indicating a shorter rainfall duration. The two errors thus contribute differently to the rainfall rate error, the depth error tending to reduce apparent rainfall rate, and the duration error tending to increase it. The resulting errors tend to be larger in short ATs, and in rainfall of low-to-moderate intensity. They also clearly depend on the sensitivity of the TBRG, and errors would be larger if data were collected using a TBRG having a sensitivity of only 0.5 mm, for example. Correspondingly, errors would be reduced if the TBRG had a sensitivity of 0.1 mm. The net error in rainfall rate is generally an overestimate because the worst-case duration error more than offsets the rain-depth error.
The depth error in TBRG data cannot be wholly eliminated. However, both the depth and rainfall duration errors would in some cases be smaller than the worst-case error, if for instance the first bucket was almost full when rain started, so that the first tip could record this moment. However, this is likely to be a rare occurrence. Likewise, it is unlikely for rain to end just as the final bucket tip occurs. Therefore, in the analyses presented here, a less severe error in rain duration was analysed, involving only one bucket-filling time, to allow for cases where the initial bucket and the final bucket were both partly full.
The lower rain rates examined here (<10 mm h−1) would generally be regarded as typical of stratiform rain, and the higher rates indicative of convective rainfall. Many convective events have intensities and durations that would fall within the range of values explored in the present study. Therefore, the present error estimates seem likely to be applicable to both forms of precipitation.
Though smaller errors may be more frequent, the worst-case errors discussed here must be expected to occur on occasions, and error magnitudes approaching the worst-case values may indeed be relatively common. Given the importance of detecting and tracking secular change in short-term rainfall rates and the need to analyse data from short ATs, it is worth briefly considering what other approaches could be used to minimise uncertainty. Weighing gauges are attended by their own limitations but can resolve small increments of rainfall, equivalent to much greater sensitivity than can be achieved with a TBRG. For example, the Lambrecht ‘rain[e]’ weighing TBRG (https://www.lambrecht.net/en/products/precipitation/weighing-precipitation-sensor-rain-e-LP, accessed on 10 April 2025), which records the growing weight of a bucket as it fills, as well as the time when it tips, is listed by Siles and Ayllon (2024) [24] in a study of 1 min rainfalls in Bolivia as having a sensitivity of 0.001 mm and an intensity resolution of 0.06 mm h−1. Unfortunately, rainfall data with this level of accuracy are far less widely available than are conventional TBRG data, the latter devices being simpler and less costly. An alternative is the co-location of a TBRG and an acoustic rainfall gauge, the latter being able to provide much more precise rainfall duration data (Dunkerley 2020) [37]. Finally, errors are likely to be reduced if multiple short ATs are analysed, rather than a single value, such as the maximum 15 min rain rate on multiple days. The mean of the five highest 15 min rain rates per day, for example, might well exhibit reduced error and greater utility in statistical analysis.
5. Conclusions
TBRG data are vulnerable to multiple sources of error. The analysis presented here has focussed on quantisation errors and their effect on estimates of depth and rainfall rate, with a focus on short rainfall events or short accumulation times. It was shown that whilst the errors in depth and duration are always underestimates, the larger uncertainty in rain duration under worst-case conditions can result in rainfall rate being considerably overestimated. This needs to be allowed for in establishing confidence limits for analyses of apparent secular change in short-duration rainfall intensities.
Funding
This research received no external funding.
Data Availability Statement
Data are available from the author upon reasonable request.
Conflicts of Interest
The author declares no conflicts of interest.
References
- Karl, T.R.; Knight, R.W. Secular Trends of Precipitation Amount, Frequency, and Intensity in the United States. Bull. Am. Meteorol. Soc. 1998, 79, 231–242. [Google Scholar] [CrossRef]
- Zeder, J.; Fischer, E.M. Observed extreme precipitation trends and scaling in Central Europe. Weather. Clim. Extrem. 2020, 29, 100266. [Google Scholar] [CrossRef]
- Robinson, A.; Lehmann, J.; Barriopedro, D.; Rahmstorf, S.; Coumou, D. Increasing heat and rainfall extremes now far outside the historical climate. npj Clim. Atmos. Sci. 2021, 4, 45. [Google Scholar] [CrossRef]
- Chen, Y.-R.; Yu, B.; Jenkins, G. Secular Variation in Rainfall Intensity and Temperature in Eastern Australia. J. Hydrometeorol. 2013, 14, 1356–1363. [Google Scholar] [CrossRef]
- Chiappa, J.; Parsons, D.B.; Furtado, J.C.; Shapiro, A. Short-Duration Extreme Rainfall Events in the Central and Eastern United States During the Summer: 2003–2023 Trends and Variability. Geophys. Res. Lett. 2024, 51, e2024GL110424. [Google Scholar] [CrossRef]
- Fu, Y.; Wu, Q. Recent Emerging Shifts in Precipitation Intensity and Frequency in the Global Tropics Observed by Satellite Precipitation Data Sets. Geophys. Res. Lett. 2024, 51, e2023GL107916. [Google Scholar] [CrossRef]
- Haslinger, K.; Breinl, K.; Pavlin, L.; Pistotnik, G.; Bertola, M.; Olefs, M.; Greilinger, M.; Schöner, W.; Blöschl, G. Increasing hourly heavy rainfall in Austria reflected in flood changes. Nature 2025, 639, 667–672. [Google Scholar] [CrossRef]
- Tamm, O.; Saaremäe, E.; Rahkema, K.; Jaagus, J.; Tamm, T. The intensification of short-duration rainfall extremes due to climate change—Need for a frequent update of intensity–duration–frequency curves. Clim. Serv. 2023, 30, 100349. [Google Scholar] [CrossRef]
- Dougherty, E.; Rasmussen, K.L. Changes in Future Flash Flood–Producing Storms in the United States. J. Hydrometeorol. 2020, 21, 2221–2236. [Google Scholar] [CrossRef]
- Faccini, F.; Luino, F.; Paliaga, G.; Sacchini, A.; Turconi, L.; de Jong, C. Role of rainfall intensity and urban sprawl in the 2014 flash flood in Genoa City, Bisagno catchment (Liguria, Italy). Appl. Geogr. 2018, 98, 224–241. [Google Scholar] [CrossRef]
- Yan, H.; Gao, Y.; Wilby, R.; Yu, D.; Wright, N.; Yin, J.; Chen, X.; Chen, J.; Guan, M. Urbanization Further Intensifies Short-Duration Rainfall Extremes in a Warmer Climate. Geophys. Res. Lett. 2024, 51, e2024GL108565. [Google Scholar] [CrossRef]
- Tett, S.F.B.; Cha, Y.; Donovan, K.; Geffers, G.-M.; Hawkins, E. The Impact of an Extreme Cloud burst on Edinburgh Castle. Bull. Am. Meteorol. Soc. 2023, 104, E1807–E1816. [Google Scholar] [CrossRef]
- He, C.; Breitner-Busch, S.; Huber, V.; Chen, K.; Zhang, S.; Gasparrini, A.; Bell, M.; Kan, H.; Royé, D.; Armstrong, B.; et al. Rainfall events and daily mortality across 645 global locations: Two stage time series analysis. BMJ 2024, 387, e080944. [Google Scholar] [CrossRef] [PubMed]
- Ji, J.S. Rainfall events and adverse health outcomes. BMJ 2024, 387, q2053. [Google Scholar] [CrossRef]
- Thomas, M.A.; Michaelis, A.C.; Oakley, N.S.; Kean, J.W.; Gensini, V.A.; Ashley, W.S. Rainfall intensification amplifies exposure of American Southwest to conditions that trigger postfire debris flows. npj Nat. Hazards 2024, 1, 14. [Google Scholar] [CrossRef]
- Zhao, Y.; Li, Y.; Zheng, J.; Wang, Y.; Meng, X.; Yue, D.; Guo, F.; Chen, G.; Qi, T.; Zhang, Y. A new rainfall Intensity−Duration threshold curve for debris flows using comprehensive rainfall intensity. Eng. Geol. 2025, 347, 107949. [Google Scholar] [CrossRef]
- Liu, B.; Xu, M.; Henderson, M. Where have all the showers gone? Regional declines in light precipitation events in China, 1960–2000. Int. J. Climatol. 2011, 31, 1177–1191. [Google Scholar] [CrossRef]
- Li, K.; Cao, L.; Zhou, Z.; Jiao, L.; Wang, N.; Liu, R. Characteristics and Cause Analysis of Variations in Light Precipitation Events in the Central and Eastern Tibetan Plateau, China, During 1961–2019. Chin. Geogr. Sci. 2022, 32, 155–173. [Google Scholar] [CrossRef]
- Huang, G.; Wen, G. Spatial and temporal variations of light rain events over China and the mid-high latitudes of the Northern Hemisphere. Chin. Sci. Bull. 2013, 58, 1402–1411. [Google Scholar] [CrossRef]
- Lafuente, A.; Berdugo, M.; Ladrón de Guevara, M.; Gozalo, B.; Maestre, F.T. Simulated climate change affects how biocrusts modulate water gains and desiccation dynamics after rainfall events. Ecohydrology 2018, 11, e1935. [Google Scholar] [CrossRef]
- Berti, M.; Bernard, M.; Gregoretti, C.; Simoni, A. Physical Interpretation of Rainfall Thresholds for Runoff-Generated Debris Flows. J. Geophys. Res. Earth Surf. 2020, 125, e2019JF005513. [Google Scholar] [CrossRef]
- Kean, J.W.; Staley, D.M. Forecasting the Frequency and Magnitude of Postfire Debris Flows Across Southern California. Earth’s Future 2021, 9, e2020EF001735. [Google Scholar] [CrossRef]
- Ahuna, M.N.; Afullo, T.J.; Alonge, A.A. 30-Second and One-Minute Rainfall Rate Modelling and Conversion for Millimetric Wave Propagation in South Africa. SAIEE Afr. Res. J. 2016, 107, 17–29. [Google Scholar] [CrossRef]
- Siles, G.A.; Ayllon, N. Annual Statistics from 5 Years of 1-Minute Rainfall Rate Measurements at a Specific Site in Bolivia. In Proceedings of the 2024 18th European Conference on Antennas and Propagation (EuCAP), Glasgow, UK, 17–22 March 2024; pp. 1–5. [Google Scholar]
- Buda, A.R.; Veith, T.L.; Folmar, G.J.; Feyereisen, G.W.; Bryant, R.B.; Church, C.D.; Schmidt, J.P.; Dell, C.J.; Kleinman, P.J.A. U.S. Department of Agriculture Agricultural Research Service Mahantango Creek Watershed, Pennsylvania, United States: Long-term precipitation database. Water Resour. Res. 2011, 47. [Google Scholar] [CrossRef]
- Buda, A.R.; Millar, D.J.; Kennedy, C.D.; Welsh, M.K.; Wiegman, A.R.H. Trends in extreme rainfall over the past 55 years suggest springtime subhourly rainfall extremes have intensified in Mahantango Creek, Pennsylvania. Sci. Rep. 2024, 14, 27837. [Google Scholar] [CrossRef]
- Dunkerley, D. Recording Rainfall Intensity: Has an Optimum Method Been Found? Water 2023, 15, 3383. [Google Scholar] [CrossRef]
- Costello, T.A.; Williams, H.J. Short duration rainfall intensity measured using calibrated time-of-tip data from a tipping bucket raingage. Agric. For. Meteorol. 1991, 57, 147–155. [Google Scholar] [CrossRef]
- Western, A.W.; Anderson, B.; Siriwardena, L.; Chiew, F.H.S.; Seed, A.; Blöschl, G. The within-day behaviour of 6 minute rainfall intensity in Australia. Hydrol. Earth Syst. Sci. 2011, 15, 2561–2579. [Google Scholar] [CrossRef]
- Wang, J.; Fisher, B.L.; Wolff, D.B. Estimating Rain Rates from Tipping-Bucket Rain Gauge Measurements. J. Atmos. Ocean. Technol. 2008, 25, 43–56. [Google Scholar] [CrossRef]
- Molini, A.; La Barbera, P.; Lanza, L.G.; Stagi, L. Rainfall intermittency and the sampling error of tipping-bucket rain gauges. Phys. Chem. Earth Part C Sol. Terr. Planet. Sci. 2001, 26, 737–742. [Google Scholar] [CrossRef]
- Yu, B.; Ciesiolka, C.A.A.; Rose, C.W.; Coughlan, K.J. A note on sampling errors in the rainfall and runoff data collected using tipping bucket technology. Trans. ASAE 1997, 40, 1305–1309. [Google Scholar] [CrossRef]
- Duchon, C.E.; Biddle, C.J. Undercatch of tipping-bucket gauges in high rain rate events. Adv. Geosci. 2010, 25, 11. [Google Scholar] [CrossRef]
- Marsalek, J. Calibration of the tipping-bucket raingage. J. Hydrol. 1981, 53, 343–354. [Google Scholar] [CrossRef]
- Humphrey, M.D.; Istok, J.D.; Lee, J.Y.; Hevesi, J.A.; Flint, A.L. A New Method for Automated Dynamic Calibration of Tipping-Bucket Rain Gauges. J. Atmos. Ocean. Technol. 1997, 14, 1513–1519. [Google Scholar] [CrossRef]
- Sypka, P. Dynamic real-time volumetric correction for tipping-bucket rain gauges. Agric. For. Meteorol. 2019, 271, 158–167. [Google Scholar] [CrossRef]
- Dunkerley, D. Acquiring unbiased rainfall duration and intensity data from tipping-bucket rain gauges: A new approach using synchronised acoustic recordings. Atmos. Res. 2020, 244, 105055. [Google Scholar] [CrossRef]
Disclaimer/Publisher’s Note: The statements, opinions and data contained in all publications are solely those of the individual author(s) and contributor(s) and not of MDPI and/or the editor(s). MDPI and/or the editor(s) disclaim responsibility for any injury to people or property resulting from any ideas, methods, instructions or products referred to in the content. |
© 2025 by the author. Licensee MDPI, Basel, Switzerland. This article is an open access article distributed under the terms and conditions of the Creative Commons Attribution (CC BY) license (https://creativecommons.org/licenses/by/4.0/).