
Public Perception of Drinking Water Quality in an Arsenic-Affected Region: Implications for Sustainable Water Management

 ,
,  ,
,  , , ,
, , ,  and
and
Abstract

1. Introduction
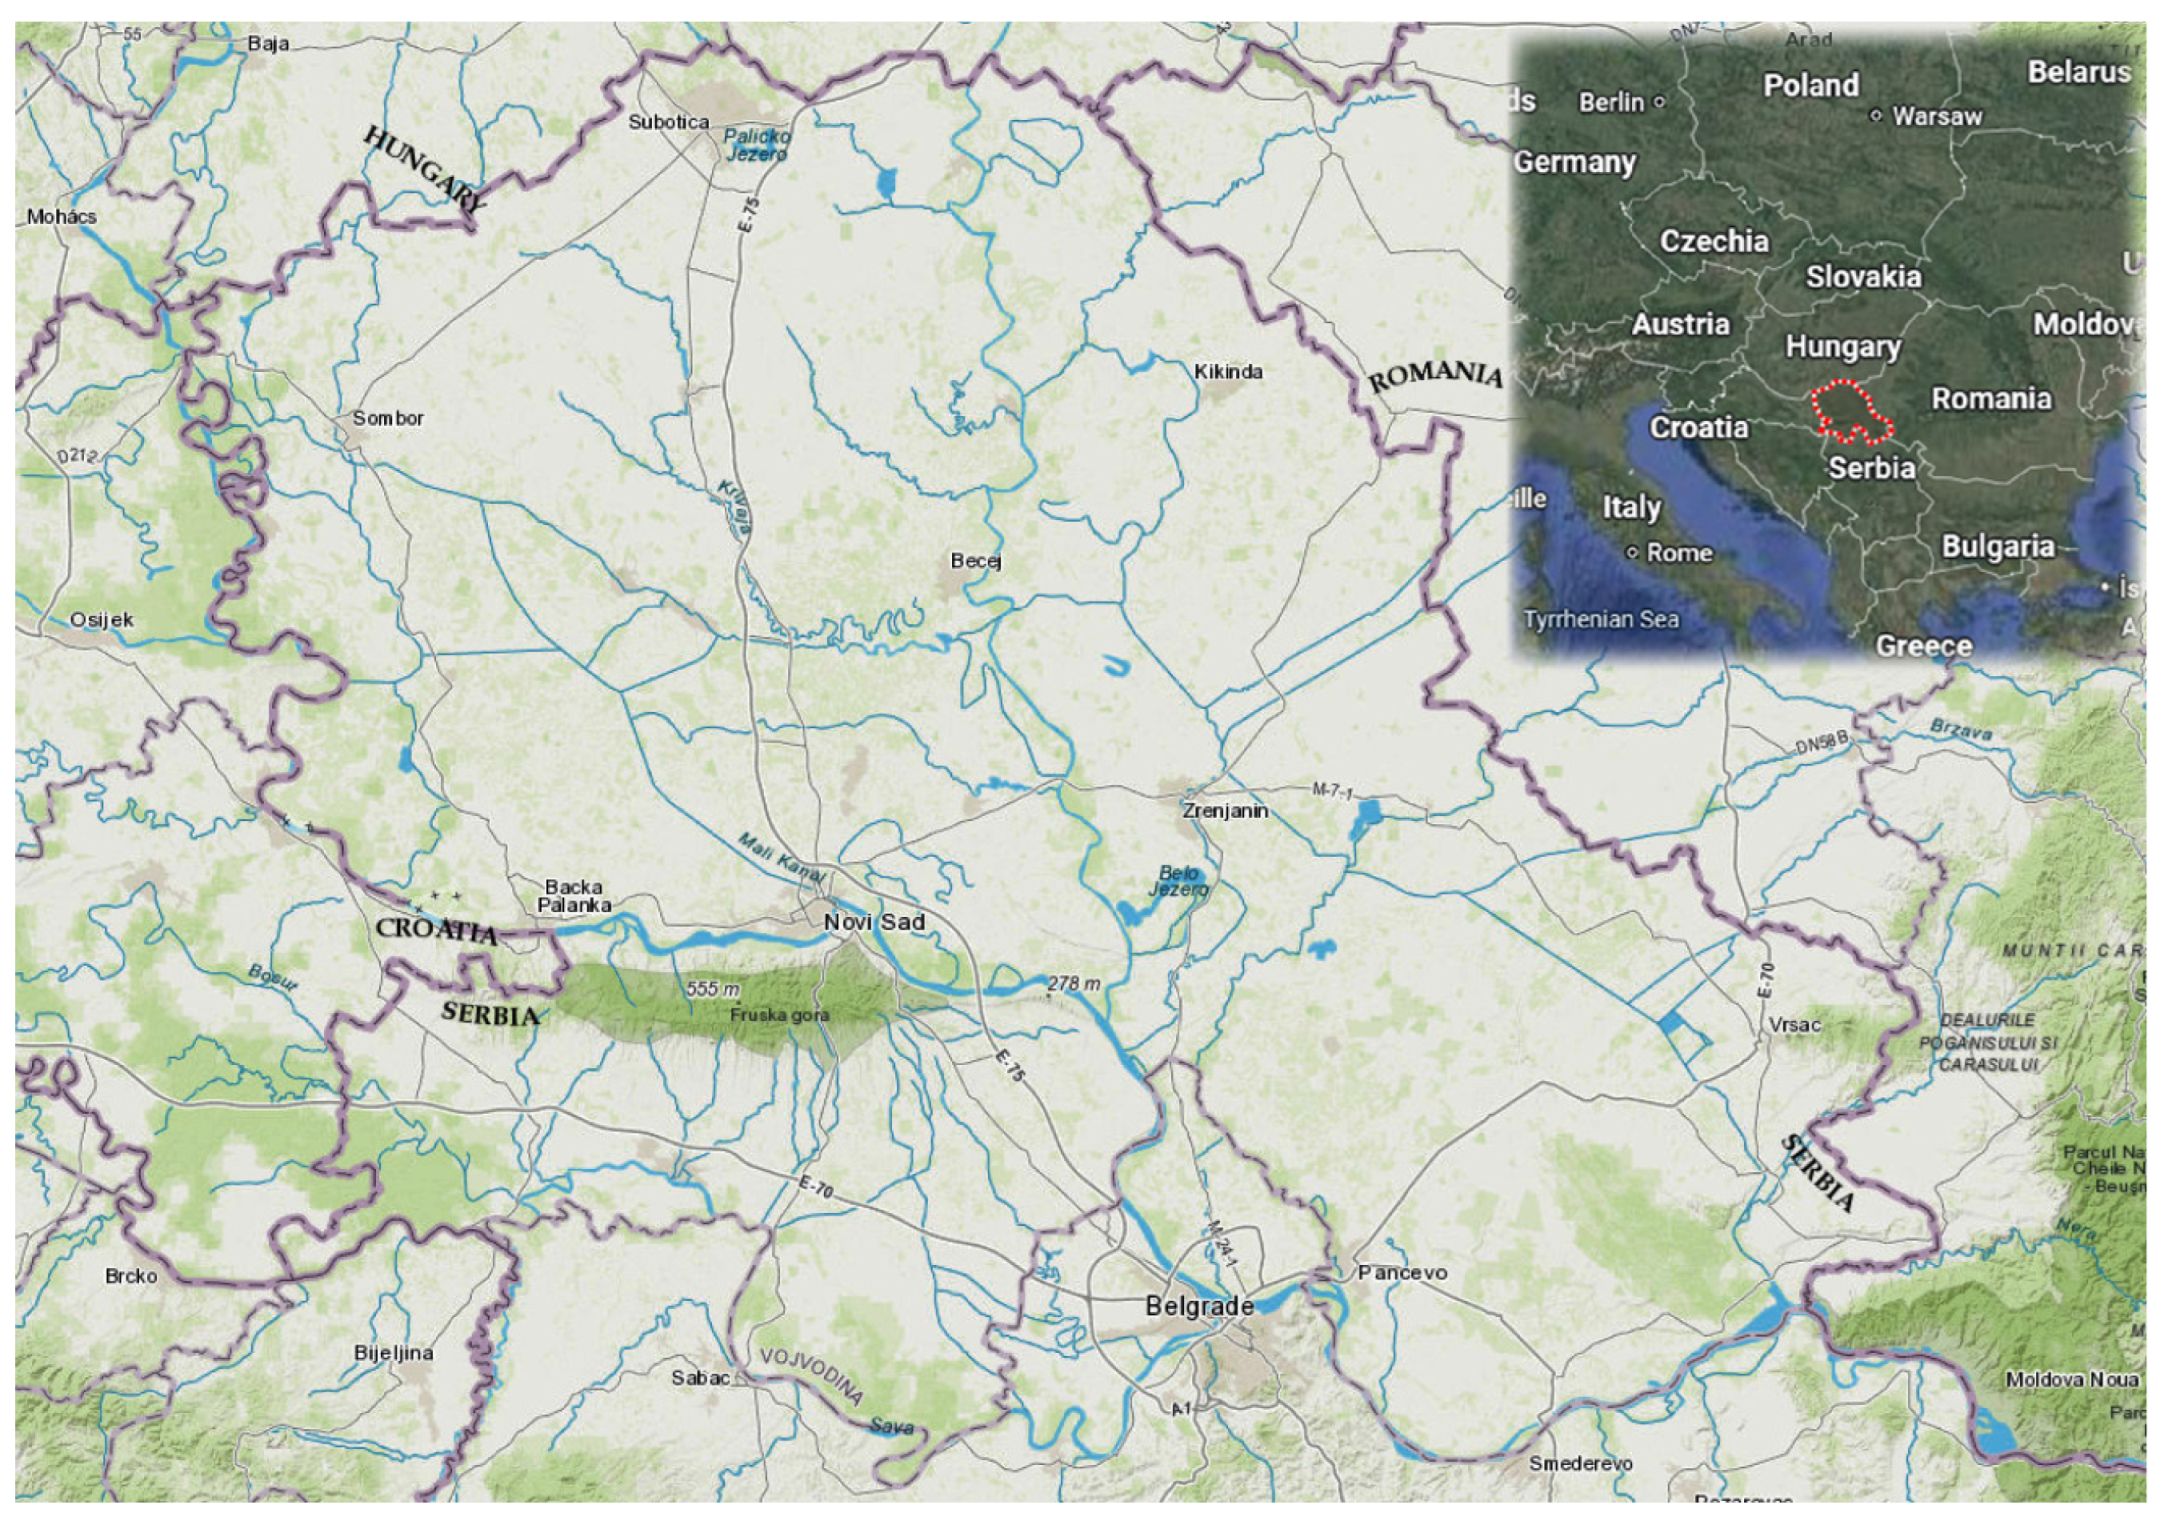
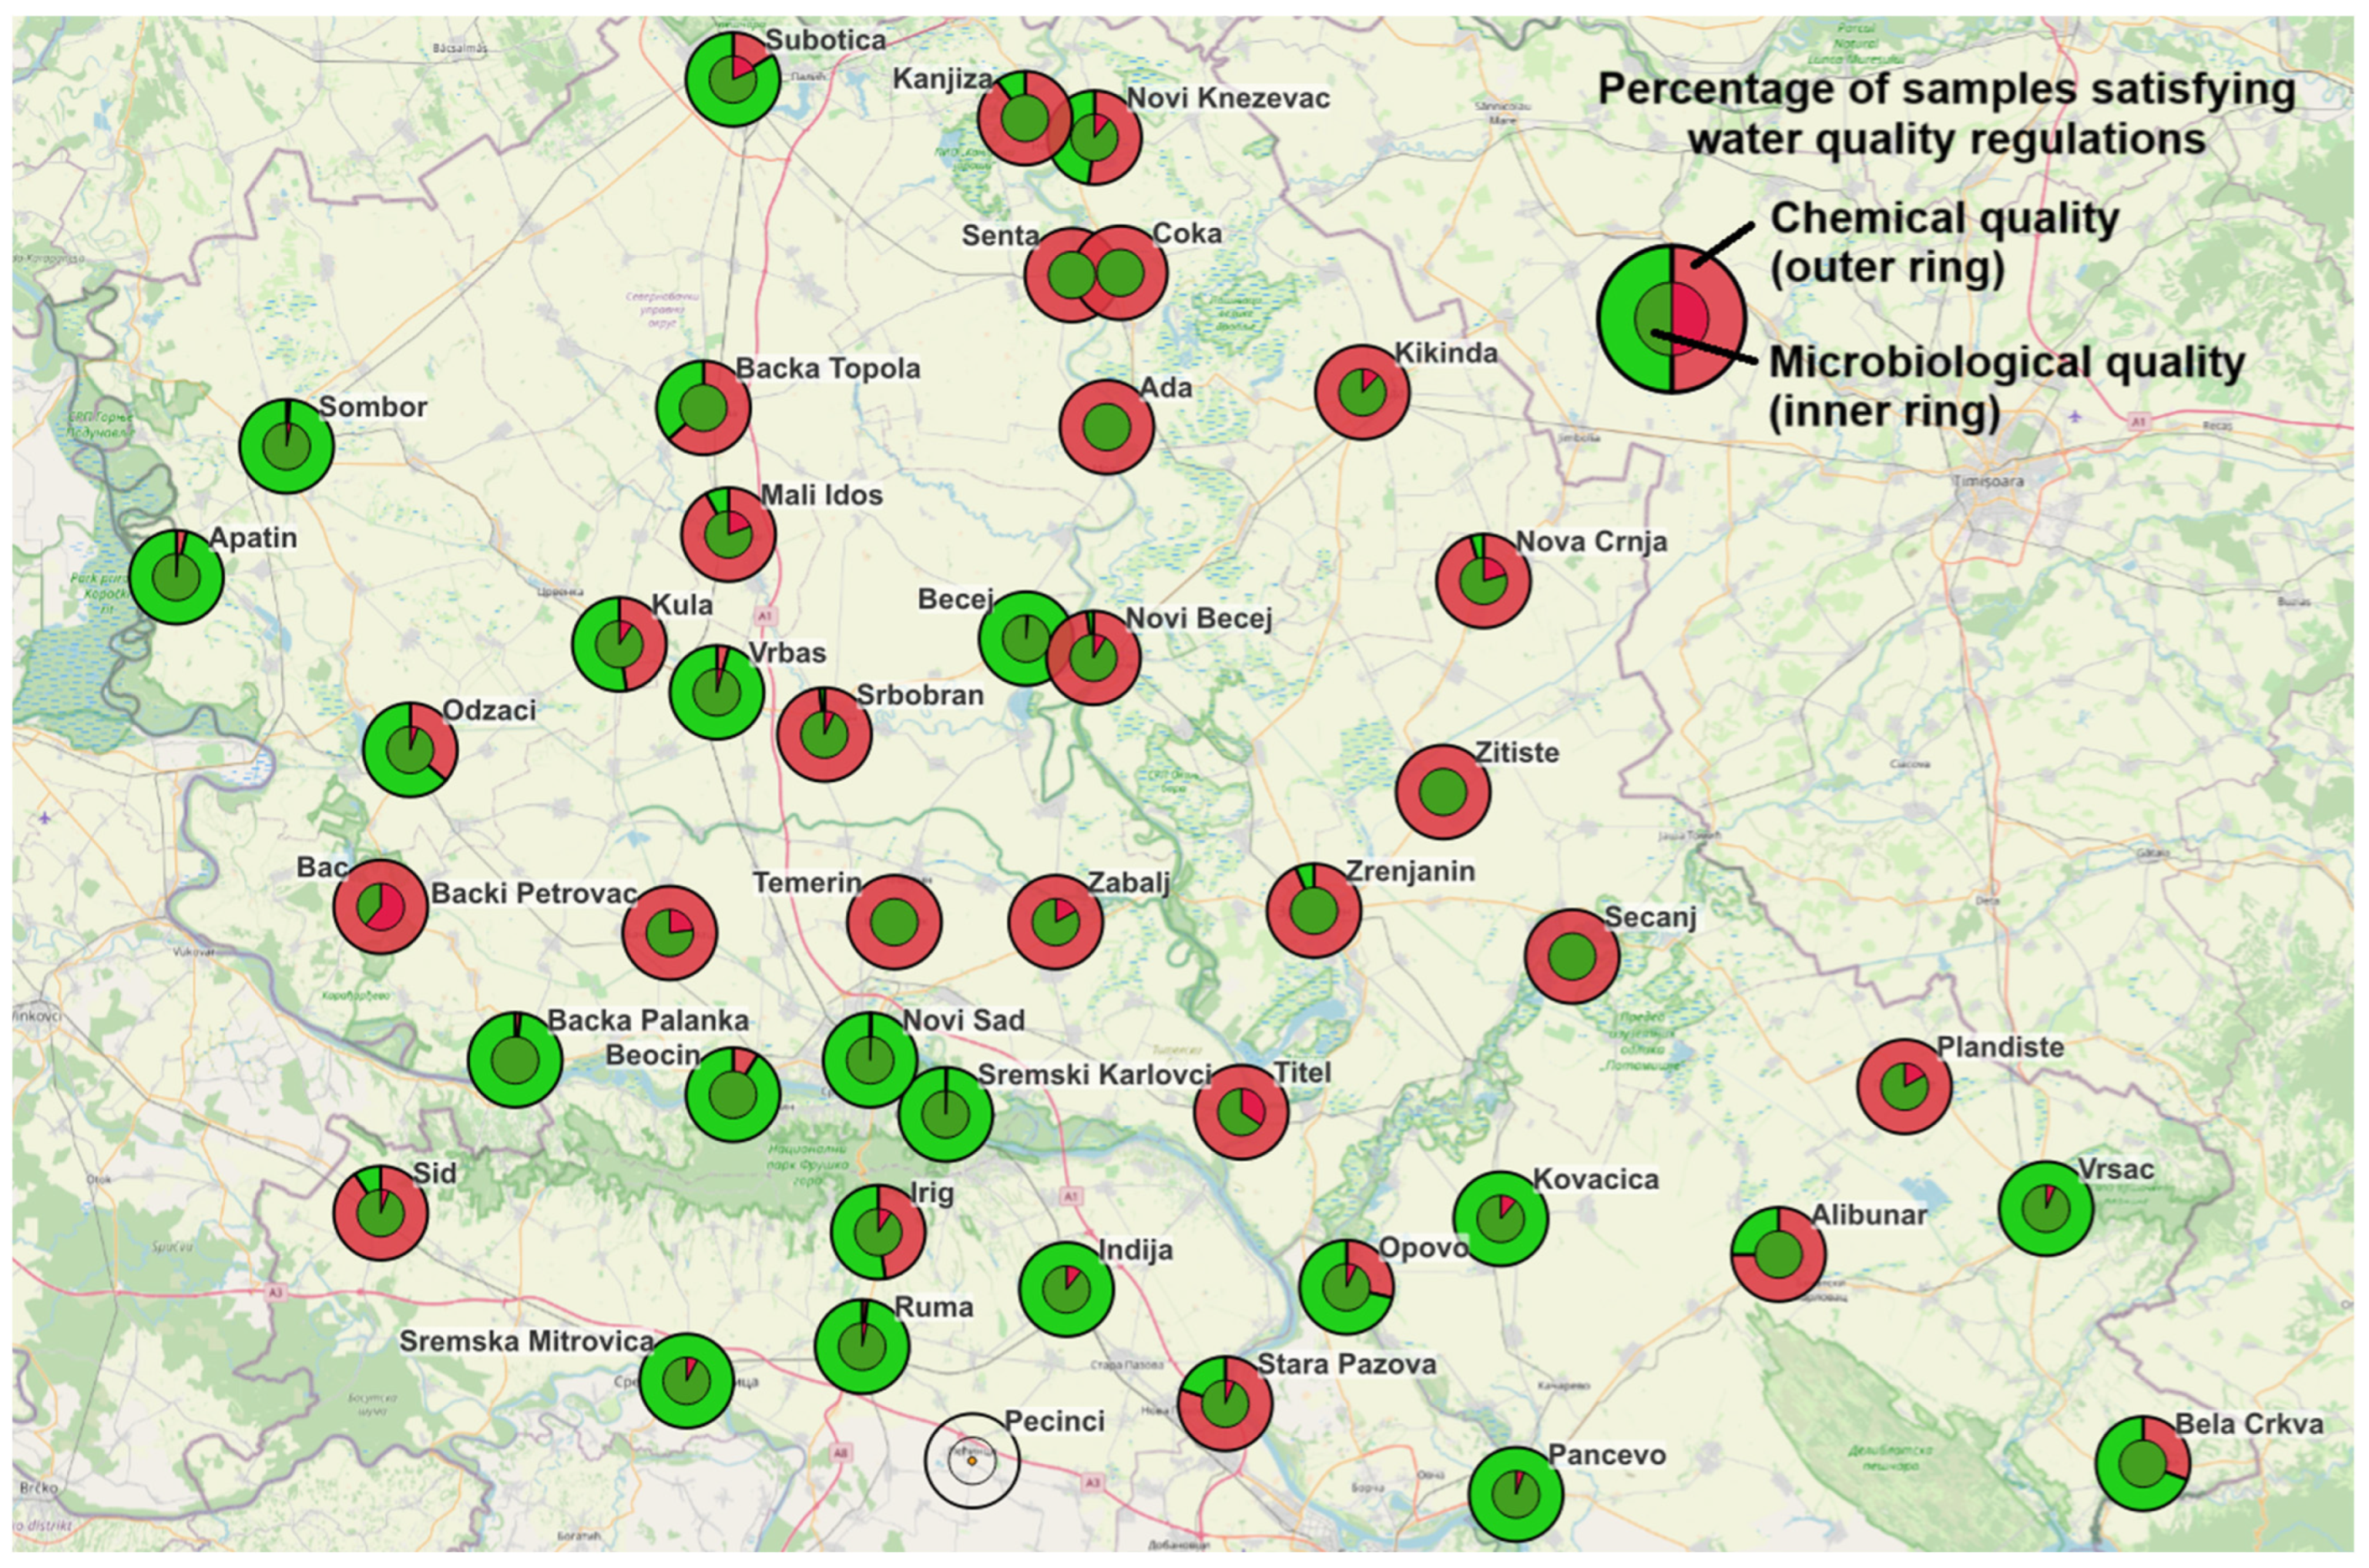
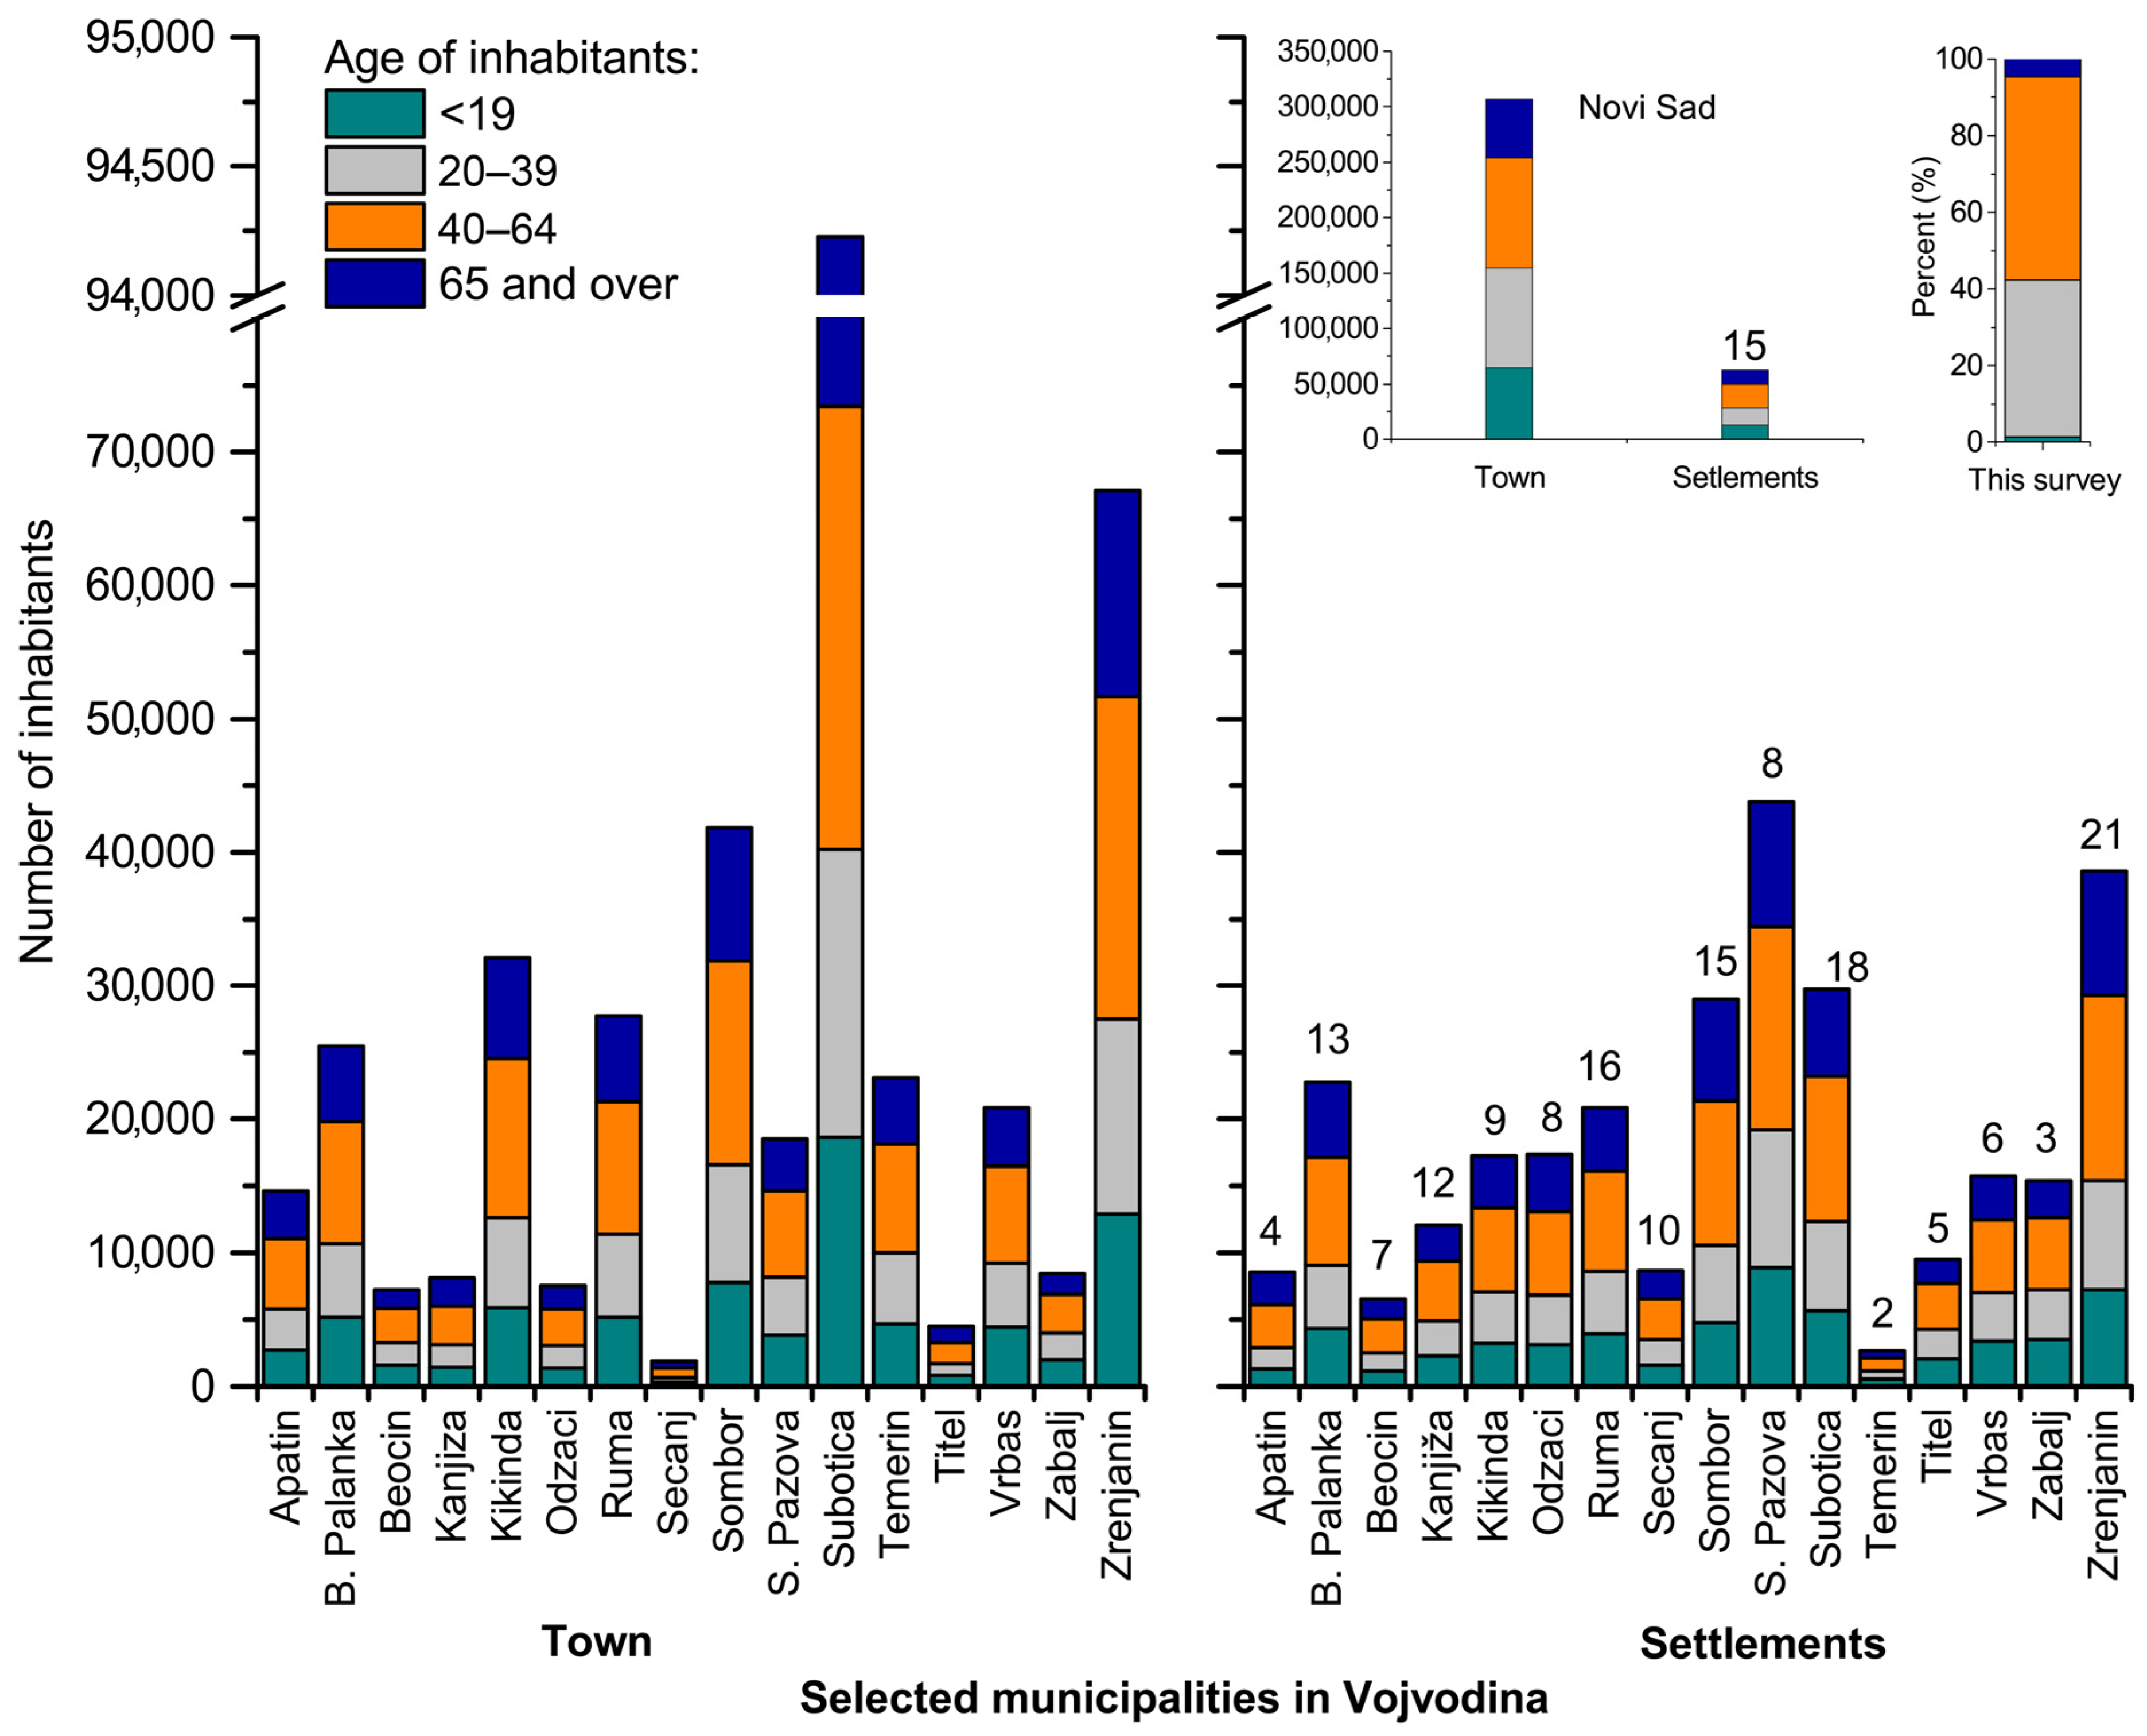
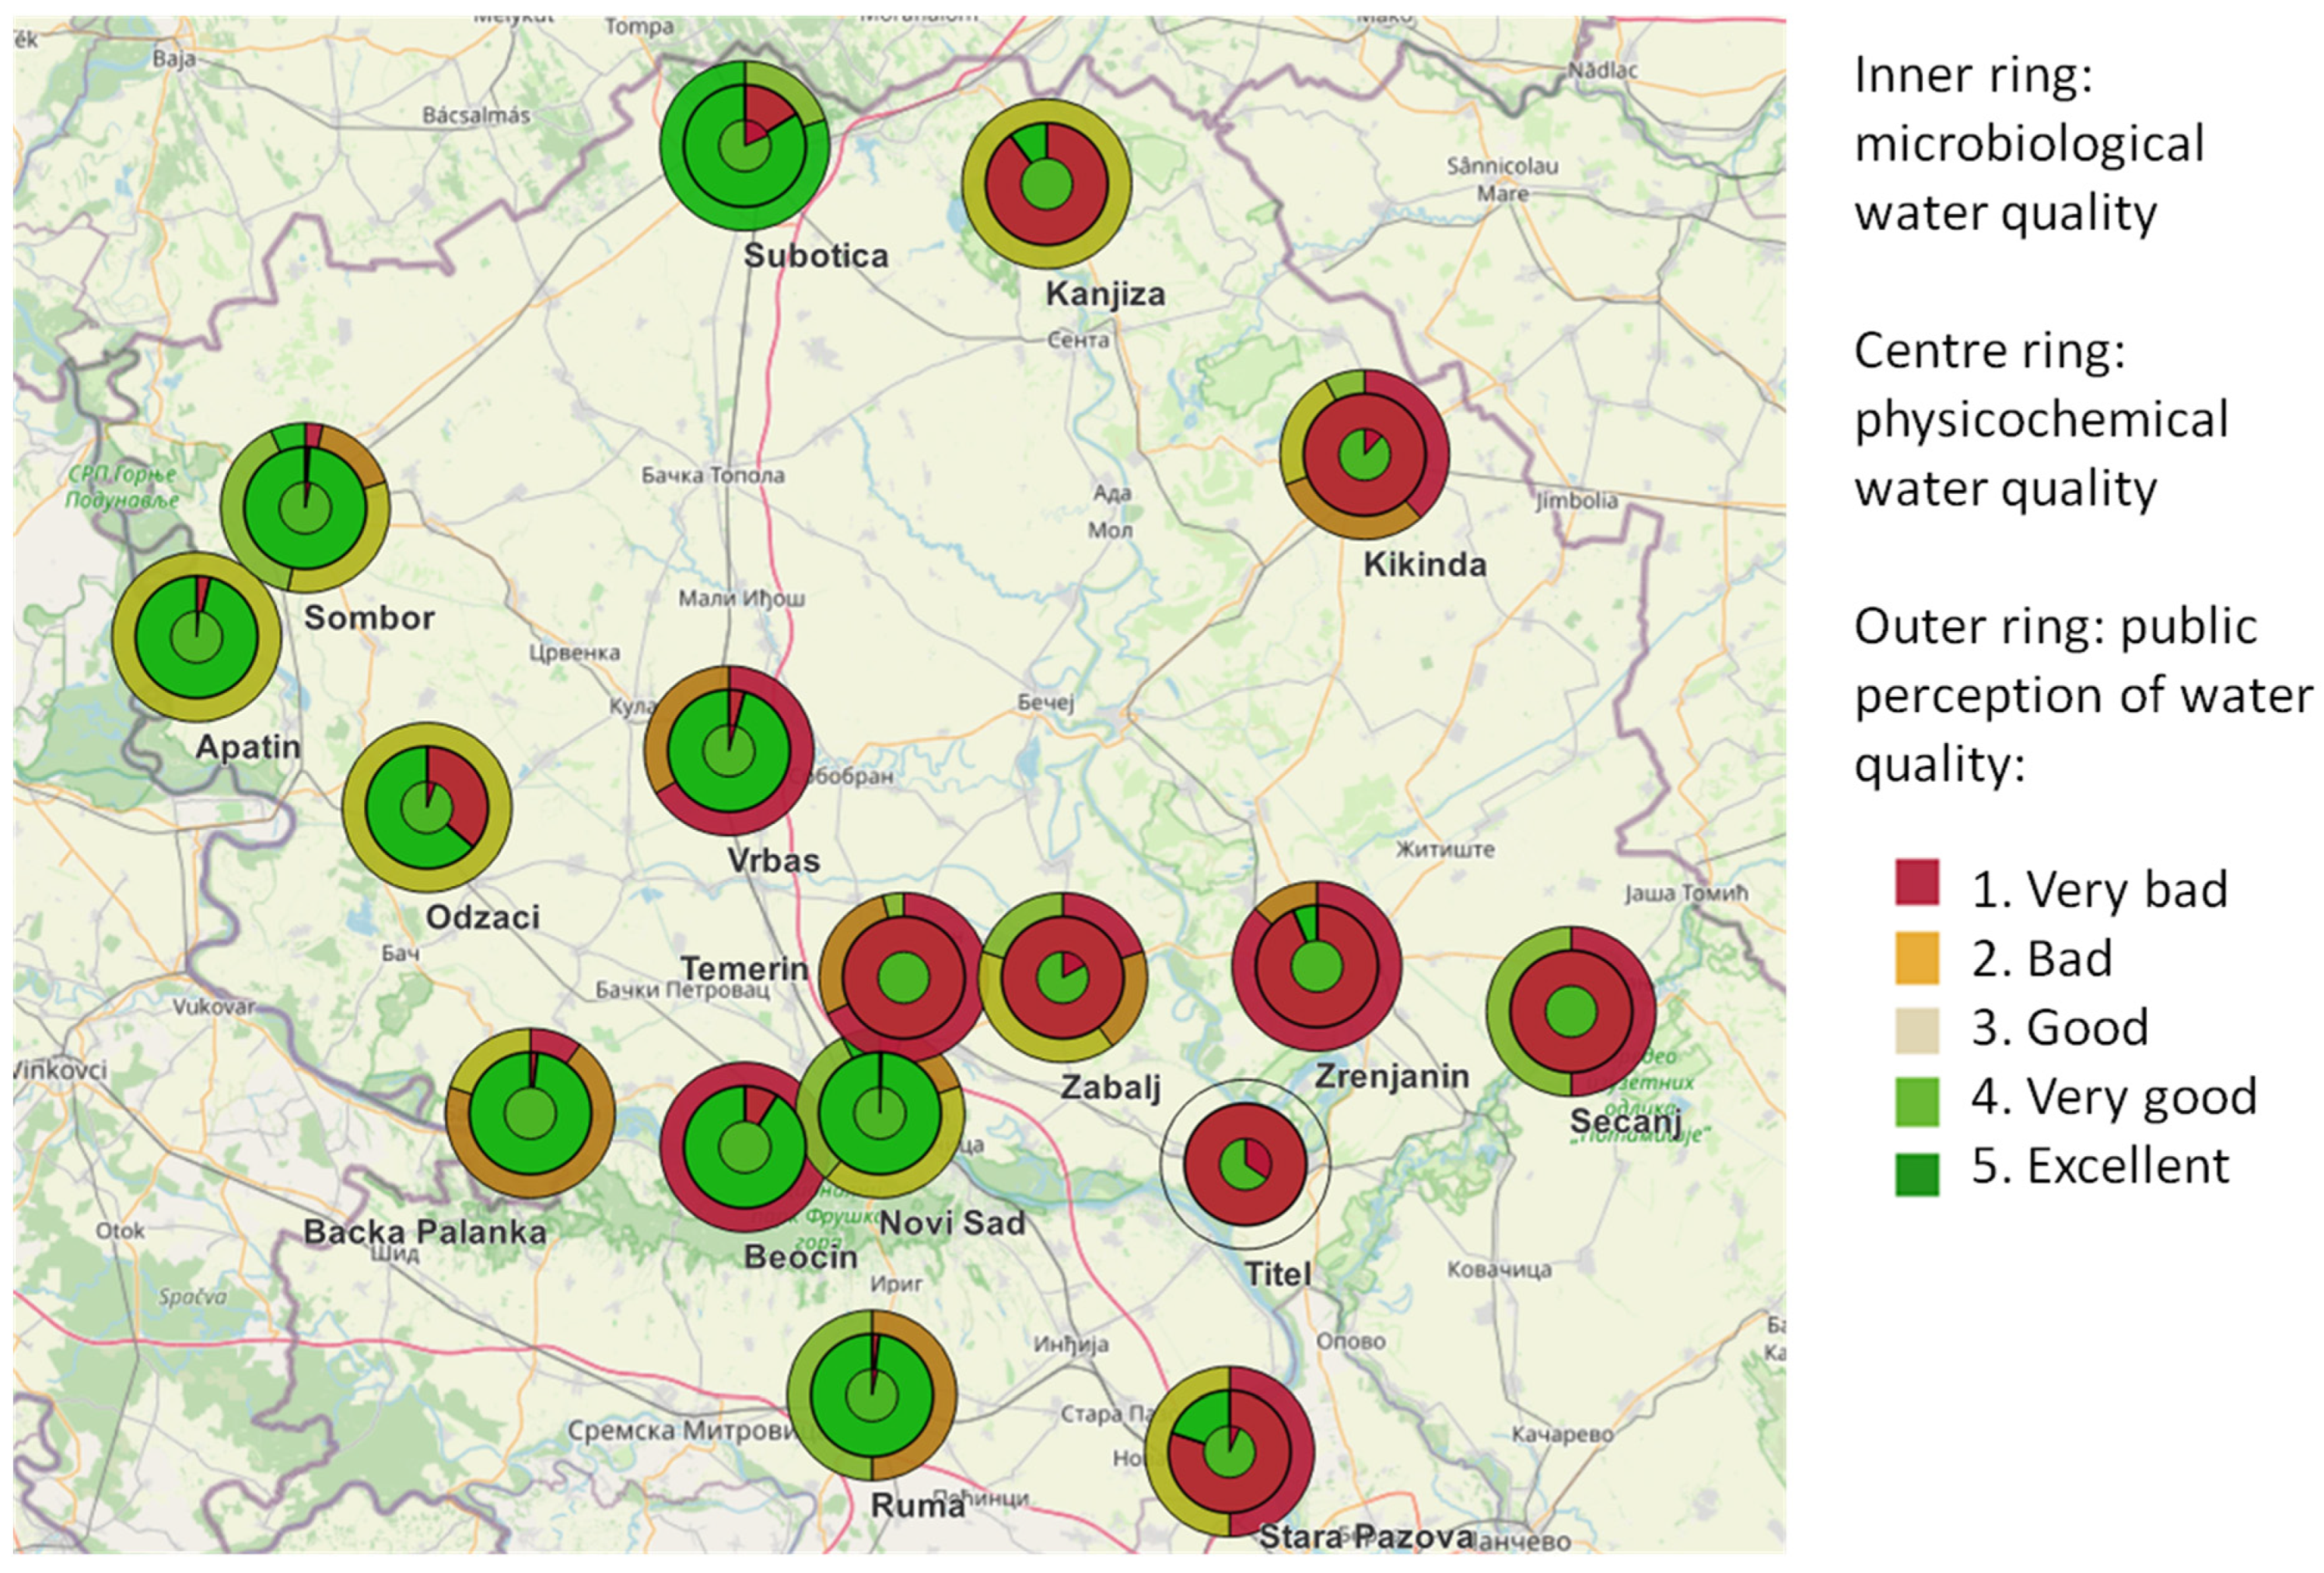
2. The Study Area
3. Materials and Methods
3.1. Methodology of the Public Survey
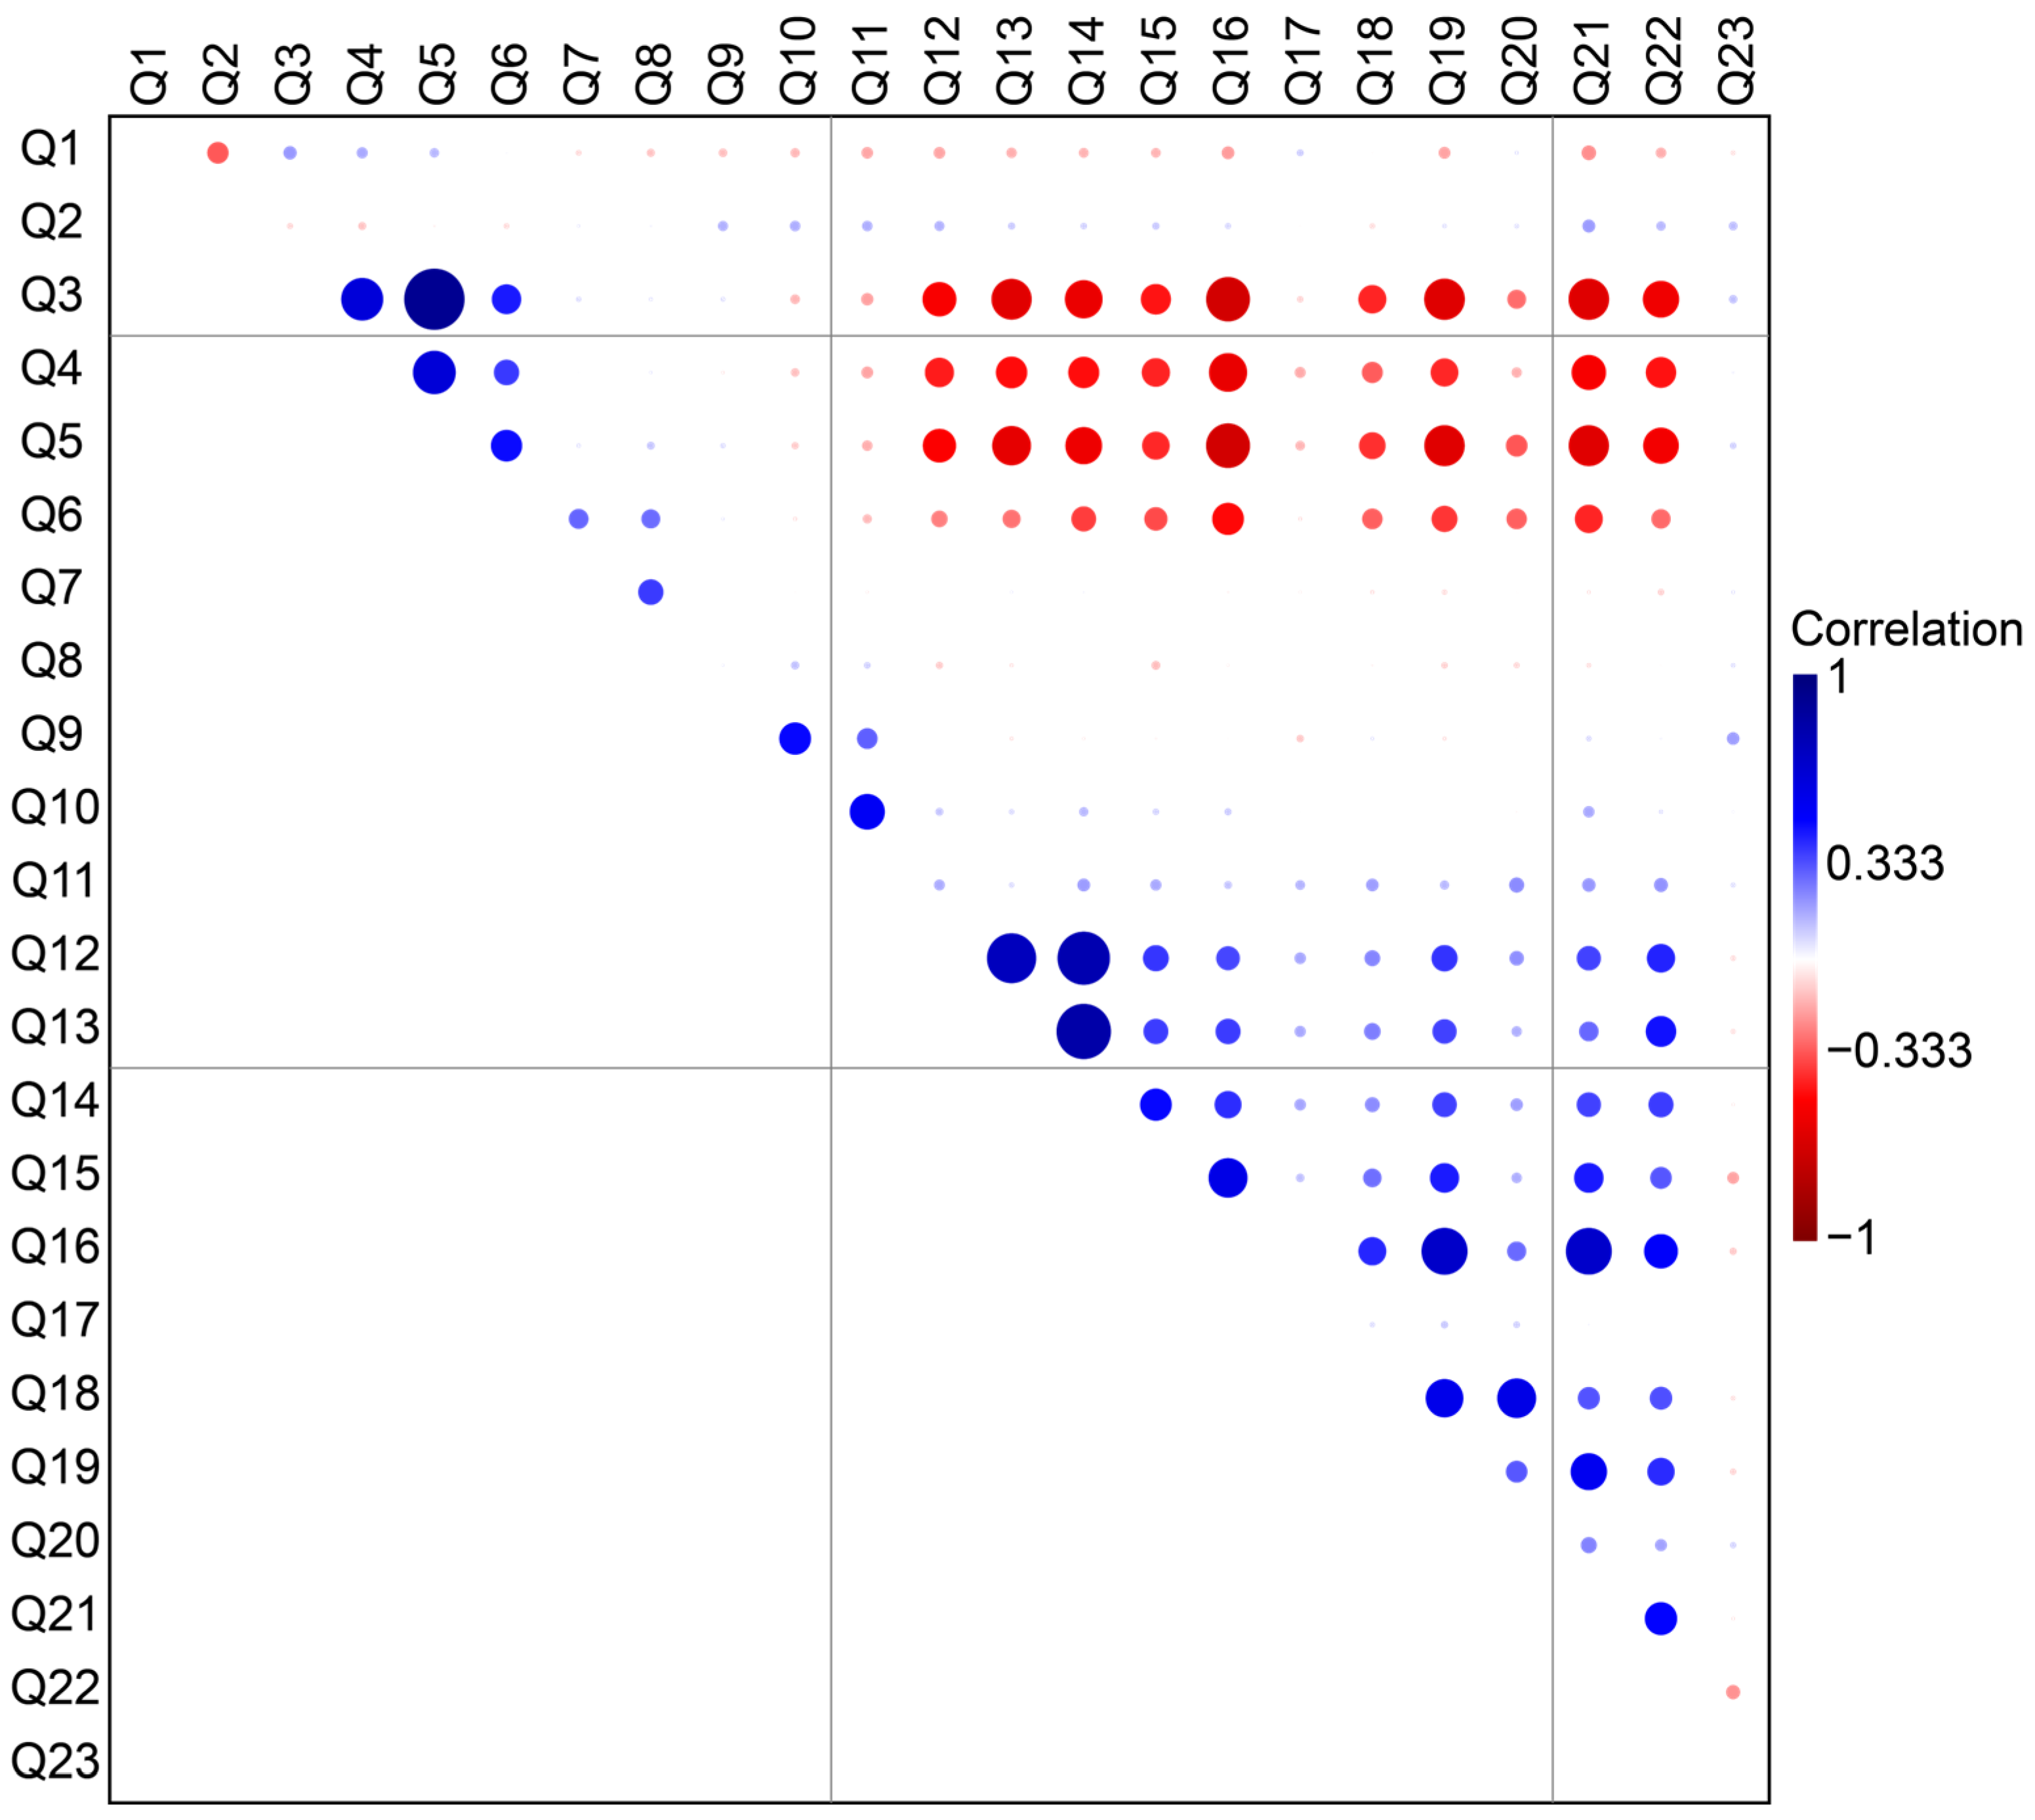
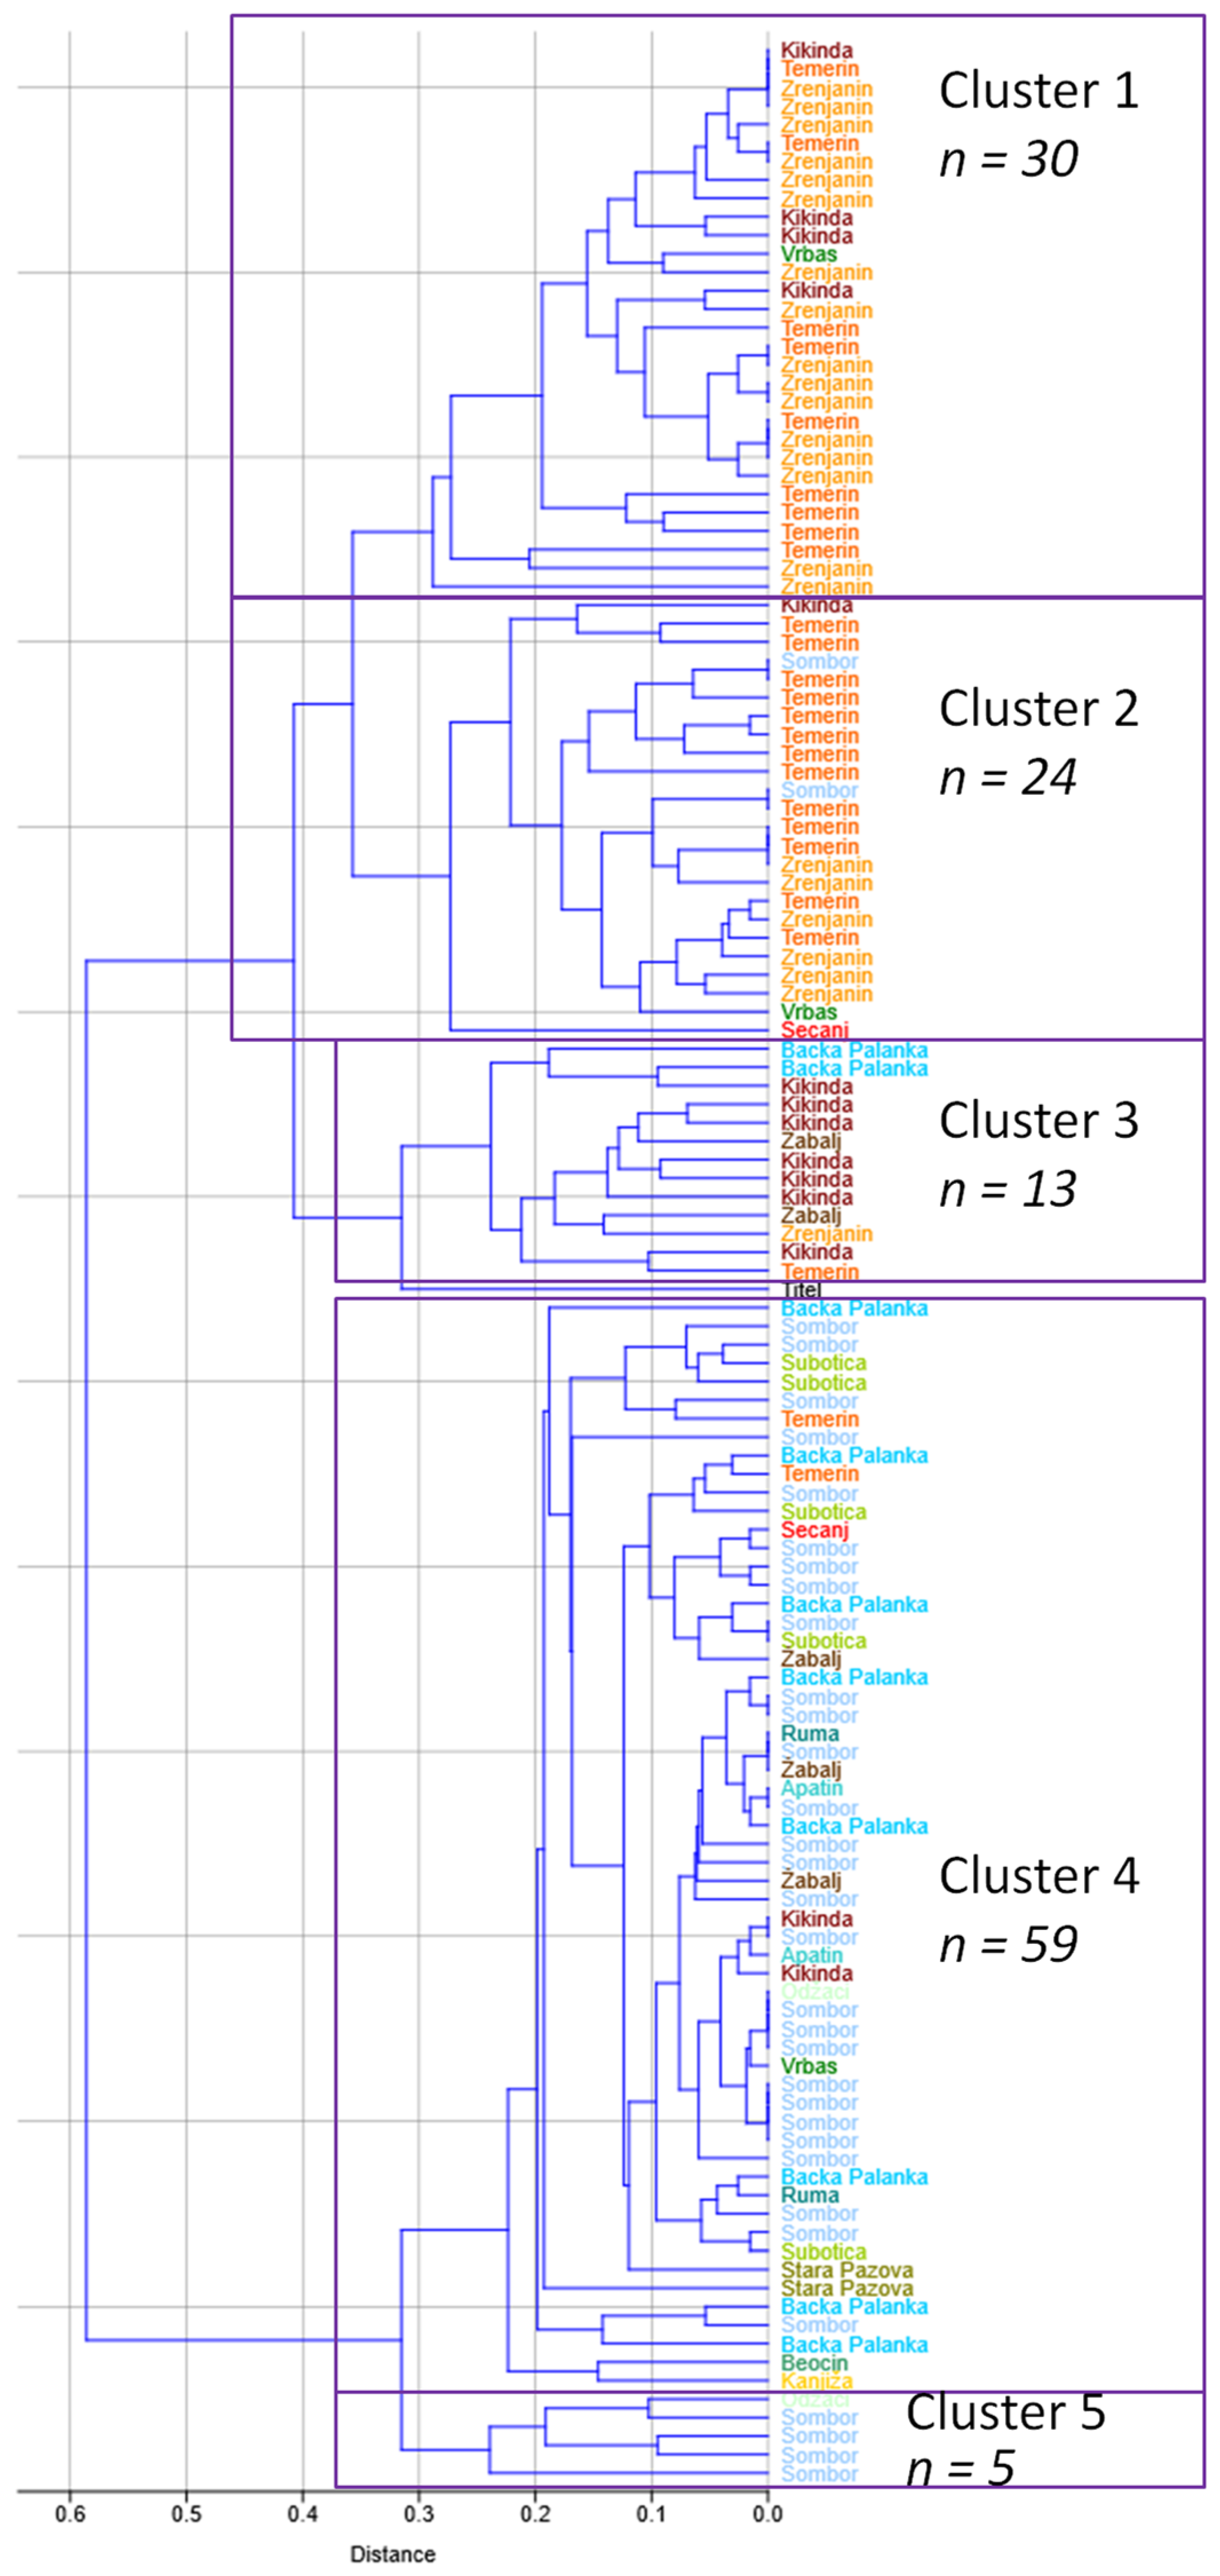
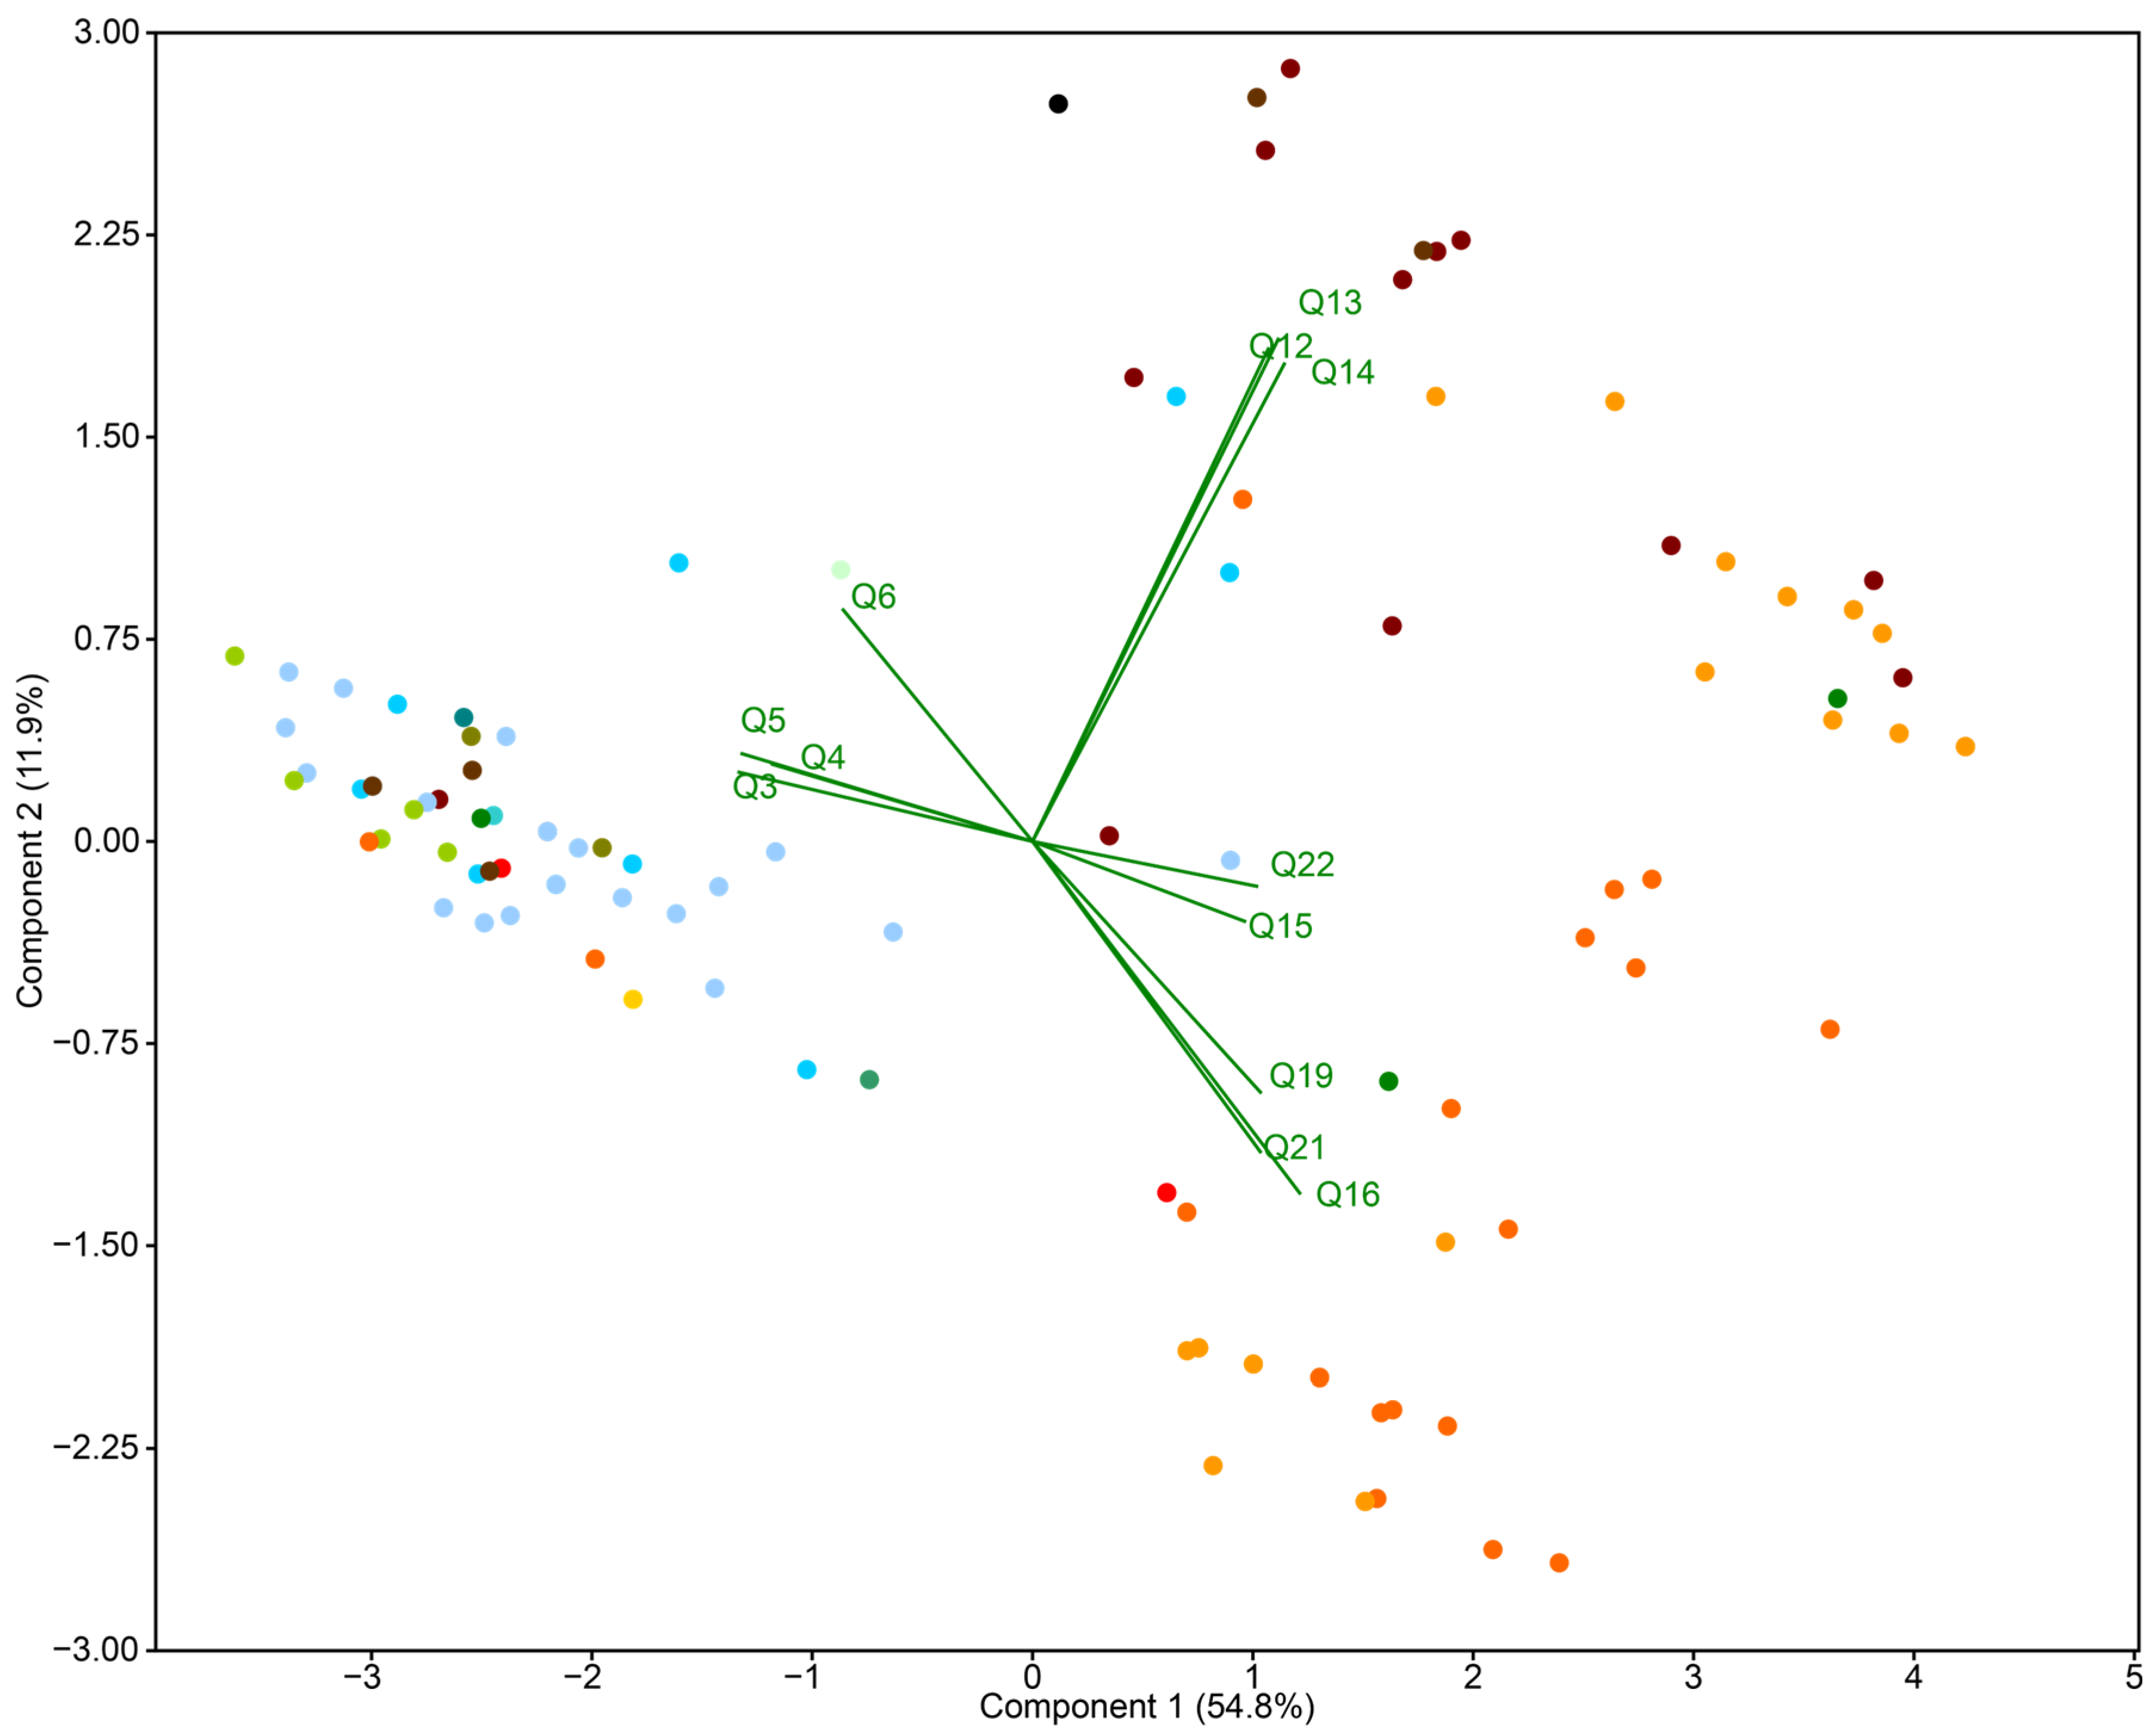
3.2. Statistical Analysis
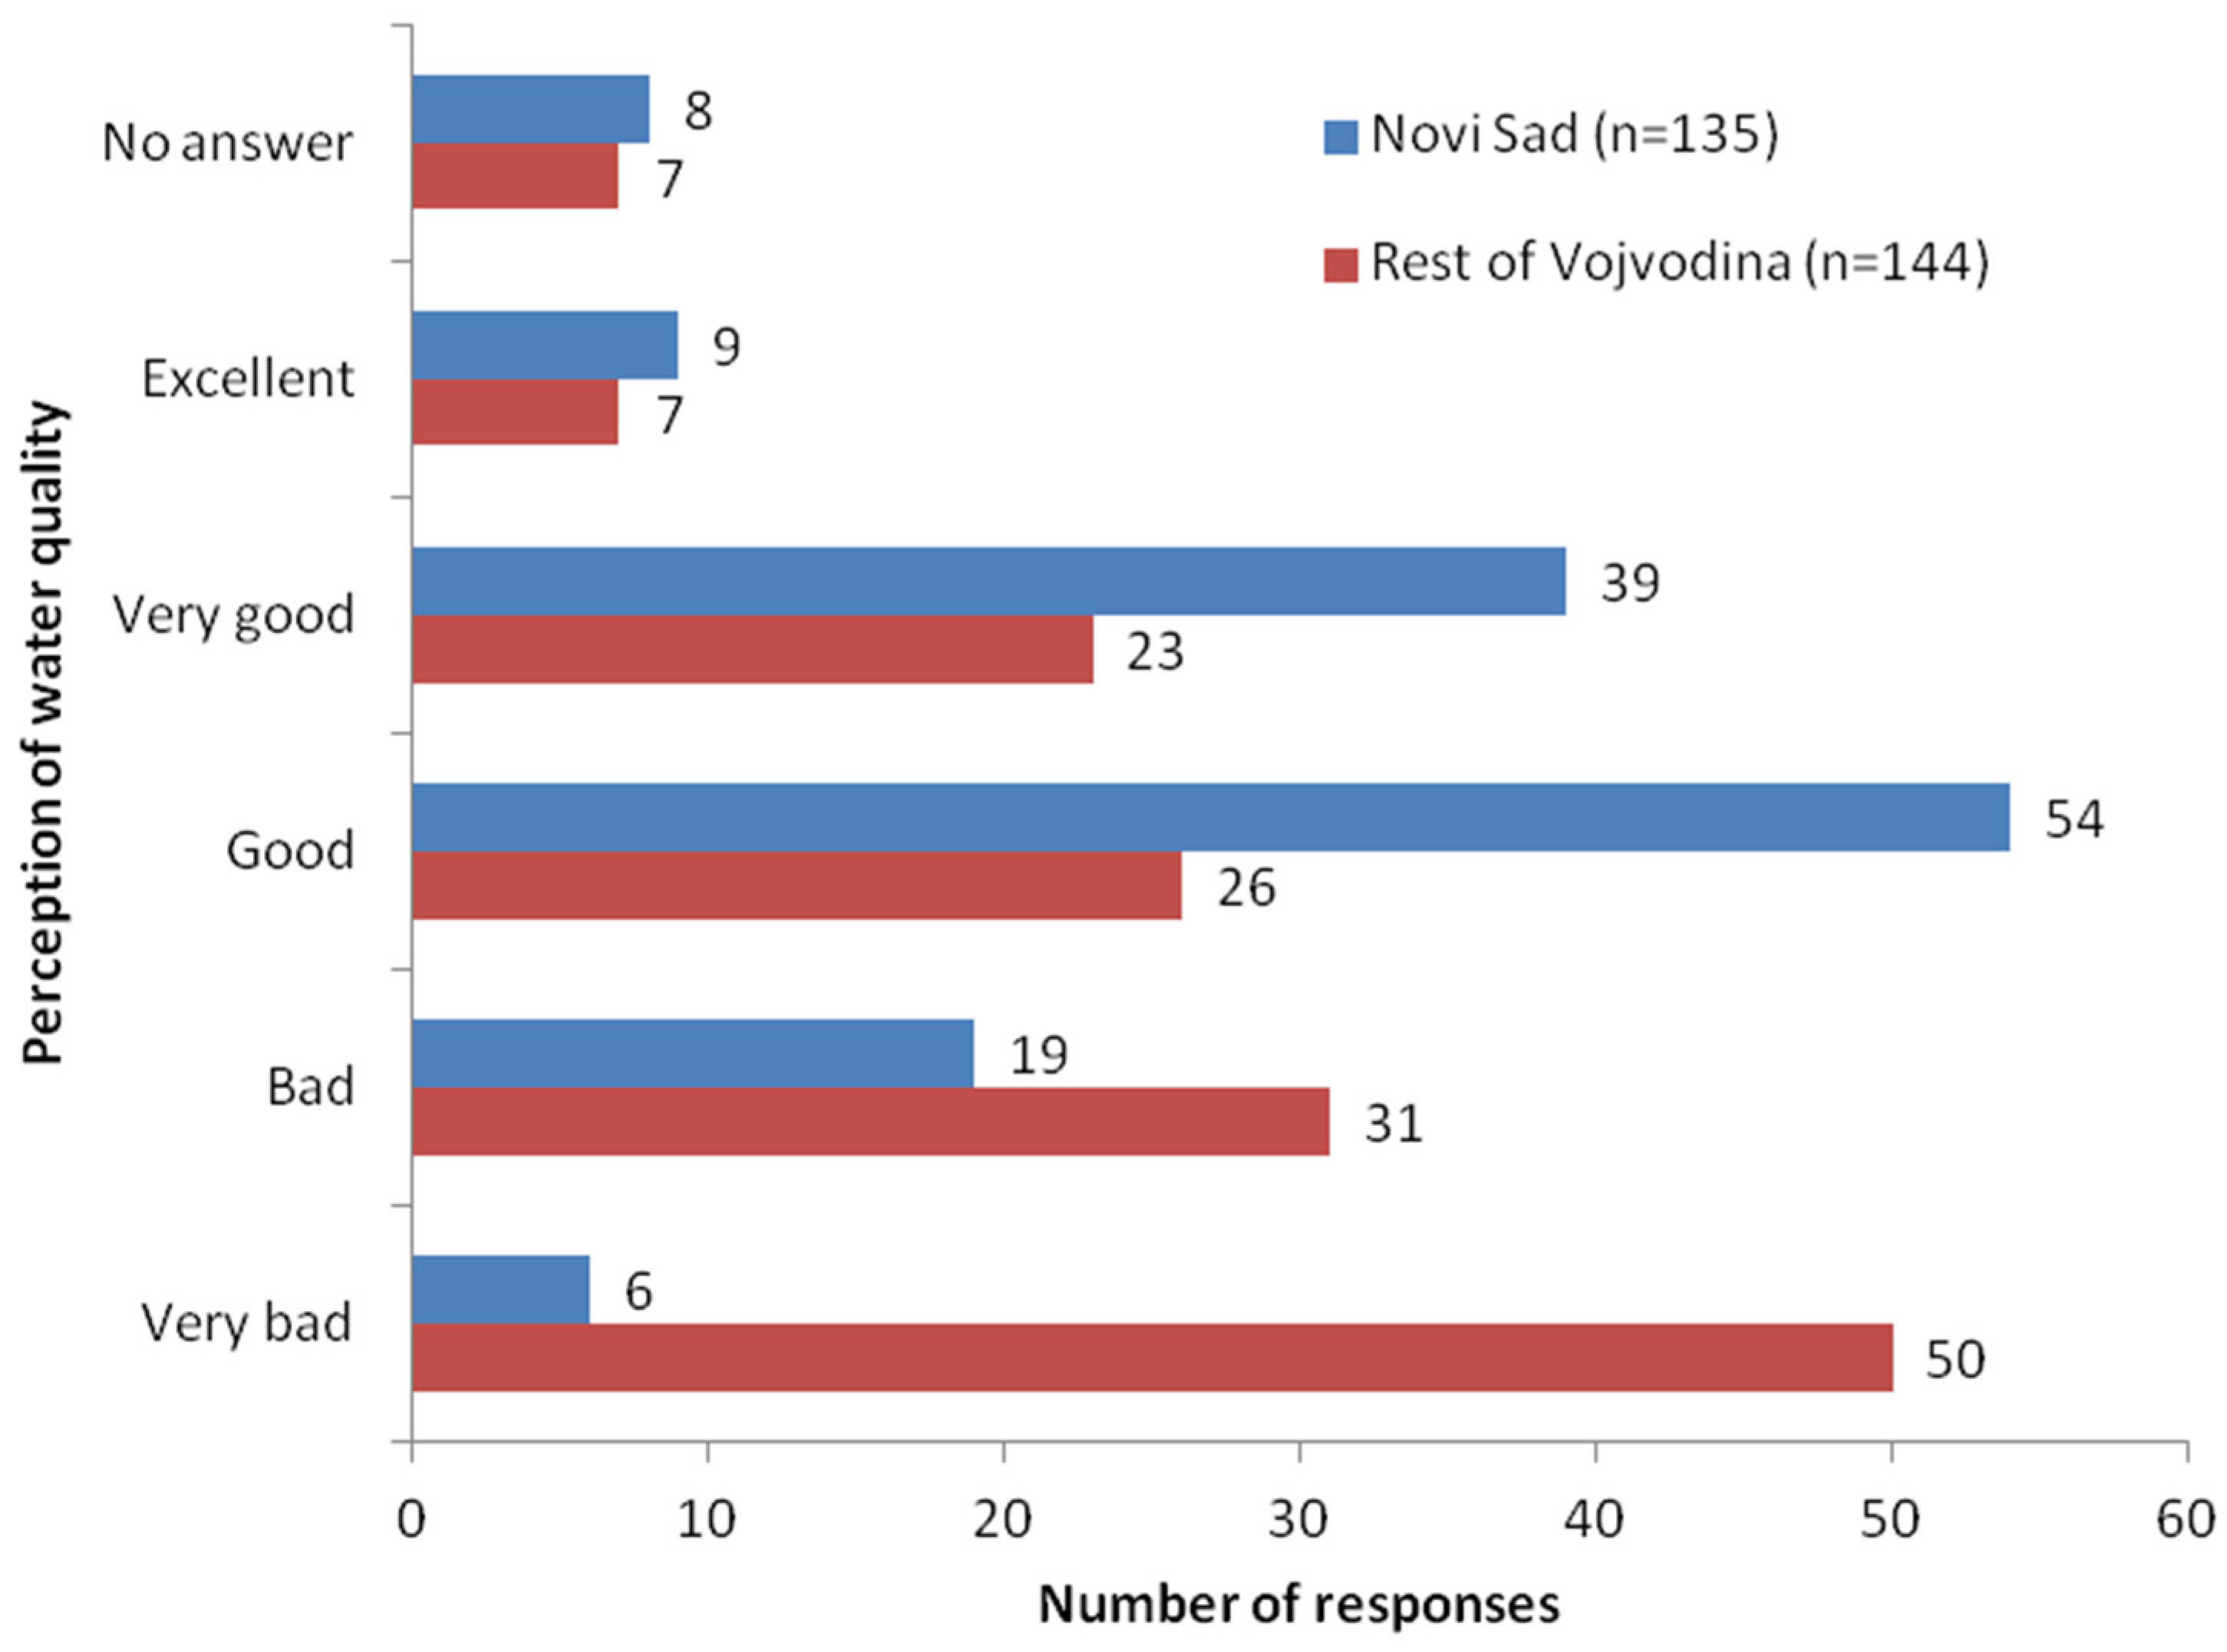
4. Results and Discussion
Statistical Analysis of the Responses from the Rest of Vojvodina, Outside of Novi Sad
5. Conclusions
Supplementary Materials
Author Contributions
Funding
Data Availability Statement
Conflicts of Interest
References
- IPCC. Climate Change 2023: Synthesis Report. Contribution of Working Groups I, II and III to the Sixth Assessment Report of the Intergovernmental Panel on Climate Change; Core Writing Team, Lee, H., Romero, J., Eds.; Intergovernmental Panel on Climate Change (IPCC): Geneva, Switzerland, 2023. [Google Scholar]
- Parag, Y.; Elimelech, E.; Opher, T. Bottled Water: An Evidence-Based Overview of Economic Viability, Environmental Impact, and Social Equity. Sustainability 2023, 15, 9760. [Google Scholar] [CrossRef]
- Okumah, M.; Yeboah, A.S.; Bonyah, S.K. What Matters Most? Stakeholders’ Perceptions of River Water Quality. Land Use Policy 2020, 99, 104824. [Google Scholar] [CrossRef]
- Flotemersch, J.; Aho, K. Factors Influencing Perceptions of Aquatic Ecosystems. Ambio 2021, 50, 425–435. [Google Scholar] [CrossRef] [PubMed]
- Mishra, A.P.; Singh, S.; Shekhar Sarkar, M.; Singh, R.; Chandra, N.; Đurin, B.; Sahu, H.; Fatahalla Mohamed Ahmed, M.; Ghassan Abdo, H. Integrating Community Perceptions, Scientific Data and Geospatial Tools for Sustainable Water Quality Management. Results Eng. 2024, 23, 102563. [Google Scholar] [CrossRef]
- Rangecroft, S.; Dextre, R.M.; Richter, I.; Grados Bueno, C.V.; Kelly, C.; Turin, C.; Fuentealba, B.; Hernandez, M.C.; Morera, S.; Martin, J.; et al. Unravelling and Understanding Local Perceptions of Water Quality in the Santa Basin, Peru. J. Hydrol. 2023, 625, 129949. [Google Scholar] [CrossRef]
- Dalmacija, B.; Kolaković, S.; Klašnja, M.; Ivančev-Tumbas, I.; Benak, J.; Vasiljević, M.; Kulačin, S.; Cinkler, R.; Milosavljević, S.; Repac, S. Strategija Vodosnabdevanja i Zaštite Voda u AP Vojvodina, Official Gazette of AP Vojvodina 1/2010 20096. Available online: https://programrazvoja.vojvodina.gov.rs/wp-content/uploads/2016/02/strategija-vodosnabdevanja-i-zastite-voda-apv.pdf (accessed on 13 March 2025).
- Fatoki, J.O.; Badmus, J.A. Arsenic as an Environmental and Human Health Antagonist: A Review of Its Toxicity and Disease Initiation. J. Hazard. Mater. Adv. 2022, 5, 100052. [Google Scholar] [CrossRef]
- Rahaman, S.; Rahman, M.; Mise, N.; Sikder, T.; Ichihara, G.; Uddin, K.; Kurasaki, M.; Ichihara, S. Environmental Arsenic Exposure and Its Contribution to Human Diseases, Toxicity Mechanism and Management. Environ. Pollut. 2021, 289, 117940. [Google Scholar] [CrossRef]
- Shaji, E.; Santosh, M.; Sarath, K.V.; Prakash, P.; Deepchand, V.; Divya, B.V. Arsenic contamination of groundwater: A global synopsis with focus on the Indian Peninsula. Geosci. Front. 2021, 12, 101079. [Google Scholar] [CrossRef]
- World Health Organization. Guidelines for Drinking-Water Quality: Fourth Edition Incorporating the First and Second Addenda; World Health Organization: Geneva, Switzerland, 2022. [Google Scholar]
- Doria, M.D.F.; Pidgeon, N.; Hunter, P.R. Perceptions of Drinking Water Quality and Risk and Its Effect on Behaviour: A Cross-National Study. Sci. Total Environ. 2009, 407, 5455–5464. [Google Scholar] [CrossRef]
- Bouhlel, Z.; Köpke, J.; Mina, M.; Smakhtin, V. Global Bottled Water Industry: A Review of Impacts and Trends; United Nations University: Hamilton, ON, Canada, 2023. [Google Scholar] [CrossRef]
- Askari, M.; Soleimani, H.; Babakrpur Nalosi, K.; Saeedi, R.; Abolli, S.; Ghani, M.; Abtahi, M.; Alimohammadi, M. Bottled Water Safety Evaluation: A Comprehensive Health Risk Assessment of Oral Exposure to Heavy Metals through Deterministic and Probabilistic Approaches by Monte Carlo Simulation. Food Chem. Toxicol. 2024, 185, 114492. [Google Scholar] [CrossRef]
- Doria, M.F. Bottled Water versus Tap Water: Understanding Consumers’ Preferences. J. Water Health 2006, 4, 271–276. [Google Scholar] [CrossRef] [PubMed]
- Hu, Z.; Morton, L.W.; Mahler, R.L. Bottled Water: United States Consumers and Their Perceptions of Water Quality. Int. J. Environ. Res. Public. Health 2011, 8, 565–578. [Google Scholar] [CrossRef] [PubMed]
- Johnstone, N.; Serret, Y. Determinants of Bottled and Purified Water Consumption: Results Based on an OECD Survey. Water Policy 2012, 14, 668–679. [Google Scholar] [CrossRef]
- Vieux, F.; Maillot, M.; Rehm, C.D.; Barrios, P.; Drewnowski, A. Trends in Tap and Bottled Water Consumption among Children and Adults in the United States: Analyses of NHANES 2011–16 Data. Nutr. J. 2020, 19, 10. [Google Scholar] [CrossRef] [PubMed]
- Brei, V.; Tadajewski, M. Crafting the Market for Bottled Water: A Social Praxeology Approach. Eur. J. Mark. 2015, 49, 327–349. [Google Scholar] [CrossRef]
- Jakus, P.M.; Shaw, W.D.; Nguyen, T.N.; Walker, M. Risk Perceptions of Arsenic in Tap Water and Consumption of Bottled Water. Water Resour. Res. 2009, 45, W05405. [Google Scholar] [CrossRef]
- Jordan, M.M. Where Does Arsenic Exposure Come From—And Why Does It Matter? APHL Blog: Silver Spring, MD, USA, 2022; Available online: https://www.aphlblog.org/arsenic-exposure/ (accessed on 8 May 2025).
- Sajjadi, S.A.; Alipour, V.; Matlabi, M.; Biglari, H. Consumer Perception and Preference of Drinking Water Sources. Electron. Physician 2016, 8, 3228–3233. [Google Scholar] [CrossRef]
- Ružičić, S.; Puljiko, M.; Brenko, T. Spatial and Statistical Analyses of Parameters Influencing Arsenic Distribution in the Lowland Drava River Area, Northeastern Croatia. Environ. Earth Sci. 2023, 82, 403. [Google Scholar] [CrossRef]
- Agbaba, J.; Watson, M.; Kragulj Isakovski, M.; Stankov, U.; Dalmacija, B.; Tubić, A. Water Supply Systems for Settlements with Arsenic-Contaminated Groundwater—Making the Right Choice. Appl. Sci. 2023, 13, 9557. [Google Scholar] [CrossRef]
- Jovanovic, D.; Jakovljević, B.; Rašić-Milutinović, Z.; Paunović, K.; Peković, G.; Knezević, T. Arsenic Occurrence in Drinking Water Supply Systems in Ten Municipalities in Vojvodina Region, Serbia. Environ. Res. 2011, 111, 315–318. [Google Scholar] [CrossRef]
- Stanisavljev, B.; Bulat, Z.; Buha, A.; Matović, V. Arsenic in Drinking Water in Northern Region of Serbia. E3S Web Conf. 2013, 1, 24006. [Google Scholar] [CrossRef]
- Vesković, J.; Bulatović, S.; Ražić, S.; Lučić, M.; Miletić, A.; Nastasović, A.; Onjia, A. Arsenic-Contaminated Groundwater of the Western Banat (Pannonian Basin): Hydrogeochemical Appraisal, Pollution Source Apportionment, and Monte Carlo Simulation of Source-Specific Health Risks. Water Environ. Res. 2024, 96, e11087. [Google Scholar] [CrossRef] [PubMed]
- Tubić, A.; Agbaba, J.; Dalmacija, B.; Ivančev-Tumbas, I.; Dalmacija, M. Removal of Arsenic and Natural Organic Matter from Groundwater Using Ferric and Alum Salts: A Case Study of Central Banat Region (Serbia). J. Environ. Sci. Health Part A 2010, 45, 363–369. [Google Scholar] [CrossRef]
- Statistical Office of the Republic of Serbia. Census of Population, Households and Dwellings in the Republic of Serbia 2022. Available online: https://popis2022.stat.gov.rs/en-US/ (accessed on 14 January 2025).
- Institute of Public Health of Serbia. Public Health Suitability of Drinking Water at Public Waterworks in Serbia, 2022; Institute of Public Health of Serbia: Belgrade, Serbia, 2023. [Google Scholar]
- Institute of Public Health of Serbia. Health Statistical Yearbook of the Republic of Serbia 2022; Institute of Public Health of Serbia: Belgrade, Serbia, 2023. [Google Scholar]
- Matijašević, I.; Bijelović, S.; Bobić, S.; Živadinović, E.; Lazović, M. Ammonium, nitrate and nitrite concentrations in drinking water of the South Bačka district of Vojvodina. Facta Univ. Ser. Med. Biol. 2024, 25, 47–54. [Google Scholar] [CrossRef]
- Devic, G.; Pergal, M.; Pergal, M. Ecological and Health Risk Assessment of Nitrates and Heavy Metals in the Groundwater of the Alluvial Area of the Danube River near Kostolac Basin, Serbia. Water 2024, 16, 1839. [Google Scholar] [CrossRef]
- Čelić, M.; Škrbić, B.D.; Insa, S.; Živančev, J.; Gros, M.; Petrović, M. Occurrence and Assessment of Environmental Risks of Endocrine Disrupting Compounds in Drinking, Surface and Wastewaters in Serbia. Environ. Pollut. 2020, 262, 114344. [Google Scholar] [CrossRef] [PubMed]
- Eurostat. Population Structure and Ageing. Available online: https://ec.europa.eu/eurostat/statistics-explained/index.php?title=Population_structure_and_ageing (accessed on 8 April 2025).
- Krčmar, D.; Dubovina, M.; Grba, N.; Pešić, V.; Watson, M.; Tričković, J.; Dalmacija, B. Distribution of Organic and Inorganic Substances in the Sediments of the “Great Bačka Canal”, a European Environmental Hotspot. Sci. Total Environ. 2017, 601–602, 833–844. [Google Scholar] [CrossRef]
- Košić, K.; Pivac, T.; Romelić, J.; Lazić, L.; Stojanović, V. Characteristics of Thermal–Mineral Waters in Backa Region (Vojvodina) and Their Exploitation in Spa Tourism. Renew. Sustain. Energy Rev. 2011, 15, 801–807. [Google Scholar] [CrossRef]
- Brouwer, S.; Hofman-Caris, R.; Van Aalderen, N. Trust in Drinking Water Quality: Understanding the Role of Risk Perception and Transparency. Water 2020, 12, 2608. [Google Scholar] [CrossRef]
- Statistical Office of the Republic of Serbia. Household Income in Money and in Kind, by Statistical Territorial Units. Available online: https://data.stat.gov.rs/Home/Result/01010101?languageCode=en-US (accessed on 8 April 2025).
- Eurostat. Gross Domestic Product (GDP) and Main Components Per Capita. Available online: https://ec.europa.eu/eurostat/databrowser/view/nama_10_pc__custom_16275672/default/table?lang=en (accessed on 13 April 2025).
- Statistical Office of the Republic of Serbia. Prihodi u Novcu i u Naturi i Lična Potrošnja Domaćinstava. 2024. Available online: https://publikacije.stat.gov.rs/G2025/HtmlL/G20251096.html (accessed on 8 April 2025).
- Nayanathara Thathsarani Pilapitiya, P.G.C.; Ratnayake, A.S. The World of Plastic Waste: A Review. Clean. Mater. 2024, 11, 100220. [Google Scholar] [CrossRef]
- Rafiq, A.; Xu, J.-L. Microplastics in Waste Management Systems: A Review of Analytical Methods, Challenges and Prospects. Waste Manag. 2023, 171, 54–70. [Google Scholar] [CrossRef] [PubMed]
- World Bank. Municipal Waste Management in Serbia—Situational Analysis. 2024. Available online: https://thedocs.worldbank.org/en/doc/8c0c355b685476cdcc2154a3ecf42768-0080012024/original/Situational-Analysis-Municipal-Waste-Management-in-Serbia.pdf (accessed on 8 April 2025).

| Question | Novi Sad (n = 135) | Rest of Vojvodina (n = 144) | |||||||
|---|---|---|---|---|---|---|---|---|---|
| Mean | SD | Min | Max | Mean | SD | Min | Max | ||
| Q1 | How old are you? | 43.26 | 11.05 | 26.00 | 86.00 | 43.80 | 12.50 | 10.00 | 75.00 |
| Q2 | How many members are there in your household? | 3.03 | 2.80 | 1.00 | 33.00 | 3.43 | 1.10 | 1.00 | 8.00 |
| Q3 | Do you drink the tap water? (+1: Y, −1: N) | 0.53 | 0.85 | −1.00 | 1.00 | −0.06 | 1.00 | −1.00 | 1.00 |
| Q4 | How would you rate the tap water quality (from 1: very bad, to 5: excellent) | 3.22 | 0.95 | 1.00 | 5.00 | 2.21 | 1.24 | 1.00 | 5.00 |
| I use tap water for (+1: Y, −1: N) | |||||||||
| Q5 | drinking | 0.44 | 0.90 | −1.00 | 1.00 | −0.14 | 0.99 | −1.00 | 1.00 |
| Q6 | cooking | 0.97 | 0.23 | −1.00 | 1.00 | 0.48 | 0.88 | −1.00 | 1.00 |
| Q7 | cleaning and household maintenance | 0.99 | 0.17 | −1.00 | 1.00 | 0.94 | 0.34 | −1.00 | 1.00 |
| Q8 | personal hygiene | 0.99 | 0.17 | −1.00 | 1.00 | 0.91 | 0.42 | −1.00 | 1.00 |
| Q9 | recreational purposes (filling pools) | −0.81 | 0.59 | −1.00 | 1.00 | −0.52 | 0.86 | −1.00 | 1.00 |
| Q10 | watering the garden (irrigation) | −0.62 | 0.79 | −1.00 | 1.00 | −0.11 | 1.00 | −1.00 | 1.00 |
| Q11 | other (e.g., washing cars) | −0.63 | 0.78 | −1.00 | 1.00 | −0.23 | 0.98 | −1.00 | 1.00 |
| Are these the reasons you do not drink the tap water (+1: Y, −1: N) | |||||||||
| Q12 | water colour | −0.96 | 0.28 | −1.00 | 1.00 | −0.44 | 0.90 | −1.00 | 1.00 |
| Q13 | water taste | −0.60 | 0.80 | −1.00 | 1.00 | −0.27 | 0.97 | −1.00 | 1.00 |
| Q14 | water odour | −0.74 | 0.68 | −1.00 | 1.00 | −0.36 | 0.94 | −1.00 | 1.00 |
| Q15 | microbiological contamination | −0.90 | 0.43 | −1.00 | 1.00 | −0.52 | 0.86 | −1.00 | 1.00 |
| Q16 | presence of chemical substances | −0.78 | 0.63 | −1.00 | 1.00 | −0.17 | 0.99 | −1.00 | 1.00 |
| Q17 | other | −0.88 | 0.48 | −1.00 | 1.00 | −0.67 | 0.75 | −1.00 | 1.00 |
| Q18 | Are you familiar with the issue of arsenic in drinking water in your region? (+1: Y, −1: N) | 0.03 | 0.68 | −1.00 | 1.00 | 0.25 | 0.72 | −1.00 | 1.00 |
| Q19 | Is there an issue with arsenic in the drinking water where you live? (+1: Y, −1: N) | −0.46 | 0.55 | −1.00 | 1.00 | 0.11 | 0.94 | −1.00 | 1.00 |
| Q20 | Are you aware of the effects of arsenic on human health? (+1: Y, −1: N) | 0.14 | 0.63 | −1.00 | 1.00 | 0.21 | 0.74 | −1.00 | 1.00 |
| Q21 | Is the presence of arsenic in drinking water one of the reasons why you do not drink tap water? (+1: Y, −1: N) | −0.22 | 0.57 | −1.00 | 1.00 | 0.32 | 0.71 | −1.00 | 1.00 |
| Q22 | What quantity of bottled water do you purchase weekly? (1: <5 L, 2: 5–15 L, 3: >15 L) | 1.33 | 0.80 | 0.00 | 3.00 | 1.78 | 0.88 | 0.00 | 3.00 |
| Q23 | Do you have a water purification device? (+1: Y, −1: N) | −0.77 | 0.64 | −1.00 | 1.00 | −0.82 | 0.58 | −1.00 | 1.00 |
| PC 1 | PC 2 | PC 3 | PC 4 | |
|---|---|---|---|---|
| Eigenvalue | 6.54 | 1.42 | 0.790 | 0.686 |
| % variance | 54.8 | 11.9 | 6.62 | 5.74 |
| Loadings | ||||
| Q3 | −0.345 | 0.0665 | 0.229 | 0.140 |
| Q4 | −0.306 | 0.0742 | 0.182 | 0.118 |
| Q5 | −0.342 | 0.0843 | 0.244 | 0.210 |
| Q6 | −0.223 | 0.223 | −0.440 | 0.727 |
| Q12 | 0.277 | 0.472 | 0.0513 | 0.0996 |
| Q13 | 0.288 | 0.482 | −0.0455 | −0.0468 |
| Q14 | 0.295 | 0.458 | 0.226 | −0.0606 |
| Q15 | 0.250 | −0.0769 | 0.593 | 0.498 |
| Q16 | 0.314 | −0.338 | 0.102 | 0.204 |
| Q19 | 0.268 | −0.241 | 0.0528 | 0.182 |
| Q21 | 0.268 | −0.298 | −0.0487 | 0.115 |
| Q22 | 0.264 | −0.0432 | −0.488 | 0.203 |
Disclaimer/Publisher’s Note: The statements, opinions and data contained in all publications are solely those of the individual author(s) and contributor(s) and not of MDPI and/or the editor(s). MDPI and/or the editor(s) disclaim responsibility for any injury to people or property resulting from any ideas, methods, instructions or products referred to in the content. |
© 2025 by the authors. Licensee MDPI, Basel, Switzerland. This article is an open access article distributed under the terms and conditions of the Creative Commons Attribution (CC BY) license (https://creativecommons.org/licenses/by/4.0/).
Share and Cite
Watson, M.; Nikić, J.; Pešić Bajić, J.; Vujić, M.; Apostolović, T.; Atanasijević, J.; Agbaba, J. Public Perception of Drinking Water Quality in an Arsenic-Affected Region: Implications for Sustainable Water Management. Water 2025, 17, 1613. https://doi.org/10.3390/w17111613
Watson M, Nikić J, Pešić Bajić J, Vujić M, Apostolović T, Atanasijević J, Agbaba J. Public Perception of Drinking Water Quality in an Arsenic-Affected Region: Implications for Sustainable Water Management. Water. 2025; 17(11):1613. https://doi.org/10.3390/w17111613
Chicago/Turabian StyleWatson, Malcolm, Jasmina Nikić, Jovana Pešić Bajić, Maja Vujić, Tamara Apostolović, Jasna Atanasijević, and Jasmina Agbaba. 2025. "Public Perception of Drinking Water Quality in an Arsenic-Affected Region: Implications for Sustainable Water Management" Water 17, no. 11: 1613. https://doi.org/10.3390/w17111613
APA StyleWatson, M., Nikić, J., Pešić Bajić, J., Vujić, M., Apostolović, T., Atanasijević, J., & Agbaba, J. (2025). Public Perception of Drinking Water Quality in an Arsenic-Affected Region: Implications for Sustainable Water Management. Water, 17(11), 1613. https://doi.org/10.3390/w17111613