Article

Engaging Rural High School Students in a Watershed Literacy Program

1
Department of Civil and Environmental Engineering, Tennessee Tech University, 1020 Stadium Drive, Cookeville, TN 38505, USA
2
Department of Curriculum and Instruction, Tennessee Tech University, Box 5042, Cookeville, TN 38505, USA
*
Author to whom correspondence should be addressed.
Water 2025, 17(11), 1588; https://doi.org/10.3390/w17111588 (registering DOI)
Submission received: 25 March 2025 / Revised: 16 May 2025 / Accepted: 20 May 2025 / Published: 24 May 2025
(This article belongs to the Section Water Resources Management, Policy and Governance)

Abstract

:
Place-based learning is an educational approach that centers around the concept of place. Intersecting watershed literacy with place-based education methods, this study explores a short-term place-based watershed outreach program in a rural high school in Tennessee, United States. As the community’s first known watershed outreach program, this pilot study aimed to improve the watershed literacy of its student participants by engaging them in the locally relevant and shared phenomenon of flooding. Overall, five units were developed, with each providing a unique interactive lecture and activity. The program’s short-term effectiveness in improving watershed literacy was evaluated anonymously through pre- and post-program assessments, as well as pre- and post-unit assessments. Ultimately, the program resulted in moderate short-term improvements in student watershed literacy, as measured by pre- and post-program surveys. The program content assessments resulted in an average percent change in watershed literacy of +34%. A Likert scale survey indicated that the students perceived an increase in watershed connectedness and confidence, but a decreased willingness to address watershed stormwater and flooding issues. Additional assessments are required to evaluate the long-term impacts of this outreach.

1. Introduction

Globally, the United Nations (UN) has acknowledged the key role that environmental education can play in building resilient communities. In the UN 2030 Agenda for Sustainable Development, a stated goal is to ensure that, by 2030, “all learners acquire the knowledge and skills needed to promote sustainable development” [1], much of which can come from environmental education. Among the environmental education methods, place-based learning is unique in its ability to “leverage the power of place to personalize learning” [2]. According to the Rural School and Community Trust, place-based education applications in rural settings have provided “enhanced student learning, increased civic knowledge and competence among students, and greater community understanding and support of public education” [3].
Watershed management presents an opportunity for both place- and problem-based learning for youth to enhance connectedness to their local environment or watershed [4]. This is particularly valuable when the local watershed may be experiencing challenges such as flooding, aging infrastructure, or contamination threatening public and environmental health. Establishing the local watershed as the focus of learning, place-based environmental education also enables students to explore scientific and engineering concepts through a local lens. In the kindergarten through 12th grade (K-12) setting, a watershed approach to place-based education has been documented as an effective way to encourage students to better understand their local watershed [4,5], to improve the management of non-point source pollutants [6], and to assist in meeting both state and national educational standards in the United States [4]. However, few studies have specifically employed watershed education and outreach programs with the explicit aim of enhancing participants’ watershed literacy.
Watershed literacy extends beyond being able to define the concept “watershed” [7]. A watershed-literate individual should also be able to identify one’s local watershed, understand watershed functions and connections, identify sources of pollution, and be aware of watershed management and protection strategies [7]. As part of collaborative watershed management, citizen watershed literacy can play an important role in community decision-making. As documented by [8], “an educated and aware public is more likely to make informed decisions as to where to live, as well as support local mitigation activities that can reduce future negative impacts” [8]. Furthermore, [6] notes the potential of K-12 watershed education measures as a key watershed management strategy. However, there is a limited body of research that utilize place-based approaches to watershed education in rural school settings. This study presents a pilot watershed literacy program conducted in a rural high school, located in Tennessee in the United States, as part of a community–university watershed partnership program. The rural community experiences frequent flooding and stormwater management challenges, highlighting the need for sustainable watershed management. This presented an opportunity to engage with the local high school, allowing students to explore place-based watershed issues and potential solutions through education and outreach. Although implemented in the United States, the structure of the program and its instructional units can be adapted for use in any high school science curriculum.

2. Methodology

2.1. Institutional Review Board Application

Prior to beginning the outreach program, an Institutional Review Board application was initiated to ensure all necessary steps are taken to protect the student participants. As part of this application, it was decided to record all student responses and work anonymously to protect student privacy. Because of this anonymity, all student surveys were compared collectively, rather than individually. This study received approval from the university Institutional Review Board during September 2021.

2.2. Participant Selection

Students were selected to participate in this program based on their enrollment in the STEM III course at a high school in a rural and economically at-risk county in Middle Tennessee, United States. The program occurred during school hours, as previous attempts at outreach revealed that many of the students are engaged in after school activities, such as sports or employment. Additionally, placing the program in the school setting eliminated the need for student travel, and thus assisted in protecting student safety and promoting accessibility. The STEM III class occurred during a 90 min block period, which allowed for sufficient time to complete the program interactive lectures and activities.

2.3. Program Outline

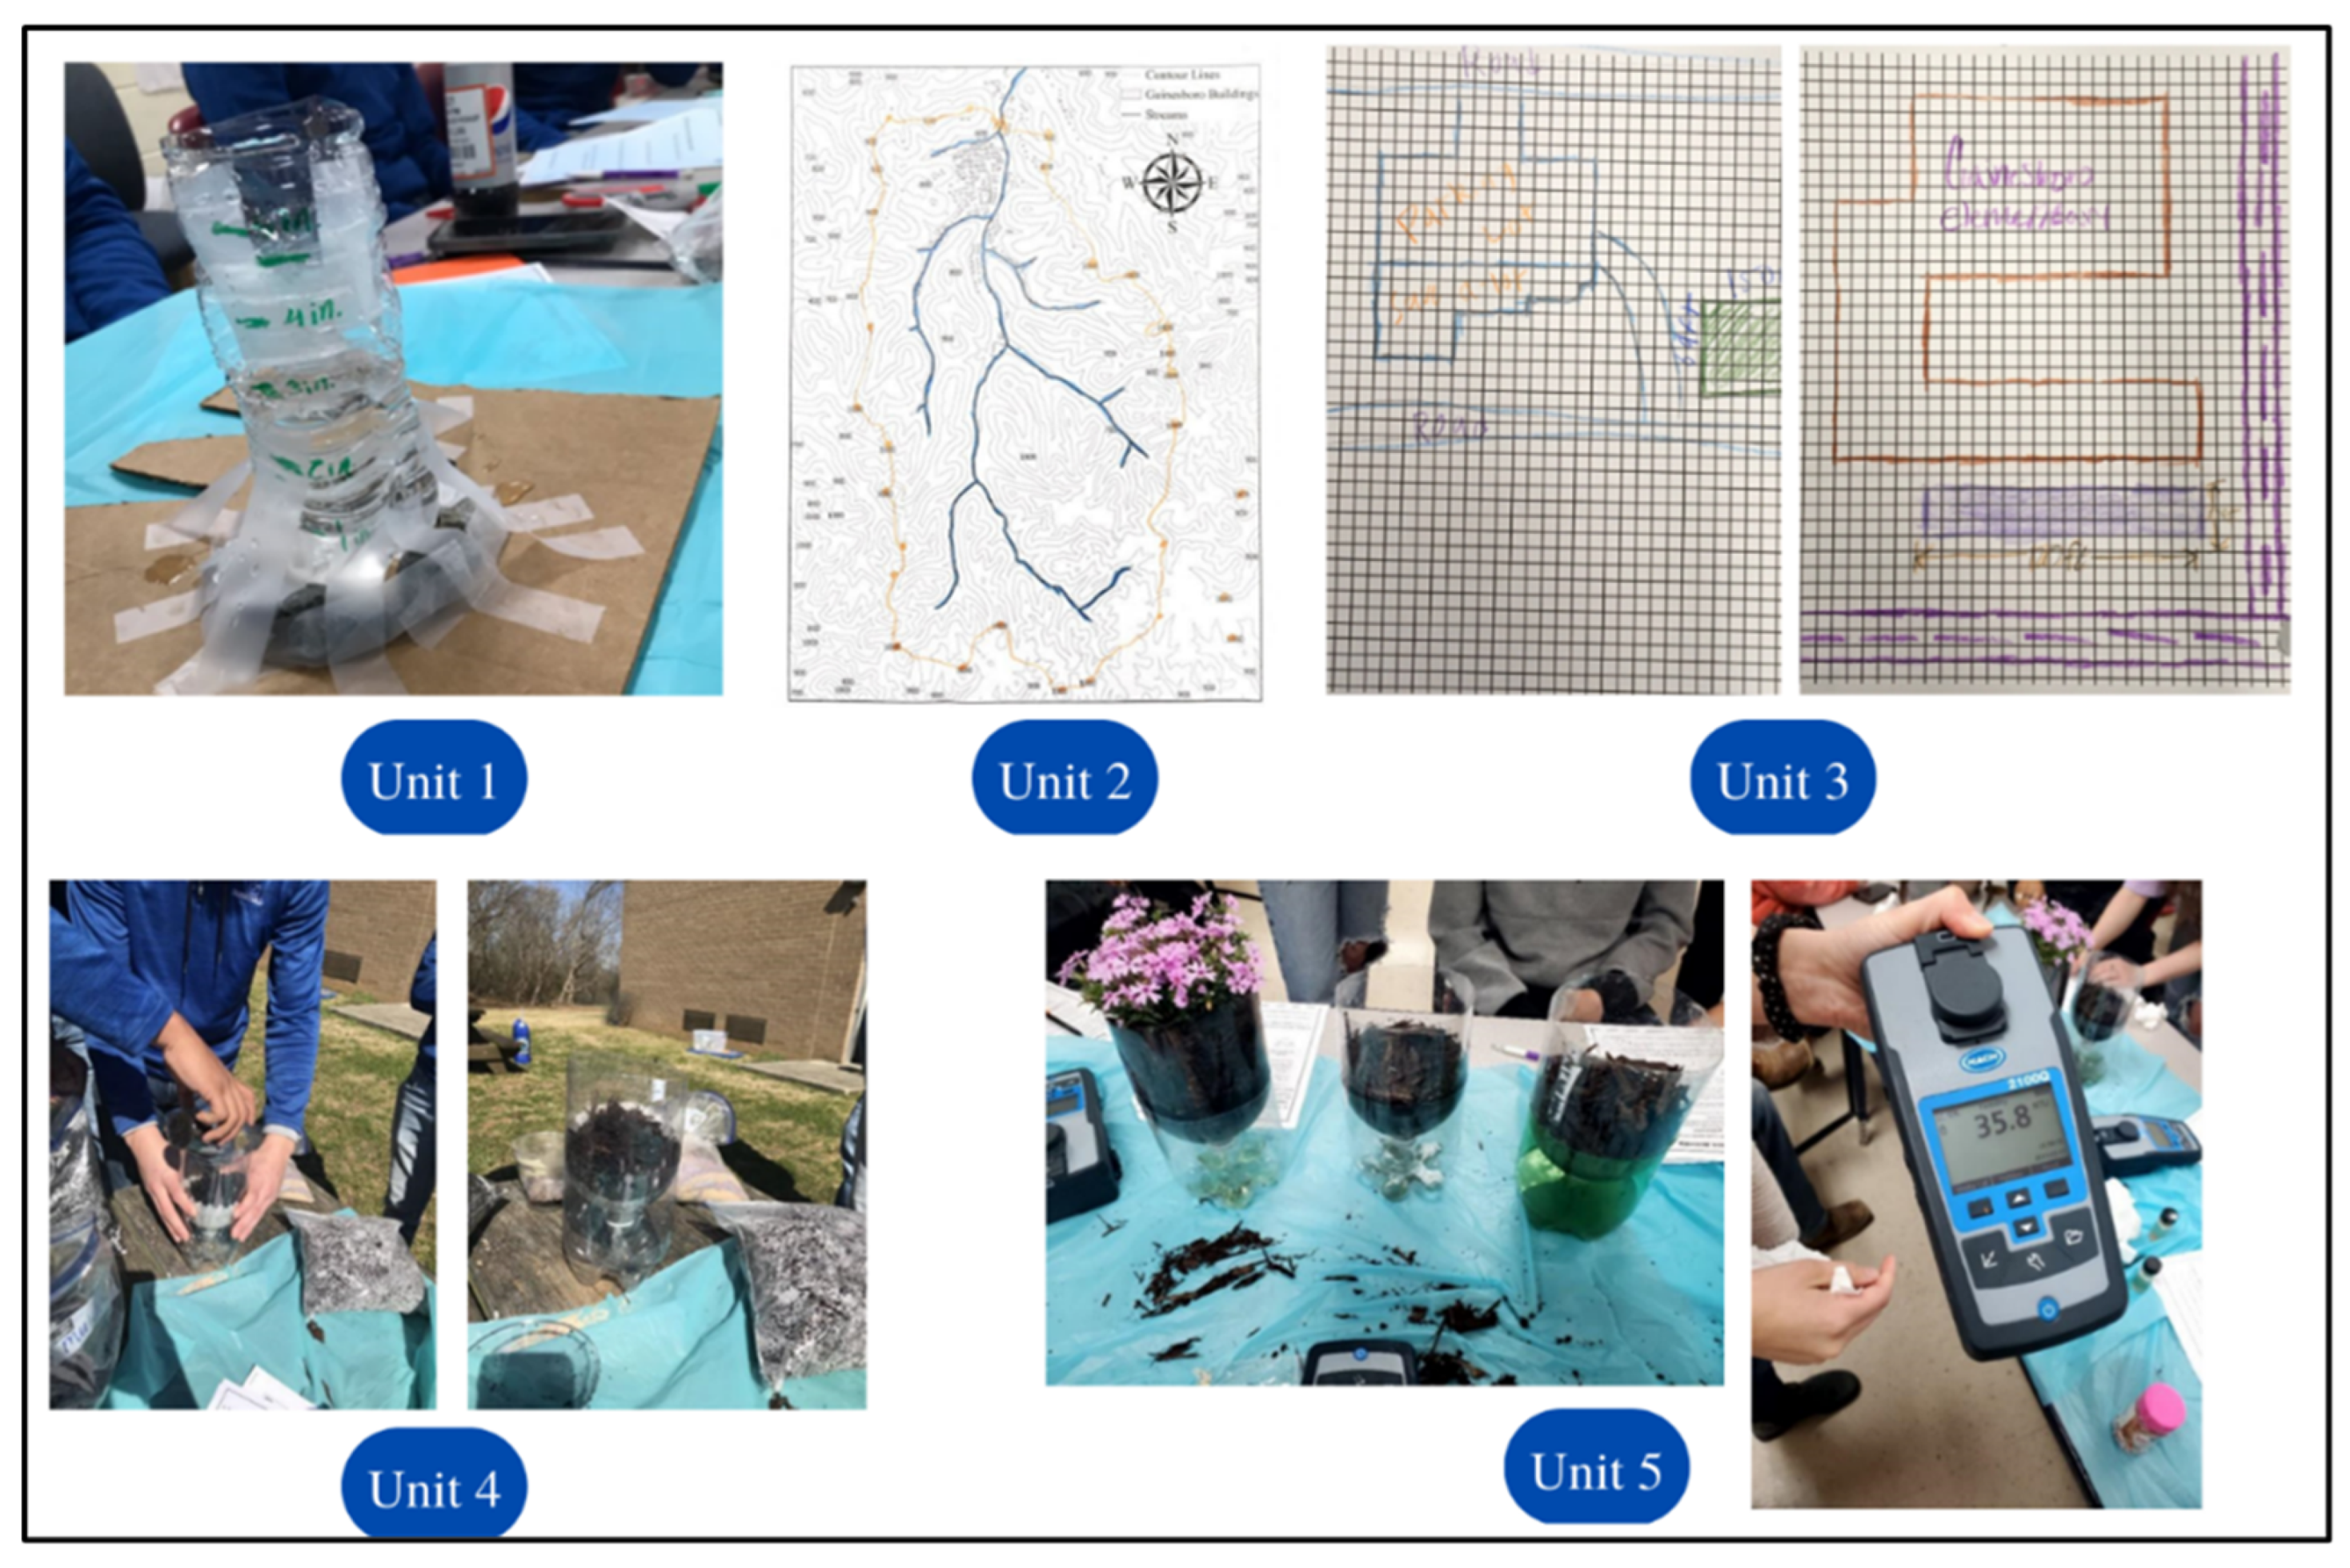
Once the Institutional Review Board application was approved, a short-term outreach approach began during the Spring 2022 semester. Intersecting place-based education with watershed literacy, five interactive lectures and related activities were developed as outlined in Table 1 and Figure 1 below. Lectures were delivered over a five-week period, with one lecture conducted each week. Flooding within the watershed was used as the local phenomenon central to the learning objectives for the lectures. This decision was influenced by the fact that the community where the high school is located frequently experienced flooding, disrupting public infrastructure and affecting residential properties. Each unit was structured to allow for 15 min interactive lectures, where interactive lecturing is defined as “the process of combining engaging presentations with carefully selected active learning methods to achieve intended learning goals” [9]. During the interactive lectures, the university activity leaders would lead a discussion on the unit’s topic, using questioning as the active learning method. The high school students were also provided with partially completed notes to fill in during the lectures, similar to the note-taking methods proposed by [10]. After each lecture, the student participants were divided into small groups (2–3 students) to engage in a lecture-specific phenomenon related to the topic. Each small group was then mentored by a civil engineering university student, who functioned as the activity leader. Once completed, the small groups then presented their findings and explored the “why” behind the activity.

2.4. Surveys

The effectiveness of the program was evaluated through pre- and post- assessments. Watershed literacy was measured both before and after the program in a program content assessment (22 questions), as well as before and after each individual unit through a unit content assessment (3–5 questions). Both the unit and program assessments asked the students to answer content-specific questions in a short-answer format. Once completed, student responses were scored as incorrect (0), partially correct (0.5), or correct (1), and then an average was taken for each question to represent the students’ collective watershed literacy. Additionally, a 6-point Likert scale survey was administered to the 8 student participants both before the program and after the program to assess the students’ perceived change in watershed literacy. The response options were strongly agree (1), agree (2), somewhat agree (3), somewhat disagree (4), disagree (5), and strongly disagree (6). Once completed, survey questions were categorized as: student watershed connectedness, student confidence, and student willingness in addressing stormwater issues. All surveys were administered individually, were untimed, and completed manually by the students.

3. Results and Discussion

All hands-on activities related to the five units were completed under the supervision of the university activity leaders and the students’ teacher. Furthermore, all lessons and activities took place inside the high school classroom which eliminated the need for the students to travel.

3.1. Introduction to Engineering Hydrology

The first unit introduced the students to engineering hydrology. A brief interactive lecture was given to define hydrology, the hydrologic cycle, engineering hydrology, and the water budget equation. After the lesson, students were encouraged to further explore the concept of a rain gage, an example of engineering hydrology, by participating in a hands-on activity adapted from the National Aeronautics and Space Administration’s Global Precipitation Measurement Mission [11]. The activity introduced the students to the engineering design process and encouraged them to create an engineering design problem: how can we build a device that measures rain? Students were instructed to consider durability in their designs. After completing their designs, students shared their work with the class and answered related discussion questions.

3.2. What Is a Watershed?

The second unit focused on exploring the phenomenon of a watershed. According to the United States Environmental Protection Agency, watershed-based planning has been encouraged for many years due to its comprehensive assessment of water quality and quantity problems, as well as its prioritization of protection and restoration measures [12]. Therefore, the university students began with an interactive lecture focused on defining the concept of a watershed, understanding watershed characteristics, identifying the local watershed, and delineating a watershed. For the activity, students manually delineated their local watershed using provided topographic maps.

3.3. Rain and Drainage

The third lesson and activity explored rain and drainage within a watershed. The lesson defined precipitation, pervious/impervious spaces, rainfall intensity, rainfall duration, rainfall depth, and rainfall frequency. Following the lesson, the students applied the engineering design process previously covered in the program to design a rain garden for two locations in their watershed, which documented stormwater issues. This activity was developed using guidance from the North Carolina Stormwater Best Management Practices Manual and the Iowa Rain Garden Design and Installation Manual [13].
To accomplish this, students conducted background research on their site, using Google Earth to identify potential green and pervious spaces to install the rain gardens. Design requirements are provided by the activity leaders (the garden must be at least 10 feet downhill or away from any structural foundation, should be in a low spot where water can easily move to it, and should not be located on a steep incline). The students then sketched their gardens, and used the “Measure” tool in Google Earth to measure the impervious area adjacent to the green space. The students estimated the runoff volume using the measured area and a provided water depth. Once the runoff volume was estimated, students calculated their approximate rain garden sizes. Finally, students sketched their design with estimated dimensions, and presented their findings to the class.

3.4. Soils and Infiltration

The fourth lesson explored soil and infiltration. The lesson further explored rain gardens by defining low-impact development and bioretention, and highlighting the importance of soils in hydrology. Following the lesson, the fourth activity was adapted from the “Does Media Matter? Infiltration Rates and Storage Capacity” activity developed by the University of South Florida’s Water Awareness Research and Education Research Experience for Teachers [14]. For this activity, students were given the opportunity to work with three different media types (mulch, topsoil, and sand) to better understand the drainage properties (field capacity and infiltration rate) of each soil type. The students were divided into three small groups, and each group tested the media’s field capacity and infiltration rate. Once the three groups were more familiar with their media types, each group shared their findings with the class. In their discussions, the students concluded that the mulch had the highest infiltration rate. The activity leaders then instructed the students that a common ratio for rain garden soil mix is 2:2:1 sand, topsoil, and mulch, respectively. The students came together as a class to test the infiltration of this 2:2:1 mixture of sand, topsoil, and mulch.

3.5. Plants and Filtration

For the final lesson, the students explore stormwater runoff pollution, filtration, and the role that rain gardens can play in protecting water quality. For the activity, students began by polluting a sample of “stormwater.” The students used simple, affordable ingredients in the activity: tajin represented sediment and organic matter, sprinkles represented microplastics, and quinoa represented animal waste. Once the students made their sample of polluted stormwater, the students were presented with three samples of potential rain garden soil mixtures. Sample 1 contained only mulch, Sample 2 contains the rain garden mix the students used in the previous activity (2:2:1 sand, topsoil, and mulch), and Sample 3 contained the rain garden mix as in Sample 2, but also includes a plant (Phlox stolonifera). As a class, the students hypothesized that Sample 3, which contained the rain garden mix and plant, would filter the water the best. To test the students’ hypothesis, the activity leaders introduced turbidimeters and the concept of turbidity. The students then used the turbidimeter to measure the turbidity of the polluted water prior to filtering it through any of our samples. Then, the students filter the stormwater through each of the samples and wait 3–5 min for water to pass through. After 3–5 min, the students retest the filtered sample’s turbidity. As hypothesized, filtering the polluted stormwater through Sample 3 resulted in the greatest reduction in turbidity.

3.6. Immediate Watershed Literacy Changes

Following the interactive lectures, the immediate changes in watershed literacy are shown in Table 2, Table 3, Table 4, Table 5 and Table 6 for the various units. It should be noted that two students were absent during the Unit 3 interactive lecture, and activity on rain and drainage (pre-n = 7, post-n = 6). In Unit 4, four students were absent, and two students who did not attend the interactive lecture completed the post-content assessment (pre-n = 5, post-n = 6). Ultimately, the small number of student survey participants (n = 5 to n = 9) was a limitation of this study. The limited number of student participants may not reflect the overall opinions or abilities of the local youth, and the lack of a control group to which the survey results could be compared may introduce selection bias.
Due to the limited sample size of participants, descriptive statistics were used to evaluate the effectiveness of this short-term outreach. Overall, the students answered the assessment questions more accurately after participating in both the interactive lecture and activity. The average percent change in watershed literacy was found to be +22%, +57%, +13%, +20%, and +8% for units 1–5, respectively. Students experienced the greatest positive change in watershed literacy during Unit 2, with Q7 resulting in the greatest positive change (88%) of any of the questions of the five-unit content assessments. Unit 2 introduced students to the concept of a watershed through exploring characteristics of their local watershed. Through engaging with this place-based lesson, students were able to utilize their existing knowledge of their community and its flooding problems to better engage with the material.
For questions Q15 and Q18, the students showed no change in their ability to accurately answer the questions. In the case of Q18, the students were correctly able to identify sources of pollution in water prior to the unit, and therefore experienced no change in their responses. In question Q15, the students collectively maintained a 50% understanding of the concept of a rain garden both before and after the unit. Questions Q2, Q10, Q16, and Q20 revealed a decrease in watershed literacy after participation, suggesting that these questions should be further inspected to ensure that the questions are clear to the students. Additionally, the units should be reassessed to ensure the topics from these questions are sufficiently addressed. Incorporating a section of the surveys to allow students to express their difficulty in understanding the questions may help to ensure field validity of the survey materials [15]. As a pilot program, these questions may provide insights into ways that the program and its surveys may be improved.

3.7. Overall Changes in Watershed Literacy

As shown in Table 7, participating in the overall program resulted in a positive change in watershed literacy. The average percent change in watershed literacy was found to be +34%. Out of the 22 questions total, one question did not result in a positive change was Q10 (−25%). During this unit, two students were absent, and therefore did not participate in the interactive lecture or activity, which may have impacted their ability to correctly answer the question. For the remaining 21 questions, all students were able to answer the watershed questions more accurately after program participation. Question Q3 resulted in the overall highest positive change (+56%), while questions Q9 and Q14 resulted in the lowest positive change (+6%).

3.8. Student Perceived Change in Watershed Literacy

Lastly, the students reported their perceived watershed literacy using a Likert scale survey both before and after the program (1 = strongly agree, 6 = strongly disagree), as shown below in Table 8. The 10 questions were then organized into three categories: watershed connectedness, student confidence, and student willingness.
Overall, the students showed an improved attitude toward their watershed for 8 of the 10 questions, which is similar to the findings of a watershed outreach attitude study by [16], which showed a “weak trend towards desirable attitude shifts”. Similarly to [16], the objective of this study was not to change student attitudes toward their watershed, but to improve watershed literacy. However, through the process of improving their understanding of a local watershed, the students reported an increased connectedness to their watershed and confidence in addressing stormwater management and flooding issues. These outcomes are shown in Table 8. As members of a community facing watershed management challenges, this outcome was encouraging, as it demonstrated that students were able to better understand local watershed issues and were empowered to take informed action.
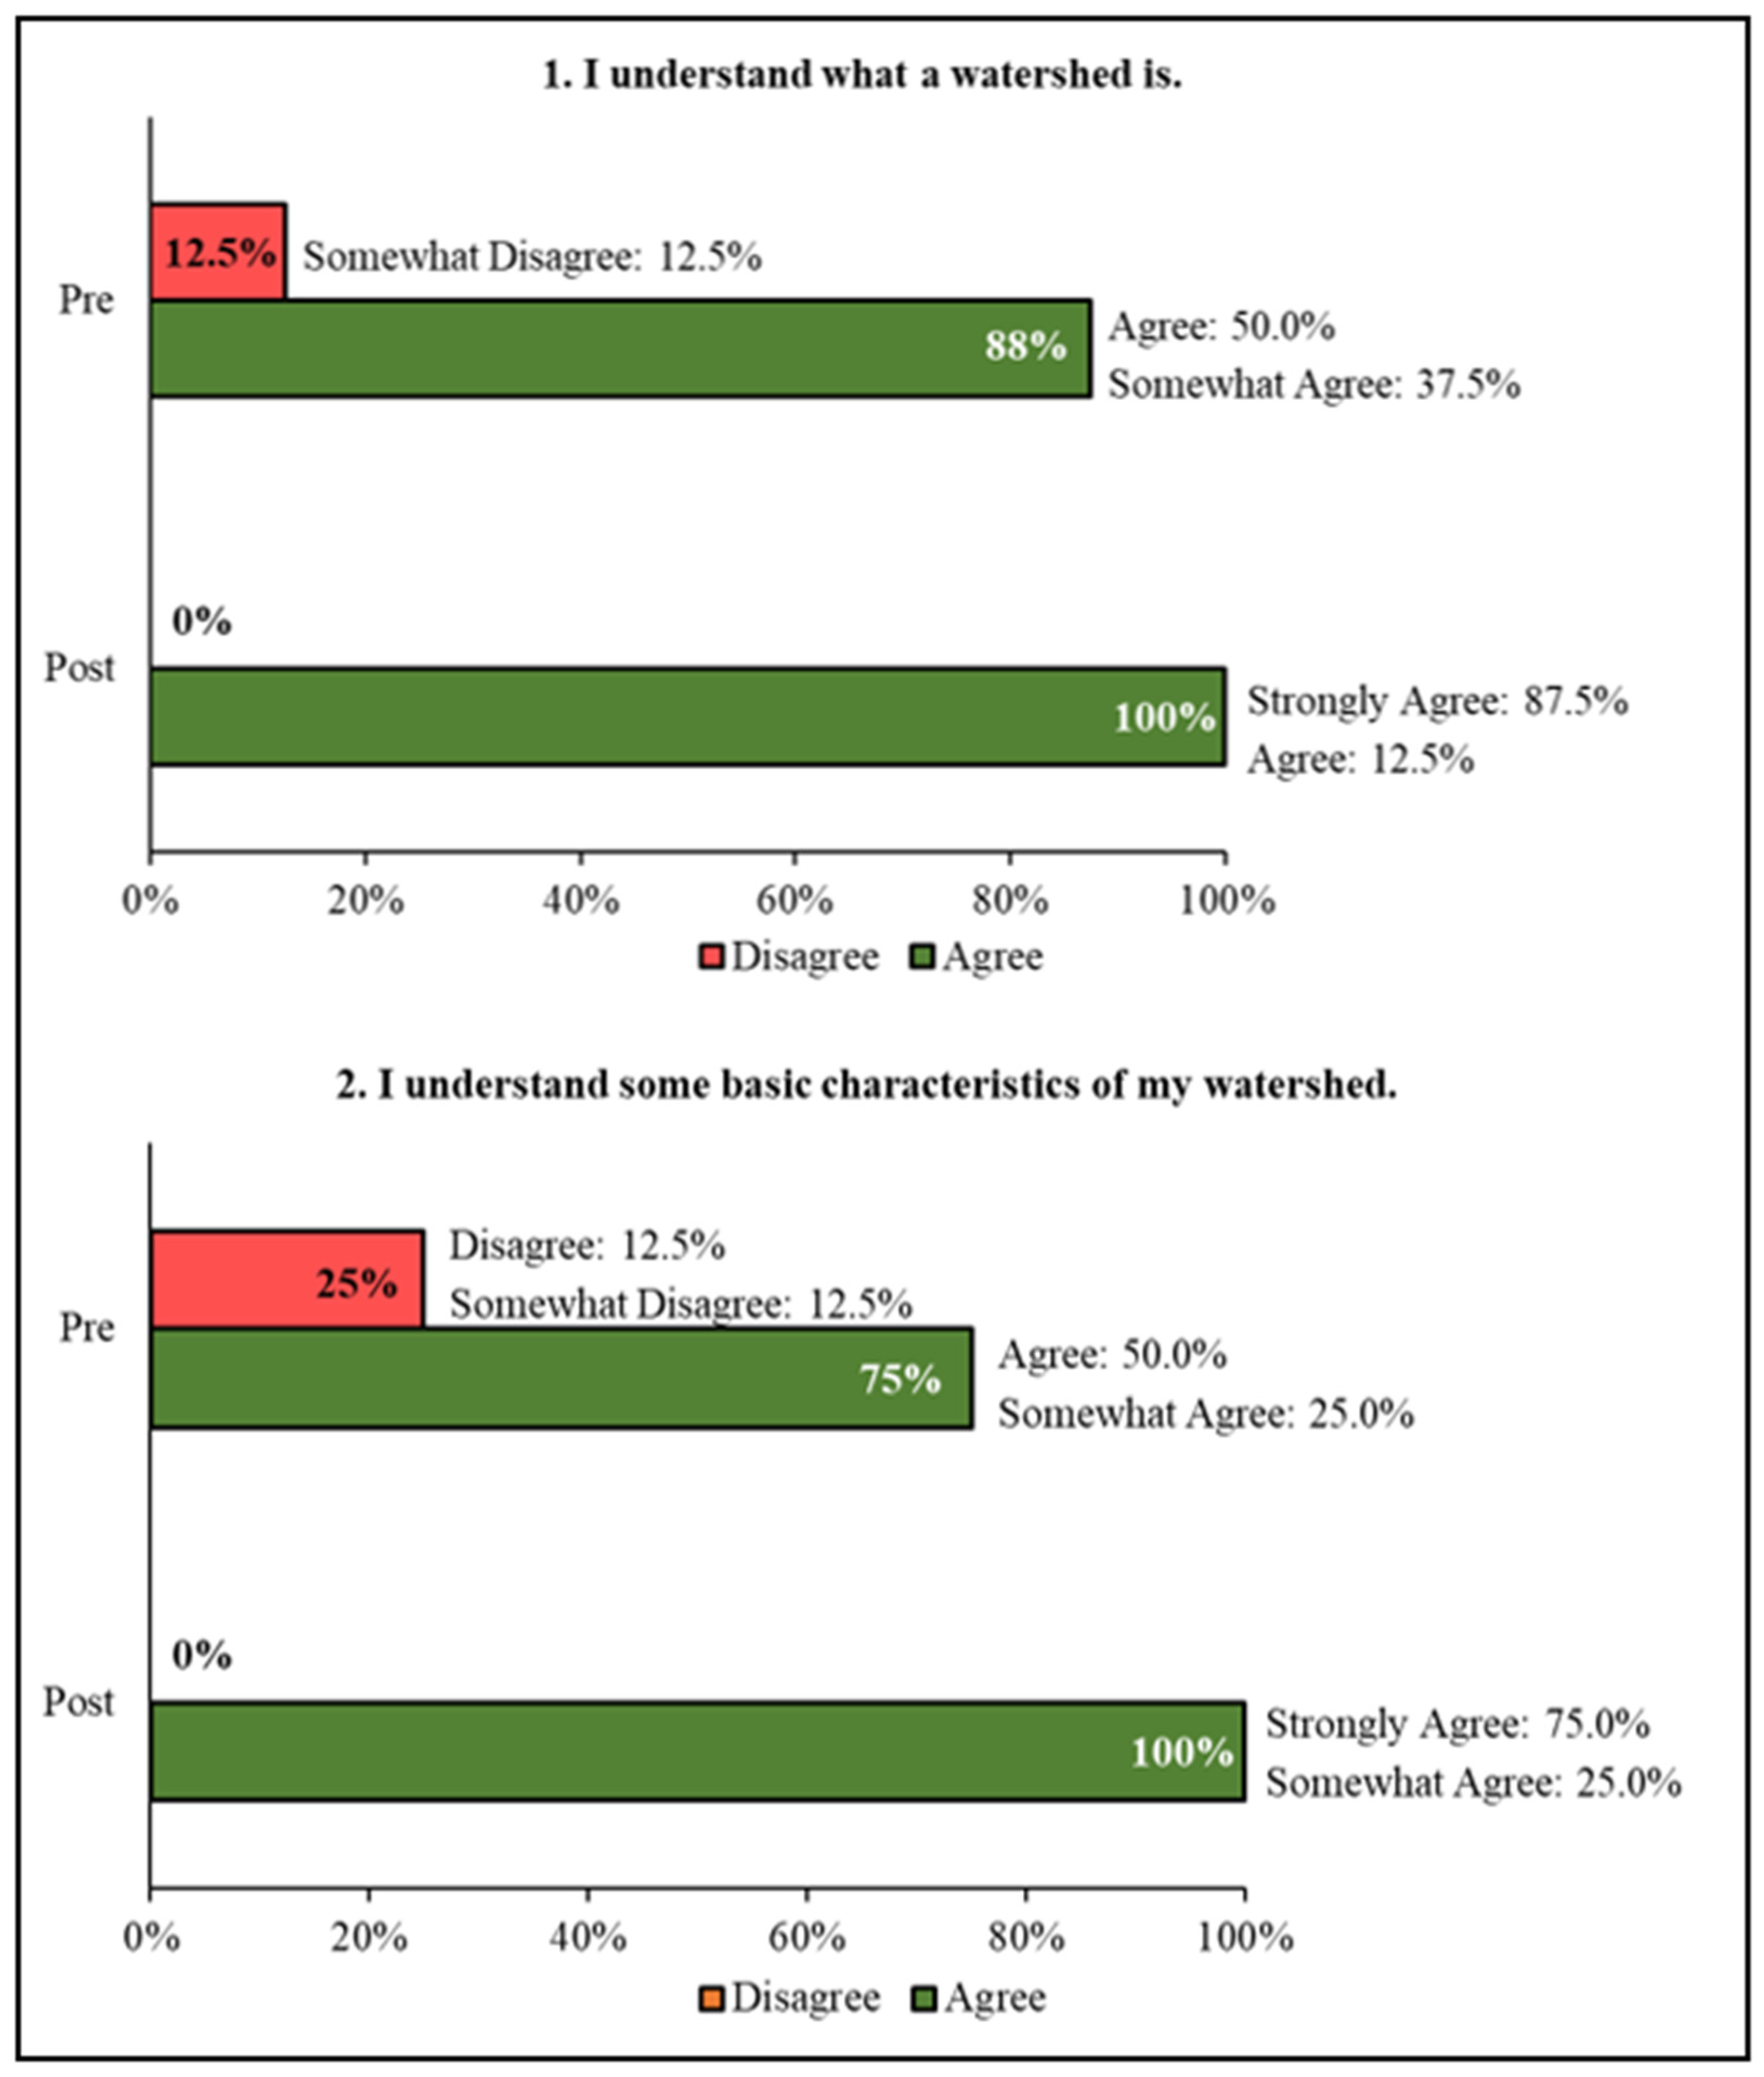
The questions that resulted in the greatest positive change in mean were Q1 (+1.50) and Q2 (+1.63), which correspond to watershed connectedness. In Q1 and Q2, students collectively reported an improvement in their understanding of a watershed and its characteristics (Figure 2). Prior to the outreach, 88% of the students reported that they understood what a watershed was. However, referring to Table 8, 0% of students were able to successfully define a watershed during the pre-program content assessment. This difference in self-perceived understanding and understanding as measured through the content assessments should be further investigated in future study efforts. Providing an incentive for student completion of the content surveys may be useful as well, as the brevity of some student responses may indicate a lack of effort rather than a lack of knowledge.
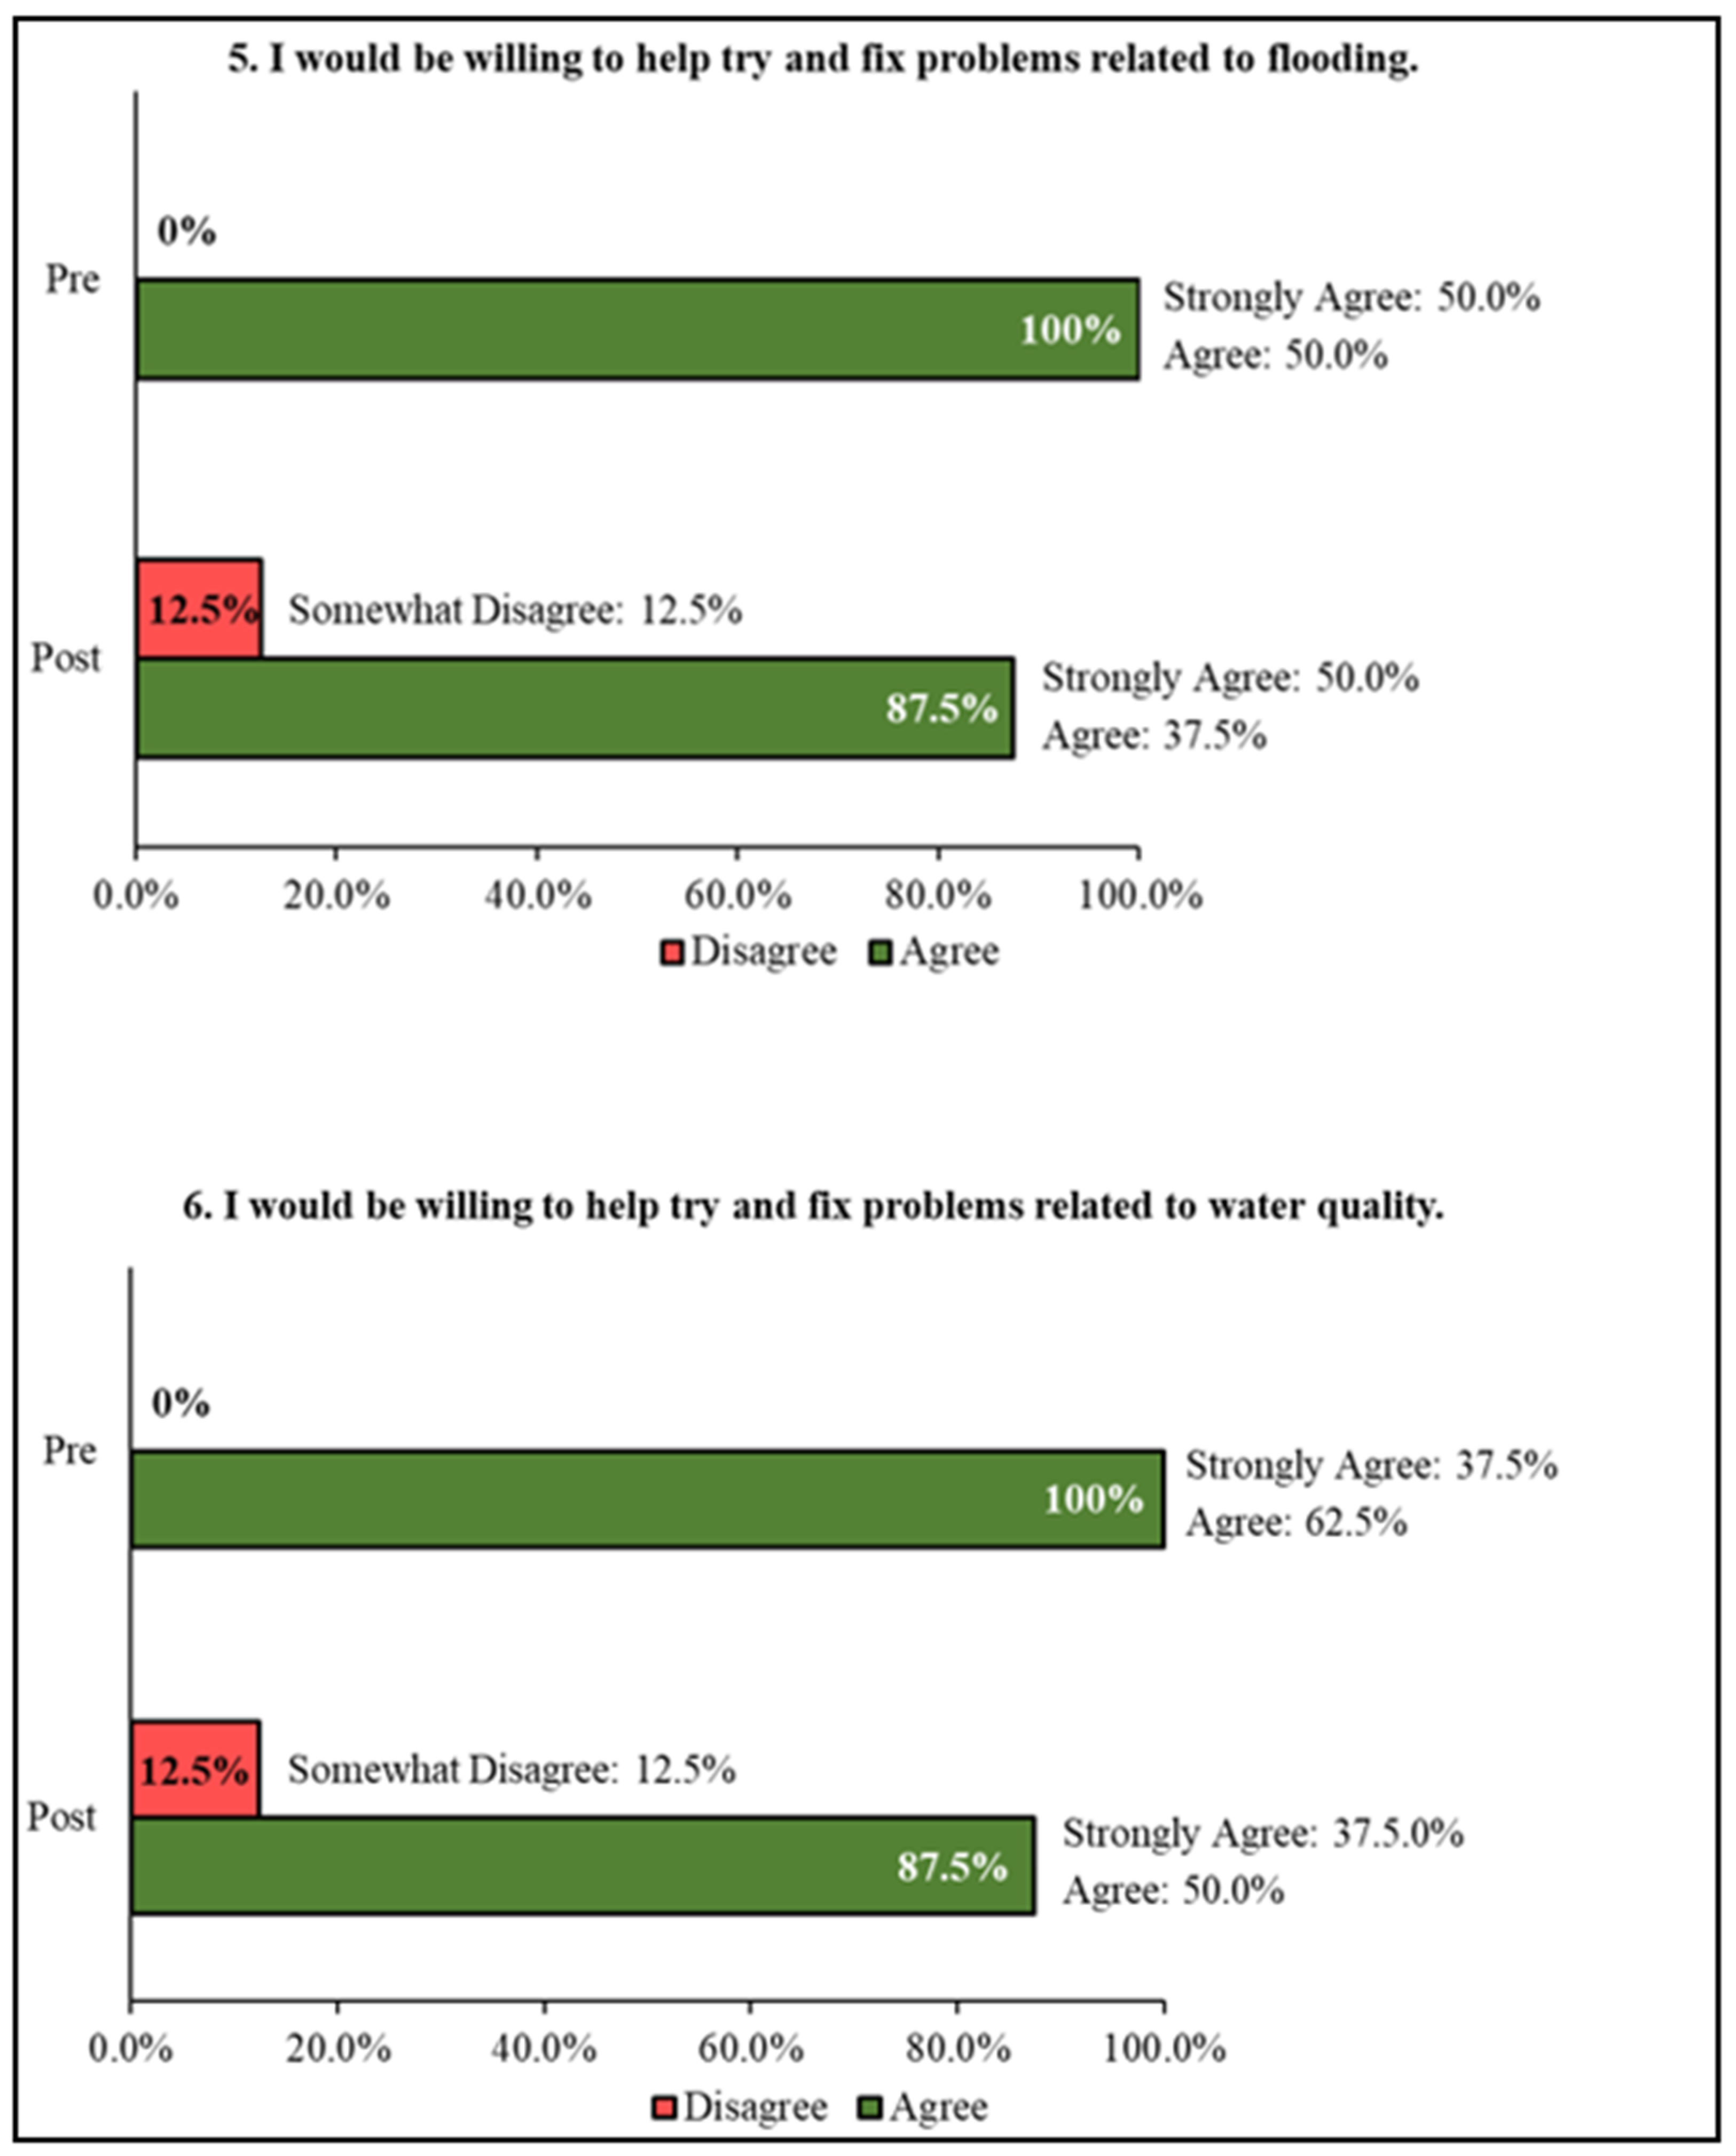
Conversely, the reported change in mean in questions 5 (−0.25) and 6 (−0.25) represented the greatest negative change. Questions 5 and 6 indicate that the student participants reported a decrease in willingness to address local flooding issues in their watershed (Figure 3). Despite resulting in an overall improvement of short-term watershed literacy of the student participants, additional efforts should be made to attempt to address student willingness to become active watershed stewards. Involving community members in environmental outreach efforts has been found to provide increased data collection [17], improved participation in stewardship efforts [18], and enhanced awareness of one’s watershed and its processes [19]. Therefore, it is recommended that future efforts with the students at the high school extend beyond classroom activities to allow the students to collect relevant watershed data and observe future flood mitigation measures.
As this program was designed largely by Civil and Environmental Engineering university representatives, increased collaboration and involvement with individuals who specialize in education and the inclusion of a rubric to evaluate program materials may provide valuable improvements to the outreach program as well. Providing an option to receive educator feedback from future studies is recommended as well. Additionally, including a section during the Likert scale assessments for students to explain their reasonings behind their agreements or disagreements may also provide additional insights into how the program may be improved. Because post-program surveys were conducted immediately after the final outreach unit, the potential long-term effectiveness of this outreach remains unevaluated.
4. Conclusions

This study serves as a foundational step in establishing outreach in a rural watershed. Prior to this study, no community programs were identified to improve the watershed literacy or stewardship of local youth. As a result of this study, materials were developed for low-cost, place-based environmental engineering learning activities to explore the local phenomena of flooding. In future efforts, it is recommended to modify the survey method used to assess the impact of the program on individual students, instead of the collective group. Additionally, through involving a larger sample size of students in the program, statistical analysis may be employed to better evaluate the effectiveness of the program in improving watershed literacy. While this research focused on program implementation in a small, rural classroom setting, future efforts could apply the materials to assess effectiveness in larger, suburban or urban classrooms.
Furthermore, in addition to survey methods, the program may be improved to better meet the learning needs of the student participants by administering a content survey before finalizing the outreach materials. As there is a general lack of watershed literacy for both adults and children in the United States, it may be beneficial to assess the specific students’ baseline knowledge and then modify the outreach material accordingly, instead of designing content materials for a specific grade level. While specific to the rural watershed, the program’s materials and general approach may be adapted for other watersheds.

Author Contributions

Conceptualization, M.Y., T.D. and A.K.; methodology, M.Y., T.D. and A.K.; validation, K.M.; formal analysis, M.Y. and T.D.; data curation, M.Y.; writing—original draft preparation, M.Y.; writing—T.D., A.K. and K.M.; visualization, M.Y.; supervision, T.D.; project administration, T.D. All authors have read and agreed to the published version of the manuscript.

Funding

This research received no external funding.

Data Availability Statement

Due to IRB policies and the protection of privacy of the study participants, data is not available on public domain.

Acknowledgments

This research was conducted under the financial support of Tennessee Technological University’s Center for the Management, Utilization and Protection of Water Resources and the Department of Civil and Environmental Engineering.

Conflicts of Interest

The authors declare no conflict of interest.

References

  1. United Nations. Transforming Our World: The 2030 Agenda for Sustainable Development. 2015. Available online: https://sdgs.un.org/2030agenda (accessed on 5 May 2023).
  2. Vander Ark, T.; Liebtag, E.; McClennen, N. The Power of Place: Authentic Learning Through Place-Based Education; ASCD: Arlington, VA, USA, 2020. [Google Scholar]
  3. Rural School and Community Trust. Annual Report 2005: Addressing the Crucial Relationship between Good Schools and Thriving Rural Communities; Rural School and Community Trust: Washington, DC, USA, 2005. [Google Scholar]
  4. Hamilton, E.R.; Pawelka, K.; Morrow, T.; Marckini-Polk, L. Putting Problem-based Learning in Its Place. Sci. Child. 2022, 59, 58–61. [Google Scholar] [CrossRef]
  5. Endreny, A.H. Urban 5th graders conceptions during a place-based inquiry unit on watersheds. J. Res. Sci. Teach. 2010, 47, 501–517. [Google Scholar] [CrossRef]
  6. Rittenburg, R.A. Using Process-Based Hydrologic Approaches and Place-Based Education to improve Nonpoint Source Pollution Management; ProQuest Dissertations Publishing: Ann Arbor, MI, USA, 2015. [Google Scholar]
  7. Zint, M.; Kraemer, A.; Heimlich, J. National Oceanic and Atmospheric Administration’s Bay Watershed Education and Training Program Evaluation System 5-Year Plan; National Oceanic and Atmospheric Administration: Washington, DC, USA, 2012; Volume 23. [Google Scholar]
  8. Brody, S.D.; Highfield, W.E.; Kang, J.E. Rising Waters: The Causes and Consequences of Flooding in the United States; Cambridge University Press: Cambridge, UK, 2011. [Google Scholar]
  9. Barkley, E.F.; Major, C.H. Interactive Lecturing; Jossey-Bass: San Francisco, CA, USA, 2018. [Google Scholar]
  10. Stencel, J.E. An Interactive Lecture Notebook-Twelve Ways to Improve Students’ Grades: Drawing Students’ Attention to What They Need to Know in Lecture. J. Coll. Sci. Teach. 1998, 27, 343–345. [Google Scholar]
  11. National Aeronautics and Space Administration Global Precipitation Measurement Mission (n.d.). Rain Gauge Activity Lesson Plan. Retrieved from the National Aeronautics and Space Administration. Available online: https://gpm.nasa.gov/education/lesson-plans/rain-gauge-activity (accessed on 5 May 2023).
  12. US Environmental Protection Agency (EPA). A QUICK GUIDE to Developing Watershed Plans to Restore and Protect Our Waters. Retrieved from U.S. Environmental Protection Agency (EPA). 2013. Available online: https://www.epa.gov/sites/default/files/2015-12/documents/watershed_mgmnt_quick_guide.pdf (accessed on 5 May 2023).
  13. North Carolina Division of Water Quality. Stormwater Best Management Practices Manual; North Carolina Department of Environmental Quality: Raleigh, NC, USA, 2007. [Google Scholar]
  14. University of South Florida. Does Media Matter? Infiltration Rates and Storage Capacity. Retrieved from TeachEngineering. 2012. Available online: https://www.teachengineering.org/activities/view/usf_stormwater_lesson02_activity2 (accessed on 5 May 2023).
  15. Gomez Galan, J. Educational Research in Higher Education: Methods and Experiences; River Publishers: Nordjylland, Denmark, 2016; Volume 12. [Google Scholar]
  16. Lev, D.; Renfro, S.; Lindbo, D.; Jarrell, W.; Blair, J.; Andrews, S.; Howell, L. The Student Watershed Research Project (SWRP): Collecting Watershed Data for Use by Resource Management Agencies. Urban Ecosyst. 1998, 2, 113–127. [Google Scholar] [CrossRef]
  17. Bonney, R.; Dickinson, J.L. Citizen Science Public Participation in Environmental Research; Comstock Publishing Associates: New York, NY, USA, 2012. [Google Scholar] [CrossRef]
  18. Shandas, V.; Messer, W.B. Fostering Green Communities Through Civic Engagement: Community-Based Environmental Stewardship in the Portland Area. J. Am. Plan. Assoc. 2008, 74, 408–418. [Google Scholar] [CrossRef]
  19. Leach, W.D. Collaborative Public Management and Democracy: Evidence from Western Watershed Partnerships. Public Adm. Rev. 2006, 66, 100–110. [Google Scholar] [CrossRef]
Figure 1. Student activity participation from the five units or lectures offered.
Water 17 01588 g001
Figure 2. Greatest student self-reported improvements (watershed literacy).
Water 17 01588 g002
Figure 3. Greatest student self-reported decrease (student willingness).
Water 17 01588 g003
Table 1. Short-term outreach program design.
UnitLearning Goals
1. Introduction to Engineering Hydrology
  • Define hydrology.
  • Explain the hydrologic cycle.
  • Define engineering hydrology.
  • Provide an example of engineering hydrology.
2. What is a Watershed?
  • Define watershed.
  • Understand watershed characteristics.
  • Identify local watershed.
  • Delineate a watershed.
3. Rain and Drainage
  • Define precipitation.
  • Define rainfall duration, depth, and frequency.
  • Provide an example of an engineering tool used to quantify rainfall.
4. Soils and Infiltration
  • Define rain garden.
  • Define bioretention.
  • Describe the importance of soils in hydrology.
  • Identify rain garden soil design considerations.
5. Plants and Filtration
  • Identify sources of pollution in water bodies.
  • Define filtration.
  • Describe the importance of natural filters such as rain gardens.
  • Describe the importance of rain gardens in protecting pollinators.
Table 2. Unit 1 content assessment (pre-n = 9, post-n = 8).
No.QuestionPrePostChange
Q1Define hydrology.78%100%22%
Q2Define engineering hydrology.33%31%−2%
Q3Explain the hydrologic cycle.44%56%12%
Q4Describe the water budget equation.0%31%31%
Q5Provide an example of engineering hydrology.56%100%44%
Table 3. Unit 2 content assessment (pre-n = 9, post-n = 8).
No.QuestionPrePostChange
Q6Define the term “watershed”.0%44%44%
Q7Describe some characteristics of a watershed.0%88%88%
Q8What is the name of your local watershed?78%100%22%
Q9How do hydrologists delineate watersheds?0%75%75%
Table 4. Unit 3 content assessment (pre-n = 7, post-n = 6).
No.QuestionPrePostChange
Q10Define “Precipitation”.79%75%−4%
Q11Define “Rainfall Duration”, “Rainfall Depth”, and “Rainfall Frequency”. 48%61%13%
Q12What is a tool that hydrologists use to quantify or measure rainfall?71%100%29%
Table 5. Unit 4 content assessment (pre-n = 5, post-n = 6).
No.QuestionPrePostChange
Q13Define Low Impact Development (LID).0%29%29%
Q14Define Bioretention.0%43%43%
Q15Define Rain Garden.50%50%0%
Q16Describe the importance of soils in hydrology.42%23%−19%
Q17Identify Rain Garden Soil Design Considerations.17%64%48%
Table 6. Unit 5 content assessment (pre-n = 9, post-n = 8).
No.QuestionPrePostChange
Q18Identify sources of pollution in water bodies.100%100%0%
Q19Define filtration.22%31%9%
Q20Describe the importance of natural filters such as rain gardens.50%44%−6%
Q21Define pollinators and provide some examples.67%69%2%
Q22Describe the importance of rain gardens in protecting pollinators. 28%63%35%
Table 7. Program content assessment (n = 8).
No.QuestionPrePostChange
Q1Define hydrology.56%94%38%
Q2Define engineering hydrology.6%44%38%
Q3Explain the hydrologic cycle.0%56%56%
Q4Describe the water budget equation.0%13%13%
Q5Provide an example of engineering hydrology.6%63%56%
Q6Define the term “watershed”.0%38%38%
Q7Describe some characteristics of a watershed.0%25%25%
Q8What is the name of your local watershed?50%100%50%
Q9How do hydrologists delineate watersheds?0%6%6%
Q10Define “Precipitation”.63%38%−25%
Q11Define “Rainfall Duration”, “Rainfall Depth”, and “Rainfall Frequency”. 31%69%38%
Q12What is a tool that hydrologists use to quantify or measure rainfall?13%75%63%
Q13Define Low Impact Development (LID).0%19%19%
Q14Define Bioretention.0%6%6%
Q15Define Rain Garden.31%69%38%
Q16Describe the importance of soils in hydrology.25%75%50%
Q17Identify Rain Garden Soil Design Considerations.0%44%44%
Q18Identify sources of pollution in water bodies.75%100%25%
Q19Define filtration.50%88%38%
Q20Describe the importance of natural filters such as rain gardens.19%63%44%
Q21Define pollinators and provide some examples.50%88%38%
Q22Describe the importance of rain gardens in protecting pollinators. 19%75%56%
Table 8. Likert scale survey average responses (n = 8).
Watershed ConnectednessBeforeAfterDifference
1. I understand what a watershed is.2.631.13+1.50
2. I understand some basic characteristics of my watershed.2.881.25+1.63
3. I am aware of the flooding that has impacted my watershed since 2018.1.881.13+0.75
4. I have knowledge of some of the different consequences of flooding.1.501.13+0.38
7. I understand some of the basic procedures that engineering hydrologists use to address flooding.2.501.63+0.88
Student ConfidenceBeforeAfterDifference
8. I feel confident that the flooding issues within my watershed will be resolved.2.001.88+0.13
9. I feel that I am capable of addressing flood-related issues.2.381.88+0.50
Student WillingnessBeforeAfterDifference
5. I would be willing to help try and fix problems related to flooding.1.501.75−0.25
6. I would be willing to help try and fix problems related to water quality.1.631.88−0.25
10. I am interested in pursuing a career in Science, Technology, Engineering, or Mathematics (STEM).2.883.00−0.12
Disclaimer/Publisher’s Note: The statements, opinions and data contained in all publications are solely those of the individual author(s) and contributor(s) and not of MDPI and/or the editor(s). MDPI and/or the editor(s) disclaim responsibility for any injury to people or property resulting from any ideas, methods, instructions or products referred to in the content.