Article

Microscopic Air–Water Properties in Non-Uniform Self-Aerated Flows

1
Chongqing Survey and Design Institute of Water Resources, Electric Power and Architecture Co., Ltd., Chongqing 400020, China
2
State Key Laboratory of Hydraulics and Mountain River Engineering, Sichuan University, Chengdu 610065, China
*
Author to whom correspondence should be addressed.
Water 2025, 17(11), 1587; https://doi.org/10.3390/w17111587 (registering DOI)
Submission received: 10 April 2025 / Revised: 19 May 2025 / Accepted: 19 May 2025 / Published: 24 May 2025
(This article belongs to the Special Issue Monitoring and Modelling of Contaminants in Water Environment)

Abstract

:
Supercritical open channel flows contribute substantially to the air–water transfer process in spillways, rivers, and streams. They are characterized by strong turbulent mixing and a substantial amount of air entrainment. The microscopic air–water properties in non-uniform self-aerated flows are investigated experimentally with various chute slopes, including air chord size and air–water transfer frequency. Microscopic air–water structures are primarily affected by chute slope, whereas the approach flow Reynolds number hardly influences them, resulting in self-similarity of the probability distribution of air chord length and air–water transfer frequency distribution in the self-aerated region. The distribution of bubble chord length is more continuous from the small to large scale in the high-air-concentration region for a greater chute slope, and the position of maximum air frequency moves to the higher-aeration zone and gets closely to the free surface. Moreover, empirical relationships are provided to predict the microscopic air–water properties in non-uniform self-aerated flows.

1. Introduction

In high-speed water flows, air–water transfer is derived from free surface aeration, e.g., running streams, rivers, and spillways. The self-aerated flow is characterized by strong turbulent mixing and a substantial amount of air entrainment, and the flow structure is complex, including individual water drops and bubbles with irregular shapes, air–water projections, and foam [1,2,3]. Uniform self-aerated flows were analyzed to obtain a homogeneous and equilibrium assumption to establish a basic model, while for non-uniform self-aerated flows, two microscopic concepts of “entrained air” and “entrapped air” have been proposed, which indicate that the air–water in a non-uniform self-aerated flow may not be seen as a homogeneous mixture. The two air types have different effects on air–water properties, including bulk interest, cavitation prevention, and gas transfer [4,5,6]. Furthermore, for environmental fluid issues, the assessment of the water quality of rivers and streams is strongly affected by the air–water transfer frequency across the two-phase interface. Thus, the microscopic properties of air–water structures and the development process are an important interest for the study of mixed flows.
Self-aeration occurs when the bottom turbulent boundary layer reaches the free surface, overcoming surface tension. Air concentration and distribution have been studied for decades, and a series of theoretical model and test data for self-aeration process have been developed [7,8,9]. With the improvement of instrumentation, the -detection needle probes and high-speed cameras have been developed and used in air–water flow experiments [10,11]. More detailed microscopic properties including bubbles, droplets, and entrapped vertical structures have been investigated in recent decades [12,13,14]. Gulliver et al. [15] analyzed bubble size distribution at cross-section of self-aerated flows, but the results were limited to the sidewall boundary. Chanson [16] investigated air–water flow structures and bubble size characteristics on a small-slope channel (4°) in the air detrainment region of self-aerated flows. Toombes and Chanson [17] discussed the surface wave effect on the air–water structure, including air concentration and air–water chord length distribution. Many researchers have studied the air–water structure variation and self-aeration development in stepped [18,19,20] and rock chutes [21,22,23]. Some experimental data showed that the unsymmetrical bubble frequency distributions, including the cross-sectional maximum bubble frequency, were affected by the air–water flow wave amplitude [24]. A combination of macroscopic (e.g., air concentration, waves) and microscopic properties (e.g., bubble sizes and shapes) in air–water flows was analyzed to provide a complete description for the air–water mixture process [25]. Considering that the surface wave was a result of free surface aeration development of air–water flows, this would imply that the non-uniform mixture process plays some part in the evolution of bubble properties. The air entrainment and diffusion into the specific air–water mixture region might offer new insight into the non-uniform developing process.
For flat, smooth chutes, the turbulence intensity near the bottom is much lower than the level in stepped and rock chutes, and the scale of turbulent eddies supporting the generation of entrained vortices is much smaller. Air–water structures in high-speed chute flows have received less attention, especially for the fragmentation developing process. The previous air–water development status was determined by the air concentration equilibrium level [26,27]); however, the microscopic air–water structures, such as bubble quantities and sizes, continued to vary downstream [28,29]. The Hinze scale of shearing air bubbles was commonly used as the size scale, representing the scale where turbulent bubble fragmentation ceases [30,31]. Observations of bubble formation and scale dependence in free surface air entrainment indicated that the bubble size was much larger than the Hinze scale and the bubble size and shape properties were much more complicated in the self-aeration process [32,33]. However, there is little information on the development process of air–water structures in non-uniformed regions and a lack of understanding of the effects of flow and chute features. Examining distribution of air–water structures and the development process would result in a reasonable description and understanding of air–water flows.
Compared to the acceptable homogeneous and equilibrium assumption for uniform self-aerated chute flows, the air–water structures in non-uniform developing flows, including the air phase quantity and size properties related to the air concentration, change across time over a wide range of scales. This complexity has constrained the conceptualization efforts of self-aeration developing flows and hindered the development of models. Challenges arise in the modelling of the development of self-aerated flows in applications, and the mixture process generates bubble break-up and diffusion along both vertical and streamwise directions, spanning over large scales in hydraulic structures. Thus, detailed measurements of self-aerated non-uniform flows in physical models are still needed to yield improved knowledge of self-aerated development.
In order to bridge the gap between the broad range of bubble properties in self-aerated developing chute flows, the present study systematically tests the microscopic properties under various flow conditions and slope chutes, including air chord length and air–water transfer frequency, in the process of supercritical non-uniform development. Detailed relationships among the microscopic bubble properties and macroscopic air concentrations along the streamwise air–water chute flows are analyzed. In specific aerated areas of self-aerated developing flows, some self-similarity properties are discussed in obtaining universal bubble distributions for a more accurate air–water chute flow descriptions.

2. Experimental Apparatus

The experiments are performed in two model chutes with various slopes made of PMMA (polymethyl methacrylate). One is 12 m long and 0.4 m wide with a bottom angle α = 13.5° and 17.5°, and the other is 18 m long and 0.3 m wide with α = 28°. Here, x = stream-wise coordinate along the chute bottom, and the coordinate perpendicular to it is y, as shown in Figure 1. The roughness height of the model chutes is 0.01 mm. The study by Hsiao [34] showed that the air concentration in the center of the channel was homogeneous in the transverse direction in a 6-inch-wide channel (about 15.24 cm wide). This suggests that effects from a smooth side-wall can be neglected and the assumption of transverse homogeneity should likewise be valid for the 30–40 cm wide chute in the present flume.
Air and water signals are recorded using a CQY—Z8a measurement instrument (Huaihe River Commission of the Ministry of Water Resources, Bengbu, China) [35] an intrusive phase detection probe. The conductive tip measures the air–water interfaces based on the air–water binary transfer over time. The raw data are post-processed according to the threshold limit of air and water phase difference. In the present study, an “air” is defined as a volume of air detected by the conductive tip from two consecutive air–water interface signals. The local air concentration C is defined as the volume of air per unit volume. The bobble properties are measured at 8–11 cross-sections of non-uniform air–water flows, and the relative streamwise distance normalized by d0 ranges x/d0 = 2.5–204 according to approaching flow conditions. At each measured position, the signals from the conductivity probe are recorded with a scan rate of Fsample = 100 kHz per channel for a t = 5 s scan period [36]. The air–water transfer frequency is characterized by the count of air–water signal transfer unit time, defined as F = N/t, where N is the number of “air” volumes measured in the scanning time t. The “air chord” is a characteristic size of an air bubble or entrapped air in the surface roughness, and it is the measured length of two consecutive intersections of air–water interface. The histogram columns represent each quantity probability of bubble chord length in a chord interval, and it is defined as follows:
P r = n j N
where nj is the air amount of a certain chord length and N is the total amount in the measurement scan period. A chord interval is 0.1 mm and the probability of air chord length from 0.4 to 0.5 mm is presented by the column labelled 0.5 mm.
The approach flows with variable initial depths d0, velocities V0, and relative Reynolds number Re0 = V0D0/ν are generated in the intake connected with the chute, with ν = kinematic water viscosity and g = gravitation acceleration. D0 is the hydraulic diameter of the initial water flow in chutes. The initial average water velocity V0 is defined as V0 = qw/d0, where qw is the unit flow discharge. Four series of tests were conducted, according to Table 1, including different hydraulic conditions.

3. Results

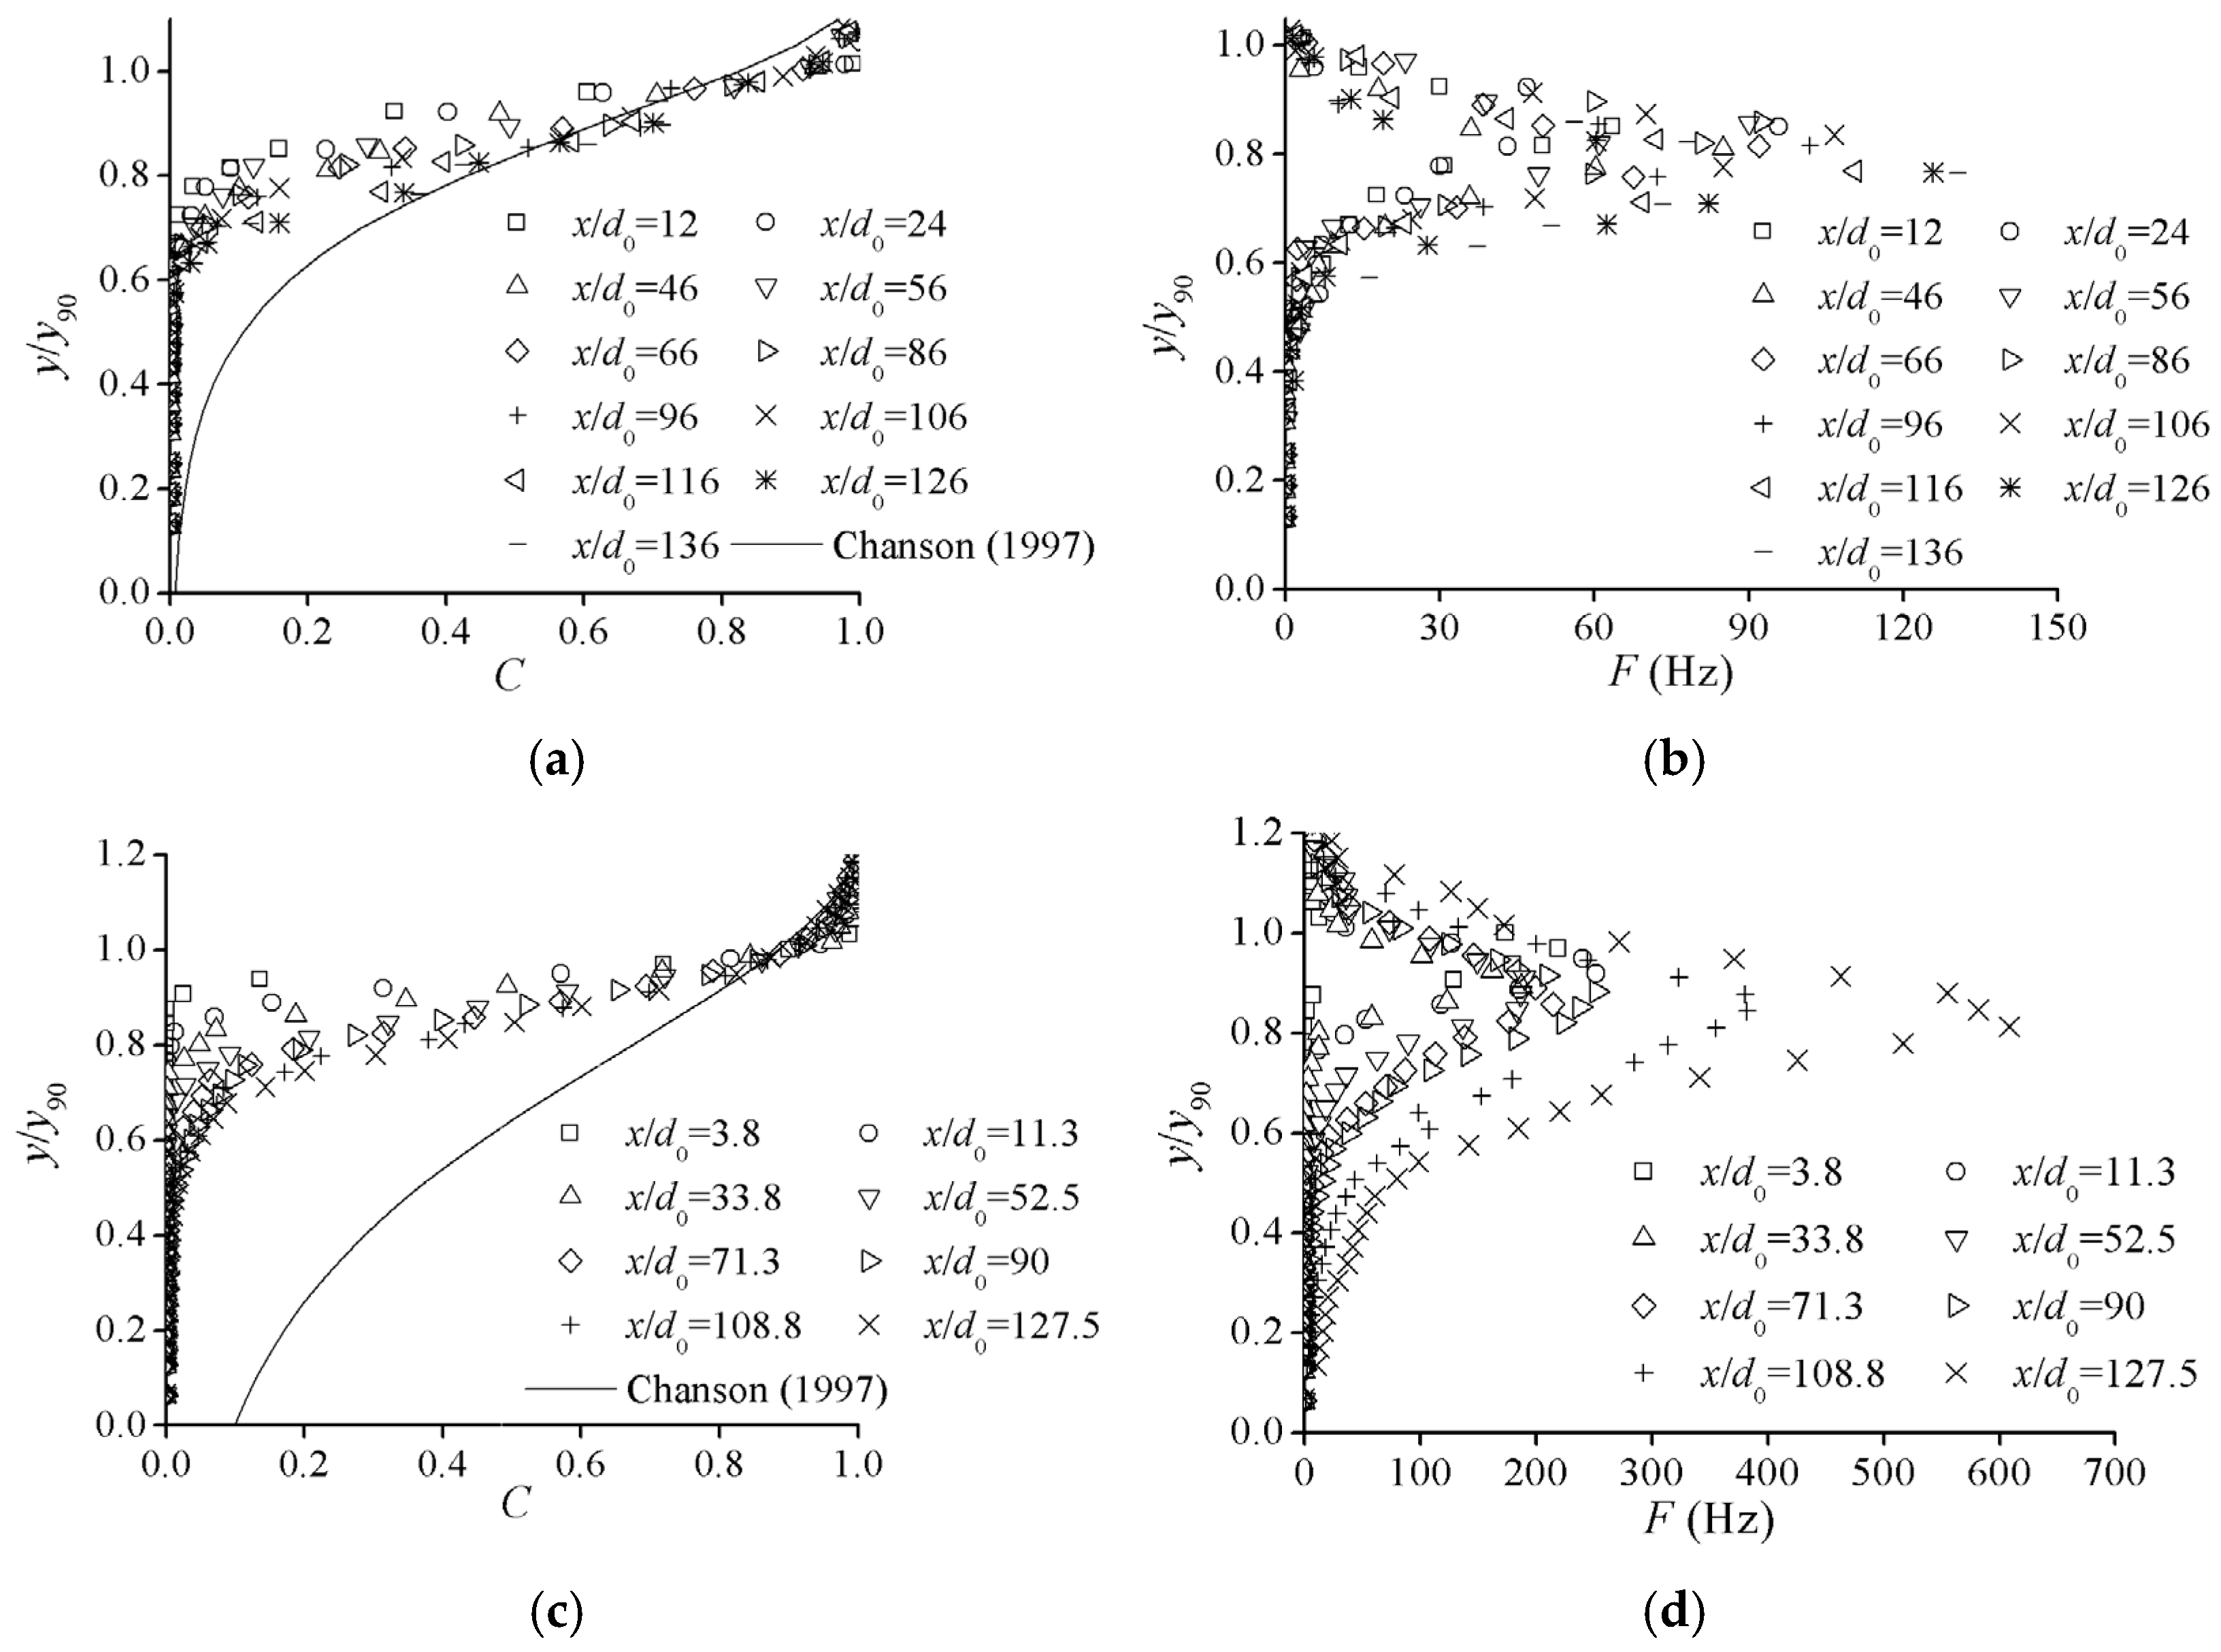
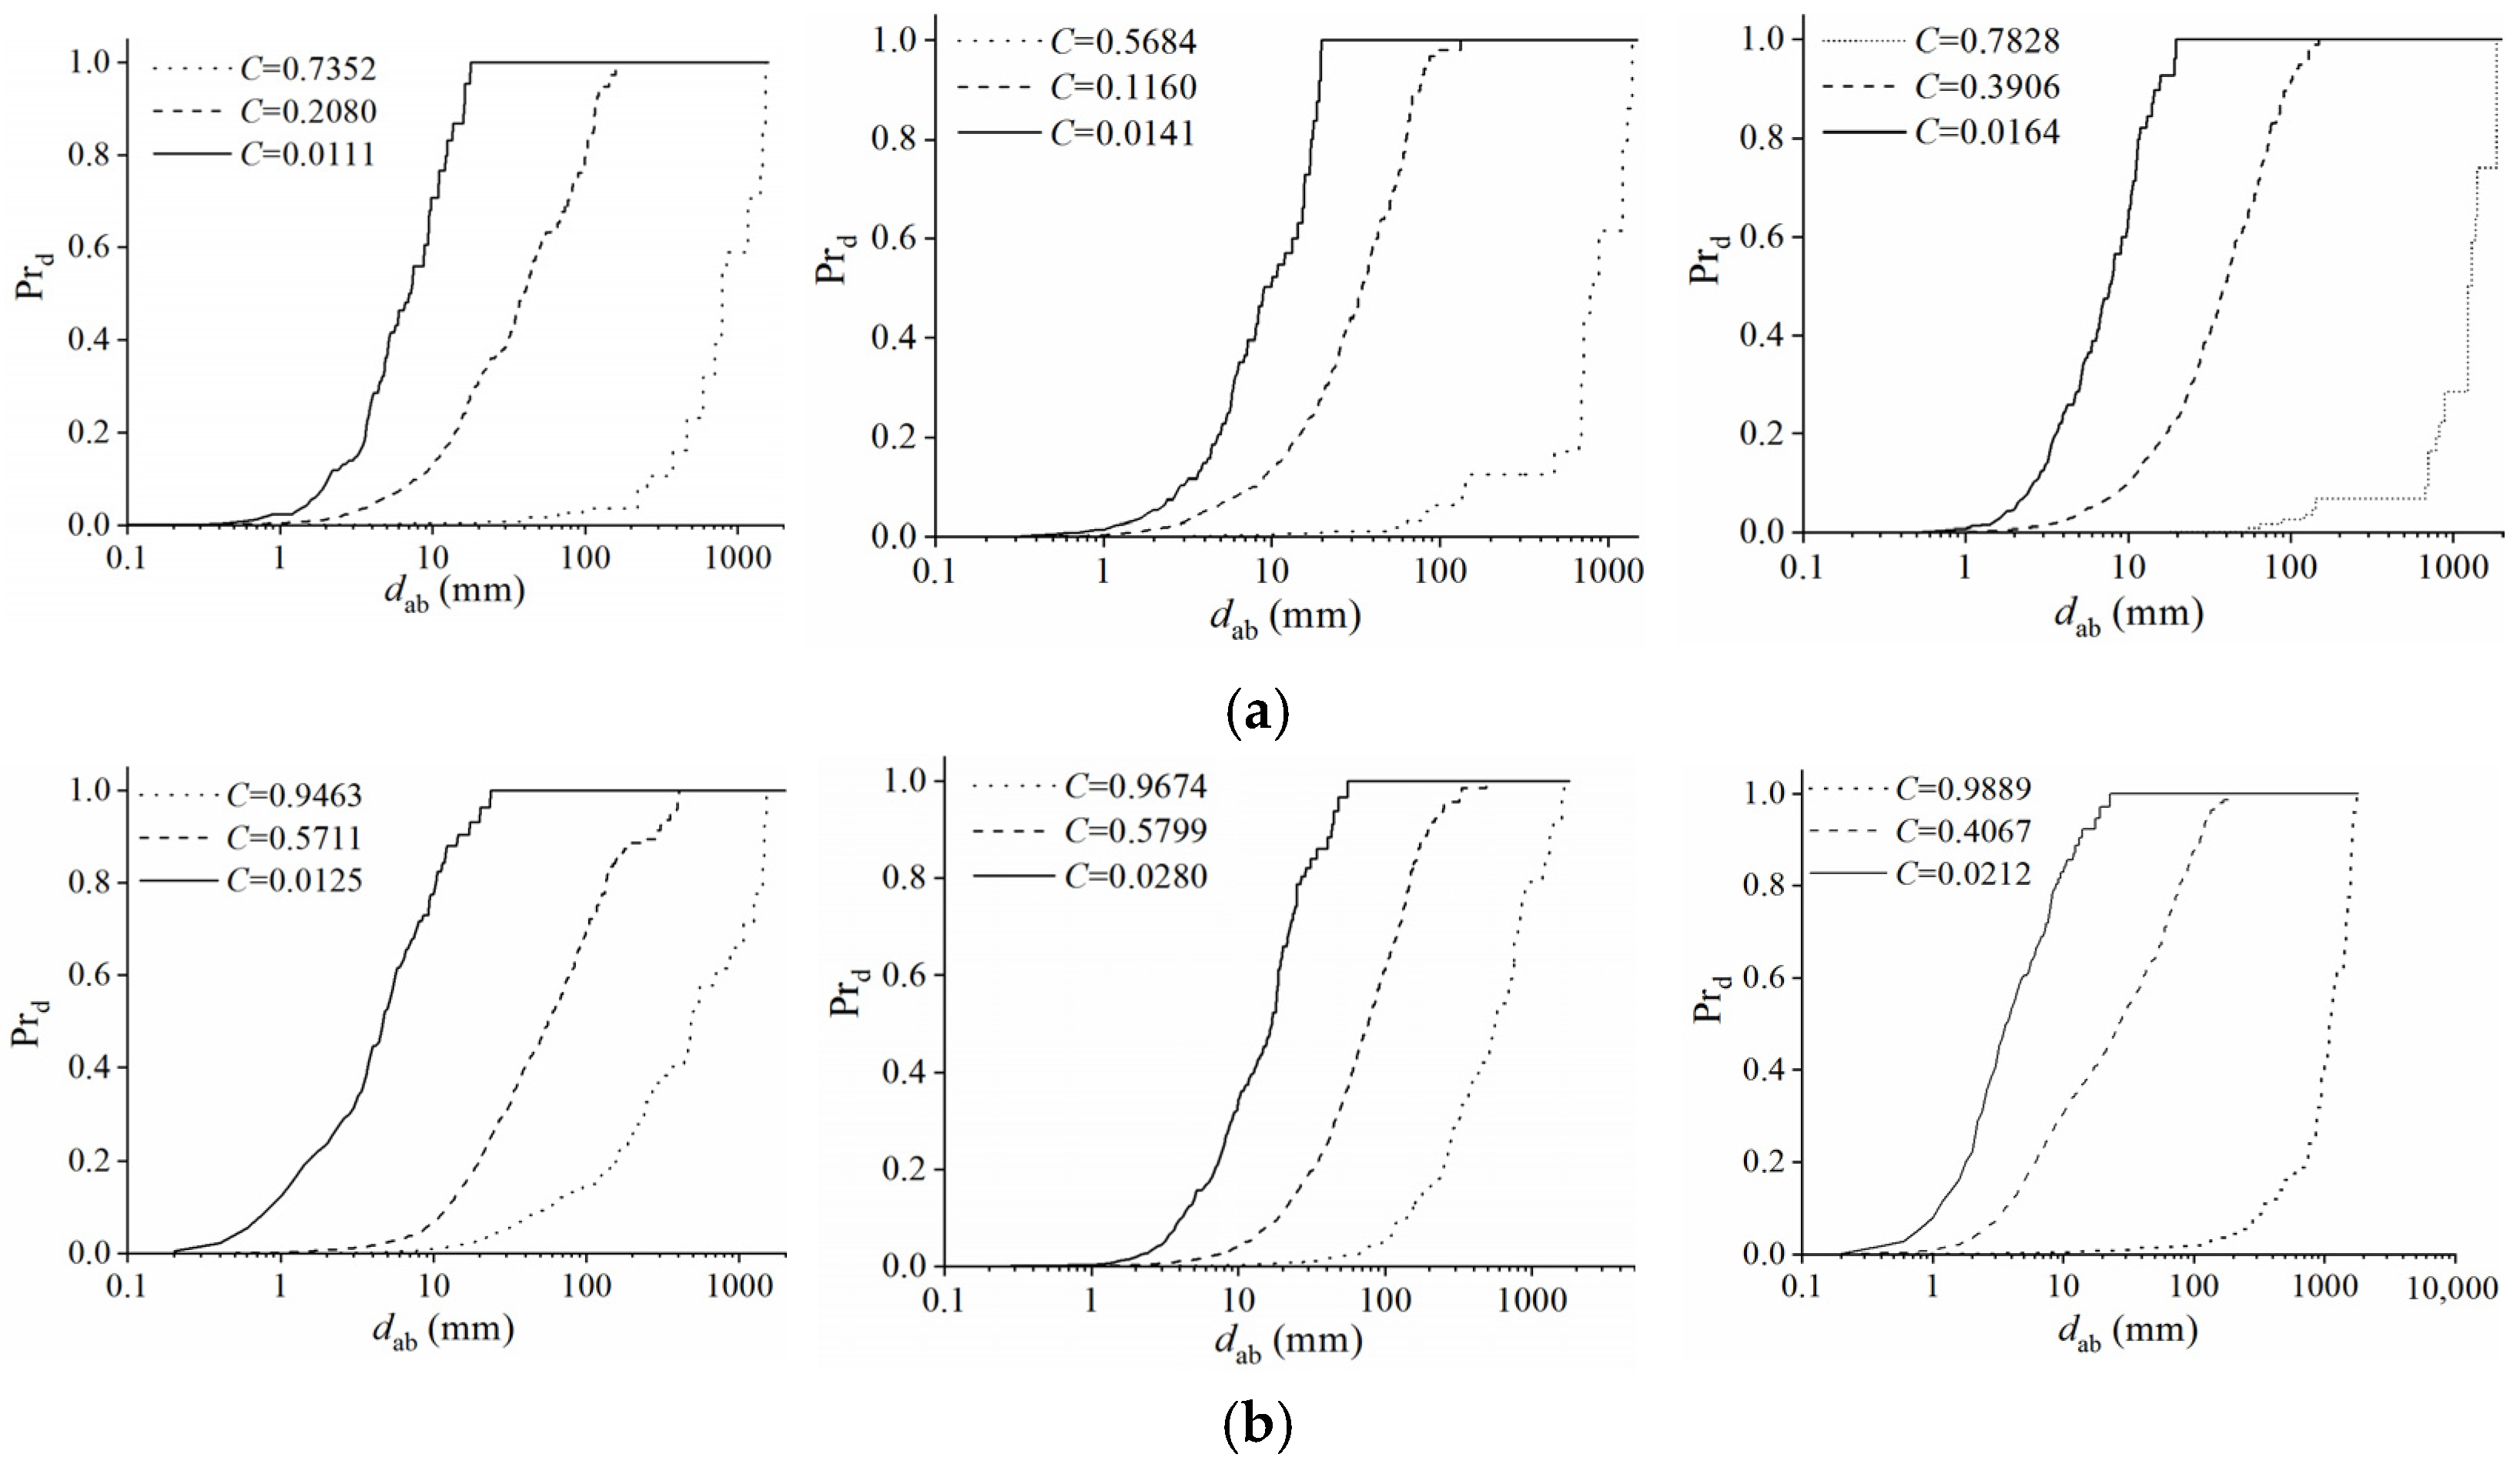
3.1. Bubble Size and Air Concentration Distributions

Typical distributions of air concentration and air–water transfer frequency are plotted in Figure 2. The air concentration increases continuously from the bottom to the free surface. At a certain cross-section, the free surface is especially affected, taking on a rough and wavy appearance, and air concentration increases much more rapidly near the water free surface. The present data are compared with a general function for air concentration distribution for uniform flow conditions [3,12]. These present values are smaller, indicating that the self-aeration is still developing downstream. With the development of self-aeration downstream, the bubble penetrates much deeper into the water flow and the air–water flow maintains non-uniformity.
The air–water transfer frequency increases with increasing distance from the bottom of the self-aeration region and then decreases in the area near the free surface, and these profiles exhibit a maximum Fmax at each cross-section. Note that the F increases and the air–water interaction becomes more and more intensive with the development of self-aeration. The position of the maximum air-phase frequency yFmax moves into the air–water flow downstream. The Fmax is two orders of magnitude, with range from 108.7 Hz (α = 13.5°, Re0 = 1.1 × 10⁵) to 608.2 Hz (α = 28°, Re0 = 3.4 × 10⁵).
Figure 3 shows air chord size distributions at various positions in the self-aerated region. Note that for high-air-concentration regions (C > 0.50), the range of air chord length extends over several orders of magnitude, with the greatest chord length even reaching 102~103 mm. This is mainly because of the large-scale roughness and wavy appearance and the fact that the air transported with the water flow is “entrapped air” instead of individual air bubbles entrained into the flow. In Figure 3, when the chute slope α and flow turbulent intensity Re0 are greater, the distribution of air chord length is more continuous from small to large scale in the high-air-concentration region (in Figure 3a,b), and the proportion of small-sized bubbles is greater in the low-air-concentration region (in Figure 3e,f). As the air concentration decreases, the range of chord length decreases and the distributions are skewed with a preponderance of small bubble sizes. For the lowest air concentration (C < 0.02~0.03), the bubble sizes are mainly smaller than 20 mm, indicating that the air transported with flow in this area is mainly in individual entrained bubbles.
Figure 4 and Figure 5 show the air amount (Prn) and chord size (Prd) cumulations at various positions in the self-aerated region. For the air amount cumulation, the rising tendency declines with the chord length increase. It is suggested that the probability of bubble chord length is the largest for small bubbles between 0–20 mm, and the preponderance of small bubble sizes increases as the air concentration and the distance from the free surface decrease. For the air chord size cumulation, the rising tendency is slow in the small chord length range when the air concentration is high (C > 0.50), and it increases sharply at the large chord length range. When the air concentration decreases, the rising tendency differs to a similar shape of bubble amount cumulation, and the size cumulation falls behind the amount cumulation throughout. This indicates that within the self-aerated zone, small-sized air dominate quantitatively while large-sized air have a large portion in terms of air content. This is because the large-scale surface roughness contains more entrapped air, which makes a greater contribution to air content compared with the individual entrained air bubbles. This specific difference remains in the self-aeration development downstream.
Considering the two microscopic aerated types in the mixed flows, entrained and entrapped air, as the distance from the free surface increases, the development process of the air–water structure is predominant entrapped air–coexistence of entrained and entrapped air–entrained air. For the bubble amount and chord length cumulations as shown in Figure 4 and Figure 5, the growth trend in the low-air-concentration region (C < 0.40) is mainly identical for different slopes and flow turbulence conditions, while the difference of growth trends between high- and low-air-concentration regions reduces for greater α and Re0. When the air concentration is about 0.50 ~ 0.60, the entrapped air accounts for a large part of the concentration for α = 13.5° and Re0 = 2.0 × 10⁵ (Figure 3b and Figure 5a, x/d0 = 46), while for α = 28° and Re0 = 2.6 × 10⁵ (Figure 3c,d and Figure 5b, x/d0 = 52.7), the main air–water structure is individual entrained air bubbles. This indicates that the air–water structure has homogeneity in the low-air-concentration region of self-aerated flows. The effects of chute slope and flow turbulence on the difference in high-air-concentration regions will be discussed in the following section.

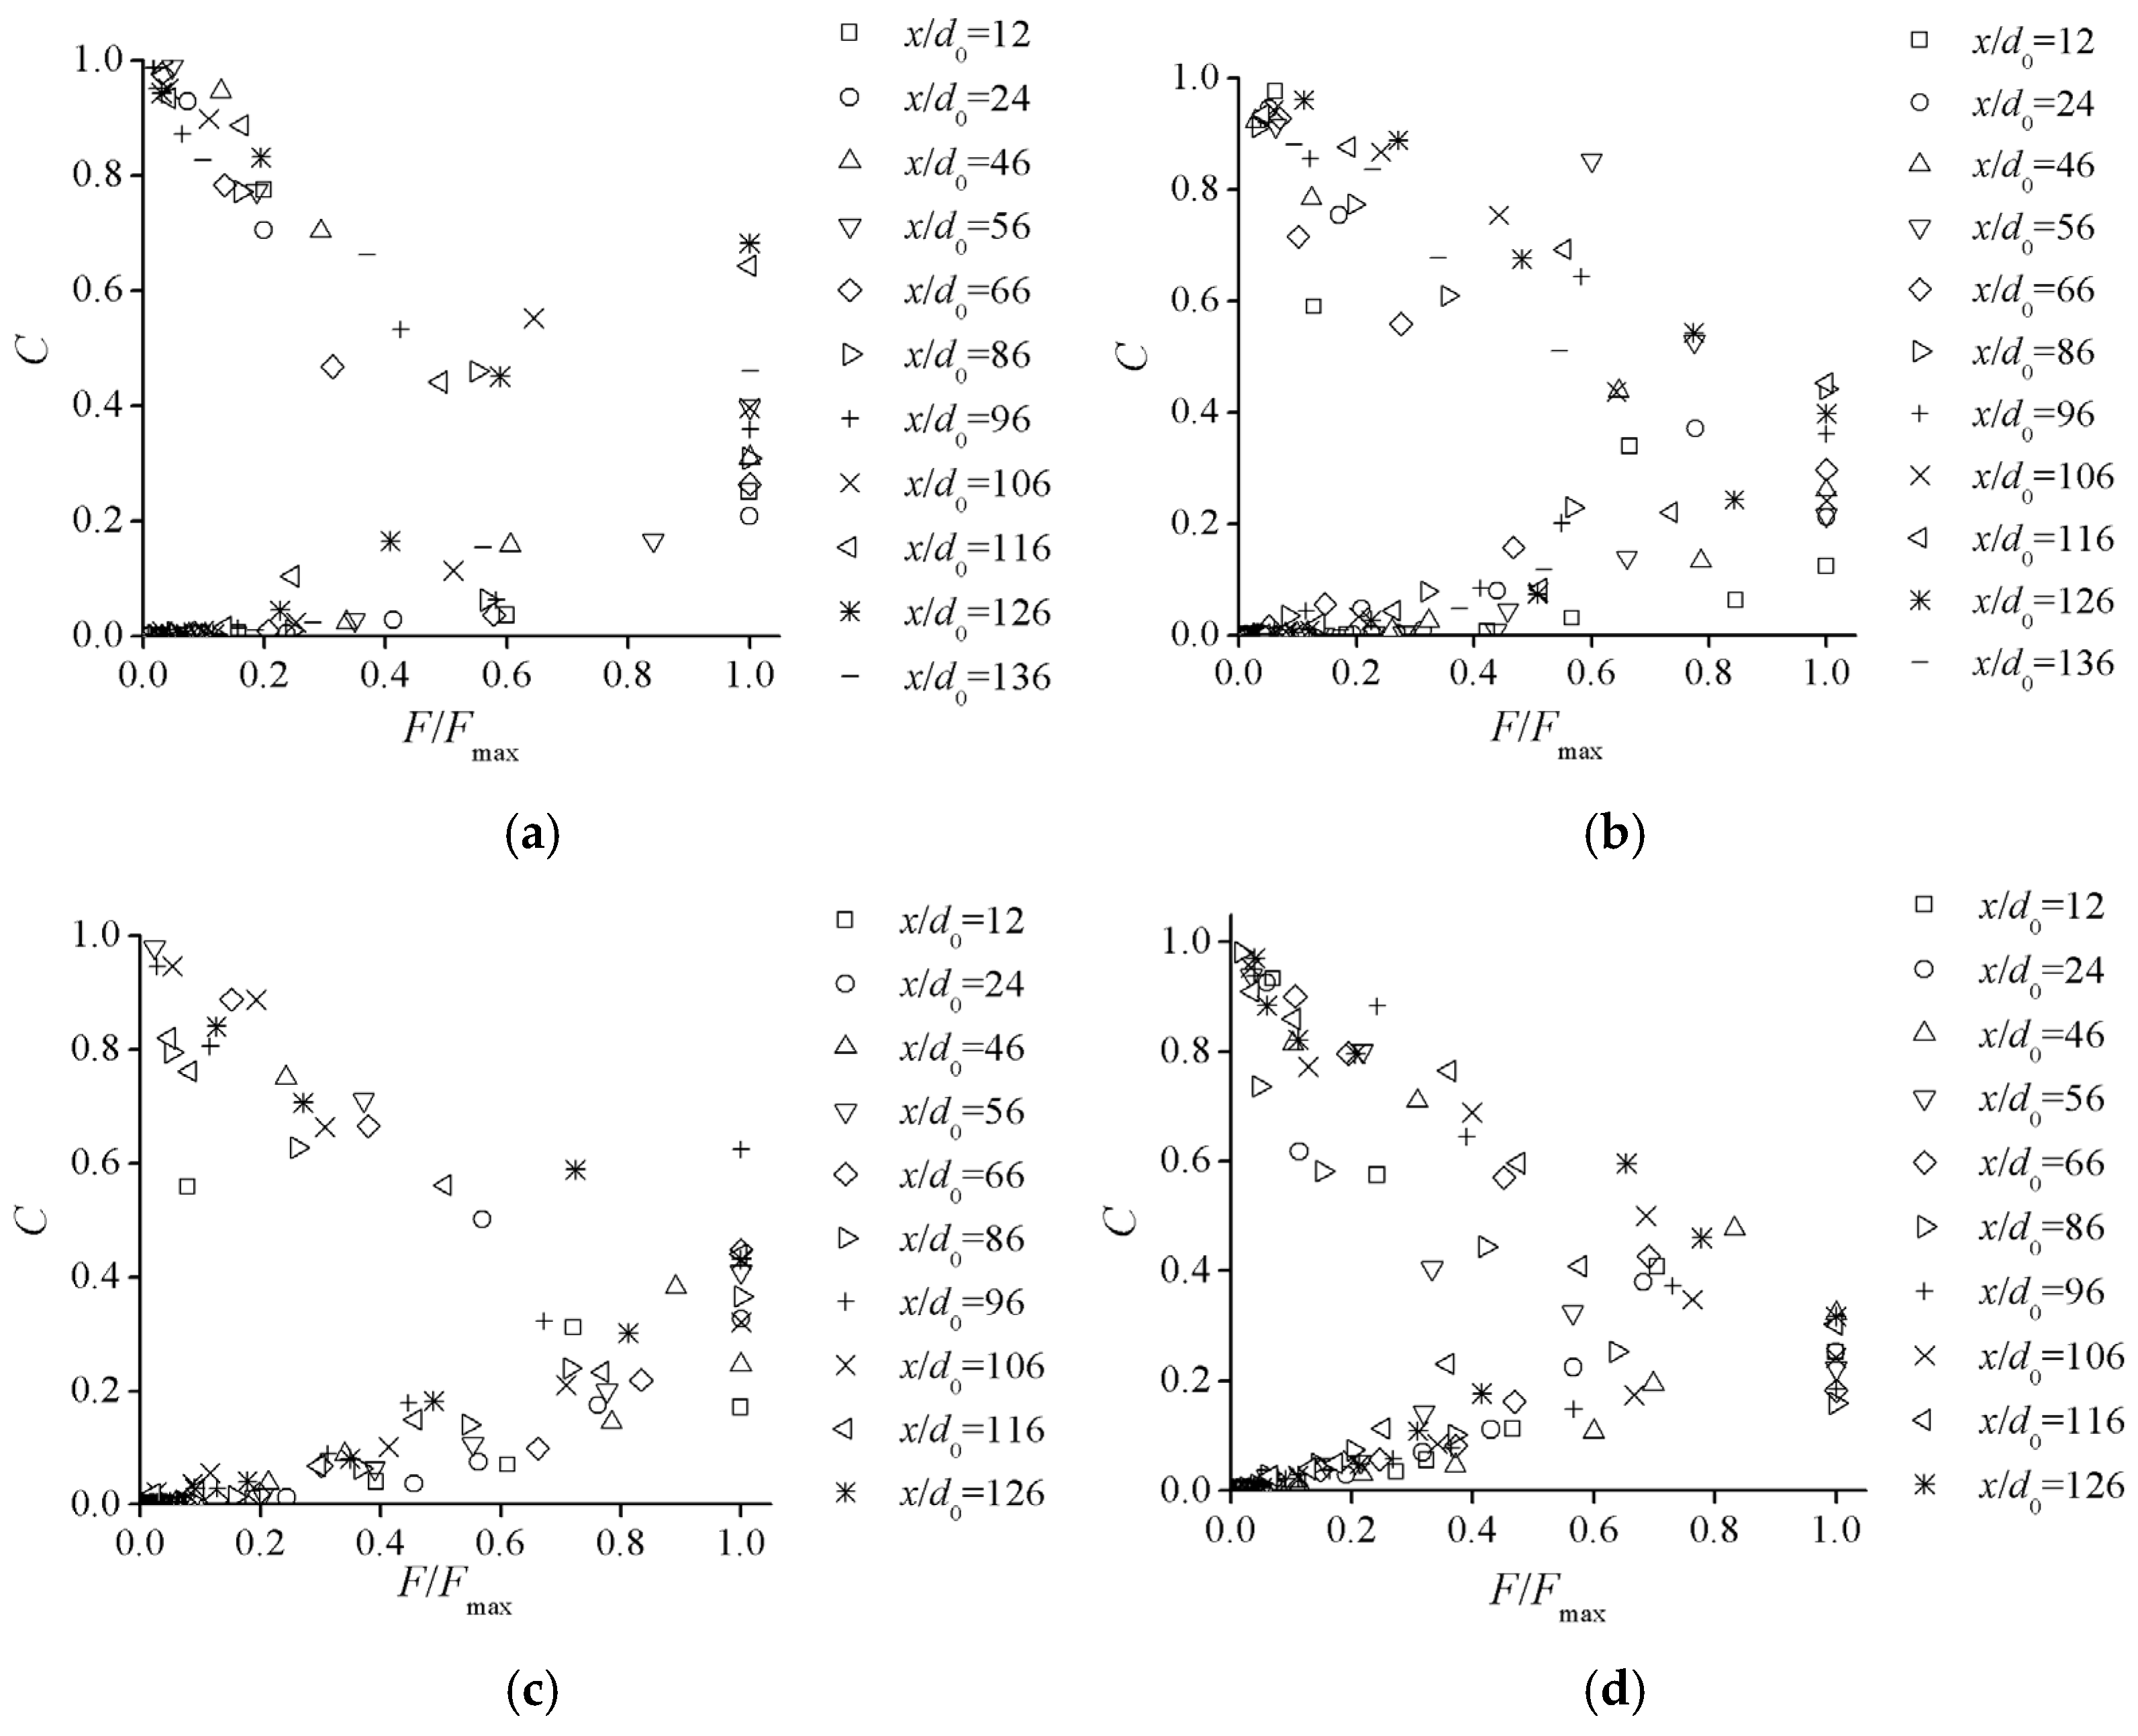
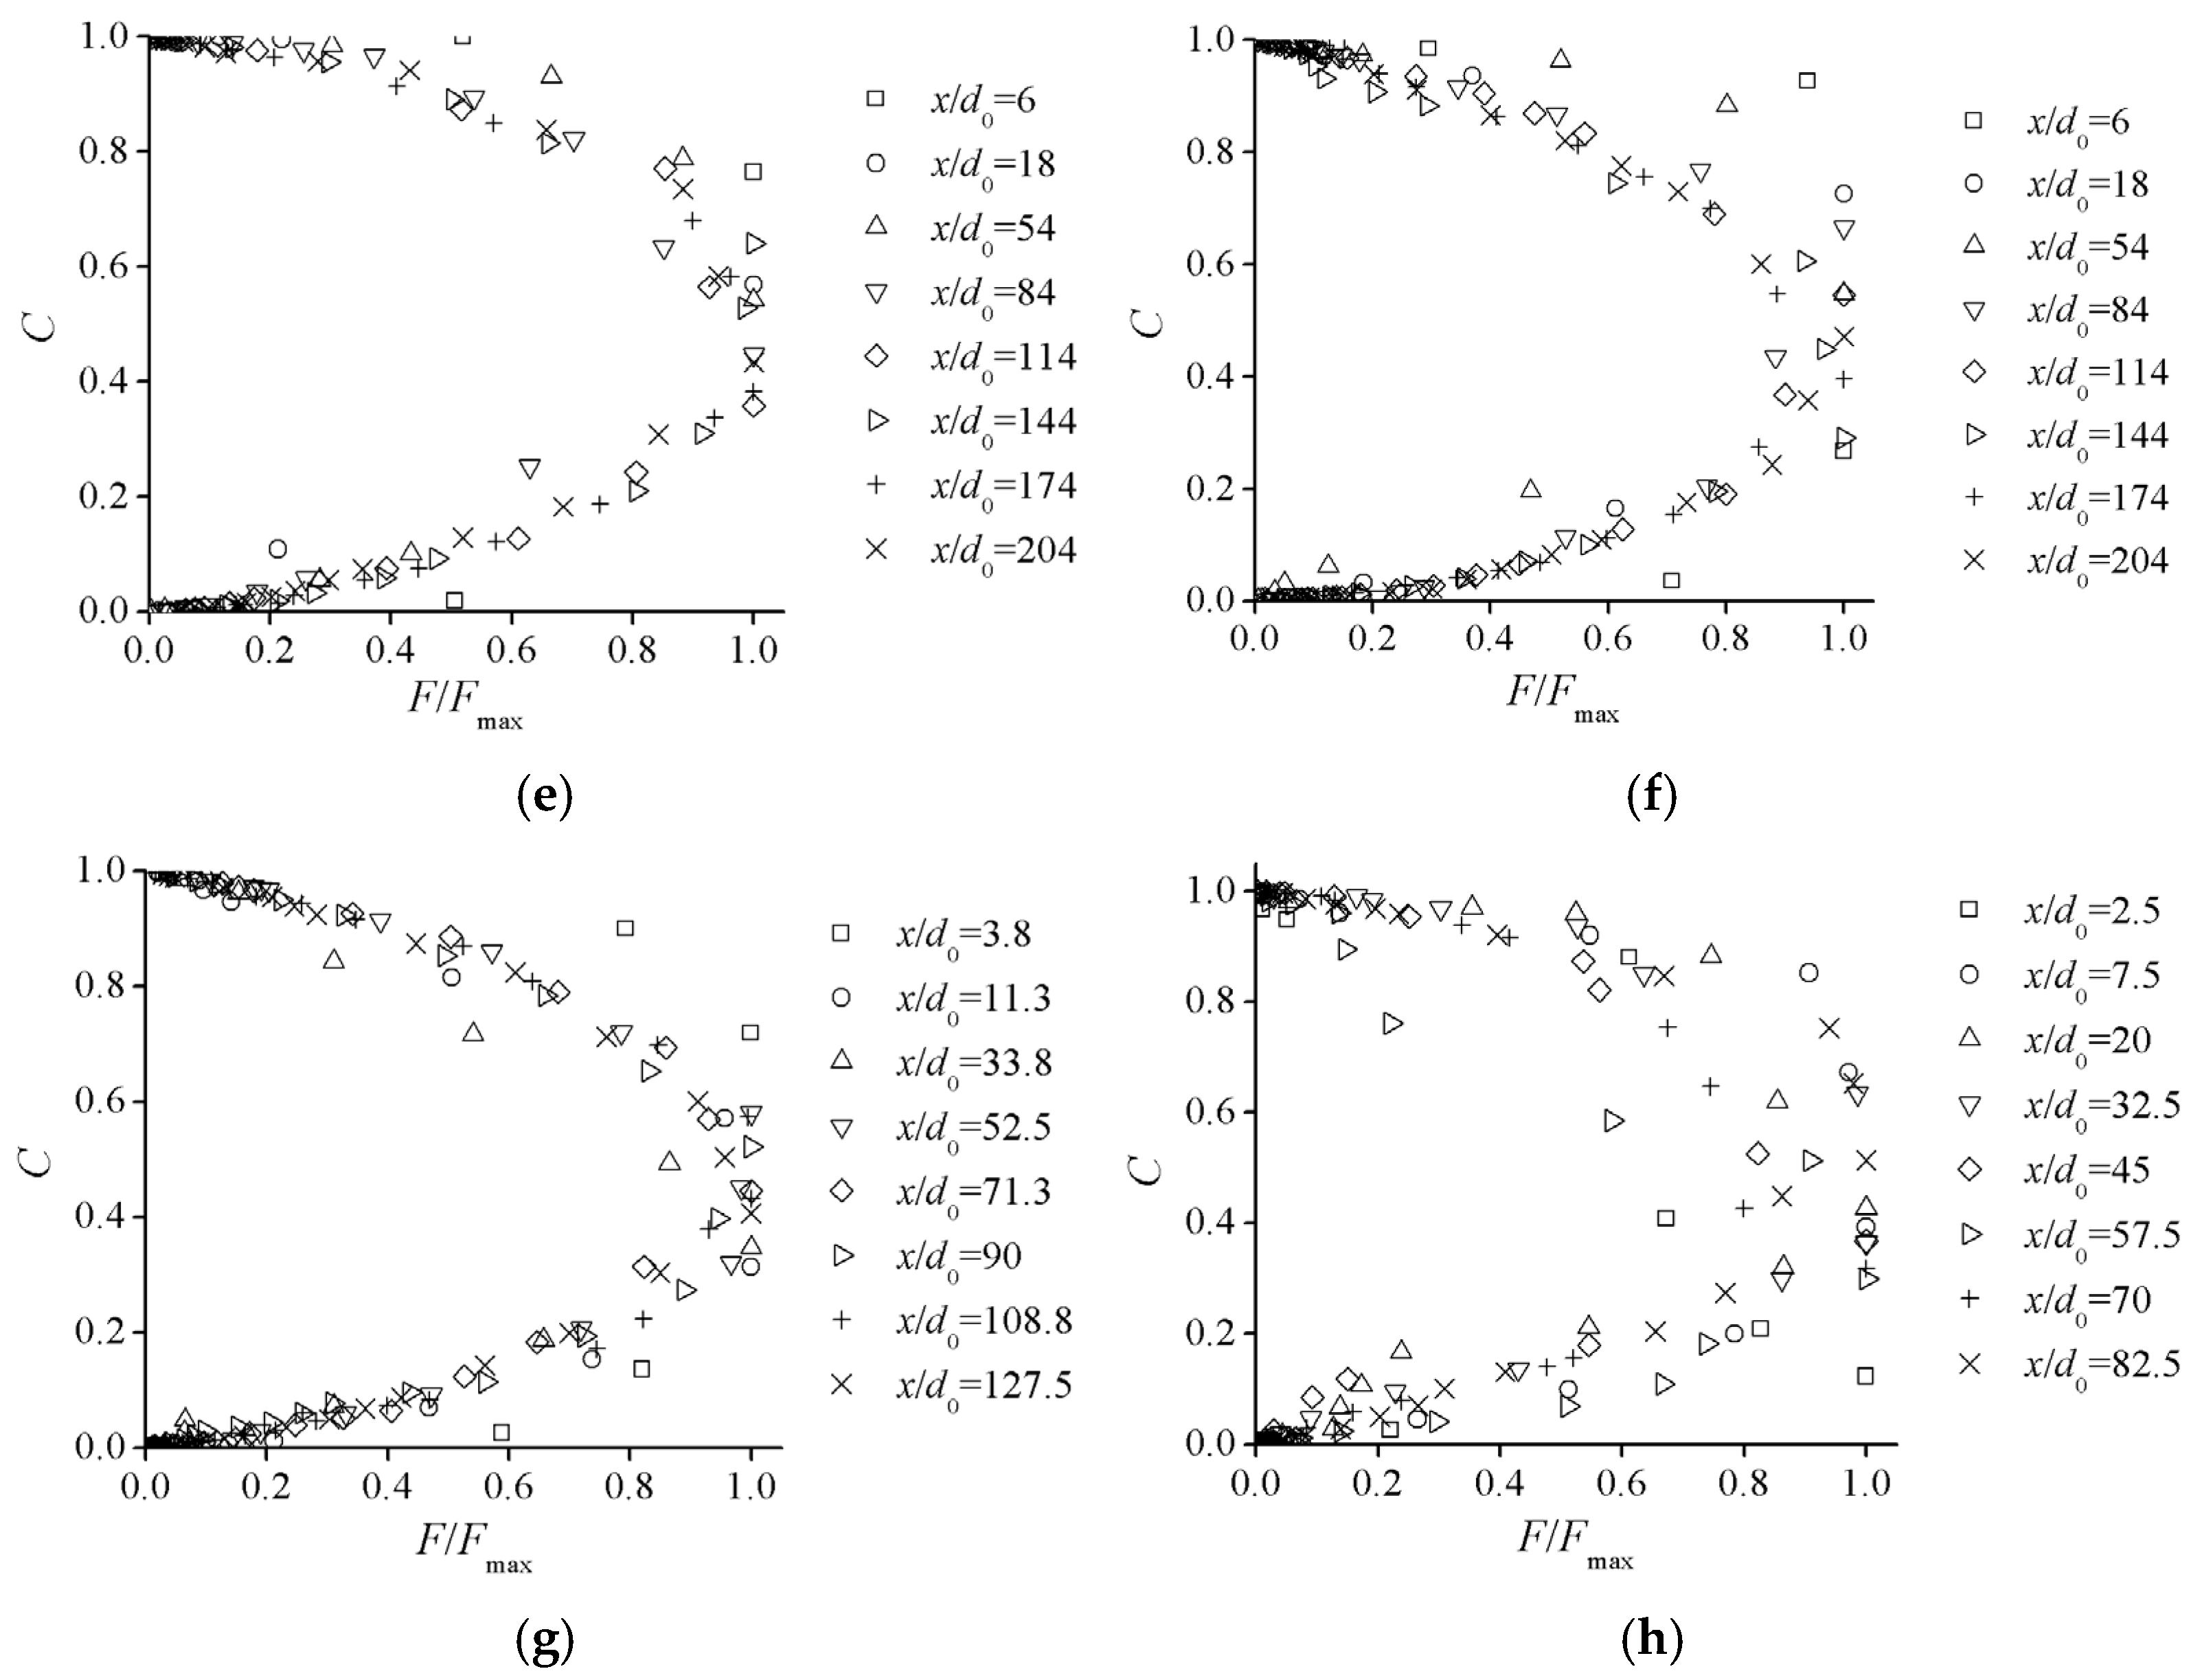
3.2. Air–Water Transfer Frequency in Aeration Regions

Figure 6 shows the relationship between air–water transfer frequency and air concentration in non-uniform self-aerated regions. For a small chute slope (α = 13.5°), the position of maximum frequency is located mainly in the low-air-concentration region (0.20 < C < 0.40). With the increase in chute slope, the range of air concentration variation of the maximum frequency CFmax extends, and it mainly varies from 0.20 to 0.60 for α = 28°. This confirms the cross-section profile of air–water structures, ranging from predominant surface deformation to individual bubbles, as presented by air chord size distributions.
Comparing the distributions of F/Fmax(C) for identical α, the distribution profiles are almost the same with the variation of Re0. This indicates that the flow turbulence condition does not affect the development process of the air–water structure in self-aerated flows. For the identical flow turbulence conditions (Figure 6b,c,e), the frequency distribution is mainly similar in the low-air-concentration region, and the variation of slope mainly changes the F/Fmax(C) distribution in the high-air-concentration region. For a greater slope, as the air concentration and distance from free surface decrease, the variation gradient of air–water transfer frequency is greater than that for a small slope condition. This is mainly because the chute slope variation changes the air–water flow structure in the highly-aerated region.
The effect of chute slope is mainly due to the change in the restraint of gravity on the surface movement under turbulent fluctuation pressure (p′) in the vertical direction, as shown in Figure 7. When α = 0°, the gravity G totally restrains the surface deformation in the vertical direction, while the effect of G on vertical direction is neglected when the flow is vertical wall-jet (α = 90°). Thus the scale of roughness decreases with the increase in chute slope, and the bubble entrainment and water drop formation occur much more easily. Based on the analysis in the above section, the pronounced preponderance of small bubble size in the high-concentration-region confirms this deduction (Figure 4). Small-scale air–water structures, like individual air bubbles, water drops, and small-scale roughness, make a great contribution to the air–water transfer frequency increase. For the low-air-concentration region, the air in the flow is mainly entrained individual bubbles for both small and large slopes; thus, the distributions of F/Fmax(C) remain unchanged.
The air concentration of the maximum air–water transfer frequency fluctuates for different slope conditions, which is due to the non-uniform flow conditions. The average value at the same x/d0 CFmax is used to descript the development of air–water properties as the mixed flow develops downstream, as shown in Figure 8. CFmax increases gradually downstream as the process of air–water mixture development progresses. With α becoming larger, the value of CFmax increases and the maximum position of Fmax is located at a relatively higher-aeration zone. The air concentration of maximum frequency moves to the position where CFmax = 0.50. A previous study [16] showed that the bubble frequency profiles exhibited a maximum value at about C = 0.50 for fully developed uniform regions of self-aerated flow. It can be deduced from the data of the non-uniform region that the development of self-aeration is a process of air–water transferring equilibrium. Based on experimental data, CFmax in the non-uniform region can be represented by an approximate function of x/d0 and α, given as follows:
C F max = ( 0.0034 × cos α 0.0021 ) x d 0 + 0.8 × sin α
This is an empirical relation between the microscopic CFmax and macroscopic properties based on physical data. The analogy of the variation trend between the data and calculated values results in a reasonable approximation of the air–water mixture process in the non-uniform region. The present results apply to 1.1 × 10⁵ < Re0 < 3.8 × 10⁵, 13.5° < α < 28°, 2.5 < x/d0 < 150. It should be noted that the specific value of x/d0 for CFmax = 0.50 cannot be considered a determination factor for the developing length of the non-uniform self-aerated region. According to the previous analysis on self-aeration developing length [7,26,37], the specific lengths of flat chute flows (α < 30°) deduced from the independent average cross-sectional air concentration along the streamwise air–water flow were mainly larger than x/d0 = 200–300. Compared to the present analysis of analogous flat chutes, the related distance length ranges from 120–200, which is shorter than the full air–water mixture distance. This indicates that the relation between bubble frequency and air concentration represents a moderate level of air entrainment penetration and mixture with water. The process of bubbles colliding and merging, accompanied by the probability distribution shape variation for identical air concentrations, is the primary feature for the further air–water mixture process in non-uniform self-aerated flows.
Further, while the analogy does not fully explain the air–water fragmentation level due to the complex air element shape and bubble size distribution evolutions [38], the relation of air concentration and bubble frequency can give some insights into the air bubble chord length distribution evolution. For the low-air-concentration region within small-sized bubbles, the approximately standard bubble frequency distributions are well represented by the stable self-similarity of the probability distribution of air chord length. Thus, the low-aeration feature in the non-uniform region is the result of bubble penetration into the water and the diffusion area’s expansion in the flow cross-section. With the increase in bubble size in high-air-concentration regions, the bubble frequency distribution evolution is affected by the chute slope and flow conditions, resulting in the shape change of air chord length distribution, as shown in Figure 3. The disproportionate trend of air sample size indicates that in the high-aeration-region near the free surface, the self-aeration development is dominated by large entrained air scale evolutions. Consequently, combined with the previous layer model for self-aerated flows [9,26,27], the non-uniform self-aeration development is characterized by different flow layer evolutions of both macroscopic and microscopic air–water structures.
The limited boundaries of self-aeration in air–water flows are considered as the position y90 and y2, respectively, where the air concentration is 0.90 and 0.02. The unit area dC is defined as follows:
d C = y 90 y 2
The characteristic normal distance yC is as follows:
y C = y y 2
The dimensional distance in self-aeration region is as follows:
y C d C = y y 2 y 90 y 2
Figure 9 shows the air–water transfer frequency distributions in dC for different flow and slope conditions. The positions of maximum value F/Fmax oscillate for different flow cross-sections due to the present experimental flow with supercritical non-uniform conditions. The (yC/dC)Fmax represents the location of the Fmax in the self-aerated region for a certain α, and the self-aeration development hardly influences the distributions of air–water transfer frequency in the aerated region. For a certain chute slope condition, the distributions of F/Fmax show self-similarity as the function of yC/dC, with a decrease from the center of self-aeration to the upper and bottom boundaries. (yC/dC)f represents the average value of different cross-sections with the same flow turbulence Re0 conditions, and no clear trend is obtained for the effect of Re0, as shown in Figure 10. A simple normal distribution centered on (yC/dC)f is set to fit the F/Fmax distributions in dC as follows:
F F max = A 2 π σ exp ( ( ( y C / d C ) ( y C / d C ) f ) 2 2 σ 2 )
where the coefficients of A and σ are 0.625 and 0.25, respectively. Experimental data are compared with Equation (6) is shown in Figure 9, and the agreement is reasonable.
For different chute slope conditions, the value of f increases with α. indicating that the chute slope can change the distribution of air–water transfer frequency in supercritical non-uniform self-aerated flows. For the present three slopes, 13.5°, 17.5°, and 28°, the (yC/dC)f is 0.482, 0.558, and 0.582, respectively. Considering the (yC/dC)f as the most intensive air–water transfer interface, it moves more closely to the free surface with greater α. This is in agreement with the analysis of transition depth in the self-aerated flows. Straub and Anderson [2] developed the transition depth as the location of the curvature change of the air concentration profile, and based on the experimental results, the transition depth increases with the chute slope, ranging from 7.5° to 75°. This indicates the transition location moves to the free surface with the increase in α, as the present data suggest.

4. Conclusions

Microscopic air–water properties in self-aerated non-uniform flows are analyzed with a series of hydraulic experiments. Measurements of air chord length and air–water transfer frequency in self-aerated region are conducted and the relationships consisting of air concentration and self-aerated region are discussed. The following conclusions may be drawn:
For non-uniform self-aerated flows, microscopic air–water structures are primarily affected by chute slope, resulting in self-similarity of probability distribution of air chord length and air–water transfer frequency distribution in self-aerated regions. The low-aeration region manifests a stable relationship between the air concentration and air–water transfer frequency, accompanied by bubble penetration into the water and diffusion area expansion in the flow cross-section. The distribution of bubble chord length is more continuous from small to large scale in the high-air-concentration region with the increase in chute slope. In the high-aeration region near the free surface, the self-aeration development is dominated by large entrained air scale evolutions. The position of maximum air–water transfer frequency moves to the higher-aeration zone with the increase in chute slope. The variation of slope mainly changes the F/Fmax(C) distribution in the high-air-concentration region, whereas the low-air-concentration region is hardly influenced. The distribution of air–water transfer frequency fits a simple normal distribution centered on a specific location (yC/dC)f in self-aerated regions, and this specific location moves to the free surface with the increase in chute slope.

Author Contributions

Conceptualization, C.Y. and W.W.; methodology, W.W.; software, C.Y.; validation, C.Y. and W.W.; investigation, C.Y. and W.W.; resources, W.W.; data curation, C.Y. and W.W.; writing—original draft preparation, C.Y.; writing—review and editing, C.Y. and W.W.; supervision, W.W. All authors have read and agreed to the published version of the manuscript.

Funding

This research received no external funding.

Data Availability Statement

The original contributions presented in this study are included in the article. Further inquiries can be directed to the corresponding author.

Conflicts of Interest

Caiyong Yang was employed by Chongqing Survey and Design Institute of Water Resources, Electric Power and Architecture Co., Ltd. The remaining authors declare that the research was conducted in the absence of any commercial or financial relationships that could be construed as a potential conflict of interest.

References

  1. Halbronn, G.; Durand, R.; Cohen de Lara, G. Air entrainment in steeply sloping flumes. In Proceeding of 5th IAHR Congress; IAHR-ASCE: Minneapolis, MI, USA, 1953. [Google Scholar]
  2. Straub, L.G.; Anderson, A.G. Experiments on Self-aerated flow in open channels. J. Hydraul. Div. ASCE 1958, 84, 1–35. [Google Scholar] [CrossRef]
  3. Thandaveswara, B.S. Self-Aerated Flow Characteristics in Developing Zones and in Hydraulic Jumps. Ph.D. Thesis, Deptement of Civil Engrg India, Institute of Science Bangalore, Bangalore, India, 1974. [Google Scholar]
  4. Valero, D.; Bung, D.B. Reformulating self-aeration in hydraulic structures: Turbulent growth of free surface perturbations leading to air entrainment. Int. J. Multiph. Flow 2018, 84, 127–142. [Google Scholar] [CrossRef]
  5. Chen, X.P.; Xi, R.Z.; Shao, D.C. New concept of air entrainment effect on mitigating cavitation damage. J. Hydraul. Eng. 2003, 34, 70–74. (In Chinese) [Google Scholar]
  6. Wilhelms, S.C. Self-Aerated Spillway Flow. Ph.D. Thesis, University of Minnesota, Minneapolis, MN, USA, 1997. [Google Scholar]
  7. Chanson, H. Self-aerated flows on chutes and spillways. J. Hydraul. Eng. 1993, 119, 220–243. [Google Scholar] [CrossRef]
  8. Hager, W.H. Uniform aerated chute flow. J. Hydraul. Eng. 1991, 118, 528–533. [Google Scholar] [CrossRef]
  9. Wood, I.R. Uniform region of self-aerated flow. J. Hydraul. Eng. 1983, 109, 447–461. [Google Scholar] [CrossRef]
  10. Cain, P.; Wood, I.R. Instrumentation for aerated flow on spillways. J. Hydraul. Div. 1981, 107, 1407–1424. [Google Scholar] [CrossRef]
  11. Cain, P.; Wood, I.R. Measurements of self-aerated flow on a spillway. J. Hydraul. Div. 1981, 107, 1425–1444. [Google Scholar] [CrossRef]
  12. Chanson, H.; Carosi, G. Turbulent time and length scale measurements in high-velocity open channel flows. Exp. Fluids 2007, 42, 385–401. [Google Scholar] [CrossRef]
  13. Sene, K.J.; Hunt, J.C.R.; Thomas, N.H. The role of coherent structures in bubble transport by turbulent shear flows. J. Fluid. Mech. 1994, 259, 219–240. [Google Scholar] [CrossRef]
  14. Zhang, G.; Wang, H.; Chanson, H. Turbulence and aeration in hydraulic jumps: Free-surface fluctuation and integral turbulent scale measurements. Environ. Fluid Mech. 2013, 13, 189–204. [Google Scholar] [CrossRef]
  15. Gulliver, J.S.; Thene, J.R.; Rindels, A.J. Indexing gas transfer in self-aerated flows. J. Environ. Eng. 1990, 116, 503–522. [Google Scholar] [CrossRef]
  16. Chanson, H. Air bubble entrainment in open channels. Flow structure and bubble size distributions. Int. J. Multiph. Flow 1997, 23, 193–203. [Google Scholar] [CrossRef]
  17. Toombes, L.; Chanson, H. Surface waves and roughness in self-aerated supercritical Flow. Environ. Fluid Mech. 2007, 7, 259–270. [Google Scholar] [CrossRef]
  18. Felder, S.; Chanson, H. Triple decomposition technique in air–water flows: Application to instationary flows on a stepped spillway. Int. J. Multiph. Flow 2014, 58, 139–153. [Google Scholar] [CrossRef]
  19. Guenther, P.; Felder, S.; Chanson, H. Flow aeration, cavity processes and energy dissipation on flat and pooled stepped spillways for embankments. Environ. Fluid Mech. 2013, 13, 503–525. [Google Scholar] [CrossRef]
  20. Pfister, M.; Hager, W.H. Self-entrainment of air on stepped spillways. Int. J. Multiph. Flow 2011, 37, 99–107. [Google Scholar] [CrossRef]
  21. Pagliara, S. Self-aeration and friction over rock chutes in uniform flow conditions. J. Hydraul. Eng. 2010, 136, 447–461. [Google Scholar] [CrossRef]
  22. Pagliara, S.; Carnacina, I.; Roshni, T. Inception point and air entrainment on flows under macroroughness condition. J. Environ. Eng. 2011, 137, 629–638. [Google Scholar] [CrossRef]
  23. Robinson, K.M.; Rice, C.E.; Kadavy, K.C. Design of rock chutes. Am. Soc. Agric. Eng. Trans. 1988, 41, 621–626. [Google Scholar] [CrossRef]
  24. Toombes, L. Experimental Study of Air-Water Flow Properties on Low-Gradient Stepped Cascades. Ph.D. Thesis, University of Queensland, Brisbane, Australia, 2002. [Google Scholar]
  25. Kramer, M. Turbulent free-surface in self-aerated flows: Superposition of entrapped and entrained air. J. Fluid Mech. 2024, 980, A25. [Google Scholar] [CrossRef]
  26. Wilhelms, S.C.; Gulliver, J.S. Bubbles and waves description of self-aerated spillway flow. J. Hydraul. Res. 2005, 43, 522–531. [Google Scholar] [CrossRef]
  27. Wei, W.; Deng, J. Free surface aeration and devel opment dependence in chute flows. Sci. Rep. 2022, 12, 1477. [Google Scholar]
  28. Felder, S.; Chanson, H. Energy dissipation, flow resistance and gas-liquid interfacial area in skimming flows on moderate-slope stepped spillways. Environ. Fluid Mech. 2009, 9, 427–441. [Google Scholar] [CrossRef]
  29. Kramer, M.; Valero, D. Linking turbulent waves and bubble diffusion in self-aerated open-channel flows: Two state air concentration. J. Fluid Mech. 2023, 966, A37. [Google Scholar] [CrossRef]
  30. Deane, G.B.; Stokes, M.D. Scale dependence of bubble creation mechanisms in breaking waves. Nature 2002, 418, 834–844. [Google Scholar] [CrossRef]
  31. Vela-Martín, A.; Avila, M. Memoryless drop breakup in turbulence. Sci. Adv. 2022, 8, eabp9561. [Google Scholar] [CrossRef]
  32. Wei, W.; Xu, W.; Deng, J.; Tian, Z.; Zhang, F. Bubble formation and scale dependence in free-surface air entrainment. Sci. Rep. 2019, 9, 11008. [Google Scholar] [CrossRef]
  33. Wei, W.; Xu, W.; Deng, J.; Guo, Y. Self-aeration development and fully cross-sectional air diffusion in high-speed open channel flows. J. Hydraul. Res. 2022, 60, 445–459. [Google Scholar] [CrossRef]
  34. Hsiao, F.; Lamb, O.P.; Pilch, M. Report on the High Velocity Flow of Water in a Small Rectangular Channel; Project Report Advanced Hydraulic Laboratory Nos. CE 194 and CE 195 the University of Minnesota: Minneapolis, MN, USA, 1947. [Google Scholar]
  35. Chen, X.P.; Shao, D.C. Measuring bubbles sizes in aerated flow. In Proceedings of the Conference of Global Chinese Scholars on Hydrodynamics, Shanghai, China, 16 August 2006; pp. 470–474. [Google Scholar]
  36. Deng, J.; Wei, W.R.; Xu, W.L.; Tian, Z.; Zhang, F.X. Experimental study on air-phase frequency in self-aerated flow. Water Manag.-ICE 2015, 168, 153–161. [Google Scholar] [CrossRef]
  37. Anwar, H.O. Discussion on “Self-aerated flows on chutes and spillways”. J. Hydraul. Eng. 1994, 120, 778–779. [Google Scholar] [CrossRef]
  38. Wei, W.; Xu, W.; Deng, J.; Tian, Z.; Zhang, F. Experimental study of air-water interface properties in self-aerated flows. J. Hydrodyn. 2019, 31, 940–948. [Google Scholar] [CrossRef]
Figure 1. (a) Experimental facility and air–water flow tests; (b) schematic depiction of self-aerated developing flows.
Water 17 01587 g001
Figure 2. Profiles of air concentration and bubble frequency along the flow development: (a) C(y/y90), α = 13.5°, Re0 = 2.0 × 10⁵; (b) F(y/y90), α = 13.5°, Re0 = 2.0 × 10⁵; (c) C(y/y90), α = 28°, Re0 = 3.4 × 10⁵; (d) F(y/y90), α = 28°, Re0 = 3.4 × 10⁵ [16].
Water 17 01587 g002
Figure 3. Comparisons of air chord size distributions (black line for α = 13.5°, Re0 = 2.0 × 10⁵, red line for α = 28°, Re0 = 2.6 × 10⁵): (a) C = 0.7352 and C = 0.9463; (b) C = 0.5684 and C = 0.9674; (c) C = 0.2080 and C = 0.5711; (d) C = 0.1160 and C = 0.5799; (e) C = 0.0111 and C = 0.0125; (f) C = 0.0141 and C = 0.0208.
Water 17 01587 g003
Figure 4. Comparisons of air amount cumulations. (a) α = 13.5° and Re0 = 2.0 × 10⁵; (b) α = 28° and Re0 = 2.6 × 10⁵.
Water 17 01587 g004
Figure 5. Comparisons of air chord length cumulations. (a) α = 13.5° and Re0 = 2.0 × 10⁵; (b) α = 28° and Re0 = 2.6 × 10⁵.
Water 17 01587 g005
Figure 6. Comparisons of the relationship between bubble frequency and air concentration: (a) α = 13.5°, Re0 = 1.1 × 10⁵; (b) α = 13.5°, Re0 = 1.8 × 10⁵; (c) α = 17.5°, Re0 = 1.8 × 10⁵; (d) α = 17.5°, Re0 = 2.4 × 10⁵; (e) α = 28°, Re0 = 1.8 × 10⁵; (f) α = 28°, Re0 = 2.6 × 10⁵; (g) α = 28°, Re0 = 3.4 × 10⁵; (h) α = 28°, Re0 = 3.6 × 10⁵.
Water 17 01587 g006aWater 17 01587 g006b
Figure 7. Effect of chute slope on air–water structure near the free surface.
Water 17 01587 g007
Figure 8. Position distributions of maximum bubble frequency.
Water 17 01587 g008
Figure 9. Air–water transfer frequency distribution in the self-aerated region: (a) α =13.5°; (b) α =17.5°; (c) α =28°.
Water 17 01587 g009
Figure 10. Effects of Re0 and α on the location of maximum air–water transfer frequency.
Water 17 01587 g010
Table 1. Test program and turbulence parameters.
α (°)d0 (m)V0 (m/s)Re0 (×105)
13.50.053.51.1
4.31.3
5.01.5
5.81.8
6.42.0
17.50.054.51.4
5.21.6
6.01.8
7.02.1
7.82.4
28.00.056.21.8
7.52.1
9.02.6
0.086.62.6
7.53.0
8.53.4
0.106.53.0
7.53.4
8.43.8
0.126.23.2
7.03.6
Disclaimer/Publisher’s Note: The statements, opinions and data contained in all publications are solely those of the individual author(s) and contributor(s) and not of MDPI and/or the editor(s). MDPI and/or the editor(s) disclaim responsibility for any injury to people or property resulting from any ideas, methods, instructions or products referred to in the content.

