
Assessing Groundwater Potential in the Kabul River Basin of Pakistan: A GIS and Analytical Hierarchy Process Approach for Sustainable Water Management

 , ,
, ,  and
and 
Abstract
:1. Introduction
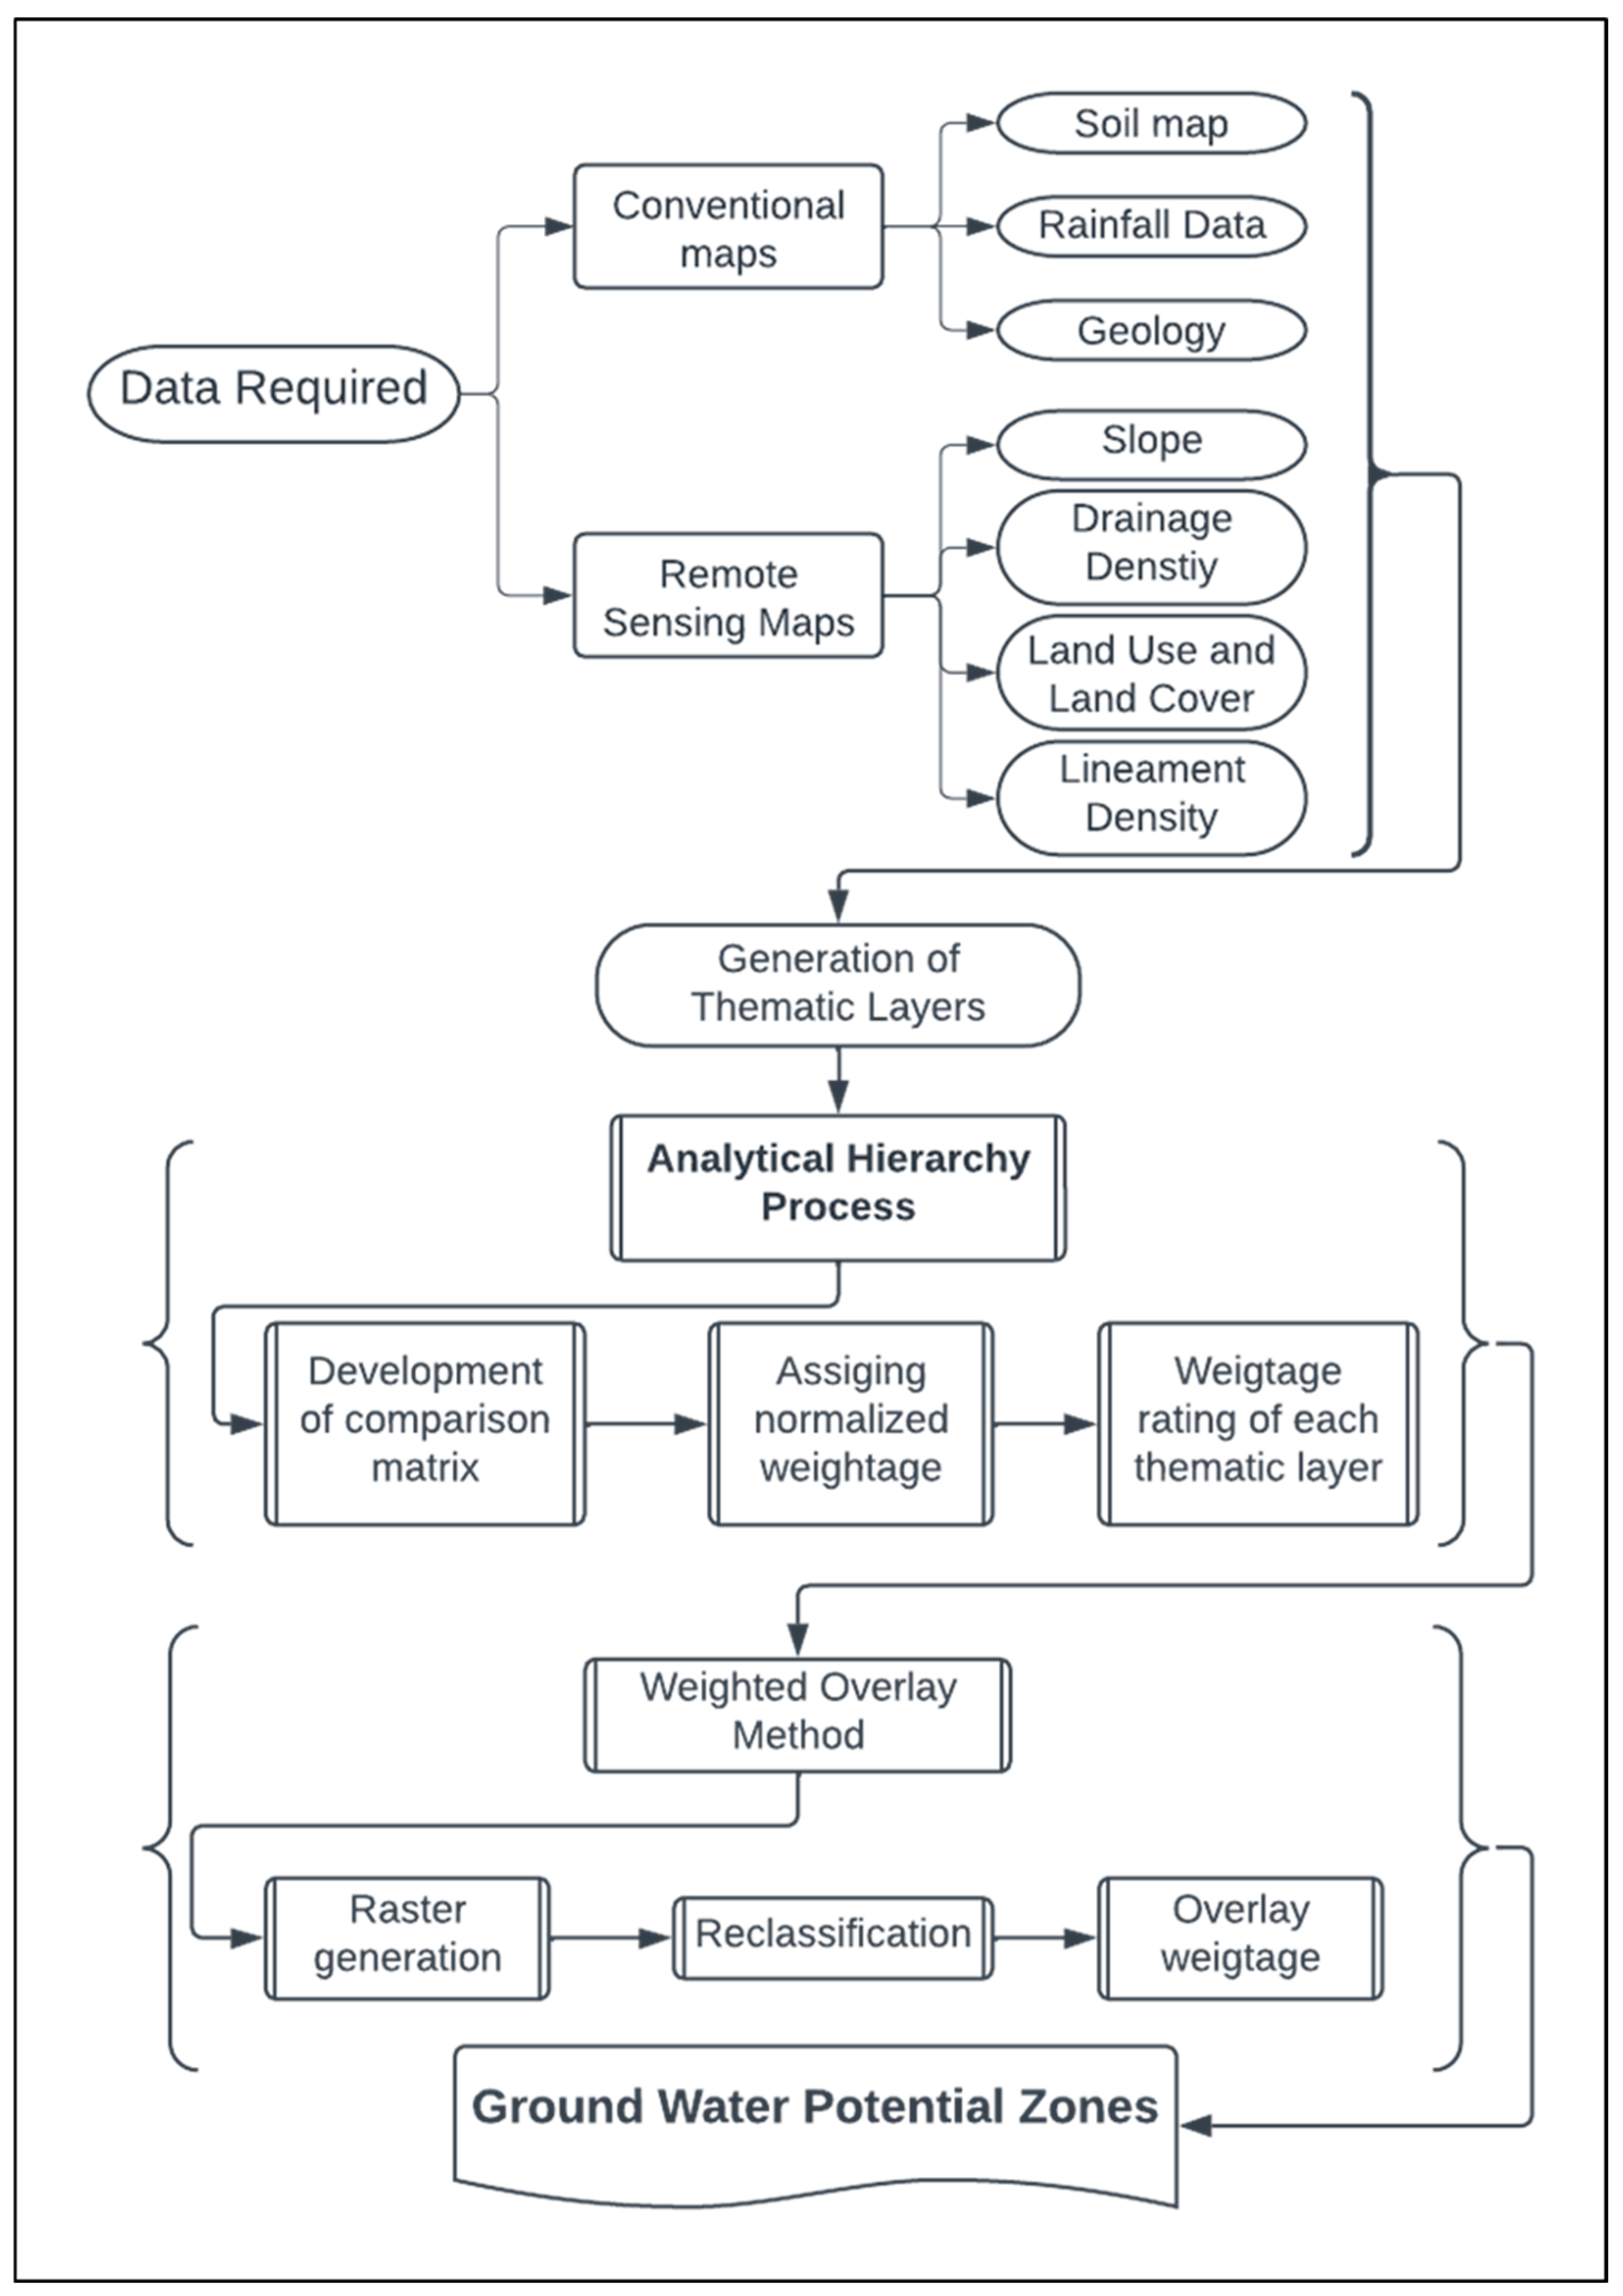
2. Materials and Methods
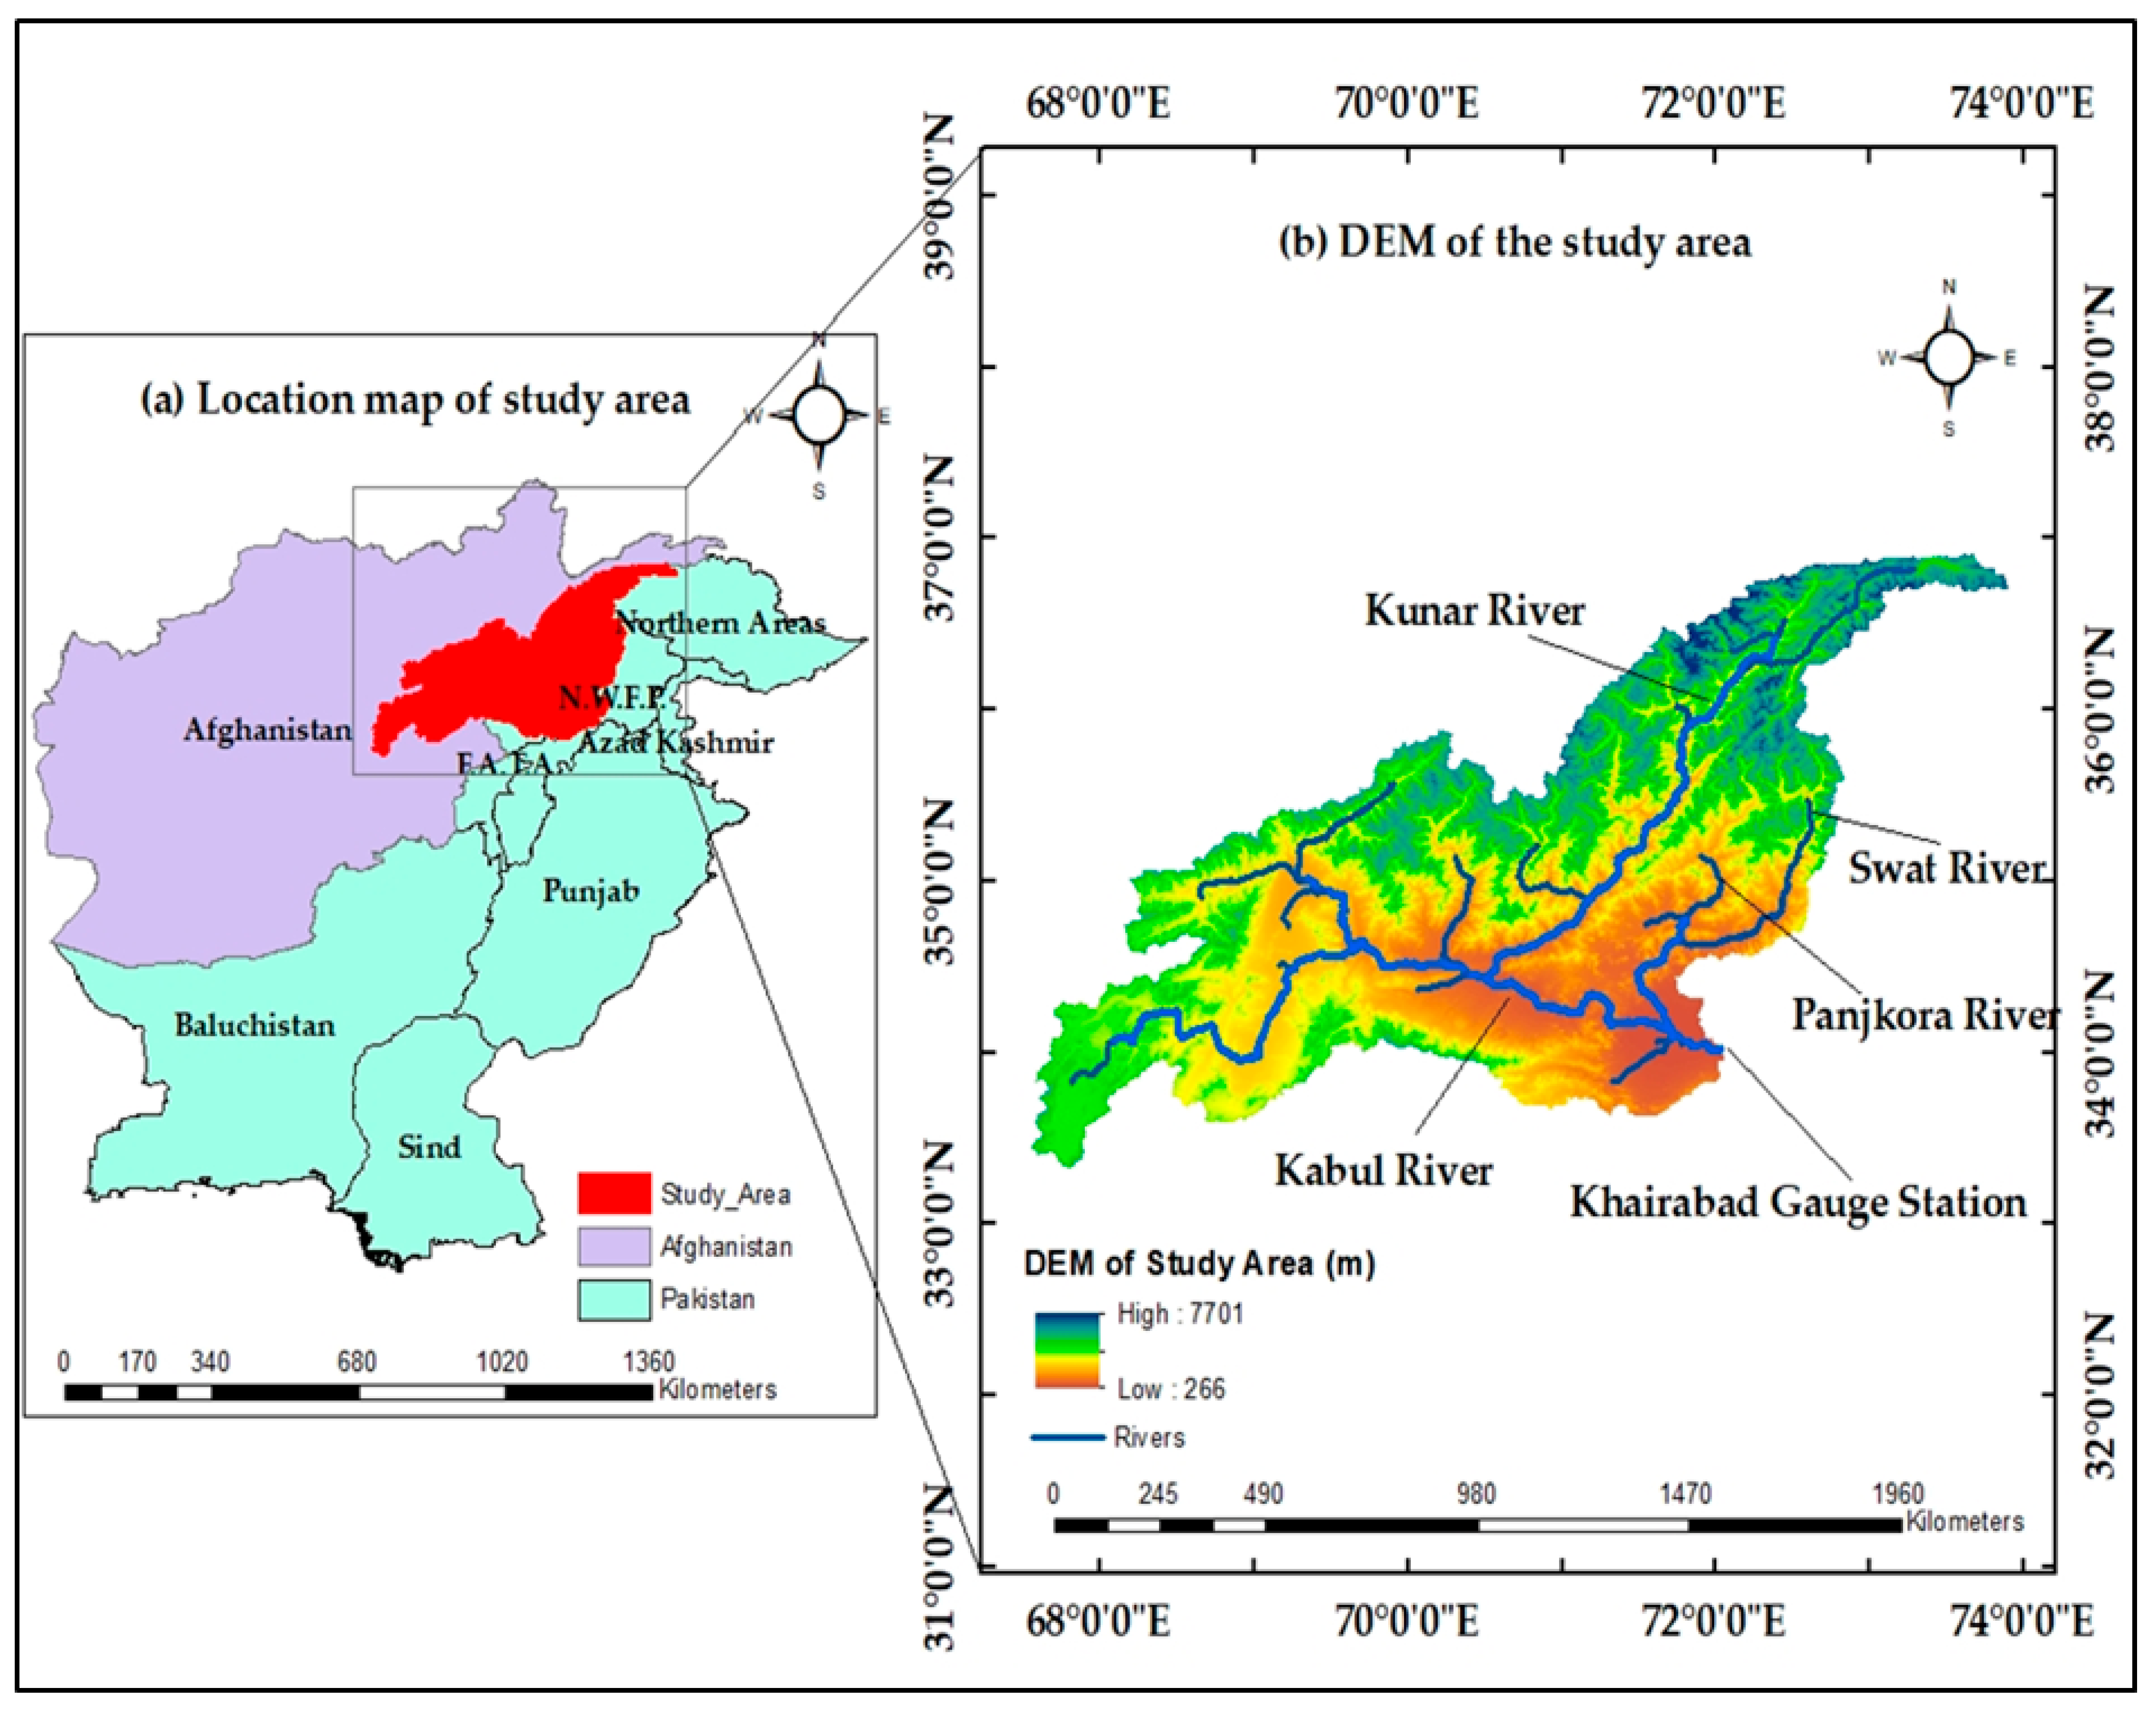
2.1. Description of Study Area
2.2. Factors Influencing the Groundwater Potential Zones
2.3. Analytical Hierarchy Process (AHP)
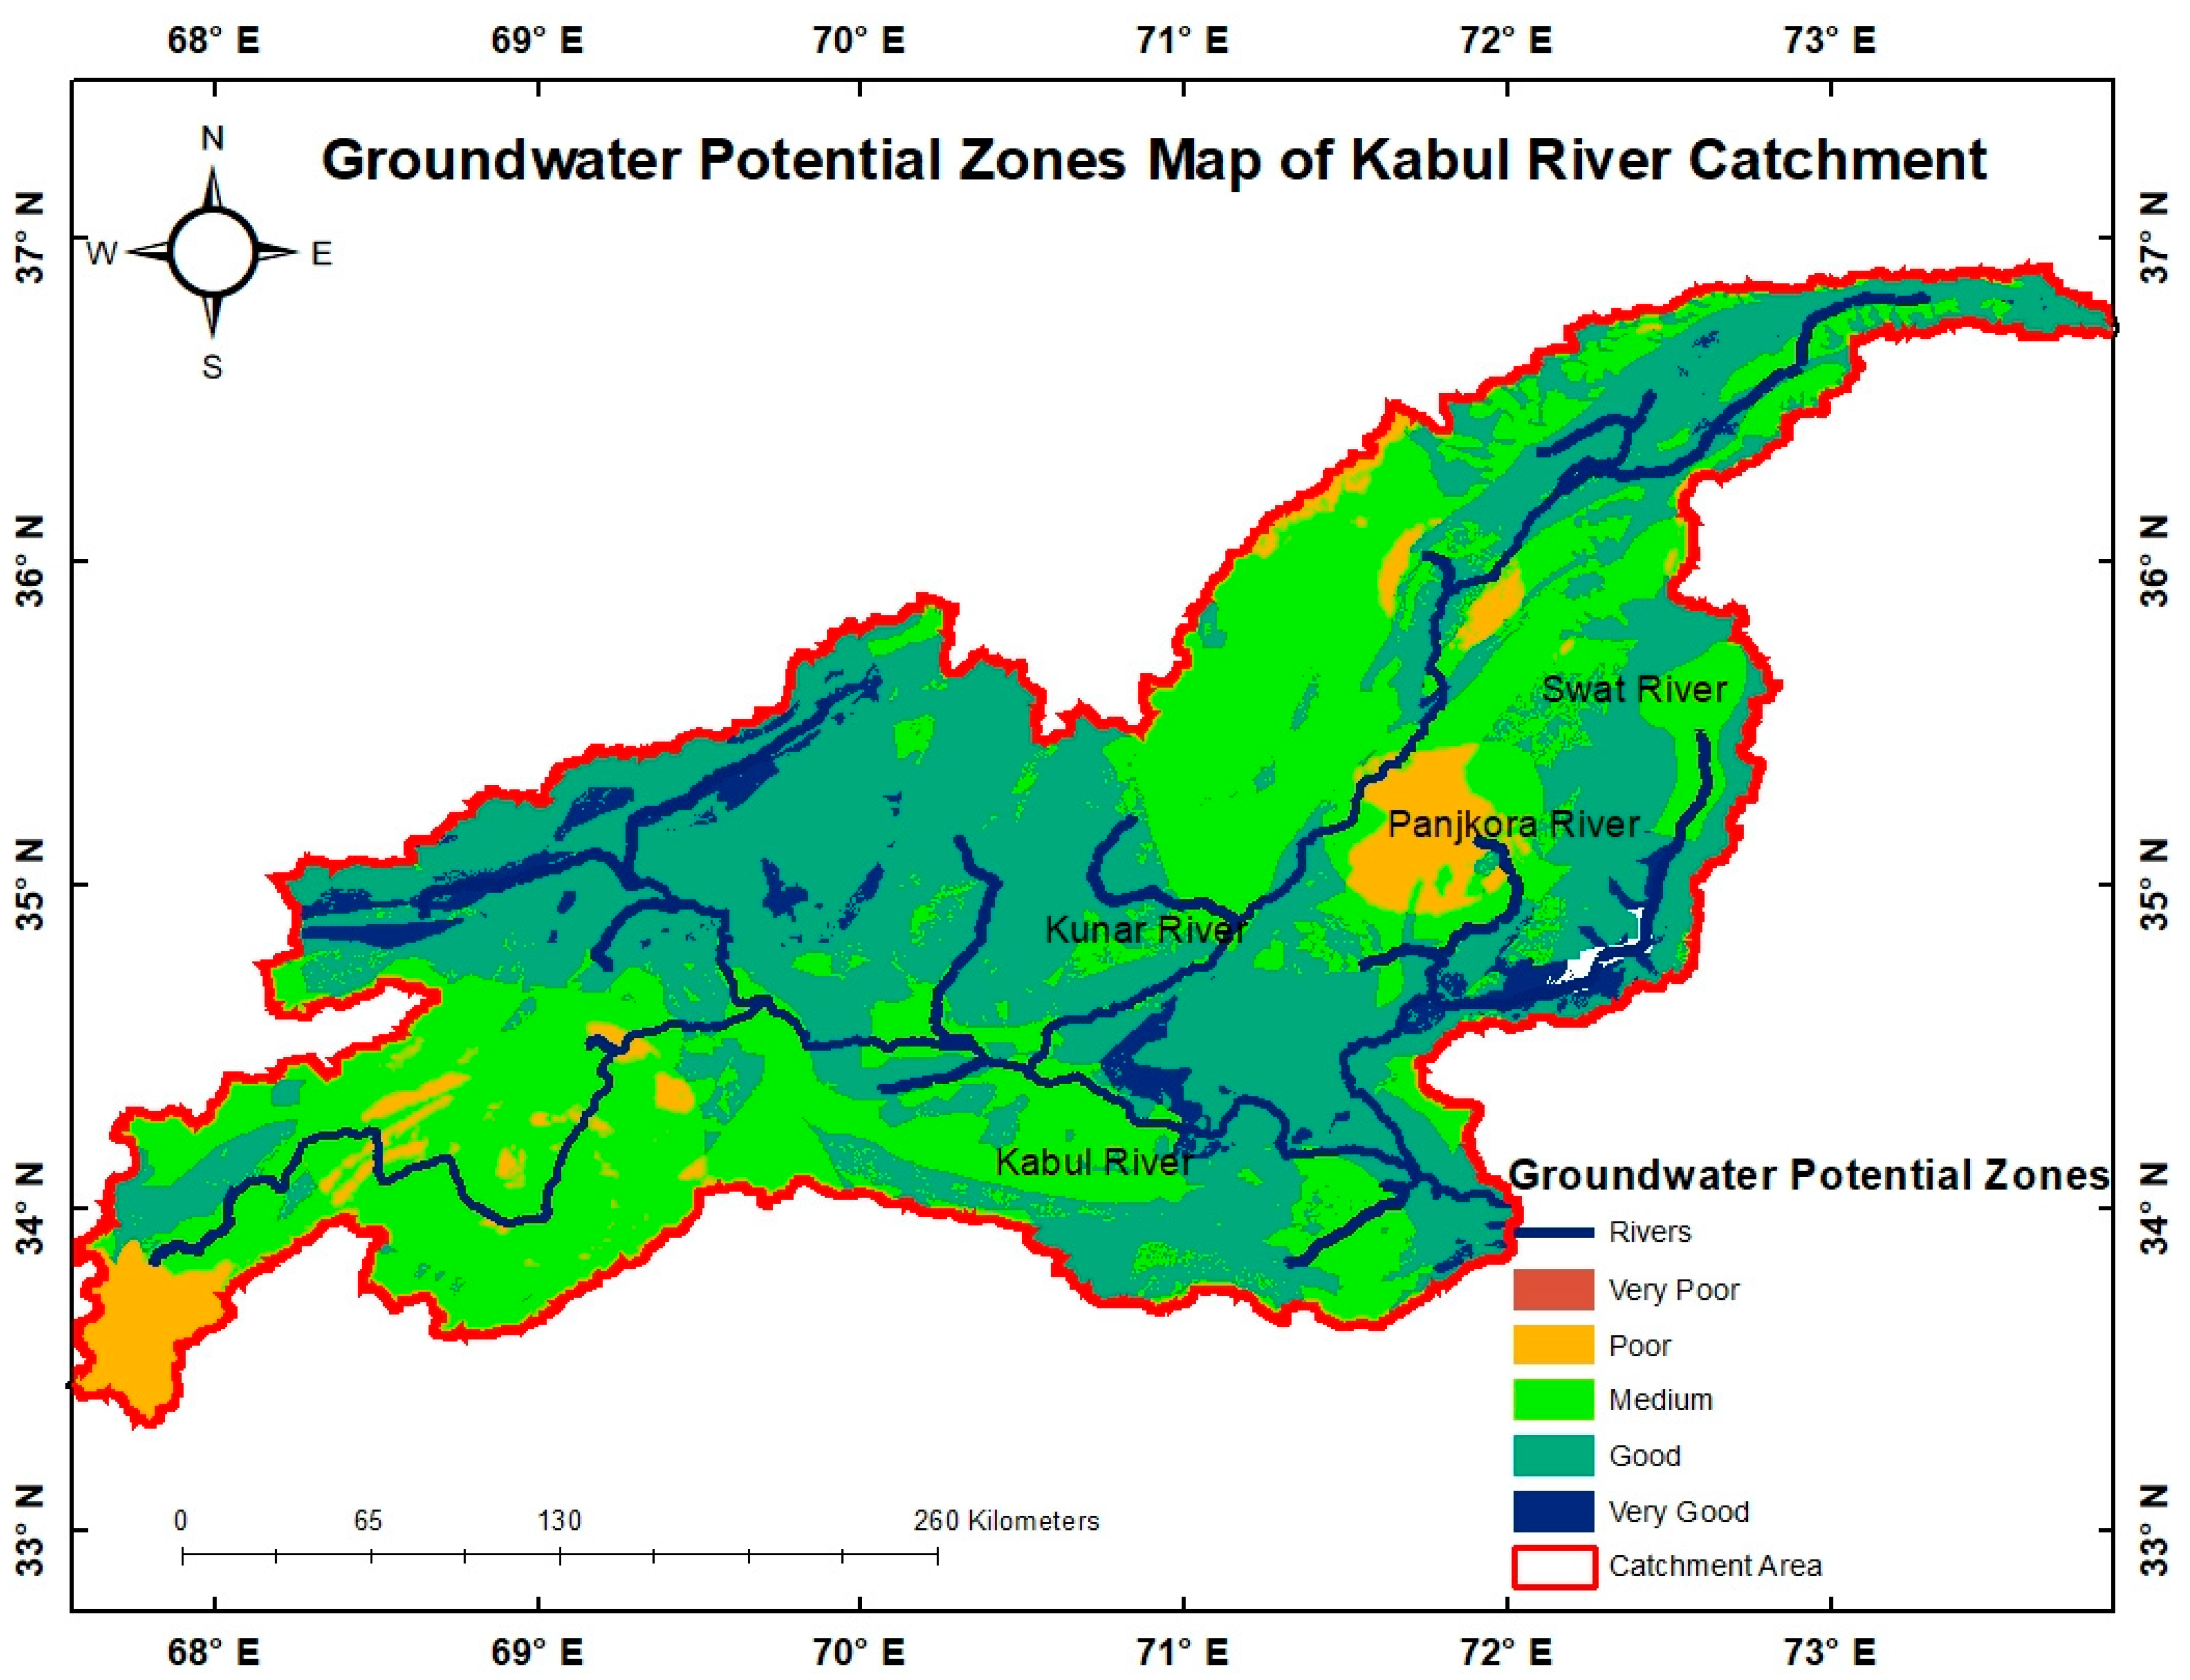
3. Results
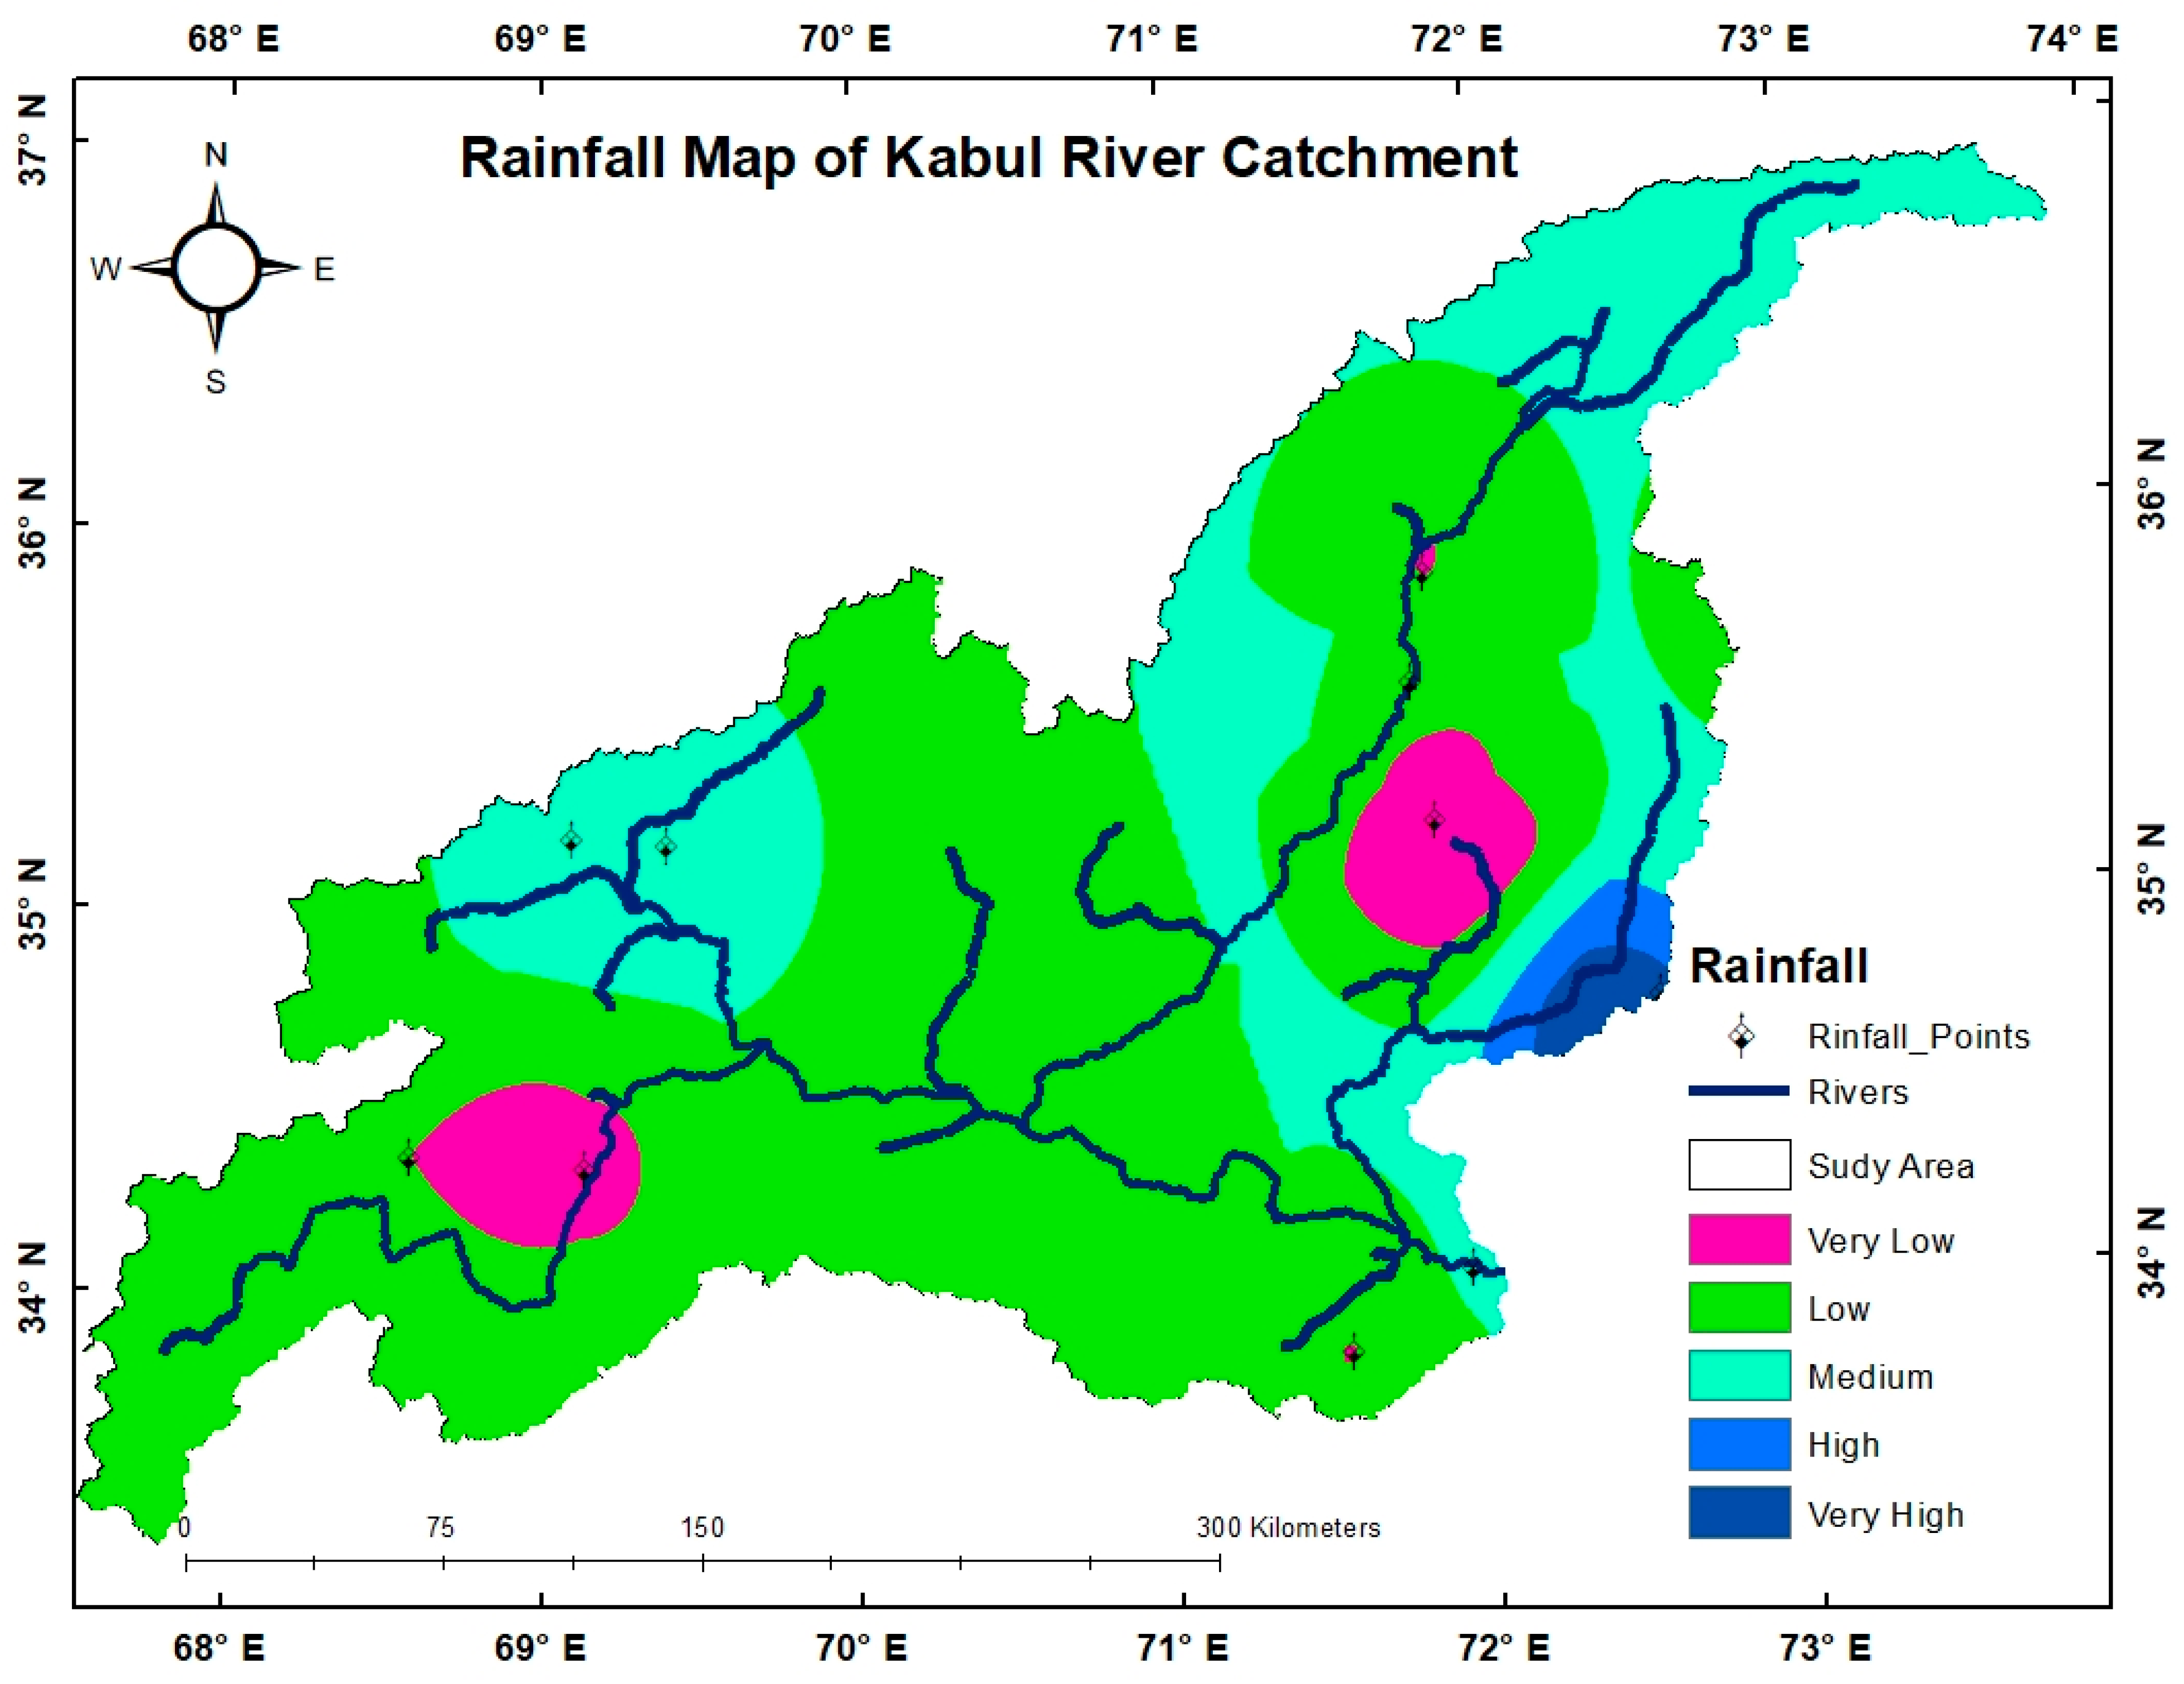
3.1. Rainfall
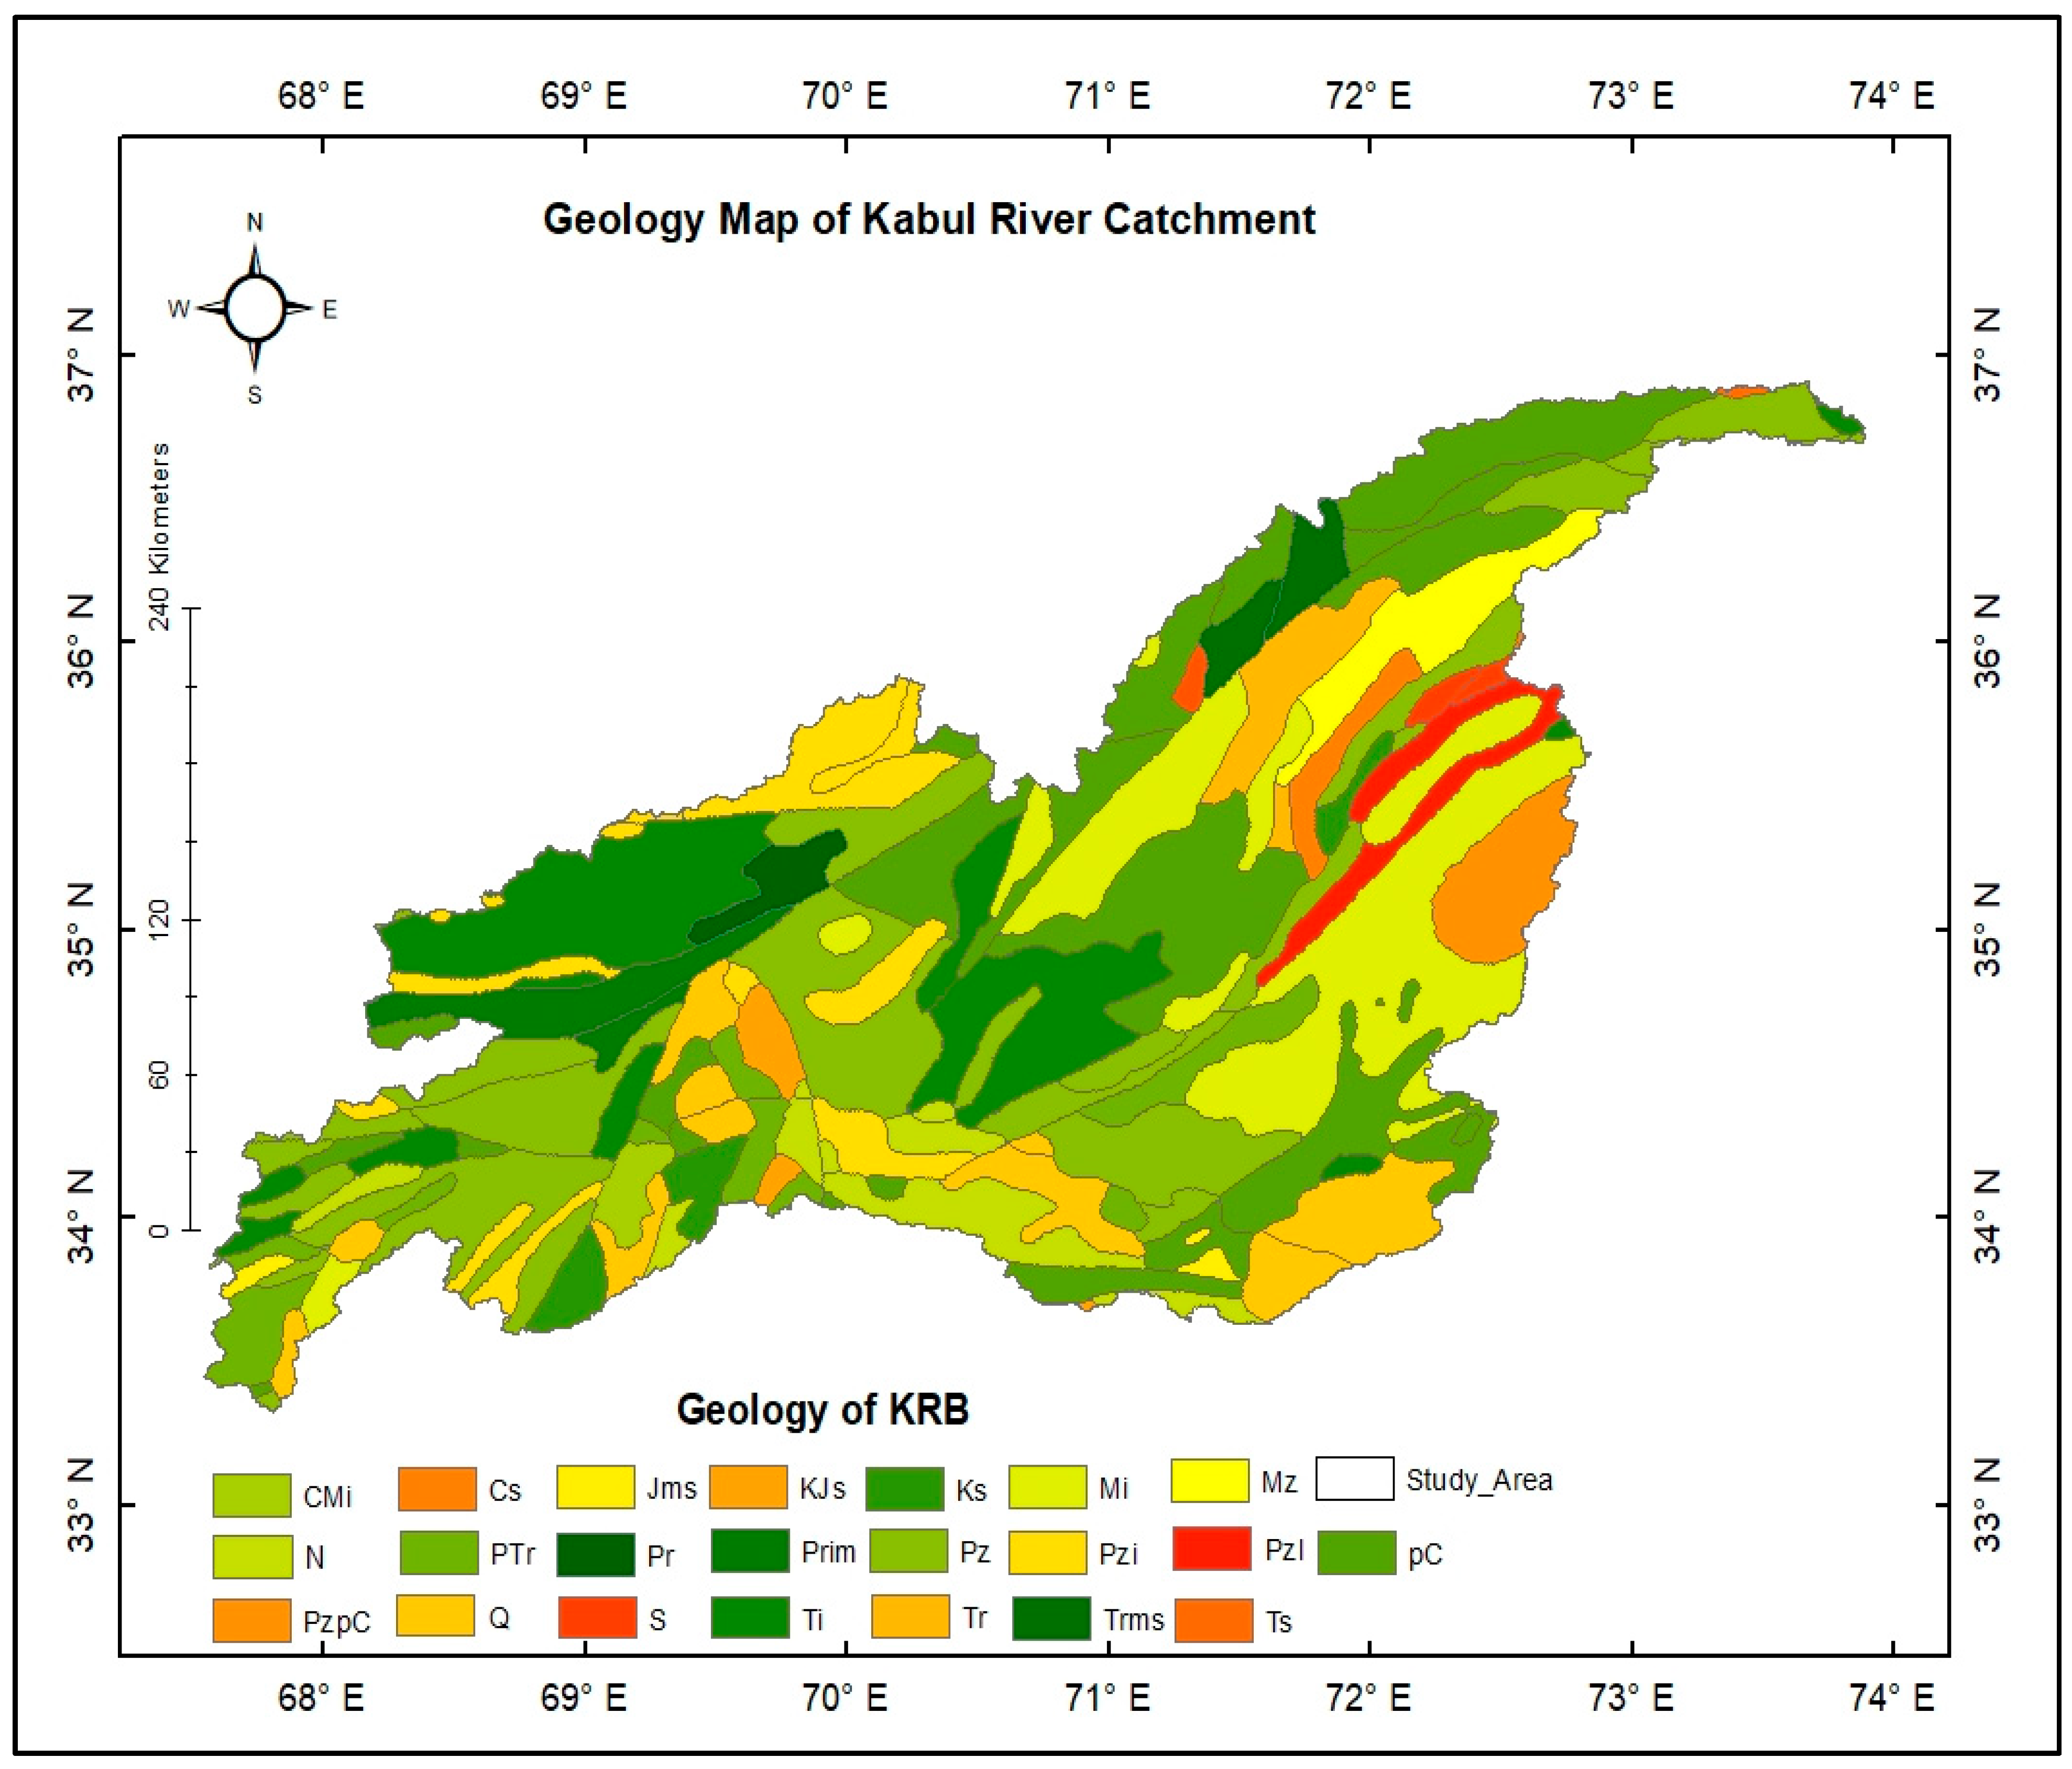
3.2. Geology
3.3. Lineament Density
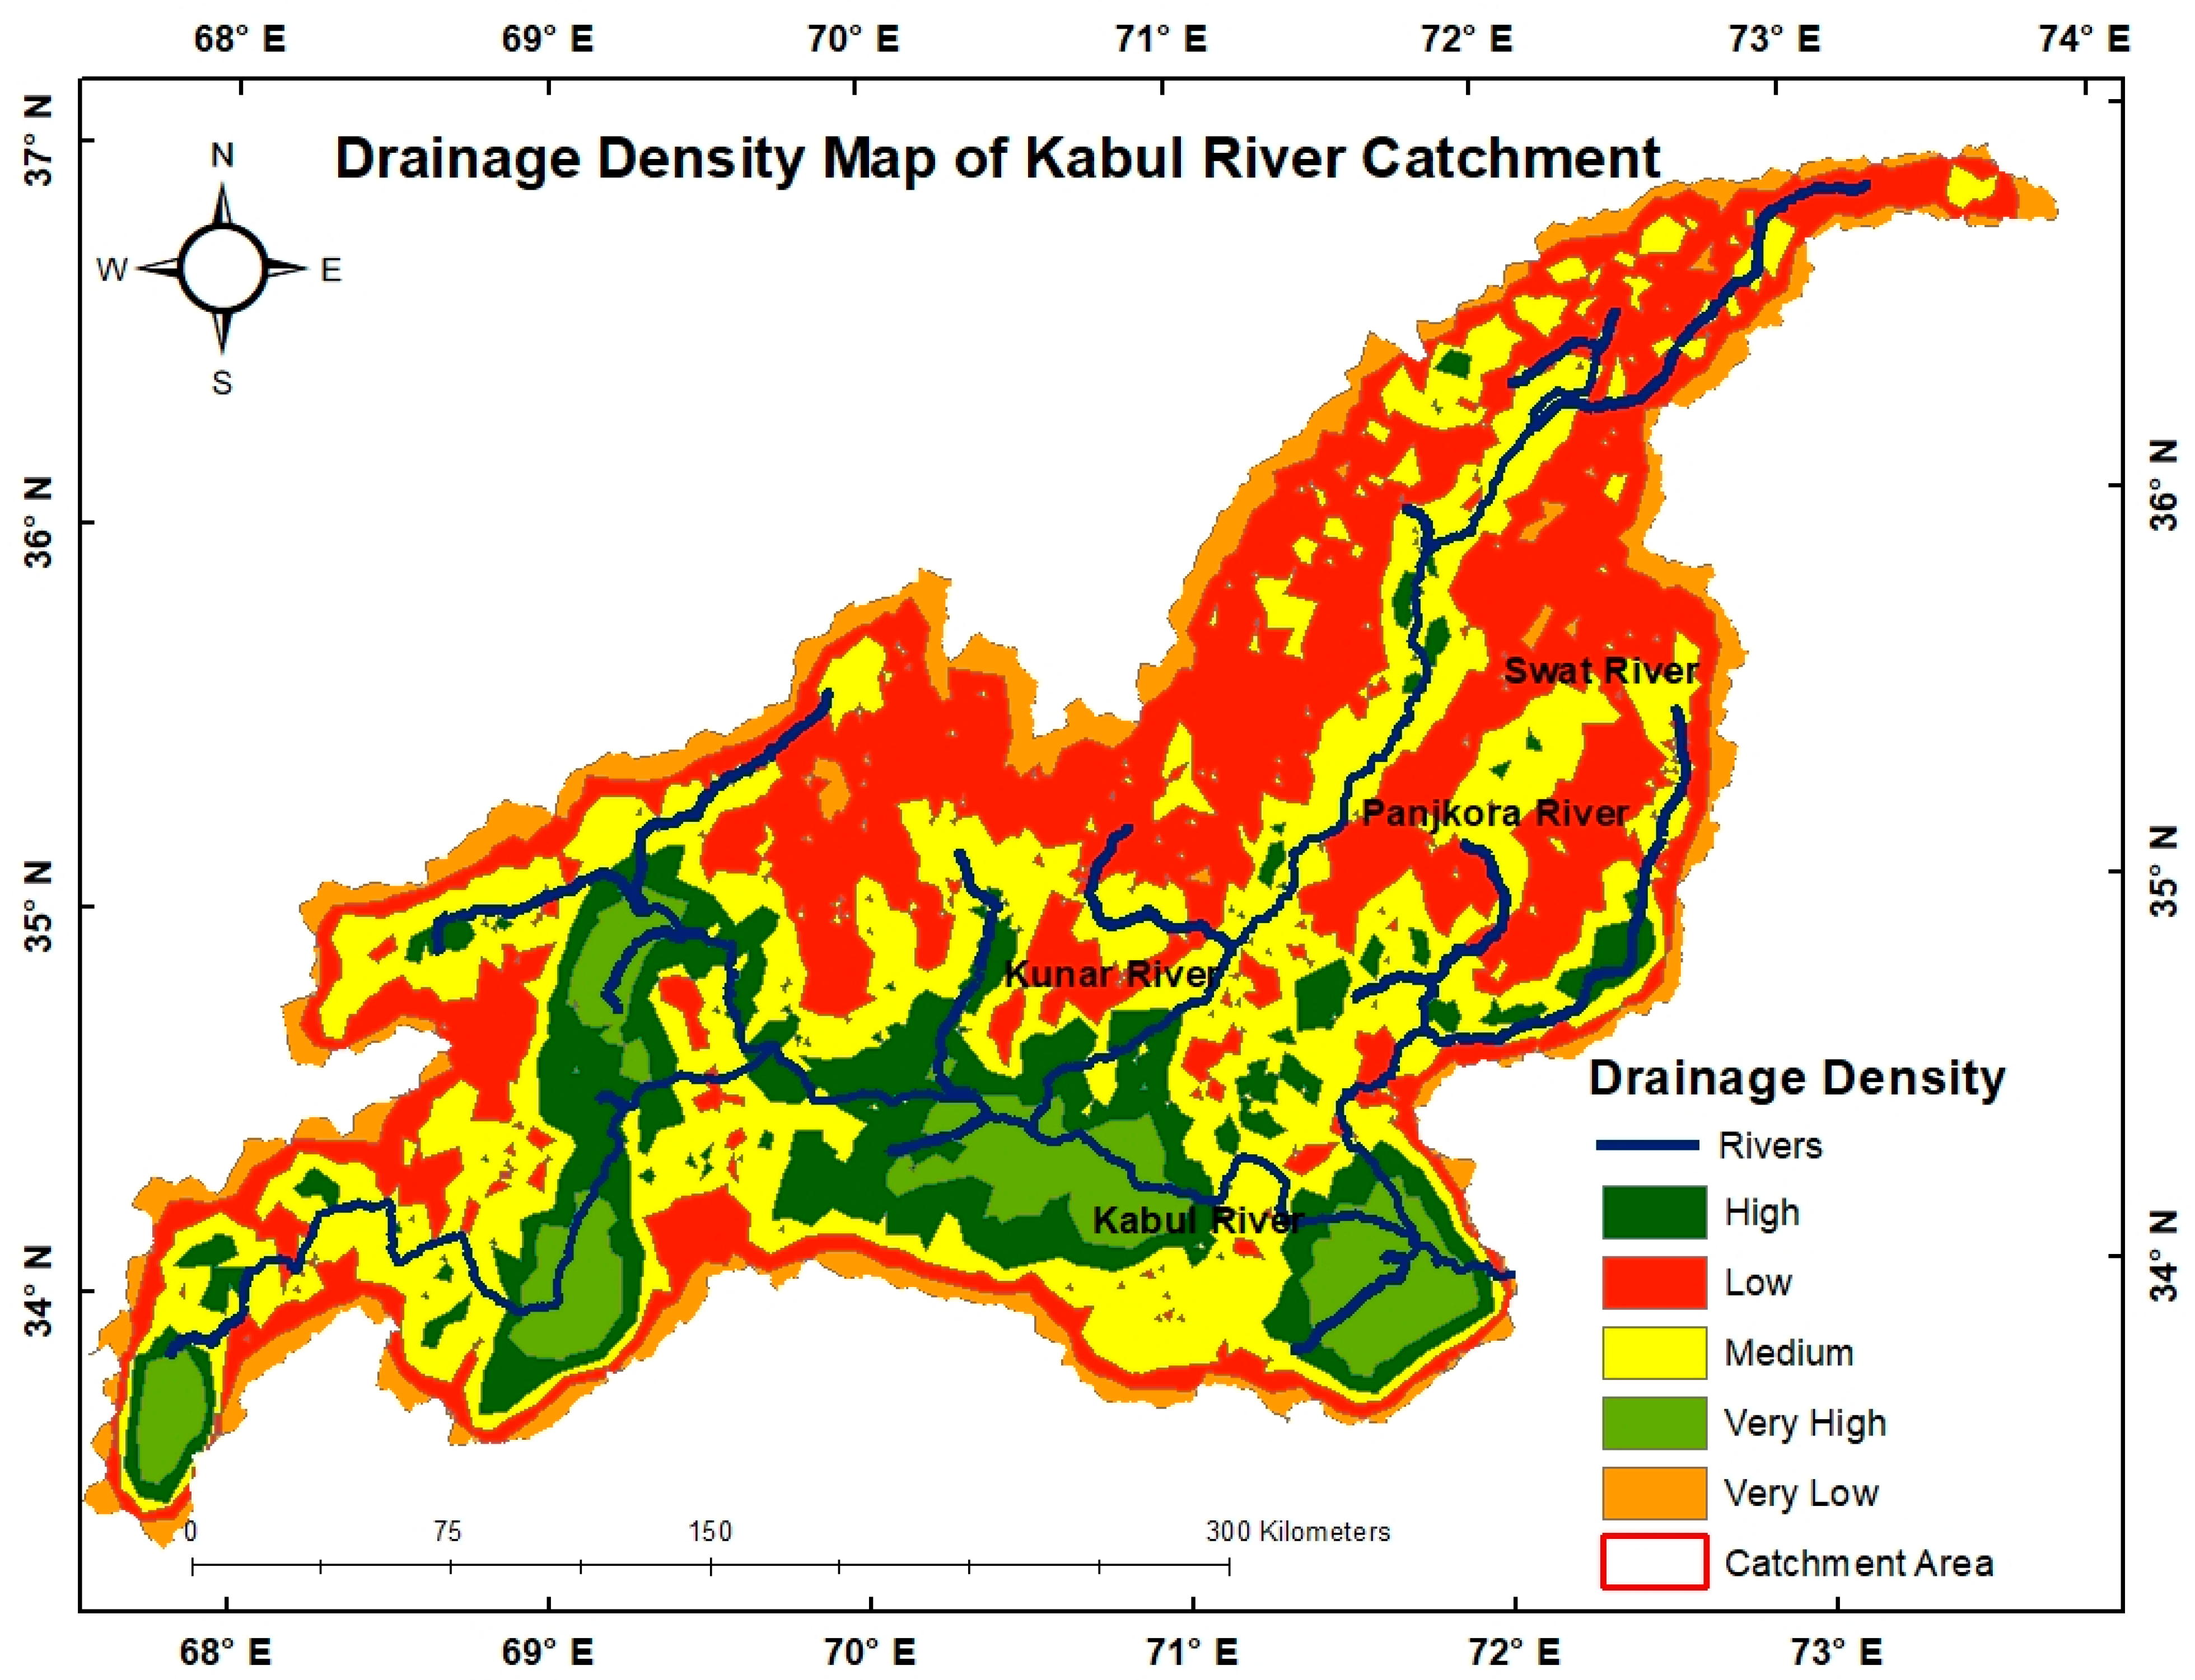
3.4. Drainage Density
3.5. Slope
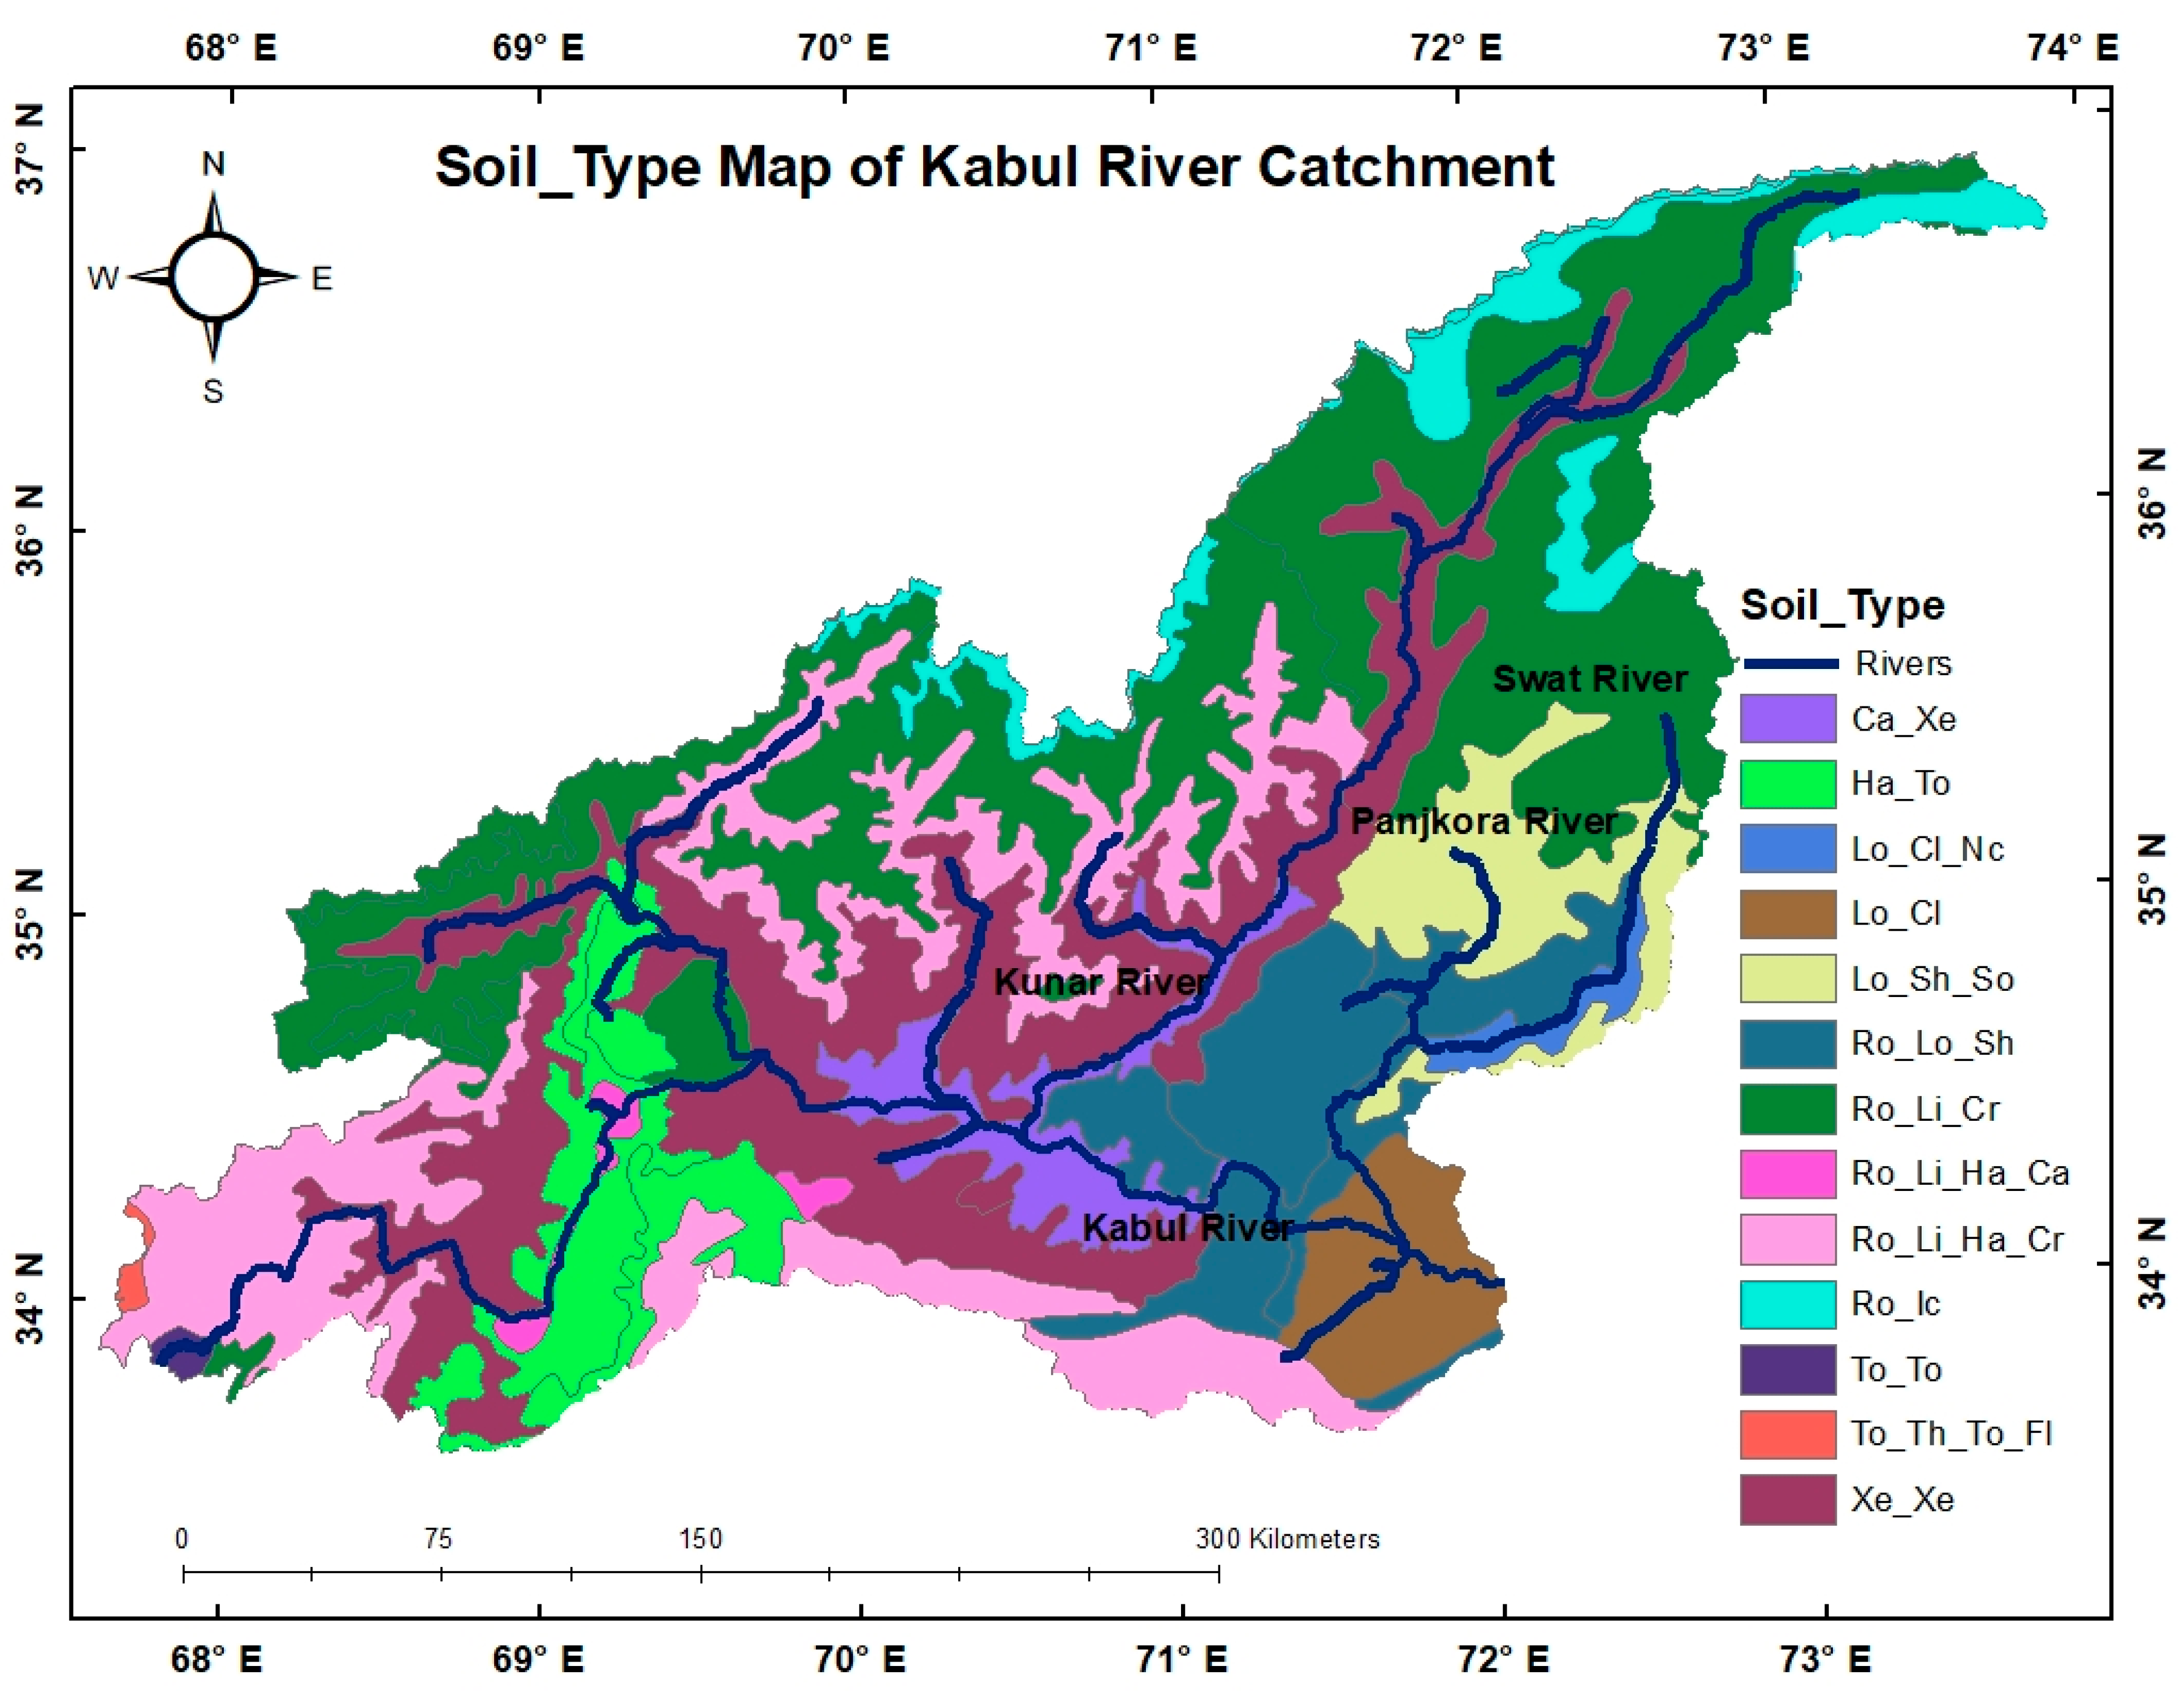
3.6. Soil Type
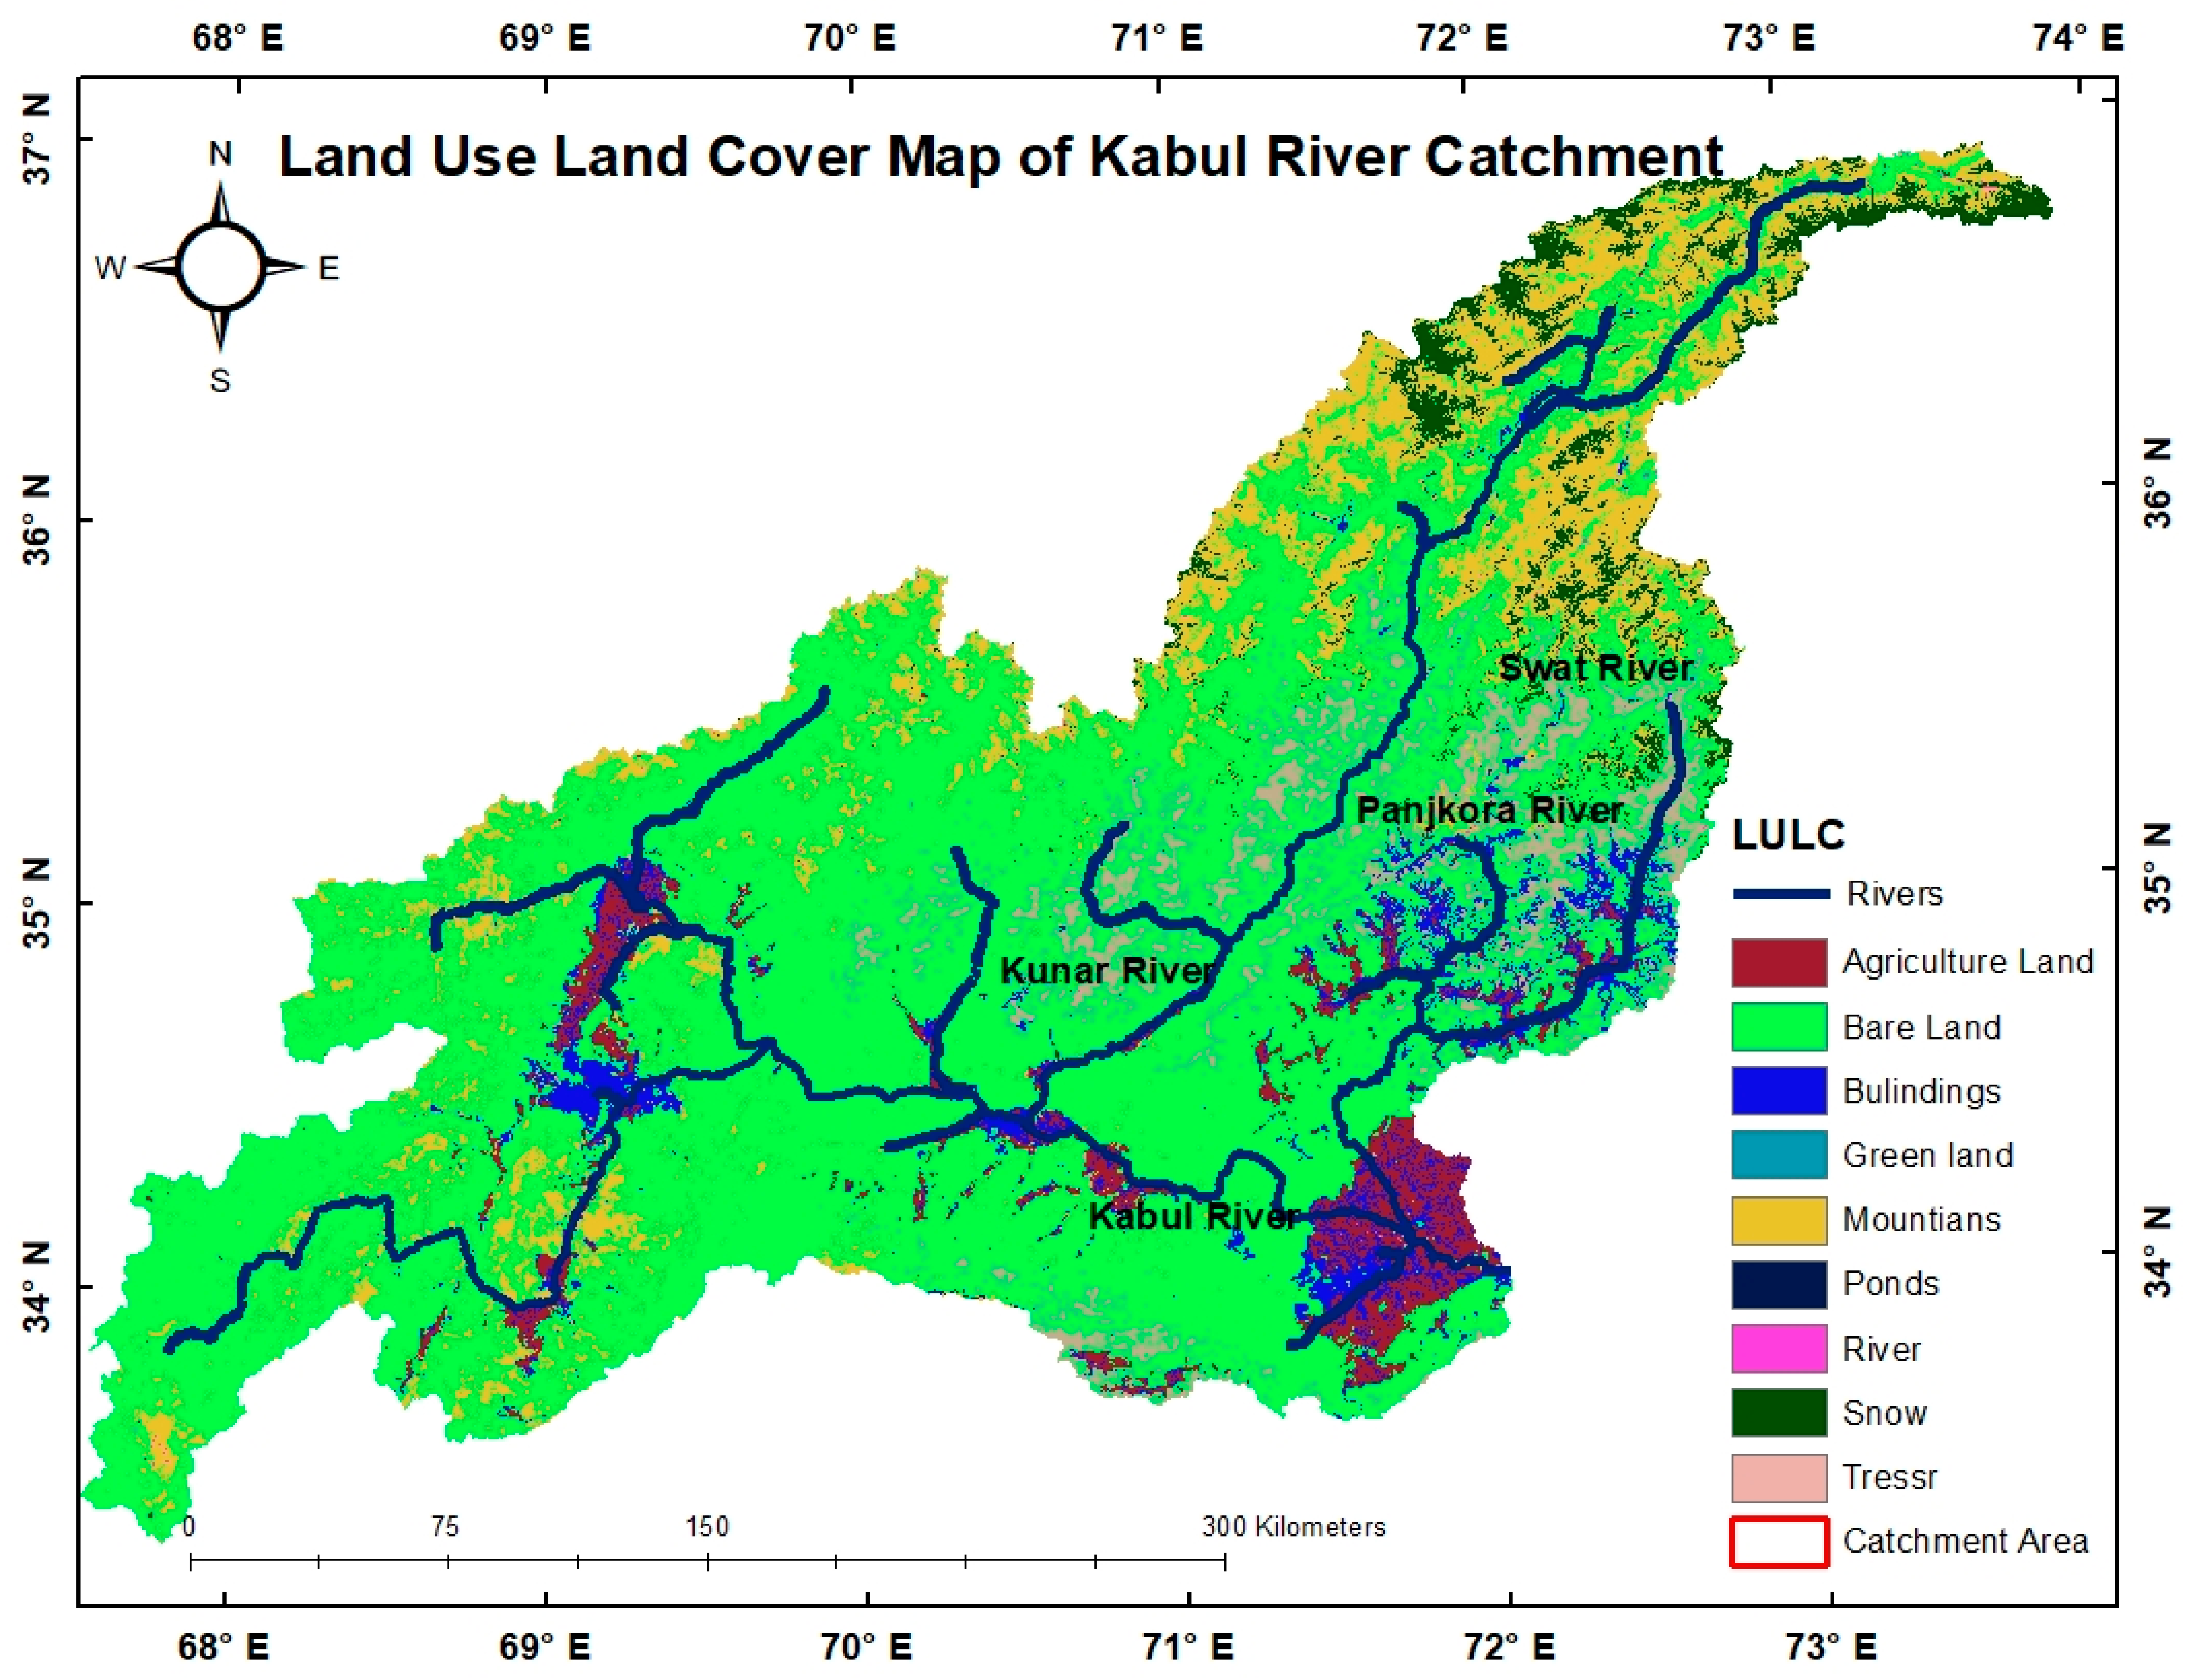
3.7. Land Use/Land Cover
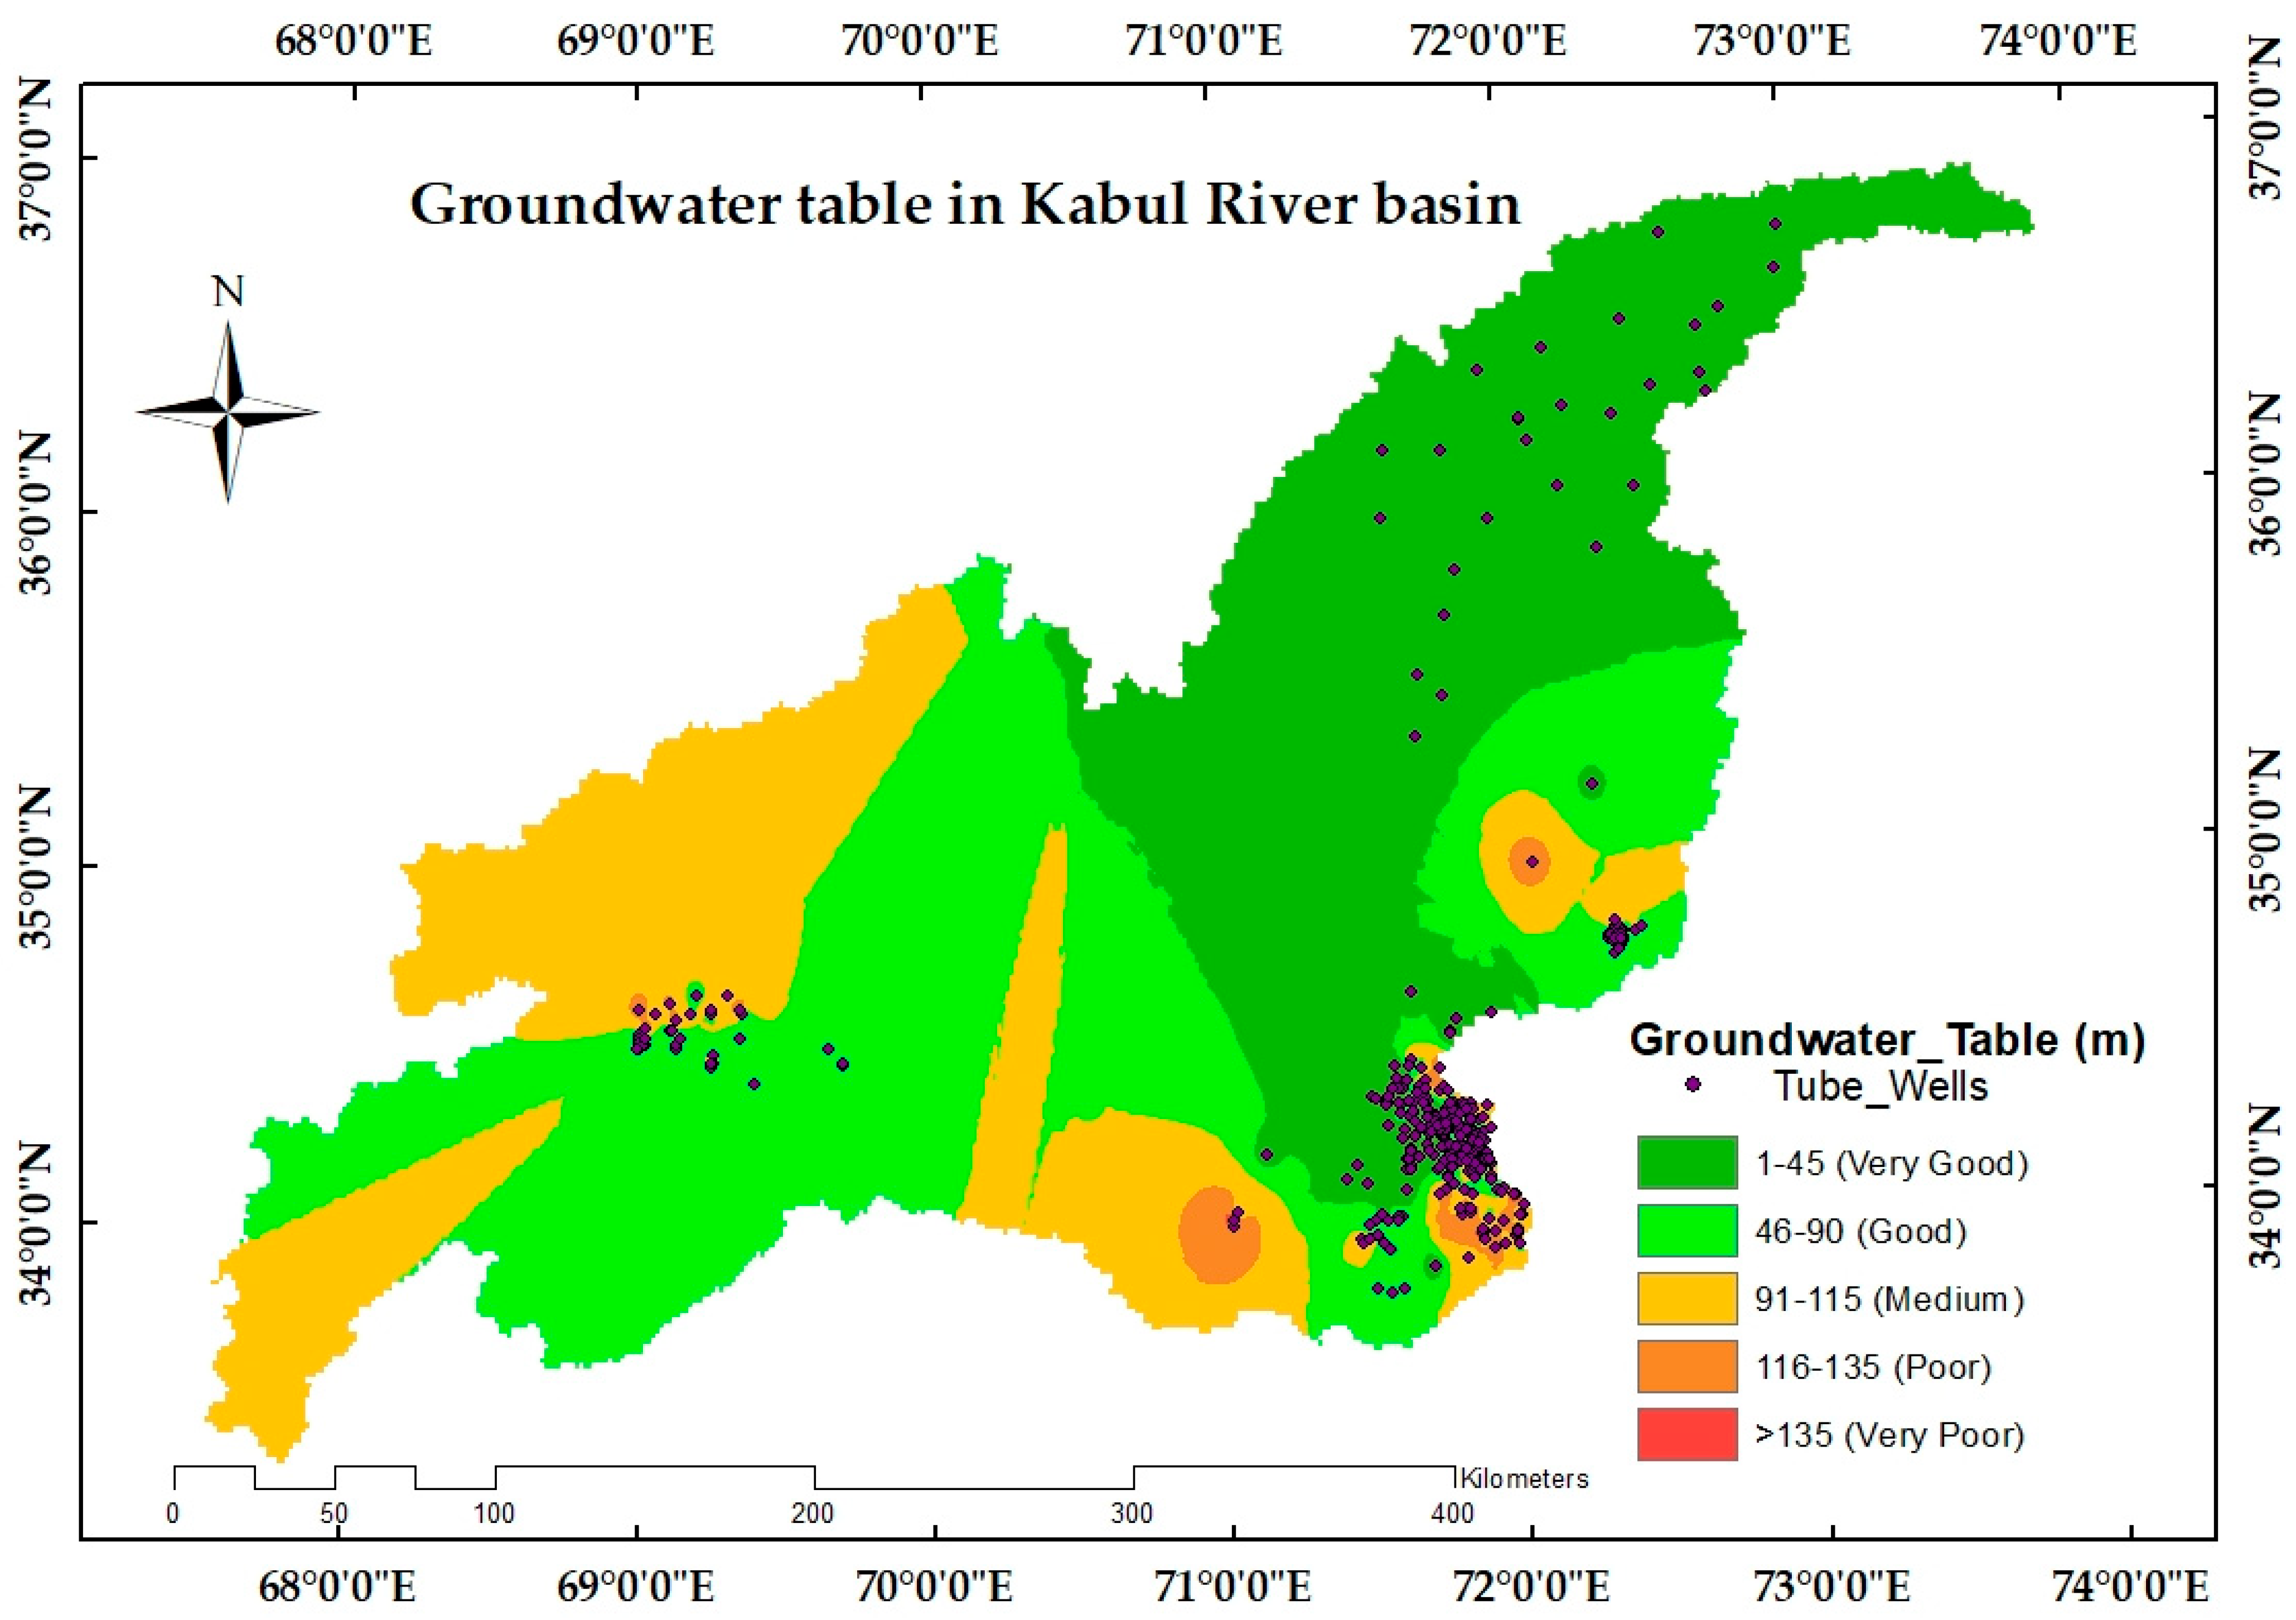
3.8. Validation of Qualitative Results
4. Conclusions
5. Limitations
Author Contributions
Funding
Data Availability Statement
Acknowledgments
Conflicts of Interest
References
- Todd, D.K.; Mays, L.W. Groundwater Hydrology; John Wiley & Sons: Hoboken, NJ, USA, 2004. [Google Scholar]
- Nhamo, L.; Nhamo, L.; Ebrahim, G.Y.; Mabhaudhi, T.; Mpandeli, S.; Magombeyi, M.; Chitakira, M.; Magidi, J.; Sibanda, M. An Assessment of Groundwater Use in Irrigated Agriculture Using Multi-Spectral Remote Sensing. Phys. Chem. Earth 2020, 115, 102810. [Google Scholar] [CrossRef]
- Patra, S.; Mishra, P.; Mahapatra, S.C. Delineation of Groundwater Potential Zone for Sustainable Development: A Case Study from Ganga Alluvial Plain Covering Hooghly District of India Using Remote Sensing, Geographic Information System and Analytic Hierarchy Process. J. Clean. Prod. 2018, 172, 2485–2502. [Google Scholar] [CrossRef]
- Qureshi, A.S.; McCornick, P.G.; Sarwar, A.; Sharma, B.R. Challenges and prospects of sustainable groundwater management in the Indus Basin, Pakistan. Water Resour. Manag. 2009, 24, 1551–1569. [Google Scholar] [CrossRef]
- Basharat, M. Water management in the Indus Basin in Pakistan: Challenges and opportunities. In Indus River Basin; Elsevier: Amsterdam, The Netherlands, 2019; Volume 1, Chapter 16; pp. 375–388. [Google Scholar]
- Qureshi, A.S.; Gill, M.A.; Sarwar, A. Sustainable Groundwater Management in Pakistan: Challenges and opportunities. Irrig. Drain. 2008, 59, 107–116. [Google Scholar] [CrossRef]
- Tani, H.; Tayfur, G. Identification of Groundwater Potential Zones in Kabul River basin, Afghanistan. Groundw. Sustain. Dev. 2021, 15, 100666. [Google Scholar] [CrossRef]
- Berhanu, K.G.; Hatiye, S.D. Identification of Groundwater Potential Zones using proxy data: Case study of megech watershed, Ethiopia. J. Hydrol. Reg. Stud. 2020, 28, 100676. [Google Scholar] [CrossRef]
- Jha, M.K.; Chowdary, V.M.; Chowdhury, A. Groundwater assessment in Salboni Block, West Bengal (India) using remote sensing, geographical information system and multi-criteria decision analysis techniques. Hydrogeol. J. 2010, 18, 1713–1728. [Google Scholar] [CrossRef]
- Lee, S.; Song, K.-Y.; Kim, Y.; Park, I. Regional groundwater productivity potential mapping using a geographic information system (GIS) based Artificial Neural Network model. Hydrogeol. J. 2012, 20, 1511–1527. [Google Scholar] [CrossRef]
- Andualem, T.G.; Demeke, G.G. Groundwater potential assessment using GIS and Remote Sensing: A case study of Guna tana landscape, Upper Blue Nile Basin, Ethiopia. J. Hydrol. Reg. Stud. 2019, 24, 100610. [Google Scholar] [CrossRef]
- Shao, Z.; Fu, H.; Li, D.; Altan, O.; Cheng, T. Remote sensing monitoring of multi-scale watersheds impermeability for urban hydrological evaluation. Remote Sens. Environ. 2019, 232, 111338. [Google Scholar] [CrossRef]
- Siddi Raju, R.; Sudarsana Raju, G.; Rajasekhar, M. Identification of Groundwater Potential Zones in Mandavi River basin, Andhra Pradesh, India using remote sensing, GIS and Mif Techniques. HydroResearch 2019, 2, 1–11. [Google Scholar] [CrossRef]
- Achu, A.L.; Thomas, J.; Reghunath, R. Multi-criteria decision analysis for delineation of Groundwater Potential Zones in a tropical river basin using remote sensing, GIS and Analytical Hierarchy process (AHP). Groundw. Sustain. Dev. 2020, 10, 100365. [Google Scholar] [CrossRef]
- Allafta, H.; Opp, C.; Patra, S. Identification of Groundwater Potential Zones using remote sensing and GIS techniques: A case study of the shatt al-arab basin. Remote Sens. 2020, 13, 112. [Google Scholar] [CrossRef]
- Çelik, R. Evaluation of groundwater potential by GIS-based multicriteria decision making as a spatial prediction tool: Case study in the Tigris River Batman-Hasankeyf sub-basin, Turkey. Water 2019, 11, 2630. [Google Scholar] [CrossRef]
- Anbarasu, S.; Brindha, K.; Elango, L. Multi-influencing factor method for delineation of Groundwater Potential Zones using remote sensing and GIS techniques in the western part of Perambalur District, southern India. Earth Sci. Inform. 2019, 13, 317–332. [Google Scholar] [CrossRef]
- Mallick, J.; Khan, R.A.; Ahmed, M.; Alqadhi, S.D.; Alsubih, M.; Falqi, I.; Hasan, M.A. Modeling groundwater potential zone in a semi-arid region of Aseer using Fuzzy-AHP and geoinformation techniques. Water 2019, 11, 2656. [Google Scholar] [CrossRef]
- Rajasekhar, M.; Sudarsana Raju, G.; Sreenivasulu, Y.; Siddi Raju, R. Delineation of Groundwater Potential Zones in semi-arid region of Jilledubanderu River basin, Anantapur District, Andhra Pradesh, India using Fuzzy Logic, AHP and Integrated Fuzzy-AHP approaches. HydroResearch 2019, 2, 97–108. [Google Scholar] [CrossRef]
- Lilienfeld, A.; Asmild, M. Estimation of excess water use in irrigated agriculture: A Data Envelopment Analysis Approach. Agric. Water Manag. 2007, 94, 73–82. [Google Scholar] [CrossRef]
- Mohammadi-Behzad, H.R.; Charchi, A.; Kalantari, N.; Nejad, A.M.; Vardanjani, H.K. Delineation of Groundwater Potential Zones using remote sensing (RS), Geographical Information System (GIS) and Analytic Hierarchy Process (AHP) techniques: A case study in the leylia–keynow watershed, southwest of Iran. Carbonates Evaporites 2018, 34, 1307–1319. [Google Scholar] [CrossRef]
- Pinto, D.; Shrestha, S.; Babel, M.S.; Ninsawat, S. Delineation of Groundwater Potential Zones in the Comoro watershed, Timor Leste using GIS, remote sensing and Analytic Hierarchy Process (AHP) technique. Appl. Water Sci. 2015, 7, 503–519. [Google Scholar] [CrossRef]
- Jhariya, D.C.; Kumar, T.; Gobinath, M.; Diwan, P.; Kishore, N. Assessment of groundwater potential zone using remote sensing, GIS and Multi Criteria Decision Analysis Techniques. J. Geol. Soc. India 2016, 88, 481–492. [Google Scholar] [CrossRef]
- Fenta, A.A.; Kifle, A.; Gebreyohannes, T.; Hailu, G. Spatial analysis of groundwater potential using remote sensing and GIS-based multi-criteria evaluation in Raya Valley, Northern Ethiopia. Hydrogeol. J. 2014, 23, 195–206. [Google Scholar] [CrossRef]
- Aykut, T. Determination of Groundwater Potential Zones using geographical information systems (GIS) and Analytic Hierarchy Process (AHP) between Edirne-Kalkansogut (northwestern Turkey). Groundw. Sustain. Dev. 2021, 12, 100545. [Google Scholar] [CrossRef]
- Saaty, T.L. Decision making with the analytic hierarchy process. Int. J. Serv. Sci. 2008, 1, 83. [Google Scholar] [CrossRef]
- Maity, D.K.; Mandal, S. Identification of Groundwater Potential Zones of the Kumari River Basin, India: An rs & GIS based semi-quantitative approach. Environ. Dev. Sustain. 2017, 21, 1013–1034. [Google Scholar]
- Das, B.; Pal, S.C.; Malik, S.; Chakrabortty, R. Modeling Groundwater Potential Zones of Puruliya District, West Bengal, India using remote sensing and GIS techniques. Geol. Ecol. Landsc. 2018, 3, 223–237. [Google Scholar] [CrossRef]
- Benjmel, K.; Amraoui, F.; Boutaleb, S.; Ouchchen, M.; Tahiri, A.; Touab, A. Mapping of Groundwater Potential Zones in crystalline terrain using remote sensing, GIS techniques, and multicriteria data analysis (case of the Ighrem region, Western Anti-Atlas, Morocco). Water 2020, 12, 471. [Google Scholar] [CrossRef]
- Steele, K.; Carmel, Y.; Cross, J.; Wilcox, C. Uses and misuses of Multicriteria Decision Analysis (MCDA) in environmental decision making. Risk Anal. 2008, 29, 26–33. [Google Scholar] [CrossRef]
- Shao, Z.; Huq, E.; Cai, B.; Altan, O.; Li, Y. Integrated Remote Sensing and GIS approach using Fuzzy-AHP to delineate and identify Groundwater Potential Zones in semi-arid Shanxi province, China. Environ. Model. Softw. 2020, 134, 104868. [Google Scholar] [CrossRef]
- Taraky, Y.M.; McBean, E.; Binns, A.; Gharabaghi, B. Advancing Water Security and Agricultural Productivity: A Case Study of Transboundary Cooperation Opportunities in the Kabul River Basin. Environments 2024, 11, 253. [Google Scholar] [CrossRef]
- Noori, A.R.; Singh, S.K. Status of groundwater resource potential and its quality at Kabul, Afghanistan: A Review. Environ. Earth Sci. 2021, 80, 654. [Google Scholar] [CrossRef]
- Mack, T.J.; Chornack, M.P.; Taher, M.R. Groundwater-level trends and implications for sustainable water use in the Kabul Basin, Afghanistan. Environ. Syst. Decis. 2013, 33, 457–467. [Google Scholar] [CrossRef]
- Safi, L.; Mujeeb, M.; Sahak, K.; Mushwani, H.; Hashmi, S.K. Climate change impacts and threats on basic livelihood resources, food security and social stability in Afghanistan. Geo J. 2024, 89, 85. [Google Scholar] [CrossRef]
- Ullah, Z.; Khan, H.; Waseem, A.; Mahmood, Q.; Farooq, U. Water quality assessment of the river Kabul at Peshawar, Pakistan: Industrial and urban wastewater impacts. J. Water Chem. Technol. 2013, 35, 170–176. [Google Scholar] [CrossRef]
- Khan, H.F.; Yang, Y.C.; Wi, S. Case study on hydropolitics in Afghanistan and Pakistan: Energy and water impacts of Kunar River Development. J. Water Resour. Plan. Manag. 2020, 146, 05020015. [Google Scholar] [CrossRef]
- Akhtar, F.; Azizi, A.H.; Shah, U.; Borgemeister, C.; Tischbein, B.; Awan, U.K. The Application of Remote Sensing for Water Resources Management in data-Scarce Watersheds in the Hindu Kush Himalaya Region. In Handbook of Himalayan Ecosystems and Sustainability, Volume 2; CRC Press: Boca Raton, FL, USA, 2022; pp. 205–222. [Google Scholar]
- Qureshi, A.S. Water Resources Management in Afghanistan: The Issues and Options; Working Paper 49, Pakistan Country Series 49; International Water Management Institute (IWMI): Columbo, Sri Lanka, 2002; 25p. [Google Scholar]
- Ahmadzai, S.; McKinna, A. Afghanistan electrical energy and trans-boundary water systems analyses: Challenges and opportunities. Energy Rep. 2018, 4, 435–469. [Google Scholar] [CrossRef]
- Qureshi, A.S. Water management in the Indus Basin in Pakistan: Challenges and opportunities. Mt. Res. Dev. 2011, 31, 252–260. [Google Scholar] [CrossRef]
- Salehie, O.; bin Ismail, T.; Shahid, S.; Hamed, M.M.; Chinnasamy, P.; Wang, X. Assessment of water resources availability in Amu Darya River basin using Grace Data. Water 2022, 14, 533. [Google Scholar] [CrossRef]
- Nasir, M.J.; Khan, S.; Ayaz, T.; Khan, A.Z.; Ahmad, W.; Lei, M. An integrated geospatial multi-influencing factor approach to delineate and identify Groundwater Potential Zones in Kabul Province, Afghanistan. Environ. Earth Sci. 2021, 80, 453. [Google Scholar] [CrossRef]
- Nasir, M.J.; Khan, S.; Zahid, H.; Khan, A. Delineation of Groundwater Potential Zones using GIS and multi influence factor (MIF) techniques: A study of district Swat, Khyber Pakhtunkhwa, Pakistan. Environ. Earth Sci. 2018, 77, 367. [Google Scholar] [CrossRef]
- USAID. Afghanistan Water Resources Profile Overview. Water Resources Profile Series 2021. Available online: https://winrock.org/wp-content/uploads/2021/08/Afghanistan_Country_Profile-Final.pdf (accessed on 1 May 2025).
- World Bank. Financing Climate Change Adaptation in Transboundary Basins. Financing Climate Change Adaptation in Transboundary Basins: Preparing Bankable Projects; World Bank: Washington, DC, USA, 2019. [Google Scholar] [CrossRef]
- Lenton, R.L. Foreword to transboundary water resources in Afghanistan. In Transboundary Water Resources in Afghanistan; Elsevier: Amsterdam, The Netherlands, 2016; Volume 1, pp. xv–xvi. [Google Scholar] [CrossRef]
- Ahmad, M.; Wasiq, M. Water resource development in northern Afghanistan and its implications for Amu Darya Basin. World Bank: Washington, DC, USA, 2004. [Google Scholar] [CrossRef]
- Favre, A.; Kamal, G.M. Watershed Atlas of Afghanistan 2004. Available online: http://aizon.org/watershed_atlas.htm (accessed on 1 May 2025).
- Mehmood, A.; Jia, S.; Lv, A.; Zhu, W.; Mahmood, R.; Saifullah, M.; Adnan, R.M. Detection of spatial shift in flood regime of the Kabul River basin in Pakistan, causes, challenges, and opportunities. Water 2021, 13, 1276. [Google Scholar] [CrossRef]
- Hassanyar, M.H.; Tsutsumi, J. Multi-model ensemble climate change projection for Kunduz River basin, Afghanistan under representative concentration pathways. Mod. Environ. Sci. Eng. 2017, 03, 291–301. [Google Scholar] [CrossRef]
- Lashkaripour, G.R.; Hussaini, S.A. Water Resource Management in Kabul River Basin, eastern Afghanistan. Environmentalist 2007, 28, 253–260. [Google Scholar] [CrossRef]
- Sidiqi, M.; Shrestha, S. Assessment of climate change impact on the hydrology of the Kabul River Basin, Afghanistan. J. Water Eng. Manag. 2021, 2, 3. [Google Scholar] [CrossRef]
- Irfan, M.; Mahboob Alam, M.; Khan, S.; Khan, I.; Eldin, S.M. Distance and weightage-based identification of most critical and vulnerable locations of surface water pollution in Kabul River tributaries. Sci. Rep. 2023, 13, 11615. [Google Scholar] [CrossRef]
- Huq, M.E.; Su, C.L.; Li, J.X.; Liu, R. Distribution and hydrogeochemical behavior of arsenic-enriched groundwater in the sedimentary aquifers: Comparison between Datong Basin, China and Kushtia District, Bangladesh. Environ. Arsen. A Chang. World 2019, 25, 123–124. [Google Scholar]
- Shaban, A.; Khawlie, M.; Abdallah, C. Use of remote sensing and GIS to determine recharge potential zones: The case of Occidental Lebanon. Hydrogeol. J. 2005, 14, 433–443. [Google Scholar] [CrossRef]
- Sener, E.; Davraz, A.; Ozcelik, M. An integration of GIS and remote sensing in groundwater investigations: A case study in Burdur, Turkey. Hydrogeol. J. 2004, 13, 826–834. [Google Scholar] [CrossRef]
- Magesh, N.S.; Chandrasekar, N.; Soundranayagam, J.P. Delineation of Groundwater Potential Zones in Theni district, Tamil Nadu, using remote sensing, GIS and Mif Techniques. Geosci. Front. 2012, 3, 189–196. [Google Scholar] [CrossRef]
- Chepchumba, M.C.; Raude, J.M.; Sang, J.K. Geospatial delineation and mapping of groundwater potential in Embu County, Kenya. Acque Sotter. Ital. J. Groundw. 2019, 8, 39–51. [Google Scholar] [CrossRef]
- Selvam, S.; Magesh, N.S.; Chidambaram, S.; Rajamanickam, M.; Sashikkumar, M.C. A GIS based identification of groundwater recharge potential zones using RS and if technique: A case study in Ottapidaram Taluk, Tuticorin District, Tamil nadu. Environ. Earth Sci. 2014, 73, 3785–3799. [Google Scholar] [CrossRef]
- Rahmati, O.; Nazari Samani, A.; Mahdavi, M.; Pourghasemi, H.R.; Zeinivand, H. Groundwater potential mapping at Kurdistan Region of Iran using analytic hierarchy process and GIS. Arab. J. Geosci. 2014, 8, 7059–7071. [Google Scholar] [CrossRef]
- Ghorbani Nejad, S.; Falah, F.; Daneshfar, M.; Haghizadeh, A.; Rahmati, O. Delineation of Groundwater Potential Zones using remote sensing and GIS-based data-driven models. Geocarto Int. 2017, 32, 167–187. [Google Scholar] [CrossRef]
- Yeh, H.-F.; Lee, C.-H.; Hsu, K.-C.; Chang, P.-H. GIS for the assessment of the groundwater recharge potential zone. Environ. Geol. 2008, 58, 185–195. [Google Scholar] [CrossRef]
- Mogaji, K.A.; Lim, H.S.; Abdullah, K. Regional prediction of groundwater potential mapping in a multifaceted geology terrain using GIS-based Dempster–Shafer model. Arab. J. Geosci. 2014, 8, 3235–3258. [Google Scholar] [CrossRef]
- Saaty, T.L. How to make a decision: The Analytic Hierarchy Process. Eur. J. Oper. Res. 1990, 48, 9–26. [Google Scholar] [CrossRef]
- Grundlagen Zum AHP 15. Erhebungsprozesse und Konsistenzanforderungen im Analytic Hierarchy Process (AHP); Peter Lang Verlag: Berlin, Germany, 2025. [Google Scholar]
- Golden, B.L.; Wasil, E.A.; Levy, D.E. Applications of the Analytic Hierarchy Process: A categorized, annotated bibliography. In The Analytic Hierarchy Process; Springer: Berlin/Heidelberg, Germany, 1989; pp. 37–58. [Google Scholar]
- Dewandel, B.; Lachassagne, P.; Boudier, F.; Al-Hattali, S.; Ladouche, B.; Pinault, J.-L.; Al-Suleimani, Z. A conceptual hydrogeological model of ophiolite hard-rock aquifers in Oman based on a multiscale and a multidisciplinary approach. Hydrogeol. J. 2005, 13, 708–726. [Google Scholar] [CrossRef]
- Fetter, C.W. Applied Hydrogeology, 4th ed.; Prentice Hall: Upper Saddle River, NJ, USA, 2001; Available online: https://arjzaidi.wordpress.com/wp-content/uploads/2015/09/unimasr-com_e7ce669a880a8c4c70b4214641f93a02.pdf (accessed on 1 May 2025).
- Singhal, B.B.; Gupta, R.P. Hydrogeology of Crystalline Rocks. In Applied Hydrogeology of Fractured Rocks; Springer: Berlin/Heidelberg, Germany, 2010; pp. 237–255. ISBN 978-90-481-8798-0. [Google Scholar] [CrossRef]
- Soil Survey Staff. Soil Taxonomy: A Basic System of Soil Classification for Making and Interpreting Soil Surveys. In U.S. Department of Agriculture Handbook, 2nd ed.; Natural Resources Conservation Service, U.S. Department of Agriculture: Washington, DC, USA, 1999; p. 436. ISBN 0-299-06830-7-114-492. [Google Scholar] [CrossRef]
- Jiang, R.; Li, T.; Liu, D.; Fu, Q.; Hou, R.; Li, Q.; Cui, S.; Li, M. Soil infiltration characteristics and pore distribution under freezing–thawing conditions. Cryosphere 2021, 15, 2133–2146. [Google Scholar] [CrossRef]
- Weil, N.C.; Brady, R.R.; Weil, R.R. The Nature and Properties of Soils, 15th ed.; Pearson: Upper Saddle River, NJ, USA, 2016; ISBN 978-0133254488. [Google Scholar]
- Rahman, A.; Khan, A.; Haq, N.; Samiullah; Shaw, R. Soil sealing and depletion of groundwater in rapidly growing Peshawar City District, Pakistan. In Urban Drought: Emerging Water Challenges in Asia; Springer Nature: Berlin/Heidelberg, Germany, 2018; Volume 1, Chapter 17; pp. 289–309. [Google Scholar]
- Khan, A.Y.; Niaz, A.; Nisar, U.B. Multi-dimensional characterization of groundwater distribution in sub-Himalayan region of Pakistan. Environ. Earth Sci. 2024, 83, 64. [Google Scholar] [CrossRef]
- Alikhanov, B.; Juliev, M.; Alikhanova, S.; Mondal, I. Assessment of influencing factor method for delineation of Groundwater Potential Zones with geospatial techniques. case study of bostanlik district, Uzbekistan. Groundw. Sustain. Dev. 2021, 12, 100548. [Google Scholar] [CrossRef]
- Shailaja, G.; Kadam, A.K.; Gupta, G.; Umrikar, B.N.; Pawar, N.J. Integrated geophysical, geospatial and multiple-criteria decision analysis techniques for delineation of Groundwater Potential Zones in a semi-arid hard-rock aquifer in Maharashtra, India. Hydrogeol. J. 2018, 27, 639–654. [Google Scholar] [CrossRef]
- Uc Castillo, J.L.; Martínez Cruz, D.A.; Ramos Leal, J.A.; Tuxpan Vargas, J.; Rodríguez Tapia, S.A.; Marín Celestino, A.E. Delineation of Groundwater Potential Zones (GWPZs) in a semi-arid basin through remote sensing, GIS, and AHP approaches. Water 2022, 14, 2138. [Google Scholar] [CrossRef]
- Shekar, P.R.; Mathew, A. Delineation of Groundwater Potential Zones and identification of artificial recharge sites in the Kinnerasani watershed, India, using remote sensing-GIS, AHP, and Fuzzy-AHP Techniques. AQUA Water Infrastruct. Ecosyst. Soc. 2023, 72, 1474–1498. [Google Scholar] [CrossRef]
- Loganathan, S.; Sathiyamoorthy, M. Demarcation of Groundwater Potential Zones in ponnai sub-basin, southern India using remote sensing, GIS and Fuzzy-AHP approaches. Water Supply 2024, 24, 1529–1545. [Google Scholar] [CrossRef]
- Patel, D.K.; Thakur, T.K.; Thakur, A.; Karuppannan, S.; Swamy, S.L.; Pant, R.R. Groundwater potential zone mapping using AHP and geospatial techniques in the Upper Narmada Basin, Central India. Discov. Sustain. 2024, 5, 355. [Google Scholar] [CrossRef]
- Meng, F.; Khan, M.I.; Naqvi, S.A.; Sarwar, A.; Islam, F.; Ali, M.; Tariq, A.; Ullah, S.; Soufan, W.; Faraj, T.K. Identification and mapping of groundwater recharge zones using multi influencing factor and Analytical Hierarchy Process. Sci. Rep. 2024, 14, 19240. [Google Scholar] [CrossRef]
- Mouhoumed, R.M.; Ekmekcioğlu, Ö.; Özger, M. An integrated groundwater vulnerability and artificial recharge site suitability assessment using GIS multi-criteria decision making approach in Kayseri Region, Turkey. Environ. Sci. Pollut. Res. 2024, 31, 39794–39822. [Google Scholar] [CrossRef]
- Ayadi, Y.; Gentilucci, M.; Ncibi, K.; Hadji, R.; Hamed, Y. Assessment of a groundwater potential zone using geospatial artificial intelligence (Geo-AI), Remote Sensing (RS), and GIS Tools in Majerda Transboundary Basin (North Africa). Water 2025, 17, 331. [Google Scholar] [CrossRef]
- Nugroho, J.T.; Lestari, A.I.; Gustiandi, B.; Sofan, P.; Suwarsono; Prasasti, I.; Rahmi, K.I.; Noviar, H.; Sari, N.M.; Manalu, R.J.; et al. Groundwater potential mapping using machine learning approach in West Java, Indonesia. Groundw. Sustain. Dev. 2024, 27, 101382. [Google Scholar] [CrossRef]
- Saaty, T.L. The Analytic Hierarchy Process: Planning. Priority Setting, Resource Allocation; McGraw Hill: New York, NY, USA, 1980. [Google Scholar]
- Malczewski, J. GIS and Multicriteria Decision Analysis; John Wiley & Sons: Hoboken, NJ, USA, 1999; ISBN 978-0-471-32944-2. [Google Scholar]
- Kpiebaya, P.; Amuah, E.E.; Shaibu, A.-G.; Baatuuwie, B.N.; Avornyo, V.K.; Dekongmen, B.W. Spatial assessment of groundwater potential using quantum GIS and multi-criteria decision analysis (QGIS-AHP) in the sawla-tuna-kalba district of Ghana. J. Hydrol. Reg. Stud. 2022, 43, 101197. [Google Scholar] [CrossRef]
- Kabeto, J.; Adeba, D.; Regasa, M.S.; Leta, M.K. Groundwater potential assessment using GIS and Remote Sensing Techniques: Case Study of West Arsi Zone, Ethiopia. Water 2022, 14, 1838. [Google Scholar] [CrossRef]
- Broshears, R.E.; Chornack, M.P.; Mueller, D.K.; Ruddy, B.C. Inventory of ground-water resources in the Kabul Basin, Afghanistan. In Scientific Investigations Report; U.S. Geological Survey: Reston, VA, USA, 2005. [Google Scholar]
- Mack, T.J.; Akbari, M.A.; Ashoor, M.H.; Chornack, M.P.; Coplen, T.B.; Emerson, D.G.; Hubbard, B.E.; Litke, D.W.; Michel, R.L.; Plummer, N.; et al. Conceptual model of water resources in the Kabul Basin, Afghanistan. In Scientific Investigations Report; U.S. Geological Survey: Reston, VA, USA, 2010. Available online: https://pubs.usgs.gov/sir/2009/5262// (accessed on 1 May 2025).
- Jha, M.K.; Chowdhury, A.; Chowdary, V.M.; Peiffer, S. Groundwater Management and development by Integrated Remote Sensing and geographic information systems: Prospects and Constraints. Water Resour. Manag. 2006, 21, 427–467. [Google Scholar] [CrossRef]
- Machiwal, D.; Jha, M.K.; Mal, B.C. Assessment of groundwater potential in a semi-arid region of India using Remote Sensing, GIS and MCDM techniques. Water Resour. Manag. 2010, 25, 1359–1386. [Google Scholar] [CrossRef]


| S. No. | Data Collected | Source | Description |
|---|---|---|---|
| 1 | Soil map | Food and Agriculture Organization of the United Nations | Scale: 1:5,000,000 |
| 2 | Land use/land cover | USGS, Landsat | 30 m grid |
| 3 | Rainfall | NASA, LaRC Power Project | --- |
| 4 | Lineament density | USGS, Landsat | 30 m grid |
| 5 | Geology | USGS, CERT Mapper | 30 m grid |
| 6 | Drainage density | USGS, Landsat | 30 m grid |
| 7 | Slope | USGS, SRTM | 30 m grid |
| Gauging Station | Latitude | Longitude | Avg_Rainfall |
|---|---|---|---|
| Cherat | 34 | 72 | 427 |
| Chitral | 36 | 72 | 415 |
| Dir | 35 | 72 | 127 |
| Drosh | 36 | 72 | 619 |
| Saidu Sharif | 35 | 72 | 1474 |
| Kalam | 35 | 73 | 639 |
| Malam Jabba | 35 | 73 | 728 |
| Peshawar | 34 | 72 | 817 |
| North Salang | 35 | 69 | 990 |
| South Salang | 35 | 69 | 1036 |
| Paghman | 34 | 69 | 437 |
| Kabul | 34 | 69 | 299 |
| Saaty’s Scale Values | Description |
|---|---|
| 1 | Equally important |
| 2 | Equally to moderately important |
| 3 | Moderately important |
| 4 | Moderately to strongly important |
| 5 | Strongly important |
| 6 | Strongly to very strongly important |
| 7 | Very Strongly important |
| 8 | Very strongly to extremely important |
| 9 | Extremely important |
| Parameters | Rainfall | Geology | Lineament Density | Drainage Density | Slope | Soil Type | LULC | |
|---|---|---|---|---|---|---|---|---|
| Rainfall | 1 | 1 | 5 | 4 | 6 | 5 | 2 | 31.86% |
| Geology | 1 | 1 | 3 | 3 | 4 | 6 | 3 | 27.71% |
| Lineament density | 1/5 | 1/3 | 1 | 1 | 3 | 3 | 2 | 11.65% |
| Drainage density | 1/4 | 1/3 | 1 | 1 | 3 | 1 | 2 | 10.25% |
| Slope | 1/6 | 1/4 | 1/3 | 1/3 | 1 | 1 | 1 | 5.17% |
| Soil type | 1/5 | 1/6 | 1/3 | 1 | 1 | 1 | 1 | 5.93% |
| LULC | 1/2 | 1/3 | 1/2 | ½ | 1 | 1 | 1 | 7.43% |
| Sum | 3.32 | 3.4 | 11.67 | 10.83 | 19 | 18 | 12 |
| n | 10 | 9 | 8 | 7 | 6 | 5 | 4 | 3 | 2 | 1 |
|---|---|---|---|---|---|---|---|---|---|---|
| RCI | 1.49 | 1.45 | 1.41 | 1.32 | 1.24 | 1.12 | 0.89 | 0.58 | 0 | 0 |
| Layers | Sum | ||
|---|---|---|---|
| Rainfall | 3.32 | 0.318 | 1.06 |
| Lithology | 3.4 | 0.28 | 0.95 |
| Lineament density | 11.67 | 0.12 | 1.4 |
| Drainage density | 10.28 | 0.10 | 1.08 |
| Slope | 19 | 0.051 | 0.97 |
| Soil type | 18 | 0.06 | 1.08 |
| LULC | 12 | 0.73 | 0.88 |
| Sum = 7.42 |
| Factors/Layers | Classes | Potential for Groundwater | Class Rank | Normalized Weights | Weights of Each Rank |
|---|---|---|---|---|---|
| Rainfall | 127–396 | Very poor | 1 | 32 | 32 |
| 396–665 | Poor | 2 | 64 | ||
| 665–934 | Medium | 3 | 96 | ||
| 934–1203 | Good | 4 | 128 | ||
| 1203–1472 | Very good | 5 | 160 | ||
| Geology | Cambrian metamorphic intrusive rocks (CMI) | Very good | 2 | 27 | 54 |
| Carboniferous sedimentary rocks (Cs) | Very good | 3 | 81 | ||
| Jurassic and Triassic rocks (Jms) | Very good | 4 | 108 | ||
| Cretaceous and Jurassic sedimentary rocks (KJs). | Very good | 4 | 108 | ||
| Cretaceous sedimentary rocks (Ks) | Medium | 3 | 81 | ||
| Metamorphic intrusive rocks (Mi) | Good | 2 | 54 | ||
| Mesozoic intrusive rocks (Mz) | Good | 2 | 54 | ||
| Neogene sedimentary rocks (N) | Good | 3 | 81 | ||
| Permian rocks (Pr) | Medium | 2 | 54 | ||
| Permian intrusive metamorphic rocks (Prim) | Poor | 2 | 54 | ||
| Undivided Paleozoic rocks (Pz) | Very good | 3 | 81 | ||
| Paleozoic igneous rocks (Pzi) | Poor | 2 | 54 | ||
| Lower Paleozoic rocks (Pzl) | Poor | 2 | 54 | ||
| Paleozoic Precambrian rocks (PzPc) | Very good | 3 | 81 | ||
| Quaternary sediments (Q) | Very good | 4 | 108 | ||
| Undivided Silurian rocks (S) | Good | 3 | 81 | ||
| Tertiary igneous rocks (Ti) | Good | 2 | 54 | ||
| Triassic rocks (Tr) | Poor | 3 | 81 | ||
| Triassic metamorphic and sedimentary rocks (Trms) | Medium | 3 | 81 | ||
| Tertiary sedimentary rocks (Ts) | Poor | 4 | 108 | ||
| Undivided igneous rocks (Pc) | Good | 3 | 81 | ||
| Lineament density | 0–3 | Poor | 2 | 12 | 24 |
| 3–9 | Medium | 3 | 36 | ||
| 9–15 | Good | 4 | 48 | ||
| 15–26 | Very good | 5 | 60 | ||
| 26–51 | Very good | 5 | 60 | ||
| Drainage density | 0–4 | Poor | 2 | 10 | 20 |
| 4–12 | Medium | 3 | 30 | ||
| 12–21 | Good | 4 | 40 | ||
| 21–30 | Very good | 5 | 50 | ||
| 30–47 | Very good | 5 | 50 | ||
| Slope | 0–2,375,614 | Very good | 5 | 5 | 25 |
| 2,375,614–5,279,143 | Good | 4 | 20 | ||
| 5,279,143–8,182,672 | Medium | 3 | 15 | ||
| 81,826,72–12,933,901 | Poor | 2 | 10 | ||
| 12,933,901–67,309,080 | Very Poor | 1 | 5 | ||
| Soil | Rocky land with Lithic Cryorthents (Ro_Li_Cr) | Poor | 2 | 6 | 12 |
| Rocky land with ice-capped bare rock (Ro_Ic) | Good | 4 | 24 | ||
| Xerochrepts with Xerorthents (Xe_Xe) | Poor | 2 | 12 | ||
| Haplocambids with Torriorthents (Ha_To) | Poor | 2 | 12 | ||
| Rocky land with Lithic Haplocryids (Ro_Li_Ha_Cr) | Medium | 3 | 18 | ||
| Calcixeralfs with Xerochrepts (Ca_Xe) | Very poor | 1 | 6 | ||
| Mountain rock outcrops with very shallow loamy soils (Lo_Sh_So) | Poor | 2 | 12 | ||
| Rocky land with Lithic Haplocambids (Ro_Li_Ha_ca) | Poor | 2 | 12 | ||
| Torriorthents with Torrifluvents (To_Th_To_Fl) | Very good | 5 | 30 | ||
| Torrifluvents with Torripsamments (To_To) | Very poor | 1 | 6 | ||
| Loamy and clayey, mainly non-calcareous soils (Lo_Cl_Nc) | Poor | 2 | 12 | ||
| Loamy and clayey partly non-calcareous soils (Lo_Cl) | Medium | 3 | 18 | ||
| Mountainous area with mainly loamy, shallow soils (Ro_Lo_Sh) | Poor | 2 | 12 | ||
| LULC | Rivers | Very good | 5 | 8 | 40 |
| Trees | Poor | 2 | 16 | ||
| Water Body | Very good | 5 | 40 | ||
| Agriculture land | Medium | 3 | 24 | ||
| Buildings | Poor | 2 | 16 | ||
| Mountains | Good | 4 | 32 | ||
| Snow | Very good | 5 | 40 | ||
| Bare land | Medium | 3 | 24 |
| GWPZ | Distribution of Different Depths of Tube Well | ||||
|---|---|---|---|---|---|
| 1–45 | 46–90 | 91–115 | 116–135 | >135 | |
| Very good | 16 | 130 | 67 | 1 | 4 |
| Good | 6 | 27 | 14 | 6 | 5 |
| Medium | 4 | 23 | 14 | 2 | 3 |
| Poor | 0 | 6 | 9 | 0 | 0 |
| Very poor | 0 | 12 | 4 | 1 | 0 |
| No. of tube wells in different zones | 26 | 198 | 108 | 10 | 12 |
| No. of tube wells in medium or above GWPZ | 26 | 180 | 95 | 9 | 12 |
| % of tube wells in medium or above GWPZ | 8.07 | 55.90 | 29.50 | 2.80 | 3.73 |
Disclaimer/Publisher’s Note: The statements, opinions and data contained in all publications are solely those of the individual author(s) and contributor(s) and not of MDPI and/or the editor(s). MDPI and/or the editor(s) disclaim responsibility for any injury to people or property resulting from any ideas, methods, instructions or products referred to in the content. |
© 2025 by the authors. Licensee MDPI, Basel, Switzerland. This article is an open access article distributed under the terms and conditions of the Creative Commons Attribution (CC BY) license (https://creativecommons.org/licenses/by/4.0/).
Share and Cite
Hussan, W.U.; Irfan, M.; Waseem, M.; Yaseen, M.; Karam, W.; Adnan, M.; Adnan, R.M.; Mo, W. Assessing Groundwater Potential in the Kabul River Basin of Pakistan: A GIS and Analytical Hierarchy Process Approach for Sustainable Water Management. Water 2025, 17, 1584. https://doi.org/10.3390/w17111584
Hussan WU, Irfan M, Waseem M, Yaseen M, Karam W, Adnan M, Adnan RM, Mo W. Assessing Groundwater Potential in the Kabul River Basin of Pakistan: A GIS and Analytical Hierarchy Process Approach for Sustainable Water Management. Water. 2025; 17(11):1584. https://doi.org/10.3390/w17111584
Chicago/Turabian StyleHussan, Waqas Ul, Muhammad Irfan, Muhammad Waseem, Muhammad Yaseen, Wasim Karam, Muhammad Adnan, Rana Muhammad Adnan, and Wang Mo. 2025. "Assessing Groundwater Potential in the Kabul River Basin of Pakistan: A GIS and Analytical Hierarchy Process Approach for Sustainable Water Management" Water 17, no. 11: 1584. https://doi.org/10.3390/w17111584
APA StyleHussan, W. U., Irfan, M., Waseem, M., Yaseen, M., Karam, W., Adnan, M., Adnan, R. M., & Mo, W. (2025). Assessing Groundwater Potential in the Kabul River Basin of Pakistan: A GIS and Analytical Hierarchy Process Approach for Sustainable Water Management. Water, 17(11), 1584. https://doi.org/10.3390/w17111584