Article

Hydrochemical Characteristics and Dominant Controlling Factors of the Qujiang River Under Dual Natural–Anthropogenic Influences

1
Institute of Disaster Prevention, Sanhe 065201, China
2
Zhejiang Geological Exploration Institute, General Administration of Metallurgical Geology of China, Quzhou 324000, China
3
Chinese Academy of Natural Resources Economics, Beijing 100035, China
4
No. 1 Geological Exploration Institute, General Administration of Metallurgical Geology of China, Sanhe 065201, China
5
No. 3 Geological Exploration Institute of Non-ferrous Metals in Qinghai Province, Xining 810001, China
*
Author to whom correspondence should be addressed.
Water 2025, 17(11), 1581; https://doi.org/10.3390/w17111581
Submission received: 8 April 2025 / Revised: 21 May 2025 / Accepted: 21 May 2025 / Published: 23 May 2025
(This article belongs to the Special Issue Hydrochemistry and Isotope Hydrology for Groundwater Sustainability)

Abstract

:
This study investigated the hydrochemical characteristics, solute sources, and controlling factors of the Qujiang River, a vital tributary of the Qiantangjiang River, on the basis of 61 surface water samples collected from July to September 2019. A multi-method framework integrating ArcGIS spatial analysis, a Piper trilinear diagram, a Gibbs diagram, ion ratio analysis, and principal component analysis (PCA) was systematically applied. The results demonstrate significant spatial heterogeneity in pH values (6.39–7.15 in the upper reaches, 6.31–8.83 in the middle reaches, and 6.85–8.1 in the lower reaches), with hydrochemical facies dominated by Ca-HCO3 types (87% frequency) in the upper–middle reaches, transitioning to SO4·Cl-Na and SO4·Cl-Na·Ca mixed types downstream. Source apportionment indicates that carbonate weathering and atmospheric precipitation are the primary controls on hydrochemistry in the upper and middle reaches, whereas industrial effluents, evidenced by a 2.3-fold increase in SO42− concentration, and domestic sewage, with Cl levels reaching 16.07 mg/L, are the dominant influences in the lower reaches. This study’s innovation lies in the quantitative separation of natural weathering (68% contribution) and anthropogenic activities (32%) through an integrated methodological approach, offering a basin-scale understanding of longitudinal hydrochemical evolution. These results provide valuable insights for the management and ecological conservation of medium- to small-sized basins.

1. Introduction

Rivers act as vital linkages between terrestrial ecosystems and marine environments, playing an indispensable role in sustaining ecological balance, ensuring water resource availability, and supporting regional economic development. The hydrochemical composition of rivers contains crucial information reflecting both natural geomorphic processes, such as rock weathering, atmospheric precipitation, and evaporative concentration, as well as anthropogenic disturbances, including industrial discharges, agricultural irrigation, and domestic wastewater [1,2,3,4]. Consequently, understanding the spatiotemporal evolution of river hydrochemistry and its controlling factors is fundamental for assessing the health of aquatic ecosystems and promoting sustainable water resource management.
Global-scale studies on large rivers have established systematic frameworks. For example, the Amazon River has high dissolved organic carbon (DOC) and low ionic concentrations due to intense weathering and biogeochemical cycling [5], whereas the Nile River has elevated salinity due to Aswan Dam regulation and agricultural practices [6,7]. In China, research on the Yangtze and Yellow Rivers reveals codominant controls by carbonate weathering (contributing 65% of the Ca2+ in the Yangtze River Basin) and anthropogenic inputs (e.g., 3.44 mg/L NO3 from fertilizer application in the Yellow River Basin) [8,9,10]. However, research on medium- and small-sized basins remains fragmented and is often confined to localized case studies. Notable instances include sulfate enrichment (18.3 mg/L SO42−) in the mid-reaches of the Qiantang River caused by textile effluents [11] and chloride accumulation (24.8 mg/L Cl) in the Min River estuary resulting from seawater intrusion [12]. Existing studies primarily concentrate on individual pollution sources, such as agricultural non-point or industrial point sources, with limited emphasis on basin-wide, multi-factor interactions. Against this backdrop, this study conducts a comprehensive investigation of the Qujiang River Basin.
The Qujiang River, a significant tributary of the Qiantangjiang River with a basin area of 11,138 km2, originates from Huangshan Mountain in Anhui Province and flows through the Jinqu Basin before merging into the Qiantang River, serving as the principal water source for Zhejiang’s “Jinqu-Li Ecological Economic Zone” [13]. However, rapid industrialization and intensive agricultural activities have led to progressive deterioration of water quality [14]. Previous research has primarily focused on hydrological analysis [15,16], with limited attention given to pollution dynamics. Three major knowledge gaps remain: (1) the spatial differentiation of hydrochemical facies across the entire basin is not well understood; (2) the respective contributions of natural weathering processes, such as red-bed clastic dissolution, and anthropogenic influences, including chemical wastewater discharge, have not been quantitatively assessed; and (3) effective methodologies for distinguishing the combined effects of industrial, agricultural, and domestic pollution are lacking.
This study addresses these gaps through a comprehensive investigation of the Qujiang River. We systematically analyze spatial hydrochemical variations through multiple methods: visualize the spatial distribution of ion concentrations by using the Inverse Distance Weighting (IDW) method in ArcGIS; interpret hydrochemical types with Piper trilinear diagrams; and comprehensively analyze the sources of ion components by means of Gibbs diagrams, ion ratio methods, and principal component analysis (PCA). By systematically analyzing spatial hydrochemical variations and employing multi-method diagnostics (Gibbs diagrams, ionic ratios, and principal component analysis), we aim to unravel source-to-sink dynamics and elucidate natural–anthropogenic interaction mechanisms. The results provide scientific foundations for water resource allocation, pollution control strategies, and ecological restoration in the Qujiang Basin while establishing a transferable paradigm for hydrochemical research in analogous watersheds.

2. Materials and Methods

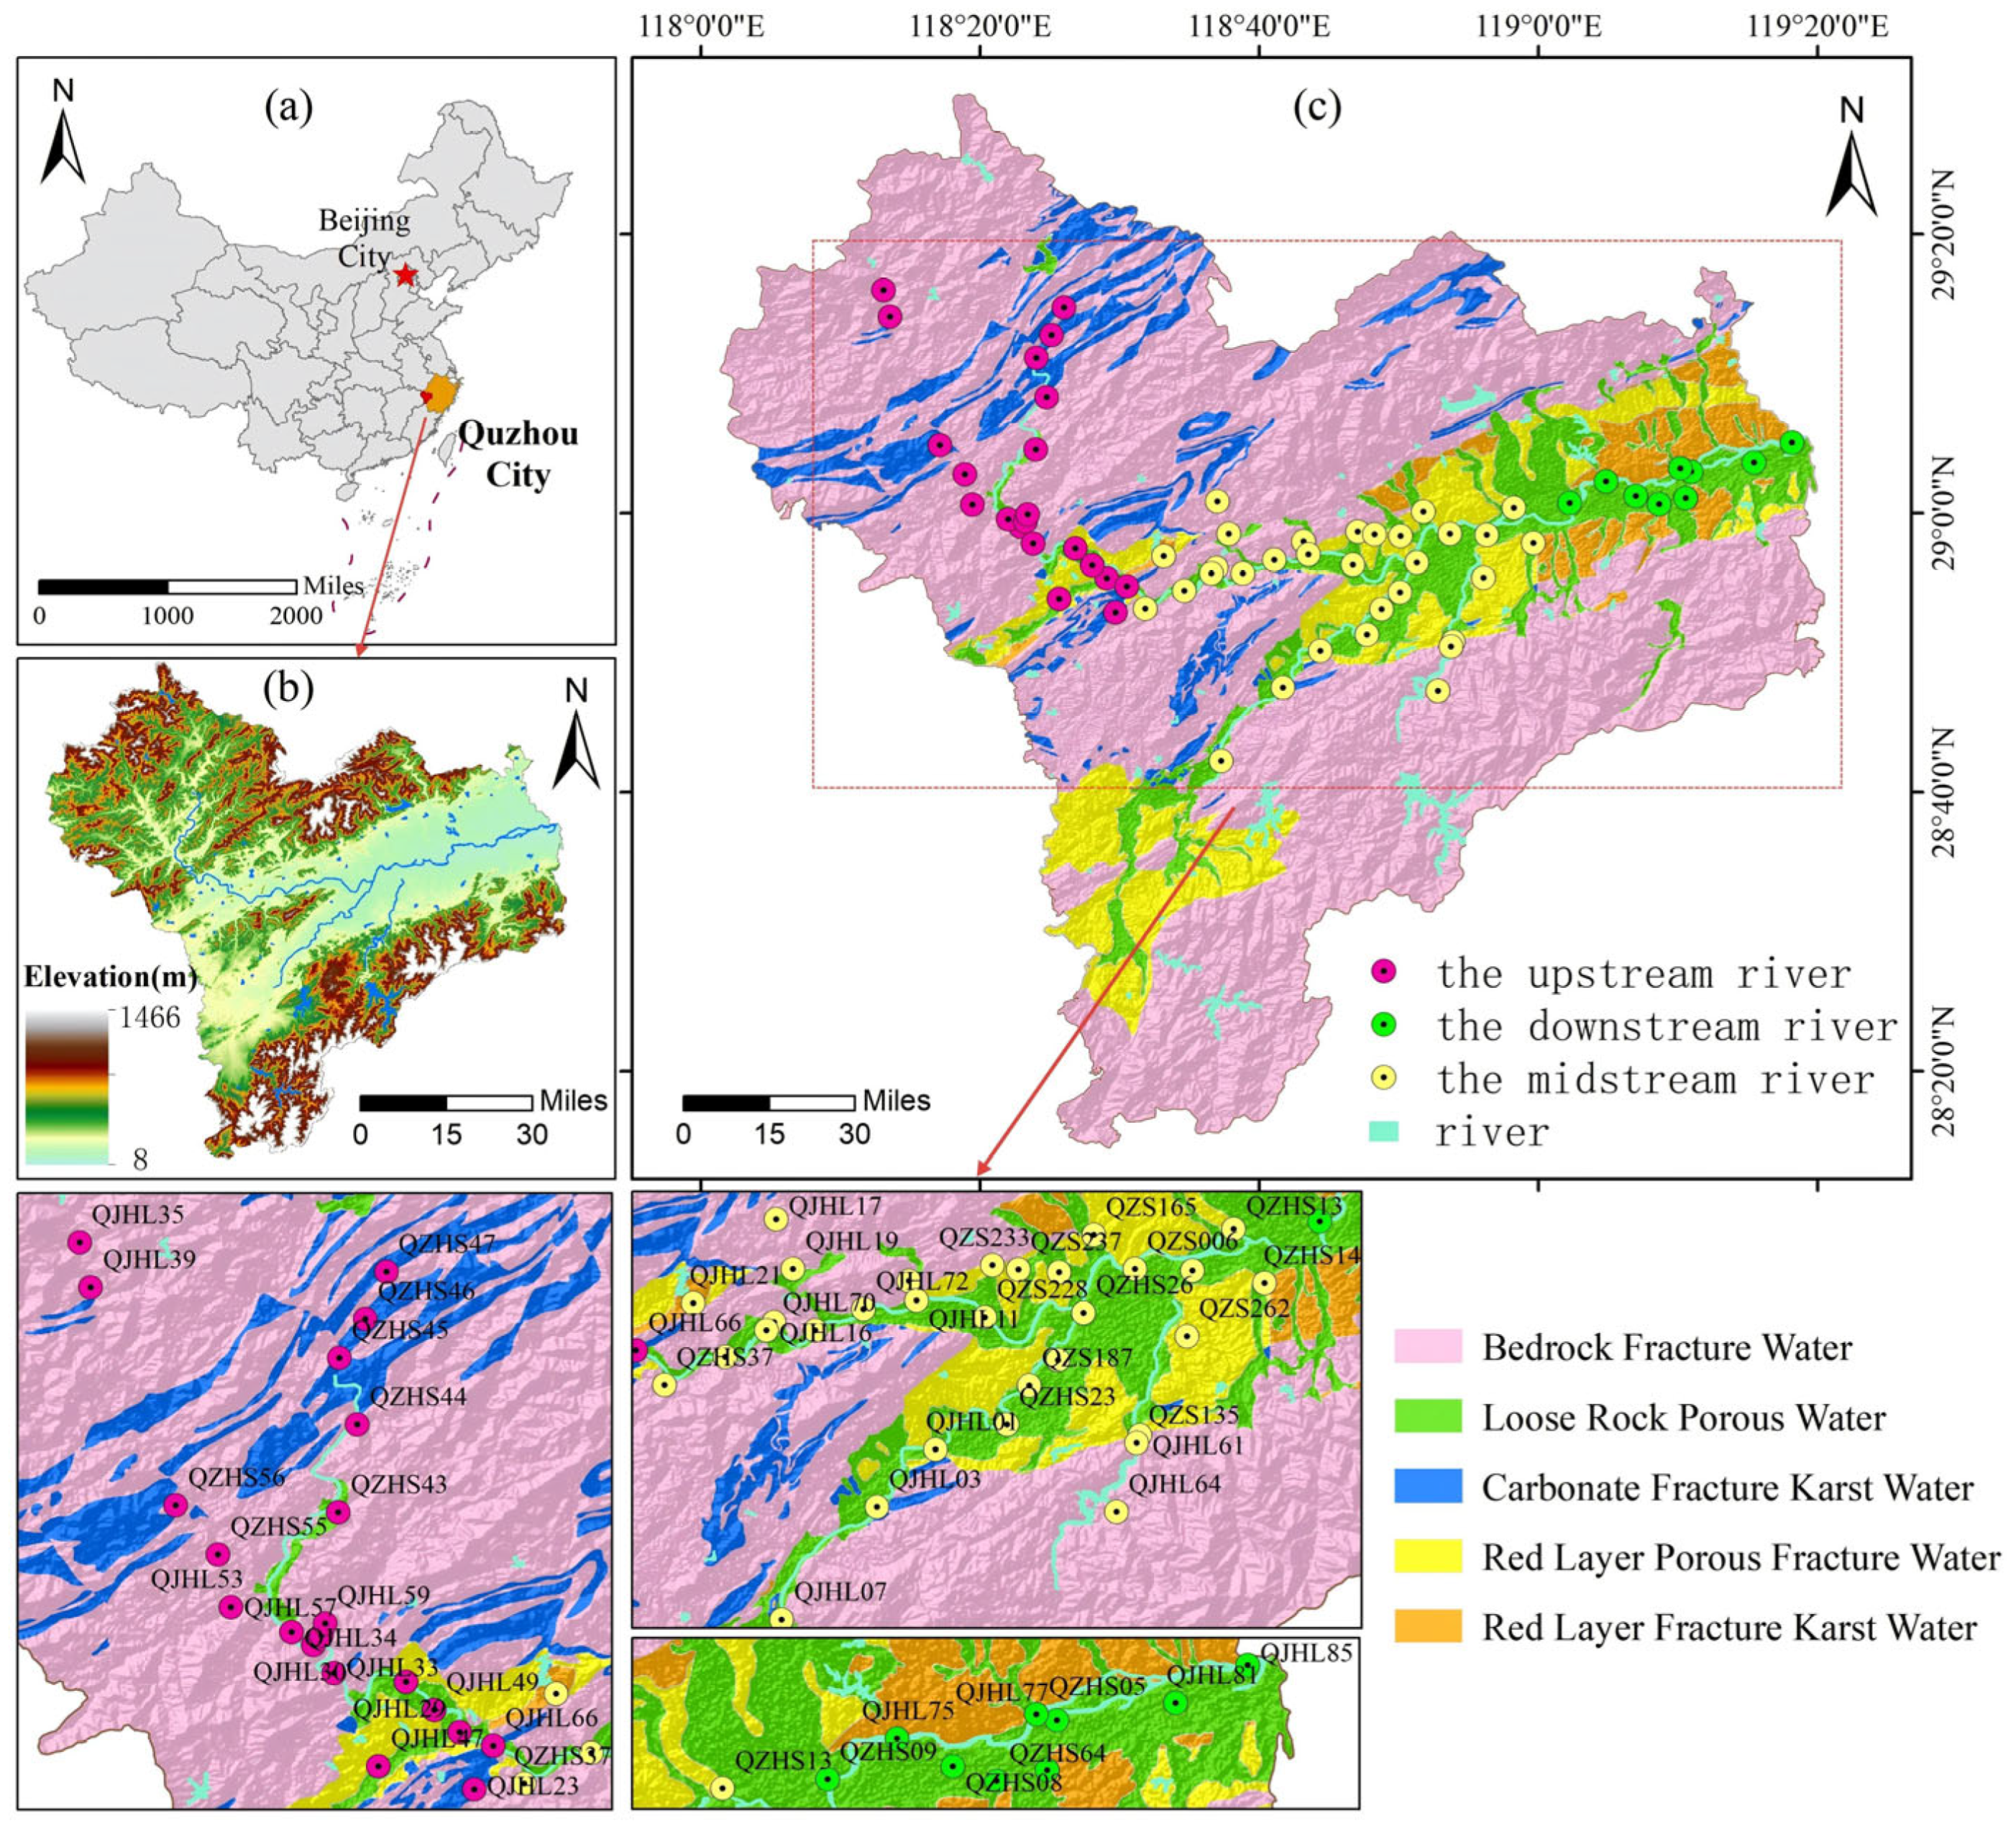
2.1. Overview of the Study Area

The Quzhou study area, located in Western Zhejiang Province (28°15′–29°30′ N, 118–119°20′ E), encompasses the upper, middle, and lower reaches of the Qujiang River system, a 140 km long critical tributary of the Qiantangjiang River. The upper basin, situated on the periphery of the Jinqu Basin, is characterized by low mountains, high peaks, and ridgelines, whereas the middle–lower reaches within the basin predominantly feature red-bed hills, intermountain basins, residual hills, and alluvial plains [17]. Elevation gradients in the region range from 50 to 300 m above sea level (ASL), with detailed geomorphological features shown in Figure 1a,b.
The area is characterized by a humid subtropical monsoon climate, receiving an average annual precipitation of 1908.04 mm and maintaining a mean annual temperature of 17.5 °C.
Geologically, the upper reaches are characterized by Early Paleozoic Ordovician and Cambrian strata, predominantly composed of fine sandstones, siltstones, and mudstones. In contrast, the middle and lower reaches are dominated by post-Cretaceous formations, mainly consisting of conglomerates, medium-to-coarse sandstones, and fine siltstones. Hydrogeologically, the aquifer system consists of two principal types: (1) unconsolidated porous aquifers and (2) red-bed clastic aquifers, which exhibit dual porosity–permeability regimes of porous water (intergranular flow) and fractured water (bedrock fracture networks) [18]. The spatial distributions of hydrogeological units are delineated in Figure 1c. Specific hydrogeological features can be seen in Figure 2.

2.2. Sample Collection and Testing

A total of 61 surface water samples were collected between July and September 2019, with sampling locations illustrated in Figure 1c. The sampling procedure followed the guidelines outlined in the “Technical Specifications for Surface Water Environmental Quality Monitoring” (HJ 91.2—2022), employing quadruple 250 mL sampling volumes. Prior to sampling, all containers were rinsed 2–3 times with in situ water to remove residual contaminants [19]. The determination methods for specific parameters are shown in Table 1.
To comprehensively assess the hydrochemical characteristics of the study area, this research integrated multiple advanced analytical methods. Spatial distribution patterns of water quality parameters were generated via the inverse distance weighting (IDW) interpolation method in ArcGIS 10.8, which extrapolates measured data from sampling points to visualize regional heterogeneity. Additionally, Piper trilinear diagrams constructed in Origin 2021 were assessed according to the ion composition and chemical types of the regional surface water [20]. The impacts of rock weathering, precipitation, and evaporation on hydrochemistry were investigated using Gibbs diagrams [21]. Finally, PCA loading plots generated in Origin 2021 were used to visually interpret the contributions of ions to principal components, providing critical evidence for deciphering hydrochemical evolution pathways.

3. Results and Discussion

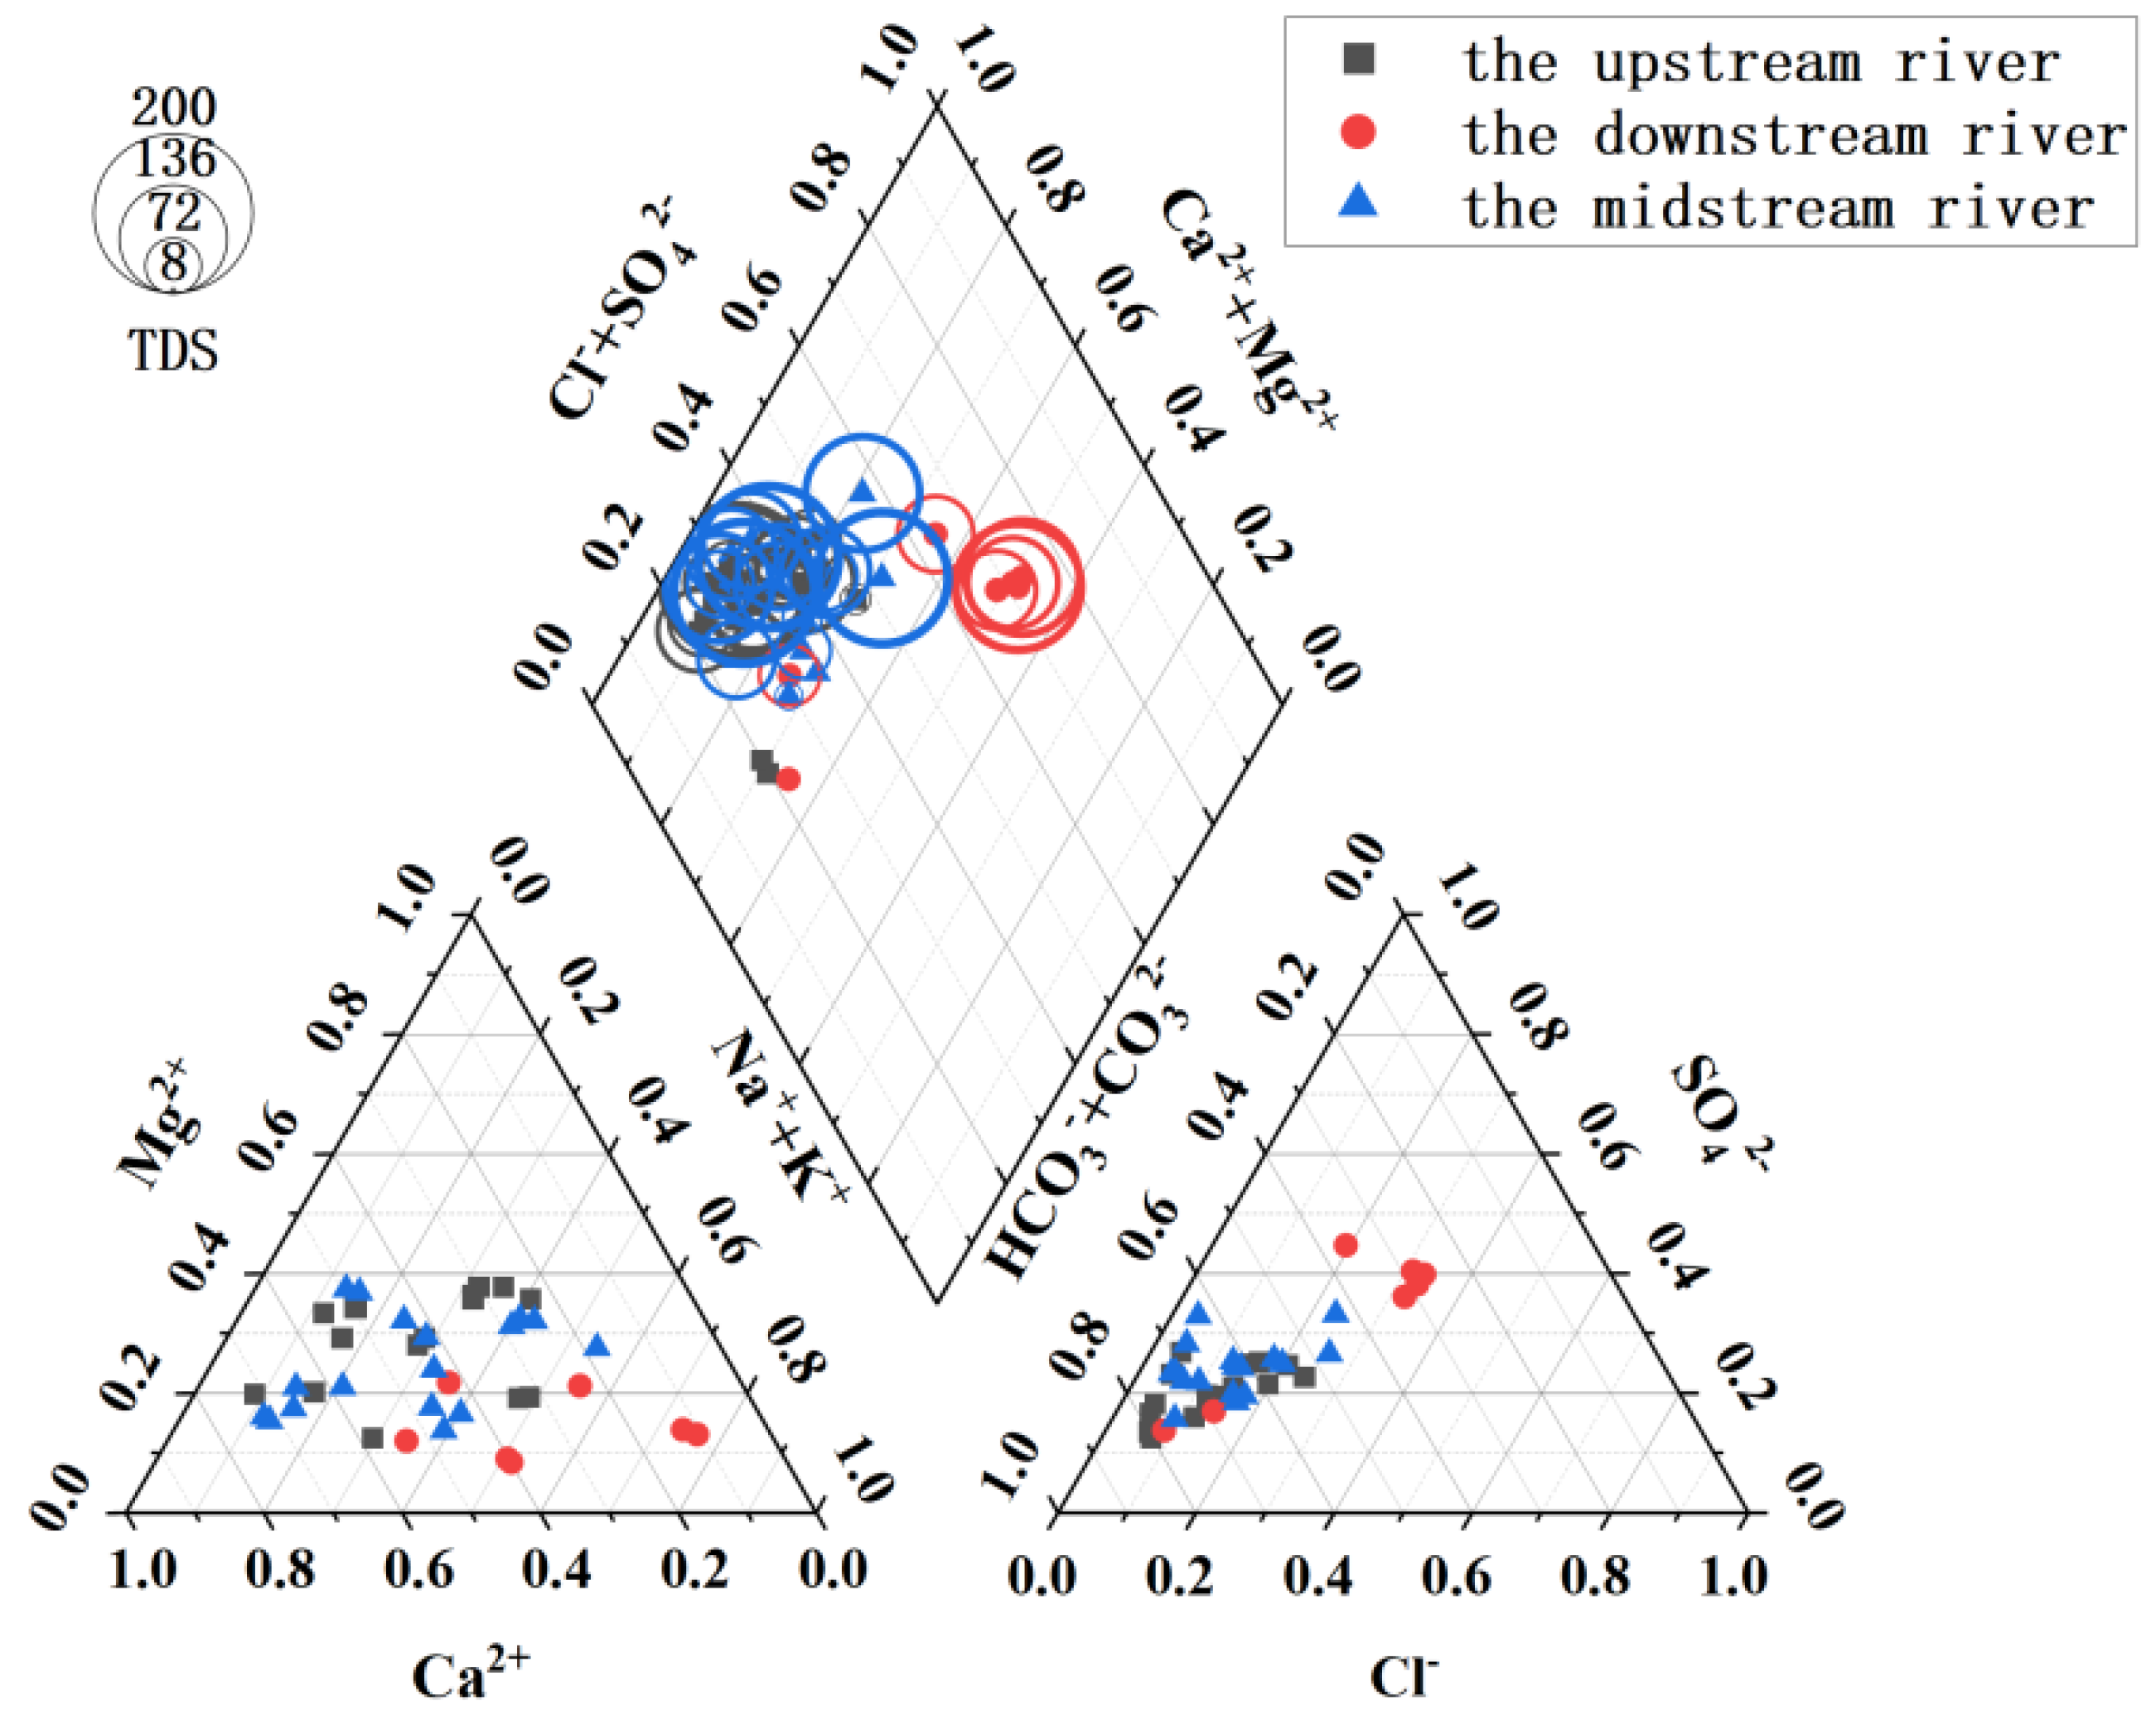
3.1. Hydrochemical Composition Characteristics of Qujiang River Basin

A statistical analysis was performed on the test data of 61 surface water sampling points in Section 2.2. The analysis results are shown in Table 2. The pH values in the upstream section of the river ranged from 6.39 to 7.15, with an average of 6.914, indicating mildly acidic conditions. Among the cations, Ca2+ and Na+ were predominant, with average concentrations of 20.529 mg/L and 4.423 mg/L, respectively. For anions, HCO3 and SO42− were the main components, with average concentrations of 54.288 mg/L and 12.908 mg/L, respectively. In the midstream section, the pH values fluctuated significantly between 6.31 and 8.83, with an average of 7.04, indicating a neutral character. The dominant cations were Ca2+ and Na+, with average concentrations of 25.852 mg/L and 5.566 mg/L, respectively, whereas the primary anions were HCO3 and SO42−, averaging 62.314 mg/L and 18.347 mg/L, respectively. The downstream pH values ranged from 6.85 to 8.1, with an average of 7.463, indicating weak alkaline properties. The major cations were Na+ and Ca2+, with average concentrations of 17.820 mg/L and 17.190 mg/L, respectively, and the dominant anions were HCO3 and SO42−, averaging 40.425 mg/L and 29.835 mg/L, respectively. These indicators are key components of the hydrochemical composition and play a significant role in determining hydrochemical types and understanding hydrochemical evolution processes. In addition, the average TDS shows a gradual increasing trend from 79.75 mg/L in the upper reaches to 113 mg/L in the lower reaches. Regarding metal ions, the exceedance of Mn, Fe, As, and Hg is relatively severe. High-value areas for manganese and iron appear in the middle reaches, with maximum values of 200 mg/L and 337.51 mg/L, respectively. The As concentration generally exceeds the standard in the middle and lower reaches, reaching a maximum of 2.8 mg/L.
Analysis of the boxplots (Figure 3a) revealed that the K+ and Mg2+ concentrations were the lowest, whereas HCO3 was the most abundant ion across the entire Qujiang River Basin. The upstream and middle reaches presented significant variations in HCO3, SO42−, and Ca2+ concentrations. Notably, the Na+, Cl, Ca2−, and SO42− concentrations were significantly higher in the middle–lower reaches than in the upstream section.
We assessed whether the water quality of the Qujiang River meets the requirements of ecological protection and the safety of domestic water for residents. A comparison with the Environmental Quality Standards for Surface Water (GB 3838–2002) [22] and the Sanitary Standards for Drinking Water (GB 5749–2006) [23] revealed that several ions exceeded permissible concentrations. Figure 3b presents boxplots of the ions surpassing these standards in the surface water of the Qujiang River. Among them, Mn2+ exhibited the most significant exceedance. The exceeding standard rate can reach 85%, followed by Fe3+, Hg2+, and As3+. The boxplots further illustrate pronounced spatial variability in Mn2+ and Fe3+ concentrations across the basin, whereas Hg2+ and As3+ levels remained relatively stable throughout the watershed. The box plots also show that the pH values in the middle and lower reaches are indeed higher than those in the upper reaches. Similarly, the concentrations of NO3 and TDS in the middle and lower reaches are greater than those in the upper reaches, consistent with the previous conclusions.

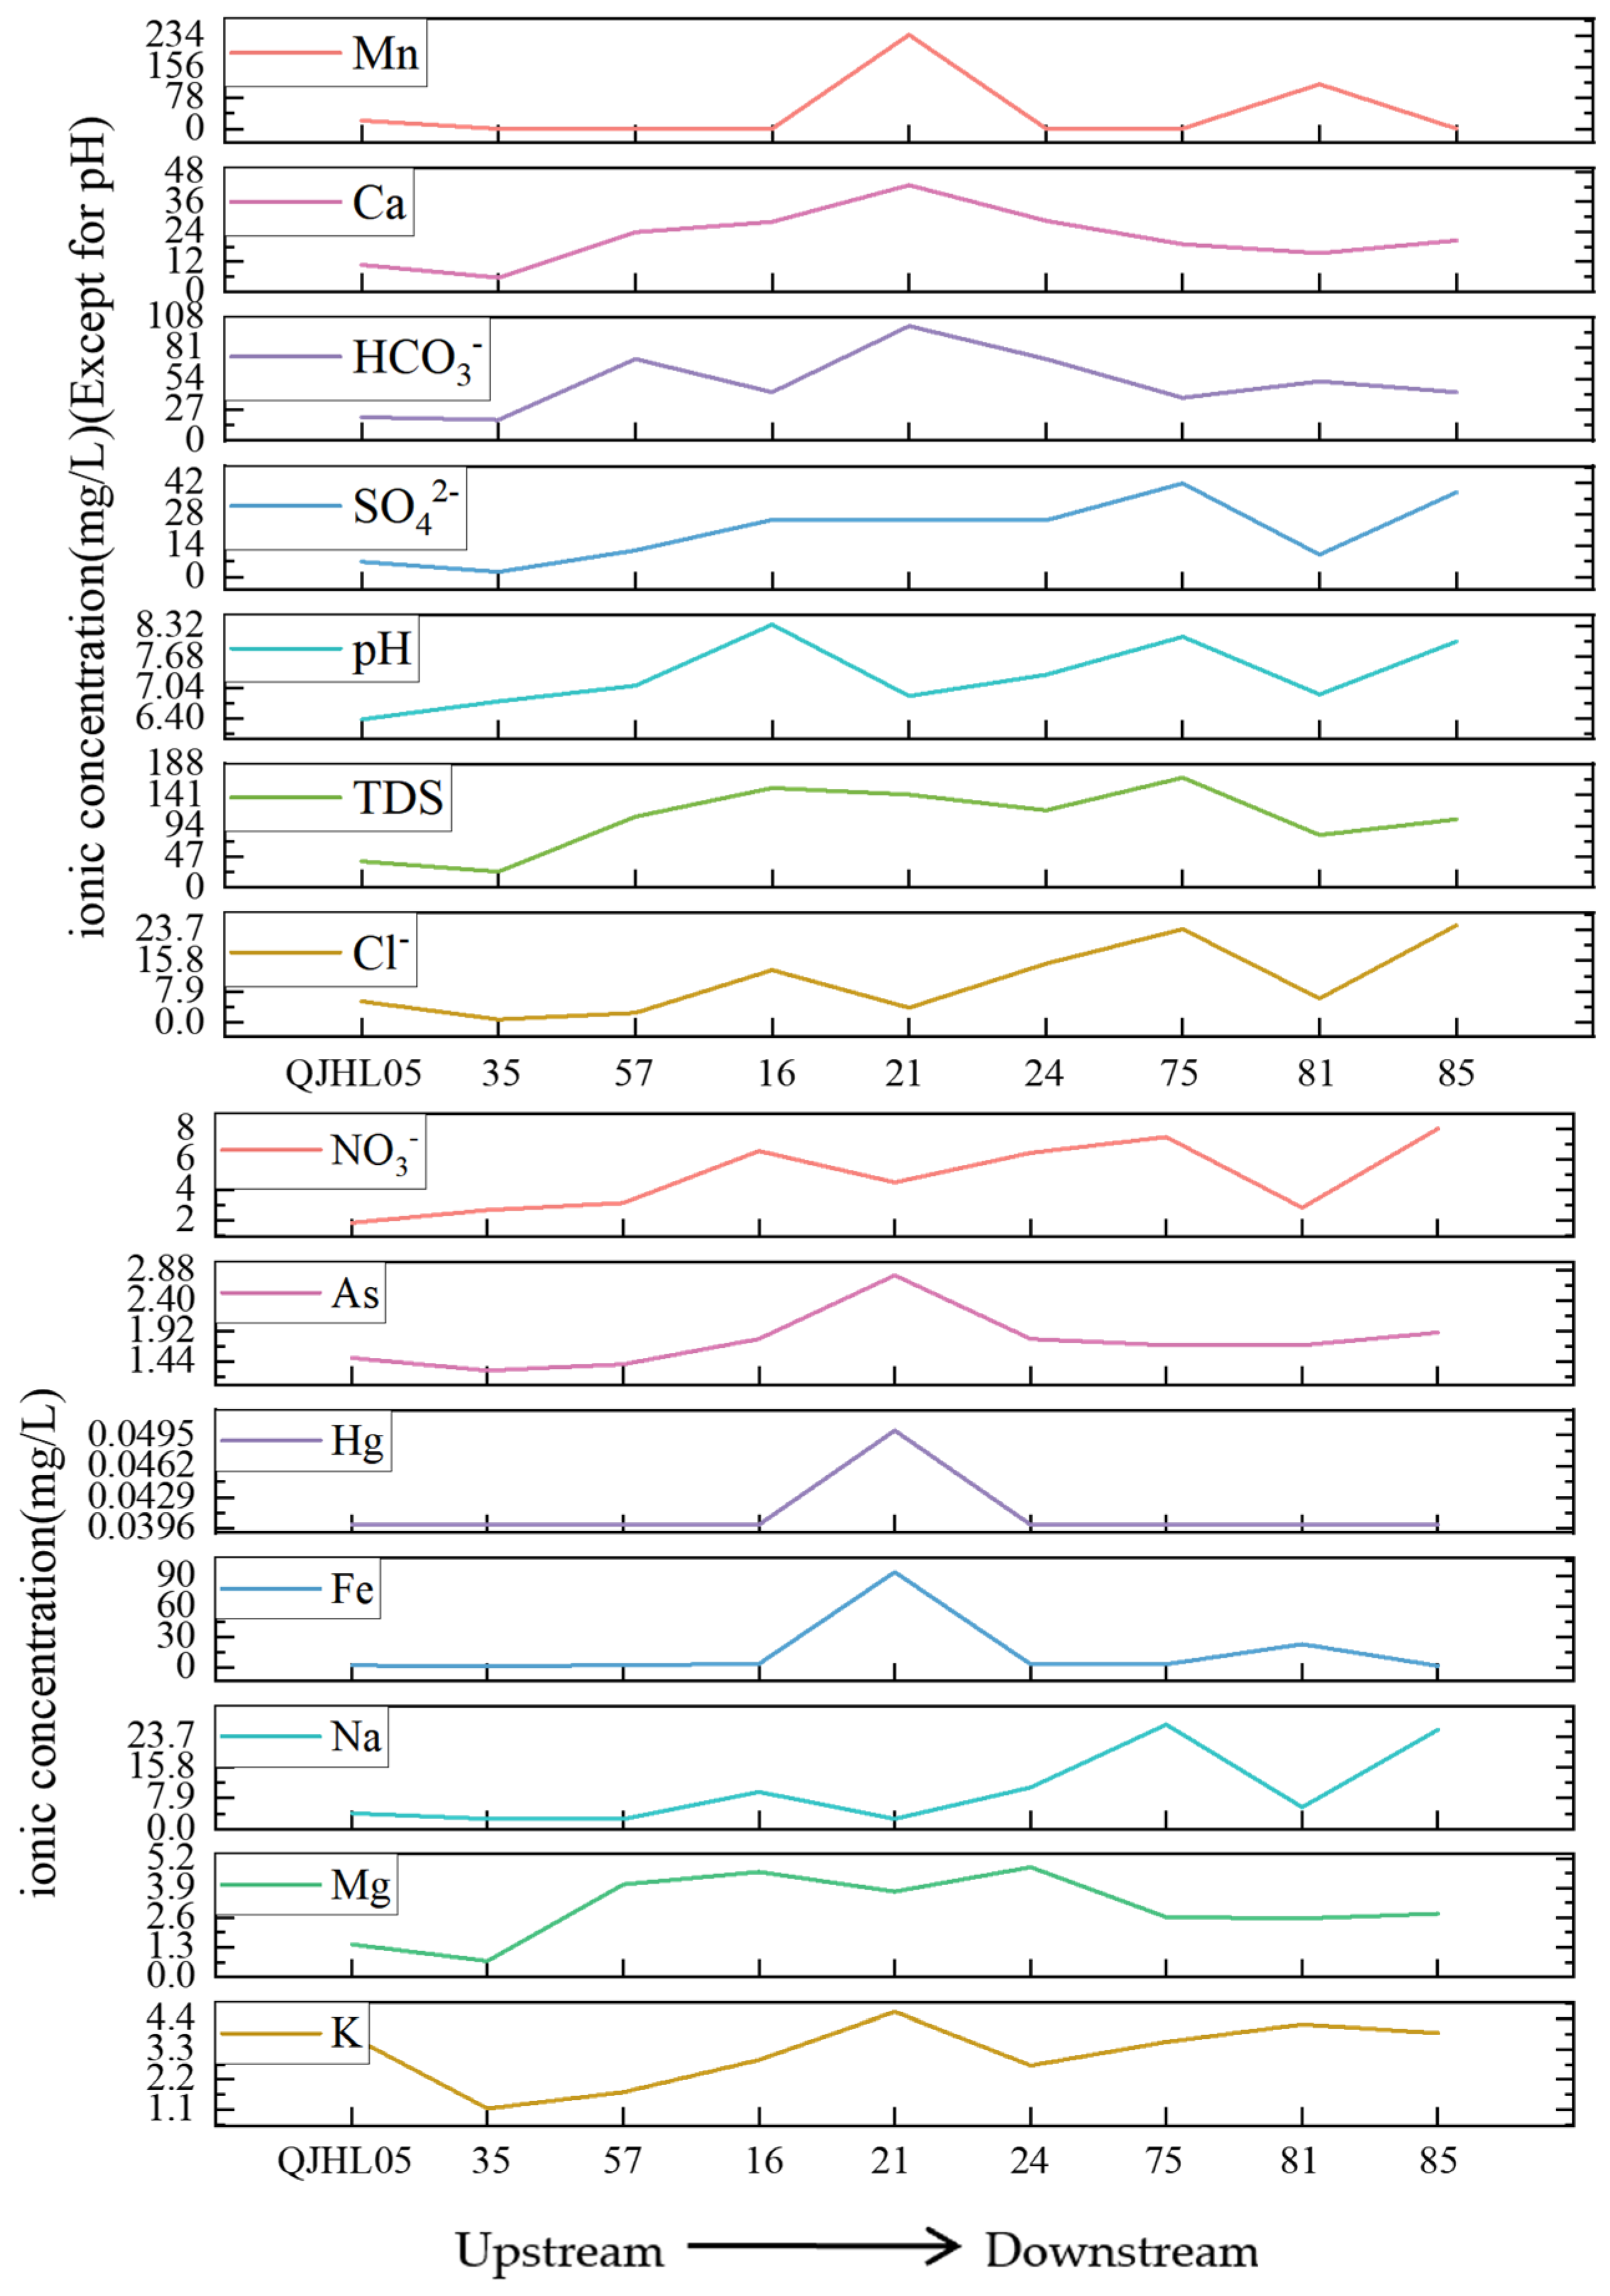
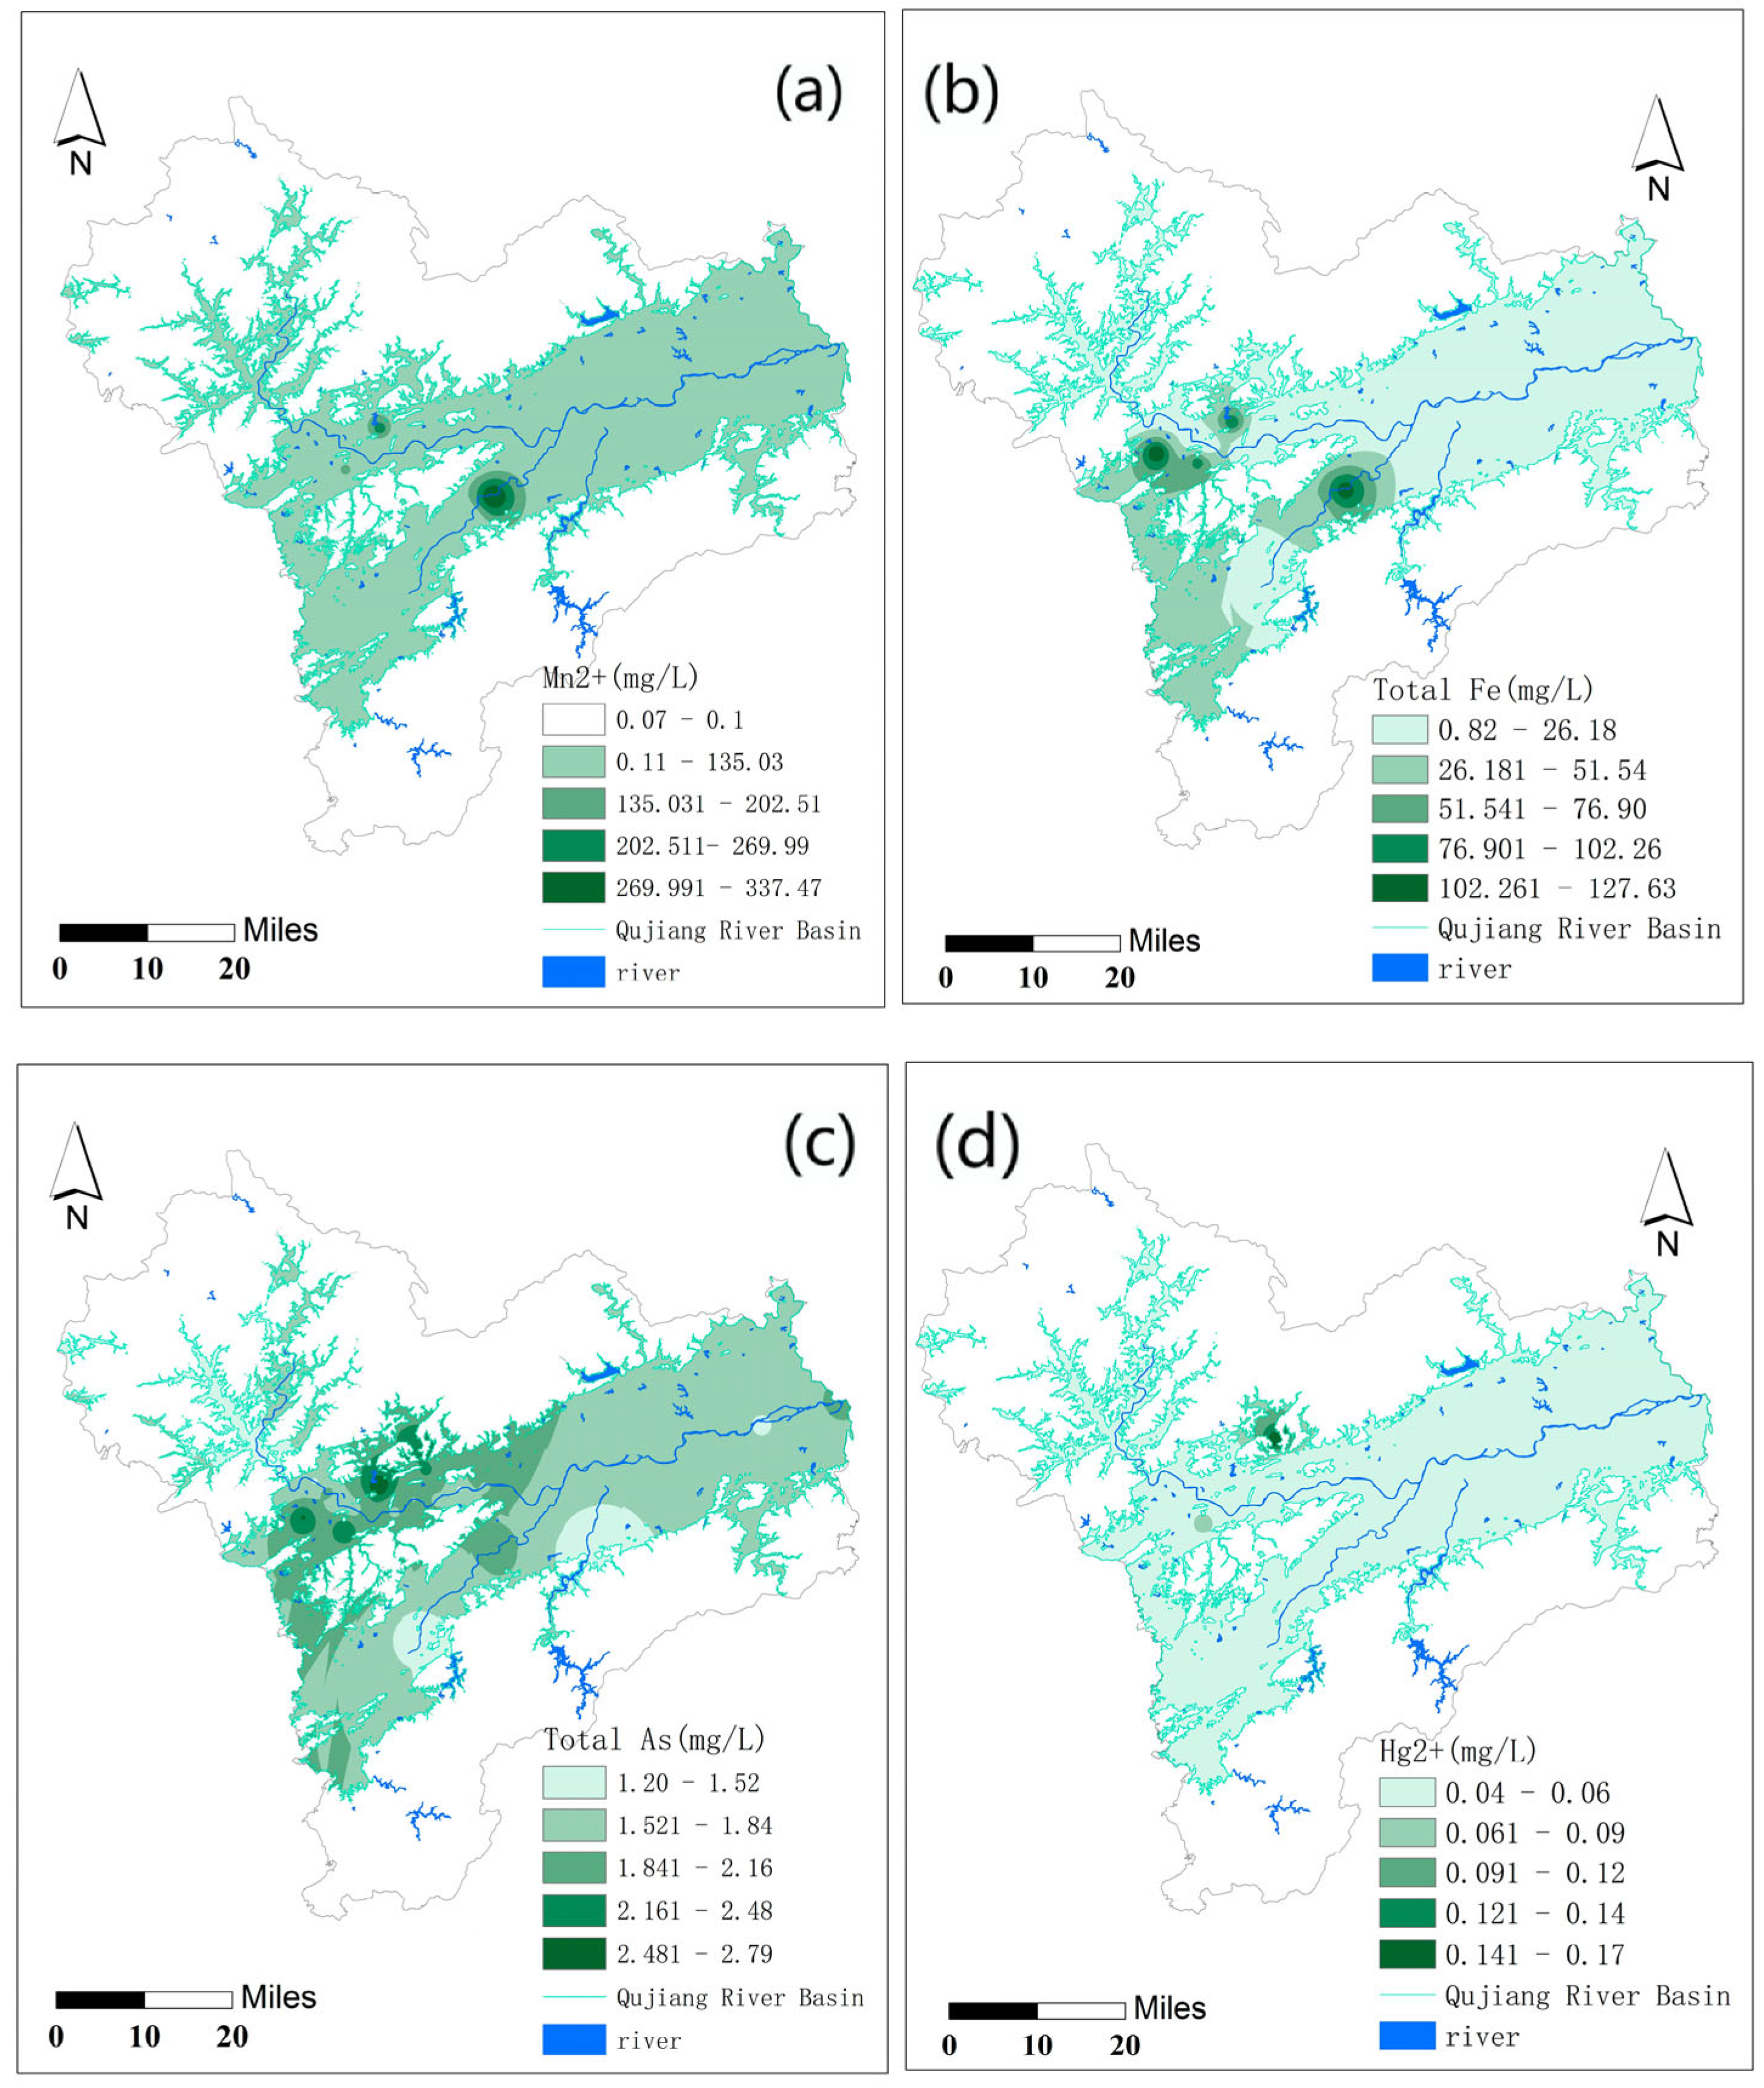
3.2. Spatial Distribution Characteristics of Hydrochemical Components in Qujiang River Water

The hydrochemical characteristics of surface water in the study area were examined using a Piper trilinear diagram (Figure 4). In the upper and middle reaches, ionic distributions display a consistent pattern: cations predominantly cluster near the Mg2+-Ca2+ combined end-member, with a tendency toward the Ca2+ end-member, while anions concentrate near the (HCO3 + CO32−)-Cl combined end-member, biased toward the (HCO3 + CO32−) component. This pattern indicates that water in these reaches is mainly of the Ca2+-HCO3 type, reflecting the limited anthropogenic influence and the dominance of natural processes such as rock weathering [20]. Additionally, the study area has a subtropical humid monsoon climate, with summer-concentrated precipitation. This provides abundant water for rock weathering and ion dissolution, directly influencing the formation of Ca-HCO3-type water upstream. In contrast, the lower reaches exhibit noticeable shifts: cations tend to cluster near the (Na+ + K+)-Ca2+ combined end-member, with a bias toward Na+ + K+, while anions align more closely with the SO42−-Cl end-member, showing a bias toward SO42−. These shifts indicate that the hydrochemical types in the lower reaches are predominantly SO4·Cl-Na and mixed SO4·Cl-Na·Ca types, suggesting substantial anthropogenic influences, primarily from industrial wastewater and domestic sewage [24].
To visualize the spatial variations in ion concentrations across the upstream, midstream, and downstream sections of the Qujiang River Basin, a line chart was constructed, as shown in Figure 5. Nine surface water samples were randomly selected, with QJHL35, QJHL05, and QJHL57 representing upstream sites; QJHL16, QJHL24, and QJHL21 representing midstream sites; and QJHL81, QJHL75, and QJHL85 representing downstream sites. The results show elevated Ca2+ concentrations in the midstream section, likely due to intensified rock weathering, which releases additional Ca2+ into the water [24]. However, Ca2+ concentrations decrease in the downstream reaches. Coupled with the previously observed increase in HCO3 concentrations, it is speculated that high levels of HCO3 may lead to the formation of calcium precipitates, thus reducing Ca2+ concentrations. Additionally, anthropogenic activities such as industrial and agricultural practices may alter ion compositions, elevate other cation concentrations, and induce cation exchange reactions, further contributing to calcium depletion.
The magnesium ion concentrations remained stable throughout the basin, indicating minimal anthropogenic influence and dominance of rock weathering processes [21]. Unlike the Ca2+ and Mg2+ concentrations, the NO3 and SO42− concentrations tended to increase in the middle–lower reaches, with downstream values exceeding upstream levels. This reflects significant downstream impacts from SO42−-bearing pollutants and intensive industrial activities. The variation trends of Mn, As, Hg, and Fe are basically consistent, with their peak values all occurring in the middle reaches, further verifying the argument that the middle reaches are affected by industrial activities. Additionally, Cl, Na+, COD, and TDS exhibited substantial fluctuations, but overall increasing trends suggested that the accumulation of dissolved solids was influenced by combined natural (rock weathering) and anthropogenic factors [25].
From the spatial distribution maps of Mn2+, total Fe, total As, and Hg2+ (Figure 6), we can see that Mn2+ and total Fe exhibited similar spatial distribution patterns, with clustered spotty or patchy high-concentration areas primarily in the midstream region. The abnormally elevated concentrations are primarily attributed to industrial pollution near Jiangshan Harbor, corresponding to the highest concentration area shown in Figure 6a, and are linked to emissions from surrounding industrial facilities [26]. In the mid-lower reaches of the Qujiang River Basin, arsenic concentrations exceeded the standard at all sampling points, with the most severe contamination observed in the upper midstream section. This pattern, when considered alongside local environmental conditions, is largely due to mineral extraction activities and agricultural practices, including livestock farming [27]. Mercury concentrations were relatively stable across the basin, with localized high-concentration clusters mainly associated with agricultural and livestock activities [28]. In addition, geological background analysis indicates that other Hg-contaminated areas are likely influenced by the gradual release of mercury from the long-term weathering of rock formations, such as the Permian Longtan Formation coal-bearing rocks and the Carboniferous Chuanshan Formation platform carbonate and magnesium carbonate sediments [18].

3.3. Comparative Analysis of the Hydrochemical Composition in the Qujiang River and Global River Systems

The hydrochemical characteristics of the Qujiang River are distinct from global river systems (Table 3), shaped by the interplay of geological processes and anthropogenic activities. Notable disparities in cation (Ca2+ and Mg2+) and anion (NO3 and SO42−) concentrations exist when compared to typical rivers both domestically (e.g., Yangtze River and Lancang River) and internationally (e.g., Nile Delta and Thames River). For example, the Lancang River’s upstream is characterized by granite and metamorphic rocks. Driven by its climate, physical weathering processes in this area result in distinct cation-release patterns. In contrast, the Qujiang River has carbonate strata in its upper reaches and Cretaceous red beds in the middle–lower reaches. Coupled with its subtropical monsoon climate, these geological features influence the cation composition of the Qujiang River [29]. Regarding anions, the Qujiang River has lower NO3 concentrations than the Nile Delta [7] and the Thames River [30], but higher SO42− levels. This can be mainly attributed to the pyrite mineralization in Jurassic coal measures and industrial discharges, such as those from the Quzhou Chemical Industrial Park. Despite the high population density in the Qujiang River Basin (212 persons/km2 in 2021), which leads to elevated nitrogen accumulation, the NO3 concentrations in the Qujiang River remain lower than those in the aforementioned rivers. The relatively high SO42− levels (29.8 mg/L) in the Qujiang River highlight the dual influence of sulfur-rich strata and industrialized watersheds. This is similar to the situation in other rivers affected by human activities, such as the Rhine. This similarity emphasizes the combined effects of natural geological factors and human activities on the hydrochemistry of the Qujiang River. It also aligns with the study’s thesis on the dual-driven influences and provides a comparative basis for understanding the formation factors of the Qujiang River’s hydrochemical characteristics.

3.4. Identification of Hydrochemical Component Sources in the Qujiang River

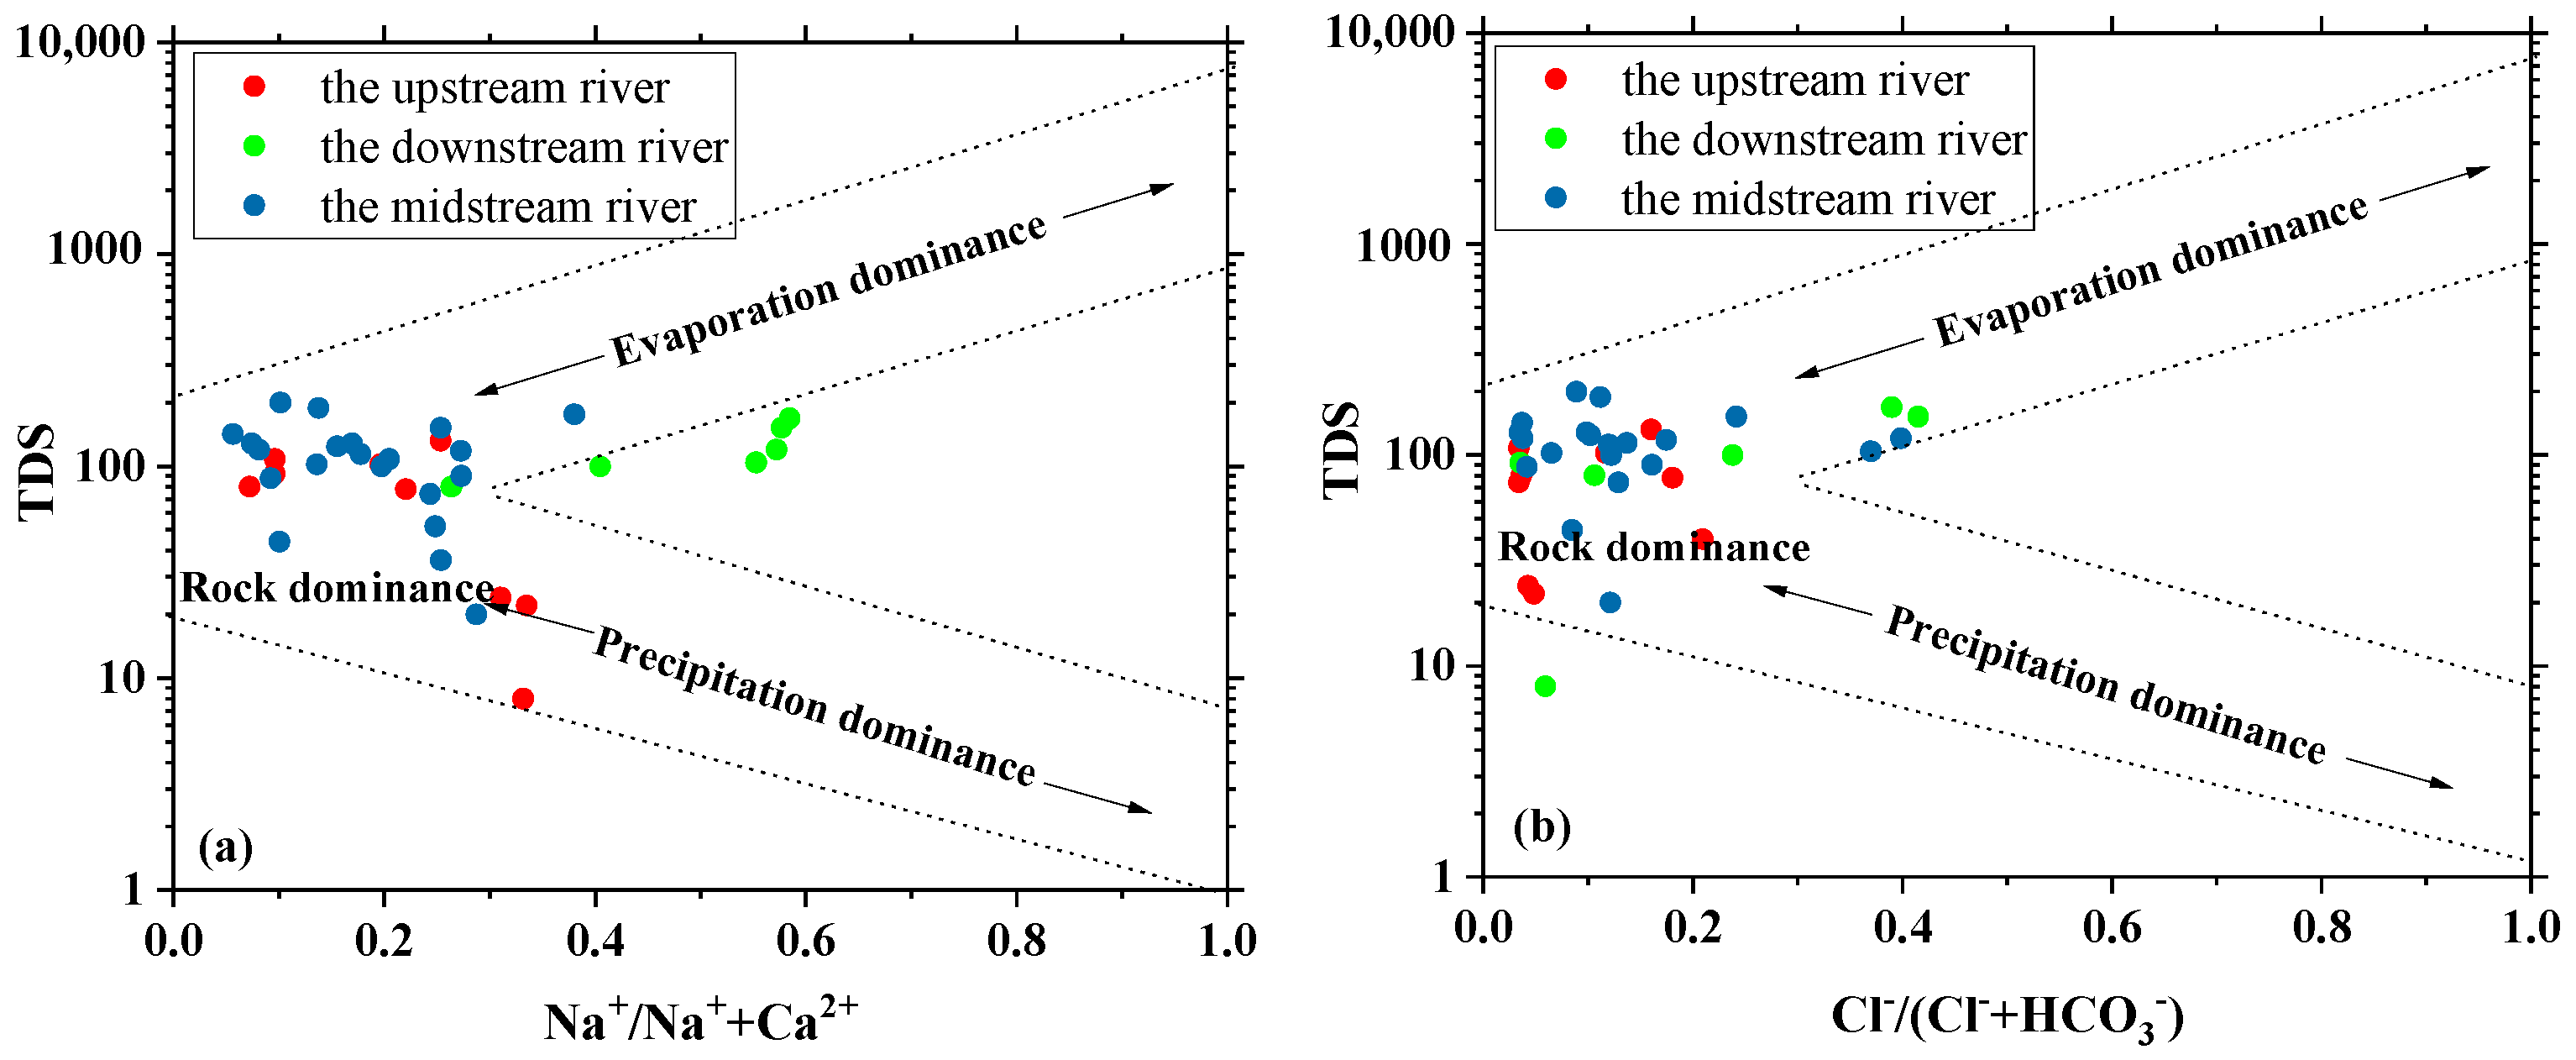
3.4.1. Source Discrimination via Gibbs Diagram Analysis

The Gibbs diagram classifies natural water chemistry into three principal genetic categories—rock weathering dominance, atmospheric precipitation dominance, and evaporation–concentration dominance [31]. Figure 7 shows that most water samples from the Qujiang River’s upper and middle reaches cluster within the rock weathering and evaporation–concentration zones, indicating that these natural processes dominate hydrochemical evolution. However, anthropogenic inputs, especially industrial and mining activities, significantly alter ionic composition via Na+-rich wastewater and mining leachates. For instance, downstream samples in Figure 7a exhibit abnormal Na+/(Na+ + Ca2+) ratios (>0.6), exceeding natural thresholds. Meanwhile, Figure 7b reveals Cl/(Cl + HCO3) ratios < 0.3, suggesting mixed sources from rock weathering, evaporation, and industrial Na+ discharges. These results reinforce prior studies, highlighting the combined influence of natural and anthropogenic factors on the river’s hydrochemistry [24].

3.4.2. Hydrochemical Component Source Analysis via the Ion Ratio Method

When natural water bodies are not dominated by atmospheric precipitation, hydrochemical ions are derived primarily from the weathering of carbonate, silicate, and evaporite rocks [32]. Different ions have specific sources, and ion ratios can trace these sources [33].
As shown in Figure 8a, most samples cluster near the silicate end-member with proximity to carbonate, indicating that mid-upstream Ca2+, Na+, and Mg2+ originate from carbonate and silicate weathering [34]. Meanwhile, the downstream samples indicate that they are derived from evaporite and silicate dissolution. The ratios of Na+ and Na+ + K+ in the mid-upstream Qujiang samples are close to 1 (Figure 8b). This shows that mid-upstream K+ and Na+ have balanced concentrations from rock weathering, while the ratio exceeding 1 in the downstream suggests additional sources. The [Ca2+ + Mg2+]/[HCO3] ratio discriminates carbonate vs. silicate contributions [35]. Figure 8c shows samples below the 1:1 line, with HCO3 exceeding Ca2+ + Mg2+, indicating that extensive carbonate dissolution drove the precipitation reactions. This reflects carbonate mineral dominance in hydrochemical formations.
The [Ca2+ + Mg2+]/[HCO3 + SO42−] ratio reveals SO42− sources [36,37]. Figure 8d shows scattered data points with HCO3 + SO42− exceeding Ca2+ + Mg2+ (below the y = x line), indicating that SO42− derives not only from evaporite dissolution but also from industrial inputs. Notably, the pore-fracture structure of Cretaceous red-bed clastic rocks in the middle and lower reaches promotes surface–groundwater exchange, and the dissolution of sulfate minerals in these rocks, along with industrial emissions, has led to a 2.3-fold increase in the SO42− concentration in the lower reaches compared to the upper reaches.

3.5. Impacts of Anthropogenic Activities on Qujiang River Hydrochemistry

The mid-lower reaches of the study area represent key zones of anthropogenic influence in Quzhou, where industrial production, agricultural activities, and domestic sewage discharge exert a pronounced impact on the chemical evolution of surface waters. Ion ratios can be used to identify the sources of anthropogenic inputs [29]. Downstream samples with high Cl concentrations and low [NO3]/[Cl] ratios suggest fecal and domestic sewage inputs (Figure 9a), while upstream samples with the opposite characteristics indicate stronger agricultural influences [24]. Midstream samples show a mix of urban sewage and agricultural impacts.
Industrial activities can be further identified through the [SO42−/Na+] vs. [NO3/Na+] relationship [24]. Across samples, [SO42−/Na+] is higher than [NO3/Na+], consistent with industrial wastewater discharge (Figure 9b). In downstream sites like QJHL75 and QJHL85, elevated [SO42−/Na+] values are due to localized industrial sources. The significantly higher [SO42−/Ca2+] in the downstream compared to the upstream further confirms that industrial activities contribute to sulfate enrichment, highlighting the more substantial industrial impacts in the downstream reaches (Figure 9c).

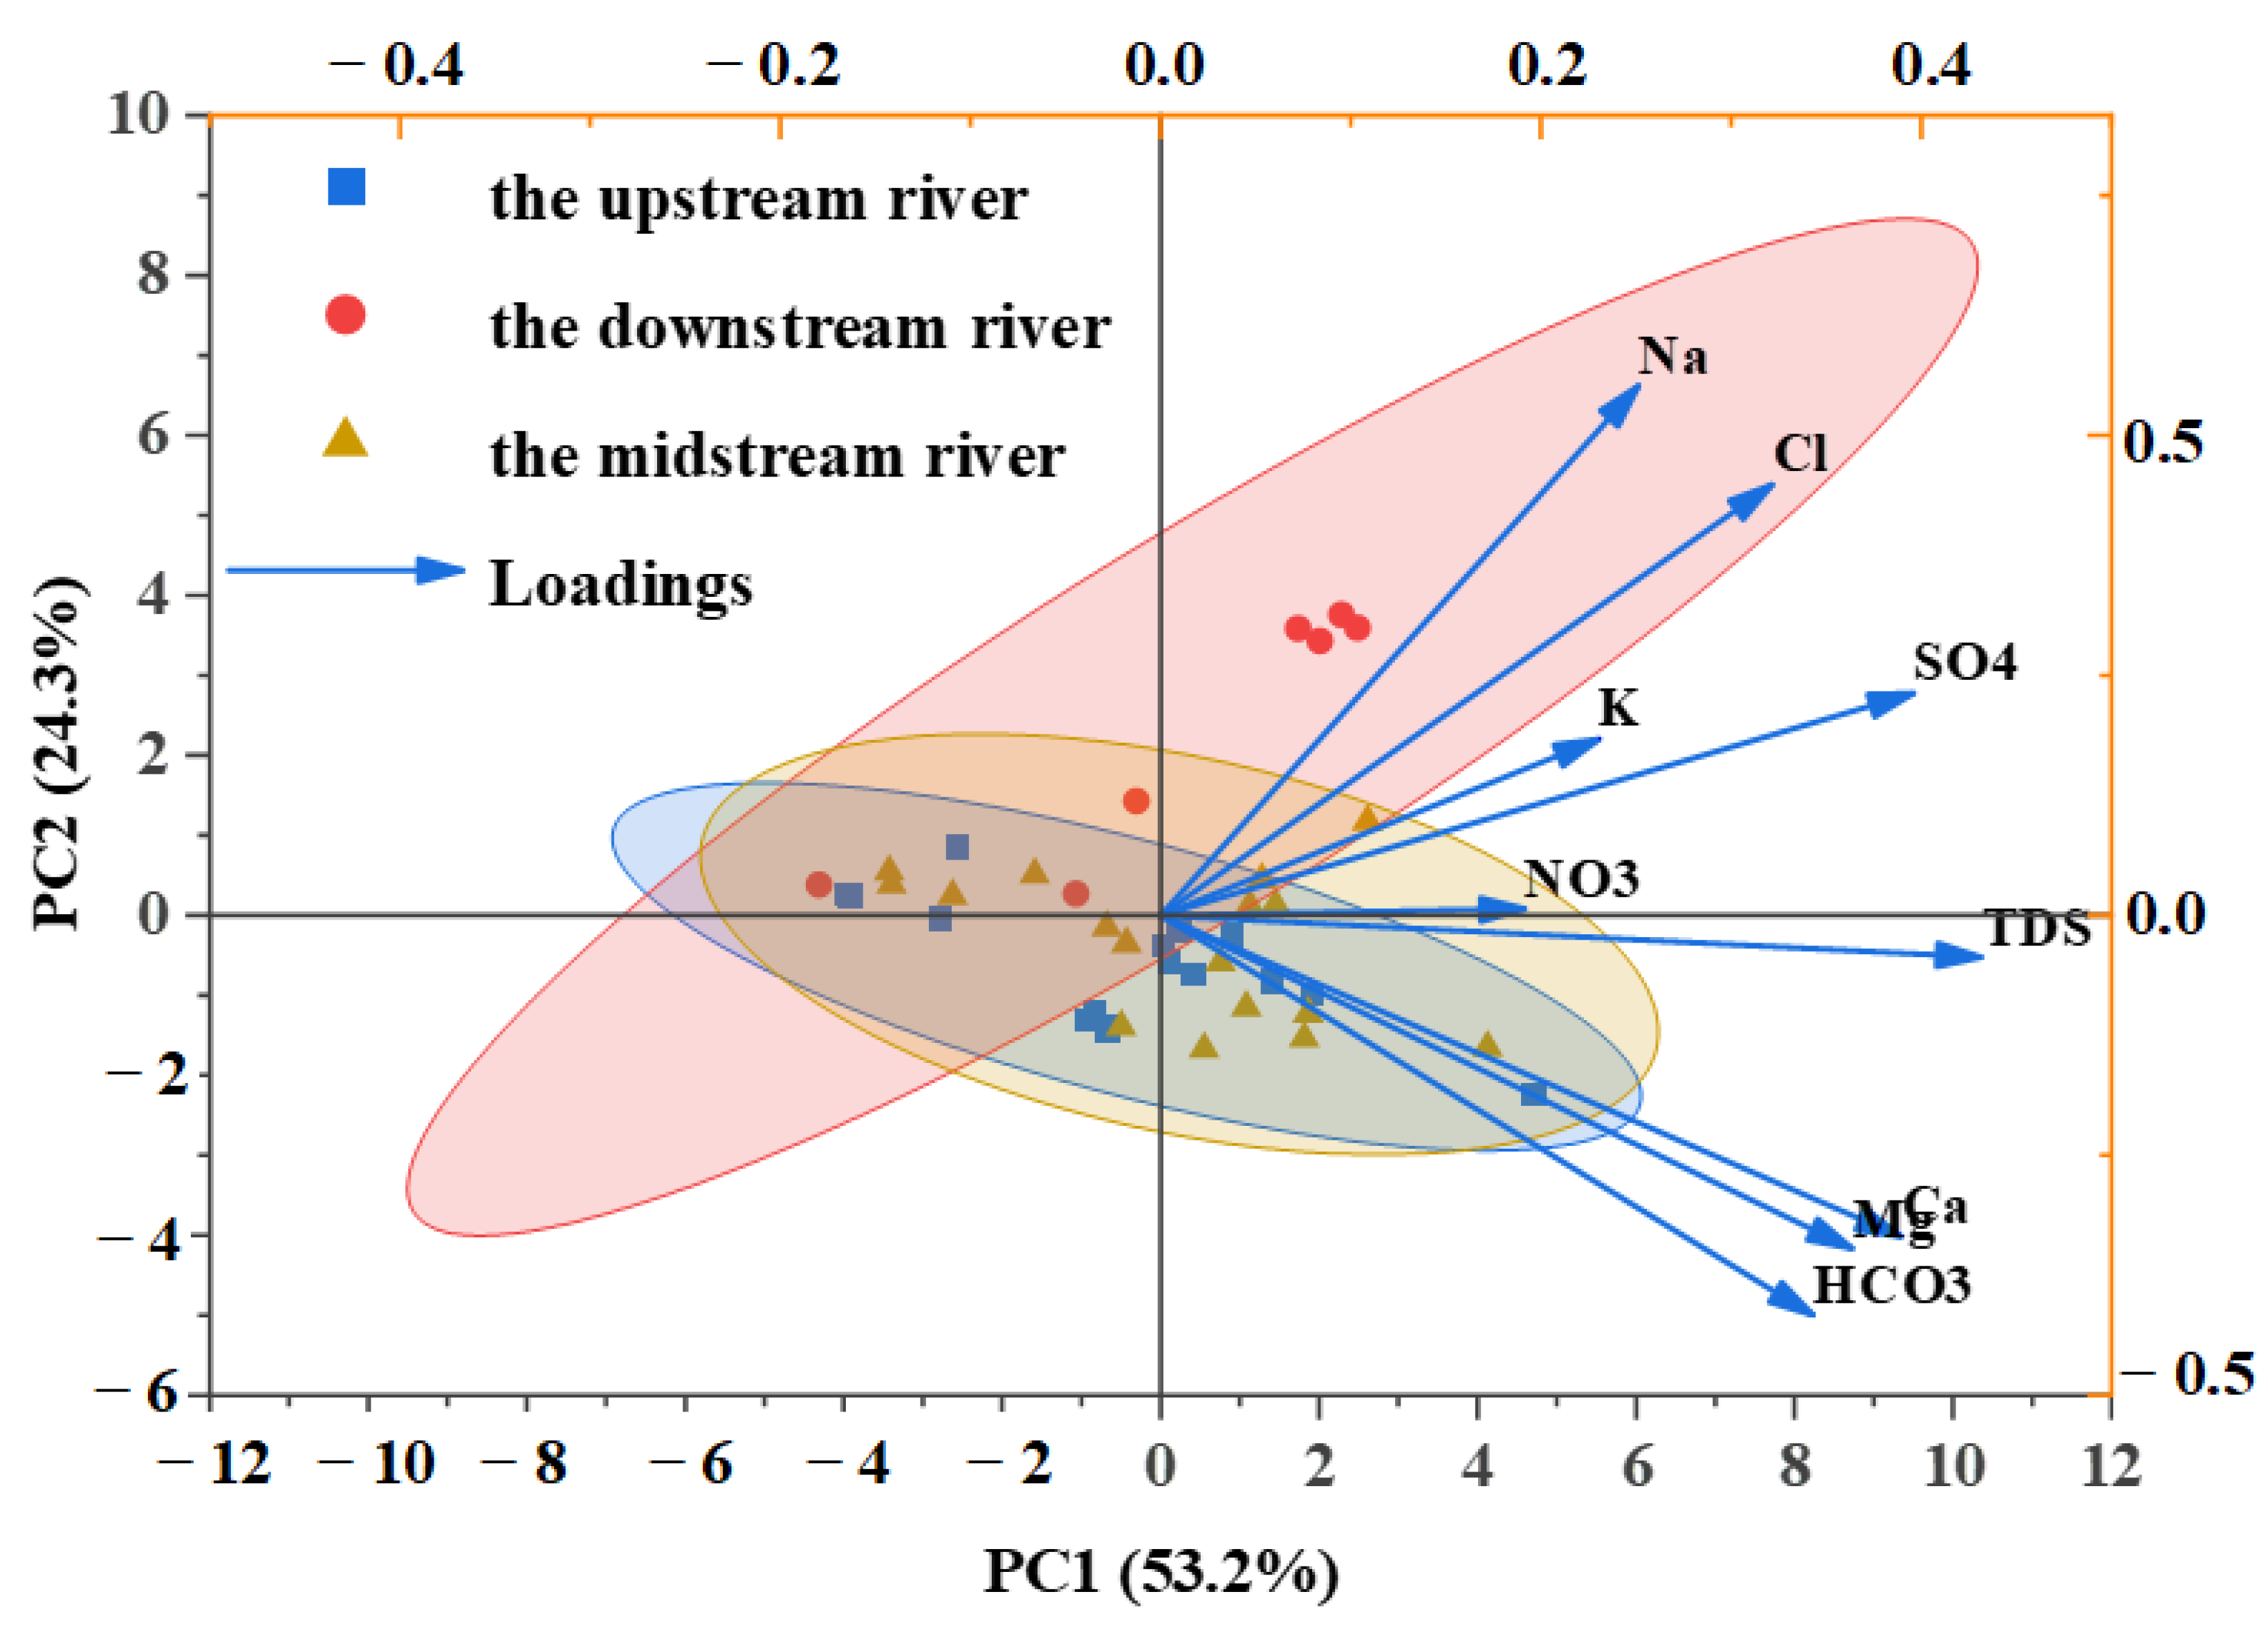
3.6. Identification of Dominant Factors Controlling Qujiang River Hydrochemistry

Principal component analysis (PCA) was applied to further identify the dominant hydrochemical controlling factors in the Qujiang River Basin. Thirteen water quality parameters (K+, Na+, Ca2+, Mg2+, Cl, SO42−, HCO3, NO3, TDS, Fe, Mn, Ag, and As) were selected for PCA across upstream, midstream, and downstream reaches. The data were evaluated via the Kaiser–Meyer–Olkin (KMO) test and Bartlett’s sphericity test. KMO values of 0.62 (upstream) and 0.56 (mid-lower reaches), combined with significant Bartlett’s test results (620, p < 0.001; 943, p < 0.001), confirmed the suitability of the PCA. After Z-score standardization, varimax-rotated principal components were extracted on the basis of eigenvalues >1. Three dominant factors were identified (Table 4), explaining 37.10% (PC1), 20.29% (PC2), and 13.47% (PC3) of the total variance.
PC1 retains significant rotated loadings for TDS, Ca2+, and SO42− (Table 4), all showing strong positive correlations. As previously discussed, Ca2+ originates primarily from evaporite and silicate dissolution, whereas SO42− sources include both evaporite weathering and industrial inputs. The downstream samples cluster along the positive PC1 axis in the biplot (Figure 10), corroborating the combined effect of evaporite dissolution (Ca2+) and industrial pollution (SO42−) inferred from Gibbs diagram deviations (Figure 7a).
PC2 has significant loadings on As, Fe, Mn, Na+, and Cl, indicating complex hydrogeochemical conditions in the Qujiang Basin. The positive loadings of As, Fe, and Mn result from the combined influence of agriculture (such as arsenic from agrochemicals) and industrial factors (iron and manganese from mining-related activities) [21]. The negative loadings of Na+ and Cl imply cation exchange processes, where Ca2+-rich industrial effluents affect Na+ concentrations [18]. Spatially, midstream samples on the positive PC2 axis are dominated by industrial and agricultural pollution, while downstream samples influenced by Na+ and Cl tend towards negative PC2 values, showing the impacts of cation exchange and domestic sewage. Overall, PC2 demonstrates the joint effects of anthropogenic activities and water–rock interactions on the Qujiang River’s hydrochemical characteristics, further supporting the argument that both natural and human factors influence the river’s hydrochemistry. PC3 was loaded onto K+, Mg2+, and HCO3. The K+/Na+ ratio (0.41/0.29 = 1.41) lies between typical silicate (K+/Na+ > 1) and evaporite (K+/Na+ < 1) signatures, indicating mixed silicate weathering and localized evaporite dissolution [31]. Combining geological maps (Figure 1c), K+ enrichment may also result from K-feldspar dissolution in Cretaceous sandstones [17]. The negative Mg2+–HCO3 correlations (Figure 8c) suggest carbonate precipitation, implying that PC3 is influenced by local water–rock reactions (e.g., dolomite dissolution–precipitation equilibrium). Additionally, K+ loadings may reflect agricultural potassium fertilizer inputs [33]. Collectively, PC3 represents the integrated effects of rock weathering and anthropogenic activities. Integrating the above principal component analysis results, PC1 and PC2 account for the largest variance contributions to the Qujiang River Basin, as detailed in Table 5.

4. Conclusions

This study, through a variety of methods of analysis, including Piper trilinear diagrams, Gibbs diagrams, and principal component analysis (PCA), reveals the significant differences in hydrochemical characteristics between the upper and lower reaches of the Qujiang River, the sources of solutes, and the comprehensive influence of natural and anthropogenic factors on its hydrochemical evolution. It clarifies the characteristics of the high-quality water source dominated by natural factors in the upper reaches and the water quality characteristics affected by human activities in the lower reaches, highlighting the resource advantages of the Qujiang River in ecological maintenance, residential water supply assurance, and the potential exploration of industrial water use. The specific conclusions are as follows:
The upper reaches are dominated by natural weathering (Ca-HCO3-type water, with natural factors accounting for 78%), where precipitation and carbonate dissolution are the key controlling processes.
The middle and lower reaches are significantly influenced by industrial wastewater (with SO42− concentration increased by 2.3 times compared to the upper reaches) and domestic sewage (with Cl reaching 16.07 mg/L), with the contribution rate of anthropogenic factors reaching 48–66%.
Spatial analysis shows that the superposition of red-bed weathering and industrial activities has led to the transformation of hydrochemical types in the lower reaches to SO4·Cl-Na type.
However, due to the large workload, insufficient data, and other reasons, there are still many shortcomings in this paper, and further research is needed:
  • The data only cover the wet season from July to September 2019, lacking data from the dry season and, thus, making it difficult to reveal the seasonal dynamics of hydrochemical characteristics.
  • In the analysis of complex mixed pollution sources, the existing methods are unable to accurately distinguish the contributions from natural and anthropogenic sources, affecting the in-depth analysis of the sources of solutes and the pollution mechanisms.
Future research could supplement monitoring during the dry season and incorporate techniques such as the Positive Matrix Factorization (PMF) model and isotope tracing to improve the study of the hydrochemical evolution mechanism of the Qujiang River.

Author Contributions

X.L. drafted the manuscript and created figures and visualizations; Y.Z. formulated and selected appropriate research methods; J.J. managed the project; L.X. participated in data collection and investigation; C.Z. (Chaoyu Zhang) and C.Z. (Chengfu Zhang) processed the data and conducted result analysis; G.W. contributed to the writing of the initial draft and investigation; Y.L. and D.T. revised the manuscript. All authors have read and agreed to the published version of the manuscript.

Funding

This study was supported by 2024 Langfang City Science and Technology Research and Development Program (2024013003) and Geological Survey Project (DD20190216).

Data Availability Statement

Data are contained within the article.

Conflicts of Interest

The authors declare no conflicts of interest.

References

  1. Tao, L.C.; Cun, D.X.; Tu, C.L.; Ma, Y.Q.; Liu, Z.N.; Yi, L.H.; He, C.G.; Pang, L.; Zhang, Q.D. Hydrochemical Characteristics and Controlling Factors of Surface Water in the Kuaize River Basin, Pearl River Source. China Environ. Sci. 2023, 44, 6025–6037. [Google Scholar] [CrossRef]
  2. Zhao, Z.; Wang, C.; Qiu, X.; Zhou, R.; Yang, Q.; Zhao, R. Hydrochemical Characteristics of Surface Water and Genesis Mechanism of High—Fluoride Water in the Qingshui River Basin, Ningxia. Earth Sci. Front. 2024, 31, 462–473. [Google Scholar] [CrossRef]
  3. Hu, H.; Wei, R.; Zerizghi, T.; Du, C.; Zhao, C.; Wang, Z.; Zhang, J.; Tan, Q.; Guo, Q. Control mechanisms of water chemistry based on long-term analyses of the Yangtze River. Sci. Total Environ. 2023, 892, 164713. [Google Scholar] [CrossRef]
  4. Antelmi, M.; Mazzon, P.; Höhener, P.; Marchesi, M.; Alberti, L. Evaluation of MNA in A Chlorinated Solvents-Contaminated Aquifer Using Reactive Transport Modeling Coupled with Isotopic Fractionation Analysis. Water 2021, 13, 2945. [Google Scholar] [CrossRef]
  5. Ríos-Villamizar, E.A.; Lopes, A.; da Silva, M.D.S.R.; dos Santos, N.A.S.; Oliveira, R.; Calazães, R.M.; Junk, W.J. Water chemistry of rivers and streams from the Jaú and Uatumã basins in central Brazilian Amazon. Sustain. Water Resour. Manag. 2022, 8, 117. [Google Scholar] [CrossRef]
  6. Khatita, A.M.A.; Geldern, R.V.; Bamousa, A.O.; Alexakis, D.E.; Ismail, E.; Abdellah, W.R.; Babikir, I.A.A. Combining Hydro-Geochemistry and Environmental Isotope Methods to Evaluate Groundwater Quality and Health Risk (Middle Nile Delta, Egypt). Hydrology 2025, 12, 72. [Google Scholar] [CrossRef]
  7. Zhang, J. Hydropolitics in the Nile River Basin: History and Reality. Arab World Stud. 2019, 42, 62–75. [Google Scholar] [CrossRef]
  8. Li, J.; Zheng, F.; Wu, C.; Huang, C.; Tang, C.; Peng, Y.; Xu, C.; Yang, H. Hydrochemical Characteristics of River in a Representative Silicate Rock Region under Natural Weathering and Anthropogenic Activities—A Case Study of the Fuhe River in the Middle and Lower Reaches of the Yangtze River. Earth Environ. 2021, 49, 347–357. [Google Scholar] [CrossRef]
  9. Zhao, M.; Sun, H.; Liu, Z.; Bao, Q.; Chen, B.; Yang, M.; Yan, H.; Li, D.; He, H.; Wei, Y.; et al. Organic carbon source tracing and the BCP effect in the Yangtze River and the Yellow River: Insights from hydrochemistry, carbon isotope, and lipid biomarker analyses. Sci. Total Environ. 2021, 812, 152429. [Google Scholar] [CrossRef]
  10. Ya, N.; Jun, W.; Na, W.; Zi, H.; Lin, l.; Zhi, Q. Co-occurrence of elevated arsenic and fluoride concentrations in Wuliangsu Lake: Implications for the genesis of poor-quality groundwater in the (paleo-)Huanghe (Yellow River) catchment, China. Water Res. 2024, 258, 121767. [Google Scholar] [CrossRef]
  11. Cai, X.; Kang, C. Hydrochemical characteristics and water quality evaluation of groundwaterin lower reaches of the Qiantang River. Yangtze River 2023, 54, 27–33. [Google Scholar] [CrossRef]
  12. Luo, S.; Huang, Z. Systematic Analysis and Application of Spatiotemporal Variation of Water Resources Quality in the Minjiang River Basin. Hydraul. Sci. Technol. 2015, 38, 1–6. [Google Scholar]
  13. The Largest Area for Harmonious Development Between Humanity and Nature: Interpreting the Productivity Layout and Industrial Belt Development Plan for Jinqu-Lishui Region. Today’s Zhejiang 2005, 13, 26–28.
  14. Huang, X. Research on the Location Selection and Layout Characteristicsof Traditional Villages Under the Influence of Qujiang River. Master’s Thesis, Zhejiang A&F University, Hangzhou, China, 2024. [Google Scholar] [CrossRef]
  15. Shi, X.; He, T.; Zhang, Q.; Gao, G. Practice and Exploration of Comprehensive Improvement of the Whole Area and Comprehensive Development and Utilization of Mining Land in the Context of Ecological Civilization Construction—Taking Shang fang Town, Qujiang District, Quzhou City, Zhejiang Province as an Example. Sci. Technol. Innov. 2024, 28, 33–38. [Google Scholar]
  16. Significant Achievements in Pollution Control of Pig Farming in Qujiang, Zhejiang. Swine. Ind. Outlook 2015, 20, 10. Available online: https://kns.cnki.net/kcms2/article/abstract?v=fSCzX0TVvUg-fiWD8d8QG9LDLez5SrcYK1owmkfVfcMHB1e5WrUhZwZQFFn_Rj9qDMmd-Fk-UuR_4GFu8o4WaDIyigcjlRTZjvEqaBNpAiPpSjT8I_a57w2I9XWIwCU9PTETN4q9T4esWoTAEYPvpONwa0kd9HoDR8T2l-2V1y4=&uniplatform=NZKPT (accessed on 20 May 2025).
  17. Liu, Y.; Zhang, C.; Jiang, J.; Zhang, Y.; Wang, G.; Xu, L.; Qu, Z. Interaction between Groundwater and Surface Water in the Qujiang River Basin in China: Evidence from Chemical Isotope Measurements. Water 2023, 15, 3932. [Google Scholar] [CrossRef]
  18. Wang, G. Anomaly Identification and Traceability Analysis of Groundwaterchemical Components in Red Bed Area of Quzhou. Master’s Thesis, Institute of Disaster Prevention, Beijing, China, 2021. [Google Scholar] [CrossRef]
  19. Zhao, Z.; Gong, X.; Zhang, L.; Jin, M.; Cai, Y.; Wang, X. Riverine transport and water-sediment exchange of polycyclic aromatic hydrocarbons (PAHs) along the middle-lower Yangtze River, China. J. Hazard. Mater. 2021, 403, 123973. [Google Scholar] [CrossRef]
  20. Zhang, X.; Zhang, Y.; Gui, Y.; Sun, R.; Li, J.; Wu, Q.; Ding, Y.; Chen, K. Chemical characteristics of groundwater and surface water affected by human activities in the upper Jinzi River Basin, China. Sci. Rep. 2025, 15, 9294. [Google Scholar] [CrossRef]
  21. Liu, H.; Wang, M.; Wang, X.; Su, C.; Jiang, G.; Li, Z.; Ren, F. Hydrochemical characteristics and formation mechanism of shallowgroundwater in Eastern Henan Plain. Saf. Environ. Eng. 2024, 31, 170–179. [Google Scholar] [CrossRef]
  22. GB 3838-2002; Environmental Quality Standards for Surface Water. China Environmental Science Press: Beijing, China, 2002.
  23. GB 5749-2022; Hygienic Standards for Drinking Water. Standards Press of China: Beijing, China, 2022.
  24. Ren, C.; Liu, L. Under the Strong Influence of Human Activities: The Patterns and Controlling Factors of River Water Chemistry Changes—A Case Study of the Lower Yellow River. Water 2024, 16, 1886. [Google Scholar] [CrossRef]
  25. Lin, L.; Zhang, Y.; Qian, X.; Wang, Y. Hydrochemical Characteristics and Human Health Risk Assessment of Surface Water in the Danjiang River Source Basin of the Middle Route of China’s South-to-North Water Transfer Project. Water 2023, 15, 2203. [Google Scholar] [CrossRef]
  26. Bai, J.; Yuan, Z.; Su, X. Evolution of river–aquifer disconnections and the migration and transformation of iron and manganese under non-time-varying/time-varying riverbed permeability. Sci. Total Environ. 2024, 949, 175156. [Google Scholar] [CrossRef] [PubMed]
  27. Chang, Y.; Wang, S.; Che, F.; Dong, X.; Yang, X.; Chen, H.; Huang, W. Arsenic source-sink dynamics under phosphorus competition in sediments from river–lake connected systems. Environ. Sci. Process. Impacts 2025, 27, 706–717. [Google Scholar] [CrossRef]
  28. Mao, L.; Ren, W.; Liu, X.; He, M.; Lin, C.; Zhong, Y.; Tang, Y.; Ouyang, W. Tracking the multiple Hg sources in sediments in a typical river-lake basin by isotope compositions and mixing models. J. Hazard. Mater. 2023, 459, 132166. [Google Scholar] [CrossRef]
  29. Zhang, Q.; Zhang, J.; Wang, H.; Zhai, T.; Liu, L.; Li, G.; Xu, Z. Spatial patterns in water quality and source apportionment in a typical cascade development river southwestern China using PMF modeling and multivariate statistical techniques. Chemosphere 2023, 311, 137139. [Google Scholar] [CrossRef]
  30. Neal, C.; Neal, M.; Hill, L.; Wickham, H. The water quality of the River Thame in the Thames Basin of south/south-eastern England. Sci. Total Environ. 2006, 360, 254–271. [Google Scholar] [CrossRef] [PubMed]
  31. Gibbs, R.J. Mechanisms Controlling World Water Chemistry. Science 1970, 170, 1088–1090. [Google Scholar] [CrossRef]
  32. Wang, J.; Zhang, H.; Xu, J.; Peng, J. Spatial Hydrochemical Characteristics and Controlling Factors of Surface Water in the Yancheng Area. China Environ. Sci. 2021, 42, 4772–4780. [Google Scholar] [CrossRef]
  33. Zhao, H.; Li, X.; Kang, C.; Xi, J.; Ding, L.; Zhao, Y.; Zhao, Z. Hydrochemical characteristics and genesis analysis of surface waterin the Jushui River basin (Hancheng City section). South North Water Transf. Water Sci. Technol. 2025, 23, 410–420. [Google Scholar] [CrossRef]
  34. Wang, L.; Zhang, Q.; Wang, H. Rapid Urbanization Has Changed the Driving Factors of Groundwater Chemical Evolution in the Large Groundwater Depression Funnel Area of Northern China. Water 2023, 15, 2917. [Google Scholar] [CrossRef]
  35. Wang, H.; Guo, X.; Zhang, Q.; Li, B. Evolution of groundwater hydrochemical characteristics and originanalysis in Hutuo River Basin. Environ. Chem. 2021, 40, 3838–3845. [Google Scholar]
  36. Xing, J.; Wang, L.; Zhao, J.; Zhai, T. Hydrochemical variation characteristics and driving factors of surface water in arid Areas—A case study of Beichuan River in Northwest China. Front. Environ. Sci. 2024, 12, 1493390. [Google Scholar] [CrossRef]
  37. Li, Z.; Zhao, L. Research and Practice on Systematic Management of Mountains, Rivers, Forests, Fields, Lakes, Grasslands, and Sands in the Northwest Arid Zone—Taking the Tarim River Important Headwaters Area as an Example. Front. Environ. Sci. 2022, 35, 13–18+63. [Google Scholar] [CrossRef]
Figure 1. The location, topography, landforms, sampling points, and hydrogeological zoning maps of the study area. (a) Location map of Quzhou City. (b) Topographic and geomorphic map of Qujiang City. (c) Location map of the sampling points based on the distribution of hydrogeological characteristics.
Water 17 01581 g001
Figure 2. Hydrogeological cross-section of the study.
Water 17 01581 g002
Figure 3. Boxplots of major ion concentrations in Qujiang River surface water.
Water 17 01581 g003
Figure 4. Piper/trilinear diagram of the Qujiang River Basin.
Water 17 01581 g004
Figure 5. Variations in the major ion concentrations of surface water samples along the Qujiang River course.
Water 17 01581 g005
Figure 6. Spatial distribution map of ions with exceeding concentrations in the Qujiang River Basin: (a) Mn2+, (b) total Fe, (c) total As, and (d) Hg2+.
Water 17 01581 g006
Figure 7. Gibbs diagram of water ions from the sampling points in the study area: (a) Na+/(Na++Ca2+) vs. TDS; (b) Cl–/(Cl–+HCO3–) vs. TDS.
Water 17 01581 g007
Figure 8. Relationships of major ion concentrations in the Qujiang River Basin: (a) (Ca2+/Na+) vs. (Mg2+/Na+); (b) (Cl) vs. (Na+ + K+); (c) (HCO3) vs. (Ca2+ + Mg2+); and (d) (Ca2+ + Mg2+) vs. (HCO3 + SO42−).
Water 17 01581 g008
Figure 9. The variable relationships between ions in the Qujiang River Basin. in the Qujiang River Basin.
Water 17 01581 g009
Figure 10. Biplot of principal component analysis of hydrochemical components in the surface water of the study area.
Water 17 01581 g010
Table 1. Water quality parameters and determination methods.
ParametersDetermination Methods
pH, Eh, TDS, DO, ECPortable multimeter
(HQ40d, HACH, Shanghai, China)
HCO3Titration
K+, Na+, Ca2+, Mg2+, SO42−, NO3, ClIon chromatography (IC, Metrohm 930 Compact) and UV-Vis spectrophotometry (Shimadzu UV-2600, Shimadzu Corporation, Kyoto, Japan)
TNAlkaline persulfate digestion–UV spectrophotometry
(HJ 636-2012)
TPAmmonium molybdate spectrophotometry after sulfuric acid digestion (HJ 670-2013)
CODMnDichromate reflux method (HJ 828-2017)
Table 2. Statistical characteristics of the hydrochemical composition of the Qujiang River.
ParameterspHK+Na+Ca2+Mg2+ClSO42−HCO3NO3TDSMnFeAsHg
UpstreamMin (mg/L)6.391.132.045.640.700.812.4518.101.8622.000.120.821.300.04
Max (mg/L)7.152.089.0726.724.8013.1419.9673.608.61132.005.202.311.500.04
Mean (mg/L)6.911.684.4220.523.555.4412.9054.284.0579.751.231.831.450.04
SD (mg/L)0.230.32 2.588.651.654.756.5321.932.0838.951.740.630.080.00
CV (%)3.41%18.91%58.46%42.18%46.68%87.36%50.58%40.39%51.40%48.84%141.3%34.52%5.21%0.00%
MidstreamMin (mg/L)6.311.631.347.180.681.354.9618.100.02 20.000.070.821.200.04
Max (mg/L)8.835.2116.8051.738.3421.1734.14126.7013.39200.00337.51127.642.800.17
Mean (mg/L)7.04 3.01 5.57 25.853.907.52 18.35 62.315.24109.7142.7622.831.840.05
SD (mg/L)0.641.04 3.68 11.571.785.269.0028.05 3.6347.96 85.2139.560.400.03
CV (%)9.18%34.4%66.10%44.75%45.65%69.98%49.06%45.04%69.21%43.70%199.3%173.3%21.76%64.86%
DownstreamMin (mg/L)6.853.365.5315.452.576.1610.0830.202.3480.000.090.941.200.04
Max (mg/L)8.104.2126.7820.572.7724.7941.8651.908.02168.00112.6422.802.100.06
Mean (mg/L)7.463.76 17.1917.822.66 16.07 29.8340.43 5.17 113.0033.296.321.680.04
SD (mg/L)0.680.3710.552.40 0.089.6514.129.102.30 38.1443.878.180.280.01
CV (%)9.11%9.90%61.37%13.45%3.16%60.10%47.34%22.52%58.07%33.75%131.8%129.3%16.50%16.64%
Note: pH, dimensionless; min = minimum; max = maximum; mean = average; SD = standard deviation; CV = coefficient of variation.
Table 3. Comparison of major ion concentrations in the Qujiang River with other major rivers worldwide.
RiverK+ + Na+Ca2+Mg2+SO42−ClNO3
Qujiang10.2123.413.5919.328.704.89
Yangtze River [8]8.2034.17.6011.72.903.44
Lancang River [27]20.648.1710.7263.0124.82.52
Nile Delta [6]44.840.016.630.136.420.1
Thames River [28]9.4039.01245.6073.321.9
Table 4. Principal component analysis of major ions in the Qujiang River Basin.
ParametersPC1PC2PC3
K+0.23−0.040.41
Na+0.24−0.440.29
Ca2+0.390.25−0.16
Mg2+0.370.20−0.31
HCO30.350.29−0.24
Cl0.31−0.380.21
SO42−0.39−0.180.12
NO30.18−0.13−0.25
Fe−0.010.390.38
Mn0.060.310.46
Hg0.070.10−0.13
As0.050.410.27
TDS0.430.020.01
Characteristic value4.822.641.75
Contribution rate (%)37.1020.2913.47
Cumulative contribution rate (%)37.1057.3970.86
Table 5. Comparison of hydrochemical controlling factors in the Qujiang River Basin.
River SectionPrincipal Component ContributionProportion of Natural FactorsProportion of Human ActivitiesCharacteristic Ions
UpstreamPC2 (41%)78%22%Ca2+, HCO3
MidstreamPC1 (53%)52%48%SO42−, NO3
DownstreamPC1 (67%)34%66%Na+, Cl
Disclaimer/Publisher’s Note: The statements, opinions and data contained in all publications are solely those of the individual author(s) and contributor(s) and not of MDPI and/or the editor(s). MDPI and/or the editor(s) disclaim responsibility for any injury to people or property resulting from any ideas, methods, instructions or products referred to in the content.

