Hydrochemical Characteristics and Drinking Water Quality Assessment of Phreatic Groundwater in the Northwest of the Sichuan Basin, SW China


Abstract
1. Introduction
2. Materials and Methods
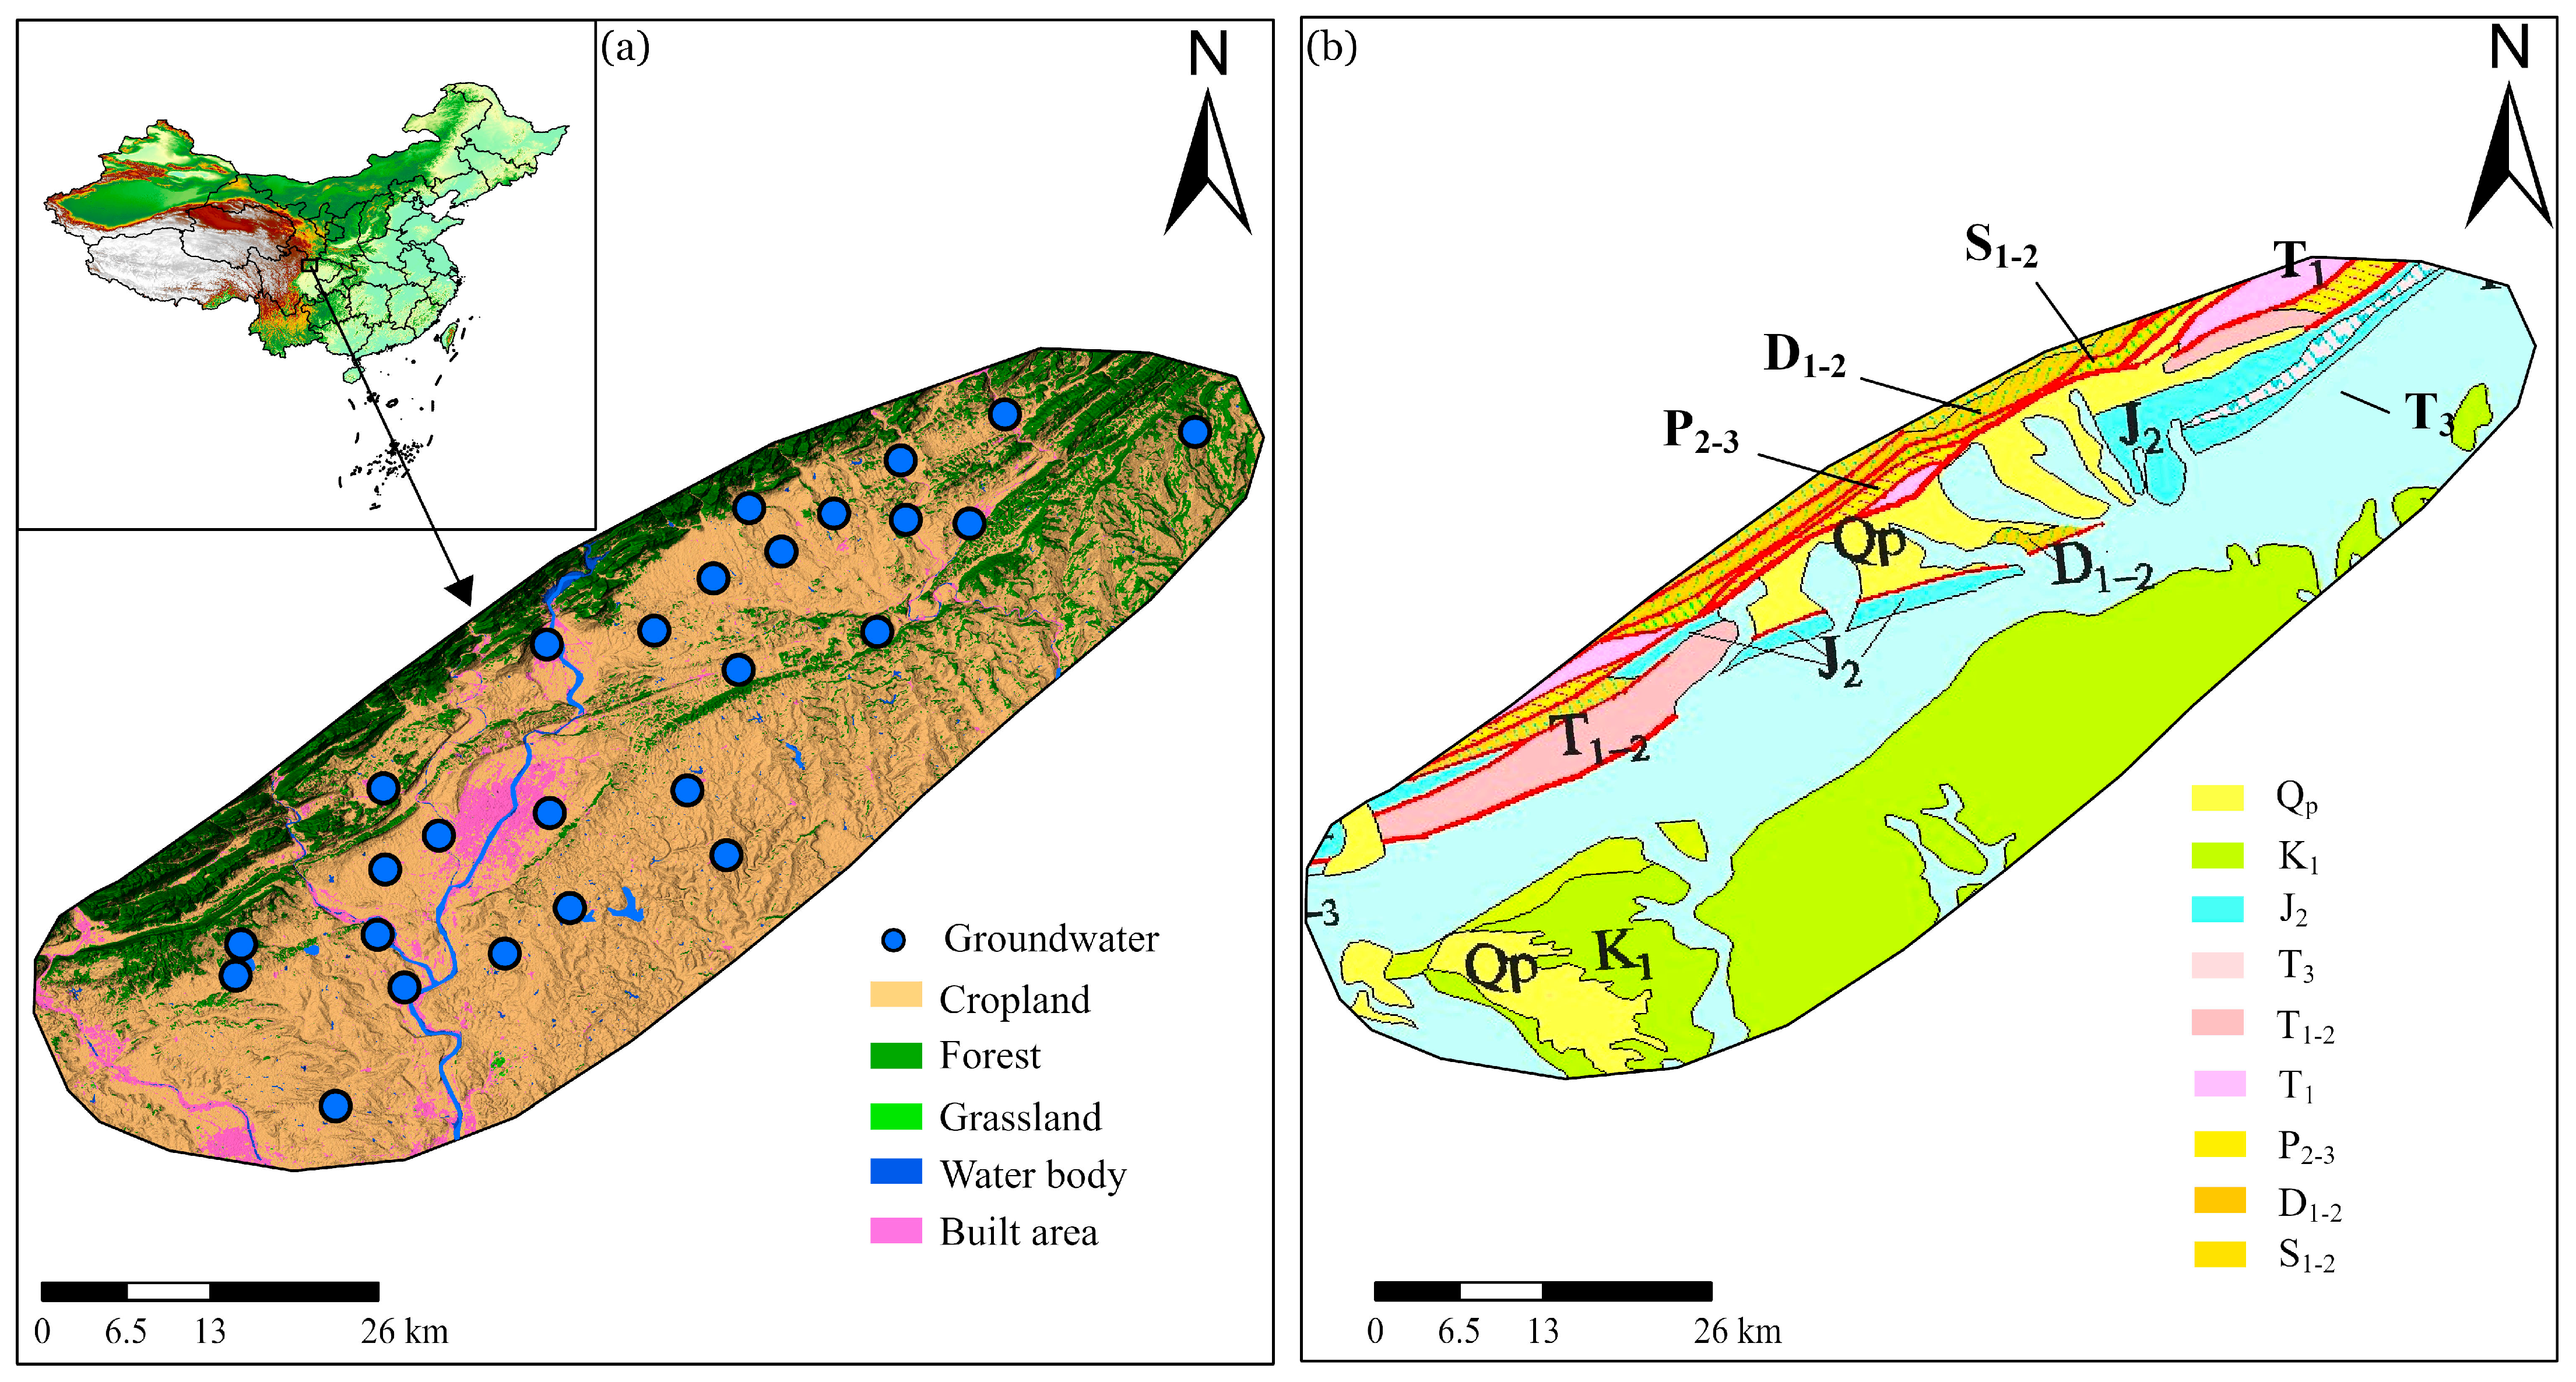
2.1. Study Area
2.2. Data Collection
2.3. Methods of Results Analysis
2.3.1. Geochemical Modeling
2.3.2. Factor Analysis Method
2.3.3. Entropy-Weighted Method
2.3.4. Chemical Water Quality Index
2.3.5. Sensitivity Analysis
3. Results
4. Discussion
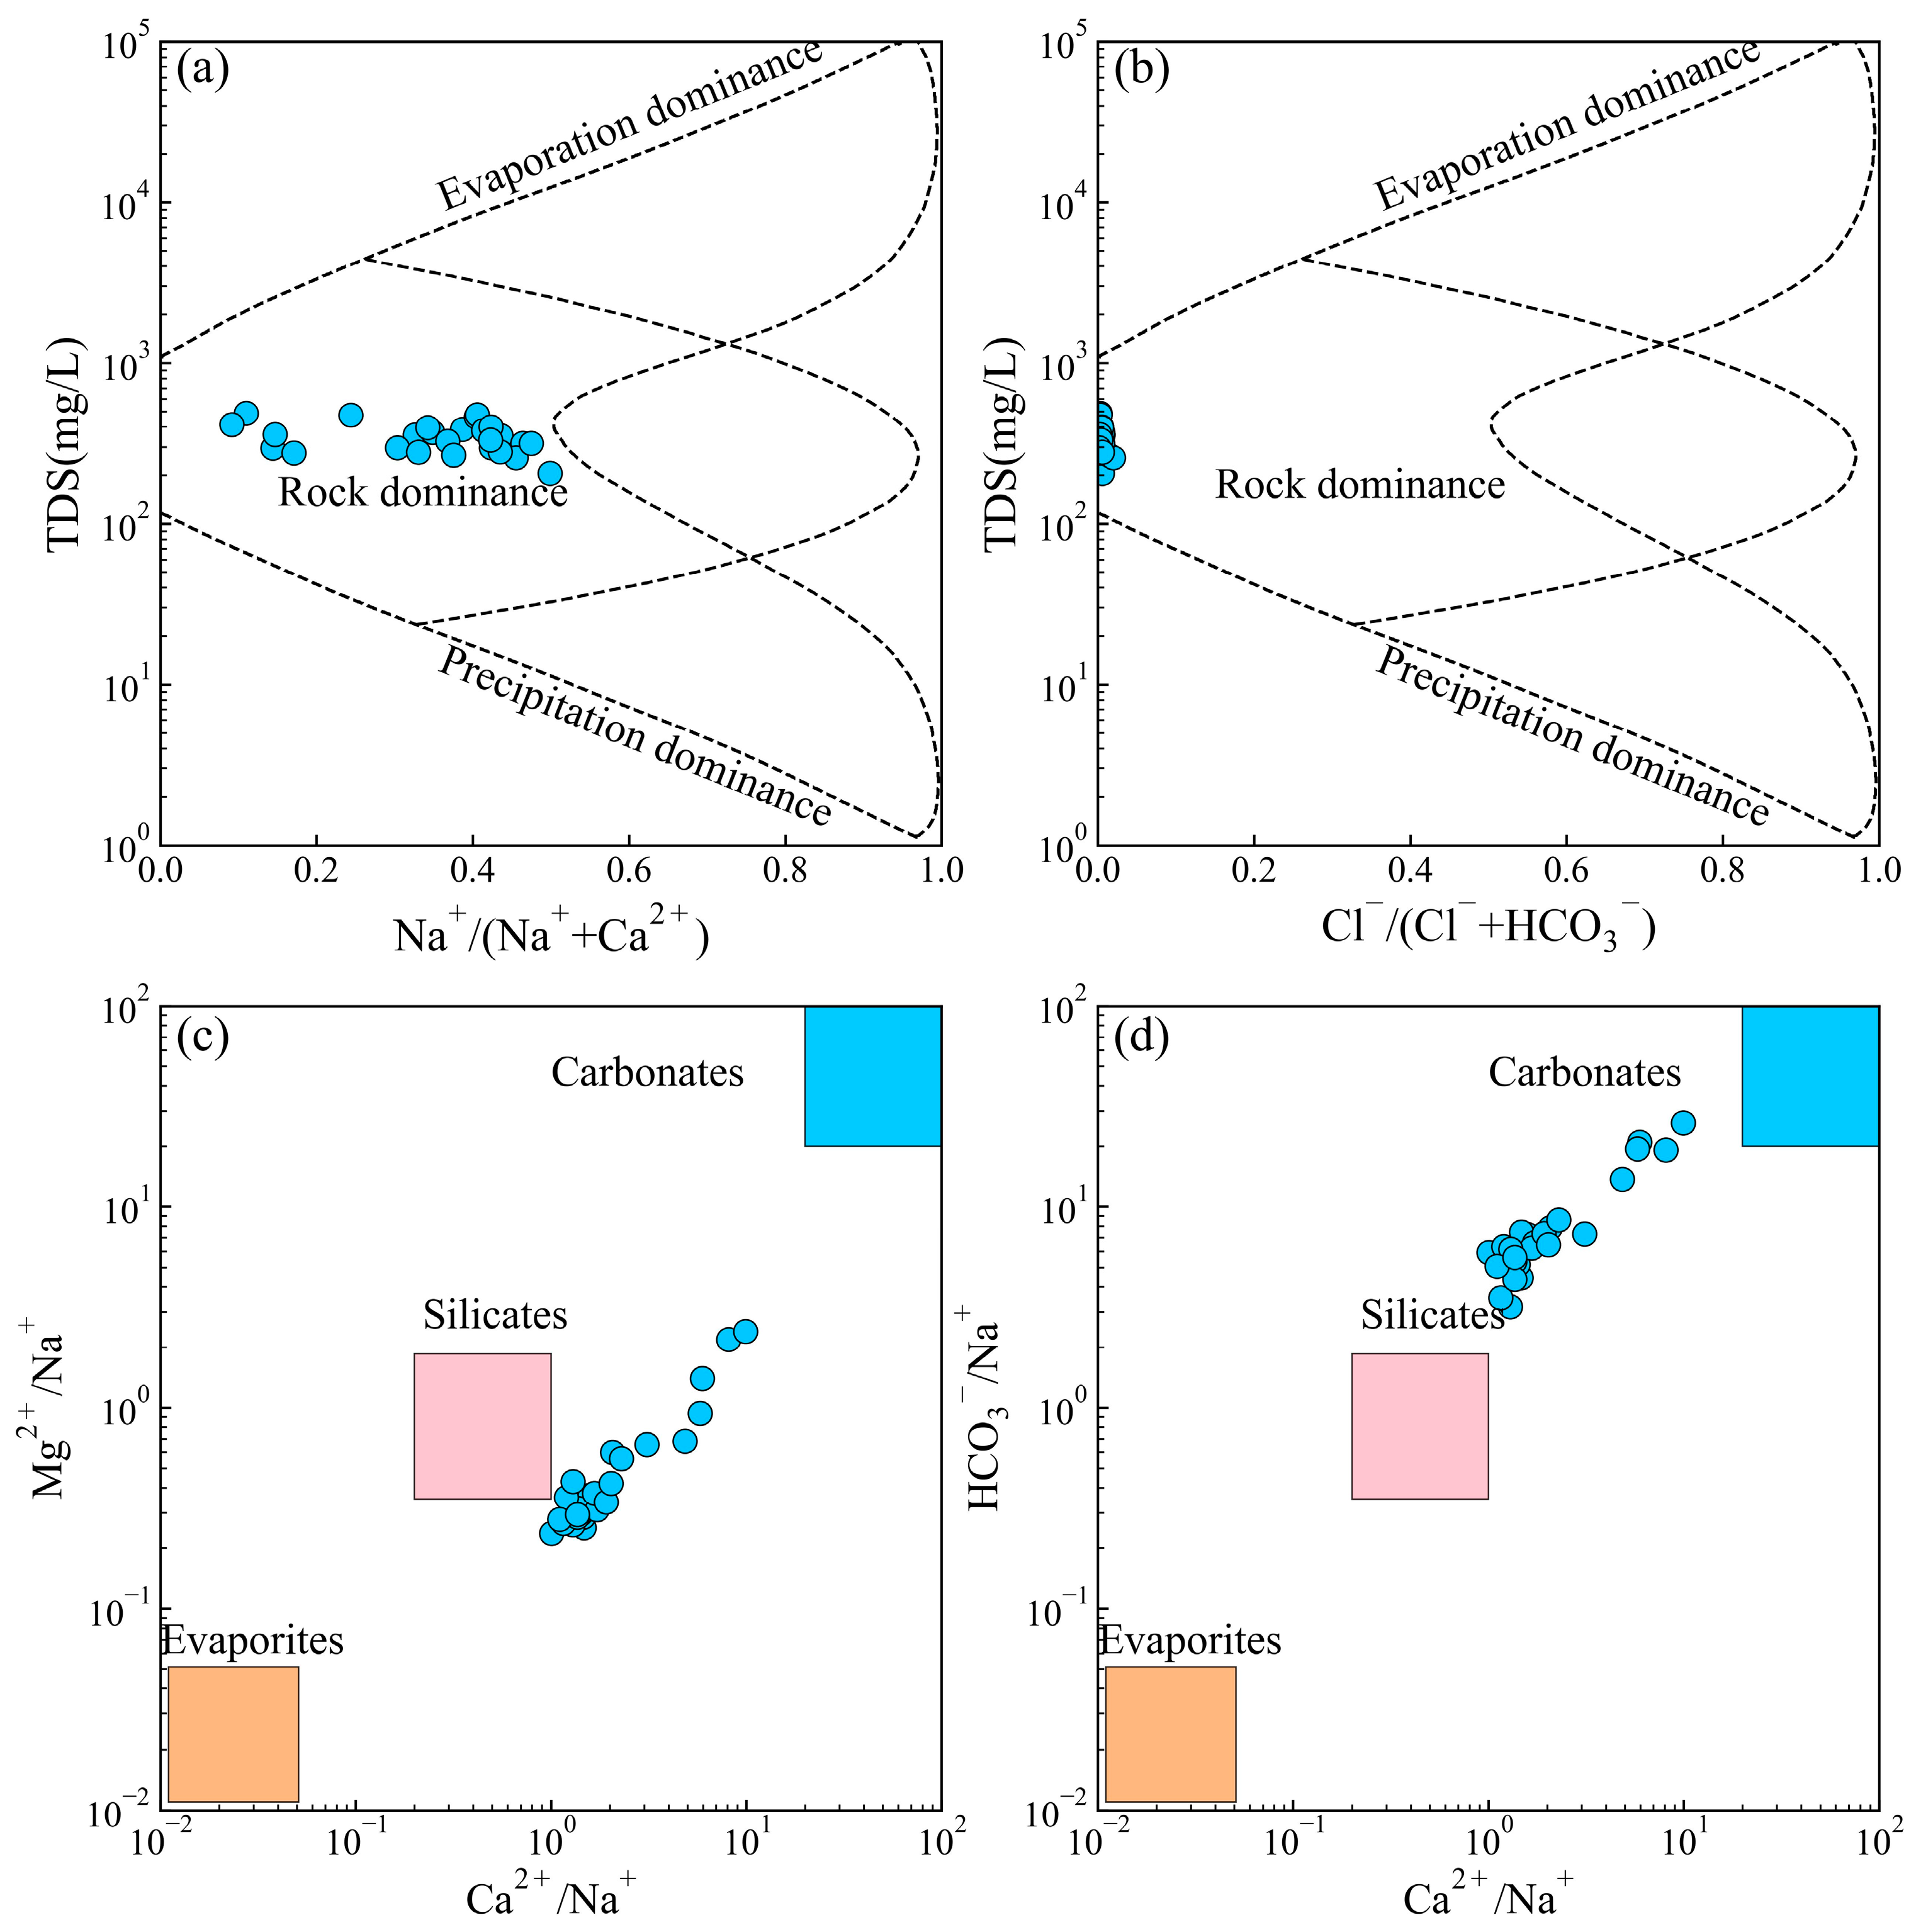
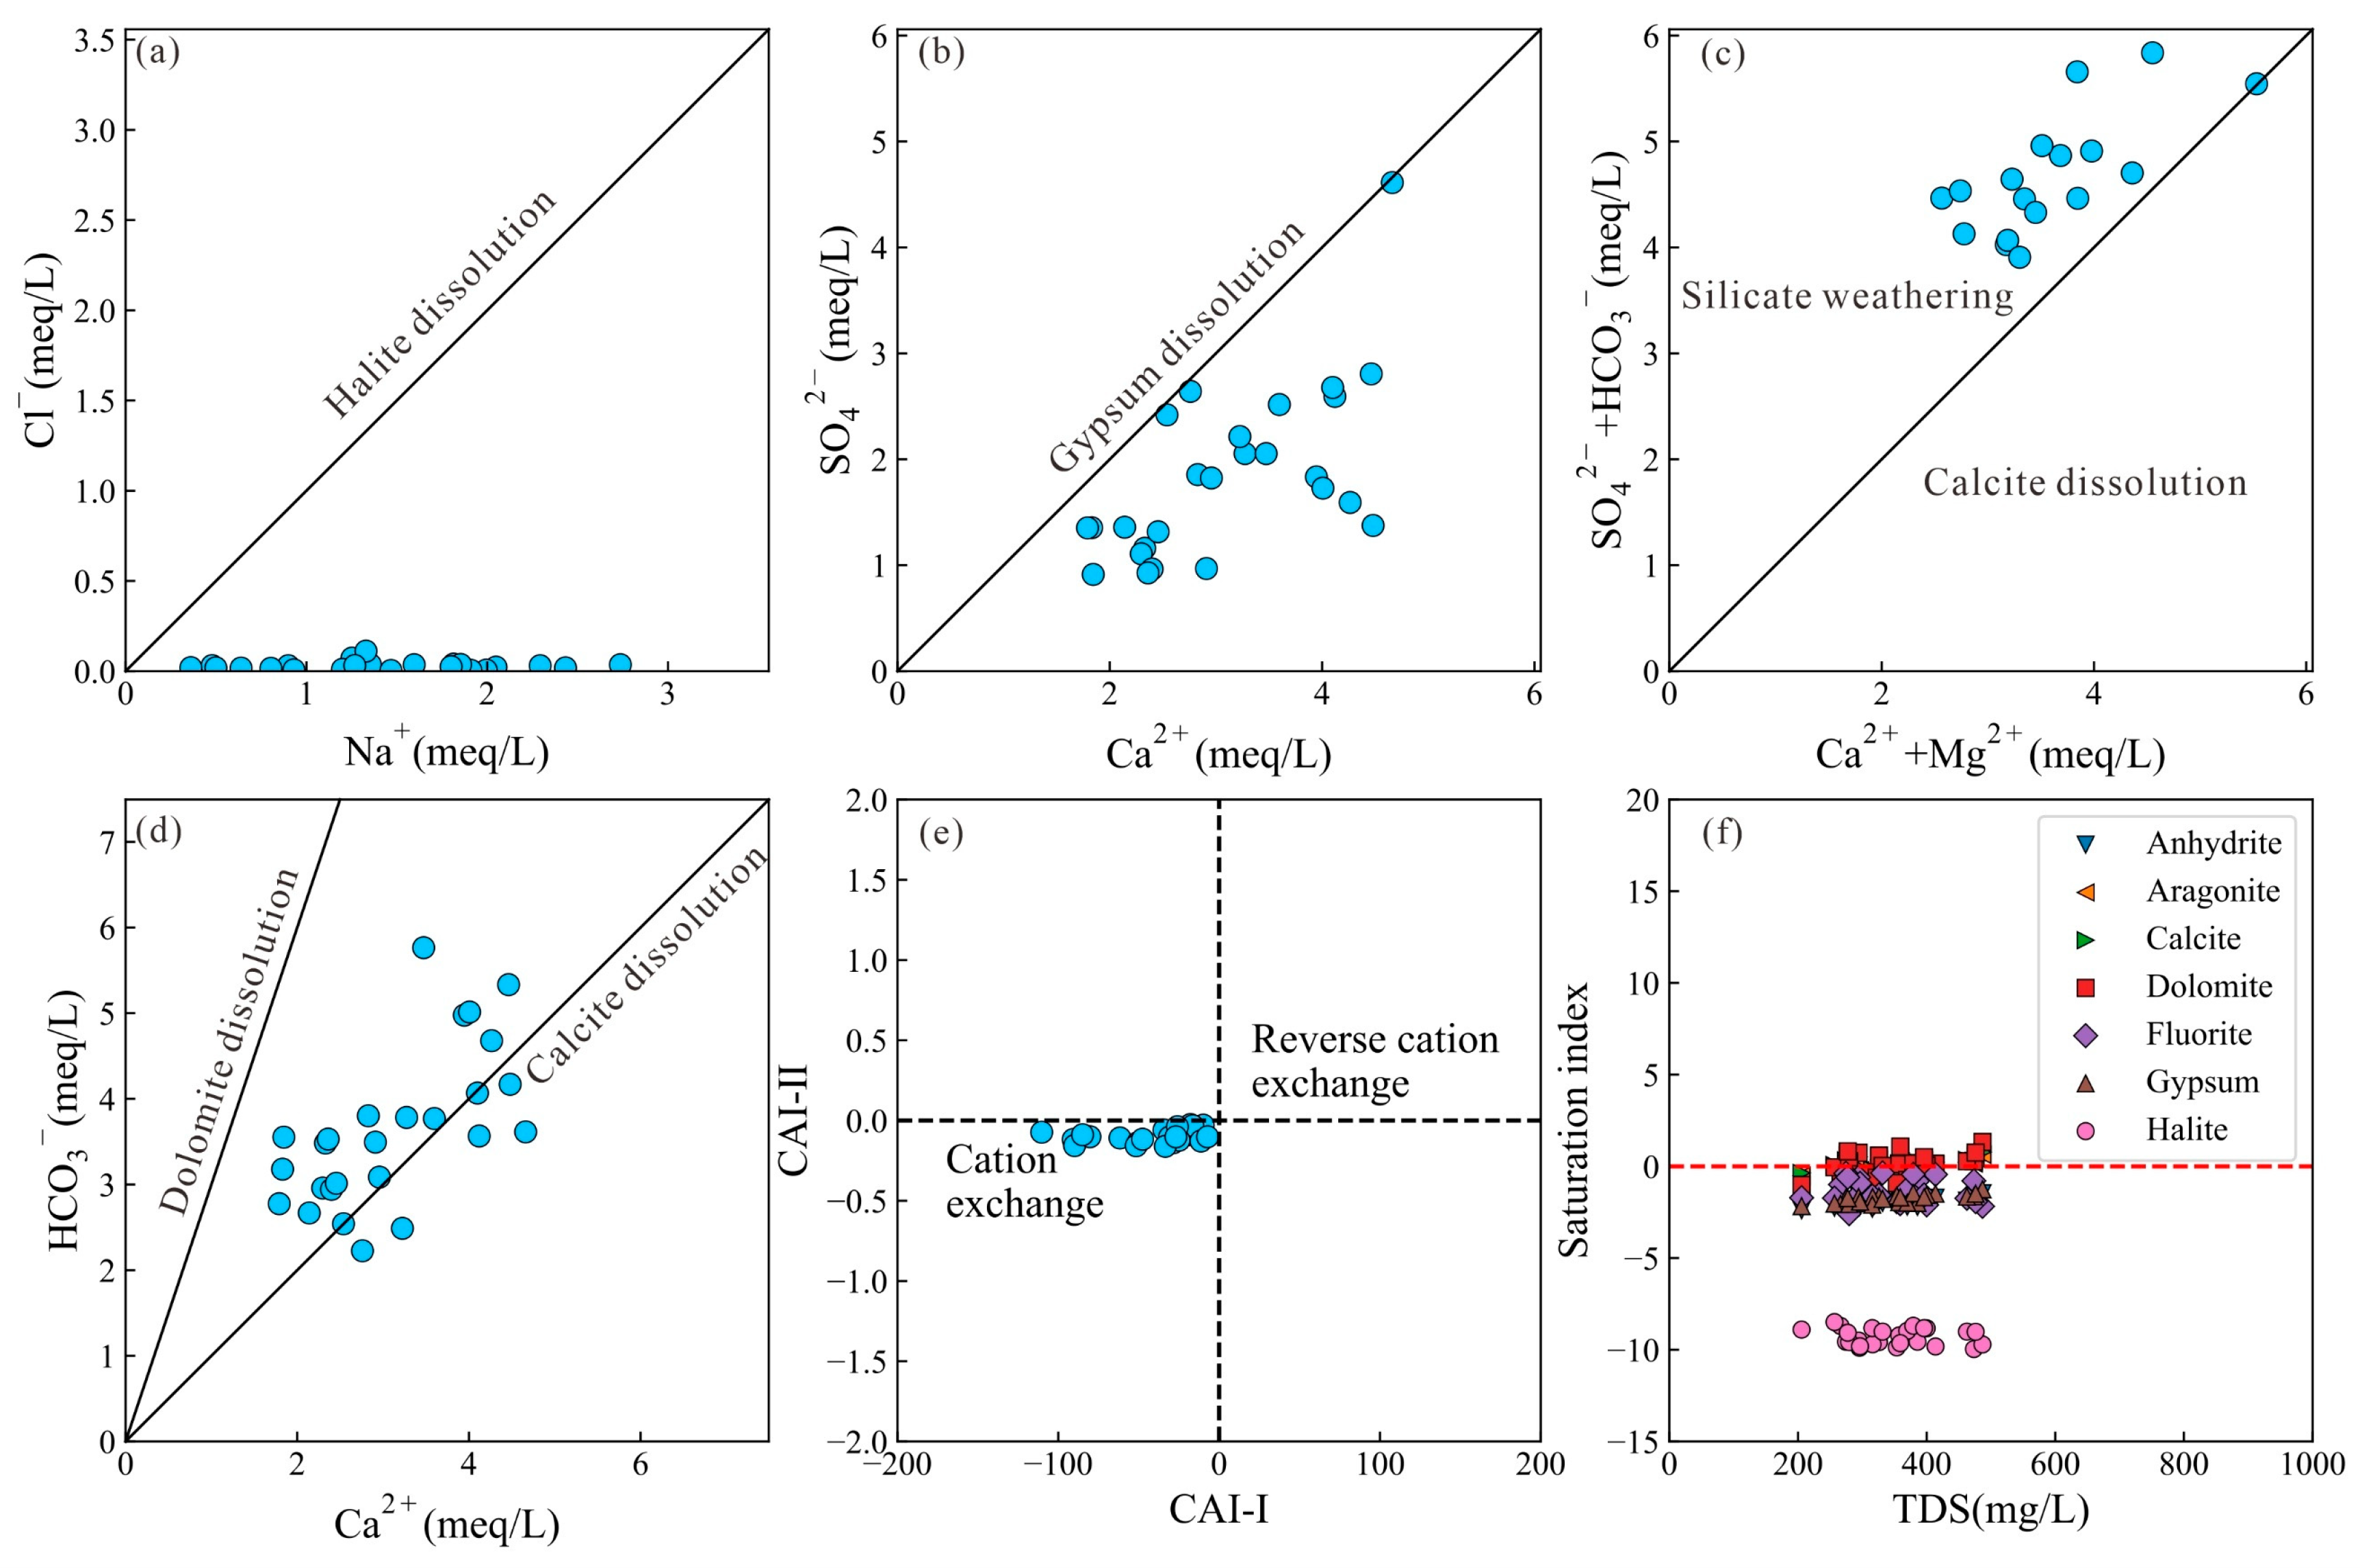
4.1. Driving Factors Controlling Groundwater Chemistry
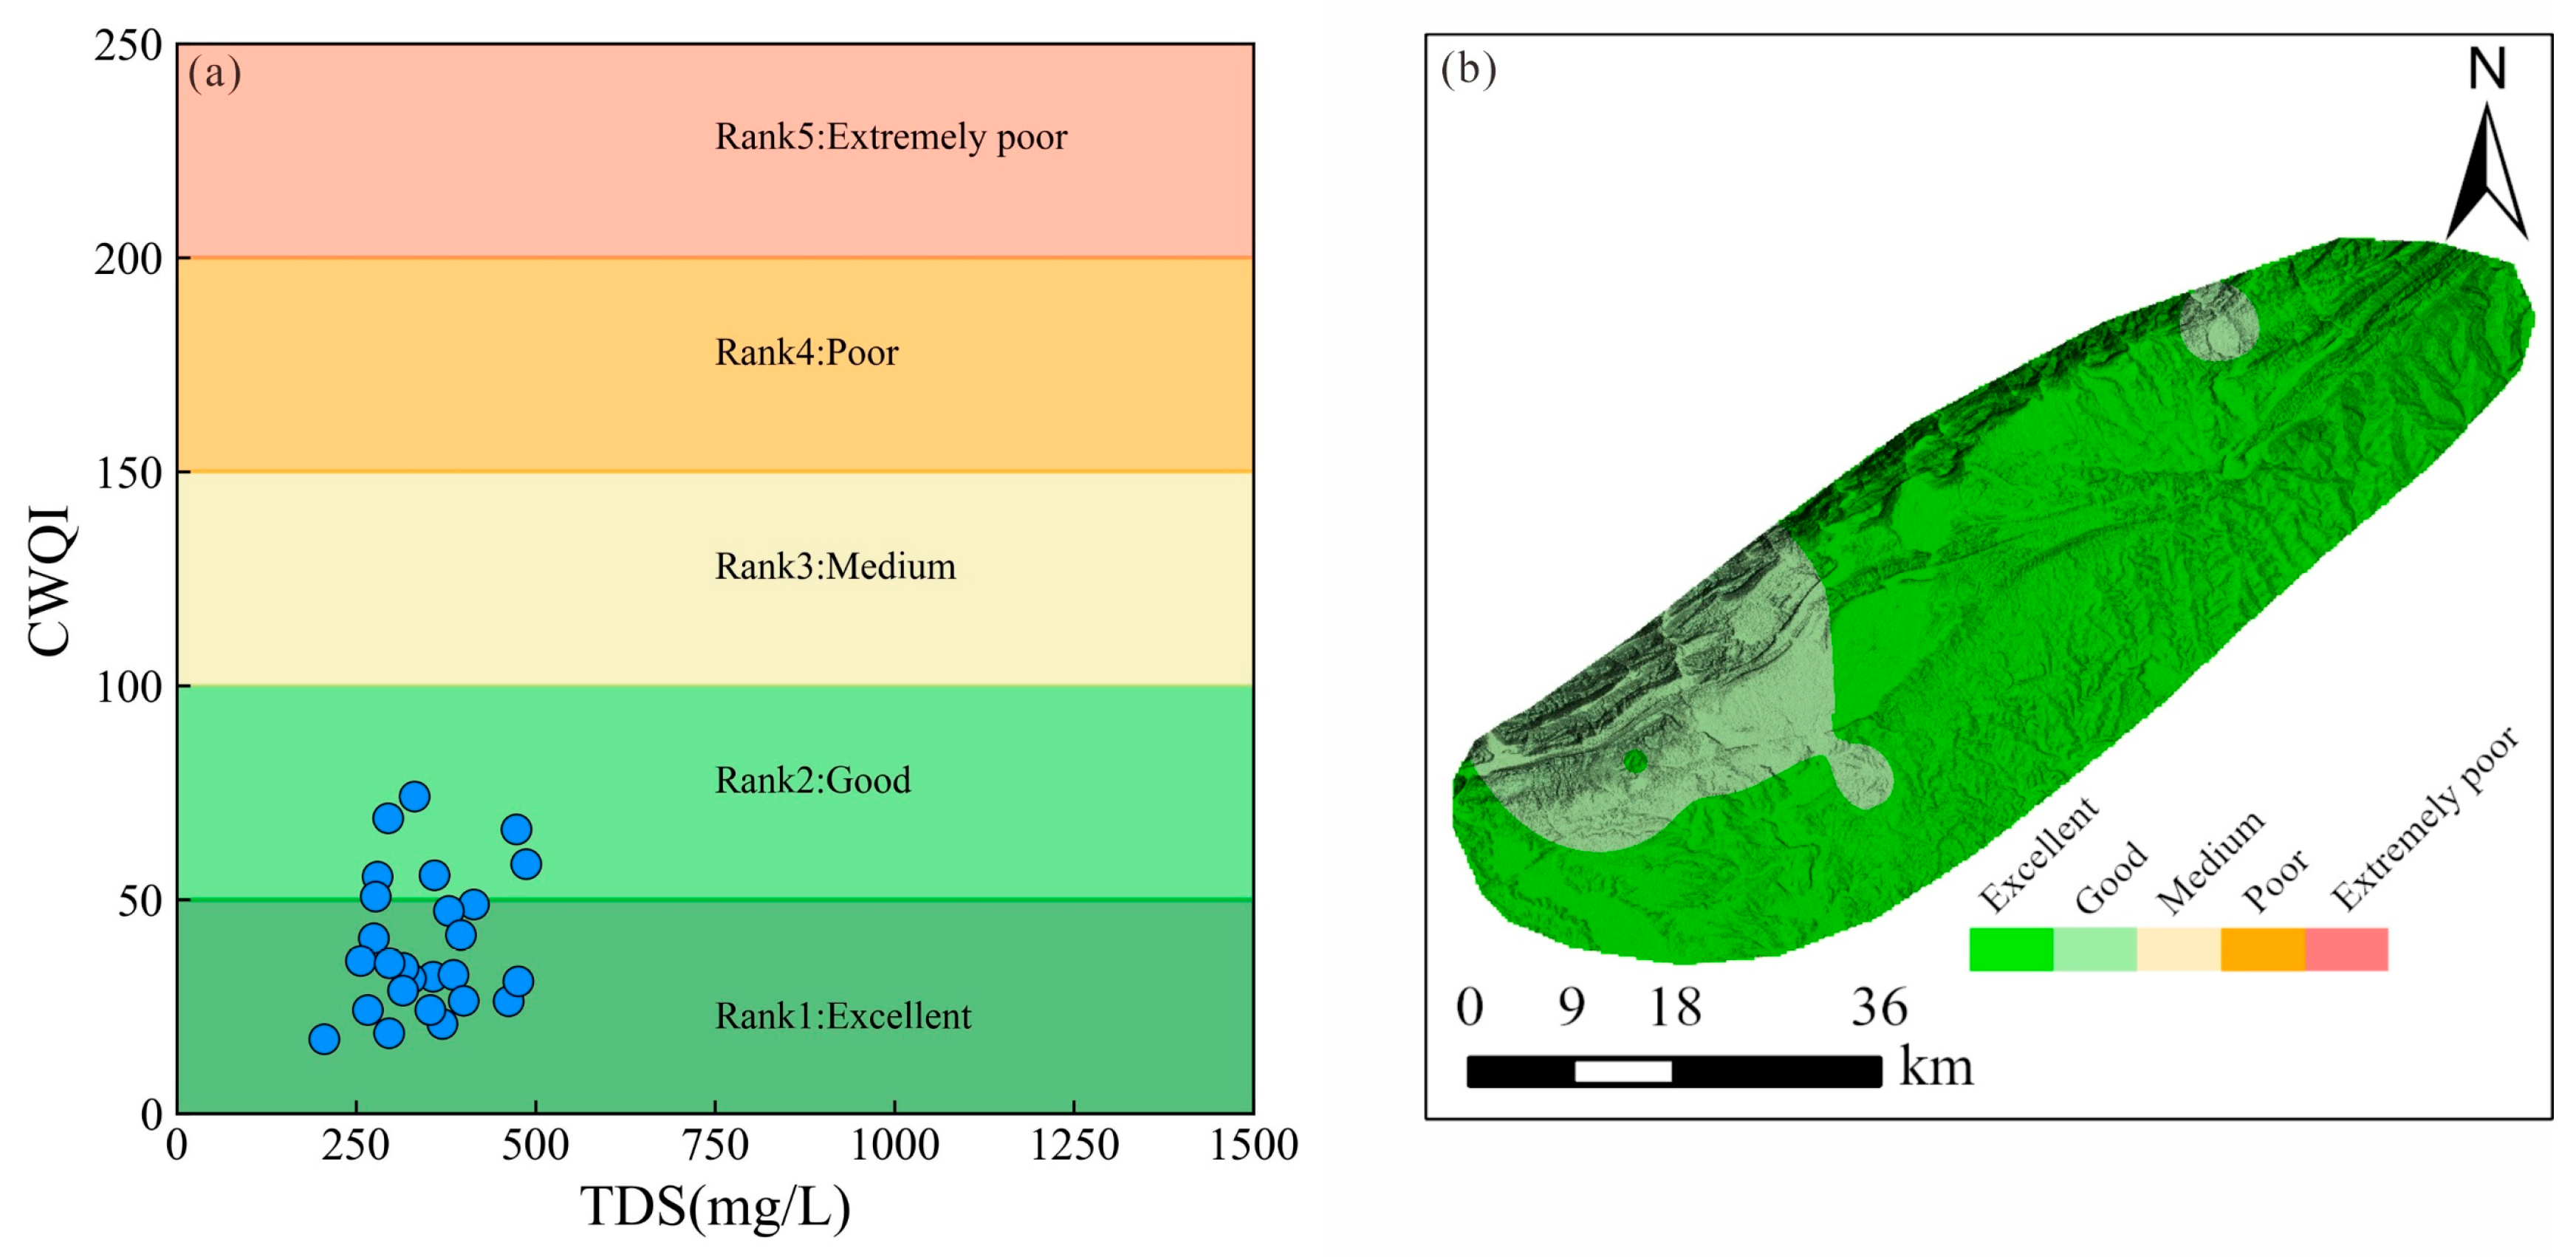
4.2. Groundwater Suitability for Drinking Purposes
4.3. Protection and Management Measures for Groundwater Resources
- Implementing stricter regulations to address the elevated levels of NO3− in groundwater, which is primarily caused by agricultural activities. This could include enforcing guidelines on the use of fertilizers and pesticides to minimize the infiltration of nutrients and pollutants into the groundwater.
- Raising public awareness about the importance of groundwater protection and the harmful effects of excessive groundwater extraction. Educational campaigns would encourage individuals and businesses to adopt water-saving practices, such as the development of efficient irrigation systems to safeguard groundwater resources.
- Supporting the development of advanced technologies for groundwater monitoring, management, and protection. This includes establishing a network of monitoring stations, regularly analyzing groundwater samples to assess water quality, and closely tracking water quality trends in order to implement timely and effective protective measures.
5. Conclusions
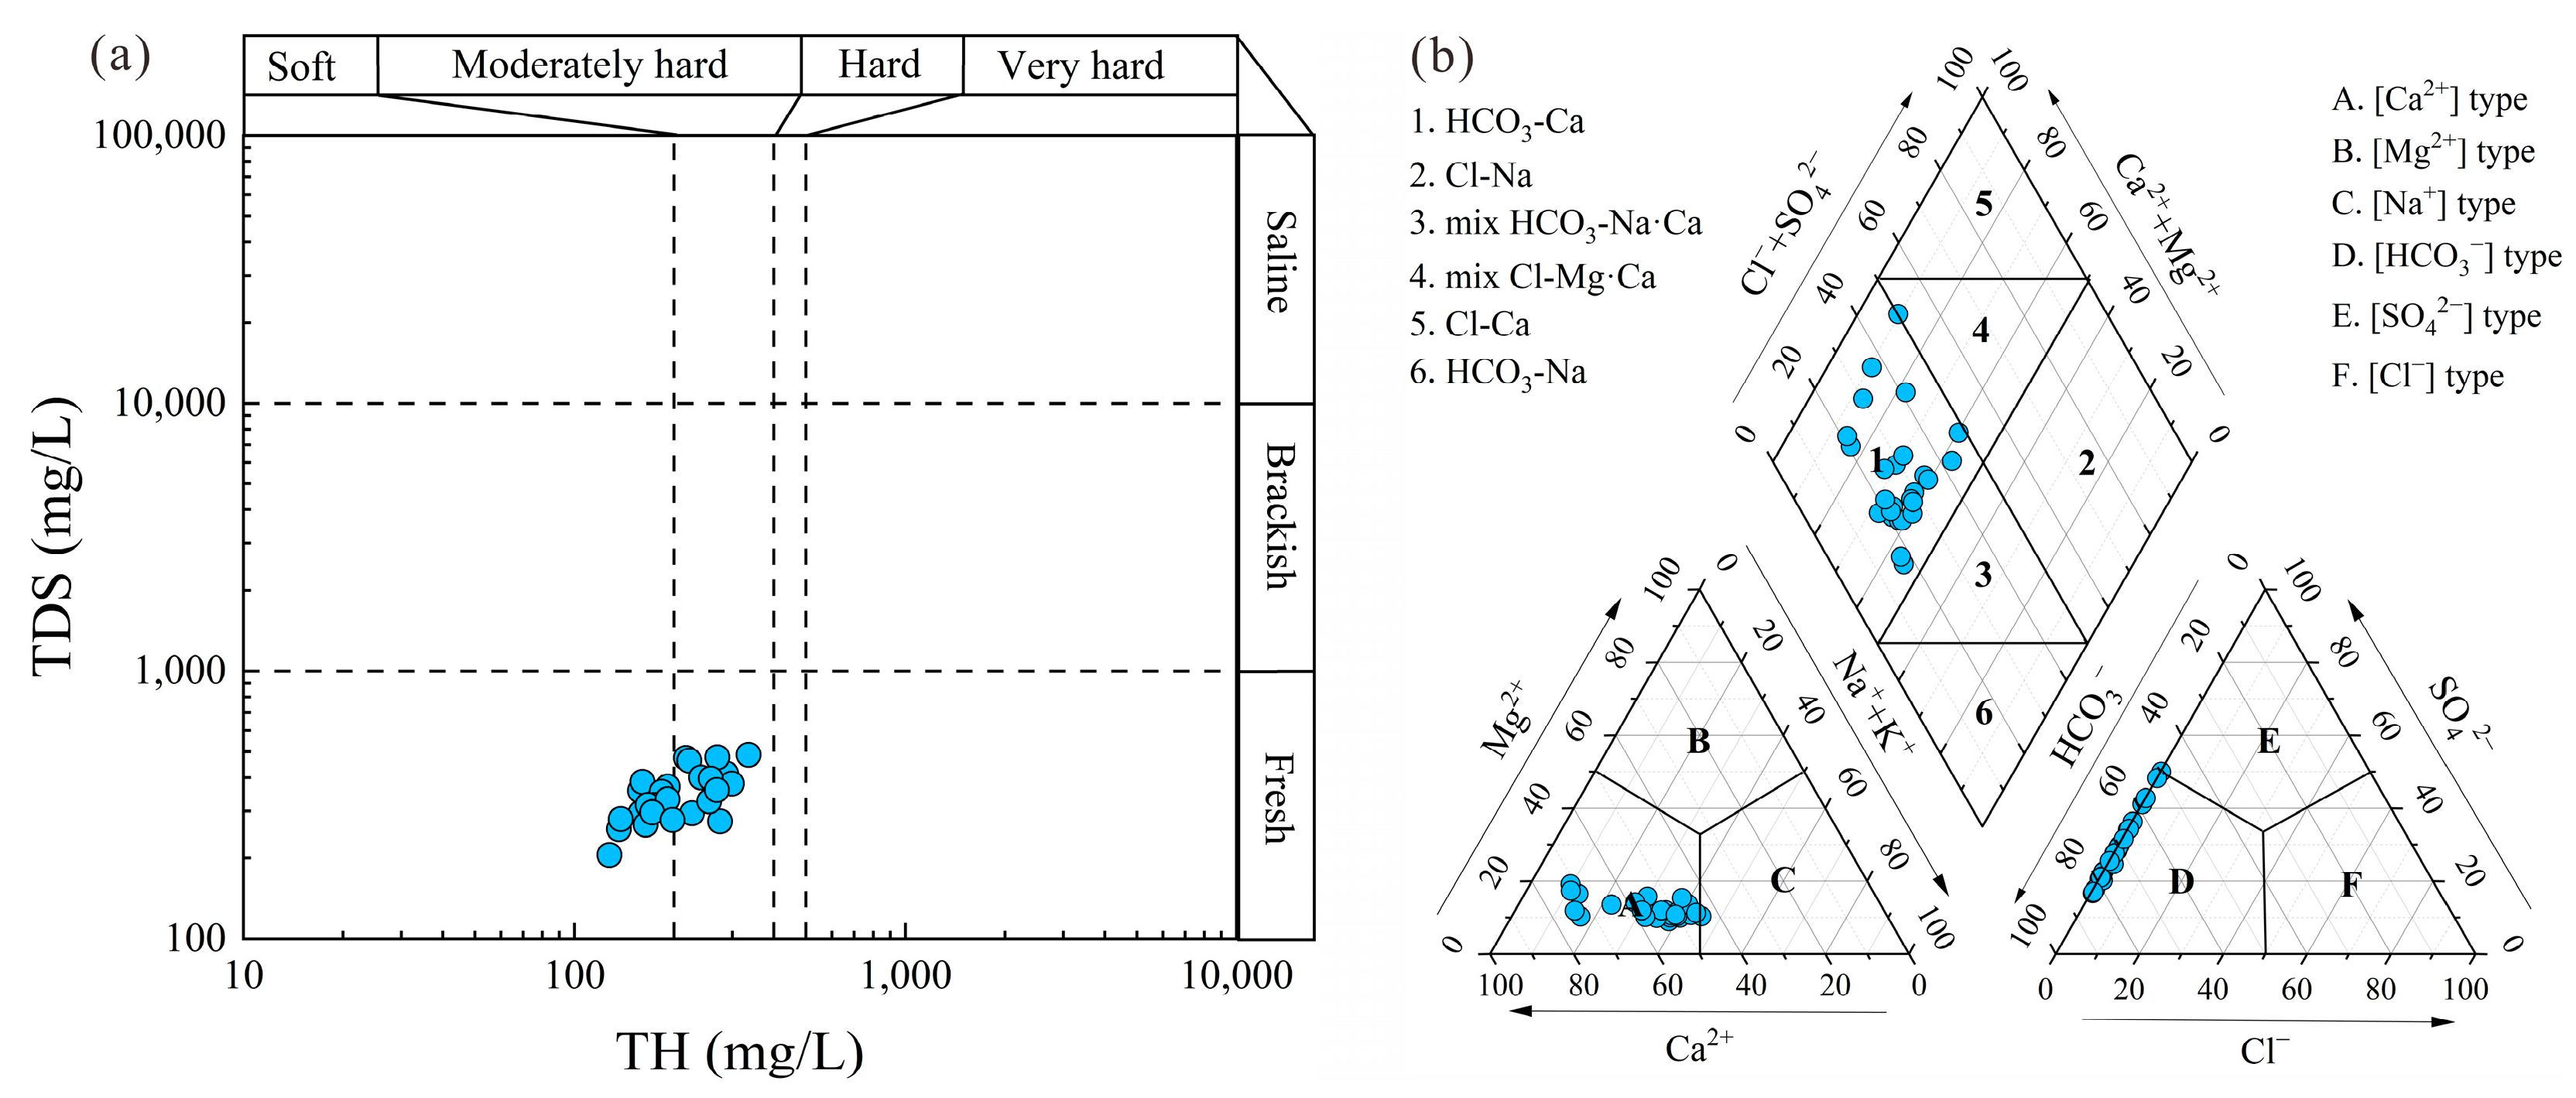
- The groundwater in the region was characterized by the HCO3-Ca type, attributed to silicate weathering and calcite dissolution. Agricultural activities significantly influenced the concentrations of NO3−, with 30.77% of samples exceeding the Chinese guidelines for drinking water. Cation exchange reaction played a crucial role in the enrichment of Na+ concentrations. The mineral saturation index of the groundwater indicated that calcite, dolomite, and fluorite were in a saturated state, with the gypsum and halite being soluble.
- The integrated weight analysis highlighted the significant impact of toxic elements on groundwater quality, with NO3− having the highest relative weight. Overall, the chemical water quality index (CWQI) revealed that the groundwater in the study area was deemed suitable for drinking, with 73.08% of the samples classified as excellent and 26.92% categorized as good. The good water quality grades in regions with elevated concentrations of NO3− and Ca2+ suggested that agricultural activities and geological processes played a significant role in shaping water quality.
- The sensitivity analysis results indicated that the removal of Cl− had the most significant effect on the CWQI (average value of 3.420%), while TDS had the least impact (mean value of 1.426%). This result not only demonstrated the applicability and robustness of the drinking water quality assessment model but also highlighted that the hydrochemical processes were influenced by both natural factors and human activities.
Author Contributions
Funding
Data Availability Statement
Conflicts of Interest
Appendix A

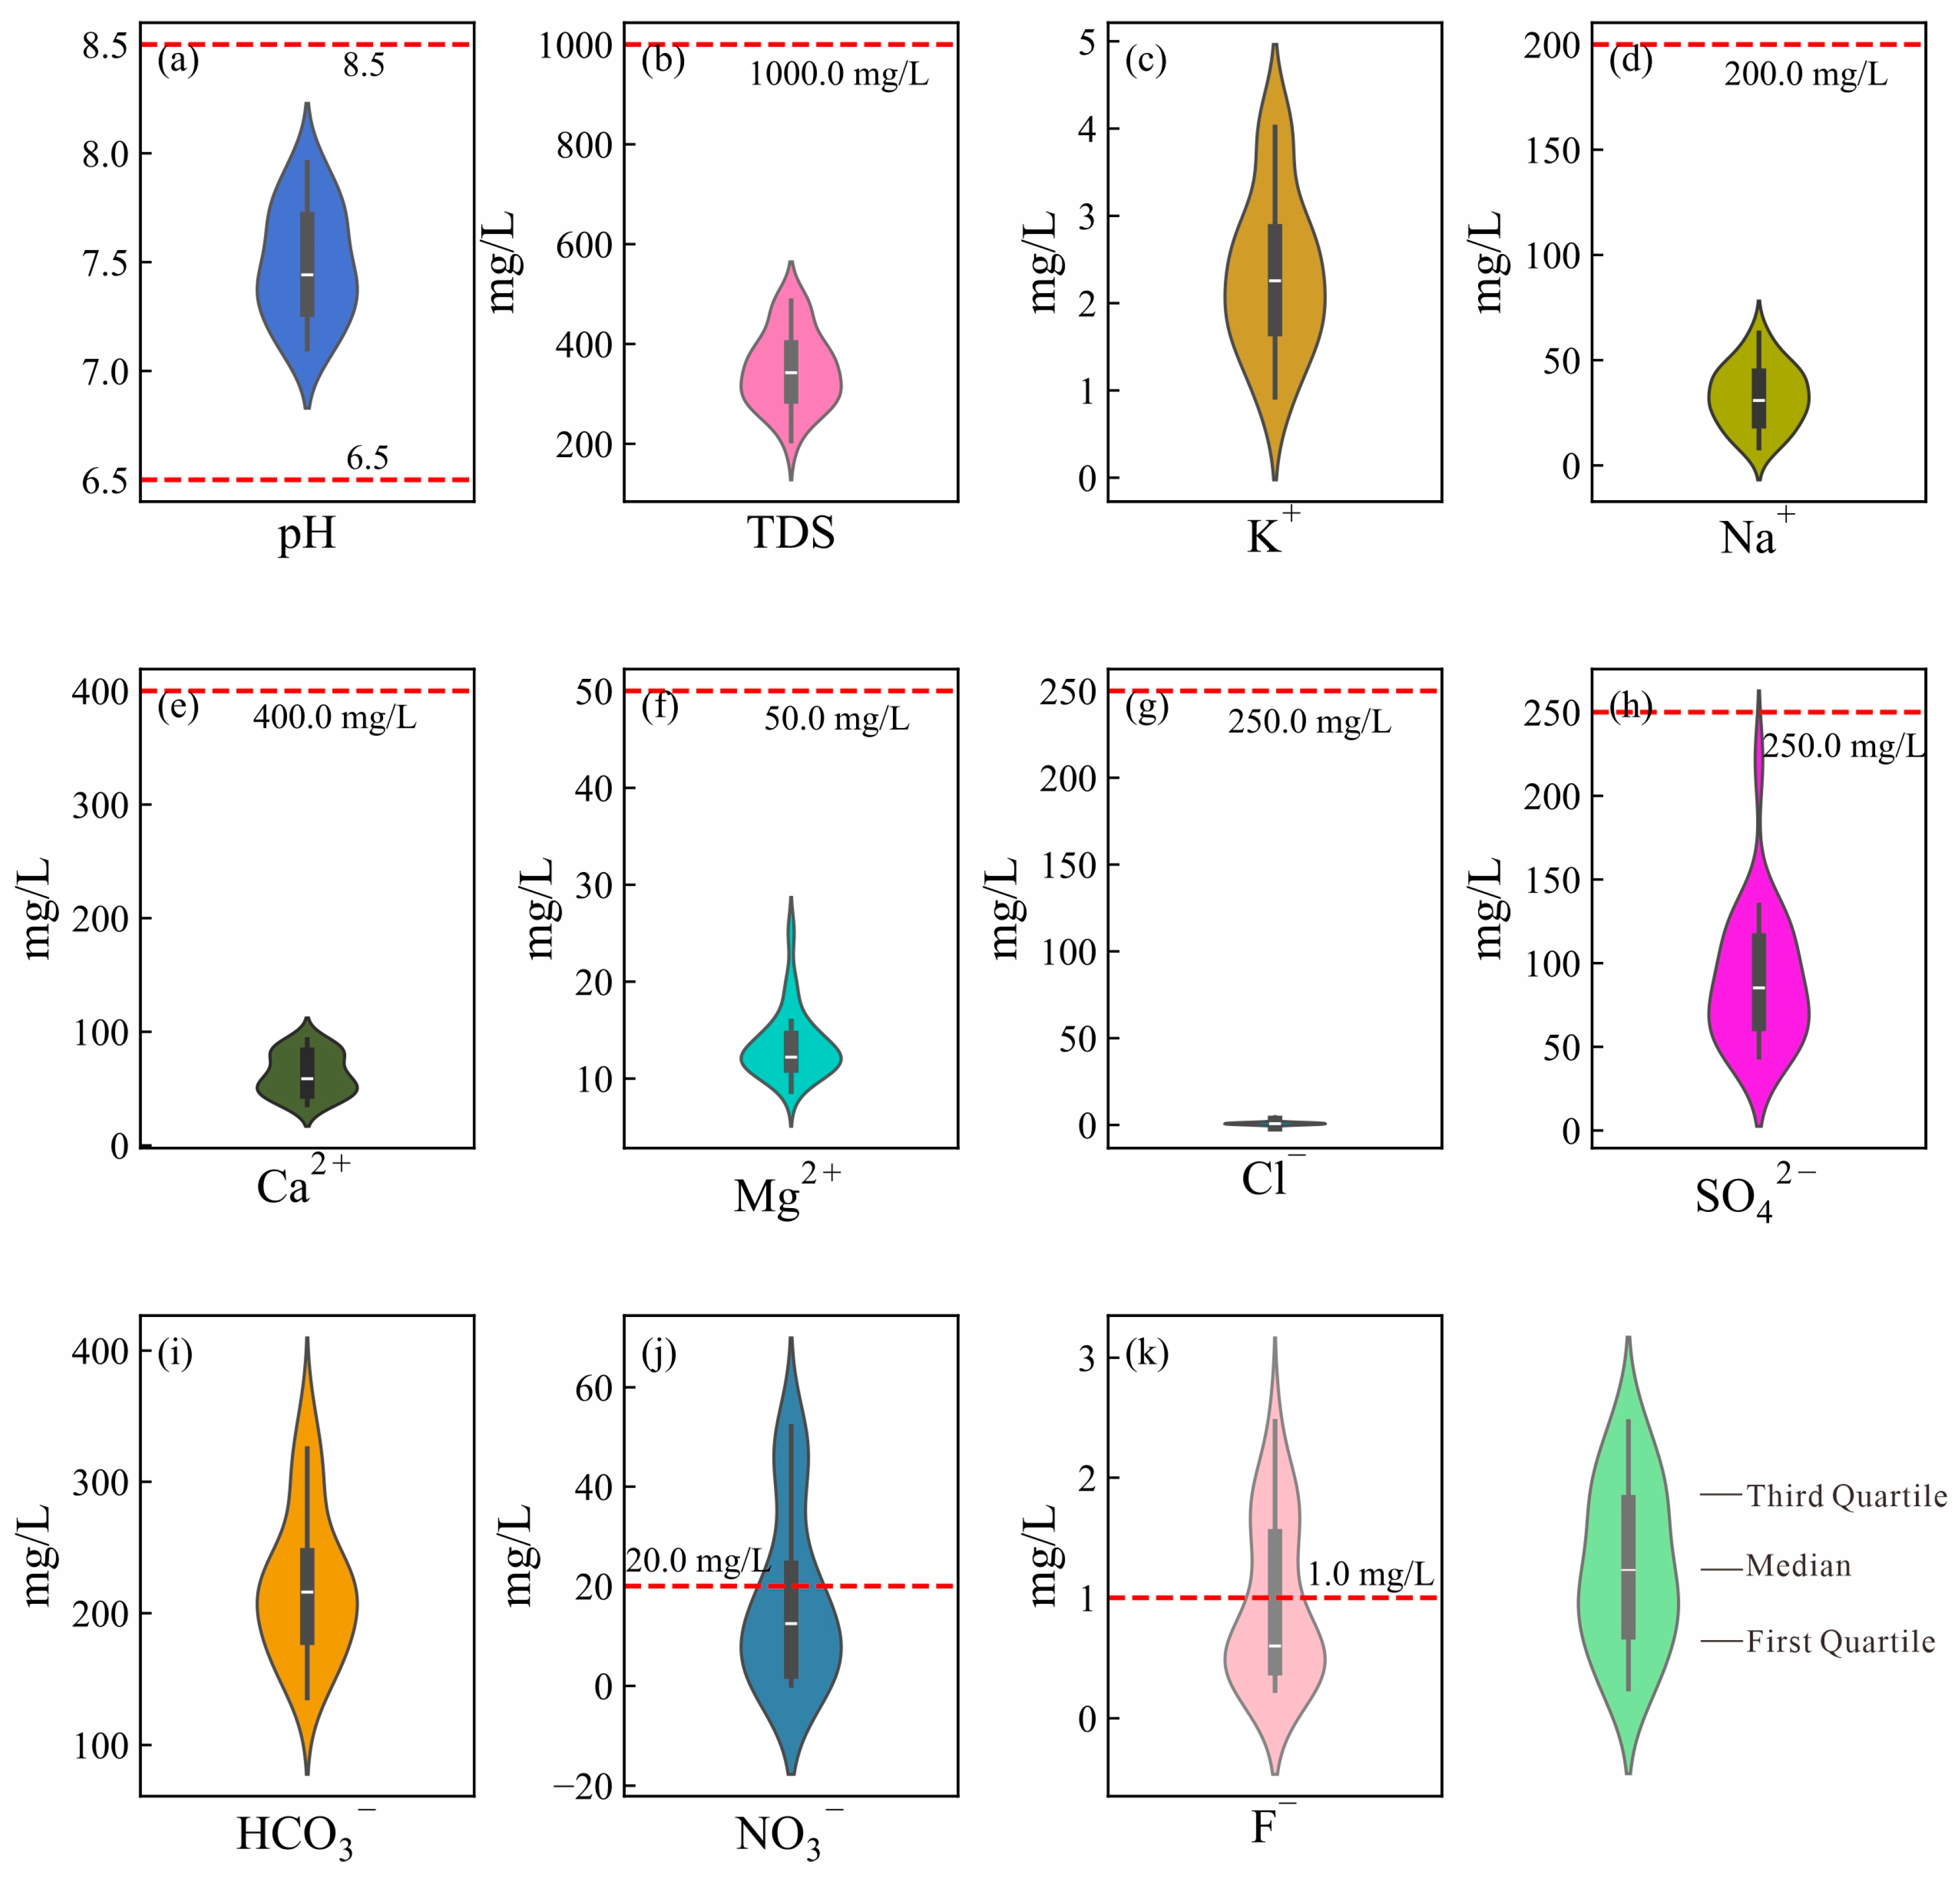
| Parameters | Min | Max | Mean | SD | CV | Limit | % of SEL |
|---|---|---|---|---|---|---|---|
| pH | 7.10 | 7.96 | 7.49 | 0.26 | 0.35 | 6.5–8.5 * | 0 |
| TDS | 205.54 | 486.80 | 347.98 | 74.45 | 100.88 | 1000.00 * | 0 |
| K+ | 0.92 | 4.02 | 2.34 | 0.91 | 1.23 | - | 0 |
| Na+ | 8.30 | 62.94 | 32.73 | 14.51 | 19.66 | 200.00 * | 0 |
| Ca2+ | 35.80 | 93.22 | 62.34 | 18.17 | 24.62 | 400.00 * | 0 |
| Mg2+ | 8.67 | 25.10 | 13.40 | 3.44 | 4.66 | 150.00 * | 0 |
| Cl− | 0.12 | 3.95 | 0.93 | 0.83 | 1.12 | 250.00 * | 0 |
| HCO3− | 135.79 | 351.62 | 221.66 | 55.66 | 75.41 | 250.00 * | 0 |
| SO42− | 43.83 | 221.39 | 89.03 | 39.62 | 53.69 | 450.00 * | 0 |
| NO3− | 0.11 | 52.11 | 17.25 | 17.10 | 23.18 | 20 ** | 30.77 |
| F− | 0.23 | 2.47 | 0.95 | 0.67 | 0.90 | 1.00 ** | 38.46 |
References
- Wang, L.; Zhang, Q.; Wang, H. Rapid Urbanization Has Changed the Driving Factors of Groundwater Chemical Evolution in the Large Groundwater Depression Funnel Area of Northern China. Water 2023, 15, 2917. [Google Scholar] [CrossRef]
- Agbasi, J.C.; Chukwu, C.N.; Nweke, N.D.; Uwajingba, H.C.; Khan, M.Y.A.; Egbueri, J.C. Water pollution indexing and health risk assessment due to PTE ingestion and dermal absorption for nine human populations in Southeast Nigeria. Groundw. Sustain. Dev. 2023, 21, 100921. [Google Scholar] [CrossRef]
- He, C.; Liu, Z.; Wu, J.; Pan, X.; Fang, Z.; Li, J.; Bryan, B.A. Future global urban water scarcity and potential solutions. Nat. Commun. 2021, 12, 4667. [Google Scholar] [CrossRef] [PubMed]
- Wang, Y.; Li, P. Appraisal of shallow groundwater quality with human health risk assessment in different seasons in rural areas of the Guanzhong Plain (China). Environ. Res. 2022, 207, 112210. [Google Scholar] [CrossRef] [PubMed]
- Li, P.; Wu, J. Drinking Water Quality and Public Health. Expo Health 2019, 11, 73–79. [Google Scholar] [CrossRef]
- Subba Rao, N.; Das, R.; Sahoo, H.K.; Gugulothu, S. Hydrochemical characterization and water quality perspectives for groundwater management for urban development. Groundw. Sustain. Dev. 2024, 24, 101071. [Google Scholar] [CrossRef]
- Li, J.; Yang, G.; Zhu, D.; Xie, H.; Zhao, Y.; Fan, L.; Zou, S. Hydrogeochemistry of karst groundwater for the environmental and health risk assessment: The case of the suburban area of Chongqing (Southwest China). Geochemistry 2022, 82, 125866. [Google Scholar] [CrossRef]
- Tang, L.; Yao, R.; Zhang, Y.; Ding, W.; Wang, J.; Kang, J.; Liu, G.; Zhang, W.; Li, X. Hydrochemical analysis and groundwater suitability for drinking and irrigation in an arid agricultural area of the Northwest China. J. Contam. Hydrol. 2023, 259, 104256. [Google Scholar] [CrossRef]
- Li, R.; Yan, Y.; Xu, J.; Yang, C.; Chen, S.; Wang, Y.; Zhang, Y. Evaluate the groundwater quality and human health risks for sustainable drinking and irrigation purposes in mountainous region of Chongqing, Southwest China. J. Contam. Hydrol. 2024, 264, 104344. [Google Scholar] [CrossRef]
- Liu, J.; Yang, C.; Chen, S.; Wang, Y.; Zhang, X.; Kang, W.; Li, J.; Wang, Y.; Hu, Q.; Yuan, X. Hydrochemical Appraisal and Driving Forces of Groundwater Quality and Potential Health Risks of Nitrate in Typical Agricultural Area of Southwestern China. Water 2023, 15, 4095. [Google Scholar] [CrossRef]
- Qin, T.; Yang, P.; Groves, C.; Chen, F.; Xie, G.; Zhan, Z. Natural and anthropogenic factors affecting geochemistry of the Jialing and Yangtze Rivers in urban Chongqing, SW China. Appl. Geochem. 2018, 98, 448–458. [Google Scholar] [CrossRef]
- Gao, Y.; Qian, H.; Ren, W.; Wang, H.; Liu, F.; Yang, F. Hydrogeochemical characterization and quality assessment of groundwater based on integrated-weight water quality index in a concentrated urban area. J. Clean. Prod. 2020, 260, 121006. [Google Scholar] [CrossRef]
- Horton, R.K. An index number system for rating water quality. J. Water Pollut. Control Fed. 1965, 37, 300–306. [Google Scholar]
- Uddin, M.G.; Nash, S.; Rahman, A.; Olbert, A.I. A comprehensive method for improvement of water quality index (WQI) models for coastal water quality assessment. Water Res. 2022, 219, 118532. [Google Scholar] [CrossRef] [PubMed]
- Yan, T.; Shen, S.L.; Zhou, A. Indices and models of surface water quality assessment: Review and perspectives. Environ. Pollut. 2022, 308, 119611. [Google Scholar] [CrossRef]
- Ghazaryan, K.; Movsesyan, H.; Gevorgyan, A.; Minkina, T.; Sushkova, S.; Rajput, V.; Mandzhieva, S. Comparative hydrochemical assessment of groundwater quality from different aquifers for irrigation purposes using IWQI: A case-study from Masis province in Armenia. Groundw. Sustain. Dev. 2020, 11, 100459. [Google Scholar] [CrossRef]
- Han, R.; Liu, W.; Zhang, J.; Zhao, T.; Sun, H.; Xu, Z. Hydrogeochemical characteristics and recharge sources identification based on isotopic tracing of alpine rivers in the Tibetan Plateau. Environ. Res. 2023, 229, 115981. [Google Scholar] [CrossRef]
- Haghnazar, H.; Johannesson, K.H.; González-Pinzón, R.; Pourakbar, M.; Aghayani, E.; Rajabi, A.; Hashemi, A.A. Groundwater geochemistry, quality, and pollution of the largest lake basin in the Middle East: Comparison of PMF and PCA-MLR receptor models and application of the source-oriented HHRA approach. Chemosphere 2022, 288, 132489. [Google Scholar] [CrossRef]
- Gugulothu, S.; Subbarao, N.; Das, R.; Dhakate, R. Geochemical evaluation of groundwater and suitability of groundwater quality for irrigation purpose in an agricultural region of South India. Appl. Water Sci. 2022, 12, 142. [Google Scholar] [CrossRef]
- Tyagi, S.; Sharma, B.; Singh, P.; Dobhal, R. Water Quality Assessment in Terms of Water Quality Index. Am. J. Water Resour. 2013, 1, 34–38. [Google Scholar]
- Akhtar, N.; Ishak, M.I.S.; Ahmad, M.I.; Umar, K.; Md Yusuff, M.S.; Anees, M.T.; Qadir, A.; Ali Almanasir, Y.K. Modification of the Water Quality Index (WQI) Process for Simple Calculation Using the Multi-Criteria Decision-Making (MCDM) Method: A Review. Water 2021, 13, 905. [Google Scholar] [CrossRef]
- Yan, Y.; Zhang, Y.; Yang, S.; Wei, D.; Zhang, J.; Li, Q.; Yao, R.; Wu, X.; Wang, Y. Optimized groundwater quality evaluation using unsupervised machine learning, game theory and Monte-Carlo simulation. J. Environ. Manag. 2024, 371, 122902. [Google Scholar] [CrossRef]
- Yassin, M.A.; Abba, S.I.; Shah, S.M.H.; Usman, A.G.; Egbueri, J.C.; Agbasi, J.C.; Khogali, A.; Baalousha, H.M.; Aljundi, I.H.; Sammen, S.S.; et al. Toward Decontamination in Coastal Regions: Groundwater Quality, Fluoride, Nitrate, and Human Health Risk Assessments within Multi-Aquifer Al-Hassa, Saudi Arabia. Water 2024, 16, 1401. [Google Scholar] [CrossRef]
- Zhong, C.; Yang, Q.; Liang, J.; Ma, H. Fuzzy comprehensive evaluation with AHP and entropy methods and health risk assessment of groundwater in Yinchuan Basin, northwest China. Environ. Res. 2022, 204, 111956. [Google Scholar] [CrossRef] [PubMed]
- Xie, Z.; Liu, W.; Chen, S.; Yao, R.; Yang, C.; Zhang, X.; Li, J.; Wang, Y.; Zhang, Y. Machine learning approaches to identify hydrochemical processes and predict drinking water quality for groundwater environment in a metropolis. J. Hydrol. Reg. Stud. 2025, 58, 102227. [Google Scholar] [CrossRef]
- Zhang, Y.; Dai, Y.; Wang, Y.; Huang, X.; Xiao, Y.; Pei, Q. Hydrochemistry, quality and potential health risk appraisal of nitrate enriched groundwater in the Nanchong area, southwestern China. Sci. Total Environ. 2021, 784, 147186. [Google Scholar] [CrossRef]
- Xu, H.; Ma, C.; Lian, J.; Xu, K.; Chaima, E. Urban flooding risk assessment based on an integrated k-means cluster algorithm and improved entropy weight method in the region of Haikou, China. J. Hydrol. 2018, 563, 975–986. [Google Scholar] [CrossRef]
- Ding, F.; Chen, L.; Sun, C.; Zhang, W.; Yue, H.; Na, S. An upgraded groundwater quality evaluation based on Hasse diagram technique & game theory. Ecol. Indic. 2022, 140, 109024. [Google Scholar] [CrossRef]
- Chen, S.; Tang, Z.; Wang, J.; Wu, J.; Yang, C.; Kang, W.; Huang, X. Multivariate Analysis and Geochemical Signatures of Shallow Groundwater in the Main Urban Area of Chongqing, Southwestern China. Water 2020, 12, 2833. [Google Scholar] [CrossRef]
- Mao, H.; Wang, G.; Liao, F.; Shi, Z.; Rao, Z.; Zhang, H.; Qiao, Z.; Bai, Y.; Chen, X.; Yan, X.; et al. Spatiotemporal Variation of Groundwater Nitrate Concentration Controlled by Groundwater Flow in a Large Basin: Evidence From Multi-Isotopes (15N, 11B, 18O, and 2H). Water Resour. Res. 2024, 60, e2023WR035299. [Google Scholar] [CrossRef]
- Xiao, Y.; Hao, Q.; Zhang, Y.; Zhu, Y.; Yin, S.; Qin, L.; Li, X. Investigating sources, driving forces and potential health risks of nitrate and fluoride in groundwater of a typical alluvial fan plain. Sci. Total Environ. 2022, 802, 149909. [Google Scholar] [CrossRef] [PubMed]
- Zhang, F.; Huang, G.; Hou, Q.; Liu, C.; Zhang, Y.; Zhang, Q. Groundwater quality in the Pearl River Delta after the rapid expansion of industrialization and urbanization: Distributions, main impact indicators, and driving forces. J. Hydrol. 2019, 577, 124004. [Google Scholar] [CrossRef]
- Yang, Y.; Li, P.; Elumalai, V.; Ning, J.; Xu, F.; Mu, D. Groundwater Quality Assessment Using EWQI With Updated Water Quality Classification Criteria: A Case Study in and Around Zhouzhi County, Guanzhong Basin (China). Expo Health 2023, 15, 825–840. [Google Scholar] [CrossRef]
- GB/T 14848-2017; Standards for Groundwater Quality. General Administration of Quality Supervision (GAQS): Beijing, China, 2017; 20p.
- WHO. Guidelines for Drinking-Water Quality, 4th ed.; World Health Organization: Geneva, Switzerland, 2011. [Google Scholar]
- Obeidavi, S.; Gandomkar, M.; Akbarizadeh, G.; Delfan, H. Evaluation of groundwater potential using Dempster-Shafer model and sensitivity analysis of effective factors: A case study of north Khuzestan province. Remote Sens. Appl. Soc. Environ. 2021, 22, 100475. [Google Scholar] [CrossRef]
- Lodwick, W.A.; Monson, W.; Svoboda, L. Attribute error and sensitivity analysis of map operations in geographical informations systems: Suitability analysis. Int. J. Geogr. Inf. Syst. 1990, 4, 413–428. [Google Scholar] [CrossRef]
- Gibbs. Mechanisms controlling world water chemistry: Evaporation-crystallization process. Science 1971, 172, 870–872. [Google Scholar] [CrossRef]
- Gaillardet. Global silicate weathering and CO2 consumption rates deduced from the chemistry of large rivers. Chem. Geol. 1999, 159, 3–30. [Google Scholar] [CrossRef]

| Parameter | pH | TDS | Na+ | Ca2+ | Mg2+ | Cl− | SO42− | NO3− | F− |
|---|---|---|---|---|---|---|---|---|---|
| Wf | 0.138 | 0.134 | 0.083 | 0.130 | 0.166 | 0.057 | 0.151 | 0.097 | 0.044 |
| Wj | 0.093 | 0.052 | 0.072 | 0.095 | 0.079 | 0.153 | 0.131 | 0.174 | 0.151 |
| Wc | 0.116 | 0.093 | 0.077 | 0.112 | 0.122 | 0.105 | 0.141 | 0.136 | 0.098 |
Disclaimer/Publisher’s Note: The statements, opinions and data contained in all publications are solely those of the individual author(s) and contributor(s) and not of MDPI and/or the editor(s). MDPI and/or the editor(s) disclaim responsibility for any injury to people or property resulting from any ideas, methods, instructions or products referred to in the content. |
© 2025 by the authors. Licensee MDPI, Basel, Switzerland. This article is an open access article distributed under the terms and conditions of the Creative Commons Attribution (CC BY) license (https://creativecommons.org/licenses/by/4.0/).
Share and Cite
Tang, N.; Chen, M.; Zhou, M.; Xie, Z.; Liu, W.; Huang, X. Hydrochemical Characteristics and Drinking Water Quality Assessment of Phreatic Groundwater in the Northwest of the Sichuan Basin, SW China. Water 2025, 17, 1074. https://doi.org/10.3390/w17071074
Tang N, Chen M, Zhou M, Xie Z, Liu W, Huang X. Hydrochemical Characteristics and Drinking Water Quality Assessment of Phreatic Groundwater in the Northwest of the Sichuan Basin, SW China. Water. 2025; 17(7):1074. https://doi.org/10.3390/w17071074
Chicago/Turabian StyleTang, Ning, Mengjun Chen, Meizhu Zhou, Zhan Xie, Weiting Liu, and Xun Huang. 2025. "Hydrochemical Characteristics and Drinking Water Quality Assessment of Phreatic Groundwater in the Northwest of the Sichuan Basin, SW China" Water 17, no. 7: 1074. https://doi.org/10.3390/w17071074
APA StyleTang, N., Chen, M., Zhou, M., Xie, Z., Liu, W., & Huang, X. (2025). Hydrochemical Characteristics and Drinking Water Quality Assessment of Phreatic Groundwater in the Northwest of the Sichuan Basin, SW China. Water, 17(7), 1074. https://doi.org/10.3390/w17071074