Article

Waste Natural Pyrite Activation of Peroxymonosulfate for Degradation of Artificial Sweetener Acesulfame Potassium: Efficiency, Influencing Factors, Degradation Mechanisms, and Toxicity Evaluation

1
School of Environment and Energy, South China University of Technology, Guangzhou 510006, China
2
Guangxi Key Laboratory of Environmental Pollution Control Theory and Technology, Guilin University of Technology, Guilin 541004, China
3
University Engineering Research Center of Watershed Protection and Green Development, Guangxi, Guilin University of Technology, Guilin 541006, China
*
Author to whom correspondence should be addressed.
Water 2025, 17(11), 1558; https://doi.org/10.3390/w17111558
Submission received: 11 April 2025 / Revised: 17 May 2025 / Accepted: 19 May 2025 / Published: 22 May 2025

Abstract

:
Acesulfame potassium (ACE) is an emerging pollutant with the potential to induce a range of health hazards. In this study, waste natural pyrite (with some oxides on its surface) was washed and used as an activator to activate potassium peroxomonosulfate (PMS) to degrade ACE in water. The experimental results demonstrate that waste natural pyrite with an oxidized layer exhibited a significant degradation effect on ACE. Under conditions of 0.7 g/L pyrite and 60 μM PMS, a degradation rate of 99.3% for ACE was achieved within 15 min, and the mineralization rate reached 15.3% within 30 min. In addition, concerning its applicability, waste natural pyrite demonstrates strong activation ability within a pH range of 3 to 7. It is important to note that while HCO3 and Ca2+ can influence the effectiveness, other common anions and cations do not significantly affect the degradation process. Mechanistic studies reveal that the primary active species in the waste natural pyrite/PMS system were sulfate radicals (SO4•−) as well as hydroxyl radicals (OH), which contributed 50.6% and 36.9%, respectively. In addition, the analysis of ACE degradation products indicates that no highly toxic intermediates were generated during the degradation process. Overall, this study underscores the outstanding performance of waste natural pyrite as an activator, providing a safe, efficient, and cost-effective approach for degrading organic pollutants like ACE.

1. Introduction

Artificial sweeteners are a class of synthetic or semi-synthetic sucrose substitutes that are widely utilized in foods, beverages, cosmetics, and animal feeds due to their high sweetness and low caloric content [1,2]. The annual production of artificial sweeteners in China is approximately 121,400 tons, accounting for 75% of global production. Acesulfame potassium (ACE) is one of the most prevalent artificial sweeteners [3]. Studies have reported that ACE is not degraded by biological metabolism and ultimately enters natural water bodies through domestic sewage, polluting water sources [4,5]. Various artificial sweeteners, including ACE, have been detected in surface waters worldwide, with the highest concentration reaching 3 mg/L [1,6,7]. Accumulated ACE in natural waters has been shown to negatively influence fish growth and development [8], cause chronic toxicity in mammals [9], and impact small organisms in both soil and water [10,11]. However, the treatment processes employed by traditional sewage treatment plants exhibit limited effectiveness in removing ACE, leading to significant quantities of ACE being discharged into surface water [12,13]. Currently, relatively few studies have systematically investigated ACE processing [14,15].
Advanced oxidation technologies (AOTs) represent effective methods for degrading organic pollutants in water [16], as they generate reactive oxygen species (ROS) that engage in oxidative reactions with target compounds. Sulfate radicals have garnered significant attention in recent years due to their higher redox potential, greater radical yield, and longer lifetime [17]. Potassium peroxymonosulfate (PMS), a strong oxidant that generates sulfate radicals, typically requires activation treatment for practical applications [18]. Common activators include carbon-based materials, cobalt-based materials, manganese-based materials, and iron-based materials. Among these, carbon-based materials often exhibit limited activation efficiency, necessitating modifications prior to application [19]. Cobalt-based and manganese-based materials exhibit the most effective activation; however, their relatively high costs and the risk of leached metal ions causing secondary pollution remain significant concerns [20,21]. In contrast, iron-based materials exhibit advantages in terms of environmental friendliness and significant activation effects [22], making them highly promising candidates for PMS activation.
As reported in reference [23], pyrite is the most plentiful metallic sulfide mineral on our planet, which exhibits limited application scenarios. It is predominantly used for producing ornaments and extracting sulfur and sulfuric acid [24]. During the ore smelting process, substantial amounts of pyrite tailings are generated and frequently discarded, exacerbating the environmental risks associated with acid mine drainage [25]. Consequently, it is imperative to expand the application areas of pyrite. Recent studies have revealed that pyrite, as an iron-based material, exhibits remarkable properties in activating PMS, making it a prominent subject of research in recent years [26]. This is attributed to the capacity of pyrite and its dissolved free Fe(II) to activate PMS, resulting in the generation of numerous free radical active species that effectively degrade pollutants [27]. Furthermore, the decrease in pH during the reaction accelerates Fe dissolution, thereby promoting the reaction. Additionally, S22− possesses electron-donating capabilities, facilitating the transformation of Fe(III) to Fe(II), which eventually enhances the utilization of Fe(II) [28]. Collectively, these factors make pyrite a highly effective choice among PMS activators.
However, most of the pyrite used by researchers to activate PMS is synthesized or subjected to acid washing, which enhances its surface activity and improves activation efficacy [29,30,31]. However, such treatments are associated with relatively high costs and complex procedures. In contrast, waste natural pyrite, commonly found in tailings ponds, has often been neglected due to its oxidized surface layer, which leads to the perception that direct activation using this form of pyrite is ineffective. Consequently, the research on waste natural pyrite has been relatively limited, leading to an incomplete understanding of its actual degradation efficacy. Recent studies have demonstrated that the surface secondary minerals of pyrite positively influence its photodegradation performance [32]. If it is confirmed that waste natural pyrite with an oxidized layer possesses activation capabilities comparable to those of high-purity pyrite in activating PMS, the costs associated with pyrite use can be significantly reduced, thus facilitating the objective of treating waste with waste.
In addition, some studies have found that after the treatment of ACE with chlorine and ultraviolet light, the toxicity of the degradation products has increased significantly, reaching more than 500 times at the maximum [33,34]. Therefore, it is very necessary to evaluate the toxicity of the degradation products of ACE. The ecological structure–activity relationship model (ECOSAR) is a software that is based on the quantitative relationship between molecular structure characteristics and a toxicity database, and is used to predict the acute toxicity (LC50/EC50) and chronic toxicity (ChV) of compounds to organisms such as fish, Daphnia magna, and green algae. It is often used to predict the toxic effects of chemicals on aquatic organisms and for ecological risk assessment [35,36].
In this study, we examined the artificial sweetener ACE as a target pollutant and aimed to activate PMS with waste natural pyrite. Our objective was to investigate its effects and mechanisms in the degradation of ACE. We systematically analyzed the influence of varying amounts of pyrite and different concentrations of PMS on the degradation efficiency of ACE. Additionally, we assessed the performance of the degradation system across a range of pH levels and in the presence of common anions and cations found in natural waters. Four potential ROS were identified, and their respective contributions were calculated. Finally, we quantitatively analyzed the primary functioning ROS and clarified their generation mechanisms. The toxicity of ACE and its transformation products (TPs) was evaluated using HPLC-TQMS (Quantitative Analysis version B.04.00/Build 4.0.225.19) and ECOSAR software (ECOSAR v2.2).

2. Materials and Methods

2.1. Chemical Reagents

Potassium peroxymonosulfate (KHSO5·0.5 KHSO4·0.5 K2SO4, PMS), acesulfame potassium (ACE), benzoic acid (BA), nitrobenzene (NB), ethanol (EtOH), methanol (MeOH), chloroform (CF), furfuryl alcohol (FFA), tert-butyl alcohol (TBA), 2,2,6,6-tetramethyl-4-piperidone (TEMP, 98%), 5,5-dimethyl-1-pyrroline-N-oxide (DMPO, 97%), CaSO4, MgSO4, NaCl, NaHCO3, NaNO3, H2SO4 (98%), NaOH, and NaNO2 (99%) were obtained from Shanghai Aladdin Biochemical Technology Co., Ltd., Shanghai, China.

2.2. Preparation and Characterization of Waste Natural Pyrite

Waste natural pyrite was collected from the tailings pond in Shangbao Mining Area, Hengyang City, Hunan Province, China. Pyrite particles with a size below 200 mesh were collected by sieving, and they were simply washed with deionized water. The washed pyrite was subsequently dehydrated using a vacuum freeze dryer (HASUC, Shanghai, China). After drying, the treated pyrite was stored in a glass desiccator for reserve.
The crystal structure of pyrite was characterized by an X-ray diffractometer (XRD, X’Pert3 Powder-DY5103, PANalytical, Almelo, The Netherlands). The microscopic morphology and elemental distribution of pyrite were observed using a scanning electron microscope (SEM, Regulus 8100, Hitachi, Tokyo, Japan) coupled with an energy-dispersive spectrometer (EDS, Octane Elect Super-70 mm2, EDAX, Pleasanton, CA, USA). The elemental ratios of pyrite were determined using X-ray fluorescence spectrometry (XRF, Spectro, Kleve, Germany). Variations in the valence states of S and Fe on pyrite before and after the reaction were characterized by X-ray photoelectron spectroscopy (XPS, ESCALAB 250Xi, Thermo Fisher Scientific, Waltham, MA, USA).

2.3. Experimental Process

2.3.1. Degradation Effect Experiment

Experiments were performed in a conical flask with a volume of 150 mL, rotating at a speed of 550 r/min. To initiate the reaction, certain amounts of ACE solution, PMS solution, and pyrite were added simultaneously into the reaction system. According to the actual concentration of ACE in the wastewater of the sewage treatment plant and the range of the wastewater’s pH value [37,38], an initial concentration of 10 μM for ACE and an initial pH of 7 were selected in this study. Meanwhile, based on the research of Fu et al. [39], the ratio of ACE to PMS was preliminarily determined to be 1:6. Under this condition, the amount of pyrite was varied to determine the optimal dosage. Then the ratio of PMS to pyrite was further optimized.
After the reaction was initiated, samples were extracted at fixed time intervals from the reaction system using 1 mL syringes with needles. Then, the aqueous samples were filtered through 0.45 µm PTFE needle filters and transferred into chromatography vials. The reaction was terminated by quenching the remaining free radicals in the samples with methanol. Finally, the concentration of ACE in the aqueous samples was determined by high-performance liquid chromatography (HPLC, Agilent 1260, Agilent, Santa Clara, CA, USA) and the mineralization rate is determined by Total Organic Carbon Analyzer (TOC, Multi N/C 3300, Analytik Jena, Jena, Germany). In order to determine the optimal dosage, experiments were carried out by increasing the amounts of pyrite and PMS from low to high. When the degradation rate no longer shows a significant increase, the dosage at this time is the optimal dosage. Control experiments were performed in the absence of PMS and pyrite. All experiments included three parallel samples to ensure the reliability and accuracy of the results.

2.3.2. Assessment of Application Scope

It has been reported that the dissociation constant of PMS in water is 9.3. PMS can exist stably under acidic conditions but is prone to decomposition under alkaline conditions [40]. Furthermore, the presence of anions and cations in the system can influence the degradation process. Therefore, we evaluated the applicability of the waste natural pyrite/PMS system for degrading ACE in practical scenarios, focusing on three aspects: pH, anions, and cations. The pH range was selected to be between 3 and 11 to encompass most real-world scenarios. Considering the anionic and cationic species and their concentrations in natural water bodies [41], Ca2+, Mg2+, Cl, HCO3, and NO3 were selected as representatives of anions and cations, and their concentration range was set to be 20–100 μM.
The initial pH was adjusted with 0.1 M sulfuric acid and NaOH solution before the start of the reaction. Solutions of CaSO4, MgSO4, NaCl, NaHCO3, and NaNO3 were prepared at specific concentrations and subsequently added to the system to simulate the influence of various ions in real environmental conditions on the reaction system. The rest of the experimental steps were the same as in Section 2.3.1.

2.3.3. Free Radical Identification, Quantification, and Quenching Experiments

In previous studies, SO4•−, OH, superoxide radicals (O2•−), and singlet oxygen (1O2) have been confirmed to be the four types of ROS that may be generated after the activation of PMS [26,31,42]. An electron paramagnetic resonance spectrometer (EPR, A300-10/2, Bruker, Munich, Germany) was employed to identify these four types of ROS. DMPO was utilized as the probe reagent for capturing the possible SO4•− and OH, DMPO was chosen to capture the possible O2•− in methanol solution, and TEMP was chosen to capture the possible 1O2 [43]. The EPR parameters were set as follows: center field at 3510 G, time constant set to 10.24 msec, sweep width of 100 G, modulation frequency of 100 kHz, acquisition duration of 5 min, and leveling amplitude of 1 G.
The contribution of different ROS to ACE degradation was evaluated through quenching experiments. EtOH was introduced into the system to quench SO4•− and OH. Meanwhile, TBA was used to inactivate OH, CF was employed to eliminate 1O2, and FFA was utilized to quench O2•− [42,43]. The subsequent experimental procedures were identical to those described in Section 2.3.1. The concentration of the quencher was progressively increased until the degree of inhibition of the reaction no longer changed significantly. The contribution ratio of the corresponding quenched ROS in the ACE degradation process was determined based on the maximum extent of reaction inhibition [44].
BA and NB were chosen as the probe reagents for SO4•− and OH, and the average concentration of SO4•− and OH in the system during the reaction time was calculated by analyzing their reaction kinetic processes in the waste natural pyrite/PMS system [42], which can be expressed as:
[ OH ] T = k obs 1 k PMS , NB k ads 1 k vol 1 k OH , NB ,
[ S O 4 ] T = k obs 2 k O H , BA [ OH ] T k PMS , BA k ads 2 k vol 2 k S O 4 , BA ,
In the above equations, kobs is the degradation kinetic constant of the waste pyrite/PMS system. KPMS,NB and kPMS,BA are the reaction rate constants of NB and BA reacting with PMS alone, respectively. Kads is the adsorption rate constant of the pyrite material for NB and BA. In addition, kvol is the volatilization rate constant of NB and BA. Since its value is extremely low, it can be ignored in this experiment.

2.4. Methods for Measuring the Concentration of Target Substances

The concentrations of ACE, BA, and NB in the samples were determined using HPLC with a C18 column (Polaris 5 C18-A, 250 × 4.6 mm, Agilent, Santa Clara, CA, USA). The column temperature was maintained at 35 °C. An injection volume of 30 μL was employed, and the flow rate was set at 1.0 mL/min. For the analysis of ACE, the mobile phase consisted of methanol and water in a 5:95 ratio, and the UV wavelength was adjusted to 230 nm. In the case of BA, the mobile phase consisted of a mixture containing methanol and water in a ratio of 45:55, with the UV wavelength adjusted to 227 nm. As for NB, the mobile phase was formulated as an 80:20 combination of methanol and water, and the wavelength of the UV light was adjusted to 263 nm.

2.5. Methods for Identification and Toxicity Assessment of Degradation Products

It has been reported that ACE may produce by-products with higher toxicity after treatment. To demonstrate that the proposed scheme in this study would not lead to secondary pollution during actual remediation, the TPs generated during the degradation of ACE were identified, and their toxicity was evaluated.
HPLC-TQMS (Agilent 1260-6460, Agilent, Santa Clara, CA, USA) was used to identify the TPs. A C18 chromatographic column (Shim-pack GIS C18, 3 μm, 2.1 × 100 mm, Shimadzu Corporation, Kyoto, Japan) was utilized with an injection volume of 10 μL. The mobile phases consisted of 0.1% formic acid (in water) and acetonitrile, delivered at a flow rate of 0.2 mL/min. The gradient elution method, which involved a mixture of 0.1% aqueous formic acid and acetonitrile, was performed as follows. Initially, the mobile phase composition was maintained at 80:20 (aqueous formic acid: acetonitrile) for the first 2 min; from 2 to 7 min, the mobile phase was gradually changed to 5:95 and kept at this ratio until 10 min; finally, the mobile phase ratio was adjusted back to 80:20. Two modes of detection were used—full scan and SIM. The full scan mode was used to identify the main products during the reaction, and the SIM mode was used to observe the changes in TP abundance with time.
The ecological structure–activity relationship model (ECOSAR) developed by the US EPA was used to assess the ecotoxicity of ACE and TPs [45]. The acute toxicity of the pollutants to fish and Daphnia was evaluated using LC50 (mg/L), the acute toxicity of the pollutants to green algae was evaluated using EC50 (mg/L), and the chronic toxicity of the pollutants to fish, daphnia, and green algae was evaluated using CHV (mg/L).

3. Results and Discussion

3.1. Research on the Degradation Performance of the Waste Natural Pyrite/PMS System

To evaluate the activation performance of waste natural pyrite with an oxidized layer-activated PMS for the degradation of ACE, the amounts of PMS and pyrite were controlled, and the effect of ACE degradation was subsequently evaluated. As shown in Figure 1, all five concentrations of the pyrite and PMS combination achieved over 85% removal of ACE within 30 min. This result suggests that the waste natural pyrite/PMS system can efficiently degrade ACE in a short period at a reasonable economic cost.
The degradation efficiency, with the ratio of ACE to PMS being 1:6, is depicted in Figure 1a, demonstrating the effects of varying pyrite concentrations. When the quantity of pyrite rose incrementally from 0.3 g/L to 0.7 g/L, the degradation efficiency significantly improved within the first 15 min, with the removal rate rising from 54.7% to 99.3%. This enhancement can be attributed to the expanded interfacial contact area existing between pyrite and the solution, subsequently elevating the reaction rate. However, further increases in the amount of pyrite did not result in a significant improvement in degradation efficiency. This phenomenon can be explained by the saturation of competition between pyrite and pollutants for PMS [26]. Consequently, the optimal pyrite concentration was determined to be 0.7 g/L.
The effect of PMS concentration on the degradation of ACE is illustrated in Figure 1c. A significant reduction in the reaction rate was observed as the PMS concentration decreased from 60 μM to 20 μM, with the removal rate dropping from 99.3% to 59.6% within the first 15 min. Conversely, increasing the PMS concentration beyond 60 μM did not result in a significant change in the reaction rate. This phenomenon can be attributed to the self-scavenging property of PMS [44], indicating that the optimal molar ratio of ACE to PMS is 1:6.
Compared with the system studied by Wang et al., this study performs better in terms of the dosage of PMS and pyrite [26]. In this system, the dosage of PMS is only 6 times the concentration of the pollutant, while in the comparative study, it is 7.5 times. The dosage of pyrite is 0.7 g/L, while in the comparative study, it is 1 g/L. When compared with the UV/PMS system used by Fu et al., this system can achieve the complete removal of ACE more quickly (15 min), while the UV/PMS system requires 30 min [39].
In addition, the TC, IC, and TOC of the reaction system were measured, and the results are presented in Table S1. Under optimal conditions, the mineralization rate of ACE was found to be 15.3% after 30 min of reaction. The relatively low mineralization rate of ACE can be attributed to the fact that its degradation involves complex transformation processes, which ultimately prolong the persistence of its degradation products. This is further corroborated in Section 3.4. Additionally, Section 3.4 indicates that the toxicity of the transformation products (TPs) of ACE has significantly decreased compared to that of ACE. Therefore, as long as ACE is completely removed from the sewage, it can be safely discharged into natural water bodies, allowing for further mineralization.

3.2. Assessment of the Applicable Scope of the Waste Natural Pyrite/PMS System

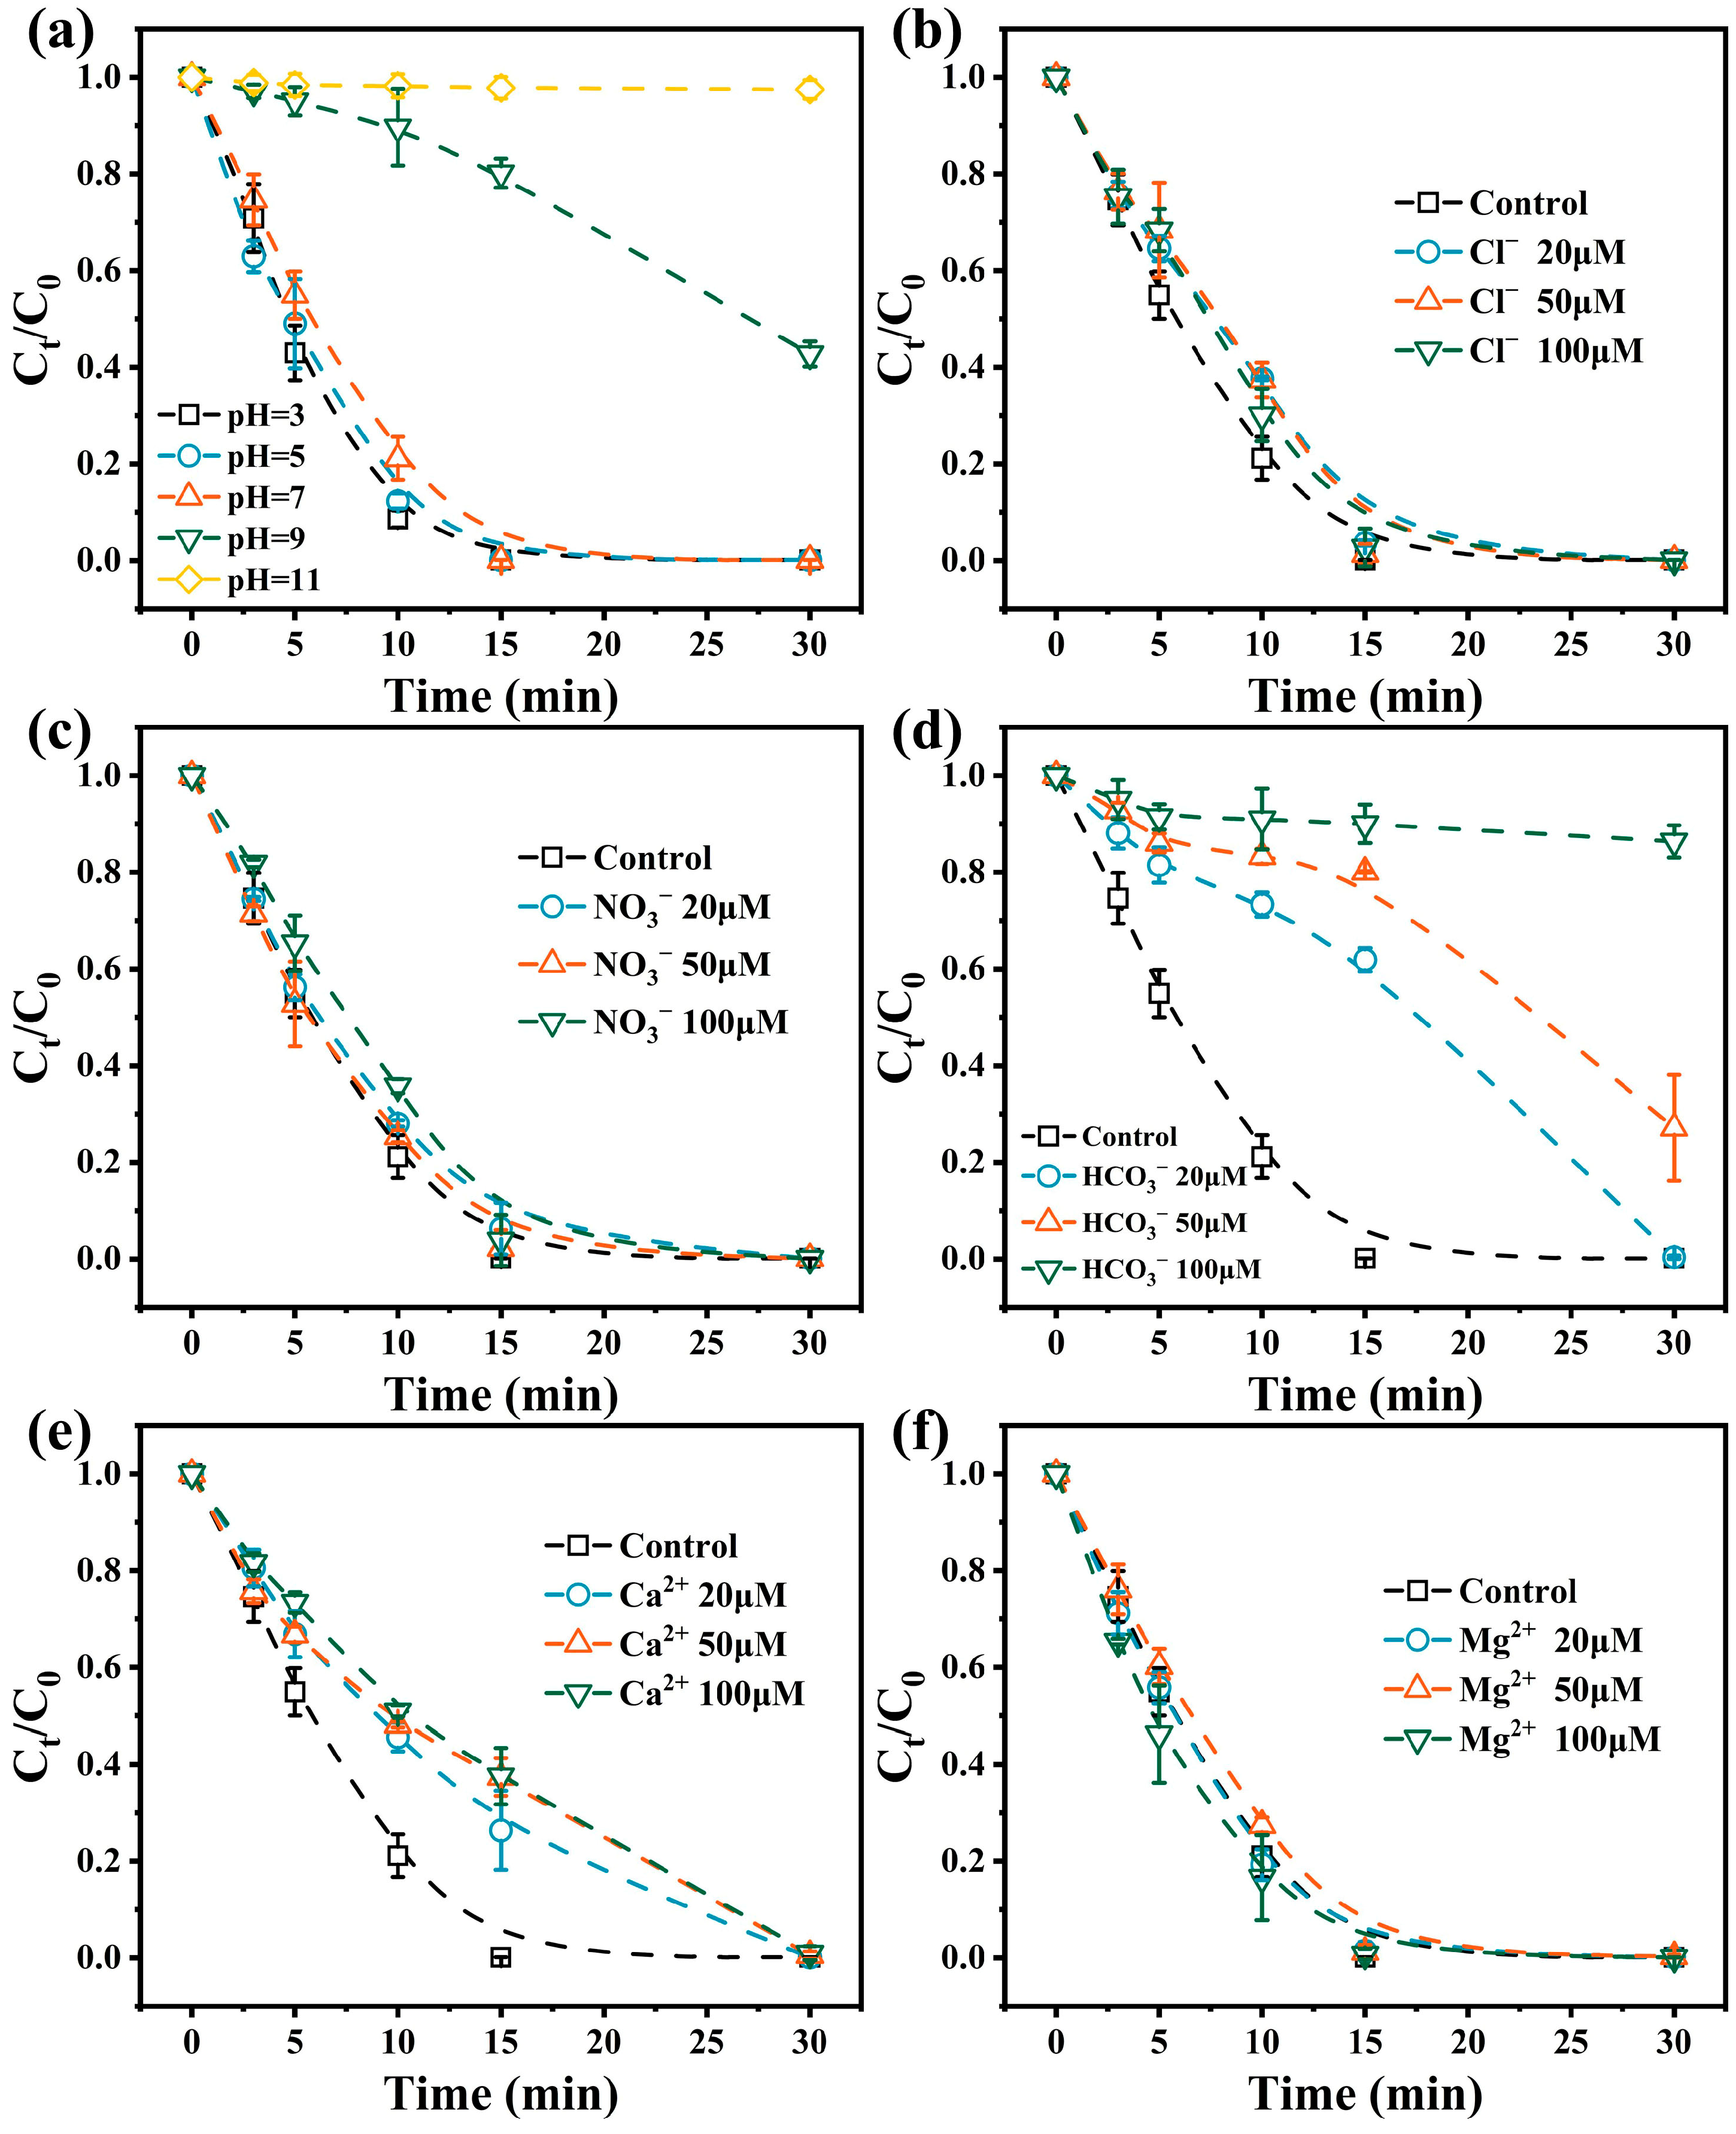
3.2.1. Effect of Solution pH

Figure 2a illustrate the impact of pH on the activation capability of waste natural pyrite. When the initial pH was below 7, the waste natural pyrite/PMS system demonstrated a strong degradation ability for ACE, and variations in pH had minimal influence on the reaction rate. However, as the pH value increased to 9, there was a significant decrease in the reaction rate, with only a 57.3% removal rate achieved in 30 min. This phenomenon is due to the precipitation of Fe at higher pH values, which forms a passivation film (Equations (2) and (3)) on the surface of pyrite, thereby hindering the reaction progression. Compared with the results reported by Wang et al. and Li et al. [26,42], the current system and the system utilizing high-purity pyrite exhibited similar responses to pH variations.

3.2.2. Effect of Inorganic Anions and Cations

The effect of the three anions on the degradation of ACE by the waste natural pyrite/PMS system is illustrated in Figure 2b–d. Cl and NO3 exhibited negligible effects on the degradation process, while HCO3 significantly decreased the reaction rate. A similar phenomenon of HCO3 reducing the reaction rate was also observed in the activated PMS system [42]. This reduction is attributed to HCO3 reacting with SO4•− and OH to produce HCO3 and CO3 (Equations (3) and (4)), which are considered to possess lower oxidation potentials and weaker degradation capabilities [42]. Furthermore, HCO3 diminished the activation of pyrite by rendering the solution alkaline. Given that Section 3.2.1 demonstrates that waste natural pyrite is more sensitive to alkaline conditions, it is reasonable to infer that the pH increase caused by HCO3 is the primary reason for the observed decrease in reaction rate. To verify this hypothesis, we investigated the effect of HCO3 on degradation at pH 3. As illustrated in Figure S6, HCO3 no longer significantly inhibited the reaction under acidic conditions, indicating that HCO3 primarily suppresses the reaction by increasing the pH value. This result confirms that the inhibitory mechanism of HCO3 mainly relies mainly on its buffering capacity to elevate the solution pH, rather than through direct radical scavenging.
SO4•− + HCO3•− = SO42− + HCO3,
OH + HCO3 = H2O + CO3•−,
As shown in Figure 2e,f, the impacts of Ca2+ and Mg2+ on the degradation of ACE in the waste natural pyrite/PMS system are elucidated. The presence of Ca2+ slightly reduced the reaction rate. However, complete degradation of ACE was achieved within 30 min, which is consistent with the findings reported by Huang et al. [46]. Notably, while some studies indicated that Mg2+ also slightly inhibited the reaction rate in the pyrite/PMS system [46,47], this effect was absent in the system of the present study. The experimental results demonstrate that both the waste natural pyrite/PMS system and the high-purity pyrite/PMS system exhibited comparable performance regarding their applicability.

3.3. Reaction Mechanism Exploration

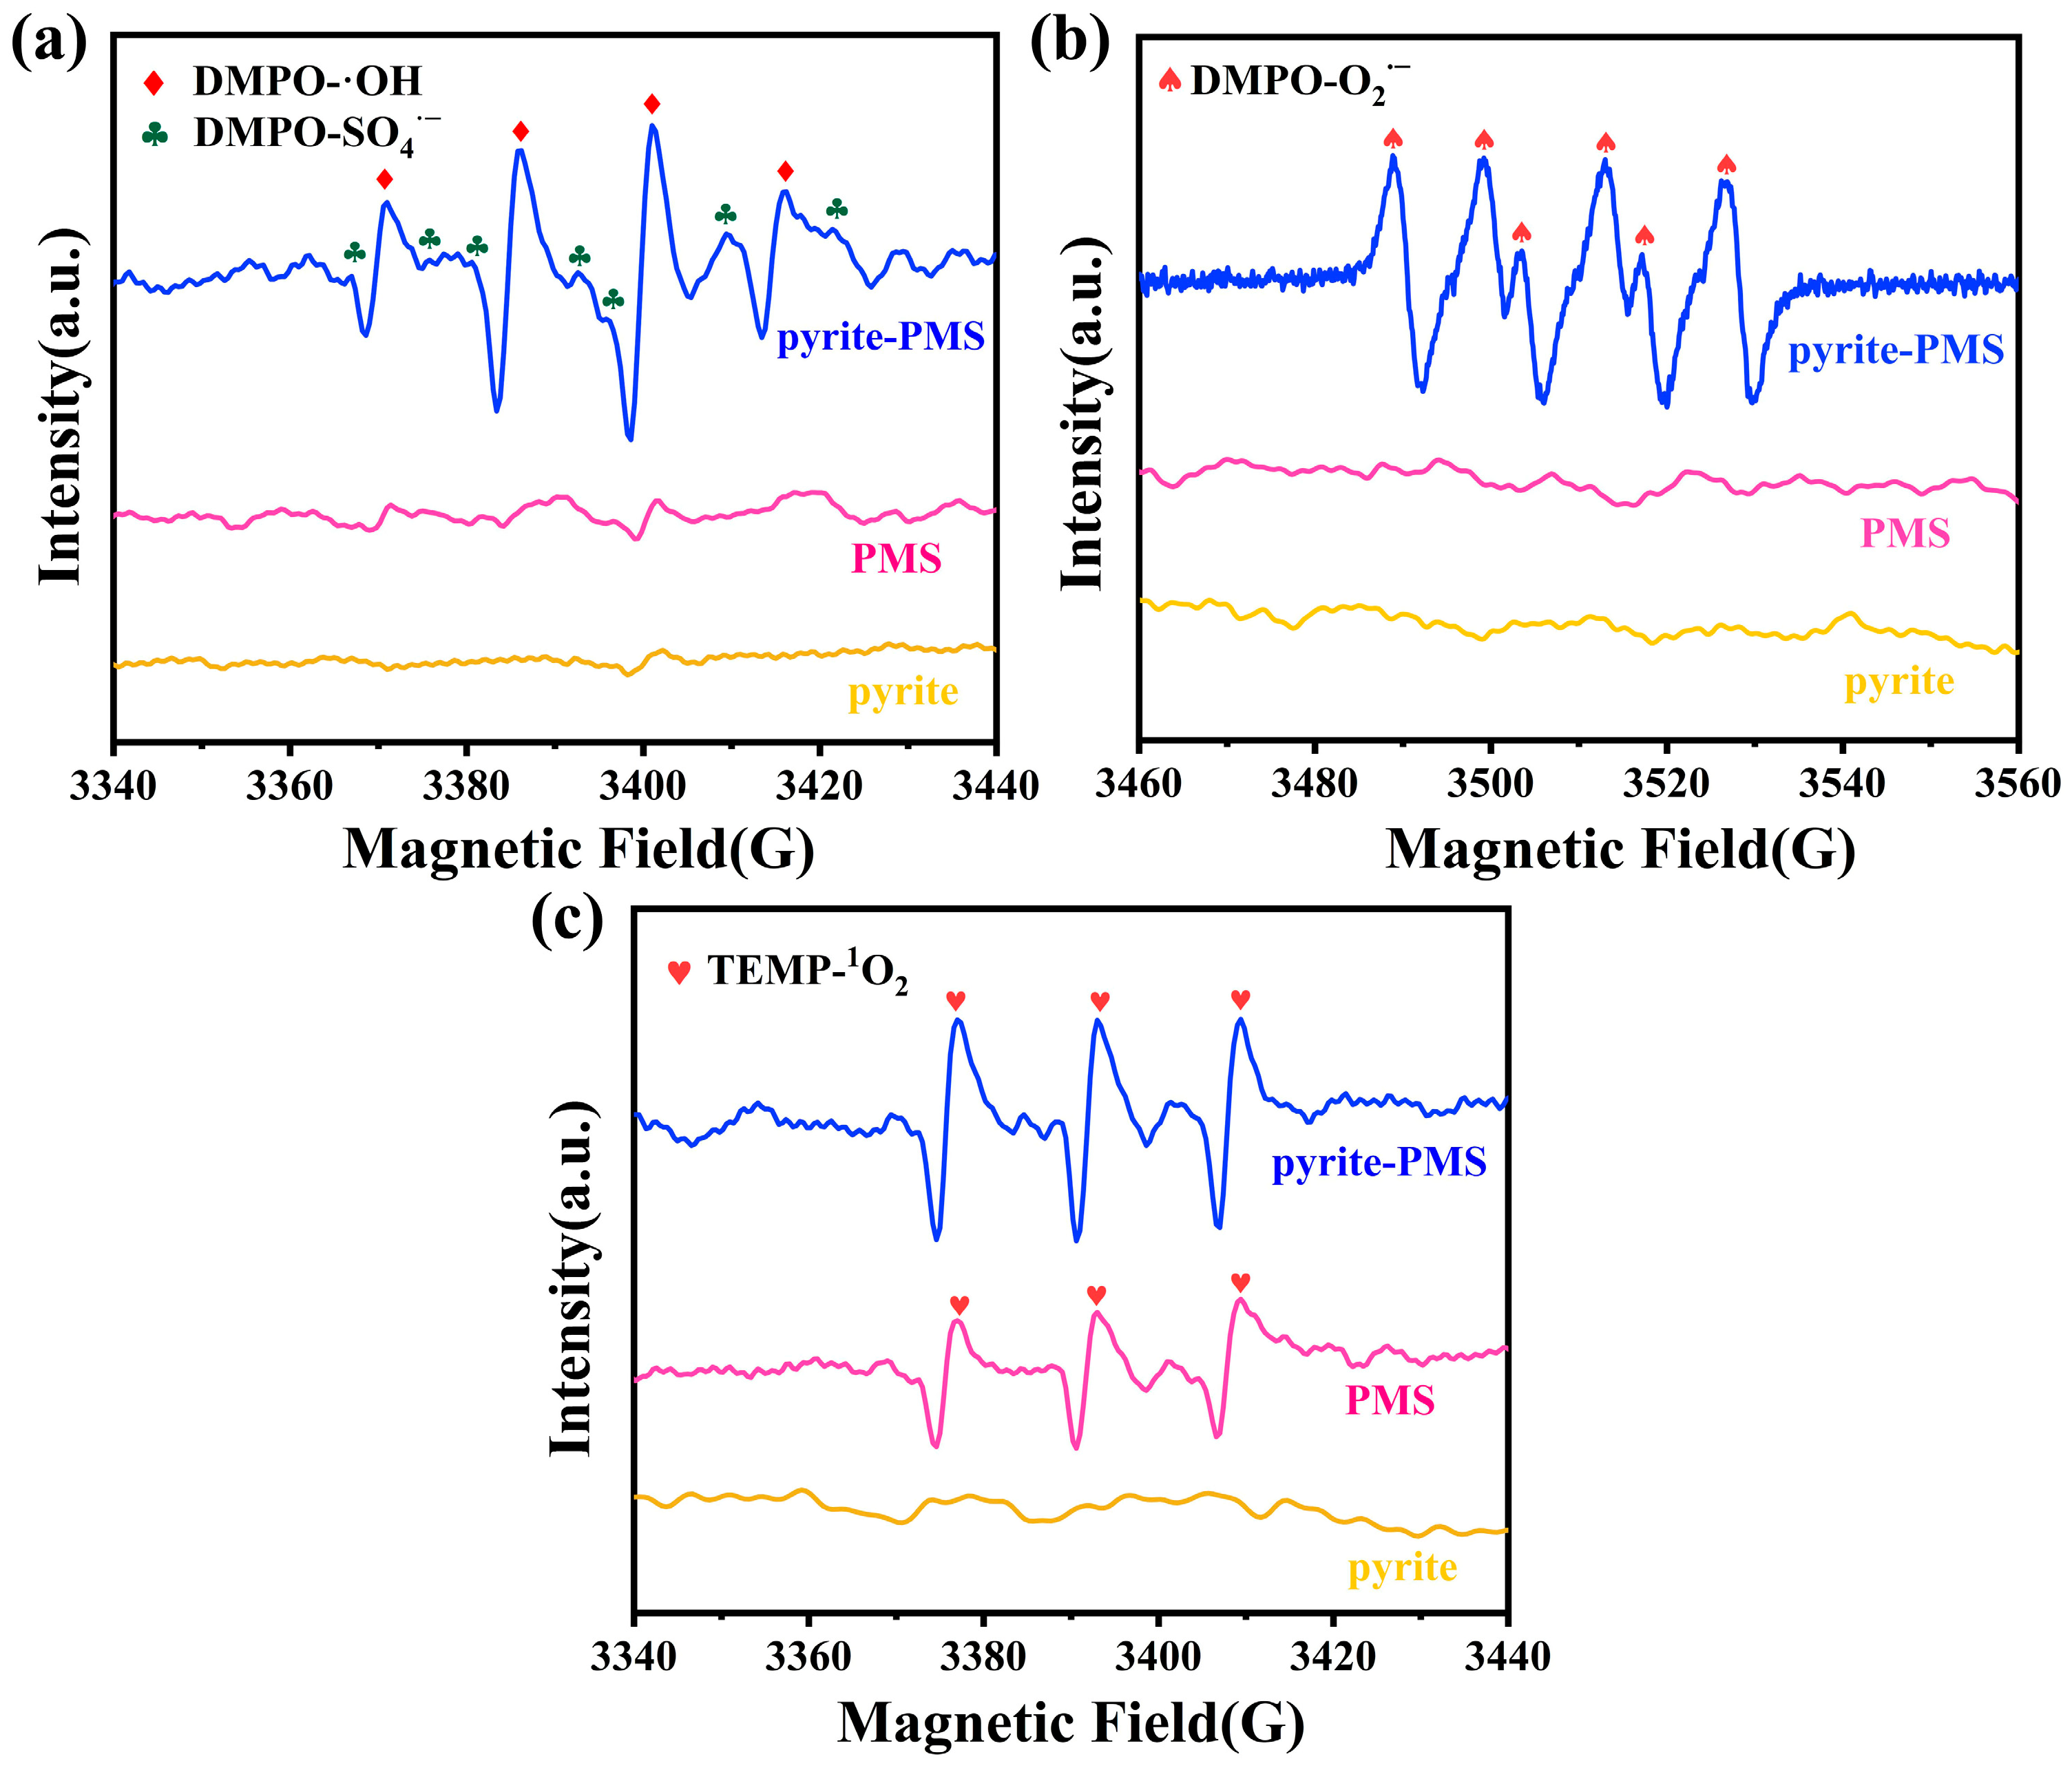
3.3.1. ROS Identification

The ACE degradation mechanism by the waste natural pyrite/PMS system was investigated by using an EPR to pinpoint the four ROS in the reaction system, as shown in Figure 3. Upon the addition of DMPO, the pyrite/PMS system distinctly exhibited a signal corresponding to the DMPO-•OH adduct, characterized by a typical peak pattern of 1:2:2:1. The faint peaks interspersed among the DMPO-•OH signals were identified as the signature of the DMPO-SO4•− adduct, as reported in reference [42]. When DMPO was introduced into a methanol solution, the pyrite/PMS system generated a signal indicative of the DMPO-O2•− adduct, manifesting as six characteristic peaks. Specifically, the peaks at positions 1, 2, 4, and 6 displayed comparable intensities, whereas those at positions 3 and 5 were relatively weaker. Notably, in the components supplemented with TEMP, both the pyrite/PMS system and the sole PMS system registered TEMP-1O2 adduct signals with an intensity ratio of “1:1:1”. In the case of the sole PMS system, 1O2 were attributed to the self-decomposition of PMS [42].
In conclusion, SO4•−, OH, 1O2, and O2•− were identified in the waste natural pyrite/PMS system, consistent with the results reported by Yu et al. [31]. Thus, waste natural pyrite and high-purity pyrite shared similar reaction mechanisms in activating PMS for degradation.

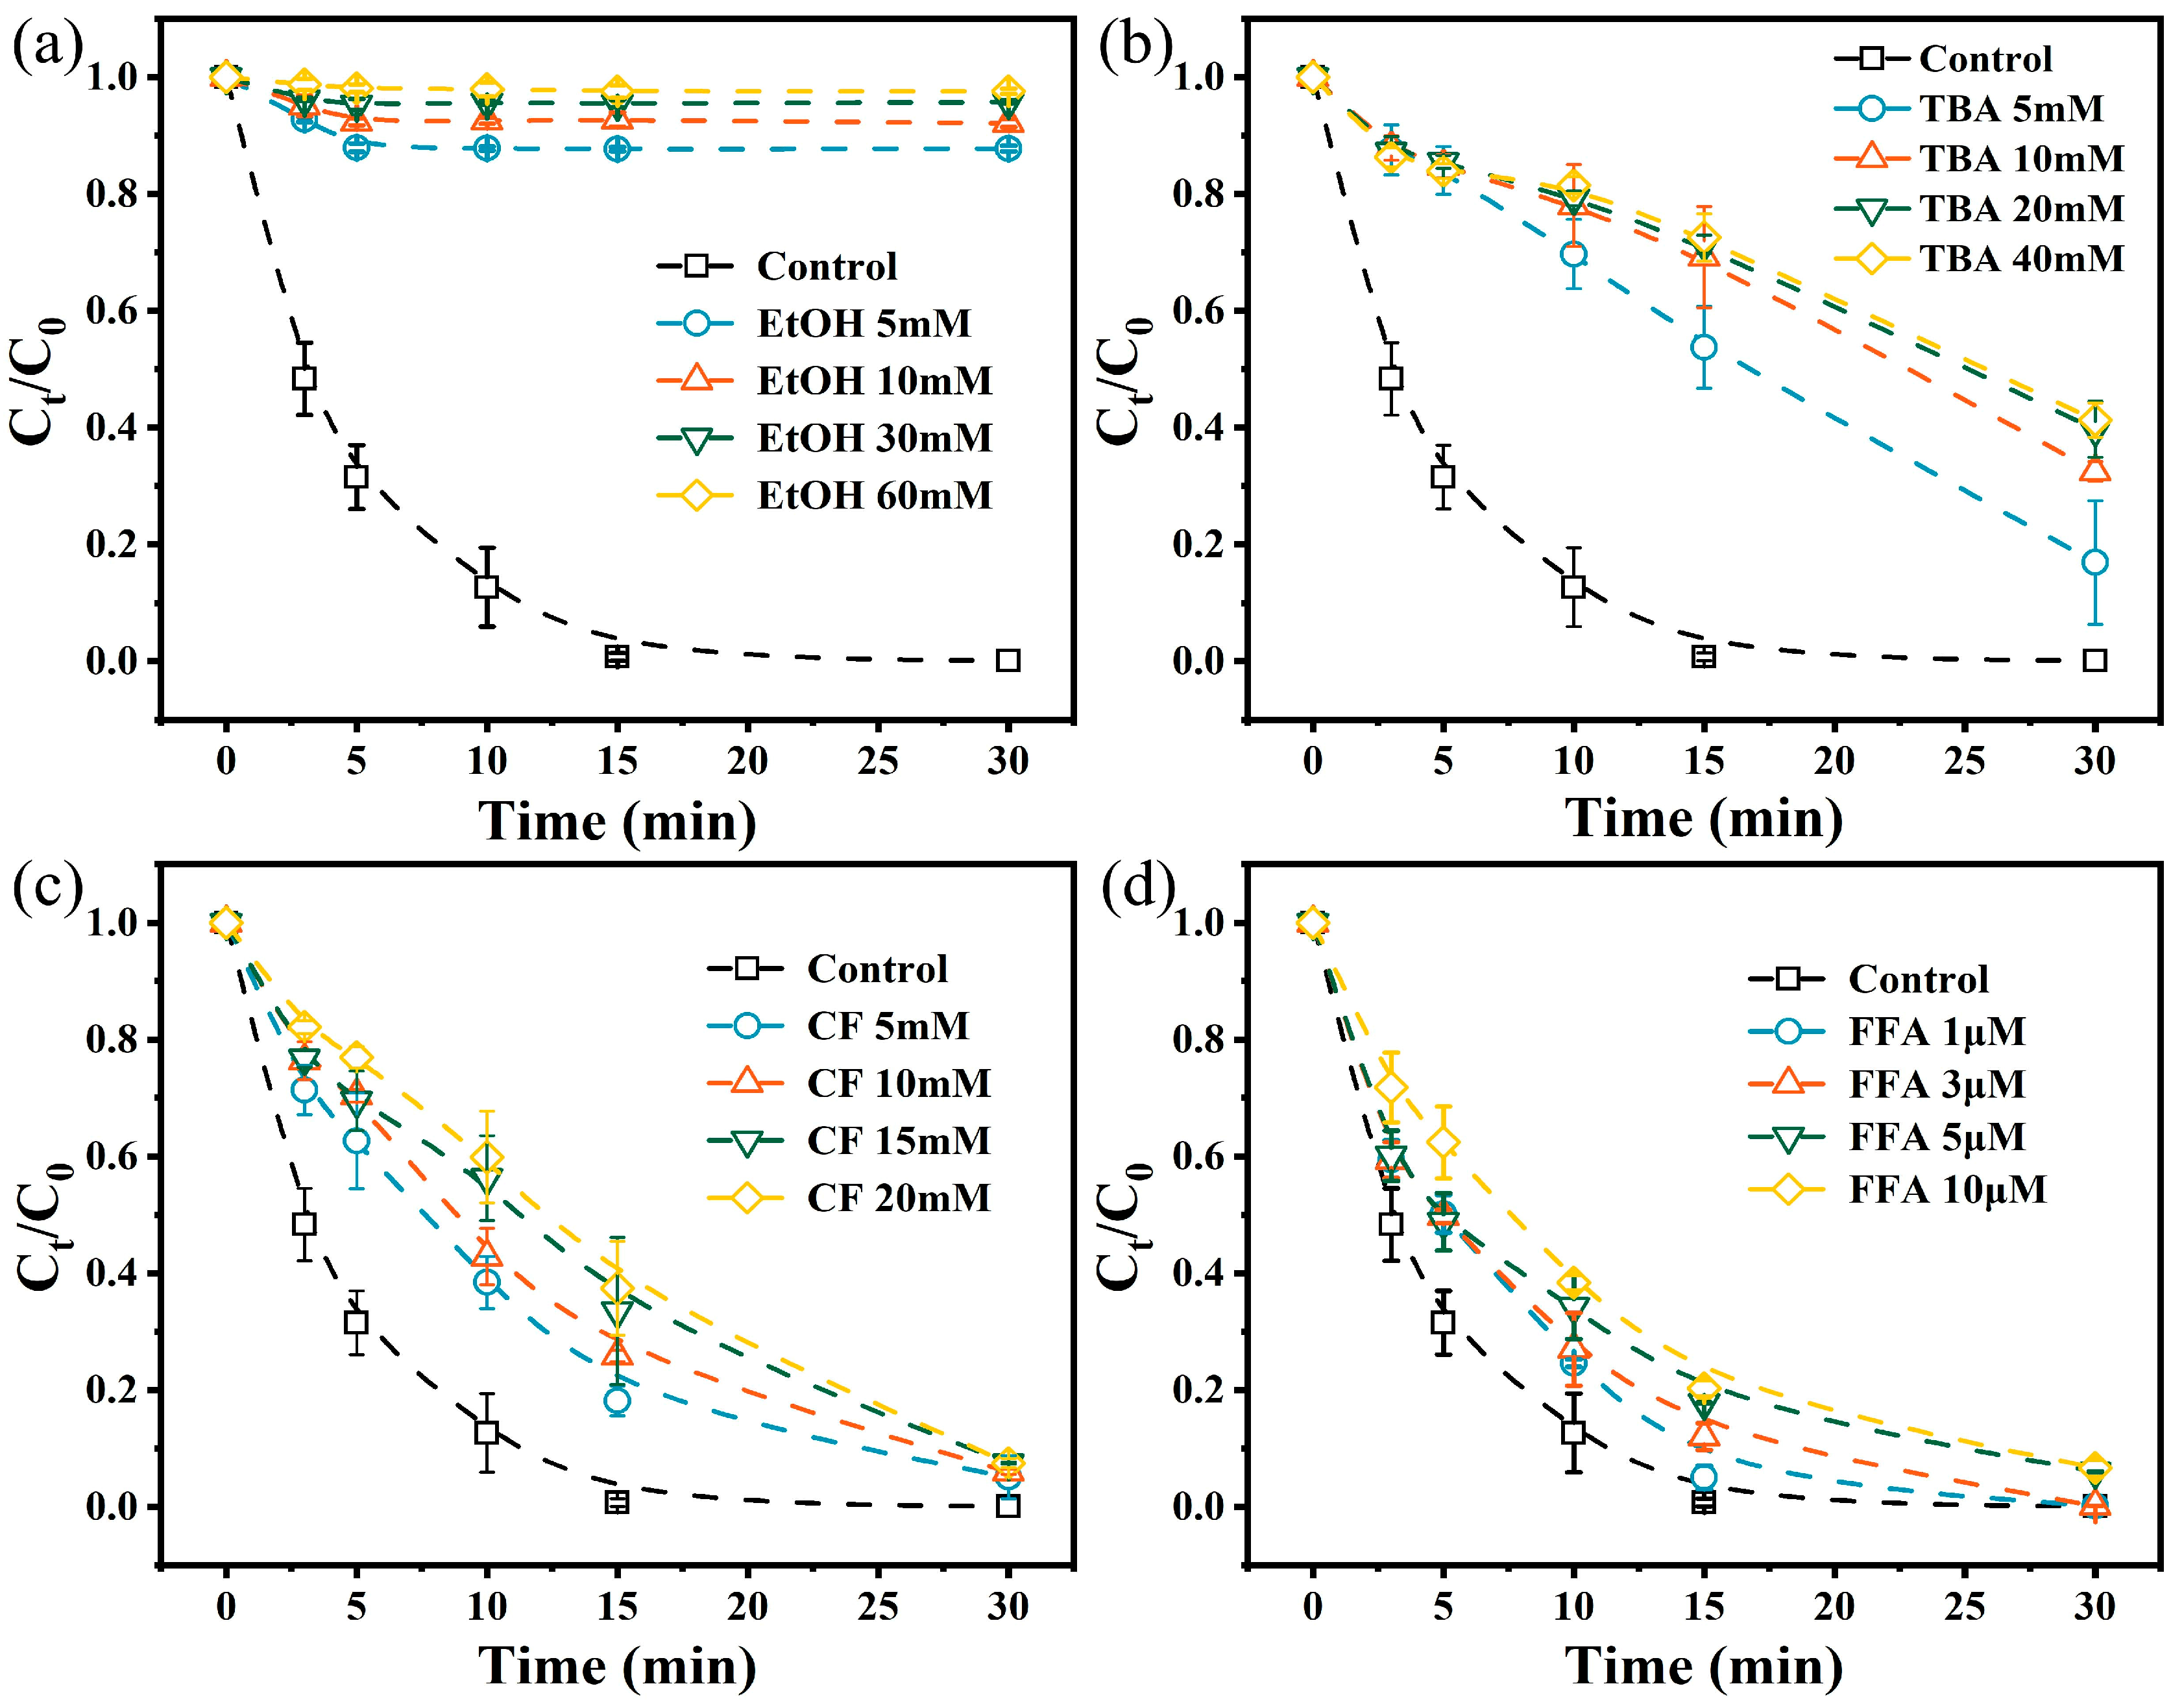
3.3.2. ROS Contribution Ratios and Concentrations

To further elucidate the impact of the four ROS on ACE degradation, their contribution ratios were investigated through quenching experiments. The results of quenching experiments with EtOH and TBA are presented in Figure 4a,b. As the quencher concentrations increased, the removal rates with EtOH and TBA decreased by 97.53% and 41.16%, respectively. Calculation results indicate that within 30 min, SO4•− accounted for 50.6% of the removal (ACE degradation), whereas OH accounted for 36.9%. The inhibitory effects of CF and FFA on the degradation system are illustrated in Figure 4c,d. Although CF and FFA initially decelerated the reaction, the removal rates with CF and FFA decreased by only 7.36% and 6.49%, respectively, after 30 min. Further calculations reveal that at 30 min, O 2 contributed 6.6% to ACE degradation, while O 2 1 contributed 5.8%. Therefore, SO4•− and OH were identified as the primary ROS in the ACE degradation system, predominantly SO4•−. These findings are consistent with the majority of research on PMS activation by pyrite [26,31,42], suggesting that the partial oxidation of pyrite did not alter the oxidation mechanism of the system.
The disparities in the production of SO4•− and OH by oxidized pyrite and high-purity pyrite for PMS activation were explored by using the molecular probe method to determine their concentrations in the system. The results are displayed in Figure S8. Calculation results reveal that throughout the reaction (30 min), the average concentration of SO4•− was 2.7 × 10⁻¹³ mol/L, while the average concentration of OH was 4 × 10⁻¹⁴ mol/L. The evidently higher concentration of SO4•− elucidated its greater contribution. For comparison, the concentrations of SO4•− and OH within the system designed by Li et al. [42] for the first 10 min, a period with intense reaction activity, were calculated. The average SO4•− and OH concentrations during the initial 10 min in the proposed waste natural pyrite/PMS system were 4.2 × 10⁻¹³ mol/L and 6.9 × 10⁻¹⁴ mol/L, respectively, while those in the comparative study were 6.8 × 10⁻¹³ mol/L and 1.6 × 10⁻¹³ mol/L. These results suggest that following oxidation, the activation capacity of pyrite during the pre-reaction period decreased slightly.

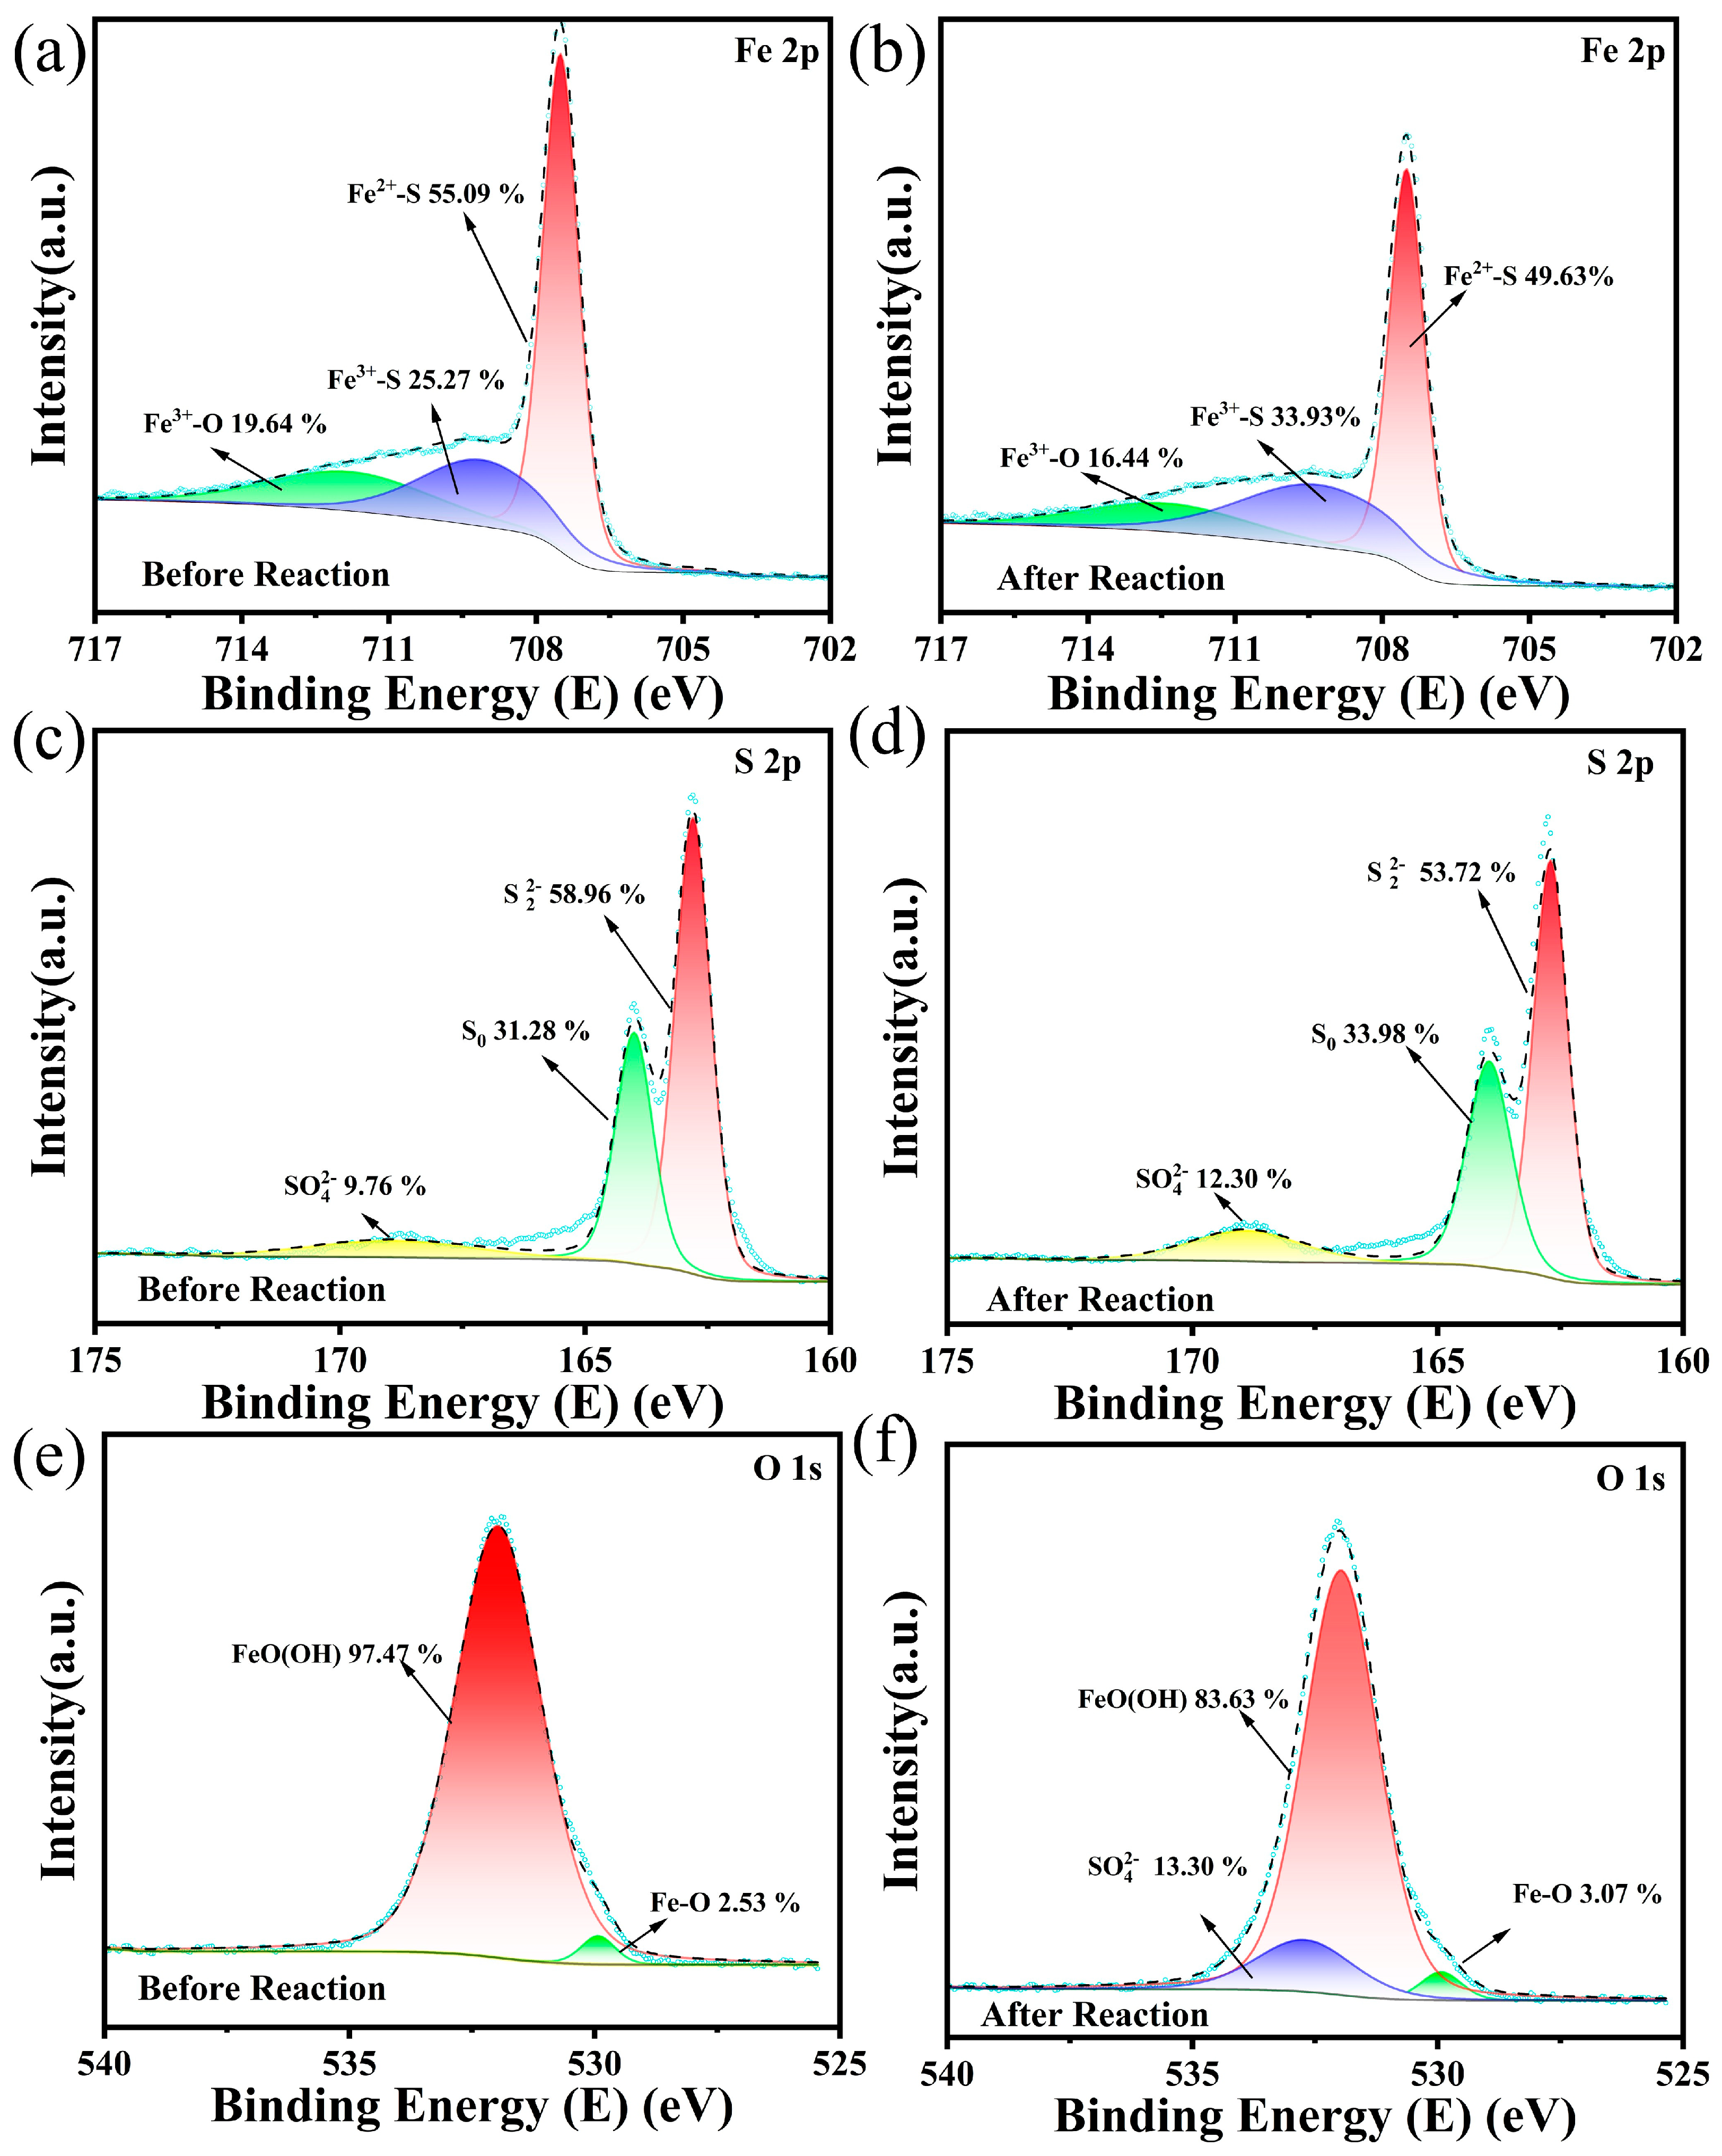
3.3.3. Changes in Waste Natural Pyrite During Reaction

Changes in the physical and chemical state of waste natural pyrite during PMS activation were further investigated via a series of characterizations of its properties before and after the reaction.
The elemental proportions of the waste natural pyrite were initially analyzed using XRF. The ideal Fe to S mass ratio of pure pyrite is 46.67%:53.33%. However, the waste natural pyrite in this study, as presented in Table S2, exhibits a Fe to S ratio of 51.4%:41.6%. This divergence can be ascribed to the pyrite oxidation process that generates novel oxides comprising iron (Fe) and oxygen (O) and loses elemental sulfur (S), ultimately increasing the Fe ratio. The iron oxides were identified by conducting XRD to characterize the crystal structure of the waste natural pyrite. As illustrated in Figure S1, distinctly diffraction peaks of pyrite are observed at 2θ values of 28.5, 33.0, 37.1, 40.8, 47.4, and 56.3°. Additionally, characteristic diffraction peaks of hematite (Fe2O3) were identified at 2θ values of 23.2, 55.2, and 65.8°, while those of goethite (FeO(OH)) were found at 2θ values of 21.2, 36.6, and 53.2°. These results indicate the presence of hematite and goethite on the surface of the waste natural pyrite, which has been reported elsewhere [47,48].
SEM was performed to investigate the micro-morphological alterations of waste natural pyrite before and after the reaction. Analysis of Figure S2a,b indicates a significant volume reduction after the reaction, with the particle surfaces transitioning from flat and smooth to uneven. These alterations were attributed to the continuous dissolution of iron (Fe) and sulfur (S) from the waste natural pyrite during the reaction, consistent with the experimental findings of Li et al. [42]. Furthermore, EDS analysis (Figure S2e,f) shows a marginal reduction in the percentage of oxygen (O) and a corresponding rise in the percentage of sulfur (S) on the surface of the waste natural pyrite post-reaction. Thus, the oxidized layer covering the surface of the waste natural pyrite was leached away during the reaction, thereby exposing the internal FeS2. These findings elucidate why the oxide layer did not inhibit PMS activation by pyrite. Additionally, the change in pH within the system during the reaction was assessed (Figure S4), revealing that the system’s acidic conditions may contribute to the detachment of the surface oxide layer.
Figure 5a,b present the XPS spectra of the waste natural pyrite pre- and post-reaction. The Fe (2p3/2) spectra of the waste natural pyrite exhibit three diagnostic peaks at 707.5, 709.1, and 711.8 eV, matching Fe2+-S, Fe3+-S, and Fe3+-O [49,50]. No new peaks emerged, and no peak shifts were observed, indicating no significant changes in the pyrite structure post-reaction. Notably, the proportion of Fe2+-S decreased from 55.1% to 49.6%, while the proportion of Fe3+-S increased from 25.3% to 33.9% post-reaction.
The above phenomenon was due to the reaction between the Fe(II) sites on the pyrite surface and HSO5 to form SO4•− and Fe(III) (Equation (5)). Meanwhile, other reports suggest that this process also further reduced Fe(III) to Fe(II) by HSO5 and ultimately produced OH (Equations (6) and (7)) [51]. In previous reports, these processes are considered to occur simultaneously on the surface of pyrite and in the aqueous phase. This phenomenon arises from the ability of pyrite to adsorb peroxymonosulfate (PMS) and engage in direct interactions with it on its surface. Furthermore, the acidic environment may facilitate the dissolution of Fe(II), which can subsequently activate PMS in the solution [26,52]. These findings explain the important roles of SO4•− and OH in the system. It was also observed that the percentage of Fe3+-O decreased from 19.6% to 16.4%, consistent with the EDS results, which indicates that the oxide covering the surface of waste natural pyrite was reduced, exposing its internal FeS2 to participate in the reaction. Figure 5c,d show the S (2p) XPS spectra of waste natural pyrite, where the three peaks at 162.8, 164, and 168.9 eV correspond to S22−, S0, and SO42−, respectively [47]. A comparison of the spectra before and after the reaction found that the percentage of S22− decreased by 5.24%, while the percentages of S0 and SO42− increased by 2.7% and 2.54%, respectively, which mirrored the results presented by Li et al. [42]. These findings demonstrate that S22− reduced Fe(III) to Fe(II) (Equations (8) and (9)) and further improved Fe utilization. Meanwhile, the O (1s) XPS spectra (Figure 5e,f) show peaks at binding energies of 529.93 and 531.97 eV, corresponding to Fe-O (the lattice oxygen) and FeO(OH), respectively. Notably, a new peak at 532.71 eV appeared post-reaction, possibly corresponding to attached water or SO4•− [47]. Additionally, the decreased percentage of FeO(OH) further supported the dissolution of the oxidized layer on the waste natural pyrite surface during the reaction.
Fe(II) + HSO5 = Fe(III) + SO4•− + OH,
Fe(III) + HSO5 = Fe(II) + SO5•− + H+,
SO4•− + OH = SO42− + OH,
2Fe(III) + S22− = 2Fe(II) + 2S0,
S22− + 14Fe(III) + 8H2O = 14Fe(II) + 16H+ + 2SO42−,
In summary, two iron oxides, Fe2O3 and FeO(OH), were identified on the surface of waste natural pyrite. While their presence did not fundamentally alter the reaction mechanism of pollutant degradation by pyrite-activated PMS, it did slightly obstruct the active sites at the initial stages of the reaction. This obstruction lowered the initial ROS concentration of the waste pyrite system compared to systems utilizing high-purity pyrite. However, the surface iron oxides were gradually removed as the reaction progressed, exposing the internal active site Fe(II). Consequently, the waste natural pyrite/PMS system ultimately demonstrated effective ACE removal.

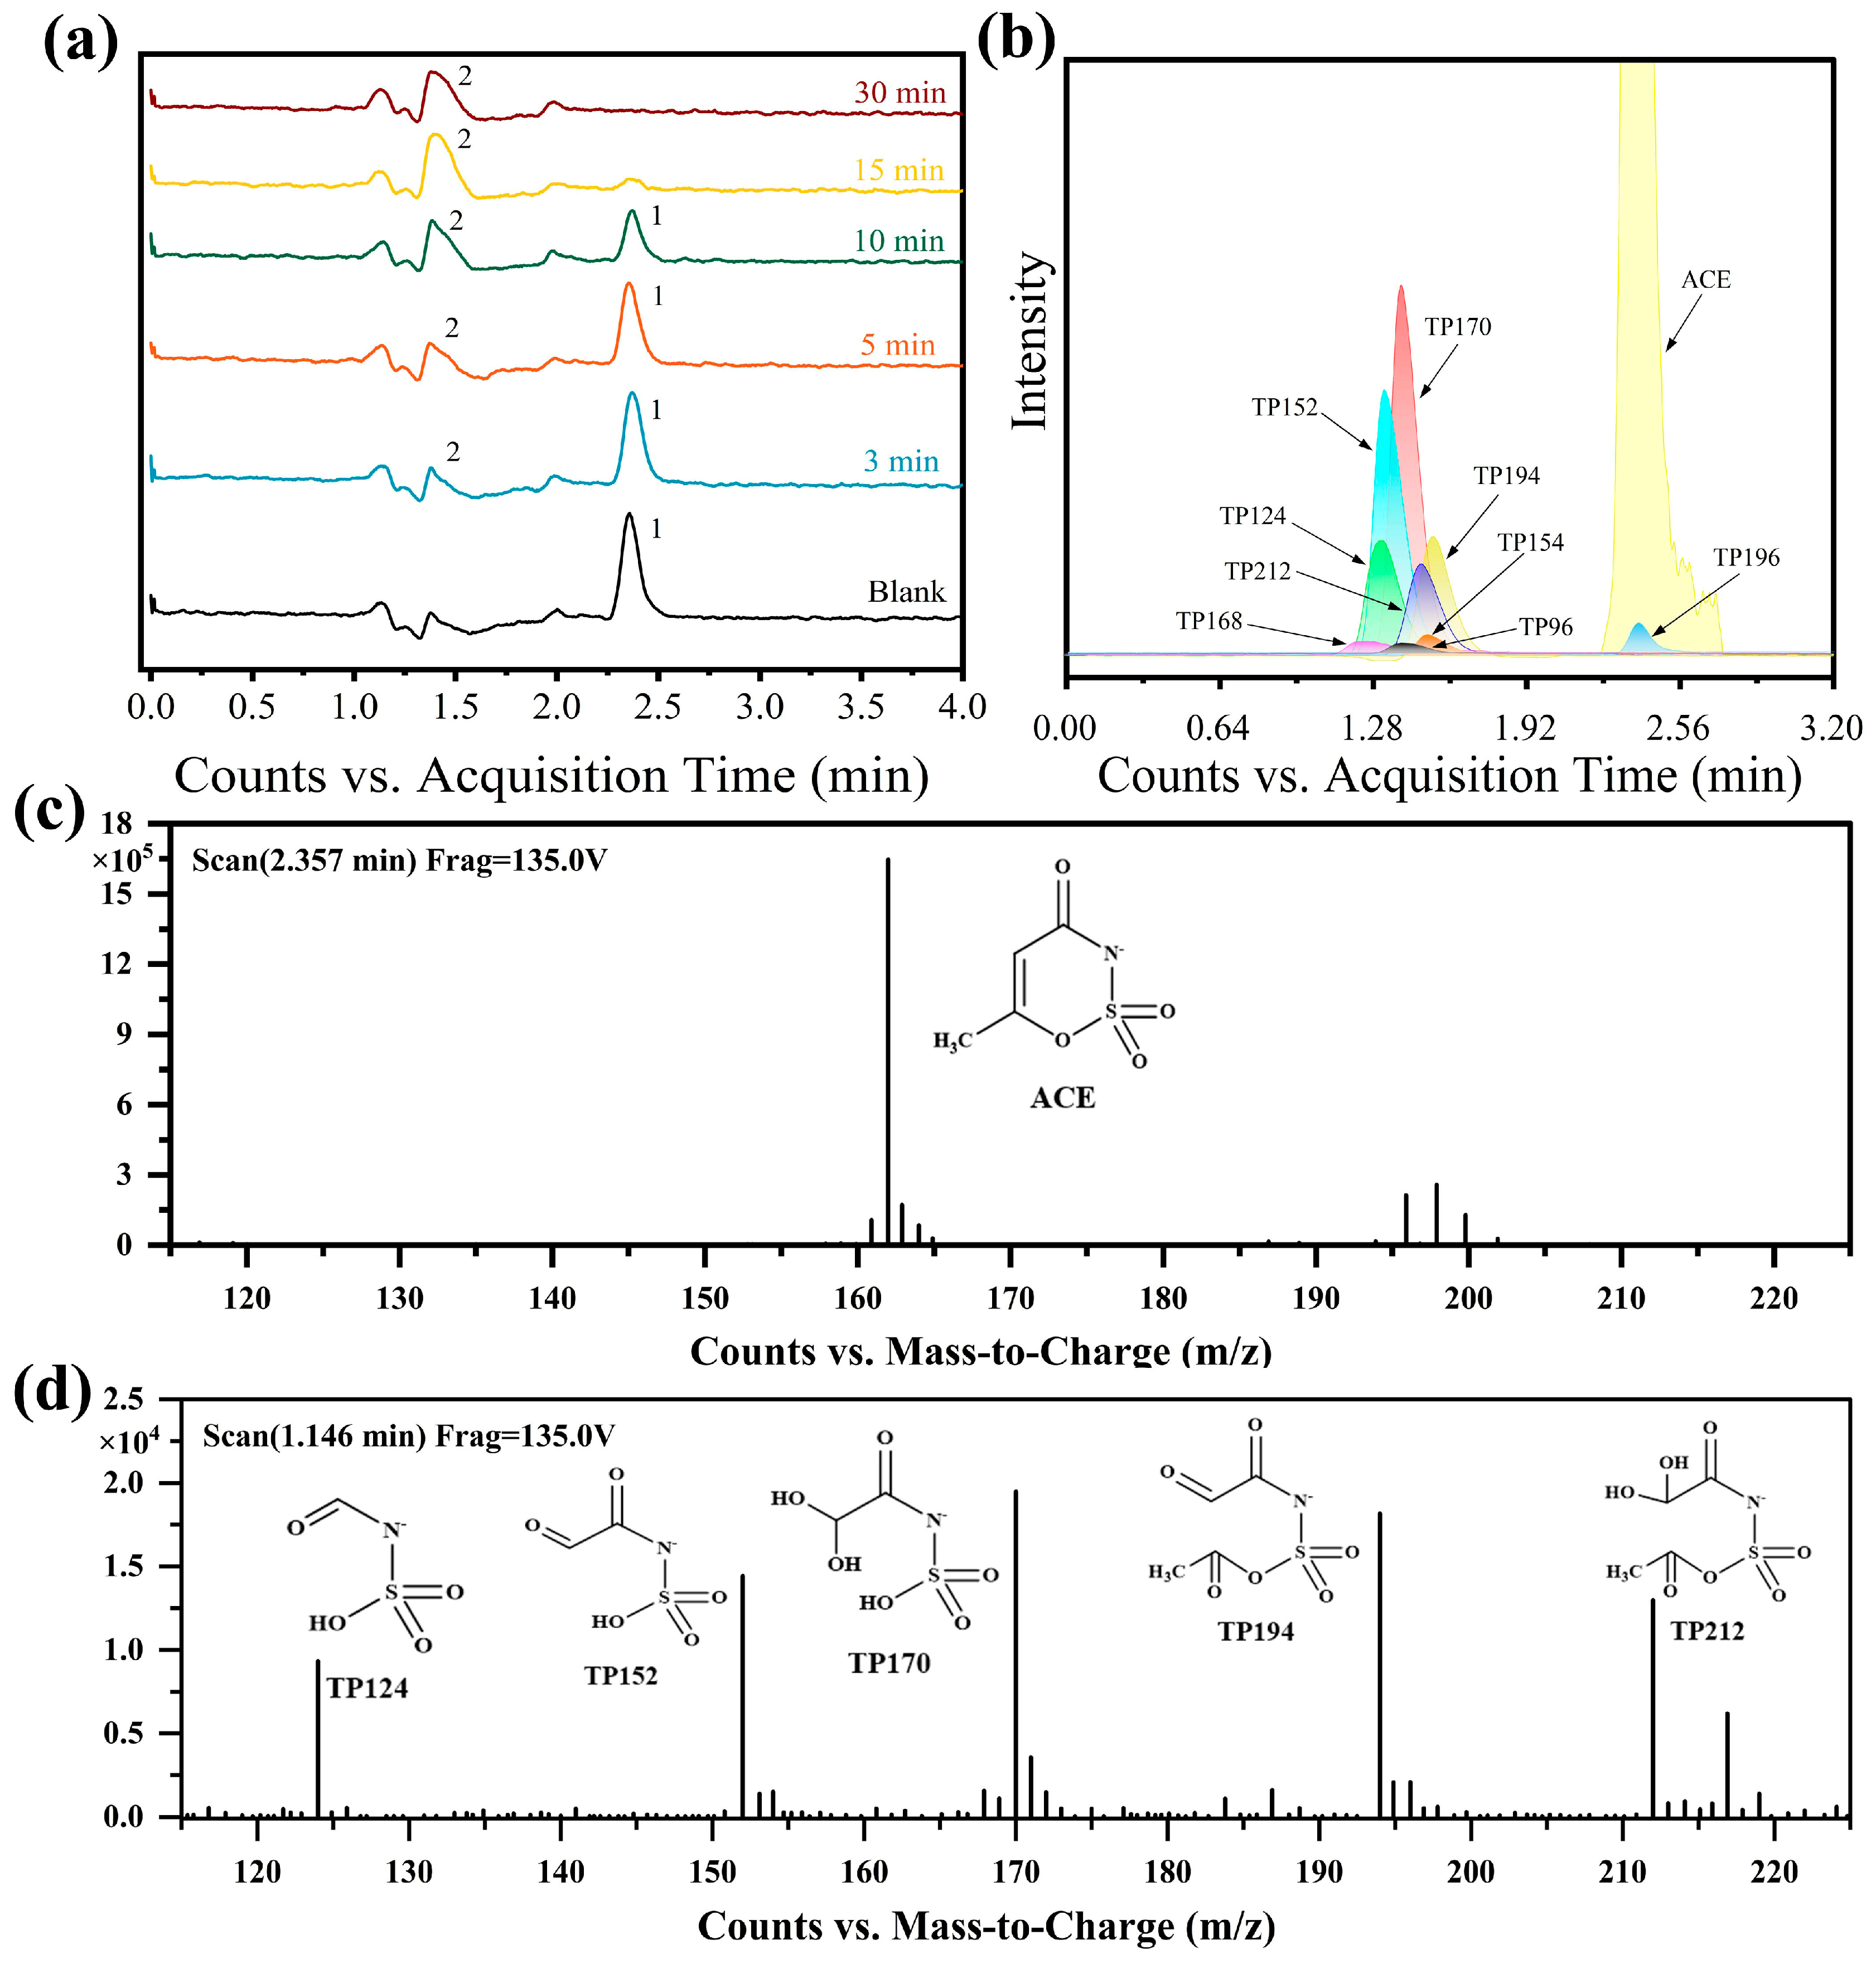
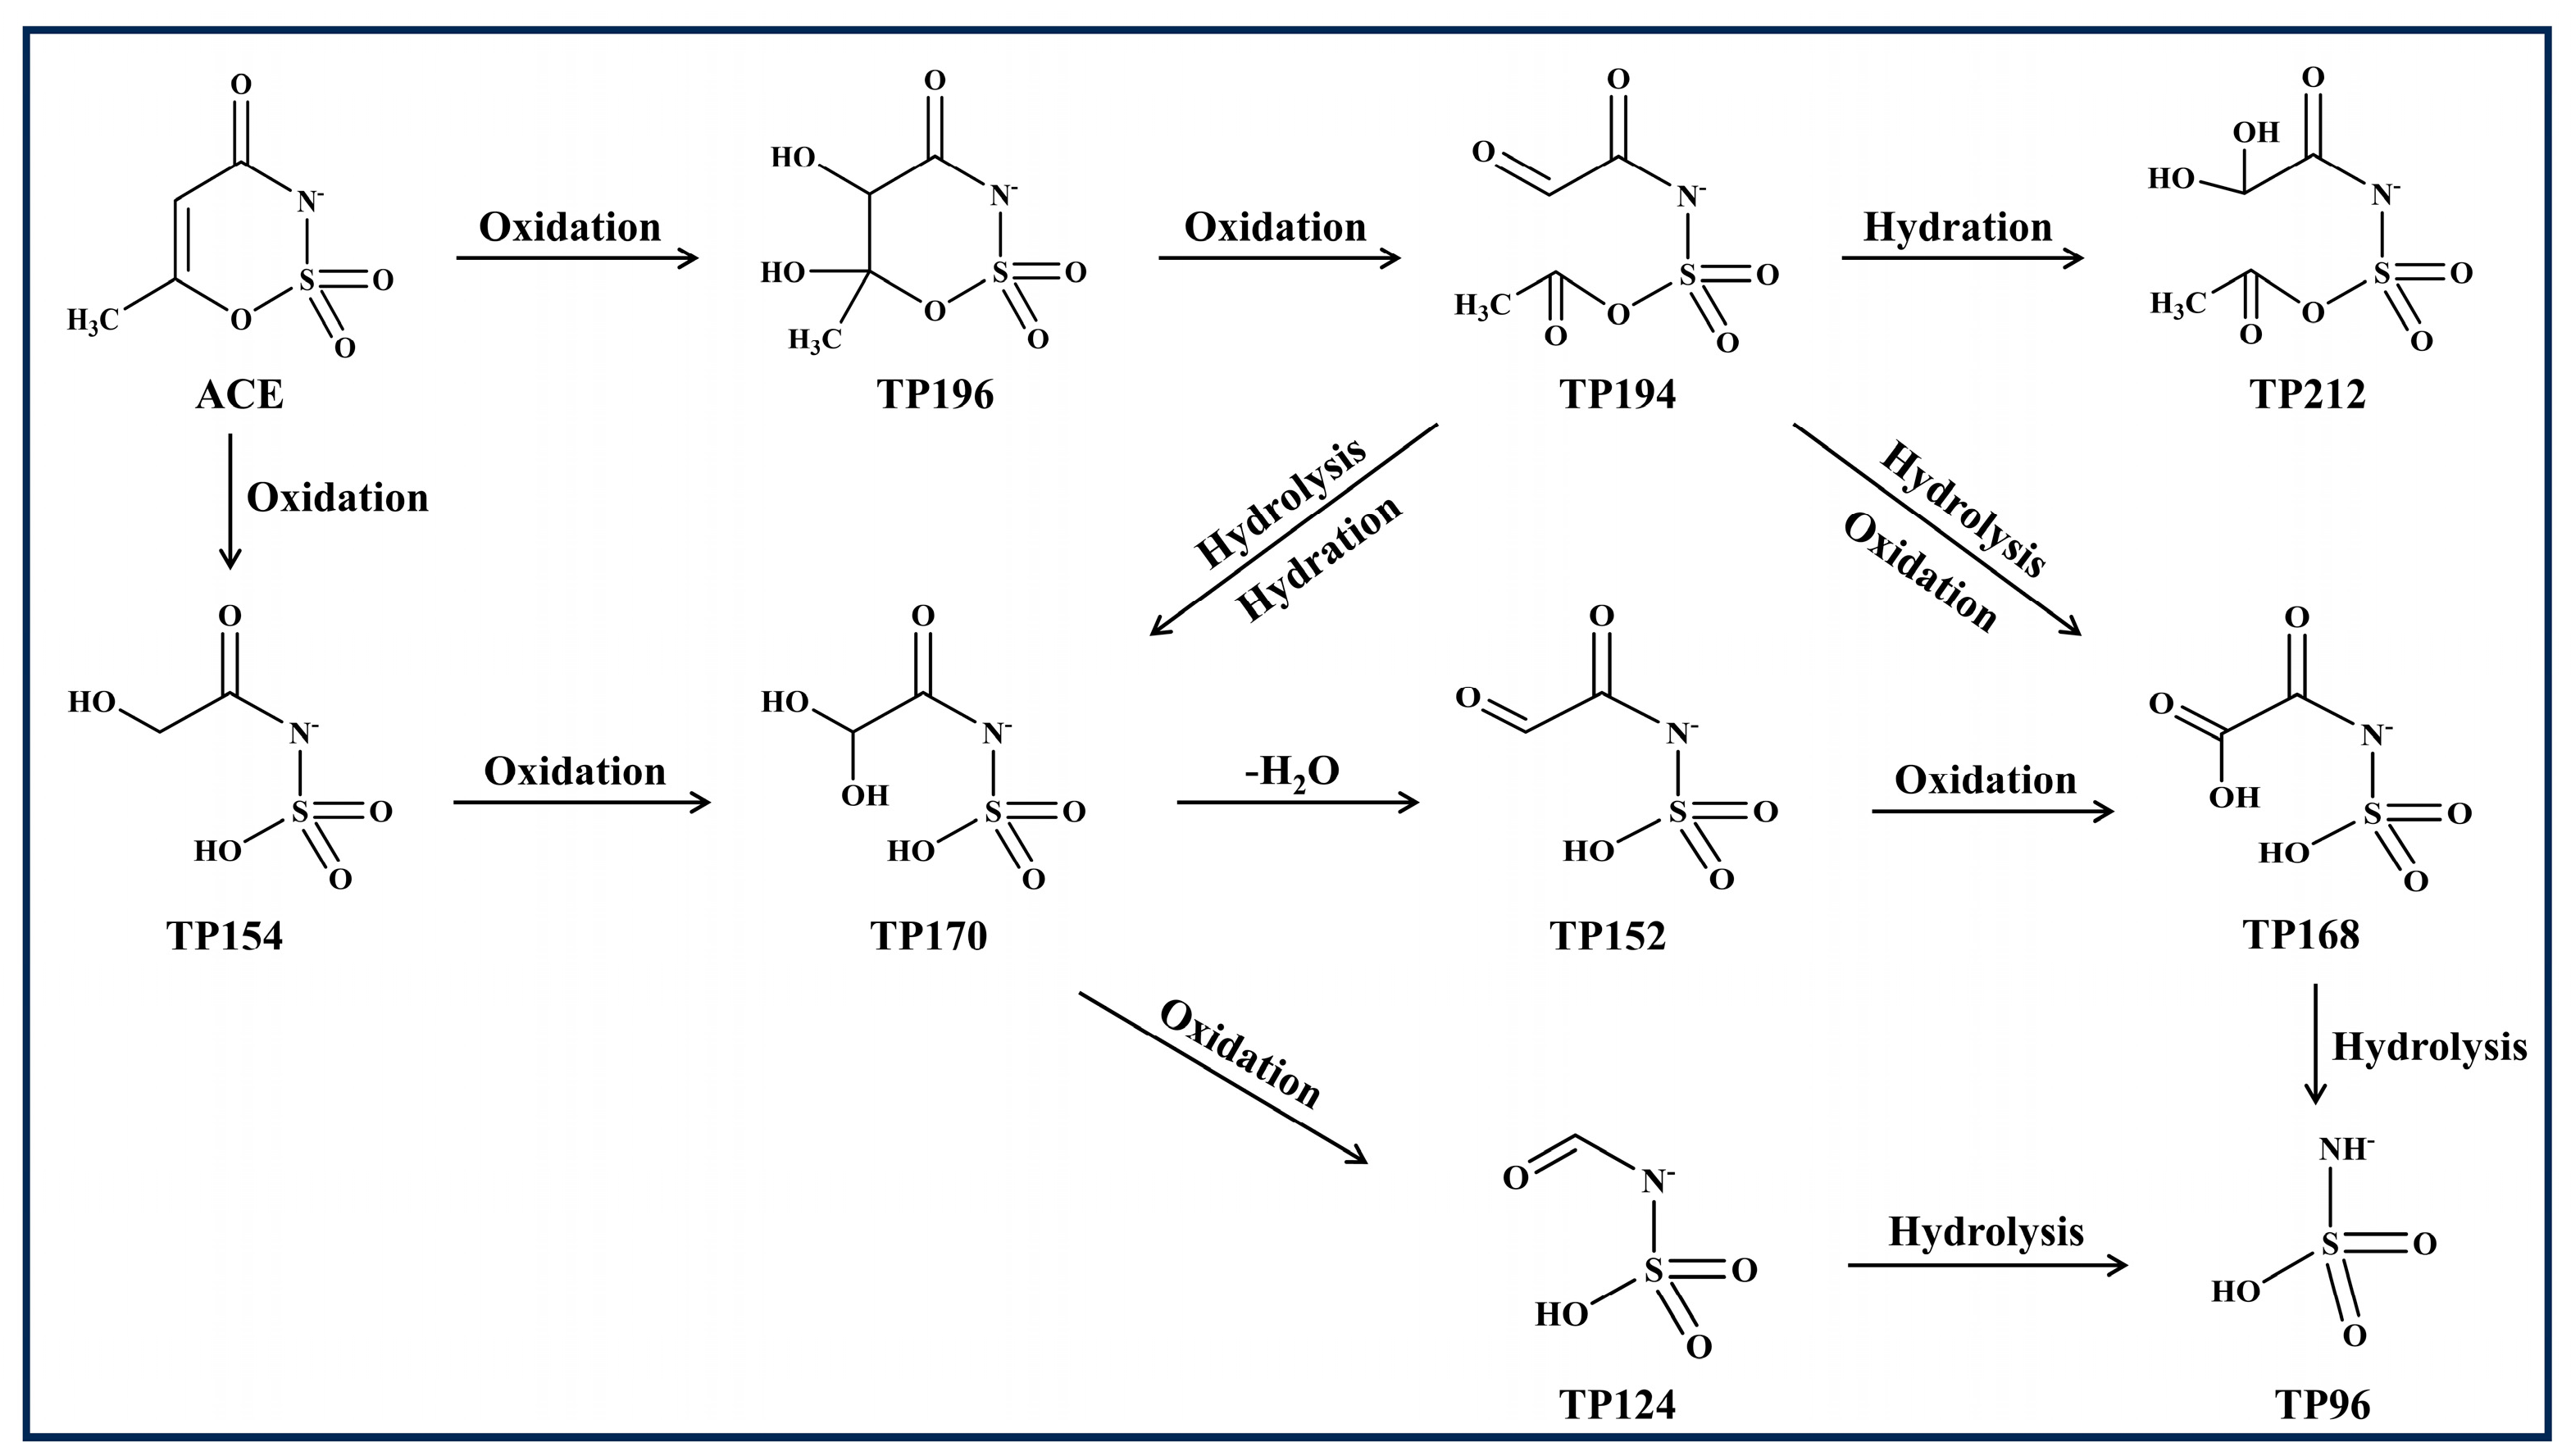
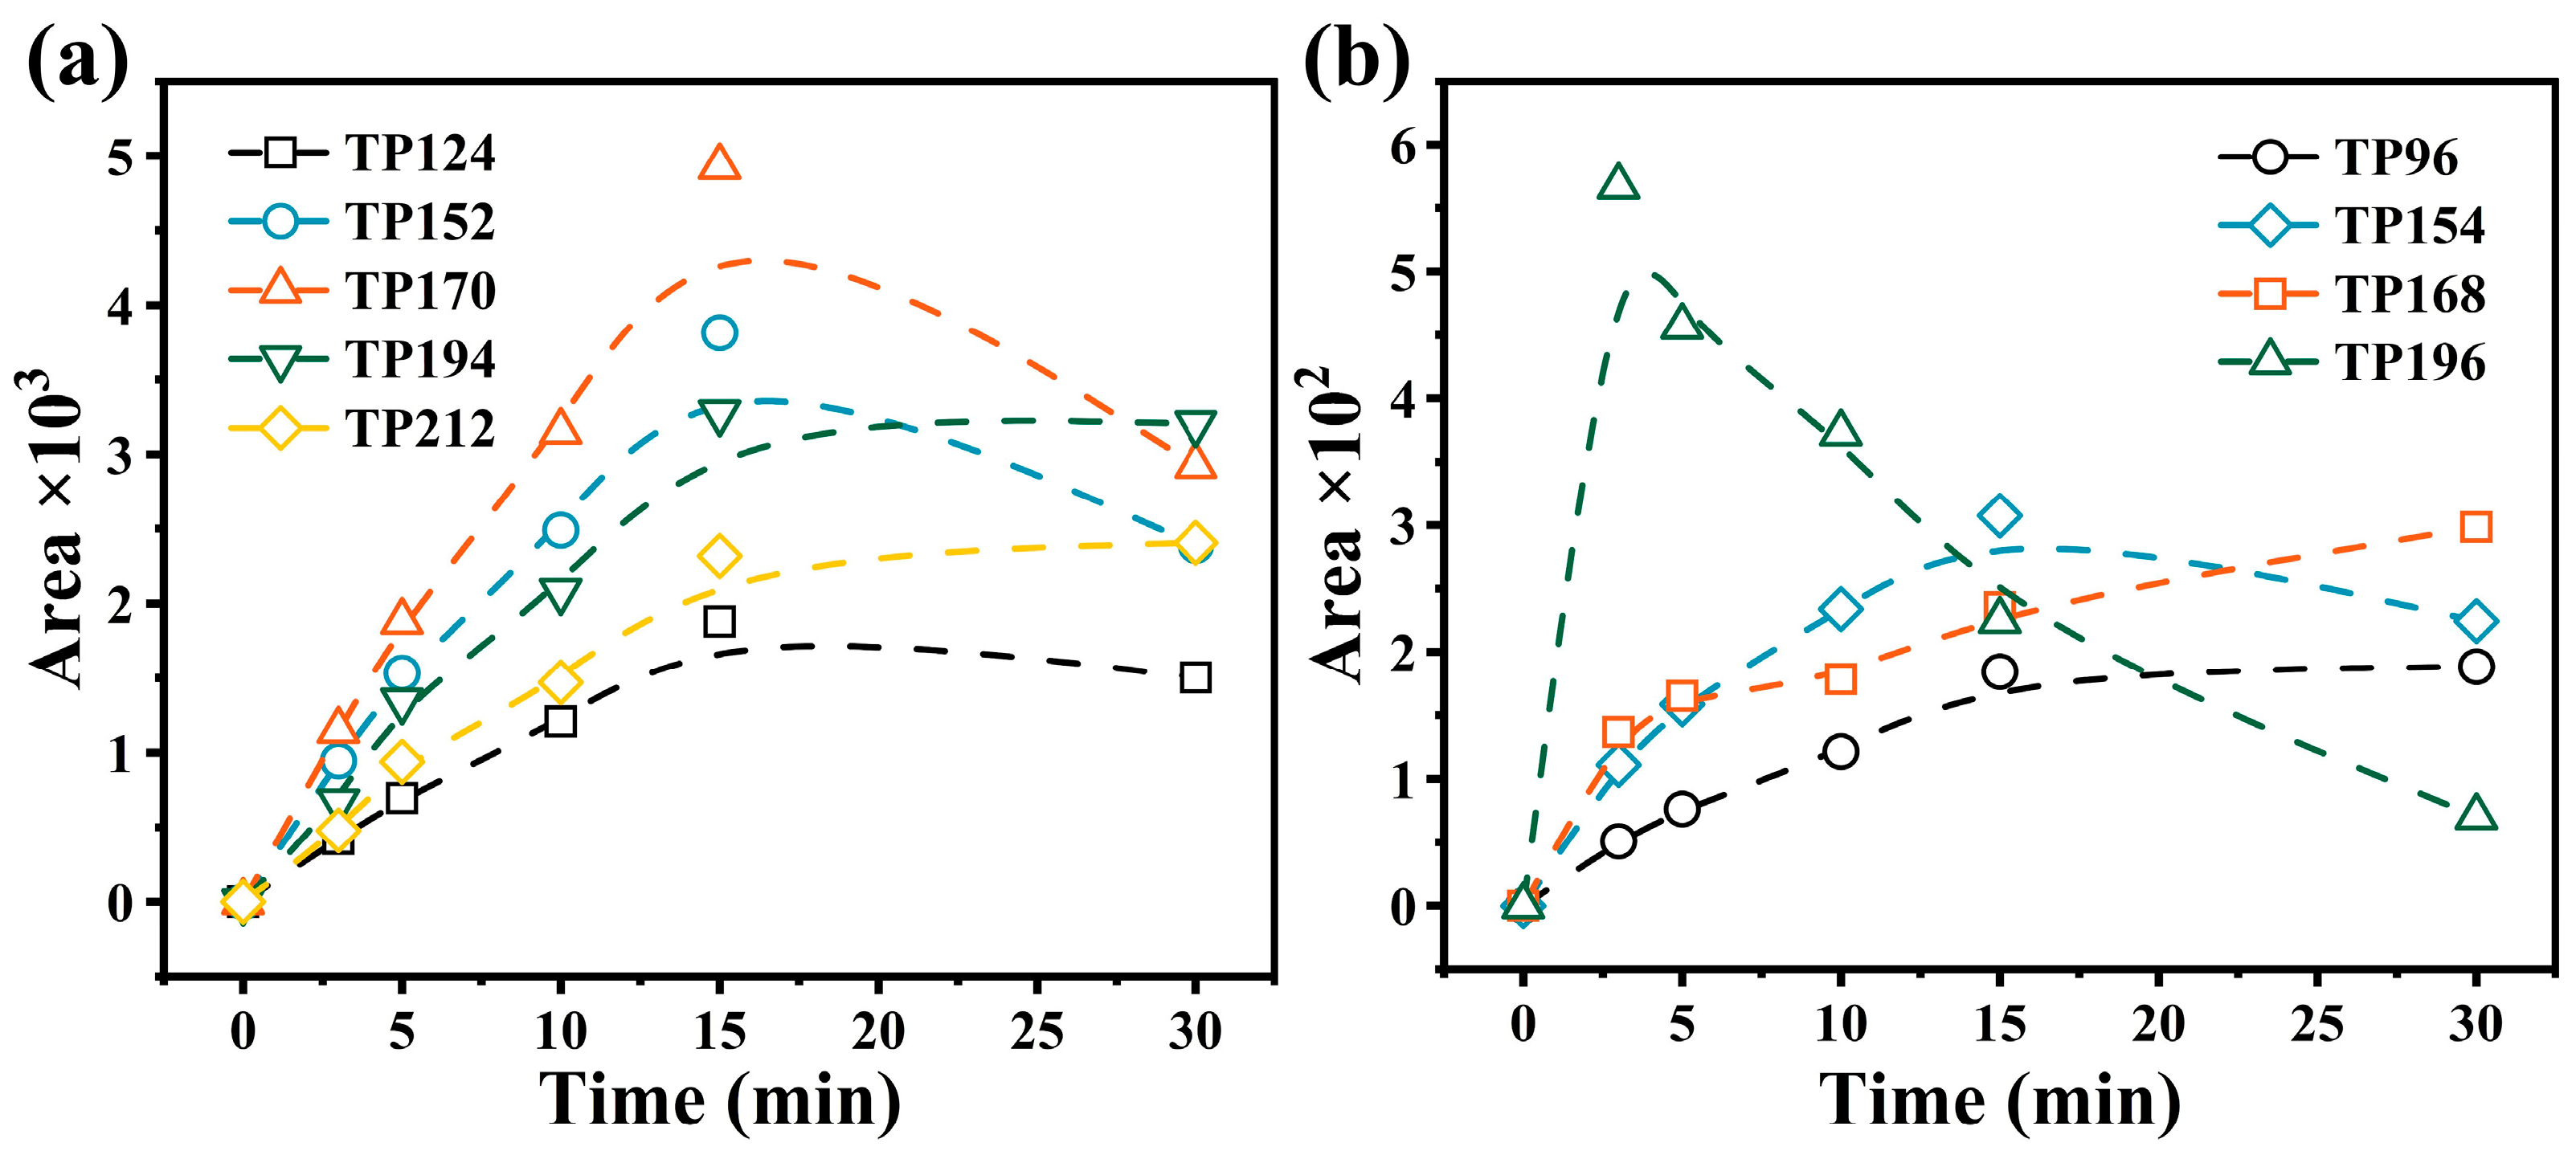
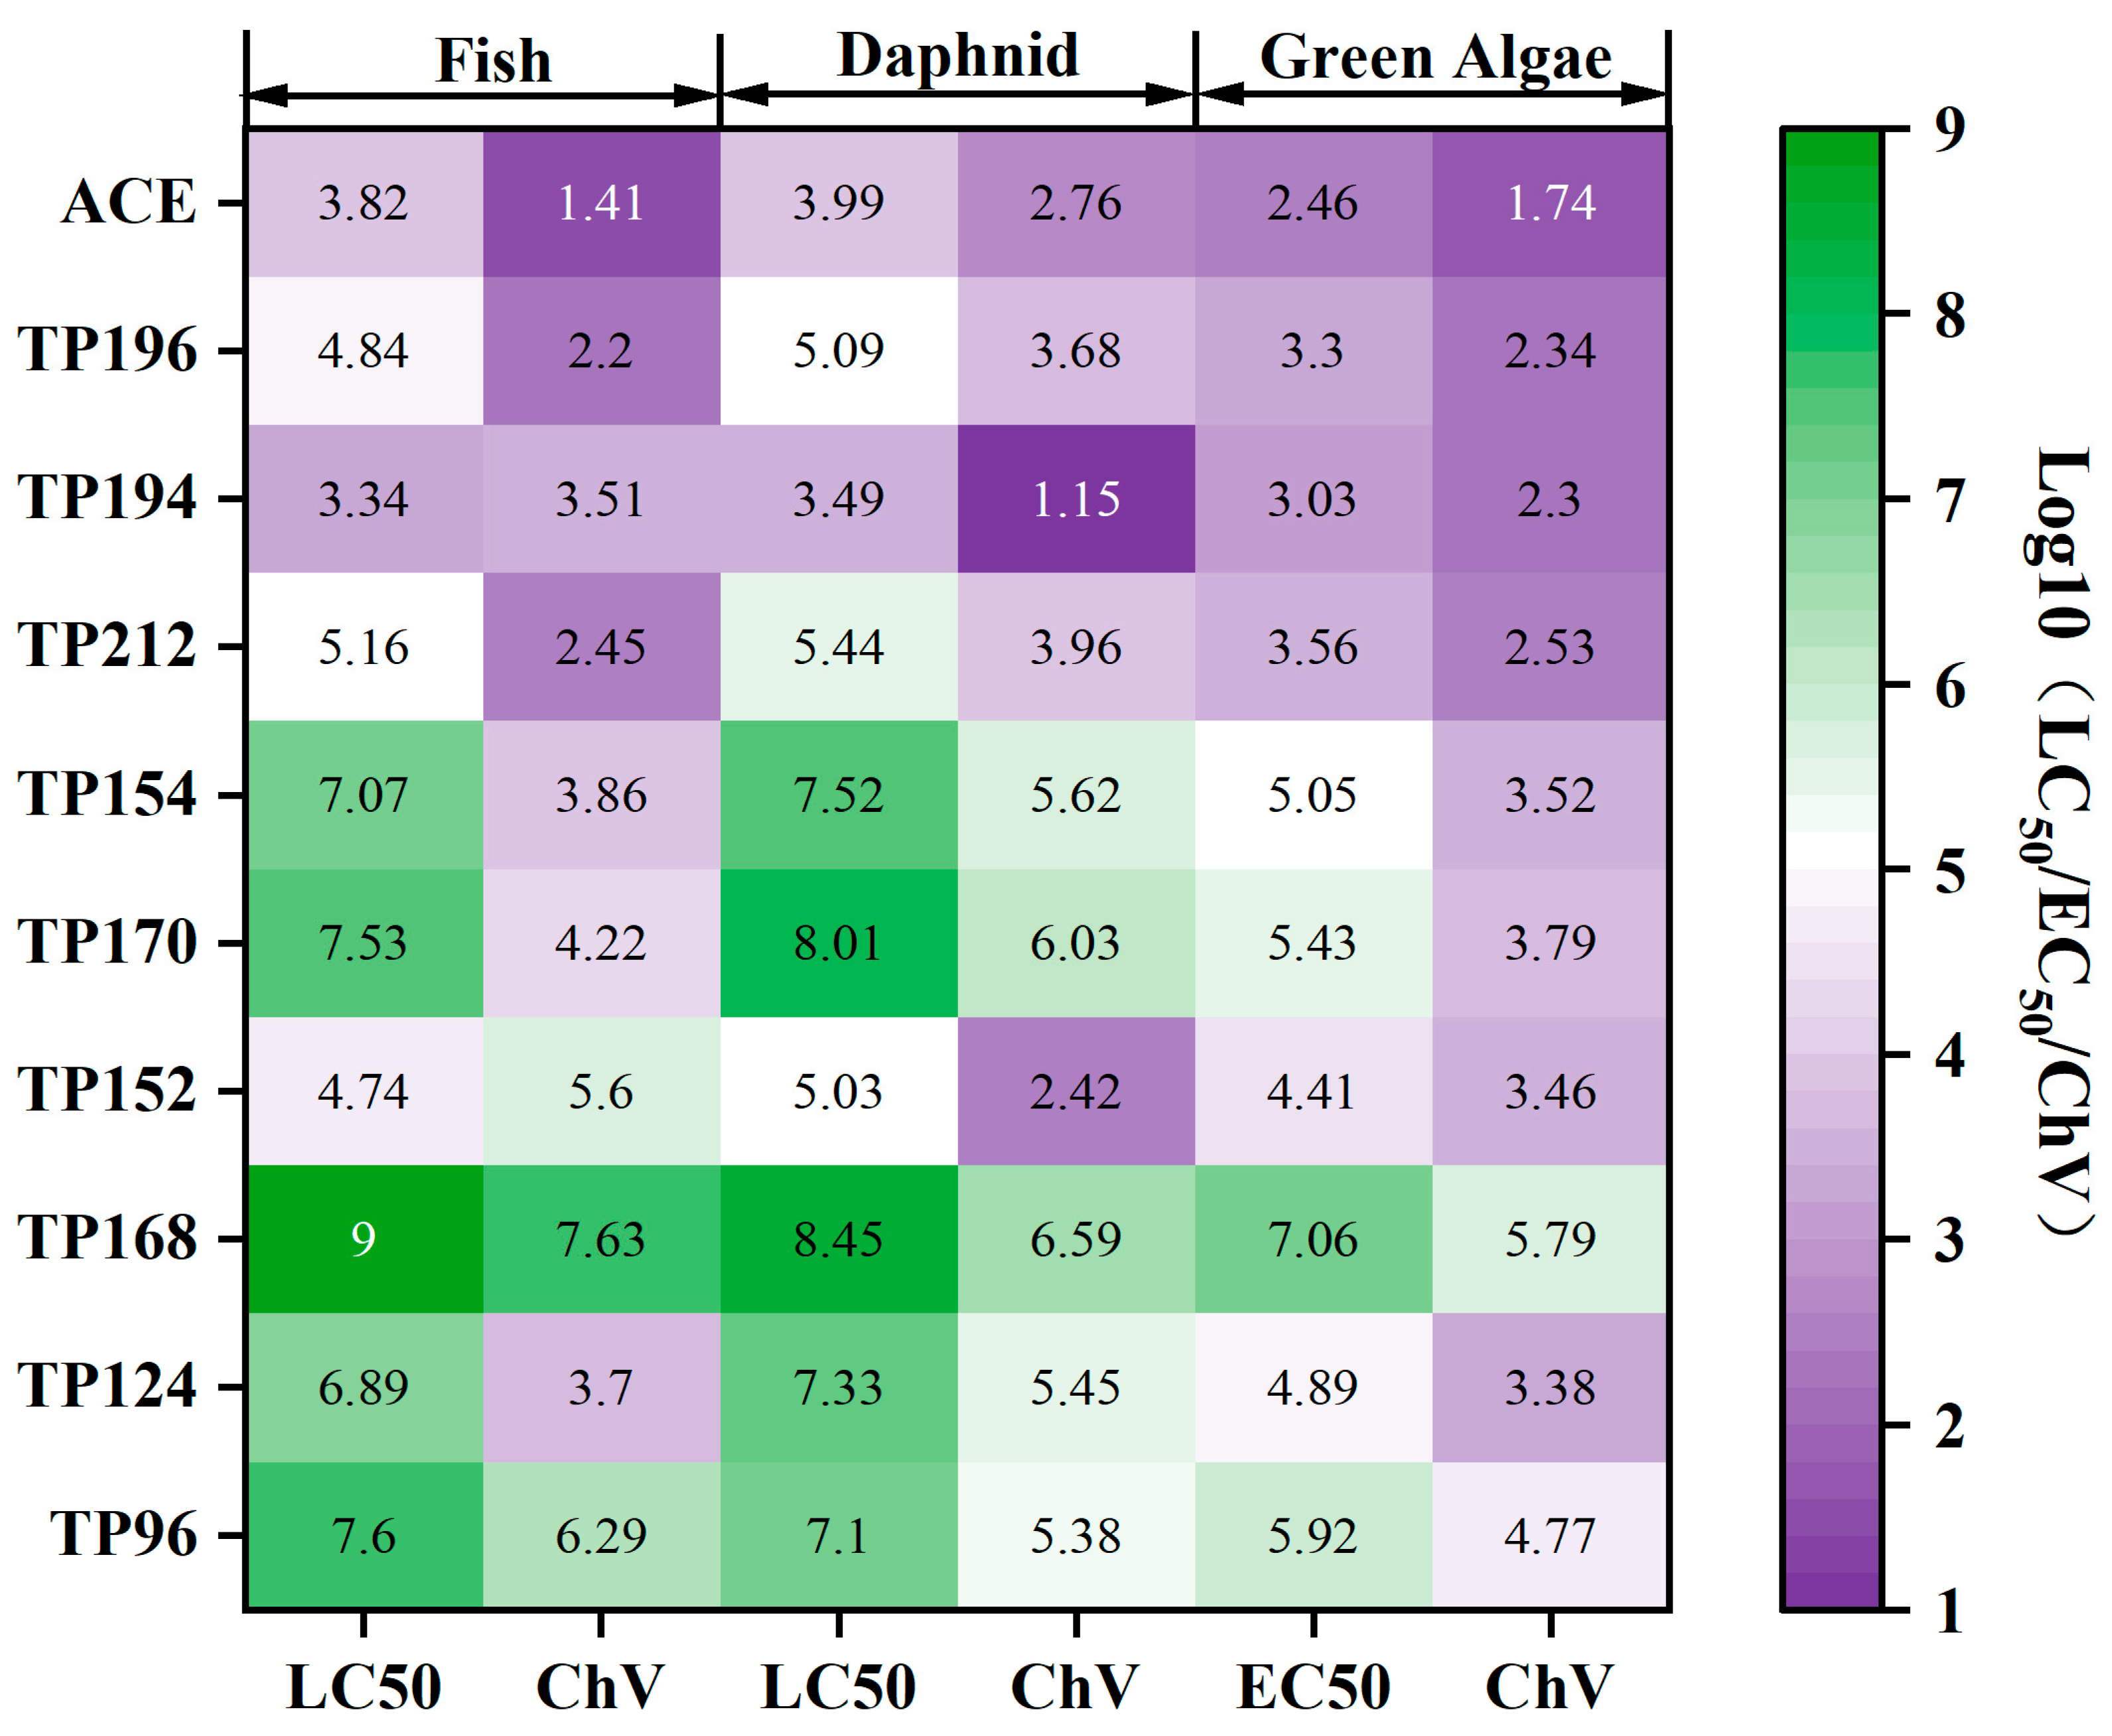
3.4. Identification and Toxicity Assessment of Degradation Products

Figure 6a presents the chromatograms at various time points of the reaction, detected in full scan mode. The peak 1 corresponding to the substance identified at a retention time of 2.357 min was ACE (Figure 6c), which exhibited a decreasing trend over time and ultimately disappeared. In contrast, a peak 2 at a retention time of 1.416 min increased over time, which may be a degradation product of ACE. Analysis of the mass spectra associated with these product peaks identified five major TPs (Figure 6d). Additionally, four minor TPs were identified via SIM scanning based on the regularity of abundance changes over time (Figure 6b). The mass-to-charge ratios (m/z) of these TPs matched the values documented in the literature concerning ACE degradation products [53,54].
Their hypothesized structures and degradation pathways are depicted in Figure 7. Notably, the primary degradation pathway involves ACE oxidation to form TP196, which possesses a cyclic structure. This intermediate reacts with ROS, thus opening the ring to produce TP194. Through hydration and hydrolysis, TP194 is converted to TP170, which subsequently transforms into TP152 and TP124, ultimately forming TP96.
The peak emergence times of TPs (Figure 6b) and their abundance changes (Figure 8) in SIM scan mode further corroborated their structures and degradation pathways. The peak time of TP196 was comparable to that of ACE, indicating their similar polar structures and intact cyclic structure. Furthermore, analysis of the abundance changes of TP196 placed its highest abundance at the onset of the reaction, subsequently declining until it disappeared. Thus, TP196 represents the initial step of ACE degradation. TPs 124, 152, 154, and 170 exhibited similar peak times and a consistent trend in abundance, i.e., an increase followed by a decrease, indicating their structural similarities and functions as intermediate products in the reaction. Conversely, the abundance of TPs 212 and 96 continuously increased until stabilization, suggesting they are the final ACE degradation products.
To demonstrate that the intermediate products of the proposed scheme do not cause secondary pollution during actual remediation, we measured the concentrations of total iron and sulfate in the system, as shown in Figures S5 and S6. With reference to other work in the literature, both iron and sulfur concentrations fall within reasonable ranges [26,55]. Additionally, we evaluated the ecological toxicity of ACE and its TPs in ECOSAR (Figure 9). The results indicate that ACE primarily exhibits chronic toxicity. Notably, the toxic effects of TP196 and TP194, precursors of ACE, on fish showed a significant increase. Meanwhile, the chronic toxicity of TP194 for Daphnia appeared to be enhanced. Regarding the intermediate products (TP154, TP170, TP152, TP168, and TP124) and the final products (TP212 and TP96), all except TP152, which exhibited chronic toxicity comparable to that of ACE for Daphnia, demonstrated markedly reduced acute and chronic toxicity towards fish, Daphnia, and green algae. From the perspective of the degradation pathway, overall toxicity decreased as ACE progressively degraded into the lower-tier TPs. These results further emphasize the advantageous function of the proposed degradation scheme in mitigating ACE pollution in aquatic environments. Consequently, applying the waste natural pyrite/PMS system to ACE degradation does not increase ecological risks to the environment; rather, it further alleviates the impact of ACE on the ecological environment.

4. Conclusions

In summary, the waste natural pyrite/PMS system demonstrates potential for effective ACE treatment. Specifically, the system exhibited excellent degradation performance, achieving complete ACE removal within 15 min under optimal conditions (a 1:6 pollutant/PMS ratio and a pyrite concentration of 0.7 g/L). This system applies to a wide range of scenarios and most natural conditions, except alkaline environments and scenarios with a high concentration of HCO3. Its degradation mechanism mirrors that of the pure pyrite/PMS system, and its oxidized layer does not significantly hinder the activation capability. Furthermore, this system presents a very low risk of ecotoxicity, as ACE can be degraded into less toxic products, thereby contributing to its eventual mineralization.

Supplementary Materials

The following supporting information can be downloaded at: https://www.mdpi.com/article/10.3390/w17111558/s1, Table S1. Different forms of carbon indices in ACE samples; Table S2. Composition of elements in the waste natural pyrite; Table S3. The physicochemical properties of ACE; Figure S1. XRD spectra of the waste natural pyrite; Figure S2. SEM images of pyrite before (a) and after (b) the reaction. EDS spectra of main elements Fe, S, and O before the reaction (c–e). EDS spectra of main elements Fe, S, and O after the reaction (f). Figure S3. Degradation of ACE by pyrite, PMS, and pyrite/PMS systems; Figure S4. The changes in the pH during the reaction process under different initial pH; Figure S5. The variation in total iron with time; Figure S6. The variation in SO₄2− with time; Figure S7. The effect of 100 μM bicarbonate ions on the degradation of ACE under initial pH 3 conditions; Figure S8. Changes in concentrations over time and the kinetic constants of NB (a,b) and BA (c,d) in pyrite, PMS, and pyrite/PMS catalytic systems.

Author Contributions

Conceptualization, C.J. and Z.D.; methodology, X.S.; software, L.J.; validation, Z.Z., C.J. and X.S.; formal analysis, C.J.; investigation, C.J.; resources, X.S.; data curation, L.J.; writing—original draft preparation, C.J.; writing—review and editing, X.S.; visualization, Z.Z. and L.J.; supervision, Z.D.; project administration, X.S.; funding acquisition, X.S. All authors have read and agreed to the published version of the manuscript.

Funding

This research was funded by National Natural Science Foundation of China, grant number “42477432”, National Natural Science Foundation of Guangxi Province, grant number “2023GXNSFAA026373”.

Data Availability Statement

Data will be made available on request.

Acknowledgments

The authors express their profound gratitude to the research platform of Modern Industry College of Ecology and Environmental Protection, Guilin University of Technology. We are grateful to the editor and anonymous reviewers for their valuable comments and suggestions, which considerably improved this work.

Conflicts of Interest

The authors declare no conflicts of interest.

References

  1. Zhai, Z.; Zhang, Y.; Liang, X.; Li, J.; Chen, Z.; Zhang, J.; Li, W.; Wang, T.; He, Q.; Li, F.; et al. Acesulfame potassium triggers inflammatory bowel disease via the inhibition of focal adhesion pathway. J. Hazard. Mater. 2024, 476, 134901. [Google Scholar] [CrossRef] [PubMed]
  2. Li, D.; Yao, Y.; Sun, H.; Wang, Y.; Pu, J.; Calderón, R.; Alder, A.; Kannan, K. Artificial Sweeteners in Pig Feed: A Worldwide Survey and Case Study in Pig Farms in Tianjin, China. Environ. Sci. Technol. 2020, 54, 4059–4067. [Google Scholar] [CrossRef] [PubMed]
  3. Li, D.; O’Brien, J.; Tscharke, B.; Choi, P.; Zheng, Q.; Ahmed, F.; Thompson, J.; Li, J.; Mueller, J.; Sun, H.; et al. National wastewater reconnaissance of artificial sweetener consumption and emission in Australia. Environ. Int. 2020, 143, 105963. [Google Scholar] [CrossRef]
  4. Buerge, I.; Poiger, T. Acesulfame: From Sugar Substitute to Wastewater Marker. Chimia 2011, 65, 176. [Google Scholar] [CrossRef]
  5. Stempvoort, D.; Roy, J.; Brown, S.; Bickerton, G. Artificial sweeteners as potential tracers in groundwater in urban environments. J. Hydrol. 2011, 401, 126–133. [Google Scholar] [CrossRef]
  6. Wu, M.; Qian, Y.; Boyd, J.; Hrudey, S.; Le, C.; Li, X. Direct large volume injection ultra-high performance liquid chromatography-tandem mass spectrometry determination of artificial sweeteners sucralose and acesulfame in well water. J. Chromatogr. A 2014, 1359, 156–161. [Google Scholar] [CrossRef]
  7. Ruff, M.; Mueller, M.; Loos, M.; Singer, H. Quantitative target and systematic non-target analysis of polar organic micro-pollutants along the river Rhine using high-resolution mass-spectrometry-Identification of unknown sources and compounds. Water Res. 2015, 87, 145–154. [Google Scholar] [CrossRef]
  8. Dong, G.; Li, X.; Han, G.; Du, L.; Li, M. Zebrafish neuro-behavioral profiles altered by acesulfame (ACE) within the range of “no observed effect concentrations (NOECs)”. Chemosphere 2020, 243, 125431. [Google Scholar] [CrossRef]
  9. Murali, A.; Giri, A.; Cameron, H.; Sperber, S.; Zickgraf, F.; Haake, V.; Driemert, P.; Walk, T.; Kamp, H.; Rietjens, I.; et al. Investigating the gut microbiome and metabolome following treatment with artificial sweeteners acesulfame potassium and saccharin in young adult Wistar rats. Food Chem. Toxicol. 2022, 165, 113123. [Google Scholar] [CrossRef]
  10. Wiklund, A.; Guo, X.; Gorokhova, E. Cardiotoxic and neurobehavioral effects of sucralose and acesulfame in Daphnia: Toward understanding ecological impacts of artificial sweeteners. Comp. Biochem. Physiol. Part C Toxicol. Pharmacol. 2023, 273, 109733. [Google Scholar] [CrossRef]
  11. Lin, X.; Guo, F.; Rillig, M.; Chen, C.; Duan, G.; Zhu, Y. Effects of common artificial sweeteners at environmentally relevant concentrations on soil springtails and their gut microbiota. Environ. Int. 2024, 185, 108496. [Google Scholar] [CrossRef] [PubMed]
  12. Scheurer, M.; Storck, F.; Brauch, H.; Lange, F. Performance of conventional multi-barrier drinking water treatment plants for the removal of four artificial sweeteners. Water Res. 2010, 44, 3573–3584. [Google Scholar] [CrossRef] [PubMed]
  13. Subedi, B.; Kannan, K. Fate of artificial sweeteners in wastewater treatment plants in New York State, U.S.A. Environ. Sci. Technol. 2014, 48, 13668–13674. [Google Scholar] [CrossRef]
  14. Mursaikova, M.; Kuráž, M.; Grasserová, A.; Cajthaml, T.; Hrkal, Z.; Boukalová, Z. Degradation behaviour of the artificial sweetener Acesulfame-K within a riverbank filtration system. J. Water Process Eng. 2024, 63, 105453. [Google Scholar] [CrossRef]
  15. Belton, K.; Schaefer, E.; Guiney, P. A Review of the Environmental Fate and Effects of Acesulfame-Potassium. Integr. Environ. Assess. Manag. 2020, 16, 421–437. [Google Scholar] [CrossRef]
  16. Priyadarshini, M.; Das, I.; Ghangrekar, M.; Blaney, L. Advanced oxidation processes: Performance, advantages, and scale-up of emerging technologies. J. Environ. Manag. 2022, 316, 115295. [Google Scholar] [CrossRef]
  17. Nidheesh, P.; Divyapriya, G.; Ezzahra, T.; Hamdani, M. Treatment of textile wastewater by sulfate radical based advanced oxidation processes. Sep. Purif. Technol. 2022, 293, 121115. [Google Scholar] [CrossRef]
  18. Peng, Y.; Tang, H.; Yao, B.; Gao, X.; Yang, X.; Zhou, Y. Activation of peroxymonosulfate (PMS) by spinel ferrite and their composites in degradation of organic pollutants: A Review. Chem. Eng. J. 2021, 414, 128800. [Google Scholar] [CrossRef]
  19. Tang, F.; Dai, H.; Yang, X.; Li, W.; Wang, B. Nitrogen and sulfur co-doped watermelon rind as an ordered mesoporous biochar activated peroxymonosulfate (PMS) for efficient tetracycline degradation. J. Environ. Chem. Eng. 2024, 12, 112302. [Google Scholar] [CrossRef]
  20. Liu, W.; Zhou, S.; Xu, W.; Shang, J.; Yi, M.; Cheng, X. Enhancement of manganese sand activation for PMS degradation of levofloxacin using Co₃O₄ quantum dots: Mechanism and application. J. Water Process Eng. 2025, 70, 107101. [Google Scholar] [CrossRef]
  21. Pan, F.; Ji, H.; Du, P.; Huang, T.; Wang, C.; Liu, W. Insights into catalytic activation of peroxymonosulfate for carbamazepine degradation by MnO2 nanoparticles in-situ anchored titanate nanotubes: Mechanism, ecotoxicity and DFT study. J. Hazard. Mater. 2021, 402, 123779. [Google Scholar] [CrossRef] [PubMed]
  22. Duan, Y.; Li, X.; Gao, S.; Yu, M.; Fu, L.; Zhang, Y.; Sun, H.; Pan, Y. Lignosulfonate modified zero-valent iron enhanced activation of peroxymonosulfate for sulfamethazine removal: Performance and mechanism. Chem. Eng. J. 2025, 504, 159054. [Google Scholar] [CrossRef]
  23. Rickard, D.; Luther, G. Chemistry of Iron Sulfides. Chem. Rev. 2007, 107, 514–562. [Google Scholar] [CrossRef] [PubMed]
  24. Ma, Z.; Liu, G.; Zhang, H.; Zhang, S.; Lu, Y. Evaluation of pyrite cinders from sulfuric acid production as oxygen carrier for chemical looping combustion. Energy 2021, 233, 121079. [Google Scholar] [CrossRef]
  25. Kobal, W.; Pepper, R.; Alarco, J.; Martens, W.; Couperthwaite, S. Production of ferric ammonium sulfate (FAS) dodecahydrate from pyrite (FeS2). Environ. Chall. 2025, 18, 101102. [Google Scholar] [CrossRef]
  26. Wang, Y.; Dong, X. PMS activation by natural pyrite for APAP degradation: Underlying mechanism and long-term removal of APAP. Catal. Commun. 2023, 177, 106661. [Google Scholar] [CrossRef]
  27. Tu, Z.; Liang, Y.; Zhou, S.; Zhang, X.; Tan, X.; Zhang, X.; Reinfelder, J. Application of pyrite to water pollutant removal: A review. J. Water Process Eng. 2024, 68, 106375. [Google Scholar] [CrossRef]
  28. Helser, J.; Vassilieva, E.; Cappuyns, V. Environmental and human health risk assessment of sulfidic mine waste: Bioaccessibility, leaching and mineralogy. J. Hazard. Mater. 2022, 424, 127313. [Google Scholar] [CrossRef]
  29. Ma, C.; Liu, Y.; Wang, J.; Deric, N.; Li, Y.; Fan, X.; Peng, W. Facile synthesis of pyrite FeS2 on carbon spheres for high-efficiency Fenton-like reaction. Chemosphere 2024, 355, 141799. [Google Scholar] [CrossRef]
  30. Rahimi, F.; Hoek, J.; Royer, S.; Javid, A.; Mashayekh-Salehi, A.; Sani, M. Pyrite nanoparticles derived from mine waste as efficient catalyst for the activation of persulfates for degradation of tetracycline. J. Water Process Eng. 2021, 40, 101808. [Google Scholar] [CrossRef]
  31. Yu, S.; Yuan, X.; Zhao, B.; Xue, N.; Du, S.; Wang, Y. Pyrite-activated persulfate to degrade 3,5,6-trichloro-2-pyridyl in water: Degradation and Fe release mechanism. Environ. Res. 2024, 251, 118198. [Google Scholar] [CrossRef] [PubMed]
  32. Shu, X.; Qin, Z.; Nie, C.; Zhou, J.; Zhang, T.; Zhang, Q. Role of surface secondary mineral on tylosin degradation mediated by the pyrite oxidation process. China Environ. Sci. 2024, 44, 5539–5546. (In Chinese) [Google Scholar] [CrossRef]
  33. Li, A.; Wu, P.; Law, J.; Chow, C.; Postigo, C.; Guo, Y.; Leung, K. Transformation of acesulfame in chlorination: Kinetics study, identification of byproducts, and toxicity assessment. Water Res. 2017, 117, 157–166. [Google Scholar] [CrossRef]
  34. Sang, Z.; Jiang, Y.; Tsoi, Y.; Leung, K. Evaluating the environmental impact of artificial sweeteners: A study of their distributions, photodegradation and toxicities. Water Res. 2014, 52, 260–274. [Google Scholar] [CrossRef]
  35. Zuo, H.; Zhu, Y.; Dong, F.; Wu, X.; Pan, X.; Zheng, Y.; Xu, J. Degradation of enestroburin in the water-sediment system: Kinetics, transformation products identification and toxicity assessment to aquatic organisms. Int. J. Environ. Anal. Chem. 2024, 1–12. [Google Scholar] [CrossRef]
  36. Medici, A.; Siciliano, A.; Libralato, G.; Saviano, L.; Guida, M.; Pedatella, S.; Luongo, G.; Fabio, G.; Zarrelli, A. Percarbonate mediated advanced oxidation of irbesartan: A suitable alternative to chlorination? Sci Total Environ. 2024, 947, 174730. [Google Scholar] [CrossRef]
  37. Loos, R.; Carvalho, R.; António, C.; Comero, S.; Locoro, G.; Tavazzi, S.; Paracchini, B.; Ghiani, M.; Lettieri, T.; Blaha, L.; et al. EU-wide monitoring survey on emerging polar organic contaminants in wastewater treatment plant effluents. Water Res. 2013, 47, 6475–6487. [Google Scholar] [CrossRef]
  38. Sackey, L.; Koomson, J.; Kumi, R.; Hayford, A.; Kayoung, P. Assessing the quality of sewage sludge: CASE study of the Kumasi wastewater treatment plant. Heliyon 2023, 9, e19550. [Google Scholar] [CrossRef]
  39. Fu, Y.; Wu, G.; Geng, J.; Li, J.; Li, S.; Ren, H. Kinetics and modeling of artificial sweeteners degradation in wastewater by the UV/persulfate process. Water Res. 2019, 150, 12–20. [Google Scholar] [CrossRef]
  40. Wang, J.; Wang, S. Activation of persulfate (PS) and peroxymonosulfate (PMS) and application for the degradation of emerging contaminants. Chem. Eng. J. 2018, 334, 1502–1517. [Google Scholar] [CrossRef]
  41. Liao, P.; Gao, Q.; Yang, Q.; Li, Q.; Sun, Y. Hydrochemical compositions characteristics of runoff in Dinghushan forest region under the background of acid deposition. Acta Ecol. Sin. 2022, 42, 2368–2381. [Google Scholar] [CrossRef]
  42. Li, X.; Yan, P.; Li, L.; Chen, Y.; Chen, Z. Activation of peroxymonosulfate by natural pyrite for effective degradation of 2,4,6-trichlorophenol in water: Efficiency, degradation mechanism and toxicity evaluation. Sep. Purif. Technol. 2023, 322, 124253. [Google Scholar] [CrossRef]
  43. Li, Y.; Chen, J.; Zhong, J.; Yang, B.; Yang, Z.; Shih, K.; Feng, Y. Acceleration of traces of Fe3+-activated peroxymonosulfate by natural pyrite: A novel cocatalyst for improving Fenton-like processes. Chem. Eng. J. 2022, 435, 134893. [Google Scholar] [CrossRef]
  44. So, H.; Lin, K.; Chu, W.; Gong, H. Degradation of Triclosan by Recyclable MnFe2O4-Activated PMS: Process Modification for Reduced Toxicity and Enhanced Performance. Ind. Eng. Chem. Res. 2020, 59, 4257–4264. [Google Scholar] [CrossRef]
  45. Liu, T.; Li, N.; Xiao, S.; Chen, J.; Ji, R.; Shi, Y.; Zhou, X.; Zhang, Y. Revisiting iodide species transformation in peracetic acid oxidation: Unexpected role of radicals in micropollutants decontamination and iodate formation. Water Res. 2024, 265, 122270. [Google Scholar] [CrossRef]
  46. Huang, Y.; Chen, Y.; Zhu, K.; Li, P.; Wu, X.; Yan, K. Visible-light-driven peroxymonosulfate activation by FeS2 nanoplates for simultaneous oxidation of arsenite and organic dyes. Results Eng. 2024, 23, 102453. [Google Scholar] [CrossRef]
  47. Zhai, J.; Wang, X.; Yan, J.; Gong, C.; Zhu, W.; Luo, Y.; Yang, D.; Gao, X. Oxidized pyrite as an efficient Fenton reagent to generate active species for the degradation of carbamazepine in a wide pH range. Appl. Surf. Sci. 2023, 638, 158098. [Google Scholar] [CrossRef]
  48. Todd, E.; Sherman, D.; Purton, J. Surface oxidation of pyrite under ambient atmospheric and aqueous (pH = 2 to 10) conditions: Electronic structure and mineralogy from X-ray absorption spectroscopy. Geochim. Cosmochim. Acta 2003, 67, 881–893. [Google Scholar] [CrossRef]
  49. Hu, J.; Zhou, S.; Liao, S.; Gu, G.; Wang, Y. Effect of oxidized pyrite activating persulfate on the degradation of aniline aerofloat: Mechanism and degradation pathway. Miner. Eng. 2023, 201, 108233. [Google Scholar] [CrossRef]
  50. Schaufuß, A.G.; Nesbitt, H.W.; Kartio, I.; Laajalehto, K.; Bancroft, G.M.; Szargan, R. Incipient oxidation of fractured pyrite surfaces in air. J. Electron Spectrosc. Relat. Phenom. 1998, 96, 69–82. [Google Scholar] [CrossRef]
  51. Zhang, H.; Song, C.; Liu, X.; Du, J.; Zhang, X.; Li, M.; Zhang, B. Efficient decontamination of Cr(III)-citrate complex with negligible Cr(VI) accumulation by pyrite-activated peroxymonosulfate process. J. Environ. Chem. Eng. 2024, 12, 112028. [Google Scholar] [CrossRef]
  52. Liu, T.; Chen, N.; Deng, Y.; Chen, F.; Feng, C. Degradation of: P-nitrophenol by nano-pyrite catalyzed Fenton reaction with enhanced peroxide utilization. RSC Adv. 2020, 10, 15901–15912. [Google Scholar] [CrossRef] [PubMed]
  53. Chow, C.; Leung, K. Removing acesulfame with the peroxone process: Transformation products, pathways and toxicity. Chemosphere 2019, 221, 647–655. [Google Scholar] [CrossRef] [PubMed]
  54. Gan, Z.; Sun, H.; Wang, R.; Hu, H.; Zhang, P.; Ren, X. Transformation of acesulfame in water under natural sunlight: Joint effect of photolysis and biodegradation. Water Res. 2014, 64, 113–122. [Google Scholar] [CrossRef]
  55. Sukarjo; Yustika, R.; Handayani, C.; Dewi, T.; Yustiawati; Yanti, D.; Dariah, A. Risk assessment for non-carcinogenic effect posed by sulfates in water on the health of residents around The Sumpur River, West Sumatra-Indonesia. Toxicol. Rep. 2025, 14, 101921. [Google Scholar] [CrossRef]
Figure 1. Effect of the amount of pyrite on the degradation of ACE (a) and pseudo-first-order kinetic plots (b). Effect of the concentration of PMS on the degradation of ACE (c) and pseudo-first-order kinetic plots (d). Conditions: [ACE]0 = 10 μM, [PMS]0 = 60 μM (for (a,b)), [pyrite]0 = 0.7 g/L (for (c,d)), initial pH = 7.0, T = 25 °C.
Water 17 01558 g001
Figure 2. Effect of the initial solution pH on the degradation of ACE (a). Effect of Cl (b), NO3 (c), HCO3 (d), Ca2+ (e), and Mg2+ (f) on the degradation of ACE. Conditions: [ACE]0 = 10 μM, [PMS]0 = 60 μM, [pyrite]0 = 0.7 g/L, initial pH = 7.0 for (bf), T = 25 °C.
Water 17 01558 g002
Figure 3. EPR spectra of DMPO- O H and DMPO- S O 4 (a), DMPO- O 2 (b), and TEMP- O 2 1 (c). Conditions: [DMPO]0 = 100 mM for (a,b), [TEMP]0 = 100 mM for (c), [PMS]0 = 60 μM, [pyrite]0 = 0.7 g/L, vortexed for 10 min, initial pH = 7.0, T = 25 °C.
Water 17 01558 g003
Figure 4. Effects of ROS quenchers EtOH (a), TBA (b), CF (c), and FFA (d) on ACE degradation. Conditions: [ACE]0 = 10 μM, [PMS]0 = 60 μM, [pyrite]0 = 0.7 g/L, initial pH = 7.0, T = 25 °C.
Water 17 01558 g004
Figure 5. XPS spectra of Fe 2p (a,b), S 2p (c,d), and O 1s (e,f) of pyrite before and after the reaction.
Water 17 01558 g005
Figure 6. Total ion chromatogram of ACE samples after degradation for different times in the system of waste natural pyrite/PMS (a), the relative relationship between the peak emergence times and abundances of various transformation products under the SIM mode (b), and the corresponding mass spectra at the scanning time of 2.357 min (c) and 1.416 min (d). Conditions: [ACE]0 = 10 μM, [PMS]0 = 60 μM, [pyrite]0 = 0.7 g/L, pH = 7.0, T = 25 °C.
Water 17 01558 g006
Figure 7. The ACE degradation pathway. Conditions: [ACE]0 = 10 μM, [PMS]0 = 60 μM, [pyrite]0 = 0.7 g/L, pH = 7.0, T = 25 °C.
Water 17 01558 g007
Figure 8. The changes in the abundance of major TPs (a) and minor TPs (b) over time. Conditions: [ACE]0 = 10 μM, [PMS]0 = 60 μM, [pyrite]0 = 0.7 g/L, pH = 7.0, T = 25 °C.
Water 17 01558 g008
Figure 9. Toxicity assessment of ACE and its transformation products. Conditions: [ACE]0 = 10 μM, [PMS]0 = 60 μM, [pyrite]0 = 0.7 g/L, pH = 7.0, T = 25 °C.
Water 17 01558 g009
Disclaimer/Publisher’s Note: The statements, opinions and data contained in all publications are solely those of the individual author(s) and contributor(s) and not of MDPI and/or the editor(s). MDPI and/or the editor(s) disclaim responsibility for any injury to people or property resulting from any ideas, methods, instructions or products referred to in the content.

