Article

Comparative Analysis of Light Microscopy and High-Throughput Sequencing for Phytoplankton Detection in Rivers Flowing into the Sea

State Environmental Protection Key Laboratory of Estuarine and Coastal Environment, Chinese Research Academy of Environment Sciences, Beijing 100012, China
*
Author to whom correspondence should be addressed.
Water 2025, 17(11), 1559; https://doi.org/10.3390/w17111559
Submission received: 24 April 2025 / Revised: 14 May 2025 / Accepted: 15 May 2025 / Published: 22 May 2025
(This article belongs to the Section Biodiversity and Functionality of Aquatic Ecosystems)

Abstract

:
Phytoplankton are essential indicators of aquatic ecosystem health. Traditional phytoplankton detection methods using microscopy struggle to identify species with small particle sizes or unclear morphological characteristics. In contrast, molecular methods have high accuracy but struggle to simultaneously detect prokaryotic and eukaryotic organisms due to primer specificity. As algal blooms can be caused by both prokaryotes and eukaryotes, methods that can detect both are required. This study used both microscopic detection and high-throughput sequencing methods to analyze phytoplankton in seagoing waters in eastern coastal China. Two high-throughput sequencing primers targeting 16S rDNA for prokaryotes and 18S rDNA for eukaryotes were used, and the results were compared with those of microscopic analysis. Microscopy identified 230 phytoplankton species across 73 genera, mainly belonging to Bacillariophyta, Chlorophyta, Euglenophyta, Cyanophyta, Dinophyta, and Chrysophyta. Twenty-four species across 16 sampling stations exceeded 1 million cells/L. High-throughput sequencing yielded 8642 prokaryotic and 7375 eukaryotic operational taxonomic units, with 432 identified as phytoplankton. Chlorophyta and Bacillariophyta had the highest species richness, accounting for 34% and 17%, respectively. High-throughput sequencing detected more species than microscopic detection but relied on gene reference databases and provided only the relative abundance of species based on operational taxonomic unit counts.

1. Introduction

Phytoplankton, as the core functional group of aquatic ecosystems, play an irreplaceable role in biogeochemical processes [1]. Through photosynthesis, phytoplankton fix approximately 50 Gt of carbon each year, accounting for more than 50% of the primary productivity of the global ocean [2]. The community structure of phytoplankton directly influences biogeochemical pathways of nitrogen, phosphorus, and silicon [3]. Owing to high sensitivity to temperature, nutrients, and pollutants, phytoplankton composition is widely used to assess eutrophication status, harmful algal bloom risks, and climate change impacts [4].
The detection and monitoring of aquatic organisms is the basis for studying the characteristics of aquatic systems and the mechanisms of interaction between organisms and environmental factors. Various methods have been developed to describe and monitor the abundance, composition, and diversity of phytoplankton communities, such as high-performance liquid chromatography for pigment detection [5,6], flow cytometer for cell particle size and optical properties detection [7], and quantitative polymerase chain reaction and high-throughput sequencing based on molecular biology [8,9,10]. Phytoplankton (<50 μm) have traditionally been identified and counted using microscopy, with accurate results [11,12]. Techniques such as fluorescent staining and centrifugation have allowed organisms as small as 0.2 μm to be observed using microscopy [12,13,14]. However, while microscopy methods have been continuously modified, the classic sedimentation technique developed by Utermöhl remains the most popular method in laboratories [11,15,16].
However, despite its maturity, the classic sedimentation technique has certain limitations. It is time-consuming and labor-intensive, often requiring more than 6 h for sample sedimentation after water sample collection [17] and a further 2–10 h for analysis [18]. Furthermore, it requires a high degree of technological expertise. The taxonomy and nomenclature of phytoplankton are under constant revision, and taxonomists must continuously attend training courses and obtain essential phytoplankton identification literature [19,20]. However, the morphological characteristics of some algal species are not obvious or are similar to other algae of the same genus or family [21,22], making it difficult to identify them at the species level. In addition, sample handling and storage processes can affect the accuracy of results. Lugol’s reagent is usually added to the sample but can cause fragile algal cells, such as Gymnodinium, to break down. Reagents should be added during sample preservation, and the sample storage time should not exceed one year [18].
In addition to microscopic detection methods, molecular biological methods are typically used to assist with accurate phytoplankton identification [23,24]. With the development of molecular biology methods based on gene sequences, our understanding of the microbial diversity in water bodies, including phytoplankton, has increased. Metabarcoding is used to analyze the species composition and relative abundance of field samples using PCR amplification and sequencing of molecular markers of field samples [25]. Common barcodes include ribosomal rRNA genes (16S, 18S, and 28S), ITS sequences, the mitochondrial gene CO1, and the chloroplast gene rbcL [26,27,28,29]. Over 20 years ago, scientists in the United States and France identified a variety of phytoplankton in seawater by cloning and sequencing chloroplast 16S rDNA and 18S rDNA sequences, respectively [30,31,32]. Since then, these two molecular markers have been widely used to detect phytoplankton. By comparing the sequencing results with the GenBank, the existing sequences of algal species can be accurately annotated to the species level using molecular methods. Compared to other detection methods, metabarcoding analysis is more efficient and accurate and can detect more phytoplankton species, including species that cannot be captured by a microscope [33]. However, it is difficult to determine the abundance of species based on sequence analysis, and only rough relative quantification can be performed by analyzing the number of operational taxonomic units (OTUs). Consequently, this method cannot completely replace microscopic detection methods.
Given the necessity to monitor phytoplankton to ensure water safety, appropriate phytoplankton detection methods are vital. This study aimed to explore the advantages and disadvantages of microscopy and molecular methods and the feasibility of combining them for detection. To achieve this, we applied microscopy and high-throughput sequencing to analyze the phytoplankton composition in several rivers that flow into the East China Sea, where algal blooms often occur in spring. The advantages of the two methods for phytoplankton detection in these rivers were compared, and the characteristics of the phytoplankton community structure were analyzed.

2. Materials and Methods

2.1. Sample Collection

Field sampling was conducted in the eastern part of Zhejiang Province, where several rivers flow into the East China Sea (Figure 1). In these sea-going rivers, the water environment is affected by upstream water and marine water, supporting diverse phytoplankton communities that include both marine and freshwater species [34,35]. The Datanggang Reservoir provides an alternative source of drinking water for the local area but experiences eutrophication and rapid increases in phytoplankton abundance [36]. The samples were collected from 10 May to 15 May 2023. The water salinity during the survey period was below 5.1‰, and the water temperature was 19.5–27.4 °C. Thirty sampling stations were selected, with fifteen located in the Datanggang Reservoir and its tributaries, eight located on Nantian Island, and seven located on Gaotang Island. All sites were hydrologically connected to the sea. At each site, 1000 mL surface water samples were collected in a sample bottle and preserved in Lugol’s solution. Additionally, at each site, 50–100 mL of surface water was filtered via peristaltic pumping onto a 0.45 mm pore size, 142 mm diameter HTTP membrane (Millipore, Boston, MA, USA). The membranes were kept at −80 °C until further processing.

2.2. Microscope Observation

Following the Utermöhl method [11,16], samples fixed with Lugol’s solution were settled and concentrated to 50–100 mL. Phytoplankton species and genera were identified and counted under an inverted light microscope (Leica, Wetzlar, Germany). The total abundance of phytoplankton, total number of species, and abundance of each species were calculated.

2.3. Metabarcoding Analysis

An improved CTAB method was used for DNA extraction [37]. Briefly, each HTTP membrane was placed in a 1.5 mL centrifuge tube with 0.7 mL of CTAB buffer and incubated at 60 °C for 60 min. During this period, the centrifuge tube was shaken every 10 min to thoroughly mix the buffer with the samples. Then, 0.7 mL of chloroform-isoamyl alcohol (24:1) was added to the sample, and the centrifuge tube was shaken to thoroughly mix the reagent. The mixture was then centrifuged at 4 °C and 14,000× g for 10 min. Then, the supernatant was collected and transferred into another 1.5 mL centrifuge tube, and 0.7 mL chloroform-isoamyl alcohol (24:1) was added. The mixture was centrifuged at 4 °C and 14,000× g for 10 min. Then, the supernatant was carefully collected and transferred into another 1.5 mL centrifuge tube. An equal volume of isopropyl alcohol pre-cooled to −20 °C was added to the supernatant, mixed, and maintained at −20 °C for at least 2 h. Then, the sample was centrifuged at 4 °C and 14,000× g for 15 min. The resulting precipitate was washed with 0.7 mL of 70% ethanol and dried on a clean workbench. Then, 30 μL of ddH2O was added to dissolve the DNA precipitate.
The DNA sample concentration and A260/280 values were measured using a NanoDrop (Thermo Fisher Technologies, Waltham, MA, USA) to ensure DNA sample quality. PCR amplification was performed, and the products were purified, quantified, and homogenized. The targets for species composition analysis, 18S rDNA and 16S rDNA, were amplified separately using a pair of specific primers: 18S rDNA: forward primer (TAReuk454FWD1) 5′-CCAGCASCYGCGGTAATTCC-3′ and reverse primer (TAReukREV3) 5′-ACTTTCGTTCTTGATYRA-3′ and 16S rDNA: forward primer (338F) 5′-ACTCCTACGGGAGGCAGCA-3′ and reverse primer (806R) 5′-GGACTACHVGGGTWTCTAAT-3′ [38,39,40,41].
After PCR product purification occurred, quantification, normalization, library construction, and sequencing were conducted by Biomarker Technologies Co., Ltd. (Beijing, China). The databases were selected as references for species annotation of the obtained sequences, including Silva [42] (Release138, http://www.arb-silva.de) (accessed on 10 April 2024), Unite [43] (Release 8.0, https://unite.ut.ee/) (accessed on 24 March 2024), Greengenes [44] (version 13.5, http://greengenes.secondgenome.com/) (accessed on 22 March 2024), NCBI (ftp://ftp.ncbi.nlm.nih.gov/refseq/TargetedLoci/, accessed on 22 April 2024), fungene [45] (http://fungene.cme.msu.edu/) (accessed on 22 March 2024), and MaarjAM [46] (http://www.maarjam.botany.ut.ee) (accessed on 6 April 2024).

3. Results

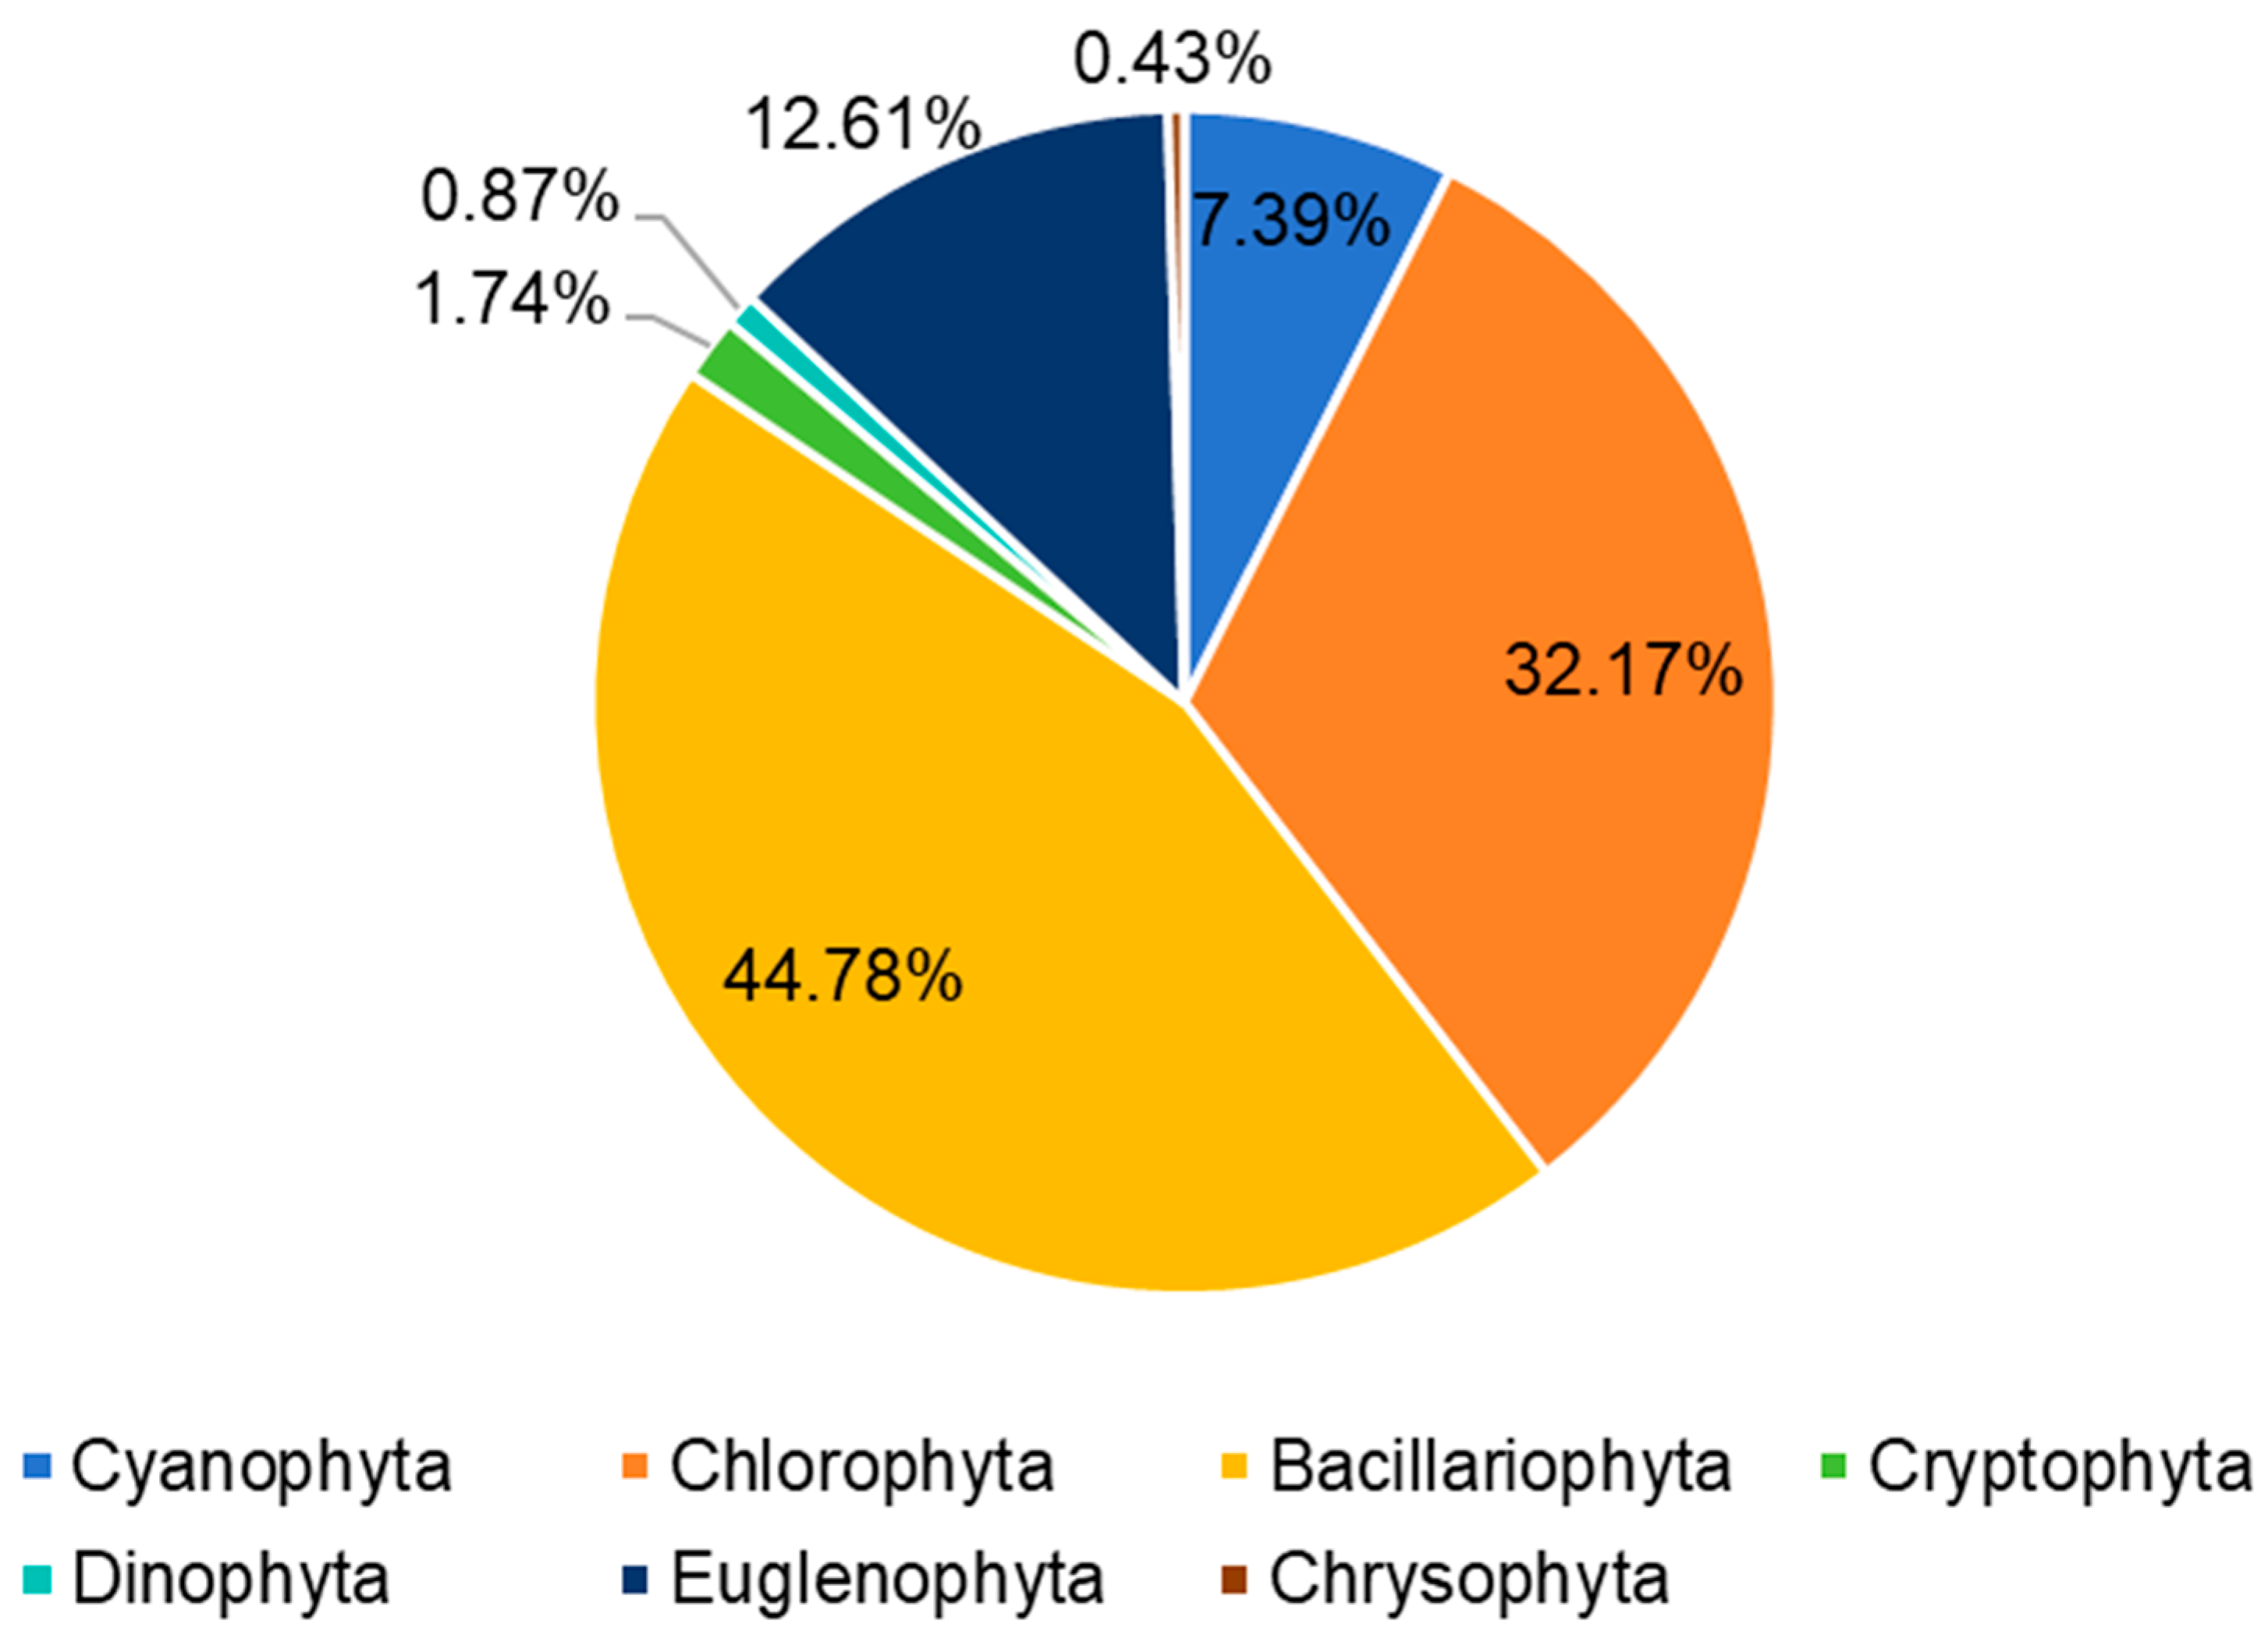
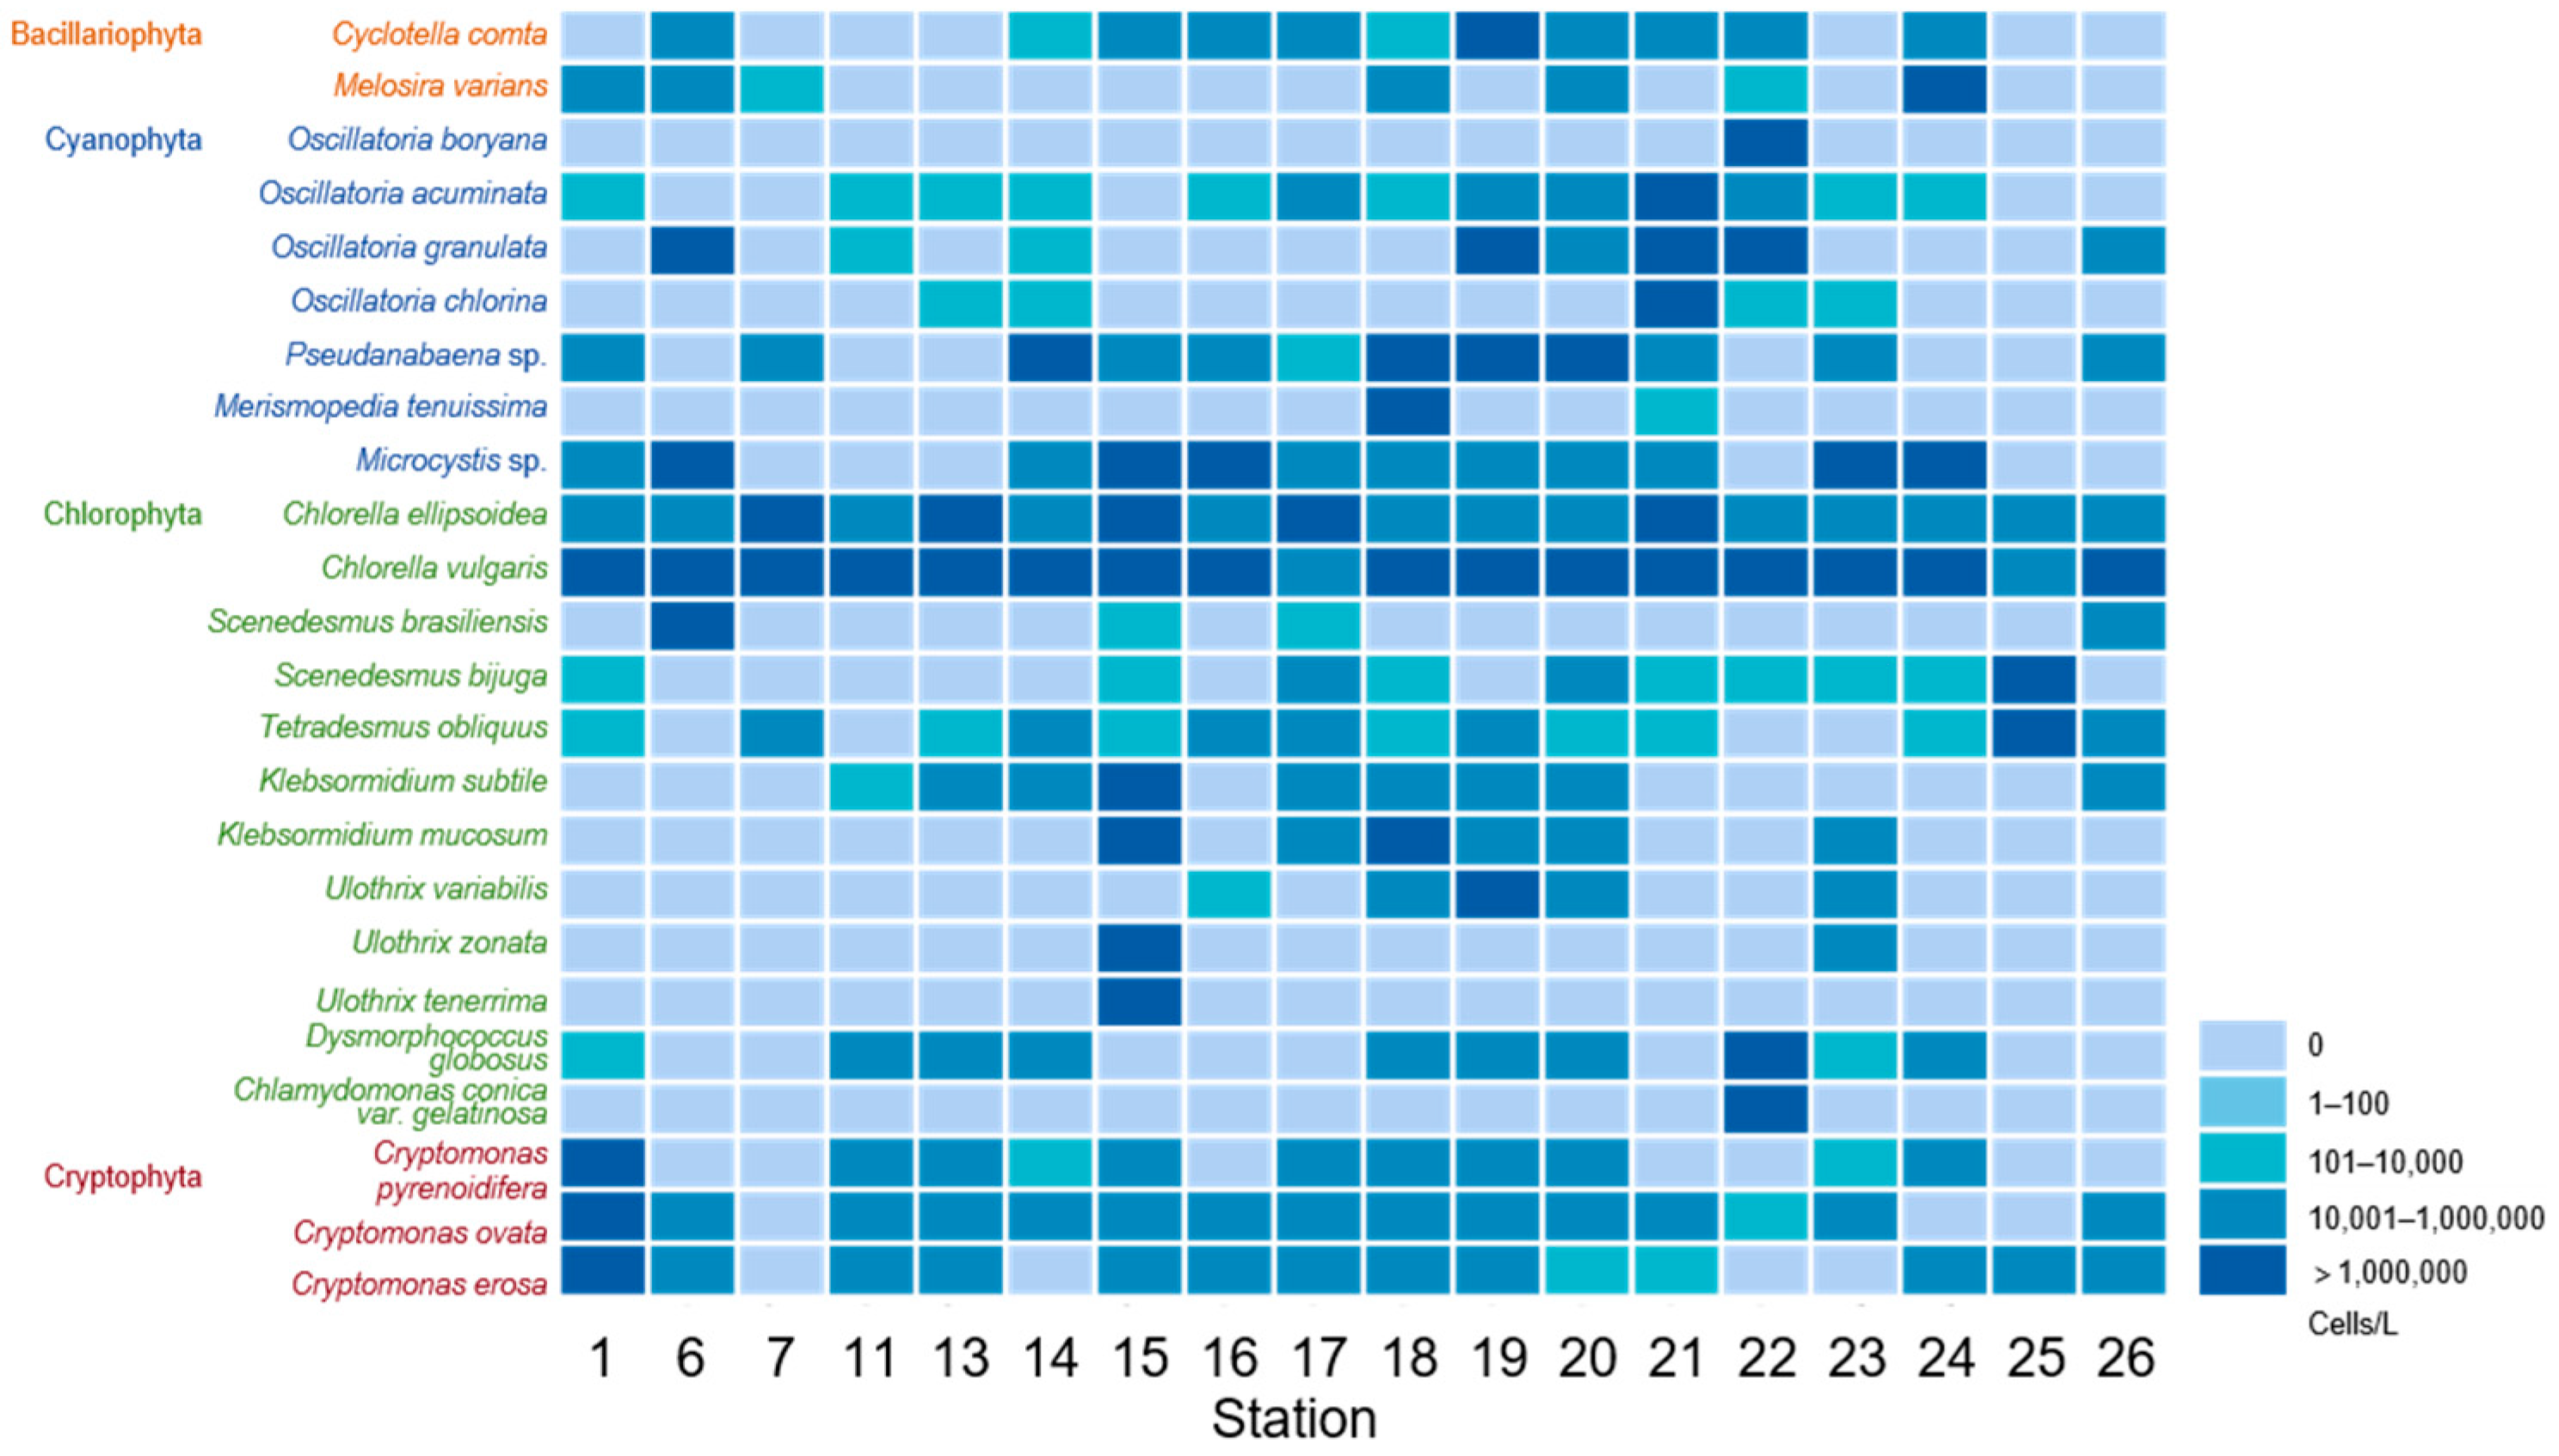
3.1. Algae Species and Abundance Observed Using Microscopy

A total of 230 phytoplankton species were identified using microscopy. The species belonged to 73 genera and 7 phyla: Bacillariophyta (103 species), Chlorophyta (74), Euglenophyta (29), Cyanobacteria (17), Cryptophyta (4), Dinophyta (2), and Chrysophyta (1). Bacillariophyta were the most diverse, accounting for 45% of the total species, followed by Chlorophyta (32%) (Figure 2). In terms of total phytoplankton abundance at all stations, the total cell abundance of Chlorophyta was the highest, at approximately 1.87 × 10⁸ cells/L, followed by Cyanobacteria (5.79 × 10⁷ cells/L), Bacillariophyta (3.94 × 10⁷ cells/L), Cryptophyta (16,600,000 cells/L), Euglenophyta (1.27 × 10⁷ cells/L), Dinophyta (6.86 × 10⁵ cells/L), and Chrysophyta (2.17 × 10⁵ cells/L). Twenty-four species had an abundance exceeding 106 cells/L at one or more stations (with 54 data points for >106 cells/L) (Figure 3): Bacillariophyta: Cyclotella comta and Melosira varians; Cyanobacteria: Microcystis sp., Merismopedia tenuissima, Pseudanabaena sp., Oscillatoria granulata, and three other Oscillatoria species; Chlorophyta: Chlorella vulgaris, Scenedesmus brasiliensis, and 10 other species; Cryptophyta: Cryptomonas reflexa, Cryptomonas ovata, and Cryptomonas erosa.

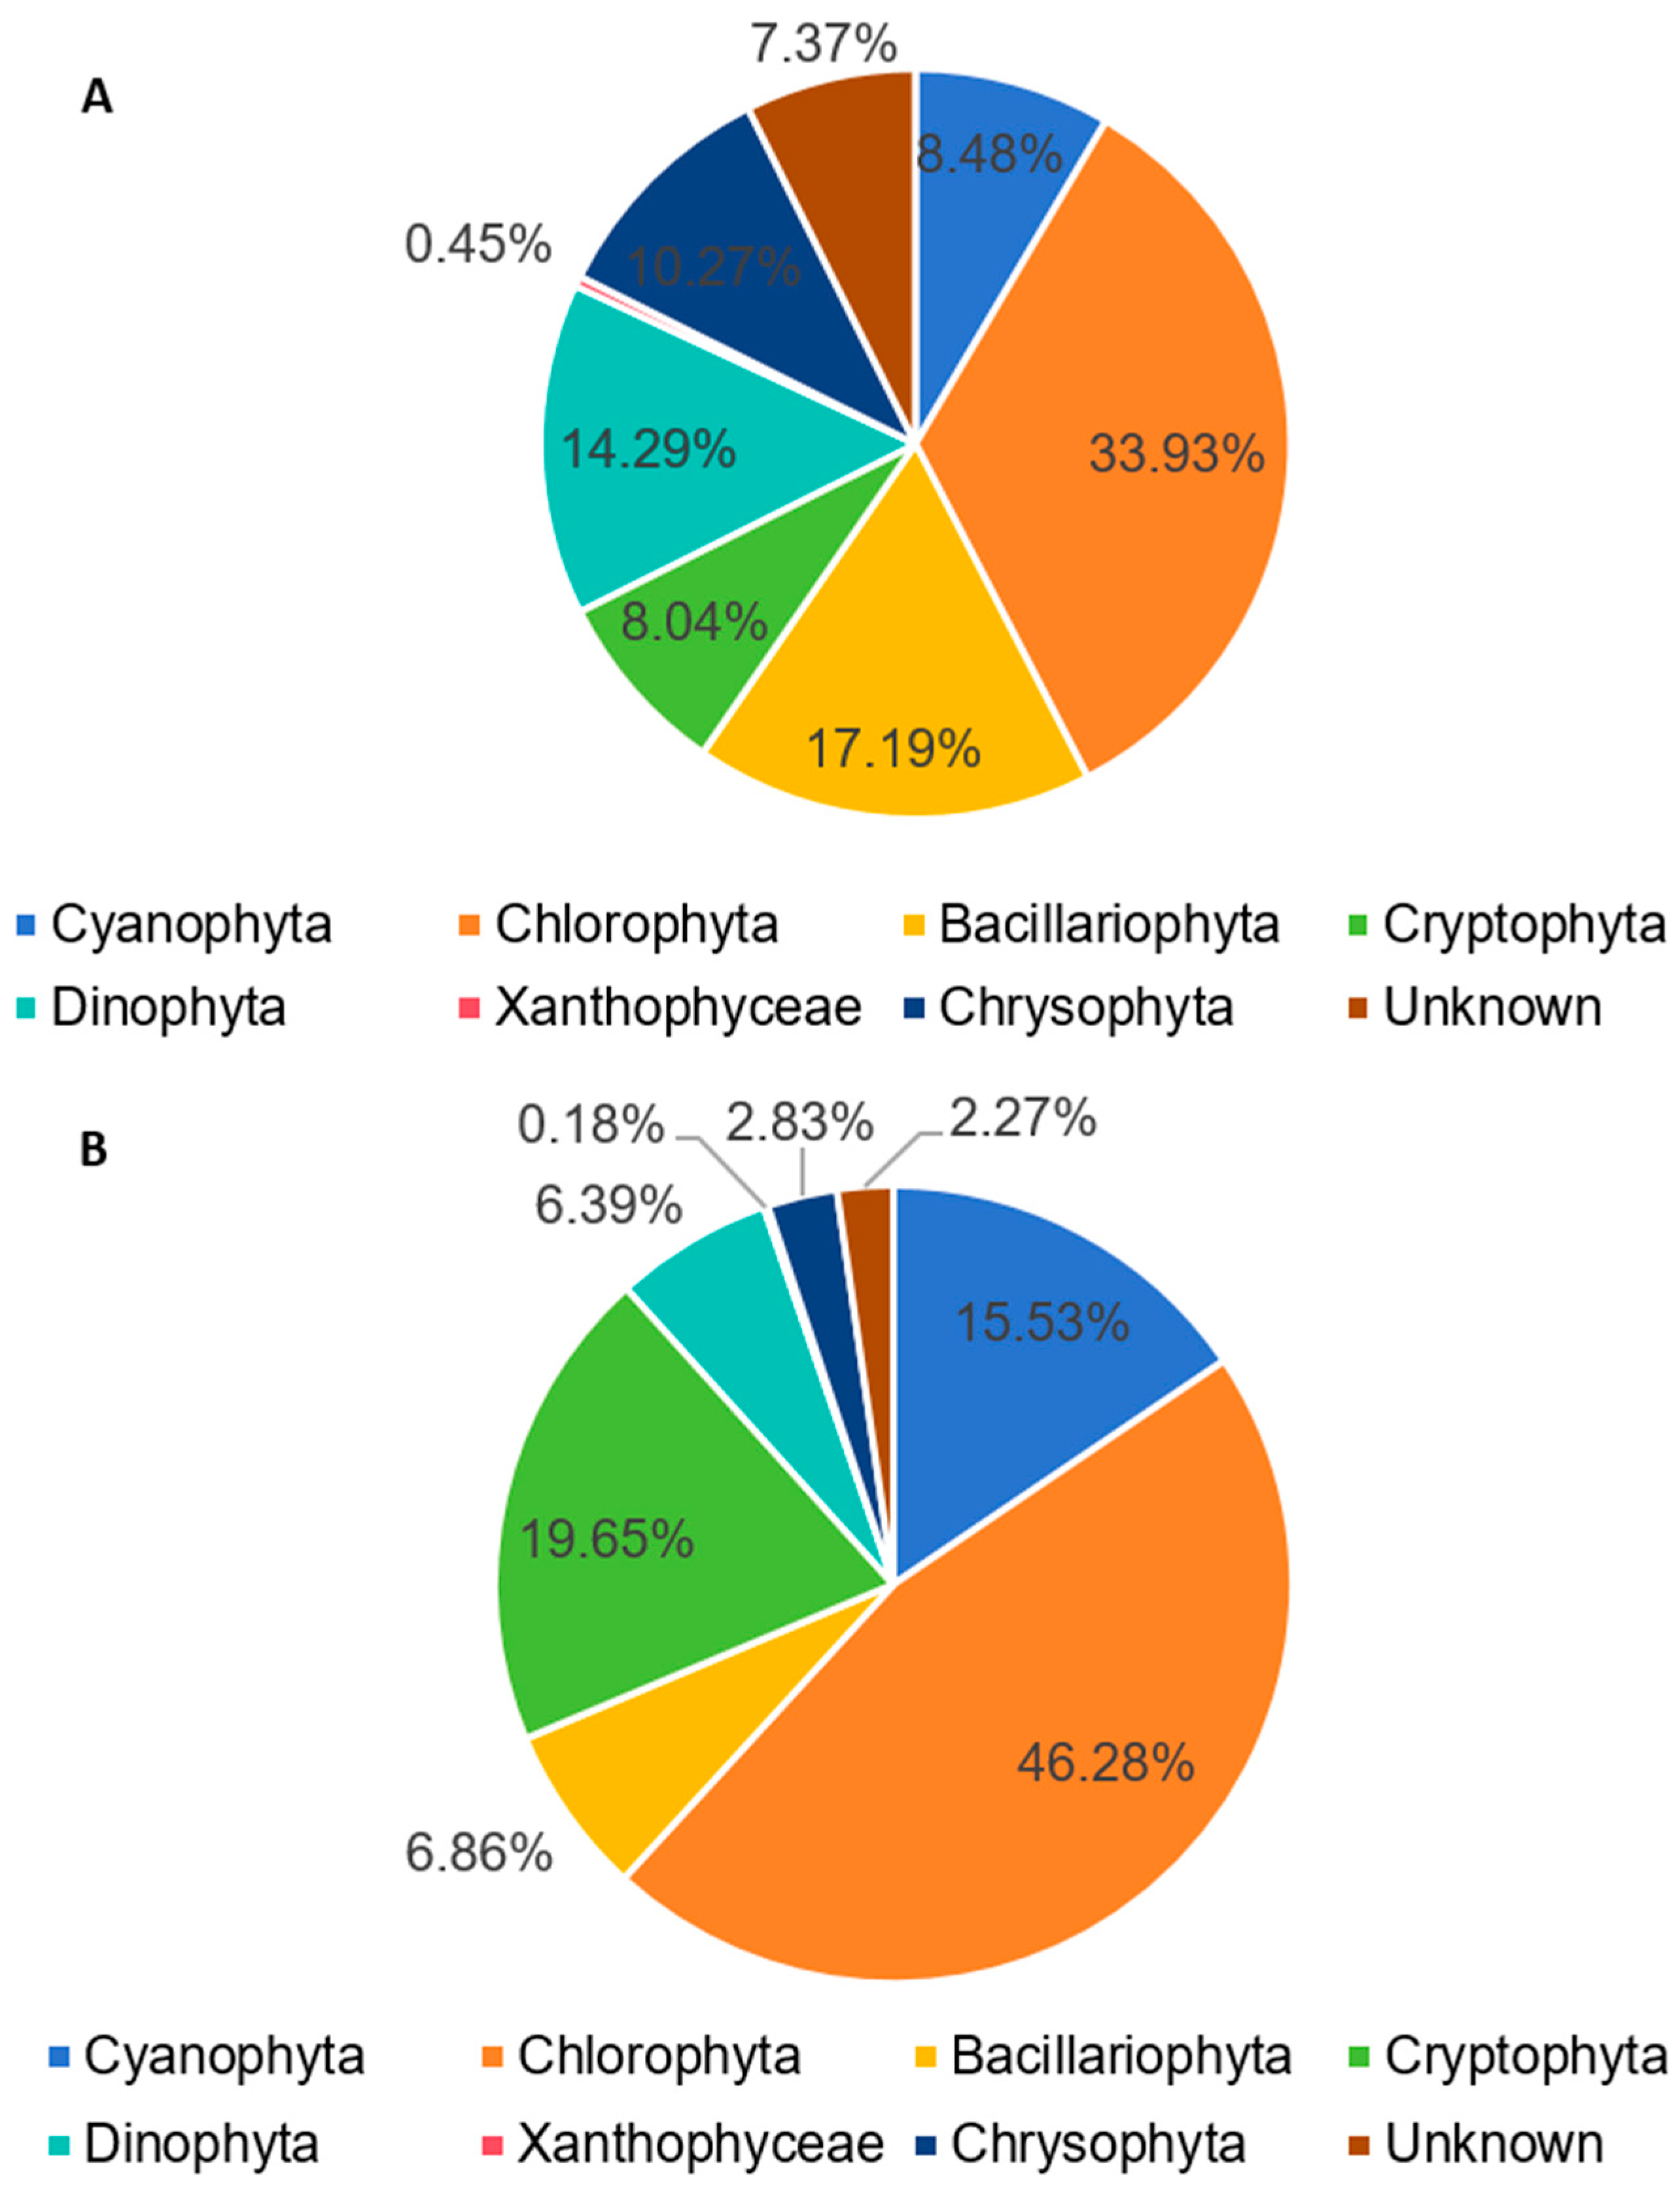
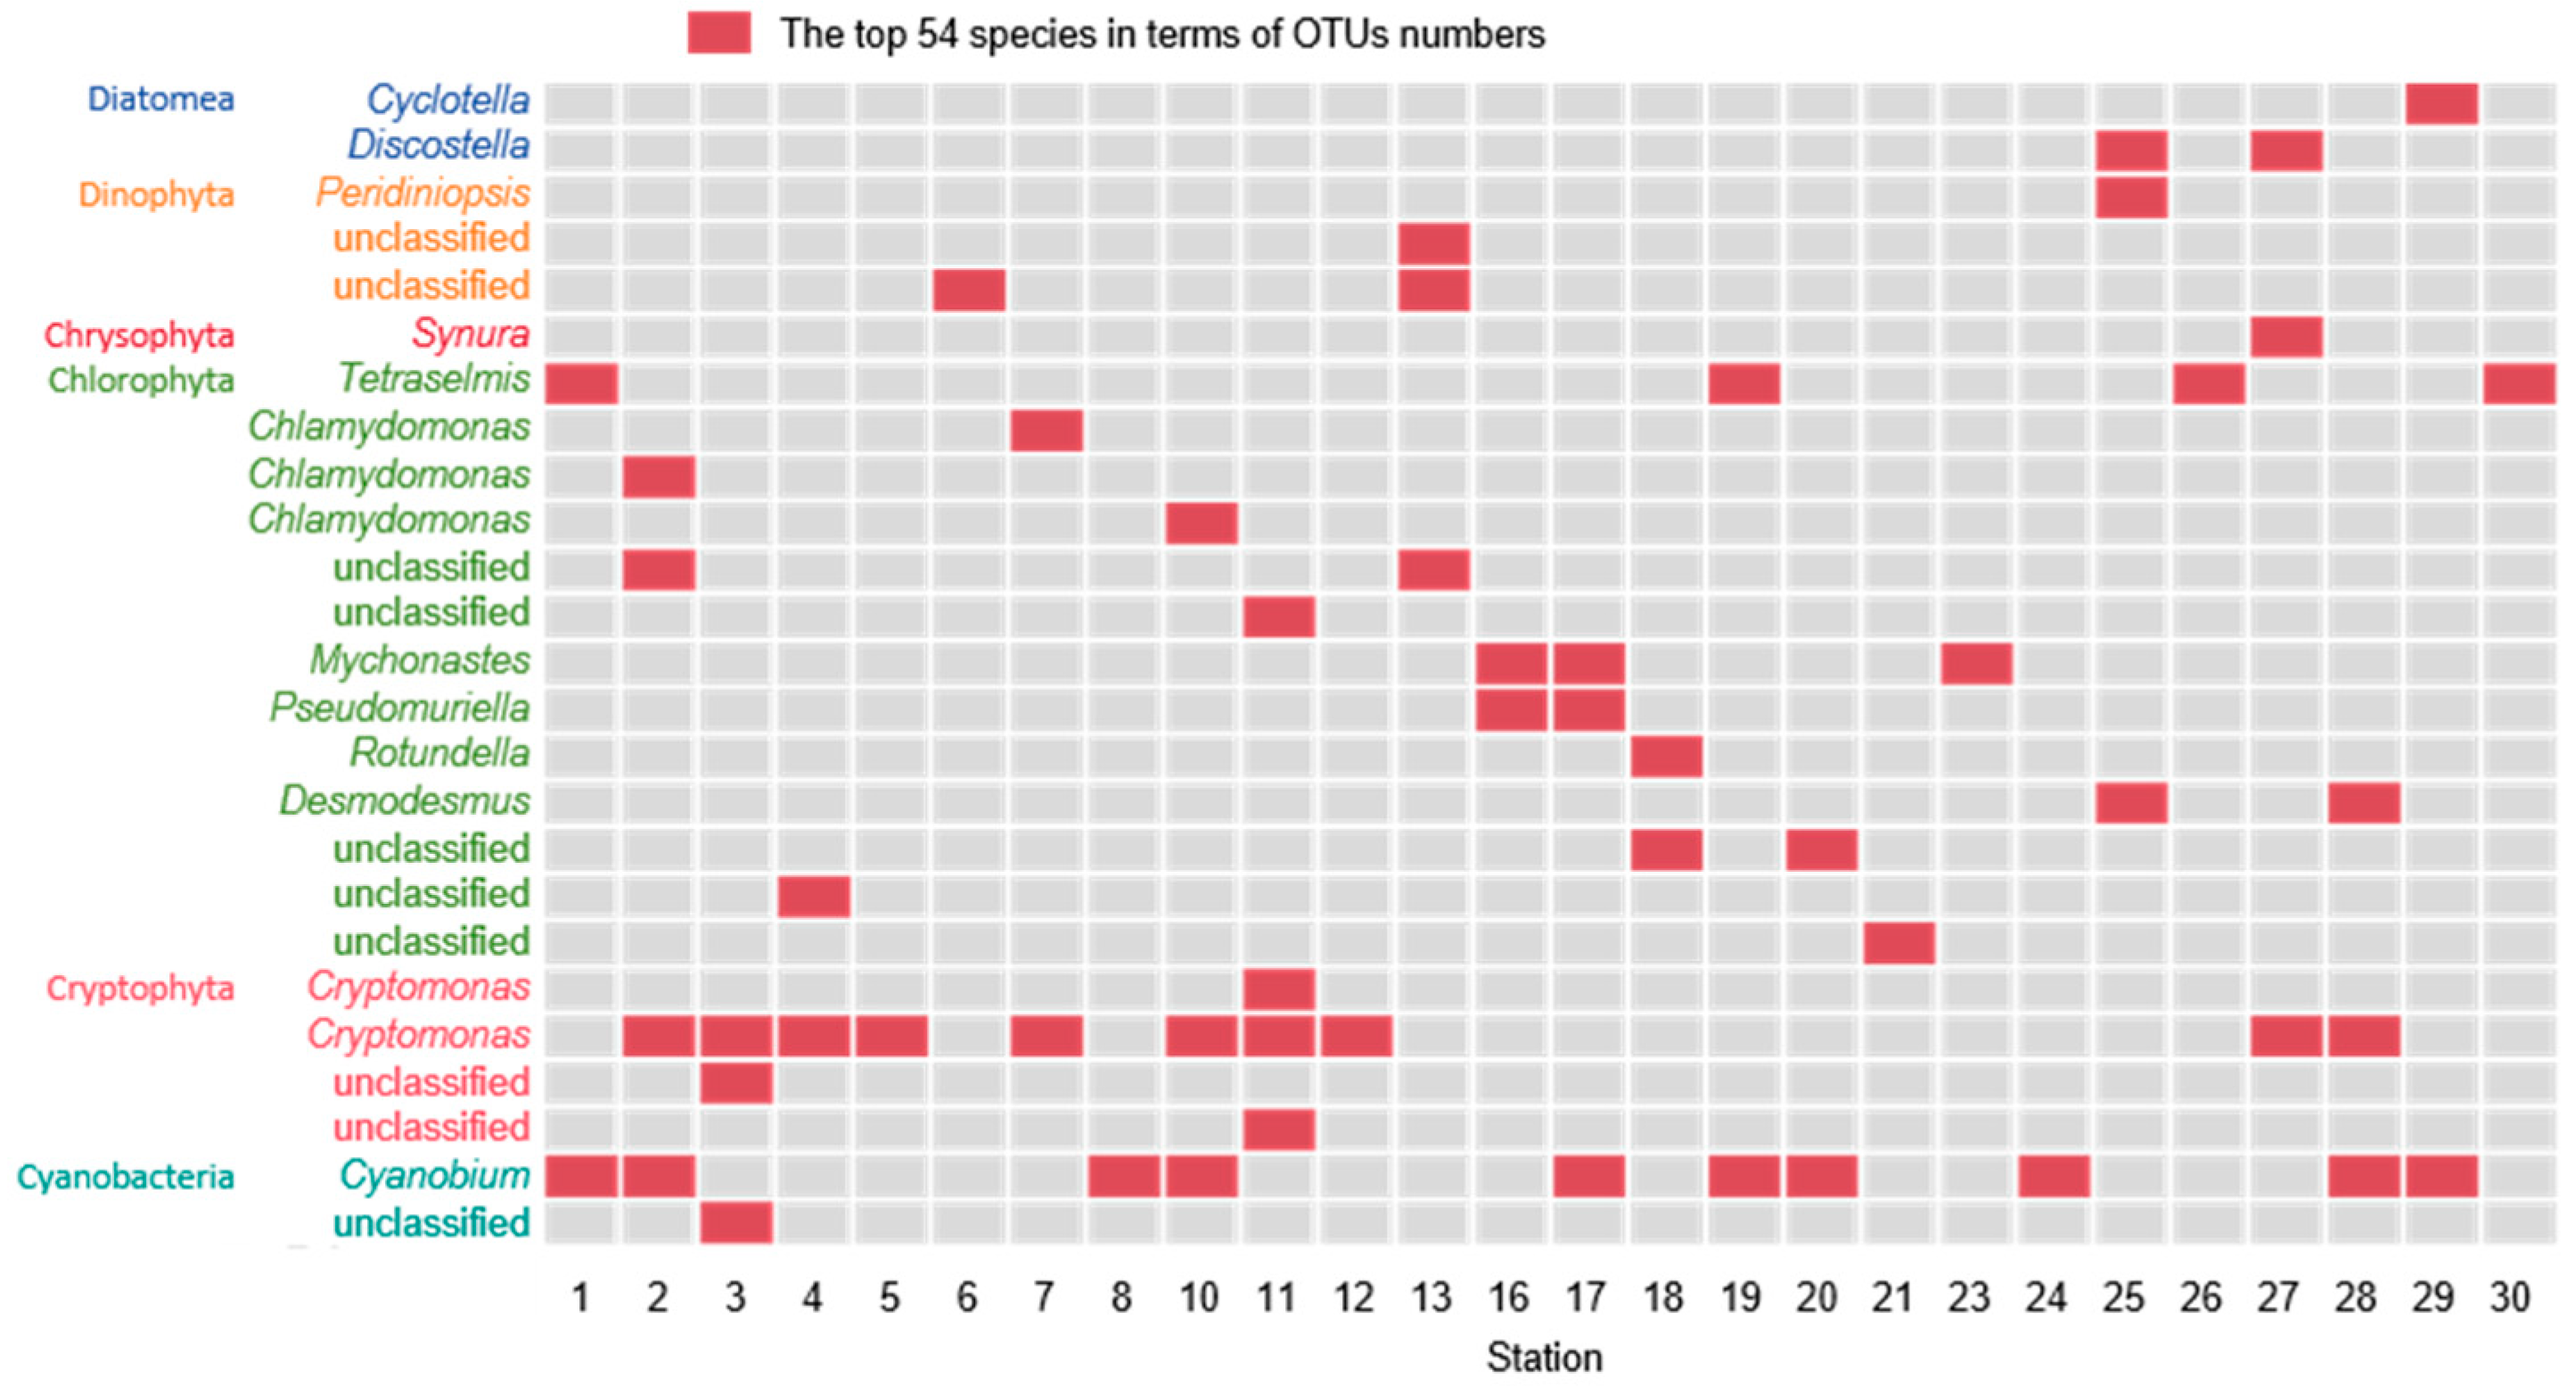
3.2. Molecular Biological Detection Result

We obtained 8642 and 7375 OTUs using 16S rDNA and 18S rDNA high-throughput sequencing, respectively. Of these, 1156 and 1552 for 16S rDNA and 18S rDNA, respectively, were matched to reference sequences in the gene bank. A total of 432 OTUs were annotated as phytoplankton, including Chlorophyta (152), Bacillariophyta (77), Dinophyta (64), Chrysophyta (46), Cyanobacteria (38), Cryptophyta (36), and Xanthophyceae (2). The species numbers of Chlorophyta and Bacillariophyta were higher than those of the others, at 34% and 17% of the total number, respectively (Figure 4). However, only partial phytoplankton genetic sequences were available and registered in the databases, and only 148 OTUs were identified at the species level.
Based on OTU counts, the relative abundance of each phylum was calculated. Chlorophyta (46%) dominated, followed by Cryptophyta (20%), Cyanobacteria (16%), Bacillariophyta (7%), Dinophyta (6%), Chrysophyta (3%), and Xanthophyceae (<1%).
The relative abundance of each species at 33 stations was determined. To maintain a comparison with the microscopy methods, the top 54 relative abundance data are listed (Figure 5). There were 25 species at 26 stations, including 13 species of Chlorophyta, 4 species of Cryptophyta, 3 species of Dinophyta, 2 species of Bacillariophyta, 2 species of Cyanobacteria, and 1 species of Chrysophyta.
In addition to phytoplankton, other organisms were noted, including bacteria and fungi, which are difficult to detect using a single microscopic method. In total, 2220 OTUs were annotated, including 519 species of aquatic animals, 44 species of aquatic macrophytes, and 1657 species of bacteria and fungi.

3.3. Comparison of the Microscopy and Molecular Biological Results

The number of phyla detected by both microscopy and the molecular biological method was seven (Table 1). Chlorophyta, Bacillariophyta, Cyanobacteria, Cryptophyta, Dinophyta, and Chrysophyta were the common phyla detected by these two methods. In addition, Xanthophyceae were detected by microscopy, and Eugleno were detected by the molecular biological method. A total of 230 species were observed by microscopy, and all of these were identified to certain species. Compared with this, 432 OTUs were confirmed as phytoplankton using the molecular biological method, and 148 were identified to certain species. According to the microscopy result, the species numbers of Bacillariophyta (103) was the most, and Chlorophyta (74) was the second. Through the molecular biological method, the species numbers of Chlorophyta (152) and Bacillariophyta (77) were the most. The top two algae species in terms of species number detected by the two methods were the same and differed in ranking.

4. Discussion

4.1. Identification of Phytoplankton Species

Optical microscopy remains the most direct and reliable method to classify phytoplankton based on their morphology and other characteristics. Optical microscopy is the basis for new species classification and for testing the validity of other determination methods [47], such as HPLC pigment [48], qPCR [49,50], and machine learning and automatic identification based on morphological photographs obtained using microscopy [51]. In this study, the characteristics of phytoplankton communities were studied by comparing the results of microscopic and molecular biological sequencing.
Historically, microscopy has enabled researchers to study phytoplankton community structures in freshwater, estuaries, and marine ecosystems [52]. In earlier estuarine studies, phytoplankton community characteristics were studied using chlorophyll values, and the dominant species were identified using morphological methods [53]. Based on numerous studies [20,54,55], Tomas et al. [19] compared phytoplankton characteristics in books, which are key references for phytoplankton identification. In the Changjiang Estuary and adjacent areas, 330 phytoplankton species were identified using microscopy during three surveys [35]. However, shortcomings in microscopy have been identified in studies, such as difficulty in identifying small cells, few morphologically characteristic species, and heavy reliance on the experience and knowledge of the investigators.
In recent years, analysis methods based on molecular marker amplification and sequencing have been widely applied in aquatic biological monitoring [56,57]. Bombin et al. [58] used environmental DNA macrobarcoding technology to elucidate algal diversity in the northern Gulf of Mexico based on partial LSU rDNA and 23S rDNA plasmid molecular markers. Biological diversity in the Pearl River, South China Sea Continuum, was analyzed using the V4 region of the 18S rRNA gene [59]. Of the 341 species that frequently cause algal blooms, 244 have 18S rDNA sequences recorded in NCBI [60]. These 18S rDNA sequences are full-length or near-full-length (1,000–1,800 bp) and have been supported by published literature. Owing to the lack of rDNA information, gene sequencing analysis methods cannot be used to track and analyze the entire biological composition of water bodies. However, other molecular markers, such as the 28S rDNA, ITS, rbcL, and CO1 sequences, are lower than the 18S rDNA sequences. The 18S gene sequence covers the most common algal species and is still a commonly used fragment. Cyanobacteria are the only known prokaryotes capable of oxygenated photosynthesis, and Cyanobacteria are usually detected with 16S [61].
In the study area, 230 phytoplankton species across 73 genera, belonging to Bacillariophyta (103 species), Chlorophyta (74), Euglenophyta (29), Cyanobacteria (17), Cryptophyta (4), Dinophyta (2), and Chrysophyta (1), were identified using microscopy. According to the HTS results, 8,642 prokaryotic (16S rDNA) and 7,375 eukaryotic (18S rDNA) OTUs were generated, with 432 OTUs classified as phytoplankton, including Chlorophyta (152), Bacillariophyta (77), Dinophyta (64), Chrysophyta (46), Cyanobacteria (38), Cryptophyta (36), and Xanthophyceae (2). In both detection methods, Bacillariophyta and Chlorophyta were the most abundant. However, the sequencing method detected more species than microscopy for all phyla apart from Bacillariophyta and Euglenophyta. These results agree with those of previous studies, showing that sequencing can detect species that microscopy cannot [62]. For example, a study in 2019 detected 131 species that can cause blooms in the coastal waters of China using metabarcoding dissection on samples collected from only four voyages [63,64,65,66]. This was over half of the total number detected using morphological methods over several decades, and included 10 new species [67]. These findings demonstrate the accuracy and sensitivity of the molecular sequencing analysis.
In addition to phytoplankton, other environmental organisms, such as bacteria and fungi, were detected. This provides abundant organism data for biodiversity and community characteristic analyses. However, limitations remain, such as in determining the vital signs of an organism and the dependence on the integrity of the molecular marker database.

4.2. Species Abundance Counting

Methods for calculating the total biomass of phytoplankton include microscopy, optical density, FlowCAM counting, flow cytometry, the chlorophyll a method, and molecular biology. Many researchers have explored the feasibility of different counting methods to measure the biomass of certain types of microalgae, with the microscopic detection method remaining the most accurate and reliable method [68,69,70]. In 1931, the Utermöhl counting method was invented based on a combination of Volk’s stationary precipitation method and Kolkwitz’s counting box [15]. In 1958, Utermöhl normalized the observation area of a count frame [10]. In 1978, the United Nations Educational, Scientific, and Cultural Organization (UNESCO) codified the Utermöhl count in the Phytoplankton Handbook, which has become a widely used phytoplankton measurement method [16] and was referenced in this study to count the cell abundance of the 230 detected phytoplankton species. Although the microscopic method is subject to cell depletion during the addition of preservation reagents and storage, it is still relatively close to the actual number compared to other methods [18].
Although molecular sequencing has advantages in species diversity detection compared to microscopy methods, it is difficult to count the number of organisms in the environment. Molecular sequencing calculates the relative abundance of a species by counting the OTU number of each species and converting it into a proportion of each species [71].
In our results, the most abundant groups by OTU proportion were Chlorophyta (46%), Cryptophyta (20%), and Cyanobacteria (16%). These differed from microscopy, where Chlorophyta (60%), Cyanobacteria (18%), and Bacillariophyta (13%) dominated. As can be seen, the molecular sequencing results were not completely consistent with those of microscopy; however, the relative abundance of species with higher proportions was a valuable reference. Many studies have analyzed community structure, species composition, and biodiversity using molecular sequencing methods [29,72]. For example, in Skagerrak, seasonal variations in phytoplankton composition and relative abundance were revealed by amplifying the V4 region of the 18S rRNA gene combined with microscopic biovolumes [71]. It was also found that these universal molecular markers often exist in multiple copies in the genome, and the copy number is diverse in different species. The OTU proportions of these molecular markers may differ from the phytoplankton cell abundance. Cell abundance cannot be determined by this alone and can be used as a supplementary analysis for microscopic statistics.

4.3. Phytoplankton Characteristics in the Study Area

The microscopic detection and molecular sequencing data were not completely consistent with the composition of biological communities, including species identification and phytoplankton cell abundance. Microscopic detection methods have limited particle size and morphological resolution, and the number of species detected is not as high as that detected by molecular sequencing. With the sequencing method, it was difficult to determine cell abundance. There are few molecular data for some species for reference, making it difficult to identify them at the species level. Therefore, the phytoplankton community characteristics in the studied waters were mainly based on microscopic detection results, and sequencing results were used for supplementary biodiversity analysis.
In the microscopy and sequencing results, Bacillariophyta and Chlorophyta species were the most abundant. The cell abundances of two Bacillariophyta and 12 Chlorophyta species exceeded 106 cells/L at several stations. As one of the most widely distributed species in water systems, Chlorella vulgaris was the only species observed at all 30 stations and had an abundance of more than 106 cells/L at 16 stations. This species is often used in aquatic ecological restoration and aquaculture feed, but ecological disasters caused by its high abundance have rarely been reported [73,74]. The numbers of Cryptophyta and Cyanobacteria species detected using microscopy were lower than those of Bacillariophyta and Chlorophyta, but they were still highly abundant. Four Cryptophyta species were observed, and the abundance of three species at one station was >106 cells/L. This indicates that the biodiversity of Cryptophyta was not the highest, but the cell density could reach a high level.
It is important to note that 17 species of cyanobacteria were detected, and the abundance of seven species exceeded 107 cells/L across 11 stations. Many cyanobacterial species produce natural compounds (cyanobacterial toxins) that are toxic to other organisms, including mammals. These compounds exhibit a wide range of toxicities, including hepatotoxicity, nephrotoxicity, neurotoxicity, and dermal toxicity. High cyanobacterial abundance causes ecological disasters, resulting in the death of aquatic animals and even threatening human health and safety. The cyanobacterial species with a cell abundance of more than 106 cells/L were Oscillatoria boryana, Phormidium acuminatum, Oscillatoria granulata, Kamptonema chlorinum, Pseudoanabaena sp., Merismopedia tenuissima, and Microcystis sp.
Microcystis can produce microcystin phycotoxins and is distributed on all continents except Antarctica [75]. Microcystis blooms have been recorded in at least 108 countries, while hepatotoxic microcystins have been reported in 79 countries [76]. Microcystin homologs can be produced by Microcystis, and long-term exposure to low microcystin concentrations is harmful to human health, such as worsening nonalcoholic fatty liver disease [77]. On 1 August 2014, the excessive level of algal toxins in Lake Erie caused the drinking water supply to be cut off in the city of Toledo and was considered to be associated with a Microcystis bloom. Therefore, the high cell abundance of cyanobacteria should be given special attention, especially for species that have been identified as producing toxins.

5. Conclusions

This study compared traditional microscopy and multiprimer high-throughput sequencing for analyzing phytoplankton communities in rivers flowing into the sea in eastern China. Microscopy identified 230 phytoplankton species, mainly Bacillariophyta (45%) and Chlorophyta (32%). In contrast, high-throughput sequencing detected 432 phytoplankton OTUs, including Cryptophyta and Xanthophyta, not detected via microscopy. However, only 34% of the OTUs were annotated to the species level, reflecting the insufficiency of the current gene database for phytoplankton. The results of the two methods were consistent with the characteristics of phylum composition, but there were differences in species composition. Microscopic examination was more suitable for the quantitative monitoring of dominant algal species, whereas high-throughput sequencing revealed higher levels of biodiversity, especially for the detection of low-abundance species. Together, these findings suggest that, in the study of phytoplankton, combining both methods offers a more comprehensive approach to obtain more diverse phytoplankton groups and accurate algal density data.

Author Contributions

X.H.: conceptualization, methodology, formal analysis, visualization, writing—original draft, and writing—review and editing. Y.L. (Yunlong Liu): data curation. R.W.: investigation. Z.D.: investigation. K.L.: data curation. S.L.: data curation. Y.L. (Yuchen Liu): investigation. W.L.: data curation. L.L.: supervision and writing—review and editing. All authors have read and agreed to the published version of the manuscript.

Funding

This study was supported by the Fundamental Research Funds for the Central Public-interest Scientific Institution (Grant number 2023YSKY-11) and the National Natural Science Foundation of China (Grant number 42107422).

Data Availability Statement

The raw data supporting the conclusions of this article will be made available by the authors on request.

Conflicts of Interest

The authors declare no conflicts of interest.

References

  1. Litchman, E.; Klausmeier, C.A.; Dyhrman, S.T. Trait-Based Community Ecology of Phytoplankton. Annu. Rev. Ecol. Evol. Syst. 2008, 39, 615–639. [Google Scholar] [CrossRef]
  2. Field, C.B.; Behrenfeld, M.J.; Randerson, J.T.; Falkowski, P. Primary production of the biosphere: Integrating terrestrial and oceanic components. Science 1998, 281, 237–240. [Google Scholar] [CrossRef] [PubMed]
  3. Tréguer, P.; Bowler, C.; Moriceau, B.; Dutkiewicz, S.; Gehlen, M.; Aumont, O.; Bittner, L.; Dugdale, R.; Finkel, Z.; Iudicone, D.; et al. The world ocean silica cycle. Annu. Rev. Mar. Sci. 2013, 5, 477–501. [Google Scholar] [CrossRef] [PubMed]
  4. Glibert, P.M. Harmful algal blooms and eutrophication: “Strategies” for nutrient uptake and growth outside the Redfield comfort zone. Chin. J. Oceanol. Limnol. 2011, 29, 724–738. [Google Scholar] [CrossRef]
  5. Wright, S.W.; Shearer, J.D. Rapid extraction and high-performance liquid chromatography of chlorophylls and carotenoids from marine phytoplankton. J. Chromatogr. A 1984, 294, 281–295. [Google Scholar] [CrossRef]
  6. Zapata, M.; Rodríguez, F.; Garrido, J.L. Separation of chlorophylls and carotenoids from marine phytoplankton—A new HPLC method using a reversed phase C8 column and pyridine-containing mobile phases. Mar. Ecol. Prog. Ser. 2000, 195, 29–45. [Google Scholar] [CrossRef]
  7. Chisholm, S.W.; Olson, R.J.; Zettler, E.R.; Goericke, R.; Waterbury, J.B.; Welschmeyer, N.A. A novel free-living prochlorophyte abundant in the oceanic euphotic zone. Nature 1988, 334, 340–343. [Google Scholar] [CrossRef]
  8. Faria, D.G.; Lee, M.D.; Lee, J.B.; Lee, J.; Chang, M.; Youn, S.H.; Suh, Y.S.; Ki, J.S. Molecular diversity of phytoplankton in the East China Sea around Jeju Island (Korea), unraveled by pyrosequencing. J. Oceanogr. 2014, 70, 11–23. [Google Scholar] [CrossRef]
  9. Hu, X.K.; Lin, Z.R.; Zhang, Q.C.; Kong, F.Z.; Cen, J.Y.; Zeng, Y.L.; Yu, R.C. Detection of bloom-forming dinoflagellates Karenia mikimotoi and Prorocentrum donghaiense using qPCR assays. J. Appl. Phycol. 2022, 34, 1483–1496. [Google Scholar] [CrossRef]
  10. Andersen, P.; Throndsen, J. Estimating cell numbers. In Manual on Harmful Marine Microalgae; Hallegraeff, G.M., Anderson, D.M., Cembella, A.D., Eds.; UNESCO: Paris, France, 2004. [Google Scholar]
  11. Utermöhl, H. Zur Vervollkommnung der quantitativen Phytoplankton-Methodik. Mitt. Int. Ver. Theor. Angew. Limnol. 1958, 9, 1–38. [Google Scholar] [CrossRef]
  12. Lohmann, H. Über das Nannoplankton und die Zentrifugierung kleinster Wasserproben zur Gewinnung desselben in lebendem Zustande. Int. Rev. Ges. Hydrobiol. 1911, 4, 1–38. [Google Scholar] [CrossRef]
  13. Johnson, P.W.; Sieburth, J.M. Chroococcoid cyanobacteria in the sea: A ubiquitous and diverse phototrophic biomass. Limnol. Oceanogr. 1979, 24, 928–935. [Google Scholar] [CrossRef]
  14. Waterbury, J.B.; Watson, S.W.; Guillard, R.R.L.; Brand, L.E. Widespread occurrence of a unicellular, marine, planktonic, cyanobacterium. Nature 1979, 277, 293–294. [Google Scholar] [CrossRef]
  15. Utermöhl, H. Neue Wege in der quantitativen Erfassung des Planktons (mit besonderer Berücksichtigung des Ultraplanktons). Verh. Int. Ver. Theor. Angew. Limnol. 1931, 5, 567–596. [Google Scholar] [CrossRef]
  16. Sournia, A. Phytoplankton Manual; UNESCO: Paris, France, 1978. [Google Scholar]
  17. Hasle, G. Counting phytoplankton cells. In Phytoplankton Manual; Sournia, A., Ed.; UNESCO: Paris, France, 1978. [Google Scholar]
  18. Karlson, B.; Cusack, C.; Bresnan, E. Microscopic and Molecular Methods for Quantitative Phytoplankton Analysis; UNESCO: Paris, France, 2010. [Google Scholar]
  19. Tomas, C. Identifying Marine Phytoplankton; Academic Press: San Diego, CA, USA, 1997. [Google Scholar]
  20. Throndsen, J.; Hasle, G.; Tangen, K. Phytoplankton of Norwegian Coastal Waters; Almater Forlag AS: Oslo, Norway, 2007. [Google Scholar]
  21. Hansen, G.; Daugbjerg, N.; Henriksen, P. Comparative Study of Gymnodinium mikimotoi and Gymnodinium aureolum, comb. nov. (=Gyrodinium aureolum) Based on Morphology, Pigment Composition, and Molecular Data. J. Phycol. 2003, 36, 394–410. [Google Scholar] [CrossRef]
  22. Bergholtz, T.; Daugbjerg, N.; Moestrup, Ø.; Fernández-Tejedor, M. On the identity of Karlodinium veneficum and description of Karlodinium armiger sp. nov. (Dinophyceae). J. Phycol. 2005, 42, 170–193. [Google Scholar] [CrossRef]
  23. Lu, D.D.; Goebel, J.; Qi, Y.Z.; Zou, J.Z.; Han, X.T.; Gao, Y.H.; Li, Y.G. Morphological and genetic study of Prorocentrum donghaiense Lu from the East China sea, and comparison with some related Prorocentrum species. Harmful Algae 2005, 4, 493–505. [Google Scholar] [CrossRef]
  24. Luo, Z.H.; Wang, L.; Chan, L.L.; Lu, S.H.; Gu, H.F. Karlodinium zhouanum, a New dinoflagellate Species from China, and molecular phylogeny of Karenia digitata and Karenia longicanalis (Gymnodiniales, Dinophyceae). Phycologia 2018, 57, 401–412. [Google Scholar] [CrossRef]
  25. Shokralla, S.; Spall, J.L.; Gibson, J.F.; Hajibabaei, M. Next-generation sequencing technologies for environmental DNA research. Mol. Ecol. 2012, 21, 1794–1805. [Google Scholar] [CrossRef]
  26. Treusch, A.H.; Demir-Hilton, E.; Vergin, K.L.; Worden, A.Z.; Carlson, C.A.; Donatz, M.G.; Burton, R.M.; Giovannoni, S.J. Phytoplankton distribution patterns in the northwestern sargasso sea revealed by small subunit rRNA genes from plastids. ISME J. 2012, 6, 481–492. [Google Scholar] [CrossRef]
  27. Zhao, J.Y.; Geng, H.X.; Zhang, Q.C.; Li, Y.F.; Kong, F.Z.; Yan, T.; Zhou, M.J.; Yang, D.; Yuan, Y.; Yu, R.C. Green Tides in the Yellow Sea Promoted the Proliferation of Pelagophyte Aureococcus anophagefferens. Environ. Sci. Technol. 2022, 56, 3056–3064. [Google Scholar] [CrossRef] [PubMed]
  28. de Vargas, C.; Audic, S.; Henry, N.; Decelle, J.; Mahé, F.; Logares, R.; Lara, E.; Berney, C.; Le Bescot, N.; Probert, I.; et al. Ocean plankton. Eukaryotic plankton diversity in the sunlit ocean. Science 2015, 348, 1261605. [Google Scholar] [CrossRef]
  29. Moon-van der Staay, S.Y.; De Wachter, R.; Vaulot, D. Oceanic 18S rDNA sequences from picoplankton reveal unsuspected eukaryotic diversity. Nature 2001, 409, 607–610. [Google Scholar] [CrossRef] [PubMed]
  30. Potter, D.; Lajeunesse, T.C.; Saunders, G.W.; Anderson, R.A. Convergent evolution masks extensive biodiversity among marine coccoid picoplankton. Biodivers. Conserv. 1997, 6, 99–107. [Google Scholar] [CrossRef]
  31. Guillou, L.; Moon-Van Der Staay, S.Y.; Claustre, H.; Partensky, F.; Vaulot, D. Diversity and abundance of Bolidophyceae (Heterokonta) in two oceanic regions. Appl. Environ. Microbiol. 1999, 65, 4528–4536. [Google Scholar] [CrossRef]
  32. Rappé, M.S.; Suzuki, M.T.; Vergin, K.L.; Giovannoni, S.J. Phylogenetic diversity of ultraplankton plastid small-subunit rRNA genes recovered in environmental nucleic acid samples from the pacific and Atlantic Coasts of the United States. Appl. Environ. Microbiol. 1998, 64, 294–303. [Google Scholar] [CrossRef]
  33. Chen, Z.F.; Zhang, Q.C.; Kong, F.Z.; Liu, Y.; Zhao, Y.; Zhou, Z.X.; Geng, H.X.; Dai, L.; Zhou, M.J.; Yu, R.C. Resolving phytoplankton taxa based on high-throughput sequencing during Brown tides in the Bohai Sea, China. Harmful Algae 2019, 84, 127–138. [Google Scholar] [CrossRef]
  34. Jiang, Z.; Chen, J.; Zhou, F.; Shou, L.; Chen, Q.; Tao, B.; Yan, X.; Wang, K. Controlling factors of summer phytoplankton community in the Changjiang (Yangtze River) estuary and adjacent East China sea shelf. Contin. Shelf Res. 2015, 101, 71–84. [Google Scholar] [CrossRef]
  35. Li, J.L.; Zheng, B.H.; Liu, L.S.; Tang, J.L. Phytoplankton community structure in the Yangtze River estuary and its relation to environmental factors. Res. Environ. Sci. 2013, 26, 403–409. [Google Scholar]
  36. Lv, S.; Li, X.; Wang, R.; Wang, Y.; Dong, Z.; Zhou, T.; Liu, Y.; Lin, K.; Liu, L. Autochthonous sources and drought conditions drive anomalous oxygen-consuming pollution increase in a sluice-controlled reservoir in eastern China. Sci. Total Environ. 2022, 841, 156739. [Google Scholar] [CrossRef]
  37. Winnepenninckx, B.; Backeljau, T.; De Wachter, R. Extraction of high-molecular-weight DNA from mollusks. Trends Genet. 1993, 9, 407. [Google Scholar] [CrossRef] [PubMed]
  38. Lejzerowicz, F.; Esling, P.; Pillet, L.; Wilding, T.A.; Black, K.D.; Pawlowski, J. High-throughput sequencing and morphology perform equally well for benthic monitoring of marine ecosystems. Sci. Rep. 2015, 5, 13932. [Google Scholar] [CrossRef] [PubMed]
  39. Stoeck, T.; Bass, D.; Nebel, M.; Christen, R.; Jones, M.D.M.; Breiner, H.W.; Richards, T.A. Multiple marker parallel tag environmental DNA sequencing reveals a highly complex eukaryotic community in marine anoxic water. Mol. Ecol. 2010, 19 (Suppl. S1), 21–31. [Google Scholar] [CrossRef]
  40. Wu, C.; Narale, D.D.; Cui, Z.; Wang, X.; Liu, H.; Xu, W.; Zhang, G.; Sun, J. Diversity, structure, and distribution of bacterioplankton and diazotroph communities in the Bay of Bengal during the winter monsoon. Front. Microbiol. 2022, 13, 987462. [Google Scholar] [CrossRef]
  41. Mori, H.; Maruyama, F.; Kato, H.; Toyoda, A.; Dozono, A.; Ohtsubo, Y.; Nagata, Y.; Fujiyama, A.; Tsuda, M.; Kurokawa, K. Design and experimental application of a novel non-degenerate universal primer set that amplifies prokaryotic 16S rRNA genes with a low possibility to amplify eukaryotic rRNA genes. DNA Res. 2014, 21, 217–227. [Google Scholar] [CrossRef] [PubMed]
  42. Quast, C.; Pruesse, E.; Yilmaz, P.; Gerken, J.; Schweer, T.; Yarza, P.; Peplies, J.; Glöckner, F.O. The SILVA ribosomal RNA gene database project: Improved data processing and web-based tools. Nucleic Acids Res. 2013, 41, D590–D596. [Google Scholar] [CrossRef]
  43. Kõljalg, U.; Larsson, K.H.; Abarenkov, K.; Nilsson, R.H.; Alexander, I.J.; Eberhardt, U.; Erland, S.; Høiland, K.; Kjøller, R.; Larsson, E.; et al. UNITE: A database providing web-based methods for the molecular identification of ectomycorrhizal fungi. New Phytol. 2005, 166, 1063–1068. [Google Scholar] [CrossRef]
  44. DeSantis, T.Z.; Hugenholtz, P.; Larsen, N.; Rojas, M.; Brodie, E.L.; Keller, K.; Huber, T.; Dalevi, D.; Hu, P.; Andersen, G.L. Greengenes, a chimera-checked 16S rRNA gene database and workbench compatible with ARB. Appl. Environ. Microbiol. 2006, 72, 5069–5072. [Google Scholar] [CrossRef]
  45. Fish, J.A.; Chai, B.; Wang, Q.; Sun, Y.; Brown, C.T.; Tiedje, J.M.; Cole, J.R. FunGene: The functional gene pipeline and repository. Front. Microbiol. 2013, 4, 291. [Google Scholar] [CrossRef]
  46. Öpik, M.; Vanatoa, A.; Vanatoa, E.; Moora, M.; Davison, J.; Kalwij, J.M.; Reier, U.; Zobel, M. The online database MaarjAM reveals global and ecosystemic distribution patterns in arbuscular mycorrhizal fungi (Glomeromycota). New Phytol. 2010, 188, 223–241. [Google Scholar] [CrossRef]
  47. Fraga, S.; Penna, A.; Bianconi, I.; Paz, B.; Zapata, M. Coolia canariensis sp. nov. (Dinophyceae), a New Nontoxic Epiphytic Benthic dinoflagellate from the Canary Islands. J. Phycol. 2008, 44, 1060–1070. [Google Scholar] [CrossRef] [PubMed]
  48. Lee, M.; Won, N.I.; Baek, S.H. Comparison of HPLC pigment analysis and microscopy in phytoplankton assessment in the Seomjin River estuary, Korea. Sustainability 2020, 12, 6880. [Google Scholar] [CrossRef]
  49. Kavanagh, S.; Brennan, C.; O’Connor, L.; Moran, S.; Salas, R.; Lyons, J.; Silke, J.; Maher, M. Real-time PCR detection of Dinophysis species in Irish coastal waters. Mar Biotechnol. 2010, 12, 534–542. [Google Scholar] [CrossRef]
  50. Barkallah, M.; Elleuch, J.; Smith, K.F.; Chaari, S.; Ben Neila, I.B.; Fendri, I.; Michaud, P.; Abdelkafi, S. Development and application of a real-time PCR assay for the sensitive detection of diarrheic toxin producer Prorocentrum lima. J. Microbiol. Methods 2020, 178, 106081. [Google Scholar] [CrossRef]
  51. Yadav, D.P.; Jalal, A.S.; Garlapati, D.; Hossain, K.; Goyal, A.; Pant, G.; Learning-Based, D. Deep learning-based ResNeXt model in phycological studies for future. Algal Res. 2020, 50, 102018. [Google Scholar] [CrossRef]
  52. Muylaert, K.; Sabbe, K.; Vyverman, W. Spatial and temporal dynamics of phytoplankton communities in a freshwater tidal estuary (Schelde, Belgium). Estuar. Coast. Shelf Sci. 2000, 50, 673–687. [Google Scholar] [CrossRef]
  53. Schuchardt, B.; Schirmer, M. Phytoplankton maxima in the tidal freshwater reaches of two coastal plain estuaries. Estuar. Coast. Shelf Sci. 1991, 32, 187–206. [Google Scholar] [CrossRef]
  54. Horner, R. A Taxonomic Guide to Some Common Marine Phytoplankton; Biopress: Bristol, UK, 2002. [Google Scholar]
  55. Throndsen, J.; Hasle, G.R.; Tangen, K. Norsk Kystplanktonflora; Almater Forlag AS: Oslo, Norway, 2003. [Google Scholar]
  56. Baird, D.J.; Hajibabaei, M. Biomonitoring 2.0: A new paradigm in ecosystem assessment made possible by next-generation DNA sequencing. Mol. Ecol. 2012, 21, 2039–2044. [Google Scholar] [CrossRef]
  57. Miyata, K.; Inoue, Y.; Amano, Y.; Nishioka, T.; Nagaike, T.; Kawaguchi, T.; Morita, O.; Yamane, M.; Honda, H. Comparative environmental RNA and DNA metabarcoding analysis of river algae and arthropods for ecological surveys and water quality assessment. Sci. Rep. 2022, 12, 19828. [Google Scholar] [CrossRef]
  58. Bombin, S.; Wysor, B.; Lopez-Bautista, J.M. Assessment of littoral algal diversity from the northern Gulf of Mexico using environmental DNA metabarcoding. J. Phycol. 2021, 57, 269–278. [Google Scholar] [CrossRef]
  59. Wu, W.; Liu, H. Disentangling protist communities identified from DNA and RNA surveys in the Pearl River–South China sea Continuum during the wet and dry seasons. Mol. Ecol. 2018, 27, 4627–4640. [Google Scholar] [CrossRef] [PubMed]
  60. Chen, N.; Chen, Y. Advances in the study of biodiversity of phytoplankton and red tide species in China (II): The East China Sea. Oceanol. Limnol. Sin 2021, 52, 363–384. [Google Scholar]
  61. Wanigatunge, R.P.; Magana-Arachchi, D.N.; Chandrasekharan, N.V.; Kulasooriya, S.A. Genetic diversity and molecular phylogeny of cyanobacteria from Sri Lanka based on 16S rRNA gene. Environ. Eng. Res. 2014, 19, 317–329. [Google Scholar] [CrossRef]
  62. Bilbao, J.; Pavloudi, C.; Blanco-Rayón, E.; Franco, J.; Madariaga, I.; Seoane, S. Phytoplankton community composition in relation to environmental variability in the Urdaibai estuary (SE Bay of Biscay): Microscopy and eDNA metabarcoding. Mar. Environ. Res. 2023, 191, 106175. [Google Scholar] [CrossRef] [PubMed]
  63. Chen, Y.; Xu, Q.; Gibson, K.; Chen, N. Metabarcoding dissection of harmful algal bloom species in the East China sea off Southern Zhejiang Province in late spring. Mar. Pollut. Bull. 2021, 169, 112586. [Google Scholar] [CrossRef] [PubMed]
  64. Cui, Z.; Xu, Q.; Gibson, K.; Liu, S.; Chen, N. Metabarcoding analysis of harmful algal bloom species in the Changjiang estuary, China. Sci. Total Environ. 2021, 782, 146823. [Google Scholar] [CrossRef]
  65. Huang, H.; Xu, Q.; Gibson, K.; Chen, Y.; Chen, N. Molecular characterization of harmful algal blooms in the Bohai Sea using metabarcoding analysis. Harmful Algae 2021, 106, 102066. [Google Scholar] [CrossRef]
  66. Liu, S.; Gibson, K.; Cui, Z.; Chen, Y.; Sun, X.; Chen, N. Metabarcoding analysis of harmful algal species in Jiaozhou Bay. Harmful Algae 2020, 92, 101772. [Google Scholar] [CrossRef]
  67. Chen, N.S.; Zhang, M.J.; Liu, S.M.; Cui, Z.M. Diversity of HAB species in coastal regions of China. Oceanol. Limnol. Sin. 2023, 54, 599–624. [Google Scholar]
  68. Welschmeyer, N.A. Fluorometric analysis of chlorophyll a in the presence of chlorophyll b and Pheopigments. Limnol. Oceanogr. 1994, 39, 1985–1992. [Google Scholar] [CrossRef]
  69. Asai, R.; Matsukawa, R.; Ikebukuro, K.; Karube, I. Highly Sensitive chemiluminescence Flow-Injection Detection of the Red Tide Phytoplankton Heterosigma carterae. Anal. Chim. Acta 1999, 390, 237–244. [Google Scholar] [CrossRef]
  70. Cai, Q.; Li, R.; Zhen, Y.; Mi, T.; Yu, Z. Detection of two Prorocentrum species using sandwich hybridization integrated with nuclease protection assay. Harmful Algae 2006, 5, 300–309. [Google Scholar] [CrossRef]
  71. Gran-Stadniczeñko, S.; Egge, E.; Hostyeva, V.; Logares, R.; Eikrem, W.; Edvardsen, B. Protist diversity and seasonal dynamics in Skagerrak plankton communities as revealed by metabarcoding and microscopy. J. Eukaryot. Microbiol. 2019, 66, 494–513. [Google Scholar] [CrossRef] [PubMed]
  72. Qiao, L.; Chang, Z.; Li, J.; Chen, Z.; Yang, L.; Luo, Q. Phytoplankton Community Structure and Diversity in the Indoor Industrial Aquaculture System for litopenaeus vannamei Revealed by High-Throughput Sequencing and Morphological Identification. Aquac. Res. 2019, 50, 2563–2576. [Google Scholar] [CrossRef]
  73. Lim, S.L.; Chu, W.L.; Phang, S.M. Use of Chlorella vulgaris for bioremediation of textile wastewater. Bioresour. Technol. 2010, 101, 7314–7322. [Google Scholar] [CrossRef]
  74. Cunha, A.E.P.; Sátiro, J.R.; Escobar, B.P.; Simões, R.M.S. Chlorella vulgaris growth, pigment and lipid accumulation: Effect of progressive light and hydrogen peroxide exposure. J. Chem. Technol. Biotechnol. 2023, 98, 442–450. [Google Scholar] [CrossRef]
  75. Zurawell, R.W.; Chen, H.; Burke, J.M.; Prepas, E.E. Hepatotoxic cyanobacteria: A review of the biological importance of microcystins in freshwater environments. J. Toxicol. Environ. Health Part B Crit. Rev. 2005, 8, 1–37. [Google Scholar] [CrossRef] [PubMed]
  76. Harke, M.J.; Steffen, M.M.; Gobler, C.J.; Otten, T.G.; Wilhelm, S.W.; Wood, S.A.; Paerl, H.W. A review of the global ecology, genomics, and biogeography of the toxic cyanobacterium, Microcystis spp. Harmful Algae 2016, 54, 4–20. [Google Scholar] [CrossRef]
  77. Sarkar, S.; Alhasson, F.; Kimono, D.; Albadrani, M.; Seth, R.K.; Xiao, S.; Porter, D.E.; Scott, G.I.; Brooks, B.; Nagarkatti, M.; et al. Microcystin exposure worsens nonalcoholic fatty liver disease associated ectopic glomerular toxicity via NOX-2-MIR21 axis. Environ. Toxicol. Pharmacol. 2020, 82, 103563. [Google Scholar] [CrossRef]
Figure 1. Study area and sampling sites.
Water 17 01559 g001
Figure 2. Species number proportion of microscope detection results.
Water 17 01559 g002
Figure 3. Phytoplankton species with cell abundance over 106 cells/L and the sampling stations.
Water 17 01559 g003
Figure 4. Gene sequencing results: (A) species number proportion and (B) OTU quantity proportion of each phylum.
Water 17 01559 g004
Figure 5. Top 54 species in terms of OTU numbers and station.
Water 17 01559 g005
Table 1. Comparison of the phyla/genera identified by microscopy and molecular biological method.
MicroscopyMolecular Biological
Phyla number77
Identified genera number7338
Species number230432 OTUs
Identified species number230148
Cell number countingYesRelative abundance
Disclaimer/Publisher’s Note: The statements, opinions and data contained in all publications are solely those of the individual author(s) and contributor(s) and not of MDPI and/or the editor(s). MDPI and/or the editor(s) disclaim responsibility for any injury to people or property resulting from any ideas, methods, instructions or products referred to in the content.

