Article

Hydrological Benefits of Green Roof Retrofitting Policies: A Case Study of an Urban Watershed in Brazil

by
Thiago Masaharu Osawa
1,*,
Fábio Ferreira Nogueira
1,
Stephanie Caroline Machado Gonzaga
1,
Fernando Garcia Silva
2,
Sabrina Domingues Miranda
1,
Brenda Chaves Coelho Leite
2 and
José Rodolfo Scarati Martins
1
1
Department of Hydraulic and Environmental Engineering, University of Sao Paulo, Professor Almeida Prado Ave., 83 Jardim Universidade, Sao Paulo 05508-070, SP, Brazil
2
Department of Civil Construction Engineering, University of Sao Paulo, Professor Almeida Prado Ave., 83 Jardim Universidade, Sao Paulo 05508-070, SP, Brazil
*
Author to whom correspondence should be addressed.
Water 2025, 17(13), 1936; https://doi.org/10.3390/w17131936 (registering DOI)
Submission received: 17 April 2025 / Revised: 16 June 2025 / Accepted: 19 June 2025 / Published: 28 June 2025

Abstract

Green roofs (GRs) are emerging as effective tools for mitigating urban runoff, particularly in cities facing challenges related to increased impervious surfaces and flooding risks. This study evaluates the potential hydrological performance of GR retrofitting in São José dos Campos, Brazil, based on municipal legislation, focusing on the effects of reducing the Effective Impervious Area (EIA) in urban watersheds. Using a range of projected EIA reduction scenarios (Mandatory, Incentivized, and Ideal), this study compares key hydrological indicators such as peak flow attenuation, runoff volume reduction, and hydrograph delay during rainfall events with different return periods. The results show that retrofitting with GRs significantly attenuates peak flows and delays runoff, with the ‘Ideal’ scenario (EIA = 16%) achieving peak flow reductions of up to 41% and runoff volume reductions of 35%. However, the effectiveness of GRs diminishes for high-intensity rainfall events, suggesting that GRs are most effective for frequent, low-intensity storms. These findings demonstrate the potential of GRs in reducing flooding risks in urban environments, highlighting the importance of integrating GRs into broader sustainable drainage systems. This study further emphasizes that while financial support is crucial for promoting GR adoption, it alone is not sufficient. Policies should be complemented by educational efforts and urban regulatory measures to ensure widespread adoption and long-term impact. This research provides urban planners and stakeholders with evidence to enhance urban resilience, sustainability, and effective flood risk management.

1. Introduction

Urban flooding has become an increasingly pressing issue in densely populated areas, primarily due to the expansion of impervious surfaces that disrupt natural hydrological cycles [1]. The replacement of natural ground cover with concrete and asphalt reduces rainfall infiltration, leading to higher runoff volumes and faster peak flows that overwhelm drainage systems, increasing flood risks [2,3]. Climate change further compounds this challenge by increasing the frequency and intensity of extreme precipitation events, reinforcing the urgency for more resilient stormwater management strategies in urban environments.
A critical parameter in flood risk analysis is the Effective Impervious Area (EIA), which represents the fraction of impervious surfaces directly connected to stormwater drainage infrastructure [4]. Higher EIA values are strongly associated with increased runoff and flood susceptibility. Thus, reducing EIA is a key strategy for restoring urban hydrological balance and mitigating flood risks [5,6]. Among the solutions available, green roofs (GRs) offer a promising nature-based approach. By converting conventional rooftops into vegetated systems, GRs enhance evapotranspiration and delay runoff peaks, contributing to both flood mitigation and urban climate adaptation [7,8,9].
Despite their multiple benefits, GRs remain underutilized globally due to both financial and cognitive barriers. High installation costs and the lack of structured incentive policies continue to restrict widespread adoption [10,11]. In contrast to cities like Toronto and Portland, which have successfully promoted GRs through subsidies and tax incentives [12], Latin America—including Brazil—has experienced slow regulatory advancement in this area, limiting the diffusion of such solutions [13]. Compounding these structural limitations is a broader lack of public and governmental awareness regarding the benefits of GRs, which further delays their integration into urban planning.
Within this context, São José dos Campos in southeastern Brazil emerges as a notable exception. It is one of the few Brazilian municipalities that has implemented local policies to promote Green Infrastructure. The city faces persistent flooding issues, with 22 areas officially designated as flood-prone and over 600 households located in high-risk zones—many occupied by socioeconomically vulnerable populations [14]. Historic flood events in the Senhorinha Creek basin, such as the 102.7 mm rainfall in March 1999 that caused BRL 1.5 million in damages and the March 2013 storm affecting more than 100,000 residents, underscore the urgent need for effective stormwater management strategies. However, scientific studies that evaluate the real impact of GRs in such urban contexts remain scarce.
Most GR modeling studies have been conducted in temperate cities across Europe and Asia and are often disconnected from the urban realities of Latin America. In Brazil, urban development is shaped by socio-territorial inequalities, informal settlements, and fragmented infrastructure, all of which produce complex hydrological responses [15]. This study addresses this knowledge gap by simulating the effects of GR retrofitting at the watershed scale in a subtropical urban basin. Using a calibrated model for São José dos Campos, we assess both current policy scenarios and expanded implementation strategies. The results offer locally grounded evidence to support incentive-based policies and advance urban flood resilience. By aligning scientific analysis with municipal targets and real-world constraints, this research aims to strengthen public policy, promote the wider adoption of GRs, and support sustainable urban water management across Brazil and other similarly challenged regions.

2. Materials and Methods

2.1. Study Site

This study focuses on the Senhorinha Creek watershed, a 9.26 km2 Microbasin of the Paraíba do Sul River basin located in São José dos Campos, Brazil (Figure 1). The watershed supports a population of approximately 99,863 inhabitants, experiences a humid subtropical climate (Cwa), according to the Köppen classification. Senhorinha Creek, extending 6.1 km, and drains a highly urbanized catchment that faces significant hydrological and environmental challenges.
Equipped with a separate sewer system, the watershed has been identified by municipal authorities as a critical area in need of targeted microdrainage interventions due to recurrent flooding and environmental degradation. Its significant socio-environmental importance led to its selection as a pilot site and its prominent feature in the first Nature-Based Solutions Accelerator for Cities, led by the World Resources Institute.
Flood-prone areas along the creek cover approximately 281,791 m2, or 3.04% of the watershed’s total area [16]. This highlights the urgent need for sustainable stormwater management and effective retrofitting strategies to mitigate flood risks and improve watershed resilience in this rapidly urbanizing region.
A land use and land cover (LULC) analysis was conducted using georeferenced data provided by the Municipality of São José dos Campos, complemented by satellite imagery from Google Earth and field surveys. The watershed was categorized into the following classes: residential, commercial and service, mixed-use, vacant land, institutional, industrial, substations, cemetery, parking, road system, and green areas. Based on this classification, the dominant land uses were residential (40.4%), roads (22.7%), green areas (17.9%), commercial and service areas (6.4%), and other uses (7.8%) (Table 1). The residential category was further subdivided into vertical developments (e.g., apartment buildings), horizontal developments (e.g., single-family homes), and gated communities. Similarly, green areas were classified into municipal green spaces, residential green areas, roadside vegetation, and public parks.
The soil in the study sub-watershed is predominantly classified as PVA 42, which corresponds to a combination of Typic Red-Yellow Argisol with medium and medium/clayey texture and Latossolic Red-Yellow Argisol with clayey texture. Both are dystrophic, with moderate A-horizons and found in undulating relief, according to [17]. Based on the adaptation of soil classification for Brazilian conditions in [18], this soil type falls into Hydrological Soil Group B according to the Soil Conservation Service Curve Number (SCS-CN) methodology [19].
LULC classes identified in the sub-watershed were adapted to the standard land use categories defined by the SCS-CN method. Each class was assigned a Curve Number (CN) value appropriate for Hydrological Soil Group B, incorporating adjustments for impervious surfaces where applicable. Table 2 summarizes the classification and assigned CN values. This classification ensured consistency with the SCS-CN method while adapting it to local land use conditions and soil characteristics.

2.2. Hydrological Modeling

Hydrologic modeling was performed using the CAbc software (version 7.5.25r), developed by the Center for Hydraulic Technology at the University of São Paulo. This software supports various methods for flow generation, including the SCS-CN method, employed in this study. The resulting hydrographs were generated using the SCS triangular unit hydrograph. CAbc is well-suited for both urban and rural watersheds and effectively accounts for variability in rainfall distribution and land use through sub-basin segmentation [21]. To enhance the representation of the study area, the Senhorinha Creek watershed was divided into three sub-basins (R1, R2, and R3). Input data included drainage area, channel length, river slope, time of concentration (Tc), CN, impervious area fraction (IA), and EIA (Table 3).
Eight rainfall events were selected within the monitoring period from May to October 2023, during which both precipitation and water level data were consistently available. These events were characterized by a wide range of durations and intensities, enabling a robust evaluation of model performance across varying hydrological conditions. Model accuracy was assessed using the Nash–Sutcliffe Efficiency (NSE) and Root Mean Square Error (RMSE). For calibration, four events were selected—primarily the least intense (Events 6, 7, and 8)—as the modeling framework emphasizes frequent rainfall events, which are most relevant for planning and evaluating nature-based solutions. The remaining four events (Events 1, 2, 3, and 4) were used for validation. The results of the calibration and validation processes are presented in Table 4. A comparison between the observed and simulated hydrographs for natural rainfall Events 2 (validation) and 5 (calibration) demonstrates the model’s ability to reproduce flow dynamics across varying conditions, capturing both the peak and overall shape of the hydrographs with high agreement (Figure 2). Additional graphs and calibration details are available in [22].
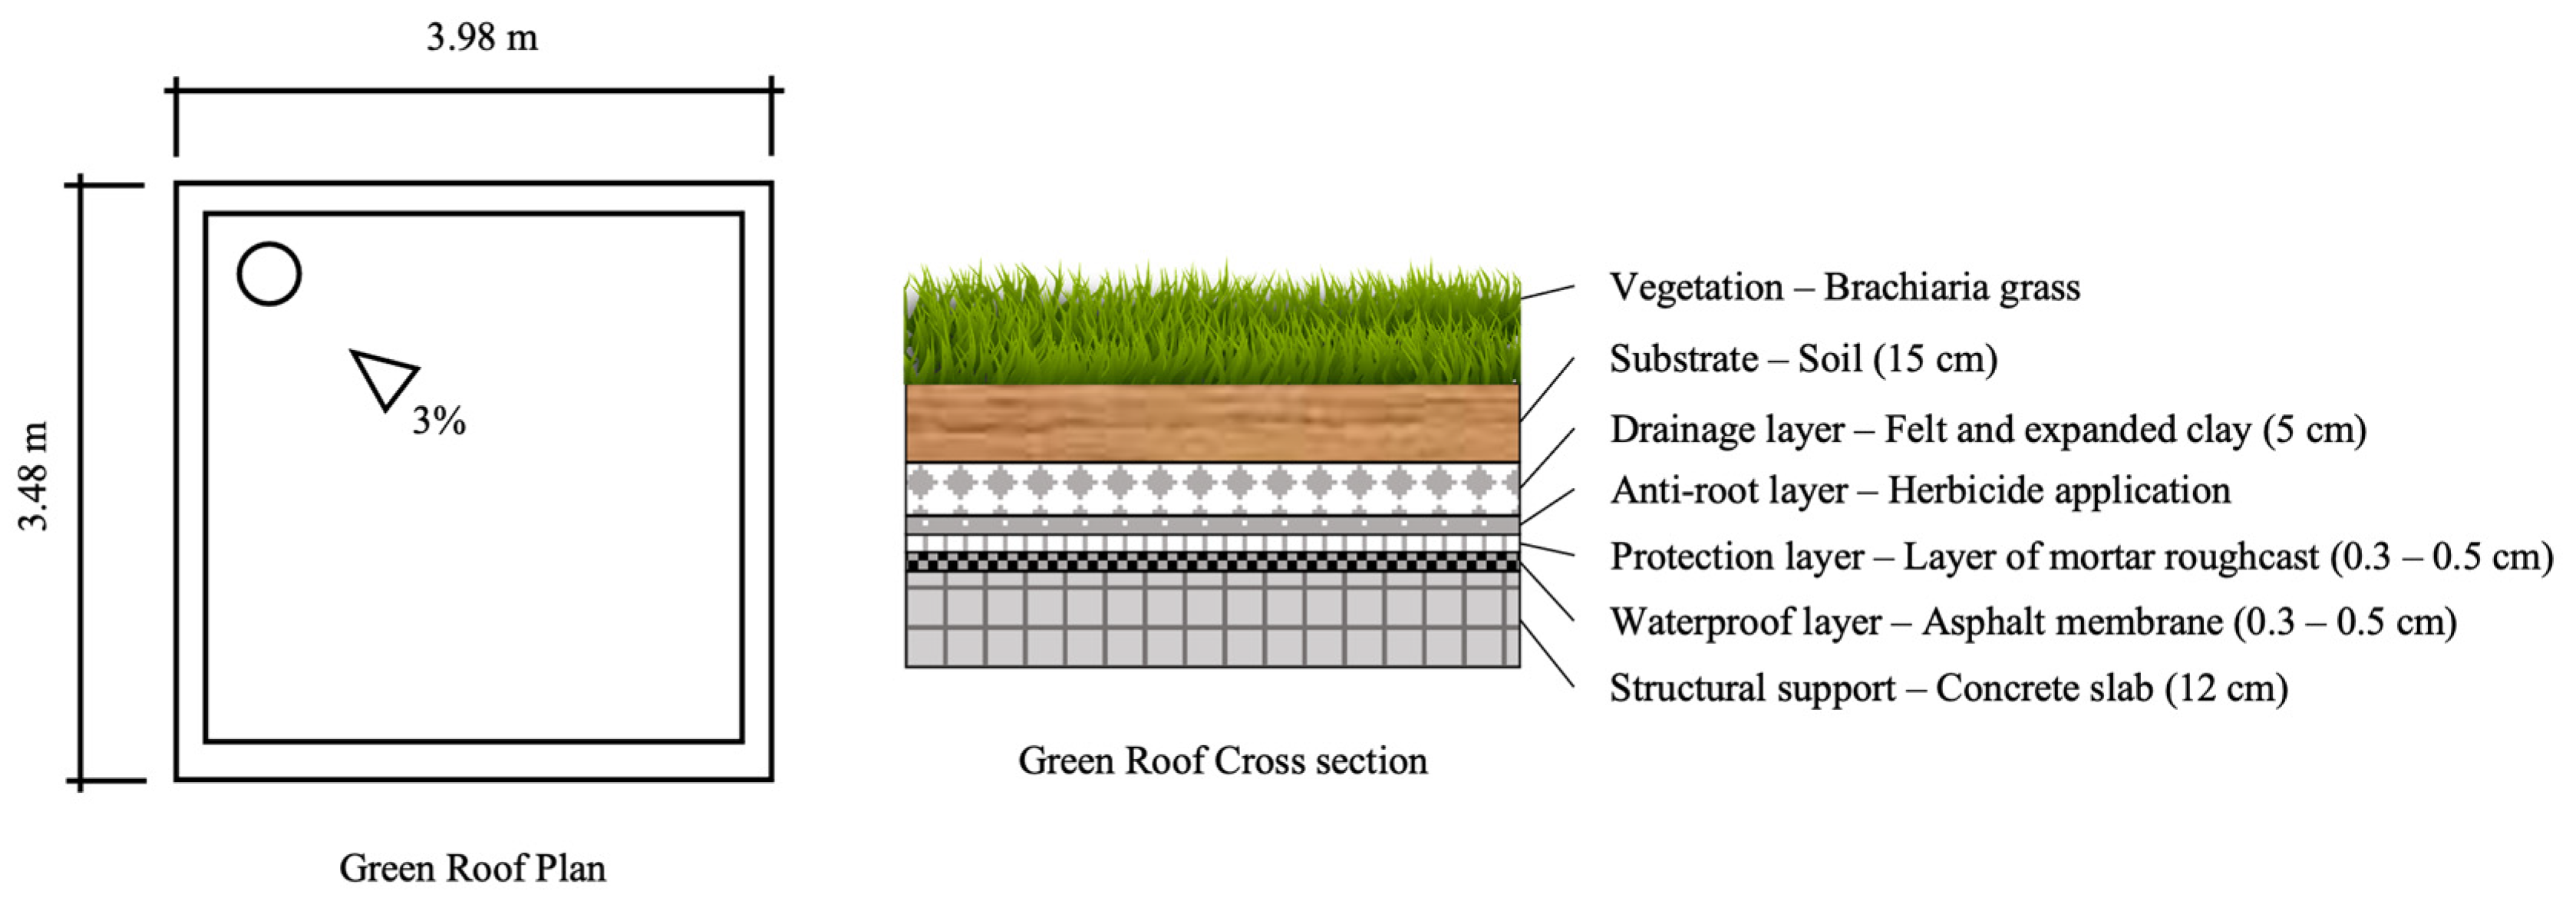
The GR model was calibrated using data from an experimental setup located at the University of São Paulo, Brazil, within a humid subtropical climate zone. Constructed in 2010, the system features a vegetated area of 11.42 m2 on a 14 m2 concrete slab with a 3% slope. Its roof assembly includes multiple layers: an asphalt-based waterproofing membrane, a mortar and felt mechanical protection layer, an anti-root barrier, a drainage layer of expanded clay, and a 15 cm thick soil substrate (see Figure 3). Initially composed of vegetable soil, the substrate was later amended with worm humus to increase its organic matter content. The vegetative cover consists of Brachiaria decumbens, a drought-tolerant grass species well adapted to subtropical conditions, which enhances evapotranspiration during warmer seasons [23].
The model calibration was based on 16 natural rainfall events that resulted in measurable runoff, selected from the monitoring period between November 2022 and March 2024, encompassing all seasons to capture a range of hydrological responses. Events that did not generate runoff were excluded from the analysis, as the focus was on events with a clear rainfall–runoff relationship. For each event, rainfall depth and the corresponding runoff volume were analyzed to estimate the CN using the SCSC-CN method. The calibration process involved the iterative adjustment of the CN and initial abstraction ratio (λ) to minimize prediction errors. The final calibrated CN value was 89, with a median λ of 0.17. This configuration yielded reliable runoff predictions, as demonstrated by an RMSE of 1.24 mm, an MAE of 1.06 mm, and an NSE coefficient of 0.95, indicating excellent agreement between observed and simulated runoff volumes. The high performance metrics suggest that the model adequately represents the hydrological behavior of the GR system under the observed conditions.
The Tc for the GR was estimated using the Triangular Unit Hydrograph method developed by Tassi et al. (2015) [24], a robust approach for simplified hydrological modeling in Brazil. The hydrograph was calibrated by minimizing the volume error between observed and simulated runoff, achieving a mean volume error of only 7% and a high NSE of 0.9, demonstrating excellent model performance. To determine Tc, a median peak delay of 14 min was observed in the GR, resulting in an estimated Tc of 11.7 min for the GR.

2.3. Simulated Scenarios

The scenario-specific percentages were established based on existing municipal legislation and projected adoption potentials. The “Mandatory” scenario reflects current regulatory requirements for new developments, which mandate a minimum of 10% infiltration area, as stipulated in Law No. 5938/2020. The “Incentivized” scenario is derived from Complementary Law No. 596/2017, which provides tax benefits to residential buildings that implement GRs covering at least 85% of the total roof area. To account for architectural and structural constraints, a coverage rate of 80% was adopted in this scenario. The “Ideal” scenario extrapolates this incentive framework to all land use categories, thereby simulating the potential environmental and social benefits of a city-wide GR adoption policy. It is important to emphasize that these scenarios are not intended to accurately reflect current adoption levels, but rather to illustrate the prospective outcomes of broader policy implementation and widespread uptake of GR systems in São José dos Campos. A summary of the assumptions for each scenario is provided in Table 5.
To represent the hydrological impacts of each scenario, modifications were applied to the land use and land cover data according to the retrofitting percentages defined in Table 5. These adjustments reduced the EIA and altered the CN, which was recalculated using an area-weighted approach to account for the increased perviousness introduced by GR implementation. CN values for GRs were derived from the calibrated results presented in Section 2.2 to ensure consistency and representativeness. In addition, Tc was updated by applying a weighted average based on the proportion of land uses converted to GRs, using the Tc value calibrated for the GR system. This approach allowed the model to account for slower runoff responses in retrofitted areas, capturing the influence of both surface storage and delayed peak flow generation. The resulting CN, EIA, and Tc values for each scenario are summarized in Table 6.
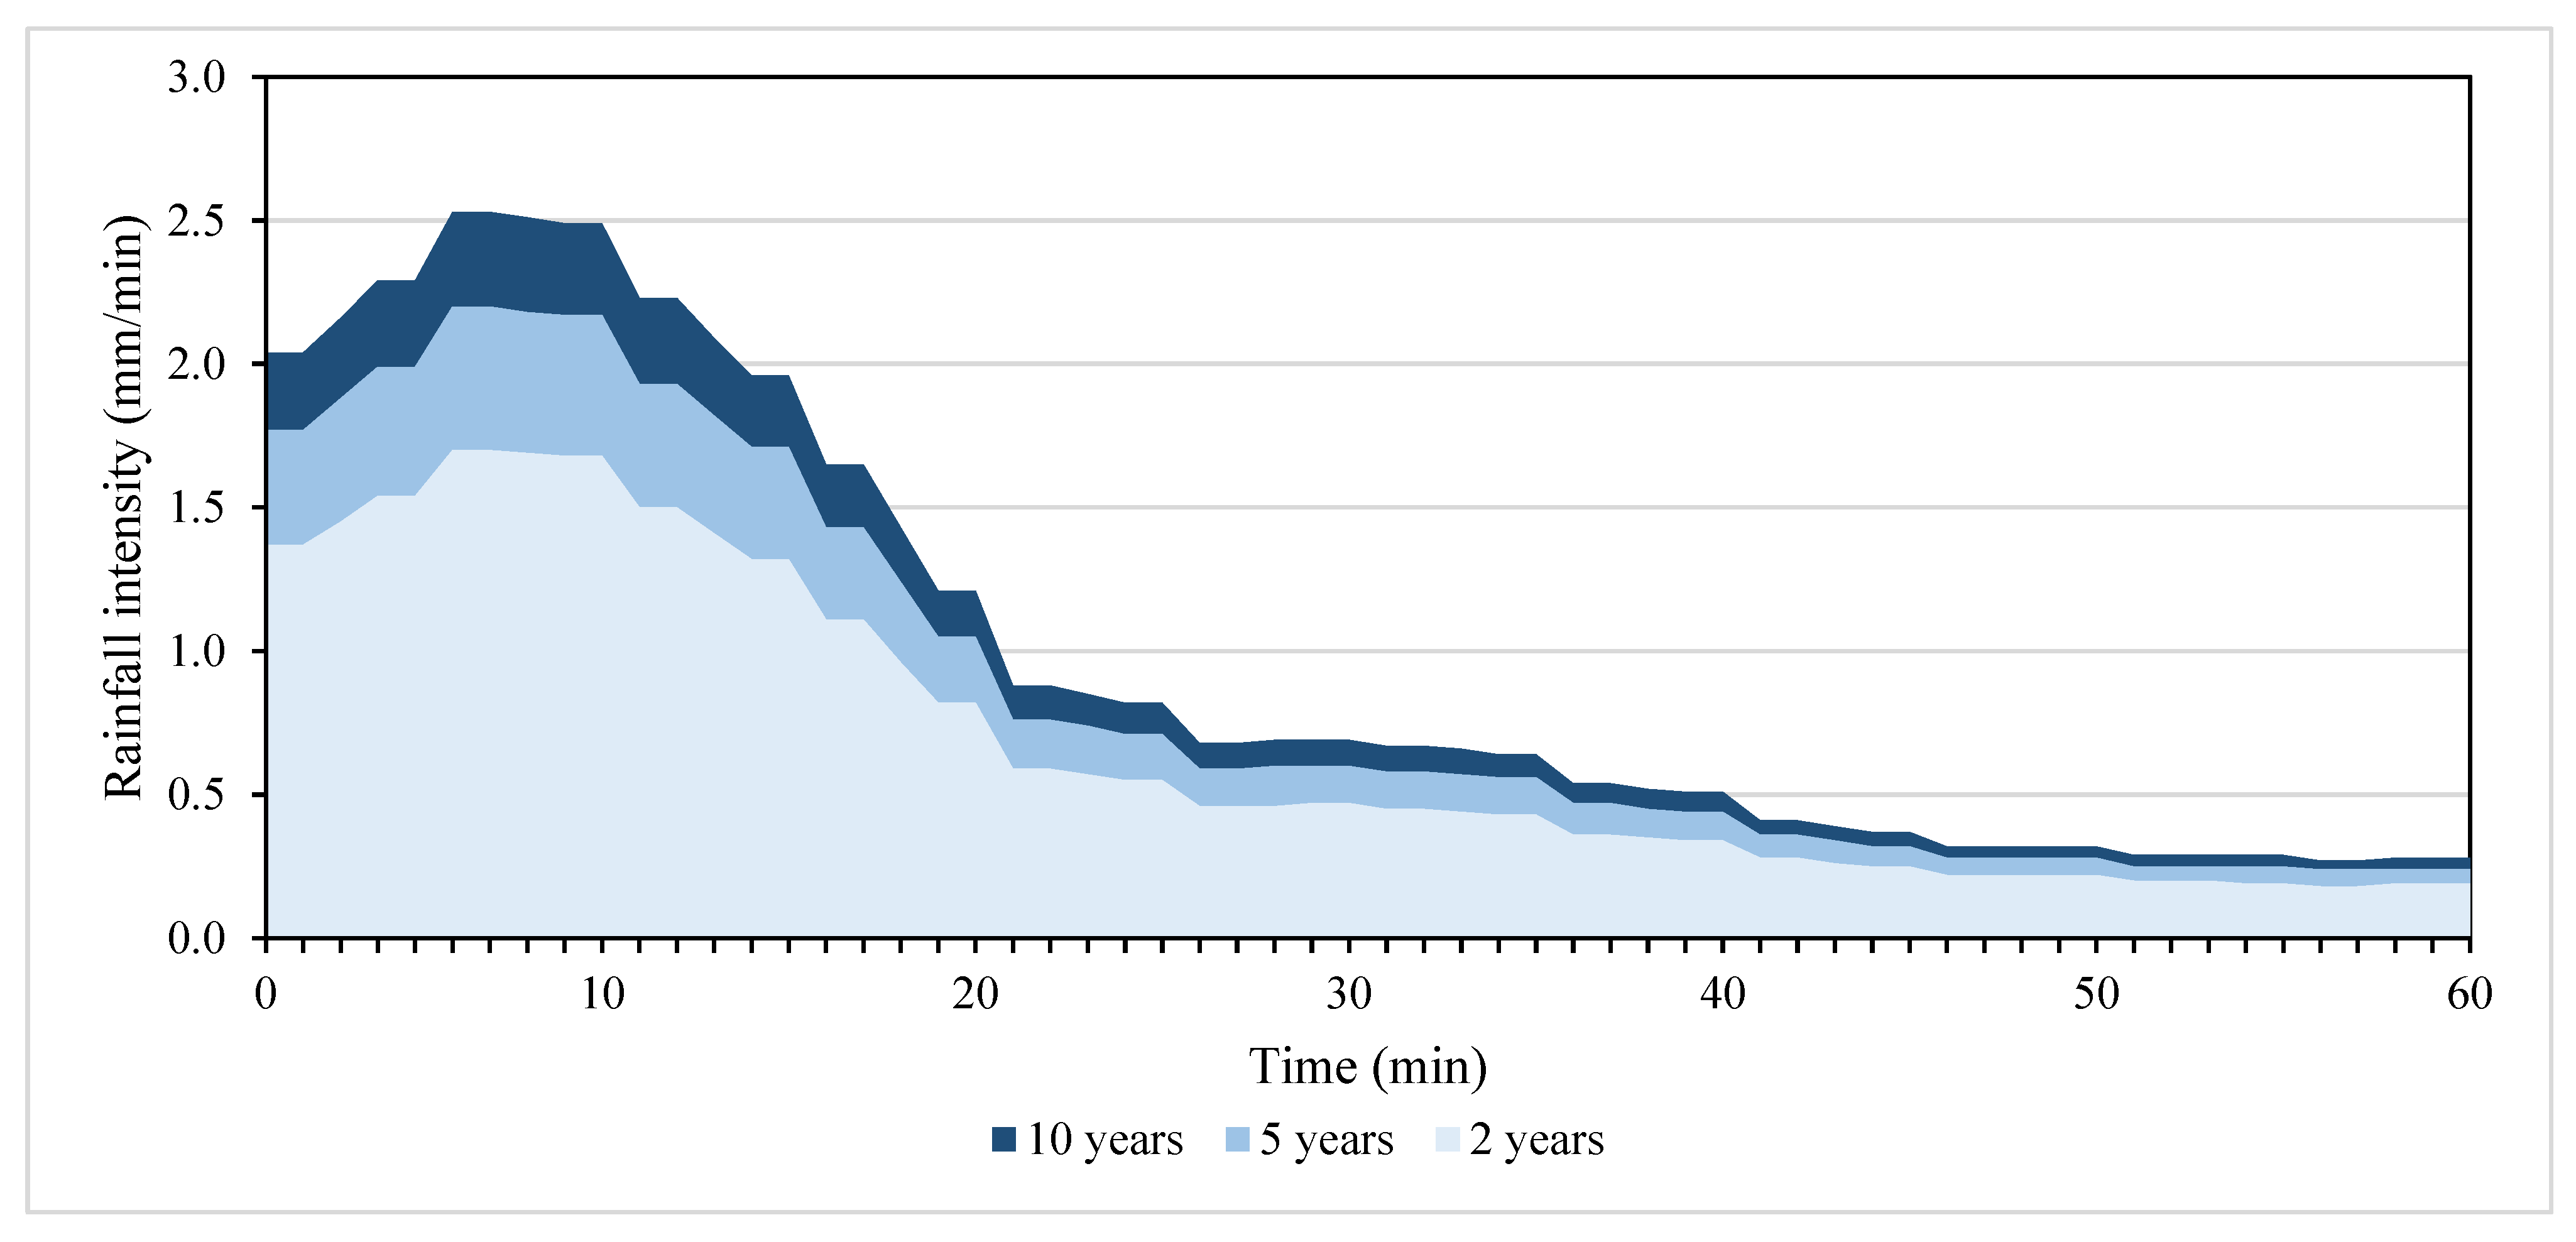
Simulations were conducted for rainfall events with 60 min durations and return periods of 2, 5, and 10 years, corresponding to intensities of 41 mm, 53 mm, and 61 mm, respectively (Figure 4). The rainfall intensity data were derived from the Taubaté IDF curve, computed based on 30 years of monitoring records [25]. Figure 4 illustrates that the rainfall was disaggregated utilizing the Huff Type I distribution with 1 min resolution as recommended by the city stormwater design guides [26].
Performance metrics, including peak flow reduction, peak flow delay, hydrograph centroid delay, and runoff volume reduction, were applied to evaluate hydrological performance from the resulting hydrographs. The hydrological performance is calculated with the following equation:
H y d r o l o g i c a l P e r f o r m a n c e   ( % ) = H y d r o l o g i c a l i n d i c a t o r B a s e H y d r o l o g i c a l i n d i c a t o r S c e n a r i o H y d r o l o g i c a l i n d i c a t o r B a s e

3. Results

3.1. Effect of EIA Reduction

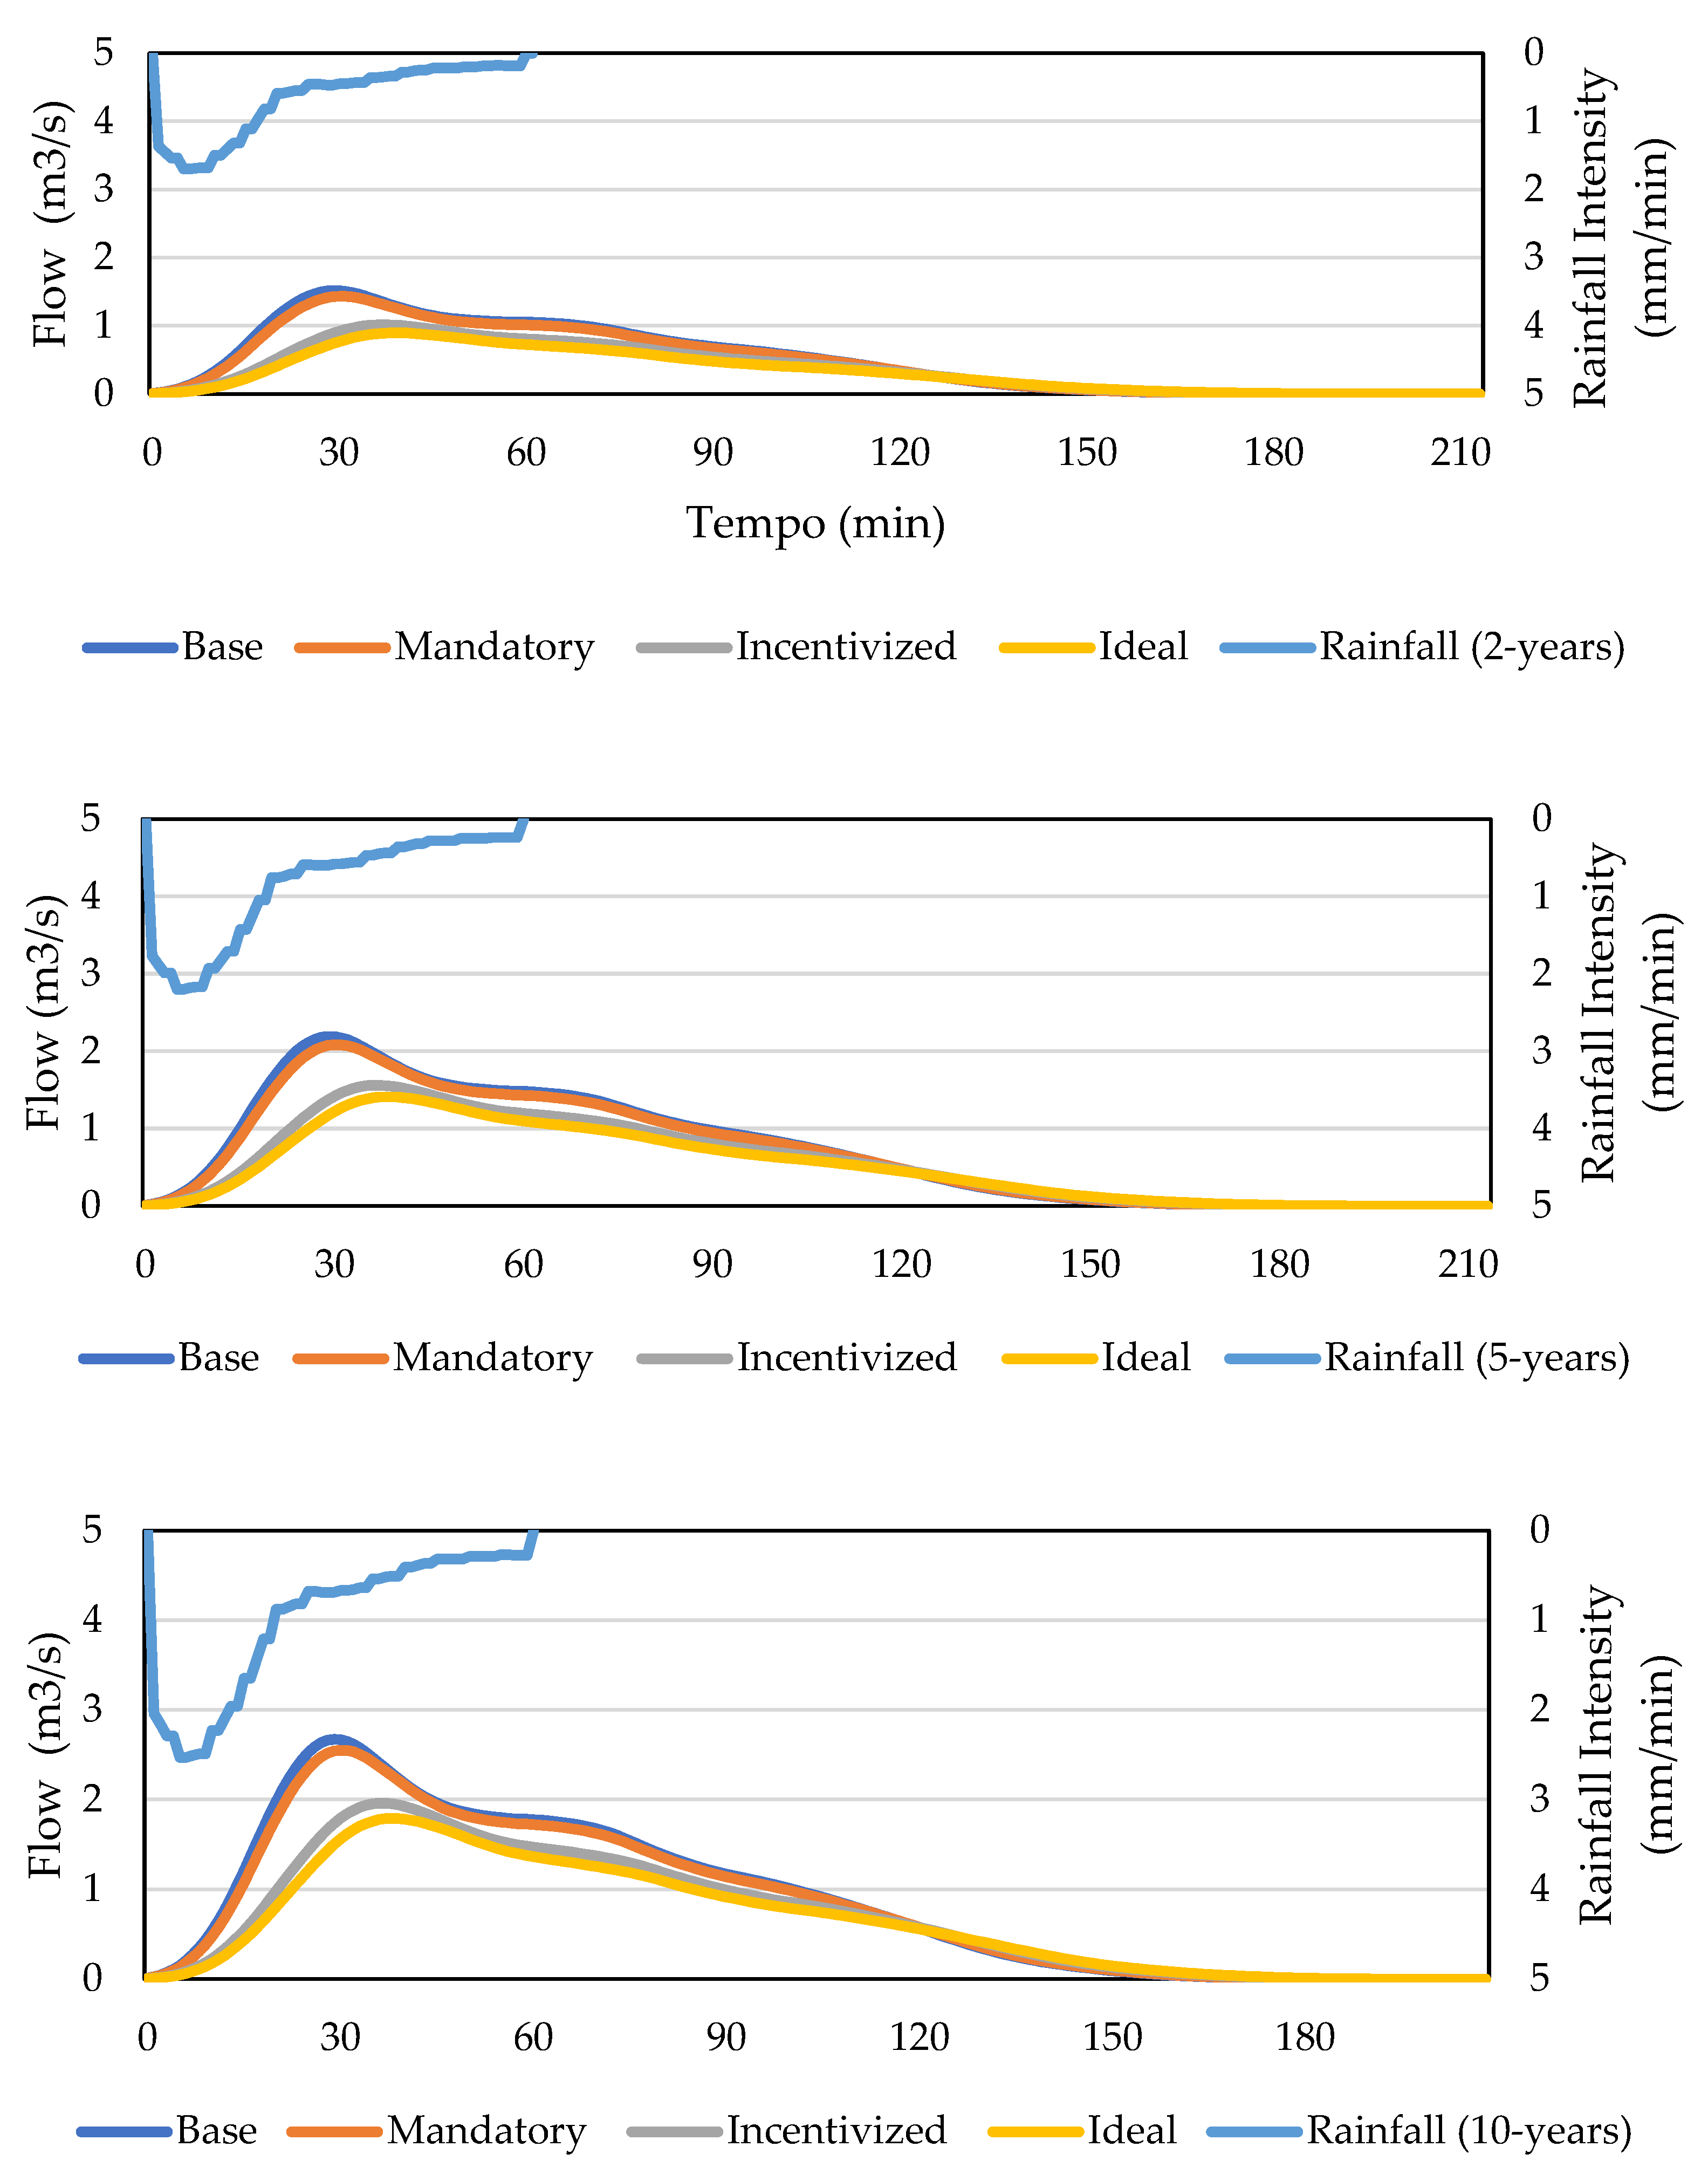
Figure 5 illustrates the impact of reducing the EIA on the hydrograph response. The results indicate that lower EIA levels significantly delayed and attenuated the initial rise in the hydrograph. In the ‘Incentivized’ and ‘Ideal’ scenarios, the hydrograph’s peak occurred later and was notably lower compared to the ‘Base’ and ‘Mandatory’ scenarios. However, the recession limb of the hydrograph exhibited similar patterns across all scenarios, suggesting that while GRs influence peak flow dynamics, their effect on prolonged runoff dissipation is less pronounced.
Table 7 presents the hydrological performance of the projected scenarios—‘Mandatory,’ ‘Incentivized,’ and ‘Ideal’—compared to the ‘Base’ scenario. The ‘Mandatory’ scenario (EIA = 34%) showed limited hydrological benefits, with peak flow reductions of only 5–6%, a peak delay of 3%, and runoff volume reductions of 3–4%. These modest improvements were accompanied by negligible shifts in the hydrograph centroid. Conversely, the ‘Incentivized’ (EIA = 21%) and ‘Ideal’ (EIA = 16%) scenarios demonstrated the substantial potential of GRs to manage urban runoff. Notably, the ‘Ideal’ scenario achieved peak flow reductions of 33–41%, runoff volume reductions of 26–35%, peak delays of up to 33%, and hydrograph centroid delays of 13%.
Hydrological performance indicators exhibited a strong linear correlation with EIA reductions, with R2 values exceeding 0.99 (Figure 6). Among these indicators, peak flow attenuation was the most sensitive, with a linear slope modulus of 1.99, highlighting its significant improvement with EIA reduction. Peak delay and runoff volume reduction showed similar trends, with linear slopes of 1.64 and 1.66, respectively. In contrast, hydrograph centroid delay was the least responsive to EIA changes, with a slope of 0.61. These findings align with those of [27,28], which highlighted that the hydrologic performance is linearly dependent on the EIA reduction. These results suggest that reducing EIA consistently enhances hydrological benefits, with no apparent tipping points in system behavior [29]. However, it is important to acknowledge potential nonlinearity in real-world conditions. The applied model does not account for dynamic fluctuations in GR performance, including seasonal variations, substrate moisture retention capacity, and vegetation growth cycles, which could influence long-term hydrological responses.
The improved hydrological performance observed in scenarios with reduced EIA can be attributed to the capacity of GRs to store water, facilitate evapotranspiration, and temporarily detain runoff. These mechanisms collectively reduce flood risks while contributing to a more balanced local hydrological cycle. EIA reduction mitigates urban flooding by addressing the two primary drivers of increased flood risk: excess runoff volume and reduced time of concentration. As urbanization expands impervious surfaces, rainfall is rapidly converted into direct runoff, overwhelming drainage systems and increasing flash flood frequency. By integrating GI and minimizing EIA, urban areas can enhance infiltration, detain stormwater, and extend the runoff response time, alleviating pressure on drainage networks. The findings of this study underscore the importance of strategic EIA reduction in flood risk mitigation, demonstrating that widespread implementation of GI can play a crucial role in managing urban hydrology and reducing the vulnerability of cities to extreme rainfall events.

3.2. Effect of Return Period

Table 7 demonstrates that the hydrological effectiveness of GRs diminishes as rainfall return periods increase, with more intense and less frequent rainfall events surpassing the detention capacity of GRs. For instance, in the Ideal scenario, peak flow attenuation decreased from 41% for a 2-year return period to 33% for a 10-year return period, while runoff volume reduction declined by 9%. These findings align with those of Sciuto et al. (2024) [7], who highlighted the limitations of GRs in handling high-intensity rainfall, primarily due to the limited field capacity of their substrate.
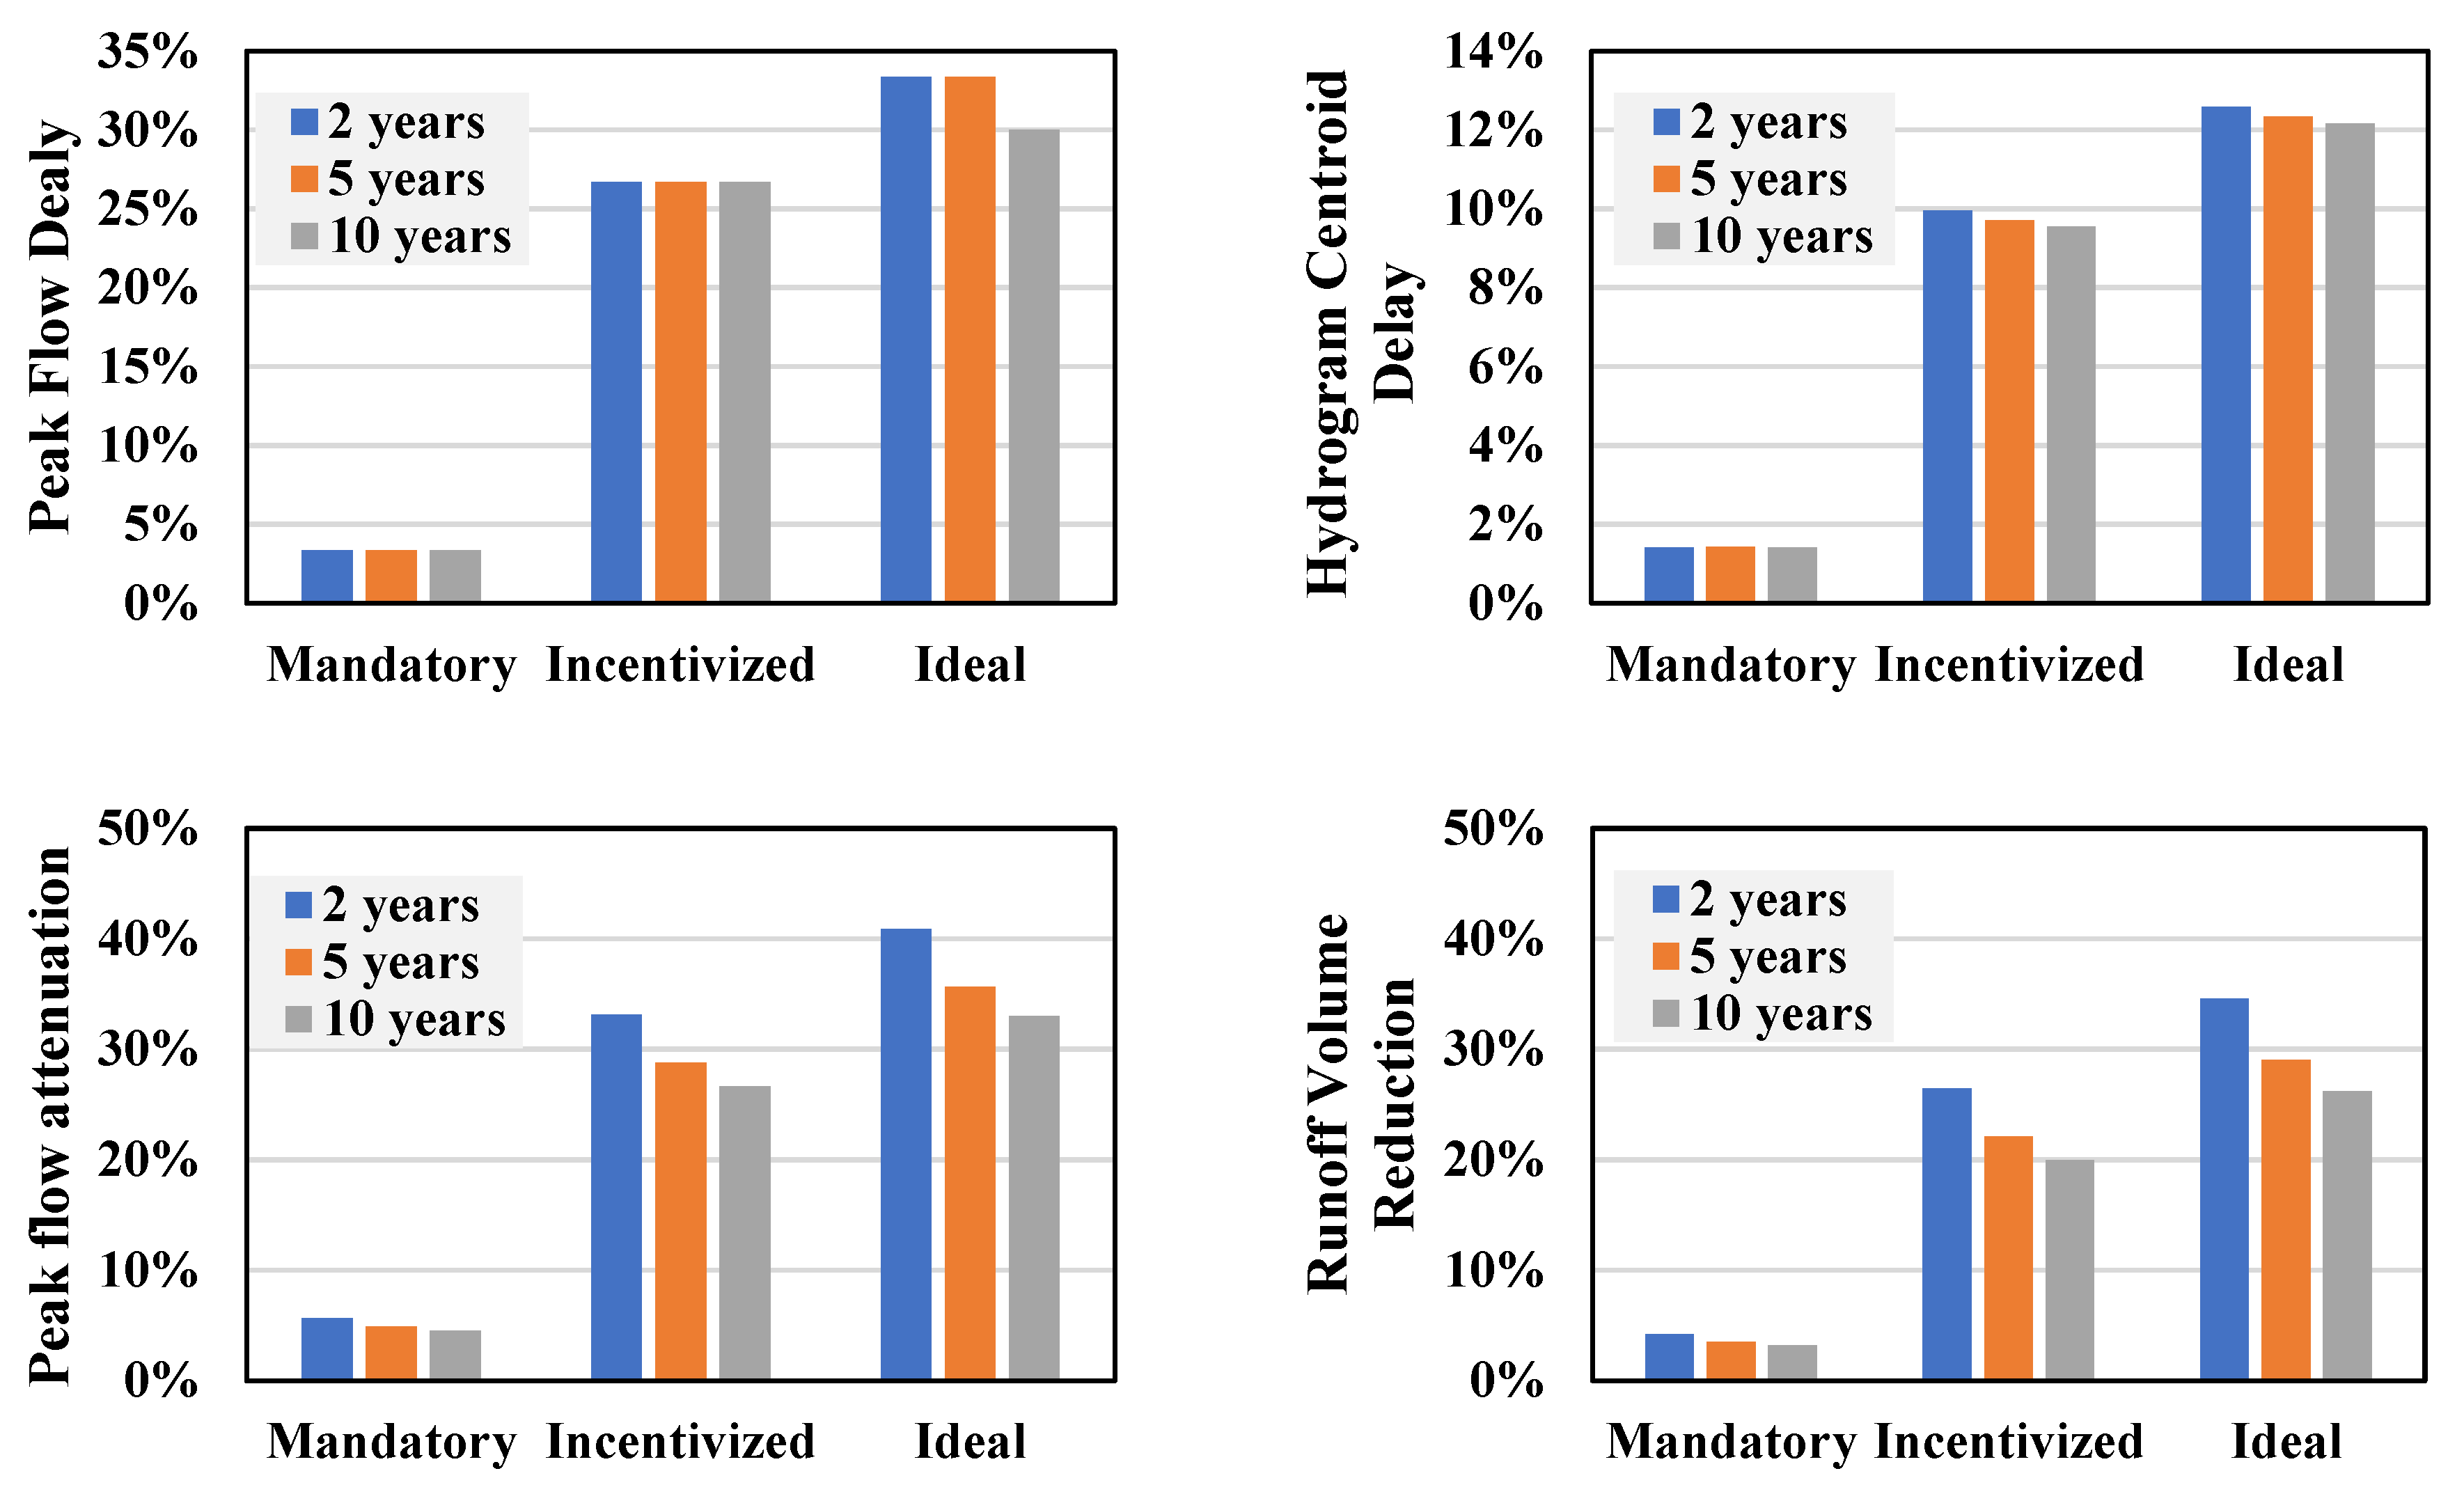
In contrast, metrics such as peak flow delay and hydrograph centroid delay exhibited minimal sensitivity to variations in return periods (Figure 7), consistent with observations made by Palla and Gnecco (2015) [27]. This behavior is hypothesized to result from the simplification inherent in the adopted model, which assumes a constant detention capacity. However, studies on individual GR systems suggest that detention capacity may vary depending on rainfall intensity and duration [30,31]. These findings emphasize the need for incorporating dynamic detention capacity in future modeling approaches to better capture the performance of GRs under diverse rainfall scenarios.
GRs are most effective in managing frequent, low-intensity rainfall events, making them a suitable tool for improving urban hydrological balance under regular conditions. However, their limited effectiveness during extreme rainfall highlights the need for GRs to be integrated into a broader sustainable drainage system, as one solution among a range of GI strategies for flood control, across different scales [32]. This combined approach can provide a more robust solution for flood mitigation and urban water management, especially in the face of increasing climate variability.

3.3. Implications

The retrofitting of GRs has emerged as a viable strategy for mitigating flood risks, particularly in densely populated urban areas. By incorporating GRs on large rooftops, cities can significantly reduce and delay surface runoff, enhancing the overall performance of urban drainage systems. This is especially relevant as climate change increases the frequency and intensity of extreme precipitation events, placing greater pressure on existing stormwater infrastructure. However, the effectiveness of GRs in flood mitigation is maximized when they are integrated within broader GI networks, such as bioretention cells and permeable pavements. Research indicates that combining these approaches can amplify the stormwater retention capacity by reducing total impervious surface areas and enhancing water infiltration [32]. Beyond flood control, these integrated solutions contribute to water quality improvement by filtering pollutants before they enter urban water bodies [33,34]. Additionally, GRs provide multiple co-benefits, including urban heat island mitigation, air quality enhancement, and biodiversity support, reinforcing their multifunctionality and contribution to urban sustainability [35,36].
Public policies that provide financial incentives—such as tax reductions, subsidies, and grants—play a crucial role in improving the economic feasibility of GR adoption for private property owners [37]. These measures help offset high initial investment costs, often cited as a major barrier to implementation [10]. By reducing upfront expenditures and enhancing return on investment, financial incentives make GRs more attractive to developers and homeowners, particularly in urban areas where space constraints and construction costs are high [37]. In the long term, these incentives yield economic benefits by lowering stormwater fees, increasing property values, and reducing energy costs through improved thermal insulation [38,39,40]. At the municipal level, widespread GR adoption can lead to financial savings by decreasing stormwater infrastructure maintenance costs and minimizing flood-related damages. By alleviating financial burdens on both private property owners and public drainage systems, well-structured incentive programs promote urban sustainability while ensuring cost-effective stormwater management and climate resilience [41].
However, financial policies alone are not sufficient to drive widespread GR adoption. Many cities worldwide have introduced financial incentives, yet adoption rates remain limited due to administrative complexities, lack of technical expertise, and insufficient public awareness [10,42,43]. Moreover, these incentives often fail to reach socioeconomically disadvantaged communities, inadvertently reinforcing urban inequalities rather than addressing them [39,43]. To enhance adoption, financial support must be integrated with regulatory frameworks, such as mandatory GR policies for new developments and incentives for retrofitting existing buildings [13]. Additionally, targeted education and outreach programs for developers, property owners, and urban planners are essential to addressing misconceptions and overcoming resistance to adoption [43]. A comprehensive strategy that combines financial incentives, regulatory measures, and educational initiatives is necessary to maximize the hydrological, environmental, and economic benefits of GRs while fostering urban resilience and equitable implementation.

3.4. Limitations

Several factors limit the scope and applicability of this study:
Overestimation of results: The simulated scenarios assume that GR retrofitting is widely feasible, presuming that most impervious surfaces correspond to rooftops. However, practical implementation faces challenges such as technical constraints, costs, and public acceptance, which could lead to an overestimation of the benefits.
Spatial Distribution of GRs: The model does not account for the spatial distribution of GRs within the watershed, which can influence runoff reduction efficiency [44,45]. A more detailed model that incorporates this spatial variation could provide a more accurate simulation of the hydrological response.
Typology, Design, and Meteorological Factors: This study assumes a single-GR typology, whereas real-world applications involve diverse designs that vary in slope, substrate depth, and materials. Additionally, climatic factors such as seasonal variations and wind conditions can significantly affect GR performance [46]. Thus, the results present a simplified approximation rather than capturing the full complexity of GR interactions with meteorological conditions.
Model Simplifications and Hydrological Representation: This study employs the SCS-CN model, which, despite its practicality and widespread use, has inherent limitations in representing the full complexity of urban hydrology. The model does not explicitly account for dynamic retention processes, infiltration variability, or the temporal evolution of GR detention capacity. Consequently, the interaction between GR and stormwater is represented in a simplified manner.

4. Conclusions

This study demonstrates that GRs play a crucial role in mitigating urban runoff, particularly by reducing the EIA. Our findings highlight that retrofitting with GRs significantly attenuates peak flows, delays hydrograph response, and decreases runoff volumes. The most pronounced benefits were observed under lower EIA scenarios. In the ‘Ideal’ scenario (EIA = 16%), peak flow reductions of up to 41% and runoff volume reductions of 35% were achieved during a 2-year return period storm, emphasizing GRs’ potential as a viable stormwater management strategy. These results are especially relevant in urban areas with frequent, low-intensity rainfall events.
However, GRs’ efficiency diminishes under extreme rainfall conditions, where their storage capacity is insufficient to manage more intense events. This limitation underscores the need for complementary flood mitigation strategies, such as integrating GRs with other GI solutions like permeable pavements and bioretention systems, which can further enhance stormwater management and urban resilience.
Beyond flood mitigation, GRs offer several co-benefits, including reducing urban heat island effects, improving air quality, and supporting biodiversity. Despite these advantages, widespread GR adoption is constrained by financial barriers, regulatory gaps, and limited public awareness. To overcome these challenges, targeted policy measures, such as tax incentives, mandatory GR integration in new developments, and public–private partnerships, are needed to foster large-scale implementation. Additionally, aligning GR initiatives with broader climate adaptation policies will amplify their role in sustainable urban water management.
Cities like São José dos Campos provide a model for GR adoption, yet further regulatory measures are necessary to expand their reach, particularly in commercial and high-density residential areas. Strengthening policy frameworks that promote GR integration into urban planning will enable cities to better cope with increasing flood risks, while simultaneously enhancing environmental quality and public health.
Future research should focus on advancing hydrological models that incorporate dynamic detention capacity to improve GR performance predictions under varying rainfall conditions. Additionally, studies assessing the long-term cost-effectiveness of GRs, their impact on water quality at larger scales, and their interactions with other GI elements are crucial for optimizing their implementation. The use of machine learning techniques could also improve the accuracy of GR performance predictions, supporting data-driven decision-making in urban water management.
In conclusion, GRs represent a strategic solution not only for mitigating urban floods but also for fostering long-term economic, environmental, and social benefits. By integrating GRs into comprehensive water management frameworks, cities can enhance their resilience to climate change, reduce flood risks, and promote more sustainable and livable urban environments.

Author Contributions

Conceptualization, T.M.O.; methodology, T.M.O., F.F.N., S.C.M.G., F.G.S., S.D.M. and J.R.S.M.; software, T.M.O., F.F.N., S.C.M.G., F.G.S. and S.D.M.; validation, F.F.N.; formal analysis, T.M.O.; investigation, T.M.O.; resources, T.M.O., F.F.N., S.C.M.G. and S.D.M.; data curation, T.M.O., F.F.N. and S.C.M.G.; writing—original draft, T.M.O.; writing—review and editing, J.R.S.M.; visualization, T.M.O. and J.R.S.M.; supervision, B.C.C.L. and J.R.S.M.; project administration, B.C.C.L. and J.R.S.M.; funding acquisition, B.C.C.L. and J.R.S.M. All authors have read and agreed to the published version of the manuscript.

Funding

This research was funded by the University of Sao Paulo/FCTH, grant number Conv. #1014756, and the APC was funded by the FCTH.

Data Availability Statement

The raw data supporting the conclusions of this article will be made available by the authors on request.

Acknowledgments

The authors gratefully acknowledge the research support provided by the Hydraulic Technological Center Foundation (FCTH) and the city of Sao Jose dos Campos.

Conflicts of Interest

The authors declare no conflicts of interest.

References

  1. Deopa, R.; Thakur, D.A.; Kumar, S.; Mohanty, M.P.; Asha, P. Discerning the Dynamics of Urbanization-Climate Change-Flood Risk Nexus in Densely Populated Urban Mega Cities: An Appraisal of Efficient Flood Management through Spatiotemporal and Geostatistical Rainfall Analysis and Hydrodynamic Modeling. Sci. Total Environ. 2024, 952, 175882. [Google Scholar] [CrossRef] [PubMed]
  2. Elliot, T.; Torres-Matallana, J.A.; Teebken, J. Urbanization under Extreme Climate Events Leads to Synchronized Decreases in Flood Protection and Increases in Vulnerability. Cities 2025, 160, 105827. [Google Scholar] [CrossRef]
  3. Seemuangngam, A.; Lin, H.L. The Impact of Urbanization on Urban Flood Risk of Nakhon Ratchasima, Thailand. Appl. Geogr. 2024, 162, 103152. [Google Scholar] [CrossRef]
  4. Obropta, C.C.; Del Monaco, N. Reducing Directly Connected Impervious Areas with Green Stormwater Infrastructure. J. Sustain. Water Built Environ. 2018, 4, 5017004. [Google Scholar] [CrossRef]
  5. Sohn, W.; Kim, J.H.; Li, M.H.; Brown, R.D.; Jaber, F.H. How Does Increasing Impervious Surfaces Affect Urban Flooding in Response to Climate Variability? Ecol. Indic. 2020, 118, 106774. [Google Scholar] [CrossRef]
  6. Zhou, H.; Luan, Q.; Gao, C.; Lu, Z.; Liu, J. An Approach for Identifying Key Factors Controlling Variable Source Impervious Area in Heterogeneous Urban Landscapes under the Influence of Overland Flow Path. J. Hydrol. 2025, 655, 132915. [Google Scholar] [CrossRef]
  7. Sciuto, L.; Licciardello, F.; Scavera, V.; Verde, D.; Giuffrida, E.R.; Cirelli, G.L. The Role of Nature-Based Solutions for the Water Flow Management in a Mediterranean Urban Area. Ecol. Eng. 2024, 208, 107375. [Google Scholar] [CrossRef]
  8. Gholamnia, M.; Sajadi, P.; Khan, S.; Sannigrahi, S.; Ghaffarian, S.; Shahabi, H.; Pilla, F. Assessment and Modeling of Green Roof System Hydrological Effectiveness in Runoff Control: A Case Study in Dublin. IEEE Access 2024, 12, 189689–189709. [Google Scholar] [CrossRef]
  9. Pace, R.; Endreny, T.A.; Ciolfi, M.; Gangwisch, M.; Saha, S.; Ruehr, N.K.; Grote, R. Mitigation Potential of Urban Greening during Heatwaves and Stormwater Events: A Modeling Study for Karlsruhe, Germany. Sci. Rep. 2025, 15, 5308. [Google Scholar] [CrossRef]
  10. Koohestani, S.S.; Mukheibir, P.; Wakefield-Ran, R.; Santamouris, M. Adopting a Socio-Technical Perspective on the Challenges and Barriers in Transitioning to Blue-Green Infrastructure (BGI). Blue-Green Syst. 2025, 7, 79–94. [Google Scholar] [CrossRef]
  11. Chen, S.; Gou, Z. An Investigation of Green Roof Spatial Distribution and Incentive Policies Using Green Buildings as a Benchmark. Land 2022, 11, 2067. [Google Scholar] [CrossRef]
  12. Wang, J.; Mukhopadhyaya, P.; Valeo, C. Implementing Green Roofs in the Private Realm for City-Wide Stormwater Management in Vancouver: Lessons Learned from Toronto and Portland. Environments 2023, 10, 102. [Google Scholar] [CrossRef]
  13. Liberalesso, T.; Oliveira Cruz, C.; Matos Silva, C.; Manso, M. Green Infrastructure and Public Policies: An International Review of Green Roofs and Green Walls Incentives. Land Use Policy 2020, 96, 104693. [Google Scholar] [CrossRef]
  14. IPPLAN. Avaliação de Áreas de Risco Do Município de São José Dos Campos. Available online: https://www.sjc.sp.gov.br/media/45004/pmrr_final_i_e_ii.pdf (accessed on 18 June 2025).
  15. Marques, T.H.N.; Rizzi, D.; Ferraz, V.; Herzog, C.P. Soluções Baseadas Na Natureza: Conceituação, Aplicabilidade e Complexidade No Contexto Latino-Americano, Casos Do Brasil e Peru. Rev. Labverde 2021, 11, 12–49. [Google Scholar] [CrossRef]
  16. Borges, C.B.N.; Amorim, L.; Gonzaga, S.C.M.; Nogueira, F.F.; Silva, F.G.; Martins, J.R.S.; Itajahy, D.; Venturi, S.G.; Chaves, C.F. Critério Para a Escolha de Anteprojeto de Técnicas de Drenagem Sustentável—Estudo de Caso Córrego Senhorinha em São José Dos Campos. In Proceedings of the XV Encontro Nacional de Águas Urbanas, Recife, Brazil, 16–20 September 2024; ABRHidro: Recife, Brazil, 2024; p. 10. [Google Scholar]
  17. Rossi, M. Mapa Pedológico do Estado de São Paulo: Revisado e Ampliado; Instituto Florestal: São Paulo, Brazil, 2017; ISBN 3239660180. [Google Scholar]
  18. Sartori, A.; Neto, F.; Genovez, A. Classificação Hidrológica de Solos Brasileiros para a Estimativa da Chuva Excedente com o Método do Serviço de Conservação do Solo dos Estados Unidos Parte 1: Classificação. Rev. Bras. Recur. Hídricos 2005, 10, 5–18. [Google Scholar] [CrossRef]
  19. Soil Conservation Service (SCS). Estimation of Direct Runoff from Storm Rainfall. In National Engineering Handbook; U.S. Department of Agriculture: Washington, DC, USA, 1956. [Google Scholar]
  20. USDA. Estimating Runoff Volume and Peak Discharge. In National Engineering Handbook; USDA Natural Resources Conservation Service: Washington, DC, USA, 2021. [Google Scholar]
  21. Amorim, L.F.; Magalhães, A.A.B.; Martins, J.R.S.; Duarte, B.P.D.S.; Nogueira, F.F. Hydrological Modeling Using Distributed Rainfall Data to Represent the Flow in Urban Watersheds. Rev. Bras. Recur. Hidricos 2022, 27, e30. [Google Scholar] [CrossRef]
  22. Prefeitura do Município de São José dos Campos. Produto 1: Relatório Técnico de Manejo Sustentável e Controle Da Poluição Difusa. In Estudo para Desenvolvimento de Tecnologias Aplciadas à Drenagem Sustenável para o Município de São José dos Campos; Prefeitura do Município de São José dos Campos: São José dos Campos, Brazil, 2024. [Google Scholar]
  23. Pereira-Flores, M.E.; Justino, F.; Rodrigues, J.M.; Boehringer, D.; Melo, A.A.M.; Cursi, A.G.; da Costa Pereira, V.; Pereira, O.G.; Ruiz-Vera, U.M. Seasonal Climate Impact on Brazilian Pasture (Brachiaria Brizantha Cv Marandu): Growth Rate, CO2 Efflux, and Irrigation Strategies. Theor. Appl. Climatol. 2023, 151, 651–666. [Google Scholar] [CrossRef]
  24. Tassi, R.; Lorenzini, F.; Allasia, D.G. Tool to Address Green Roof Widespread Implementation Effect in Flood Characteristics for Water Management Planning. IAHS-AISH Proc. Rep. 2015, 370, 217–222. [Google Scholar] [CrossRef]
  25. Departamento de Águas e Energia Elétrica (DAEE). Precipitações Intensas No Estado de São Paulo; DAEE/CTH: Sao Paulo, Brazil, 2018. [Google Scholar]
  26. Prefeitura do Município de São José dos Campos. Etapa 1—Drenagem Urbana. In Plano Diretor de Drenagem e Manejo de Águas Pluviais; Prefeitura do Município de São José dos Campos: São José dos Campos, Brazil, 2021; p. 158. [Google Scholar]
  27. Palla, A.; Gnecco, I. Hydrologic Modeling of Low Impact Development Systems at the Urban Catchment Scale. J. Hydrol. 2015, 528, 361–368. [Google Scholar] [CrossRef]
  28. Kleidorfer, M.; Mikovits, C.; Jasper-Tönnies, A.; Huttenlau, M.; Einfalt, T.; Rauch, W. Impact of a Changing Environment on Drainage System Performance. Procedia Eng. 2014, 70, 943–950. [Google Scholar] [CrossRef]
  29. Orsi, E.; Crispino, G.; Iervolino, M.; Gisonni, C. Hydraulic and Hydrologic Invariance: Effectiveness of Green Roofs and Permeable Pavements. J. Irrig. Drain. Eng. 2025, 151, 04025001. [Google Scholar] [CrossRef]
  30. Sims, A.W.; Robinson, C.E.; Smart, C.C.; O’Carroll, D.M. Mechanisms Controlling Green Roof Peak Flow Rate Attenuation. J. Hydrol. 2019, 577, 123972. [Google Scholar] [CrossRef]
  31. Bengtsson, L. Peak Flows from Thin Sedum-Moss Roof. Nord. Hydrol. 2005, 36, 269–280. [Google Scholar] [CrossRef]
  32. Cavadini, G.B.; Rodriguez, M.; Cook, L.M. Connecting Blue-Green Infrastructure Elements to Reduce Combined Sewer Overflows. J. Environ. Manag. 2024, 365, 121465. [Google Scholar] [CrossRef]
  33. Vijayaraghavan, K.; Biswal, B.K.; Adam, M.G.; Soh, S.H.; Tsen-Tieng, D.L.; Davis, A.P.; Chew, S.H.; Tan, P.Y.; Babovic, V.; Balasubramanian, R. Bioretention Systems for Stormwater Management: Recent Advances and Future Prospects. J. Environ. Manag. 2021, 292, 112766. [Google Scholar] [CrossRef]
  34. Osawa, T.M.; Cristina, M.; Pereira, S.; Chaves, B.; Leite, C.; Rodolfo, J.; Martins, S. Impact of an Aged Green Roof on Stormwater Quality and First-Flush Dynamics. Buildings 2025, 15, 1763. [Google Scholar] [CrossRef]
  35. Rahman, M.A.; Alim, M.A.; Jahan, S.; Rahman, A. Vegetated Roofs as a Means of Sustainable Urban Development: A Scoping Review. Water 2022, 14, 3188. [Google Scholar] [CrossRef]
  36. Meng, F.; Yuan, Q.; Bellezoni, R.A.; Puppim de Oliveira, J.A.; Hu, Y.; Jing, R.; Liu, G.; Yang, Z.; Seto, K.C. The Food-Water-Energy Nexus and Green Roofs in Sao Jose Dos Campos, Brazil, and Johannesburg, South Africa. NPJ Urban Sustain. 2023, 3, 12. [Google Scholar] [CrossRef]
  37. Liberalesso, T.; Silva, C.M.; Cruz, C.O. Combined Strategies for Green Roof Incentive Policies in Lisbon: Evaluating the Potentiality of Concession Grants and Identifying Priority Intervention Areas. Urban For. Urban Green. 2024, 99, 128451. [Google Scholar] [CrossRef]
  38. Jayasooriya, V.; Fernando, S.; Silva, C.; Muthukumaran, S. Comparative Analysis on the Effectiveness of Green Roofs and Photovoltaic Panels as Sustainable Rooftop Technologies. Environ. Sci. Pollut. Res. 2023, 30, 98977–98992. [Google Scholar] [CrossRef]
  39. Mendonça, R.; Roebeling, P.; Fidélis, T.; Saraiva, M. Can Policy Instruments Enhance the Benefits of Nature-Based Solutions and Curb Green Gentrification? The Case of Genova, Italy. Environ. Dev. 2024, 50, 100995. [Google Scholar] [CrossRef]
  40. Ferreira, V.d.N.; De Araujo, L.O.C.; Qualharini, E.L.; Vazquez, E.G.; Chaer, I.; Najjar, M.K. Building Retrofit for Energy Efficiency in Existing Buildings: A Case Study of a Social Residential Building in France. DYSONA—Appl. Sci. 2025, 6, 223–238. [Google Scholar] [CrossRef]
  41. Khalaji, F.; Zhang, J.; Sharma, A.K. Social and Economic Impacts of Water Sensitive Urban Design: A Review. Water 2025, 17, 16. [Google Scholar] [CrossRef]
  42. Treglia, M.L.; McPhearson, T.; Sanderson, E.W.; Yetman, G.; Maxwell, E.N. Examining the Distribution of Green Roofs in New York City through a Lens of Social, Ecological, and Technological Filters. Ecol. Soc. 2022, 27, 20. [Google Scholar] [CrossRef]
  43. Wu, J.; Yang, P.; Yi, K.; Zhou, Y.; Tan, Q. Residents’ Heterogeneous Willingness to Adopt Green Roofs in a Southern Chinese City Revealed via Interpretable Machine Learning. Ecol. Indic. 2025, 171, 113237. [Google Scholar] [CrossRef]
  44. Hamouz, V.; Møller-Pedersen, P.; Muthanna, T.M. Modelling Runoff Reduction through Implementation of Green and Grey Roofs in Urban Catchments Using PCSWMM. Urban Water J. 2020, 17, 813–826. [Google Scholar] [CrossRef]
  45. Yao, L.; Wu, Z.; Wang, Y.; Sun, S.; Wei, W.; Xu, Y. Does the Spatial Location of Green Roofs Affects Runoff Mitigation in Small Urbanized Catchments? J. Environ. Manag. 2020, 268, 110707. [Google Scholar] [CrossRef]
  46. Palla, A.; Gnecco, I.; La Barbera, P. Assessing the Hydrologic Performance of a Green Roof Retrofitting Scenario for a Small Urban Catchment. Water 2018, 10, 1052. [Google Scholar] [CrossRef]
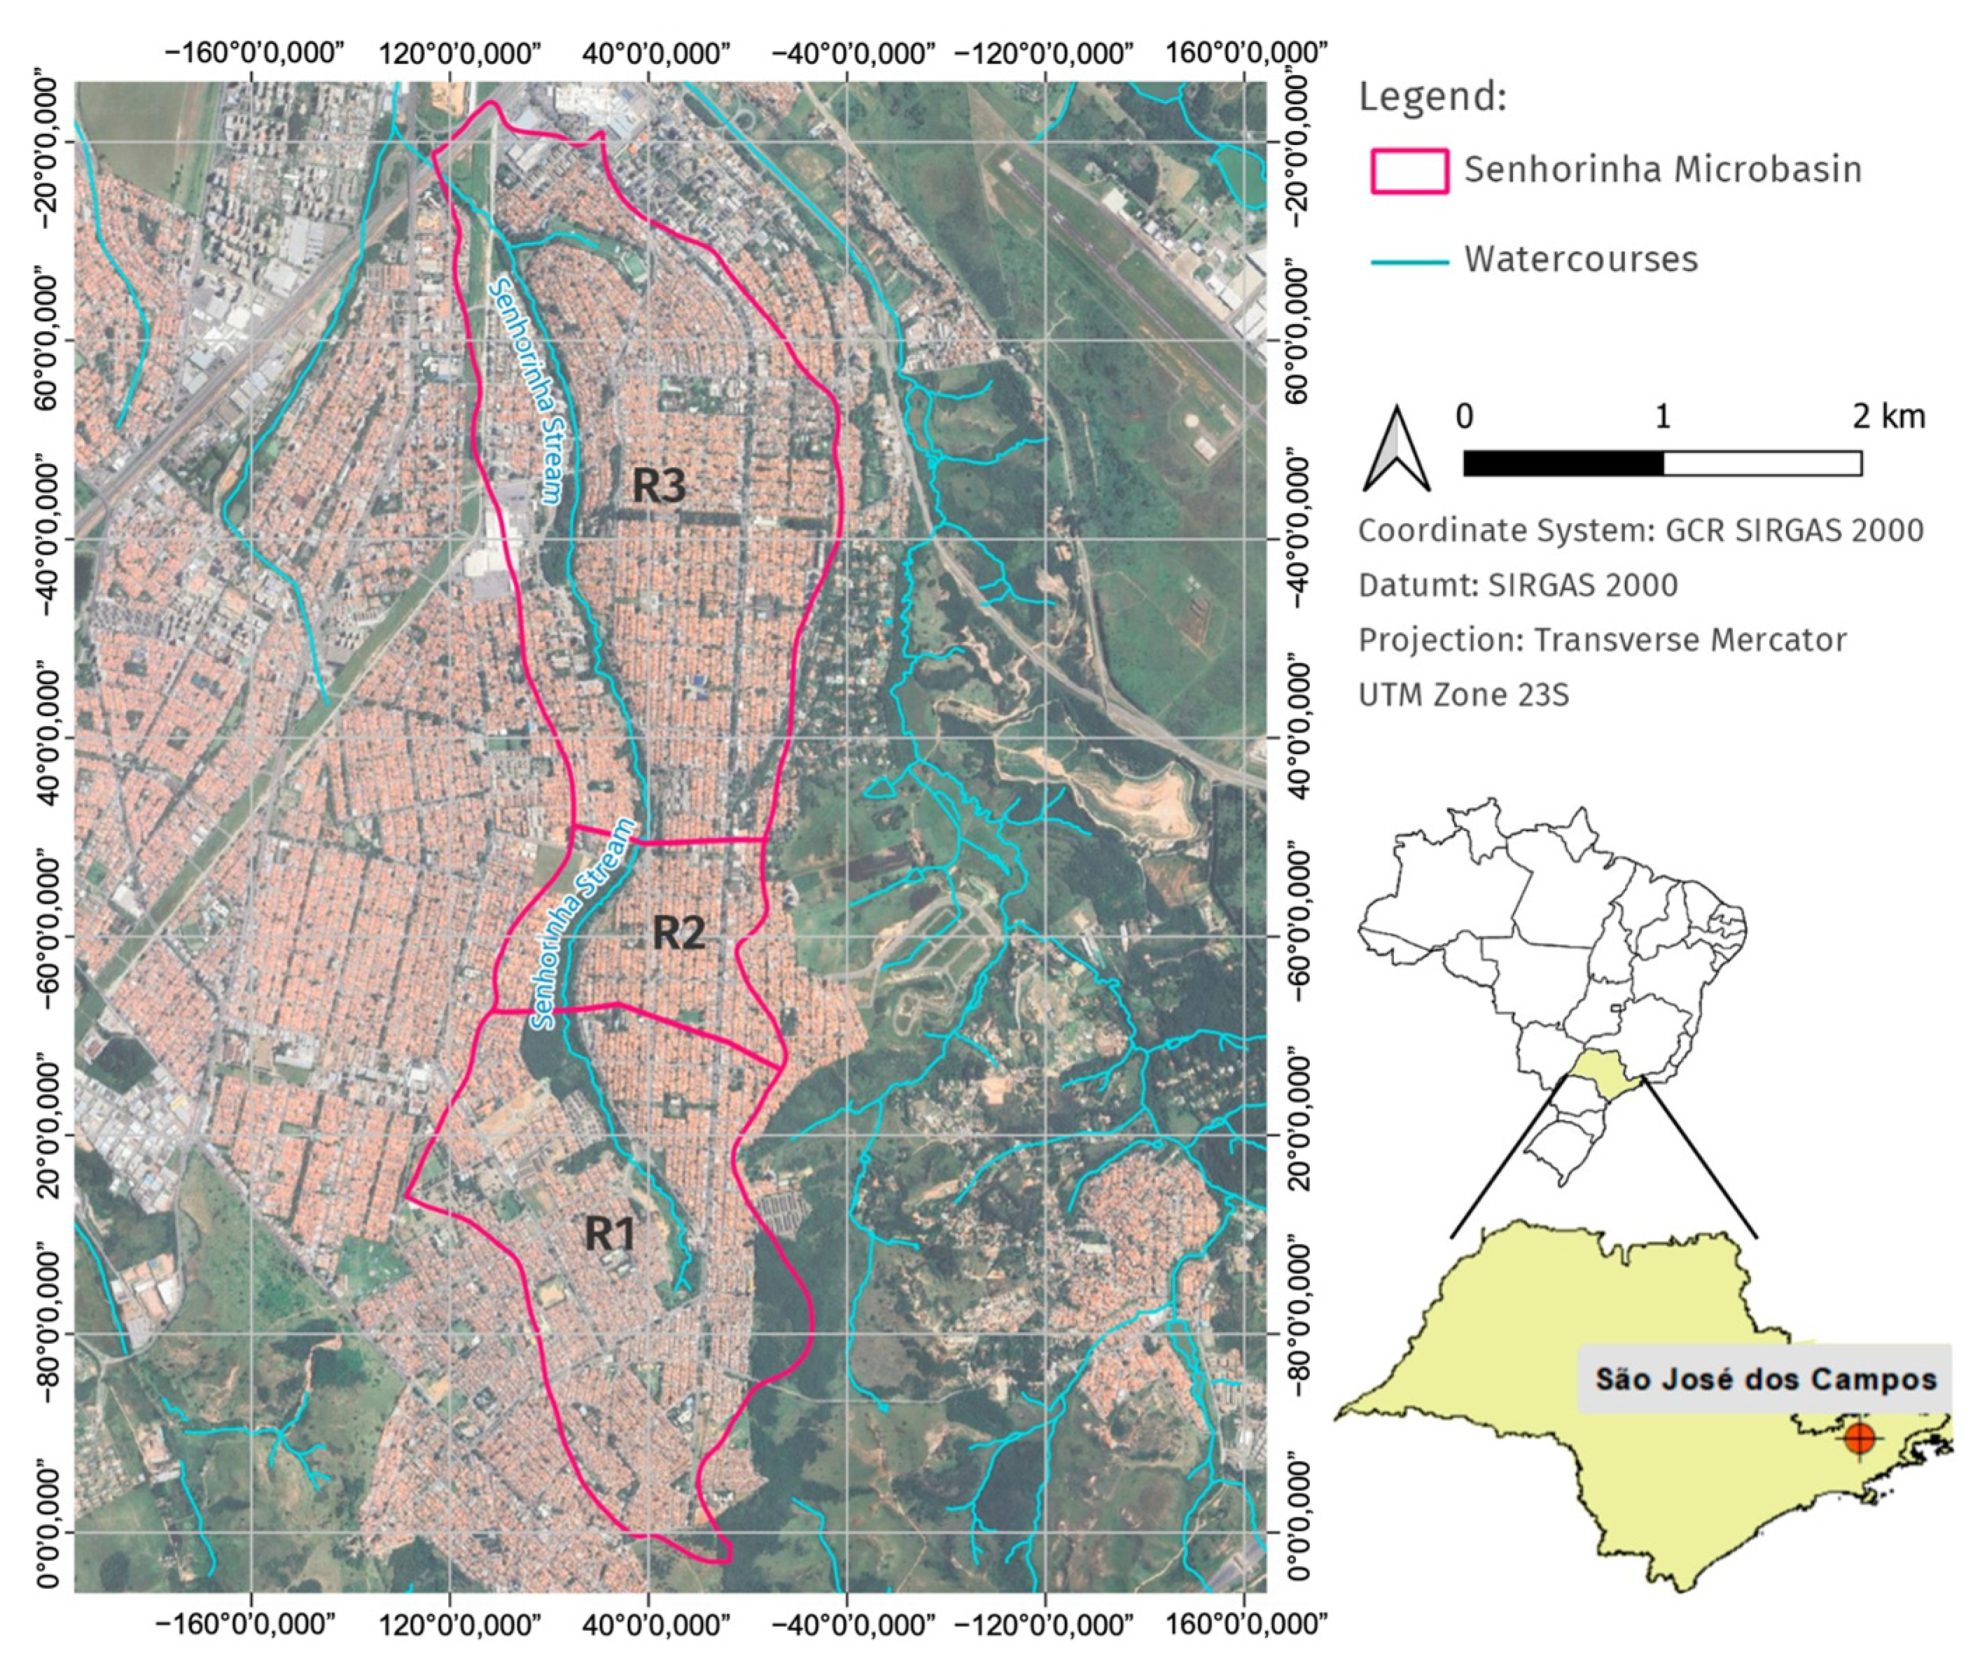
Figure 1. Localization map of the Senhorinha Creek Microbasin showing the delineation of the R1, R2, and R3 contributing areas.
Water 17 01936 g001
Figure 2. Comparison between observed and simulated hydrographs for rainfall Events 2 (validation) and 5 (calibration).
Water 17 01936 g002
Figure 3. Plan view and cross-section of the green roof (GR). The plan view illustrates the overall layout, including dimensions, slope direction, and drainage configuration. The cross-section presents the functional layers of the GR system, indicating their respective roles and approximate thicknesses.
Water 17 01936 g003
Figure 4. Hyetograph generated for rainfall of 2-, 5-, and 10-year return period and 1 h duration.
Water 17 01936 g004
Figure 5. Simulated hydrographs at the outlet of the Senhorinha Watershed and corresponding hyetographs for rainfall events with 2-year (top), 5-year (middle), and 10-year (bottom) return periods, each with a 1 h duration. Each subplot compares four scenarios: Base, Mandatory, Incentivized, and Ideal green roof retrofitting.
Water 17 01936 g005
Figure 6. Linear regression analysis between EIA and GR hydrological performance under various retrofitting scenarios in the studied watershed, based on a 2-year return period rainfall event.
Water 17 01936 g006
Figure 7. Hydrological performance metrics for rainfall events with 2-, 5-, and 10-year return periods (1 h duration) under three projected GR retrofitting scenarios.
Water 17 01936 g007
Table 1. Land use and land cover (LULC) distribution within the study area.
LULCArea (m2)Percentage (%)
Residential3,876,43340.4%
Roads2,173,53422.7%
Green areas1,715,22017.9%
Commerce and service618,2326.4%
Others1,090,6437.8%
Total area9,595,869100%
Table 2. Curve Number (CN) values assigned to each LULC class in the study area. Values are based on Hydrological Soil Group B and adapted from the SCS-CN method [20].
LULC ClassificationSCS-CN Land Use CategoryCN (Soil Group B)
CemeteryOpen space in poor condition79
Commerce and ServicesCommercial and business92
IndustrialIndustrial 88
Horizontal ResidentialResidential Type I85
Vertical ResidentialResidential Type I85
Gated CommunitiesResidential Type II75
Residential Green AreasOpen space in fair condition69
Green Area (Park, PMSJC)Open space in good condition61
ParkingPaved roads with drainage98
InstitutionalResidential Type I85
Mixed-useResidential Type I85
Utility AreaResidential Type I85
Vacant LandNatural desert landscaping77
Roadside VegetationOpen space in fair condition69
RoadsPaved roads with drainage98
Rural ResidentialResidential Type III72
Informal SettlementsDeveloping urban area86
Table 3. Morphological and hydrological characteristics of the analyzed sub-basins, including area, channel length, river slope, impervious area (IA), Effective Impervious Area (EIA), CN, and time of concentration (Tc).
Sub-BasinArea ( k m 2 )Channel Length (km)River SlopeIA (%)EIACNTc (h)
R13.371.541.6%51%35%89.20.182
R21.081.000.9%48%34%87.90.160
R34.793.540.3%55%38%90.50.655
Table 4. Nash–Sutcliffe Efficiency (NSE) and Root Mean Square Error (RMSE) values for each rainfall event, used to evaluate model performance in runoff prediction. Events 1–4 were used for validation, and Events 5–8 for calibration.
Event NumberRMSENSE
11.180.97
20.930.73
33.060.07
40.570.87
51.250.83
60.330.63
70.110.87
80.730.31
Table 5. GR retrofitting scenarios applied to IA and EIA across different land use categories in São José dos Campos. The table summarizes the percentage of IA and EIA retrofitted to GRs under four scenarios: Base (no intervention), Mandatory, Incentivized, and Ideal.
ScenariosIA and EIA Retrofitted to Green Roof (%)
ResidentialCommerce and ServiceOthersGreen AreasRoad
Base-----
Mandatory10%10%10%--
Incentivized80%10%10%--
Ideal80%80%80%--
Table 6. Summary of GR area allocation and its hydrological impacts across retrofitting scenarios in sub-basins R1, R2, and R3. The table presents total GR area (in km2 and percentage), as well as changes in IA, EIA, time of concentration (in hours), and CN under four scenarios: Base (no intervention), Mandatory, Incentivized, and Ideal.
ScenariosGR Area ( k m 2 )GR AreaIAEIATime of Concentration (h)CN
R1R2R3R1R2R3
Base0.000%53%37%0.1820.1600.65589.288.090.5
Mandatory0.344%49%34%0.1880.1680.66388.687.189.8
Incentivized2.0923%30%21%0.2230.2070.70085.283.389.7
Ideal2.7430%23%16%0.2310.2210.71884.382.089.7
Table 7. Hydrological performance indicators for projected GR retrofitting scenarios under design rainfall events with 2-, 5-, and 10-year return periods, compared to the base case scenario.
Hydrological PerformanceScenarios
Mandatory
(EIA = 34%)
Incentivized
(EIA = 21%)
Ideal
(EIA = 16%)
Two-year return period
Peak attenuation (%)6%33%41%
Peak delay (%)3%27%33%
Centroid delay (%)1%10%13%
Runoff volume reduction (%)4%26%35%
Five-year return period
Peak attenuation (%)5%29%36%
Peak delay (%)3%27%33%
Centroid delay (%)1%10%12%
Runoff volume reduction (%)4%22%29%
Ten-year return period
Peak attenuation (%)5%27%33%
Peak delay (%)3%27%30%
Centroid delay (%)1%10%12%
Runoff volume reduction (%)3%20%26%
Disclaimer/Publisher’s Note: The statements, opinions and data contained in all publications are solely those of the individual author(s) and contributor(s) and not of MDPI and/or the editor(s). MDPI and/or the editor(s) disclaim responsibility for any injury to people or property resulting from any ideas, methods, instructions or products referred to in the content.