Article

Impact of Diverse Calcite Vein Patterns on Dissolution Characteristics of Triassic Limestone in Three Gorges Reservoir Area

1
State Key Laboratory of Deep Petroleum Intelligent Exploration and Development, Institute of Geology and Geophysics, Chinese Academy of Sciences, Beijing 100029, China
2
College of Earth and Planetary Sciences, University of Chinese Academy of Sciences, Beijing 100049, China
*
Authors to whom correspondence should be addressed.
Water 2025, 17(10), 1550; https://doi.org/10.3390/w17101550
Submission received: 16 April 2025 / Revised: 15 May 2025 / Accepted: 15 May 2025 / Published: 21 May 2025
(This article belongs to the Special Issue Water–Rock Interaction)

Abstract

:
Carbonate rock slopes in reservoir environments are increasingly exposed to dissolution-induced deterioration due to water level fluctuations. However, the influence of internal structures—particularly calcite veins—on dissolution behavior remains inadequately understood. The acid-induced dissolution of limestone by a sulfuric acid solution leads to the removal of soluble minerals and changes to the rock structure. Natural variation in rock structures—particularly in the presence, density, and morphology of calcite veins—can significantly affect the dissolution process and its outcomes. In this study, we obtained three types of Triassic limestone from the same host rock but with varying vein structures from the Three Gorges Reservoir area. Cylindrical rock specimens were prepared to investigate the acid-induced dissolution behavior of limestone in a sulfuric acid solution. We identified and analyzed the macrostructures on the rock specimens before and after the interaction. Additionally, SEM was employed to observe the microstructures of the specimens before and after the acid-induced dissolution, and fractal dimension analysis was conducted on the SEM images to quantify surface complexity. Furthermore, we used a focused ion beam–scanning electron microscope (FIB-SEM) with an automatic mineral identification and characterization system, as well as mineral roundness calculation, for mineral identification and analysis. Based on the experiments and analyses, we determined the following: The contact surfaces between the host rock and the calcite veins increase the dissolution areas between the limestone and the sulfuric acid solution, intensifying the dissolution reactions, enhancing the connectivity of the original microstructural planes, and generating new, highly extended dissolution fissures. The calcite veins facilitate the entry of sulfuric acid solution into the limestone, intensifying the dissolution of the edges and corners of dolomite and resulting in the gradual rounding of dolomite shapes. Quantitatively, the limestone with dense, fine calcite veins exhibited the most severe dissolution, with water absorption rates nearly twice as high as the non-veined samples (0.13% vs. 0.07%), a 2.2% reduction in fractal dimension, and a 19.53% increase in dolomite roundness with the 1 ≤ R ≤ 3 interval, indicating significantly enhanced surface complexity and mineral reshaping. In summary, the presence of more calcite veins, regardless of their width, leads to more severe rock dissolution.

1. Introduction

Calcite veins are fractures or cracks in rocks filled with calcium carbonate (calcite), typically formed through various geological processes such as hydrothermal fluid infiltration or tectonic stress relaxation. Their morphology—including size, thickness, and distribution—varies depending on the host rock type and the geochemical environment in which they are formed. The presence of calcite veins significantly influences the physical and mechanical behavior of the surrounding rocks. For instance, He et al. [1] demonstrated that thicker calcite veins reduce compressive strength and alter fracture propagation pathways in limestone. Similarly, Chen et al. [2] reported that the orientation and density of natural calcite veins affect stress concentration zones and promote preferential crack evolution. These findings underline the critical role of calcite veins in determining rock strength, permeability, and porosity in geological, engineering, and mining contexts.
Calcite veins can serve as potential zones of weakness, ultimately compromising the overall strength of the rock mass. Furthermore, these veins can modify the deformation behavior of rocks, leading to changes in their mechanical properties [1]. Cai et al. [3] suggested that calcite veins can induce shear failure and decrease the uniaxial compressive strength of the rock. Additionally, the presence of calcite veins can significantly impact the porosity and permeability of rocks, thereby influencing the flow behavior of fluids. Yang et al. [4] demonstrated that the existence of calcite veins increases the permeability of rocks, resulting in a greater potential for groundwater flow. Moreover, a study by Wang et al. [5] highlighted the potential for differential dissolution in rock mass due to the presence of calcite veins, ultimately affecting engineering design. This indicates that calcite veins have a distinct dissolution rate compared to the host rock.
Water–rock interaction is a critical geological process in the near-surface environment [6]. The presence of water with varying chemical compositions can have complex physical and chemical effects on rocks. Previous research has investigated the impact of different water solutions on various types of rocks.
The reaction between acid solutions and reservoir rocks can lead to the dissolution of minerals and have a significant impact on the stability of carbonate reservoirs. Thaysen et al. [7] conducted flow-through column experiments to investigate the effect of H2SO4-rich brine and H2SO4-free brine on limestone and sandstone. The results showed that the overall rock porosity increased by 7–19% in the presence of H2SO4-rich brine compared to the H2SO4-free conditions. It was also observed that SO2 impurities impacted the CO2–water–reservoir rock reactions under carbon storage conditions. The generation of sulfuric acid and subsequent acidification, as well as carbonate dissolution, were commonly observed in all experiments conducted by Pearce et al. [8].
In the field of energy geology, understanding water–rock interaction is crucial for developing insight into geological structures and changes within formations, as well as providing recommendations for hydraulic-fracturing engineering [9]. Wang et al. [5] conducted a study on the water–rock interactions of eight samples from a target petroleum production area. They found that interconnected microfractures could serve as efficient flow pathways. Ma et al. [10] investigated the dynamic dissolution mechanism of carbonate reservoirs using a rotating disk apparatus, revealing that the dissolution mechanism is influenced by lithology, structures, porosities, and solution compositions. Lai et al. [11] studied the impact of acid–rock reactions on the microstructure and mechanical properties of tight limestone through acid core-flooding tests. The results indicated that acid–rock reactions mainly occurred on the inlet surface of the core, leading to the development of large areas of loose microstructure. Lyu et al. [12] explored the mechanical properties of shale after long-term immersion in fracturing fluids. They found that water–rock reactions and hydration expansion caused changes in the shale’s microstructure and the pH of fracturing fluids, leading to alterations in the macromechanical properties.
Groundwater is a critical factor that impacts the stability of rock mass in rock engineering [13,14]. The interaction between groundwater and rock mass can lead to changes in mineral composition and the formation of voids and dissolution pores. Li et al. [15] discovered that acidizing corrosion of sandstone resulted in an increase in the number and volume of macropores; a fuzzy boundary of the pore structure; and a significant increase in effective porosity, the number of effective pores, and total porosity. The reaction of an acidic solution with sandstone minerals leads to an increase in free fluid space and a decrease in bound fluid space. In coal mine construction, acid solutions weaken the dynamic mechanical parameters of rock, corrode and soften sandstone, and increase post-peak strain [6]. In tunnel construction sites, underground water has a profound impact on the surrounding rocks. Li et al. [16] utilized the NMR technique to examine changes in the porosity of limestone taken from a tunnel construction site. The findings revealed that chemical erosion plays a significant role in macrocrack propagation in the limestone samples under triaxial compression. The prolonged interaction between water and rock mass can lead to increased creep deformation of the rock [17].
Water–rock interaction has caused various instability problems in geotechnical engineering [18]. The interaction between water and the foundation can cause erosion of the foundations. Changes in water level activate the chemical interaction between reservoir water/groundwater and limestone slopes, leading to the continuous deterioration of rock mass on the bank slope [19]. The dissolution of limestone can also induce mountain landslides, ground subsidence, and other geological disasters [20,21]. These issues have been widely documented in the Three Gorges Reservoir region, particularly along the Wuxia Gorge slopes, where frequent water level fluctuations and acid rain accelerate slope weakening and karst-related hazards. The cited studies provide important regional insights that support the relevance of the present research.
In recent years, researchers have utilized a variety of laboratory tests to investigate the interactions between water and rocks. The methods used include the solution flow, rotating disc, and periodic saturation–air drying techniques [22,23,24]. While these methods have proven valuable in studying water–rock interactions, they do not account for periodic water level fluctuations. As a result, there is a pressing need to develop a water–rock interaction apparatus that can automatically change the water level, allowing for a more comprehensive understanding of these interactions.
In the Three Gorges Reservoir, China, the local acid rain and fluctuating reservoir levels trigger intense physical and chemical reactions between the reservoir water and the adjacent rock formations. Limestone with various structures can be found extensively along reservoir banks, often containing calcite veins that can significantly influence the dissolution properties of the surrounding rock during water–rock interactions. While existing research has predominantly focused on the impact of water–rock interactions on rock properties, this study seeks to investigate how different calcite vein structures affect the dissolution characteristics of Triassic limestone.
To accomplish this, a self-developed solution–rock interaction simulation device was used to conduct dissolution tests, simulating the acid solution–rock interaction process between limestone and sulfuric acid. This was followed by the collection of rock samples for further analysis. Subsequently, the microstructure dissolution characteristics of the limestone were evaluated utilizing a scanning electron microscope (SEM). Further mineral identification and analysis of the limestone samples were conducted using a focused ion beam–scanning electron microscope (FIB-SEM) with an automatic mineral identification and characterization system.
Despite growing attention to acid-induced limestone dissolution in reservoir environments, few studies have systematically examined how different calcite vein structures influence dissolution behavior at both the macro- and microscale levels. This study uniquely combines long-term acid exposure simulation with high-resolution characterization techniques—including SEM, FIB-SEM, and AMICS—to analyze the structural degradation and mineralogical characteristics in Triassic limestone taken from the Three Gorges Reservoir area. The novelty of this work lies in its focus on vein pattern variability within a single lithological unit, its integration of fractal and roundness analyses, and its implications for geotechnical stability assessment in a karst terrain. These contributions aim to bridge the gap between geochemical processes and structural consequences in carbonate slope environments.

2. Experiment

2.1. Limestone Sample Preparation

The limestone for this study was obtained from the Triassic Jialingjiang Formation in the Wu Gorge of the Three Gorges Reservoir, China (Figure 1a). The water level in the Three Gorges Reservoir fluctuates annually between 145 m and 175 m ASL (Figure 1b). A part of the Jialingjiang Formation, within the fluctuation zone, regularly interacts with the reservoir water. To analyze the changes in the characteristics of Triassic limestone after water–rock interaction, we obtained relatively fresh samples from above the water fluctuation zone (Figure 1b). Limestone that has the same host rock can exhibit various vein structures as a result of geological processes, which also impact the results of water–rock interaction. At the sampling site, the limestone of the Jialingjiang Formation mainly exhibits three types of calcite vein structures, as illustrated in Figure 2. Limestone without calcite veins is depicted in Figure 2b. Additionally, limestone with sparse, broad calcite veins is commonly found in the Wuxia Gorge (Figure 2c). Another type of limestone featuring dense, fine calcite veins is also frequently observed, as shown in Figure 2d.
The prolonged interaction between water and rock in the Three Gorges Reservoir area has led to limestone dissolution, deteriorating the rocks’ physical and mechanical properties. This, in turn, affects the stability of the bank slope. In addition to the external environmental factors, the dissolution of limestone is mainly influenced by intrinsic factors such as mineral compositions and rock structures. Calcite veins seal natural fractures through crystal growth in the limestone, and the interfaces between the veins and host rock are considered critical structures. The limestone of the Jialingjiang Formation has nearly identical mineral compositions, making vein structures a crucial factor in limestone dissolution. The interface between host rock and calcite veins provides access for water to enter the interior of the limestone, facilitating water–rock interactions.
To investigate the effect of various calcite vein structures, as shown in Figure 2b–d, on the dissolution characteristics of Triassic limestone, we collected corresponding rock samples from the Wuxia Gorge, as shown in Figure 3. Figure 3a depicts fresh, pure limestone without visible calcite veins, originating from the limestone featured in Figure 2b. Figure 3b displays limestone specimens with a distinct broad white calcite vein, obtained from the limestone in Figure 2c. In comparison, Figure 3c shows specimens with multiple fine white calcite veins distributed throughout, sourced from the limestone depicted in Figure 2d. Each rock specimen was cut into cylinders measuring 20 mm in diameter and 25 mm in height. These three types of samples are directly used in the sulfuric acid solution–limestone reaction test discussed later in this paper.
The X-ray fluorescence analysis, conducted using an AXIOS-Minerals XRF spectrometer (PANalytical, Almelo, The Netherlands), revealed quantitative results of mineral content in the three types of limestone specimens, as presented in Table 1. The analysis was performed on powdered samples obtained from the bulk specimens, ensuring a representative composition of the entire sample. It is evident that the specimens share the same mineral types, but with variations in their respective contents. The minerals include calcite, feldspar, quartz, clay, dolomite, and pyrite. When analyzing the average mineral area percentages, the specimens without veins exhibited 66.4% calcite, 21.3% feldspar, 4.6% quartz, 4.6% clay, 2.8% dolomite, and 0.2% pyrite. On the other hand, the specimens with multiple fine white calcite veins showed average mineral percentages of 68.8% calcite, 18.9% feldspar, 5.4% quartz, 5.2% clay, 1.7% dolomite, and 0.0% pyrite. A comparison between the specimens with and without veins indicated an increase in the calcite content from 66.4% to 68.8% in the presence of dense, fine calcite veins. This demonstrates the influence of calcite veins on the overall composition of the limestone. Furthermore, the specimens with a broad calcite vein displayed the highest calcite content of 72.5%, as they contained the largest calcite veins area among the three sample types.

2.2. Testing Apparatus and Method

2.2.1. Sulfuric Acid Solution–Limestone Reaction Test

The water level of the Three Gorges Reservoir fluctuates annually between 145 m and 175 m above sea level (ASL). This fluctuation process involves a sequence of stages, including high level, drawdown, low level, and water rising (Figure 4). The variation in water level leads to frequent interactions between the reservoir water and the bank slope rocks, gradually dissolving the rock mass within the water fluctuation zone. To study the effects of this process, fresh rock samples were compared with dissolved samples in the laboratory, enabling an examination of the changes in mineral composition and providing insights into the micro- and macrostructure variations before and after dissolution.
To investigate the changes in the microscopic characteristics of Triassic limestone resulting from water–rock interaction, dissolved samples were obtained by reacting fresh samples with a solution in a controlled environment. A solution–limestone interaction test (referred to as the SL test) was conducted using a self-developed solution–rock interaction simulation device (Figure 5c). This device automatically adjusted the solution level to mimic the water level fluctuations observed in the Three Gorges Reservoir area.
In the SL test, the solution level was systematically adjusted to replicate the natural fluctuation process (Figure 4). The solution level underwent a sequence of stages, namely high level, drawdown, low level, solution rising, and high level (Figure 5a,b). Specifically, the solution level gradually decreased from 30 cm to 0 cm and remained at 0 cm for 3 h. Subsequently, the solution level rose back to 30 cm and was maintained for 2 h. One complete fluctuation cycle in the laboratory lasted 12 h, corresponding to the 12-month cycle in the Three Gorges Reservoir area.
To address the concern of whether this accelerated laboratory test realistically mimics the much slower natural process, we emphasize that the key parameters of the water level fluctuation process—such as the amplitude and sequence of stages—were carefully replicated. Additionally, the solution used in the test was designed to reflect the chemical conditions of the reservoir water, particularly the effects of sulfuric acid rain, which is common in the Three Gorges Reservoir area. The experimental solutions were prepared using deionized purified water (free of mineral elements and electrolytes) (Maixiang Medical Technology (Suzhou) Co., Ltd., Suzhou, Jiangsu Province, China) and a 0.1 mol/L standard sulfuric acid solution (Xiamen Haibiao Technology Co., Ltd., Xiamen, Fujian Province, China). By adjusting the concentration of hydrogen ions (H+) and sulfate ions (SO42−) in the solution and comparing the surface changes in the limestone on the bank slope over the course of a year, we ensured that the dissolution effects in the laboratory were representative of the field conditions.
The pH value of the solution in the laboratory was not strictly consistent with the natural pH of the reservoir water. Instead, it was calibrated based on the observed dissolution effects on limestone in the field. In the laboratory, the pH of the sulfuric acid solution was adjusted to achieve similar dissolution rates and patterns as observed in the field. This approach allowed us to simulate the long-term effects of water–rock interaction within a practical timeframe.
The entire dissolution test lasted for 552 h (23 days), equivalent to 46 years of field exposure based on the accelerated time scale. During the test, the pH of the solution was continuously monitored using a high-precision pH meter, and the dissolution progress was recorded at regular intervals.
In summary, this test setup effectively simulates long-term limestone dissolution under acidic conditions by using an accelerated 552 h experiment calibrated to reflect approximately 46 years of natural exposure. Furthermore, continuous monitoring and regulation of pH throughout the test ensured that the chemical environment remained dynamically stable and comparable to the reservoir conditions. These measures address both the temporal and chemical aspects of limestone dissolution, providing a reliable basis for interpreting microstructural and mineralogical changes.

2.2.2. Water Absorption Test Under Normal Pressure and Temperature (NPT) Conditions

The reaction between the sulfuric acid solution and the limestone primarily involves the interaction of calcite with hydrogen ions. The overall intensity of the reaction depends greatly on the rate at which hydrogen ions can reach the rock surface. This, in turn, is influenced by the microstructure of the rock, including its surfaces and voids, which provide pathways for the transfer of hydrogen ions. To quantitatively characterize the amount and connectivity of these microstructure surfaces and voids, we conducted water absorption experiments under NPT conditions. We calculated the absorption rate of the rock using Equation (1), where w a represents water absorption (%), m d is the mass of dry rock, and m 0 is the total mass of the dried rock samples after soaking in water for 48 h. A higher w a indicates a greater presence of microstructure surfaces and voids, as well as better connectivity.
To evaluate the variability and potential differences in water absorption rates among the three limestone types, we calculated the average values and standard deviations for each type. The results, as shown in Table 2, reveal that specimens with multiple fine calcite veins have the highest average water absorption (0.13 ± 0.02%), followed by specimens with a distinct broad calcite vein (0.10 ± 0.02%), and limestone without veins (0.07 ± 0.01%). The higher water absorption rates in specimens with multiple fine calcite veins suggest a more developed network of microstructure surfaces and voids, which facilitates the transfer of hydrogen ions and enhances the dissolution process. These findings are consistent with the observed differences in the dissolution behavior of the three limestone types. However, due to the limited sample size, further studies with larger datasets and advanced statistical analyses are recommended to confirm the statistical significance of these differences.
w a = m 0 m d m d × 100 %

2.2.3. Microstructure Imaging

The scanning electron microscope (SEM) is a powerful tool for studying rock structures. In this study, we employed focused ion beam–scanning electron microscopy (FIB-SEM) (Carl Zeiss Industrielle Messtechnik GmbH, Oberkochen, Baden-Württemberg, Germany) to enable precise mineralogical analysis. Small limestone specimens were prepared for high-resolution surface scanning, enabling the detailed imaging of specific regions with a resolution of up to 1.0 μm.
To examine the dissolution effects of sulfuric acid on the microstructure of the three limestone types, SEM scanning was performed on polished specimens (prepared via argon ion milling) before and after the SL test. The specimens were taken from the host rock portion of cylindrical samples and imaged at 5000× magnification, providing insights into compositional and structural changes induced by acid exposure.

2.2.4. Mineral Composition Analysis

To discern the mineralogical composition of the samples pre- and post-dissolution, we employed focused ion beam–scanning electron microscopy (FIB-SEM) equipped with an automatic mineral identification and characterization system (AMICS) (Bruker; see: https://www.bruker.com/en/products-and-solutions/elemental-analyzers/eds-wds-ebsd-SEM-Micro-XRF/software-amics-automated-mineralogy-system.html?utm_source, accessed on 15 April 2025) for precise mineral identification and quantification. AMICS is a software platform that integrates mineralogical databases with BSE-SEM imagery and EDS data to automatically identify, classify, and quantify mineral phases based on compositional and textural information. The specimens selected for mineralogical examination were consistent with those observed for microstructural analysis. To enhance the micro-mineralogical analysis of the three limestone variants, a 5 nm carbon coat was applied to the specimen surfaces. Subsequently, the Backscattered Electron (BSE) mode of SEM was utilized for imaging. This was integrated with the AMICS mineral database to facilitate the automated identification and quantification of the minerals present. Although XRD was not performed in this study, the integration of FIB-SEM and AMICS enabled the high-resolution identification and quantification of mineral phases before and after dissolution, offering localized mineralogical insights beyond bulk analysis.

2.2.5. Fractal Dimension Analysis

The fractal dimension (D) was calculated from SEM images to quantify surface roughness using the box-counting method [25]. The SEM images were first binarized using a thresholding algorithm to clearly distinguish pore or grain boundaries. A series of square grids with varying box sizes (ranging from 2 to 64 pixels) were superimposed on each binarized image, and the number of boxes intersecting mineral edges was recorded at each scale. The logarithm of the box count was plotted against the logarithm of box size, and the slope of the resulting linear fit was computed as the fractal dimension. All calculations were implemented using a custom C program developed by the authors. Multiple images were processed per sample to ensure repeatability and statistical reliability. This approach provides a robust metric for comparing microscale dissolution effects across different limestone types.

2.2.6. Morphological Characterization and Roundness Quantification

While the acid-induced dissolution does not significantly alter the types of minerals in limestone, it markedly affects their morphological features, particularly in minerals that are soluble in sulfuric acid. These morphological changes can indicate the degree of dissolution. The primary mineral in all samples, calcite, is distributed extensively in the FE-SEM mineral images, but its indistinct boundaries make it unsuitable for morphological study. In contrast, dolomite exhibits more well-defined grain boundaries and pronounced morphological response to sulfuric acid, including dissolution (with calcium sulfate formation; Equation (2))and edge smoothing.
To evaluate the extent of morphological changes caused by dissolution, we quantitatively analyzed the roundness of dolomite particles. The analysis was performed using Image-Pro Plus v6.0.0.260 (Media Cybernetics), which calculates particle roundness based on Equation (3). According to Ford and Williams [23], ideal (stoichiometric) dolomite comprises CaCO3 and MgCO3 molecules in alternate layers. A layer of CaCO3 is quickly peeled away via dissolution. Magnesium carbonate is more strongly bonded. Its exposed layer resists dissolution, while any residual pinnacles of CaCO3—plus MgCO3 protruding from it—attract HCO3 ions in the back reaction. As the density of lattice defects increases, so do the opportunities to “unravel” the crystal by following screw dislocations that breach its MgCO3 layers.
CaMg(CO3)2 + 2H2SO4 = CaSO4 + MgSO4 + 2CO2↑ + 2H2O
R o u n d e s s ( R ) = p e r i m e t e r 2 4 π × a r e a ( p o l y g o n )
In Equation (3), the term “perimeter” refers to the total length of the object’s outline, while “area (polygon)” denotes the enclosed area within the polygon that defines the object’s outline; this polygon is identical to the one used for calculating the perimeter. The roundness (R) quantifies the extent to which dolomite mineral granules approximate a circular shape. Within the Image Pro-Plus software, R is always equal to or greater than 1. A value of R equal to 1 indicates perfect circularity of the dolomite particles. As the value of R increases, it signifies a deviation of the dolomite particles from a perfectly round shape.
Prior to analysis, the FE-SEM images were binarized, and dolomite grains were manually segmented and verified to ensure correct mineral identification. Over 200 dolomite particles were measured per sample to ensure statistical reliability. This method allowed us to assess the degree of mineral edge rounding and morphological evolution under acid exposure across different limestone types.

3. Results and Analysis

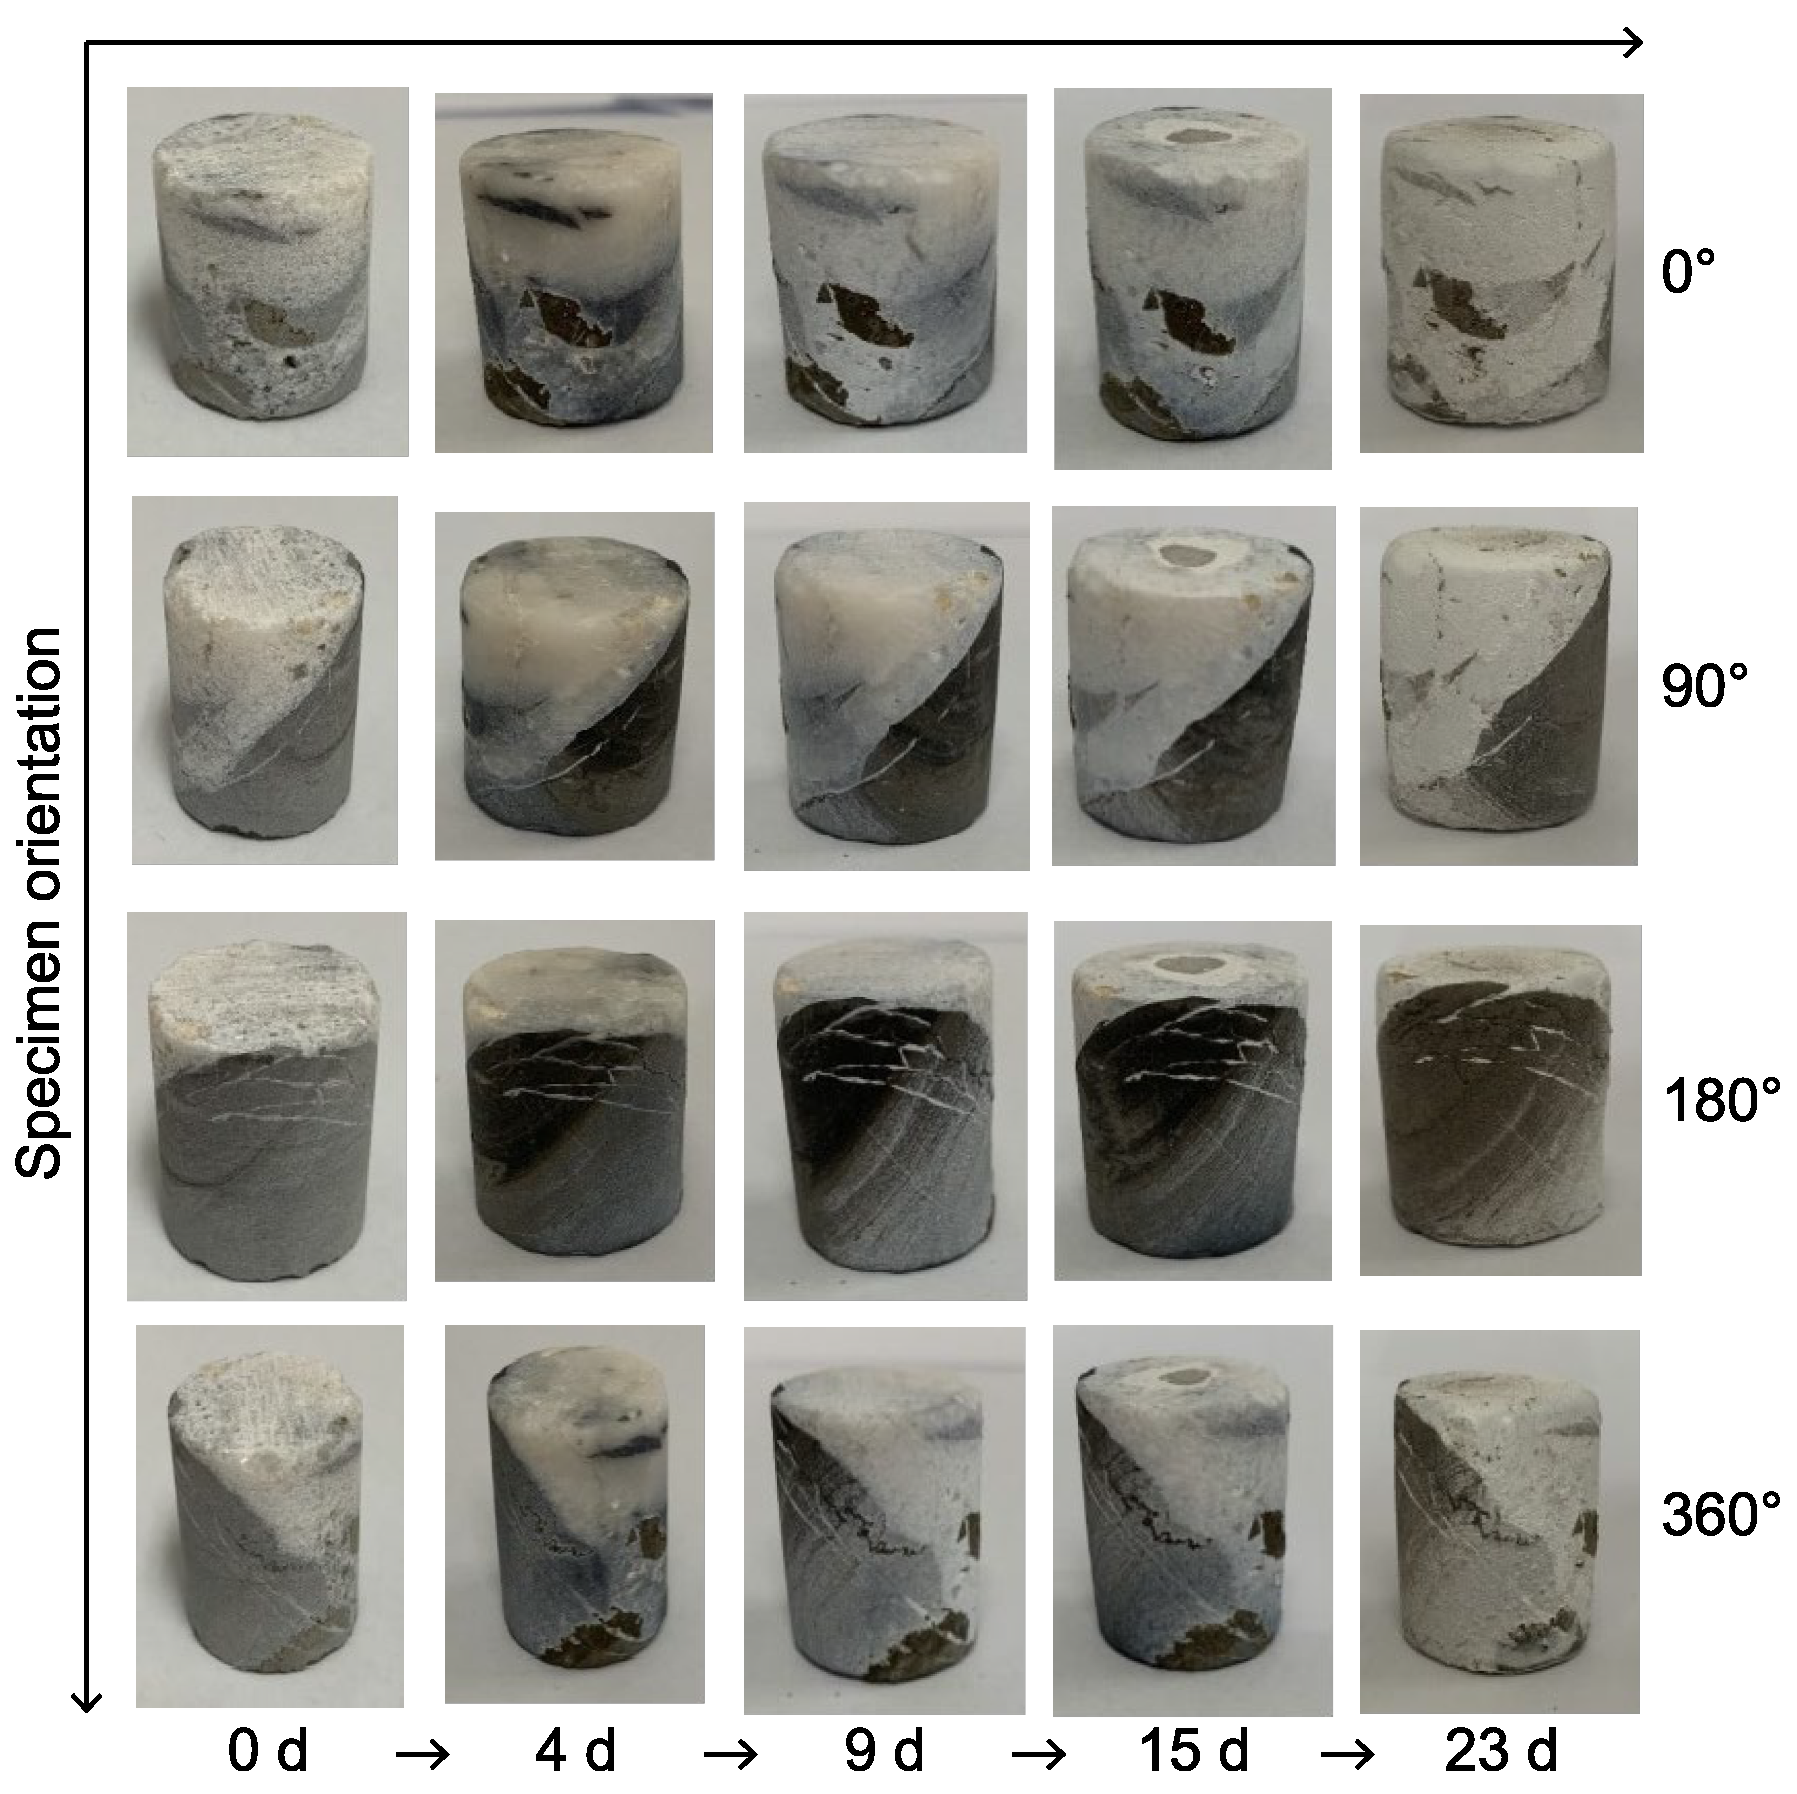
3.1. Comparative Analysis of Limestone’s Macrostructural Characteristics Before and After Acid-Induced Dissolution

3.1.1. Comparative Macrostructural Analysis of Limestone Without Veins Before and After Acid-Induced Dissolution

We conducted an SL test over 23 days. Throughout the test, we recorded the evolving characteristics of the specimens by taking images on the 0th, 4th, 9th, 15th, and 23rd day. These images, taken from four different angles, are presented in Figure 6. On the 4th day, the specimens exhibited slight darkening in color, possibly resulting from solution infiltration into micropores, surface reactions, or other microstructural modifications, while no visible dissolution features were detected. However, from the 4th to the 9th day, white calcium sulfate dihydrate (gypsum, CaSO4·2H2O) gradually precipitated on the specimen surfaces as per Reaction (4), consistent with its stability under ambient aqueous conditions. This accumulation of calcium sulfate continued to increase daily, ultimately covering the specimens almost entirely by the 23rd day. As the experiment progressed, peeling began to occur on the surface of the specimens.
Calcite-rich veins exhibited visibly accelerated dissolution compared to the surrounding matrix. This can be attributed to their larger surface area, higher crystal purity, and exposure along pre-existing fractures, which facilitate acid accessibility. Moreover, the crystalline structure of calcite offers fewer resistance sites to sulfuric acid attacks, enhancing reactivity. These characteristics lead to the preferential formation of dissolution pores and gypsum precipitates, as shown in the subsequent SEM analyses.
CaCO3 + H2SO4 + H2O → CaSO4·2H2O(s) + CO2

3.1.2. Comparative Macrostructural Analysis of Limestone with Sparse, Broad Calcite Veins Before and After Acid-Induced Dissolution

The test conditions for limestone with sparse, broad calcite veins were the same as those without calcite veins. As shown in Figure 7, the broad calcite vein was more heavily covered in white calcium sulfate than other parts. This is because the calcite content of the calcite veins is higher than that of the host rock, and calcite is a common crystalline form of calcium carbonate (CaCO3), the main chemical substance that produces calcium sulfate in Reaction (4). The demarcation between the wide calcite vein and the host rock became increasingly indistinct as more sulfuric acid solution permeated the boundary. At the same time, the intersection lines between the sides and two bottom surfaces of the cylindrical specimens gradually changed from curves to smooth surfaces. Additionally, differential dissolution occurred in different parts of the specimens, leading to the tilting of the specimens in the self-developed solution–rock interaction simulation device.

3.1.3. Comparative Macrostructural Analysis of Limestone with Dense, Fine Calcite Veins Before and After Acid-Induced Dissolution

In Figure 8, the surface of the specimen exhibits a spongy structure after the SL test. Additionally, the spongy material easily falls off with a light touch. The cylindrical specimen’s top and bottom surfaces, initially circular at the edges, dissolved into smooth contours. The unevenness in the dissolution process led to the specimen becoming tilted. Throughout the 23-day experiment, the specimens’ overall hue transitioned from gray to dark brown. However, the calcite veins, recessed due to dissolution, maintained their whiteness, appearing even brighter in contrast. Overall, among the three types of limestone tested, those with multiple fine calcite veins exhibited the most extensive degree of dissolution.
To better understand the underlying mechanisms of the observed macroscopic changes—particularly the differences in dissolution severity across vein structures—a detailed microstructural analysis was conducted using SEM imaging.

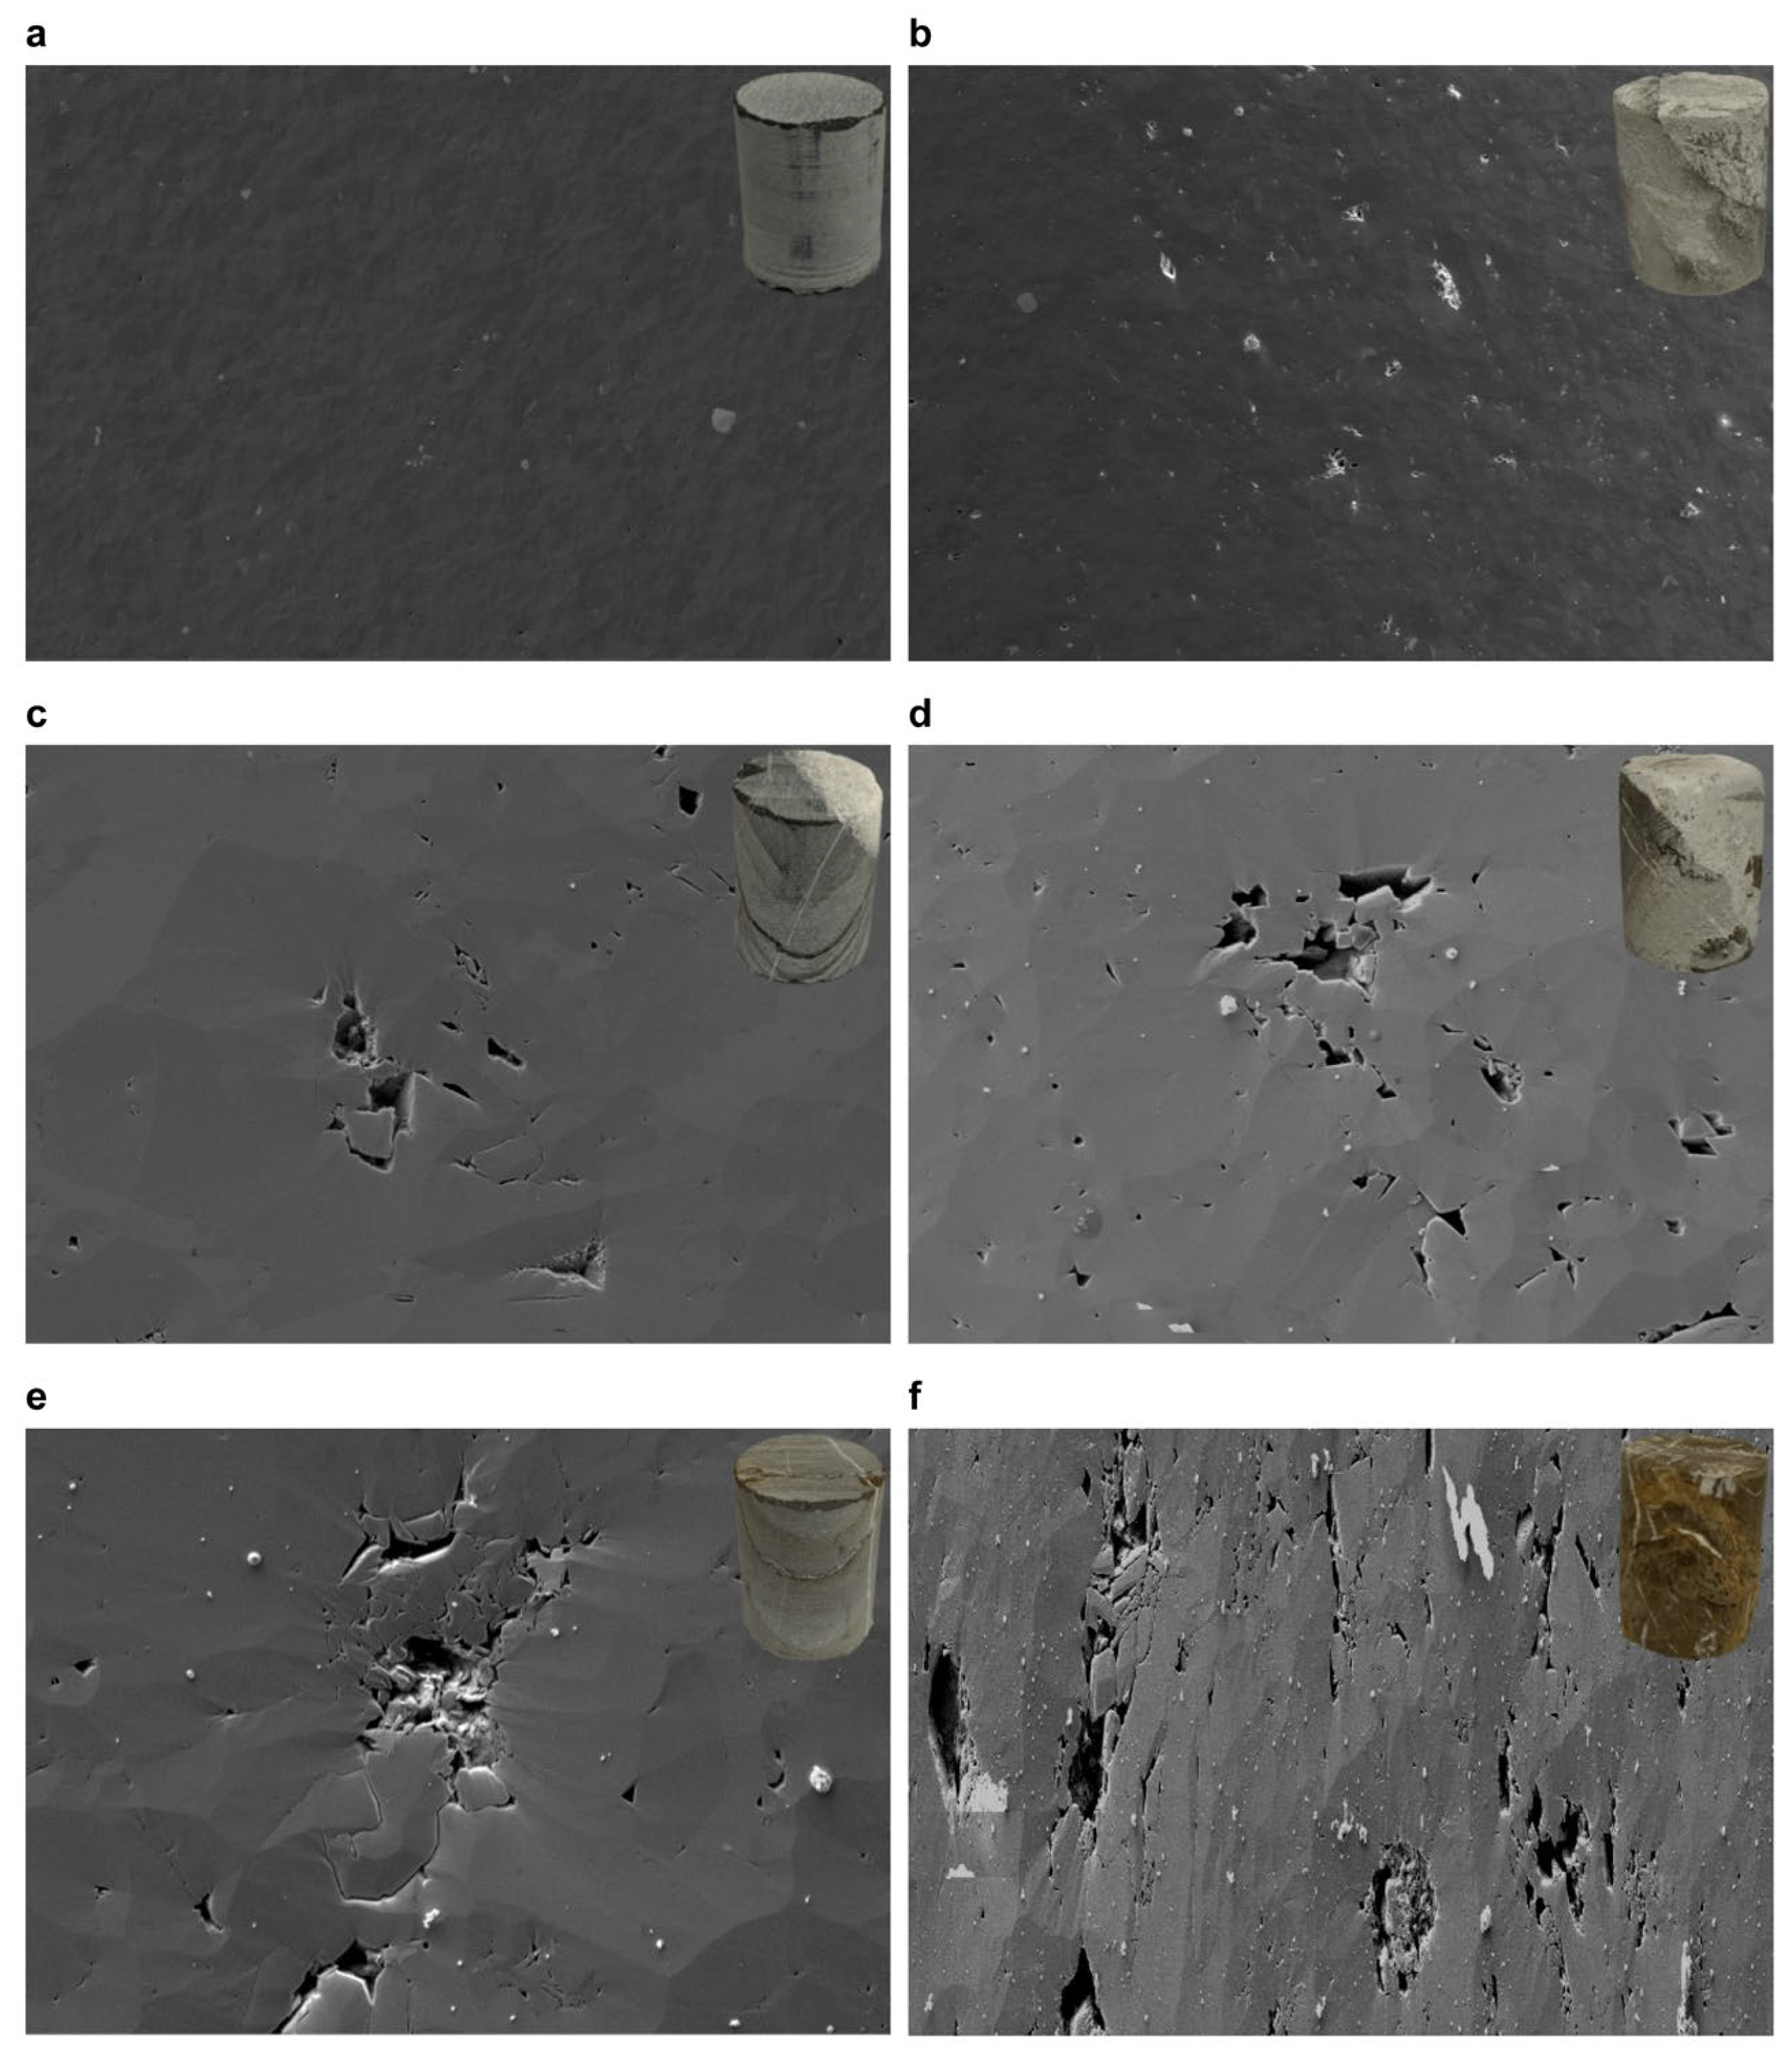
3.2. Comparative Microstructural Analysis of Limestone Before and After Acid-Induced Dissolution

3.2.1. Comparative Microstructural Analysis of Limestone Without Veins Before and After Acid-Induced Dissolution

Figure 9a shows the SEM image of the sample without dissolution induced by sulfuric acid, while Figure 9b presents the microstructure of the sample after the SL experiment. The grayscale value, which refers to the intensity of black and white in an image, can be used to differentiate between minerals, organics, pores, and cracks within the SEM image. By analyzing the grayscale values, we can identify and distinguish the areas corresponding to pores, represented by higher grayscale values. By comparing the SEM images of samples without and with the SL test, we can observe that dissolution mainly occurs in the pores and cracks and their surrounding areas, which are covered by white calcium sulfate. This is because the sulfuric acid solution flows into the rocks through pores and cracks, undergoing physical and chemical interactions with the acid solution. The surface of the dissolved sample appears uneven in the SEM image, with small bulges present (Figure 9b).
Compared to Figure 9a, Figure 9b shows numerous small white dots of varying sizes distributed on top of the sample. Through chemical analysis, we determined that the white spots are composed of calcium sulfate particles. These particles are formed when sulfuric acid reacts with calcium.

3.2.2. Comparative Microstructural Analysis of Limestone with Sparse, Broad Calcite Veins Before and After Acid-Induced Dissolution

Relative to the limestone samples devoid of calcite veins, those containing obviously wide calcite veins exhibit a more open microtexture, characterized by an increased presence of pores and fissures, as illustrated in Figure 9c. The dissolution patterns observed in these specimens (Figure 9d) resemble those in limestone without calcite veins (Figure 9b), as evidenced by the SEM images. However, a notable distinction is the emergence of numerous new dissolution pores in the limestone with obviously expansive calcite veins, as depicted in Figure 9d.
In addition to the interfaces between calcite veins and the surrounding host rock, inherent pores and fissures are dispersed throughout the limestone specimens containing calcite veins. These features collectively serve as conduits for the infiltration of the sulfuric acid solution into the specimens, thereby intensifying the dissolution process. The SL test not only enlarges the existing natural pores but also forms new dissolution-induced pores. Numerous calcium sulfate particles, predominantly small and quasi-circular in shape, are distributed around both the original pores and the newly formed dissolved pores, as evidenced in Figure 9d.
Further analysis of the SEM images (Figure 9c,d) reveals that the vein–host rock interface exhibits notable microstructural evolution. The initially narrow microfissures around the broad calcite vein are significantly widened post-dissolution, forming irregular, interconnected networks. These networks act as enhanced pathways for acid infiltration, promoting secondary dissolution. Additionally, dissolution leads to the formation of new pores along these interfaces, increasing surface roughness and connectivity.
Moreover, calcium sulfate particles—byproducts of the acid–calcite reaction—are widely observed around both original and newly formed dissolution pores. Their quasi-circular morphology and consistent distribution suggest ongoing and localized reactions near the vein boundary. Compared with limestone lacking calcite veins, these specimens show more heterogeneous surface degradation and structurally weakened zones along the vein–rock interface, highlighting the preferential attack facilitated by vein concentration.

3.2.3. Comparative Microstructural Analysis of Limestone with Dense, Fine Calcite Veins Before and After Acid-Induced Dissolution

The SEM images reveal that limestone specimens with multiple fine calcite veins exhibit more compromised internal structures (Figure 9e). These structures are more susceptible to dissolution, leading to a pronounced deterioration of both macro- and microstructural integrity. Owing to the numerous fine calcite veins, there is an increase in the contact area between the host rock and the calcite veins compared to the limestone with fewer veins. This expanded contact area facilitates a greater infiltration of the sulfuric acid solution into the specimens, thereby intensifying acid-induced dissolution and resulting in more pronounced dissolution characteristics (Figure 9f).
As depicted in Figure 9e, the SEM image of the undissolved sample reveals an interior primarily composed of closed pores, each no larger than 3 microns in length, accompanied by a few short cracks. However, following acid-induced dissolution, significant changes are evident in the internal structure, as shown in Figure 9f. The size of the original pores expands dramatically, almost sevenfold in length and fivefold in width, reaching dimensions of approximately 20 microns and 10 microns, respectively, and becoming even deeper. Some of the previously closed pores are transformed into open ones. Moreover, the intense physical and chemical interactions result in numerous new dissolution pores and significantly enlarged dissolution fissures. Some of these newly formed fissures extend across nearly the entire field of view at 1000× magnification, segmenting the internal structure of the specimen into many discrete micron-scale blocks. Additionally, various calcium sulfate particles of differing sizes are observed scattered throughout the specimen.
Based on the preceding analysis, the extent of dissolution in the rock samples devoid of calcite veins or containing obviously broad veins is less than in the limestone samples with numerous fine calcite veins. A greater number of calcite veins correlates with an increased number of structural planes between the host rock and the veins. This suggests that the dissolution strength is significantly influenced by the quantity of structural planes, which is, in turn, a consequence of the presence of calcite veins.
Figure 10 demonstrates a consistent decrease in fractal dimensions for all three limestone types after SL testing, indicating that acid dissolution generally smooths the internal surfaces of the samples. The extent of reduction, however, varies significantly among the lithologies. The limestone with multiple fine calcite veins shows the most pronounced decrease (2.214%), followed by the wide-veined type (0.860%) and the vein-free type (0.059%). This progressive trend—from largest to smallest reduction—mirrors the dissolution degrees observed (strongest to weakest), suggesting that calcite vein density may influence dissolution susceptibility. Although statistical validation with larger sample sizes is needed, the fractal dimension reduction appears to correlate with dissolution intensity, making it a potential proxy for assessing acid–rock interaction.

3.3. Evaluating Mineralogical Changes Pre- and Post-Dissolution

Extensive research has demonstrated that acid–rock reactions affect not only the microstructures but also the mineralogical composition of rocks. The specific assembly of minerals within a rock dictates its weathering resistance, physical attributes, and strength properties. Therefore, investigating the alterations in mineral composition resulting from acid–rock reactions that involve sulfuric acid holds significant importance. Mineralogical changes before and after the SL test were analyzed using AMICS-based quantification rather than conventional XRD, enabling the direct observation of dissolution effects on specific mineral grains.

3.3.1. Mineralogical Analysis via Field Emission Scanning Electron Microscopy

Figure 11 displays the Backscattered Electron (BSE) images and corresponding mineralogical compositions of three limestone samples, both pre- and post-SL test. This initial analysis (Figure 11a,c,e) revealed uniform mineral types across all samples, predominantly comprising calcite, with lesser amounts of dolomite, quartz, and K-feldspar. Minor constituents like ankerite, illite, chlorite, apatite, rutile, pyrite, and other indeterminate minerals were negligible. Post-SL test (Figure 11b,d,f), the mineral types remained unchanged, albeit with slight variations in content, likely attributable to sample-specific nuances.
The marginal changes in mineral content can be attributed to the formation of a white calcium sulfate layer during the SL test, which adheres to the sample surface, mitigating the dissolution process. Consequently, dissolution is predominantly superficial, sparing the interior regions, except near microstructural planes, pores, and cracks. Given the samples’ preparation through mechanical grinding and argon polishing, mineral analysis focused on the slightly dissolved internal sections. As discussed in Section 3.2, dissolution predominantly occurs along structural planes and adjacent to pore or crack walls. Hence, these factors collectively contribute to the minimal variation in mineral content observed before and after the acid-induced dissolution of limestone.

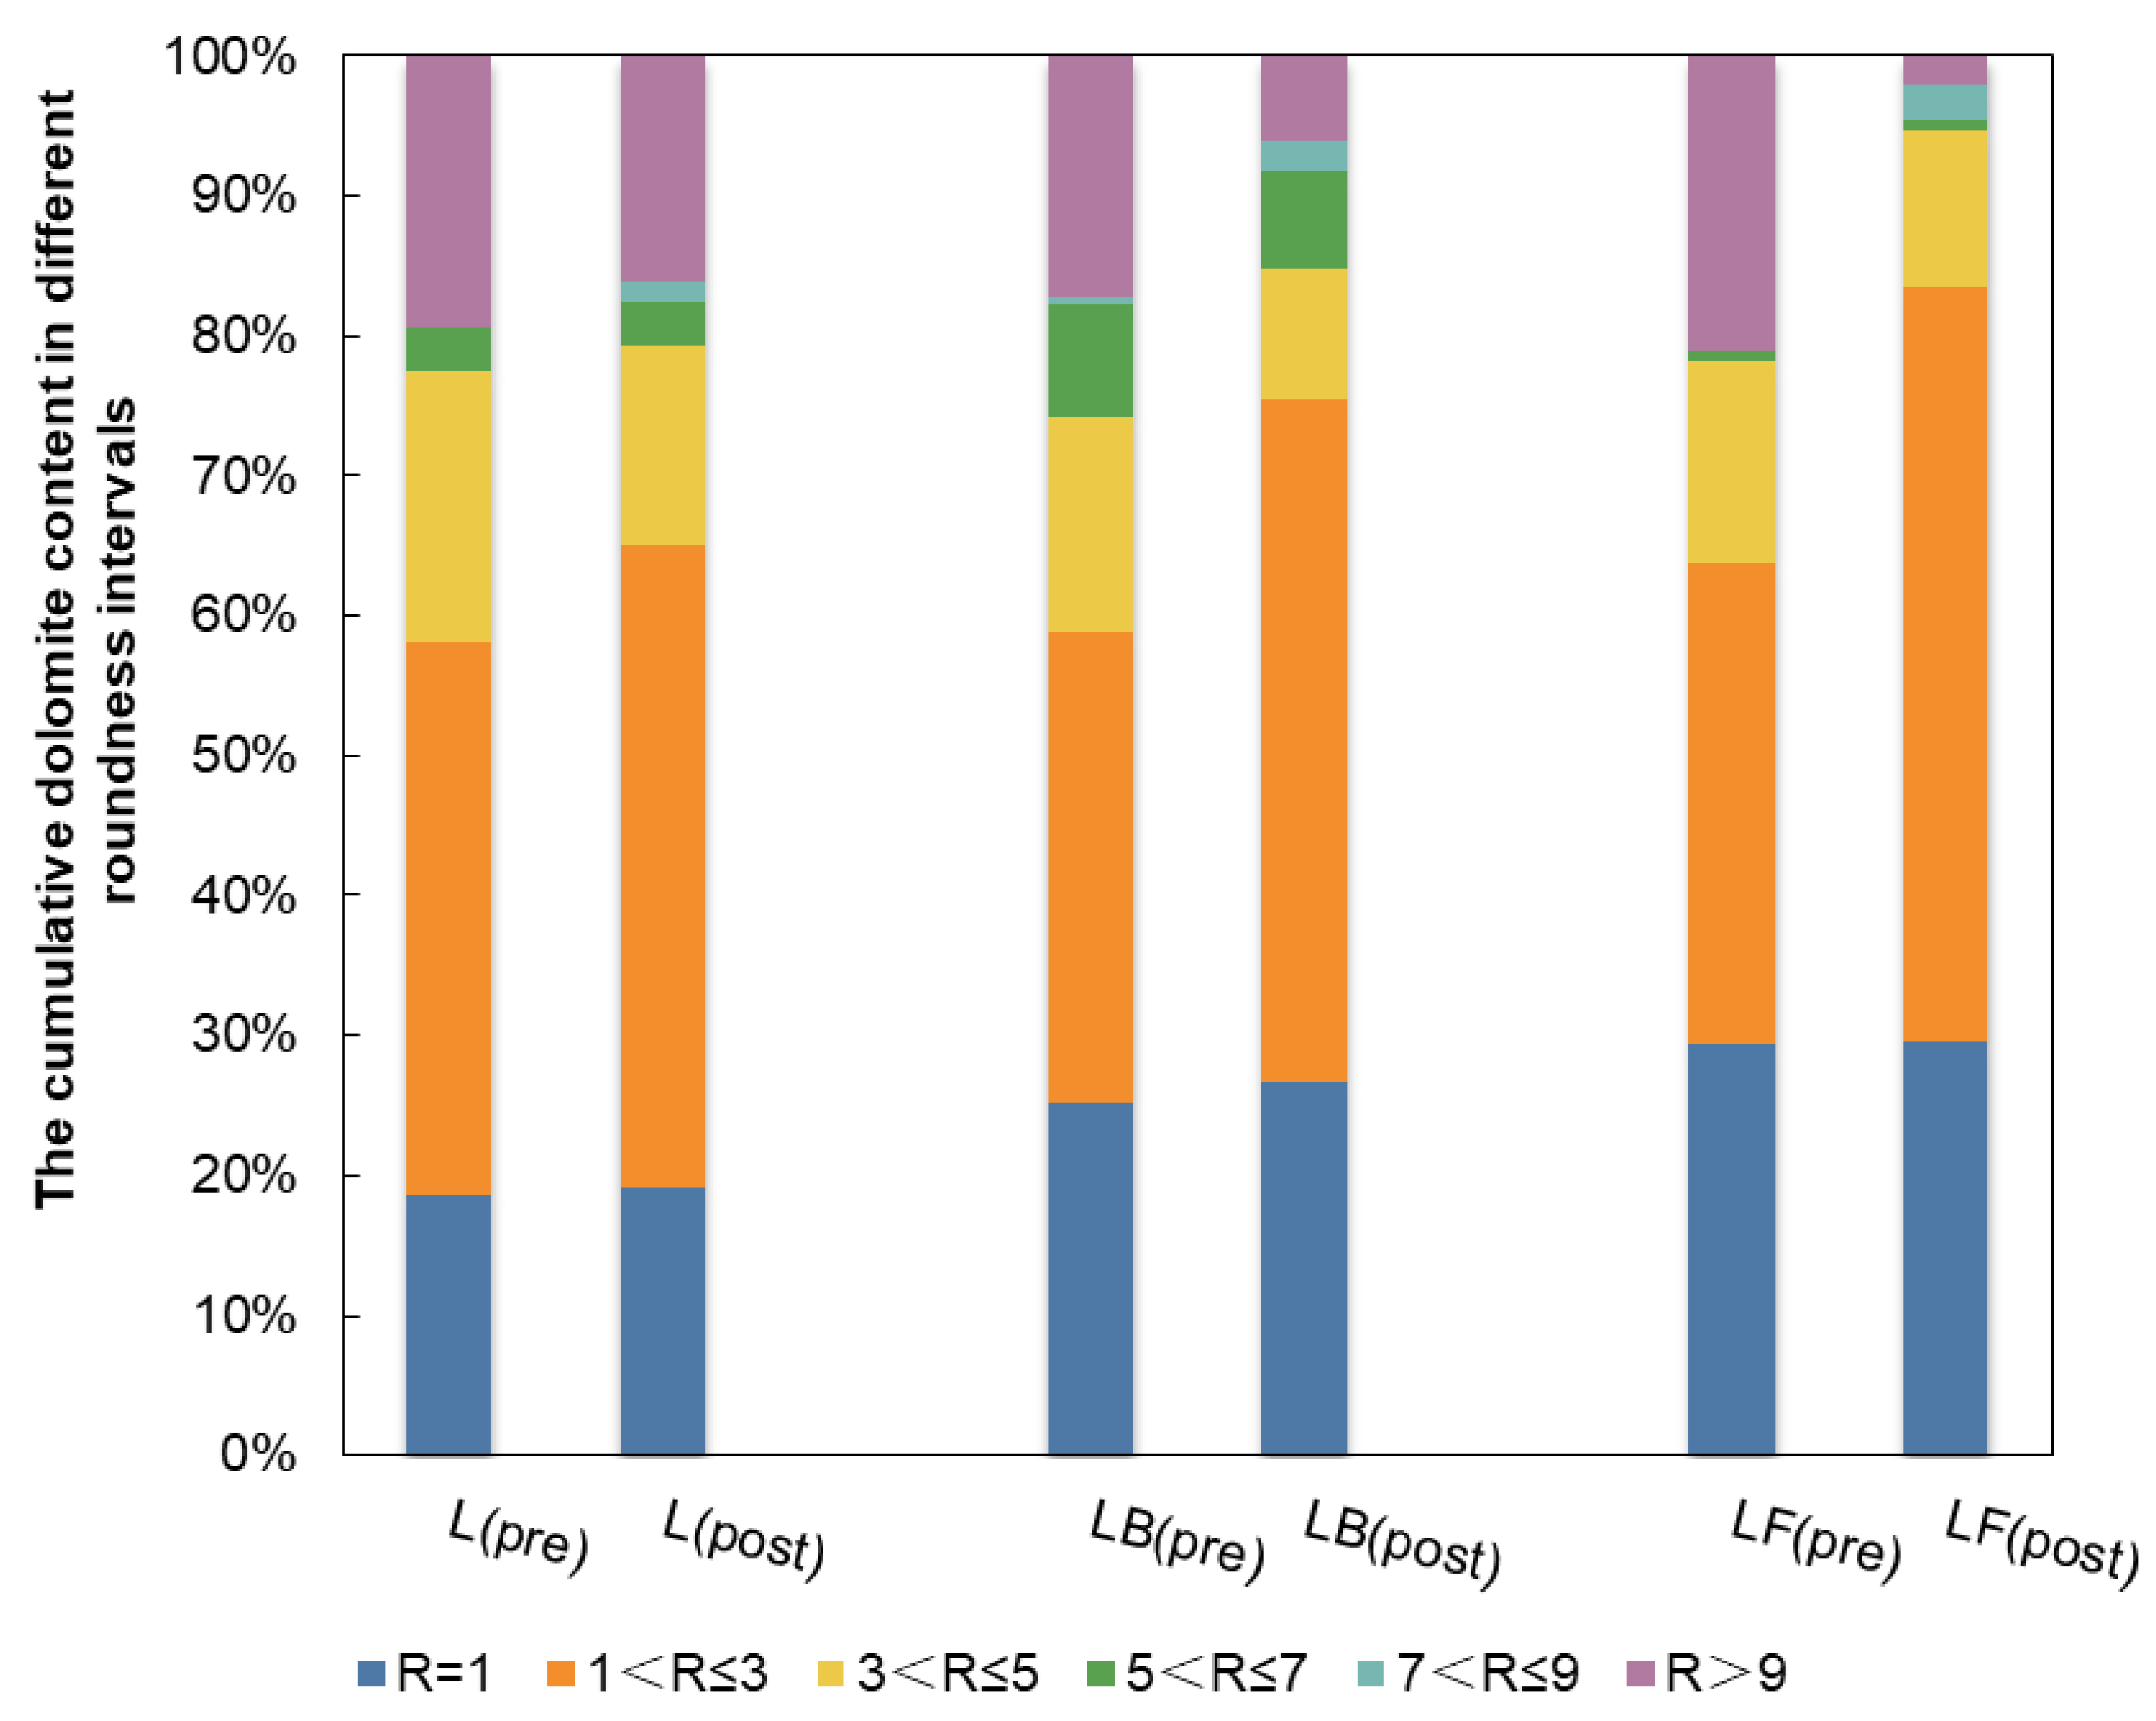
3.3.2. Assessing Dolomite Roundness in Three Varieties of Limestone

The cumulative distribution of dolomite content across various roundness intervals for all samples, both pre- and post-dissolution, was calculated and is presented in Table 3 and Figure 12. Prior to the acid-induced dissolution of limestone by sulfuric acid, the roundness of dolomite in the three limestone types predominantly clustered within four distinct intervals: R = 1, 1 < R ≤ 3, 3 < R ≤ 5, and R ≥ 9. Specifically, for limestone lacking calcite veins, the initial dolomite content percentages in these intervals were 18.55%, 39.52%, 19.35%, and 19.35%, respectively. In the case of limestone with wide calcite veins, these figures were 25.14%, 33.71%, 15.43%, and 17.14%, respectively. Similarly, limestone with multiple fine calcite veins exhibited initial dolomite contents of 29.41%, 34.45%, 14.29%, and 21.01% in the same intervals. This distribution indicates a fundamentally consistent initial dolomite roundness across the three types of Triassic limestone despite their structural differences.
Table 3 and Figure 12 demonstrate the alterations in dolomite content across different roundness intervals following the dissolution reaction, revealing a consistent trend across the three types of Triassic limestone. Specifically, there is a notable decrease in dolomite content within the 3 < R ≤ 5 and 5 < R ≤ 7 intervals, while a significant increase is observed in the R = 1 and 1 < R ≤ 3 intervals. Concurrently, the content in the R ≥ 9 interval diminishes, with a corresponding rise in the 7 < R ≤ 9 interval. This indicates a progressive shift of dolomite roundness from higher to adjacent lower-value intervals. Consequently, the dolomite particles, undergoing gradual dissolution, exhibit increasingly rounded edges, signifying a trend toward greater roundness during the dissolution process.
Regarding the cumulative dolomite content in the 1 ≤ R ≤ 3 interval pre- and post-dissolution, there is a notable shift in content across the limestone types. The limestone without calcite veins exhibits an increase from 58% to 65%, marking a 7% rise. In contrast, limestone with a single wide calcite vein shows a more substantial increase from 59% to 76%, amounting to a 17% escalation. Most significantly, limestone with multiple fine calcite veins escalates from 64% to 84%. This pattern indicates the most pronounced dissolution effect in limestone with multiple fine calcite veins, consistent with the findings discussed in Section 3.2. A similar trend is observed in the roundness change within the R ≥ 9 interval, with the rate of change again being highest in limestone with multiple fine calcite veins, followed by limestone with a single wide vein, and then limestone without calcite veins. These trends further underscore that the dissolution impact is most substantial on limestone with multiple fine calcite veins.

4. Discussion

During the early stage of acid-induced dissolution, numerous bubbles were observed, and slightly water-soluble calcium sulfate was formed. As elucidated in Section 3.1, despite identical host rock compositions, the macroscopic dissolution characteristics of the three limestone types varied. Ford et al. [23] proposed that dissolution intensity is directly proportional to the solution–rock contact area. An increased interface between the solution and the rock sample corresponds to heightened dissolution activity. Consequently, the most extensive macroscopic dissolution was observed in the limestone with dense, fine calcite veins, followed by the limestone with sparse, broad calcite veins, and least in the limestone without veins. This observation indicates that the limestone containing a network of fine veins offers the most substantial area for chemical interaction, followed sequentially by limestone with broader, isolated veins, and concluding with the non-veined limestone.
SEM imaging unveiled distinct dissolution behaviors among the different limestone varieties. Subsequent analysis revealed that the calcium sulfate layers formed on limestone surfaces can mitigate dissolution to varying extents. Internal examination via SEM (Figure 9) identified the dissolution to be most extensive in the limestone with dense, fine calcite veins; moderate in the limestone with a single wide vein; and minimal in the non-veined limestone, which is consistent with the water absorption data in Section 2.2.2. The reasons are as follows: (1) Limestone with more well-connected pores, fissures, and microstructures facilitates the extensive permeation of solutions into its internal regions. This results in a higher rate of water absorption and more pronounced dissolution characteristics. (2) The vein–rock interfaces serve as structural planes. Increased veins lead to more of such planes, enhancing permeability for solution ingress and intensifying dissolution. Notably, limestone with dense, fine calcite veins, having the highest concentration of these veins, undergoes the most pronounced dissolution. This effect—a textural phenomenon highlighted by Rauch and White [26], as well as Ali and Hascakir [9]—amplifies the interaction area between the rock and the solution. (3) In specimens with a single wide calcite vein, only two structural planes exist between the host rock and the vein. Consequently, there are fewer microstructural planes, leading to limited sulfate solution penetration into the rock’s interior. (4) The absence of veins in non-veined limestone reduces the pathways for sulfuric acid infiltration. Additionally, calcium sulfate deposition on the sample surface acts as a barrier, diminishing the internal dissolution reaction.
Considering these factors, it is deduced that in Triassic limestone, microstructural dissolution is primarily influenced by the presence of calcite veins, with the dissolution intensity being more dependent on vein quantity rather than width. Figure 6, Figure 7, Figure 8 and Figure 9 provide a three-dimensional visualization (Figure 13) that elucidates the dissolution patterns, illustrating both macroscopic and microscopic structural alterations in the three limestone types.
From a mineralogical perspective, under normal temperature and pressure, dissolution induced by sulfuric acid does not alter the types of minerals present nor their overall composition. However, it leads to a decrease in the proportions of calcite and dolomite. This effect is evidenced by changes in dolomite roundness, where the dissolution process gradually smoothens the dolomite particles’ edges and corners, making them more rounded. Additionally, the presence of calcite veins intensifies this rounding effect. The observed rounding of dolomite particles during sulfuric acid dissolution can be attributed to preferential dissolution at grain edges and corners, which are energetically less stable and thus dissolve more readily than flat surfaces. As dissolution progresses, sharp features are smoothed out, leading to more circular particle profiles. This process has been described in karst studies, such as those by Ford and Williams [23], and is consistent with the increased roundness observed in our SEM analyses.
Quantitative analysis supports the conclusion that a greater number of calcite veins leads to more intense dissolution. Specifically, the limestone specimens with dense, fine calcite veins exhibited a water absorption rate of 0.13%, compared to 0.10% for the specimens with sparse, broad veins and 0.07% for the non-veined specimens. Fractal dimension decreased by 2.214% in the dense-veined limestone, while the reduction was only 0.860% and 0.059% in the other two groups. In terms of mineral morphology, the proportion of dolomite particles with roundness in the 1 ≤ R ≤ 3 range increased by 19.53% in the dense-veined limestone, compared to 17% and 7% in the broad- and non-veined groups, respectively. These consistent trends across multiple metrics strongly indicate that higher calcite vein density promotes greater acid-induced dissolution.
In addition to the observed correlation between vein density and dissolution strength, it is also important to consider other structural factors that may influence the reaction process. Although this study focused primarily on the number of calcite veins, other structural characteristics such as vein width, orientation, and mineral composition may also influence the degree of acid-induced dissolution. In our test samples, the calcite veins in both the wide- and fine-veined limestone were predominantly composed of pure calcite, as confirmed by the XRF and AMICS analyses. The orientation of the veins was kept approximately consistent across the specimens during sampling to control for directional effects. Notably, although the vein width varied, our observations suggest that the number of veins, rather than their width, played a more decisive role in controlling dissolution severity, possibly due to the increase in vein–host interfaces and fluid ingress pathways.
Although spectroscopic techniques such as FTIR or Raman were not employed in this study, the use of FIB-SEM combined with AMICS effectively captured the post-dissolution mineralogical and structural transformations. The formation of new voids, reduction in calcite content, and increase in gypsum and amorphous phases were all identified through high-resolution imaging and mineral mapping. These changes confirm the underlying chemical reaction pathways previously discussed.
In the Three Gorges Reservoir region, periodic dissolution significantly impacts rock strength and compromises the stability of rock masses within the water fluctuation zone. The degradation effect is further amplified by the presence of calcite veins. Given the diverse range of stratigraphic units and lithological compositions in the reservoir area, future research could focus on varying types of host rocks and vein structures. In future research, regression-based or machine learning models—such as artificial neural networks (ANNs)—could be developed to quantitatively predict limestone dissolution behavior based on variables such as calcite vein density, mineral composition, and structural connectivity. These models would complement experimental observations and enhance the predictive understanding of acid–rock interactions.

5. Conclusions

In this sulfuric acid solution–limestone reaction study, a dissolution analysis of the macrofeatures, microstructures, and mineral characteristics of Triassic limestone was conducted to explore the effects of different calcite vein structures on microscopic dissolution. The following conclusions can be drawn:
(1)
Dissolution primarily occurs around microstructural planes, such as pores and cracks, altering their shapes, increasing their sizes, and generating extensive new dissolution fissures.
(2)
Calcite veins significantly affect the microscopic dissolution features of Triassic limestone. The contact surfaces between the host rock and calcite veins increase the dissolution areas between the limestone and sulfuric acid solution and intensify dissolution reactions. The dissolution intensity is more dependent on vein quantity than width.
(3)
Under normal temperature and pressure, Triassic limestone’s mineral types remain constant during dissolution. However, dolomite particles are gradually dissolved to approach roundness, and the presence of calcite veins promotes the dissolution of edges and corners.
In addition to geochemical insights, this study provides practical implications for engineering geology. The findings of this study have broader implications in geotechnical and engineering geological contexts, especially in karst terrain and reservoir bank environments. The accelerated dissolution behavior observed in limestone containing high-density calcite veins suggests that these structural features can act as chemical weak zones under prolonged acid exposure. In regions such as the Three Gorges Reservoir, where limestone slopes are subject to cyclic water level fluctuations and acid rain, this process may contribute to progressive deterioration of slope stability.
From a geotechnical perspective, the mineralogical composition and distribution of calcite veins should be considered during slope stability assessments and in the design of engineering support measures. Identifying areas with dense or continuous calcite veining may help predict zones of increased susceptibility to chemical weakening and structural failure. This integration of geochemical and structural information can enhance the reliability of long-term engineering risk evaluation in carbonate rock regions.

Author Contributions

Conceptualization, J.G. and S.L.; methodology, J.G.; software, J.G.; validation, Z.Z.; formal analysis, J.G.; investigation, J.G.; resources, S.L.; data curation, J.G.; writing—original draft preparation, J.G.; writing—review and editing, J.H. and J.G.; visualization, J.G.; supervision, X.L.; project administration, J.G.; funding acquisition, J.G. All authors have read and agreed to the published version of the manuscript.

Funding

This work was supported by the National Natural Science Foundation of China (grant number 42102322).

Data Availability Statement

The original contributions presented in this study are included in the article. Further inquiries can be directed to the corresponding authors.

Conflicts of Interest

The authors declare no conflicts of interest.

References

  1. He, J.; Li, T.; Zheng, B.; Mao, T.; Wu, Y.; Li, S.; Li, X. Effect of Calcite Veins on the Mechanical Behavior and Fracture Propagation of Carboniferous Limestone. Eng. Geol. 2022, 300, 106592. [Google Scholar] [CrossRef]
  2. Chen, Q.; Liu, Y.; Teng, Z.; Ou, X.; Zhang, Q. Investigations on the effect of natural veined calcite on the mechanical properties of limestone. Sci Rep. 2024, 14, 5871. [Google Scholar] [CrossRef] [PubMed]
  3. Cai, M.; Kaiser, P.K.; Uno, H. Estimation of Rock Mass Strength Including the Effect of Cracks and Fissures. Int. J. Rock Mech. Min. Sci. 2009, 46, 761–775. [Google Scholar]
  4. Yang, T.; Zhu, L.M.; Zhang, G.W.; Wang, F.; Lu, R.K.; Xia, J.C.; Zhang, Y.Q. Geological and Geochemical Constraints on Genesis of the Liziyuan Gold-Dominated Polymetal Deposit, Western Qinling Orogen, Central China. Int. Geol. Rev. 2012, 54, 1944–1966. [Google Scholar] [CrossRef]
  5. Wang, Q.; Hu, Q.; Larsen, C.; Zhao, C.; Sun, M.; Zhang, Y.; Zhang, T. Microfracture-Pore Structure Characterization and Water-Rock Interaction in Three Lithofacies of the Lower Eagle Ford Formation. Eng. Geol. 2021, 292, 106276. [Google Scholar] [CrossRef]
  6. Huang, X.; Pang, J.; Zou, J. Study on the Effect of Dry–Wet Cycles on Dynamic Mechanical Properties of Sandstone Under Sulfuric Acid Solution. Rock Mech. Rock Eng. 2022, 55, 1253–1269. [Google Scholar] [CrossRef]
  7. Thaysen, E.M.; Soler, J.M.; Cama, J. Laboratory-Scale Interaction Between CO2-Saturated H2SO4-Rich Brine and Reservoir Rocks (Limestone and Sandstone). Procedia Earth Planet. Sci. 2017, 17, 614–617. [Google Scholar] [CrossRef]
  8. Pearce, J.K.; Kirste, D.M.; Dawson, G.K.; Farquhar, S.M.; Biddle, D.; Golding, S.D.; Rudolph, V. SO2 Impurity Impacts on Experimental and Simulated CO2–Water–Reservoir Rock Reactions at Carbon Storage Conditions. Chem. Geol. 2015, 399, 65–86. [Google Scholar] [CrossRef]
  9. Ali, M.; Hascakir, B. Water/Rock Interaction for Eagle Ford, Marcellus, Green River, and Barnett Shale Samples and Implications for Hydraulic-Fracturing-Fluid Engineering. SPE J. 2016, 22, 162–171. [Google Scholar] [CrossRef]
  10. Ma, J.; Xie, S.; Tang, H.; Ma, M.; Carranza, E.J.M.; Han, J.; He, Z.; Jiao, C.; Zhang, H. Evolution Mechanisms of Carbonate Reservoirs Based on Dissolution Rates and Multifractal Analysis of Microscopic Morphology. Nat. Resour. Res. 2020, 29, 2843–2865. [Google Scholar] [CrossRef]
  11. Lai, J.; Guo, J.; Ma, Y.; Zhou, H.; Wang, S.; Liu, Y. Effect of Acid-Rock Reaction on the Microstructure and Mechanical Property of Tight Limestone. Rock Mech. Rock Eng. 2022, 55, 35–49. [Google Scholar] [CrossRef]
  12. Lyu, Q.; Wang, K.; Hu, C.; Dick, J.M.; Shi, J.; Tan, J. Experimental Study on the Mechanical Properties of Shale After Long-Term of Immersion in Fracturing Fluids with Different pH. Rock Mech. Rock Eng. 2022, 55, 5047–5061. [Google Scholar] [CrossRef]
  13. Chicco, J.M.; Vacha, D.; Mandrone, G. Thermo-Physical and Geo-Mechanical Characterization of Faulted Carbonate Rock Masses (Valdieri, Italy). Remote Sens. 2019, 11, 179. [Google Scholar] [CrossRef]
  14. Qiao, L.; Wang, Z.; Huang, A. Alteration of Mesoscopic Properties and Mechanical Behavior of Sandstone Due to Hydro-Physical and Hydro-Chemical Effects. Rock Mech. Rock Eng. 2017, 50, 255–267. [Google Scholar] [CrossRef]
  15. Li, X.; Liu, Z.; Feng, X.; Zhang, H.; Feng, J. Effects of Acid Sulfate and Chloride Ion on the Pore Structure and Mechanical Properties of Sandstone Under Dynamic Loading. Rock Mech. Rock Eng. 2021, 54, 6105–6121. [Google Scholar] [CrossRef]
  16. Li, H.; Zhong, Z.; Liu, X.; Sheng, Y.; Yang, D. Micro-Damage Evolution and Macro-Mechanical Property Degradation of Limestone Due to Chemical Effects. Int. J. Rock Mech. Min. Sci. 2018, 110, 257–265. [Google Scholar] [CrossRef]
  17. Liu, D.; Yan, W.; Yan, S.; Kang, Q. Study on the Effect of Axial and Hydraulic Pressure Coupling on the Creep Behaviors of Sandstone Under Multi-Loading. Bull. Eng. Geol. Environ. 2021, 80, 6107–6120. [Google Scholar] [CrossRef]
  18. Sisodiya, S.M.A.; Singh, S.M.A.; Thomas, P.E.D.; Zhang, Y.A.M.A. Effect of Water–Rock Interaction on the Axial Capacity of Drilled Caissons Socketed in Claystone Bedrock. J. Geotech. Geoenviron. Eng. 2021, 147, 04021113. [Google Scholar] [CrossRef]
  19. Tang, H.; Wasowski, J.; Juang, C.H. Geohazards in the Three Gorges Reservoir Area, China—Lessons Learned from Decades of Research. Eng. Geol. 2019, 261, 105267. [Google Scholar] [CrossRef]
  20. Delle Rose, M.; Federico, A.; Parise, M. Sinkhole Genesis and Evolution in Apulia, and Their Interrelations with the Anthropogenic Environment. Nat. Hazards Earth Syst. Sci. 2004, 4, 747–755. [Google Scholar] [CrossRef]
  21. Huang, D.; Gu, D.M.; Song, Y.X.; Cen, D.F.; Zeng, B. Towards a Complete Understanding of the Triggering Mechanism of a Large Reactivated Landslide in the Three Gorges Reservoir. Eng. Geol. 2018, 238, 36–51. [Google Scholar] [CrossRef]
  22. Tsykin, R.A. Karst Sibiri; Krasnoyarsk University Publishing House: Krasnoyarsk, Russia, 1990; pp. 2–10. [Google Scholar]
  23. Ford, D.; Williams, P.W. Karst Hydrogeology and Geomorphology; John Wiley & Sons: Chichester, UK, 2007; ISBN 978-0-470-84996-5. [Google Scholar]
  24. Dochez, S.; Laouafa, F.; Franck, C.; Guedon, S.; Martineau, F.; d’Amato, J.; Saintenoy, A. Multi-Scale Analysis of Water Alteration on the Rockslope Stability Framework. Acta Geophys. 2014, 62, 1025–1048. [Google Scholar] [CrossRef]
  25. Sun, H. Modeling Soil Water Retention Curves by Pore Fractal Dimension Based on Microstructure Image. Earth Sci. Inform. 2024, 17, 3589–3597. [Google Scholar] [CrossRef]
  26. Rauch, H.W.; White, W.B. Lithologic Controls on the Development of Solution Porosity in Carbonate Aquifers. Water Resour. Res. 1970, 6, 1175–1192. [Google Scholar] [CrossRef]
Figure 1. (a) Location of Wu Gorge; (b) schematic of sampling site located above water fluctuation zone in Wu Gorge.
Water 17 01550 g001
Figure 2. (a) Specific sampling location on bank slope above water fluctuation zone in Wu Gorge; (b) limestone without calcite veins; (c) limestone with sparse, broad calcite veins; (d) limestone with dense, fine calcite veins.
Water 17 01550 g002
Figure 3. Images of three kinds of limestone specimens: (a) specimen without calcite veins originating from limestone featured in Figure 2b; (b) specimen with distinct, broad white calcite vein obtained from limestone in Figure 2c; (c) specimen with multiple fine white calcite veins distributed throughout, sourced from limestone depicted in Figure 2d.
Water 17 01550 g003
Figure 4. Schematic representation of water level fluctuations in Three Gorges Reservoir area. Reservoir operates on an annual cycle, with water levels rising and falling between 145 m and 175 m above sea level (ASL) to balance flood control, power generation, and navigation needs. This cyclic change includes four distinct phases: high level, drawdown, low level, and rising. These stages play a key role in triggering physical and chemical interactions between reservoir water and adjacent limestone slopes in fluctuation zone.
Water 17 01550 g004
Figure 5. Diagram of laboratory solution–rock interaction simulation system: (a) Schematic of overall dissolution test, which lasted 552 h (equivalent to approximately 46 years of field exposure); (b) Diagram showing 12 h periodic changes in solution level (from high to low to high, simulating reservoir fluctuation); (c) Photograph of custom-designed simulation device with automated solution level control, used to mimic field-like hydrological boundary conditions in a controlled lab setting.
Water 17 01550 g005
Figure 6. Sequential dissolution images of specimen without calcite veins captured from four different perspectives on days 0, 4, 9, 15, and 23.
Water 17 01550 g006
Figure 7. Sequential dissolution images of specimen with a distinct broad calcite vein captured from four different perspectives on days 0, 4, 9, 15, and 23.
Water 17 01550 g007
Figure 8. Sequential dissolution images of specimen with multiple fine calcite veins captured from four different perspectives on days 0, 4, 9, 15, and 23.
Water 17 01550 g008
Figure 9. SEM images at 5000× magnification showing microstructural features in three limestone varieties before and after SL testing: (a) limestone without calcite veins, pre-dissolution; (b) limestone without calcite veins, post-dissolution; (c) limestone with obviously wide calcite veins, pre-dissolution; (d) limestone with obviously wide calcite veins, post-dissolution; (e) limestone with multiple fine calcite veins, pre-dissolution; (f) limestone with multiple fine calcite veins, post-dissolution.
Water 17 01550 g009
Figure 10. Average fractal dimensions in SEM images of three limestone varieties before and after acid-induced dissolution.
Water 17 01550 g010
Figure 11. Comparative BSE and mineral images of limestone specimens: (a,c,e) limestones without calcite veins, with wide calcite veins, and with multiple fine calcite veins, respectively, before dissolution test; (b,d,f) corresponding limestones after dissolution test.
Water 17 01550 g011
Figure 12. Cumulative dolomite roundness in three limestone sample types (L: limestone, LB: limestone with sparse, broad calcite veins, LF: limestone with dense, fine calcite veins) pre- and post-dissolution test.
Water 17 01550 g012
Figure 13. Three-dimensional visualization of dissolution processes in three limestone types: (a) limestone without calcite veins; (b) limestone with sparse, broad calcite veins; (c) limestone with dense, fine calcite veins.
Water 17 01550 g013
Table 1. Mineral composition of limestone specimens determined via X-ray fluorescence analysis.
Limestone TypesCalcite (%)Feldspar (%)Quartz (%)Clay (%)Dolomite (%)Pyrite (%)
Limestone without veins66.421.34.64.62.80.2
Limestone with sparse, broad calcite veins72.519.43.63.80.60.0
Limestone with multiple fine calcite veins68.818.95.45.21.70.0
Table 2. Average water absorption rates of three types of limestone.
Limestone TypeSpecimen TypesAverage Water Absorption (%)Standard Deviation (%)
Limestone without veinsspecimen without calcite veins0.070.01
Limestone with sparse, broad calcite veinsspecimen with a distinct broad calcite vein0.100.02
Limestone with multiple fine calcite veinsspecimen with multiple fine calcite veins0.130.02
Table 3. Dolomite content in various roundness intervals of three limestone sample types (L: limestone, LB: limestone with sparse, broad calcite veins, LF: limestone with dense, fine calcite veins) pre- and post-dissolution test.
Limestone TypesDolomite Content in Various Roundness Intervals
R = 11 < R ≤ 33 < R ≤ 55 < R ≤ 77 < R ≤ 9R ≥ 9
L (pre)18.55%39.52%19.35%3.23%019.35%
L (post)19.21%45.79%14.29%3.21%1.43%16.07%
Gradient0.67%6.27%−5.07%−0.01%1.43%−3.28%
LB (pre)25.14%33.71%15.43%8.00%0.57%17.14%
LB (post)26.62%48.92%9.35%6.91%2.16%6.04%
Gradient1.48%15.21%−6.08%−1.09%1.59%−11.11%
LF (pre)29.41%34.45%14.29%0.84%021.01%
LF (post)29.61%53.99%11.05%0.82%2.55%1.98%
Gradient0.20%19.53%−3.24%−0.02%2.55%−19.03%
Disclaimer/Publisher’s Note: The statements, opinions and data contained in all publications are solely those of the individual author(s) and contributor(s) and not of MDPI and/or the editor(s). MDPI and/or the editor(s) disclaim responsibility for any injury to people or property resulting from any ideas, methods, instructions or products referred to in the content.

