Article

Mainstream Wastewater Treatment Process Based on Multi-Nitrogen Removal Under New Anaerobic–Swing–Anoxic–Oxic Model

1
Key Laboratory of Integrated Regulation and Resource Development on Shallow Lakes, Ministry of Education, Hohai University, Nanjing 210098, China
2
College of Environment, Hohai University, Nanjing 210098, China
3
Guohe Environmental Research Institute (Nanjing) Co., Ltd., Nanjing 211599, China
*
Author to whom correspondence should be addressed.
Water 2025, 17(10), 1548; https://doi.org/10.3390/w17101548
Submission received: 17 April 2025 / Revised: 15 May 2025 / Accepted: 19 May 2025 / Published: 21 May 2025
(This article belongs to the Section Water Quality and Contamination)

Abstract

:
The Anaerobic–Swing Aerobic–Anoxic–Oxic (ASAO) process was developed to tackle problems such as temperature sensitivity during the Anaerobic–Oxic–Anoxic (AOA) process. By introducing a swing zone (S zone) with adjustable dissolved oxygen (DO), during the 112-day experimentation period, the ASAO system achieved removal rates of 88.18% for total inorganic nitrogen (TIN), 78.23% for total phosphorus (TP), and 99.78% for ammonia nitrogen. Intermittent aeration effectively suppressed nitrite-oxidizing bacteria (NOB), and the chemical oxygen demand (COD) removal rate exceeded 90%, with 60% being transformed into internal carbon sources like polyhydroxyalkanoates (PHAs) and glycogen (Gly). The key functional microorganisms encompassed Dechloromonas (denitrifying phosphorus-accumulating bacteria), Candidatus Competibacter, and Thauera, which facilitated simultaneous nitrification–denitrification (SND) and anaerobic ammonium oxidation (ANAMMOX). The enrichment of Candidatus Brocadia further enhanced the ANAMMOX activity. The flexibility of DO control in the swing zone optimized microbial activity and mitigated temperature dependence, thereby verifying the efficacy of the ASAO process in enhancing the removal rates of nutrients and COD in low-C/N wastewater. The intermittent aeration strategy and the continuous low-dissolved-oxygen (DO) operating conditions inhibited the activity of nitrite-oxidizing bacteria (NOB) and accomplished the elimination of NOB.

1. Introduction

With the increasingly stringent sewage treatment discharge standards, conventional biological denitrification technologies are no longer adequate to meet emerging requirements for energy-efficient and low-carbon wastewater remediation. Traditional processes, exemplified by the A/O (Anaerobic–Oxic) and AAO (Anaerobic–Anoxic–Oxic) systems, exhibit critical limitations: the A/O process suffers from compromised denitrification performance (typically <90% efficiency) due to the absence of a dedicated sludge return system and DO interference in internal recirculation. Although the AAO process offers a streamlined configuration, its practicality is constrained by suboptimal nutrient removal efficiencies, necessitating chemical supplementation and energy-intensive aeration, which collectively contribute to elevated carbon footprints. Against this backdrop, emerging low-carbon technologies such as simultaneous nitrification and denitrification (SND), anaerobic ammonium oxidation (ANAMMOX), and denitrifying phosphorus removal (DPR) have garnered significant attention and become key research hotspots. SND achieves nitrogen removal by regulating oxygen concentration gradients within a single reactor, thereby reducing carbon source consumption and aeration requirements by approximately 30%. However, it is associated with risks of fluctuating nitrogen removal efficiency and N2O emissions. ANAMMOX eliminates the need for organic carbon sources or aeration, but its nitrite supply relies on a stable short-cut nitrification process. DPR facilitates simultaneous nitrogen and phosphorus removal via denitrifying phosphorus-accumulating organisms (DPAOs). Nevertheless, it exhibits high sensitivity to dissolved oxygen concentrations and necessitates precise control of the metabolic environment [1]. Previous studies have demonstrated that over 80% of the external carbon sources in wastewater are effectively stored by denitrifying glycogen-accumulating organisms (DGAOs) and denitrifying phosphorus-accumulating organisms (DPAOs) during the anaerobic phase, commonly referred to as the “feast” period [2]. In the post-anoxic zone (the “famine” period), the NO3-N or NO2-N generated in the aerobic zone is reduced through endogenous denitrification, attaining a nitrogen removal efficiency of over 85% [3]. Meanwhile, it has been verified that SND can occur in the aerobic zone of the AOA mode. In the AOA system constructed by Xu et al. [4], 0.24 ± 0.06 g VSS−1 d−1 of TN was removed through SND in the aerobic zone. The results indicated that the multi-zone structure of the AOA process enhances DPR and SND in urban wastewater treatment. The inherent ability of the AOA process to utilize internal carbon sources for denitrification facilitates the enrichment of anaerobic ammonia-oxidizing bacteria (AnAOB), which are susceptible to inhibition by external carbon sources. Additionally, some studies have demonstrated that the coupling of endogenous short-cut denitrification (EPD) and anaerobic ammonia oxidation (ANAMMOX) can be achieved within the AOA system [5].
However, the AOA operation mode still presents numerous drawbacks. To achieve ANAMMOX in the anoxic zone, the hydraulic retention time (HRT) of the aerobic zone is often rather short. At this juncture, if the denitrification performance in the anoxic zone deteriorates, the overall denitrification performance will decline. For example, when the temperature drops, the activities of AnAOB bacteria and denitrifying bacteria significantly decrease, and the denitrification effect in the anoxic zone worsens. If the HRT of the aerobic zone can be prolonged at this time, other denitrification processes in the aerobic zone, such as SND, can transform into the main denitrification approach. When the temperature rises again, the HRT of the aerobic zone can be shortened, and at this point, the ANAMMOX process becomes the primary denitrification process. Hence, on the basis of AOA, this study proposed the ASAO process, adding a swing zone between the aerobic and anoxic zones. This zone can freely switch between aerobic and anoxic modes to fulfill the tasks of denitrification and phosphorus removal under various working conditions. The subsequent aerobic zone can achieve further phosphorus removal before the effluent, and studies have indicated that intermittent aeration can carry out the elutriation of nitrite-oxidizing bacteria (NOB) and further phosphorus removal, which is conducive to the realization of partial nitrification (PN) and the ANAMMOX process. The above-mentioned improvements have enabled the ASAO process to demonstrate significant advantages: through the coupling mechanism of “zonal functional optimization—aeration mode regulation”, it possesses both high-efficiency nitrogen and phosphorus removal capabilities and operational adaptability in the treatment of low-C/N wastewater, providing an innovative solution for wastewater treatment under complex environmental conditions. Through a 112-day continuous-flow experiment, the primary objectives are as follows: (1) to validate ASAO’s operational flexibility in low-C/N wastewater treatment; (2) to quantify its synergistic nitrogen–phosphorus removal efficiency via coupled pathways (ED, DPR, SND, anammox); and (3) to elucidate the microbial mechanisms driving its performance.

2. Materials and Methods

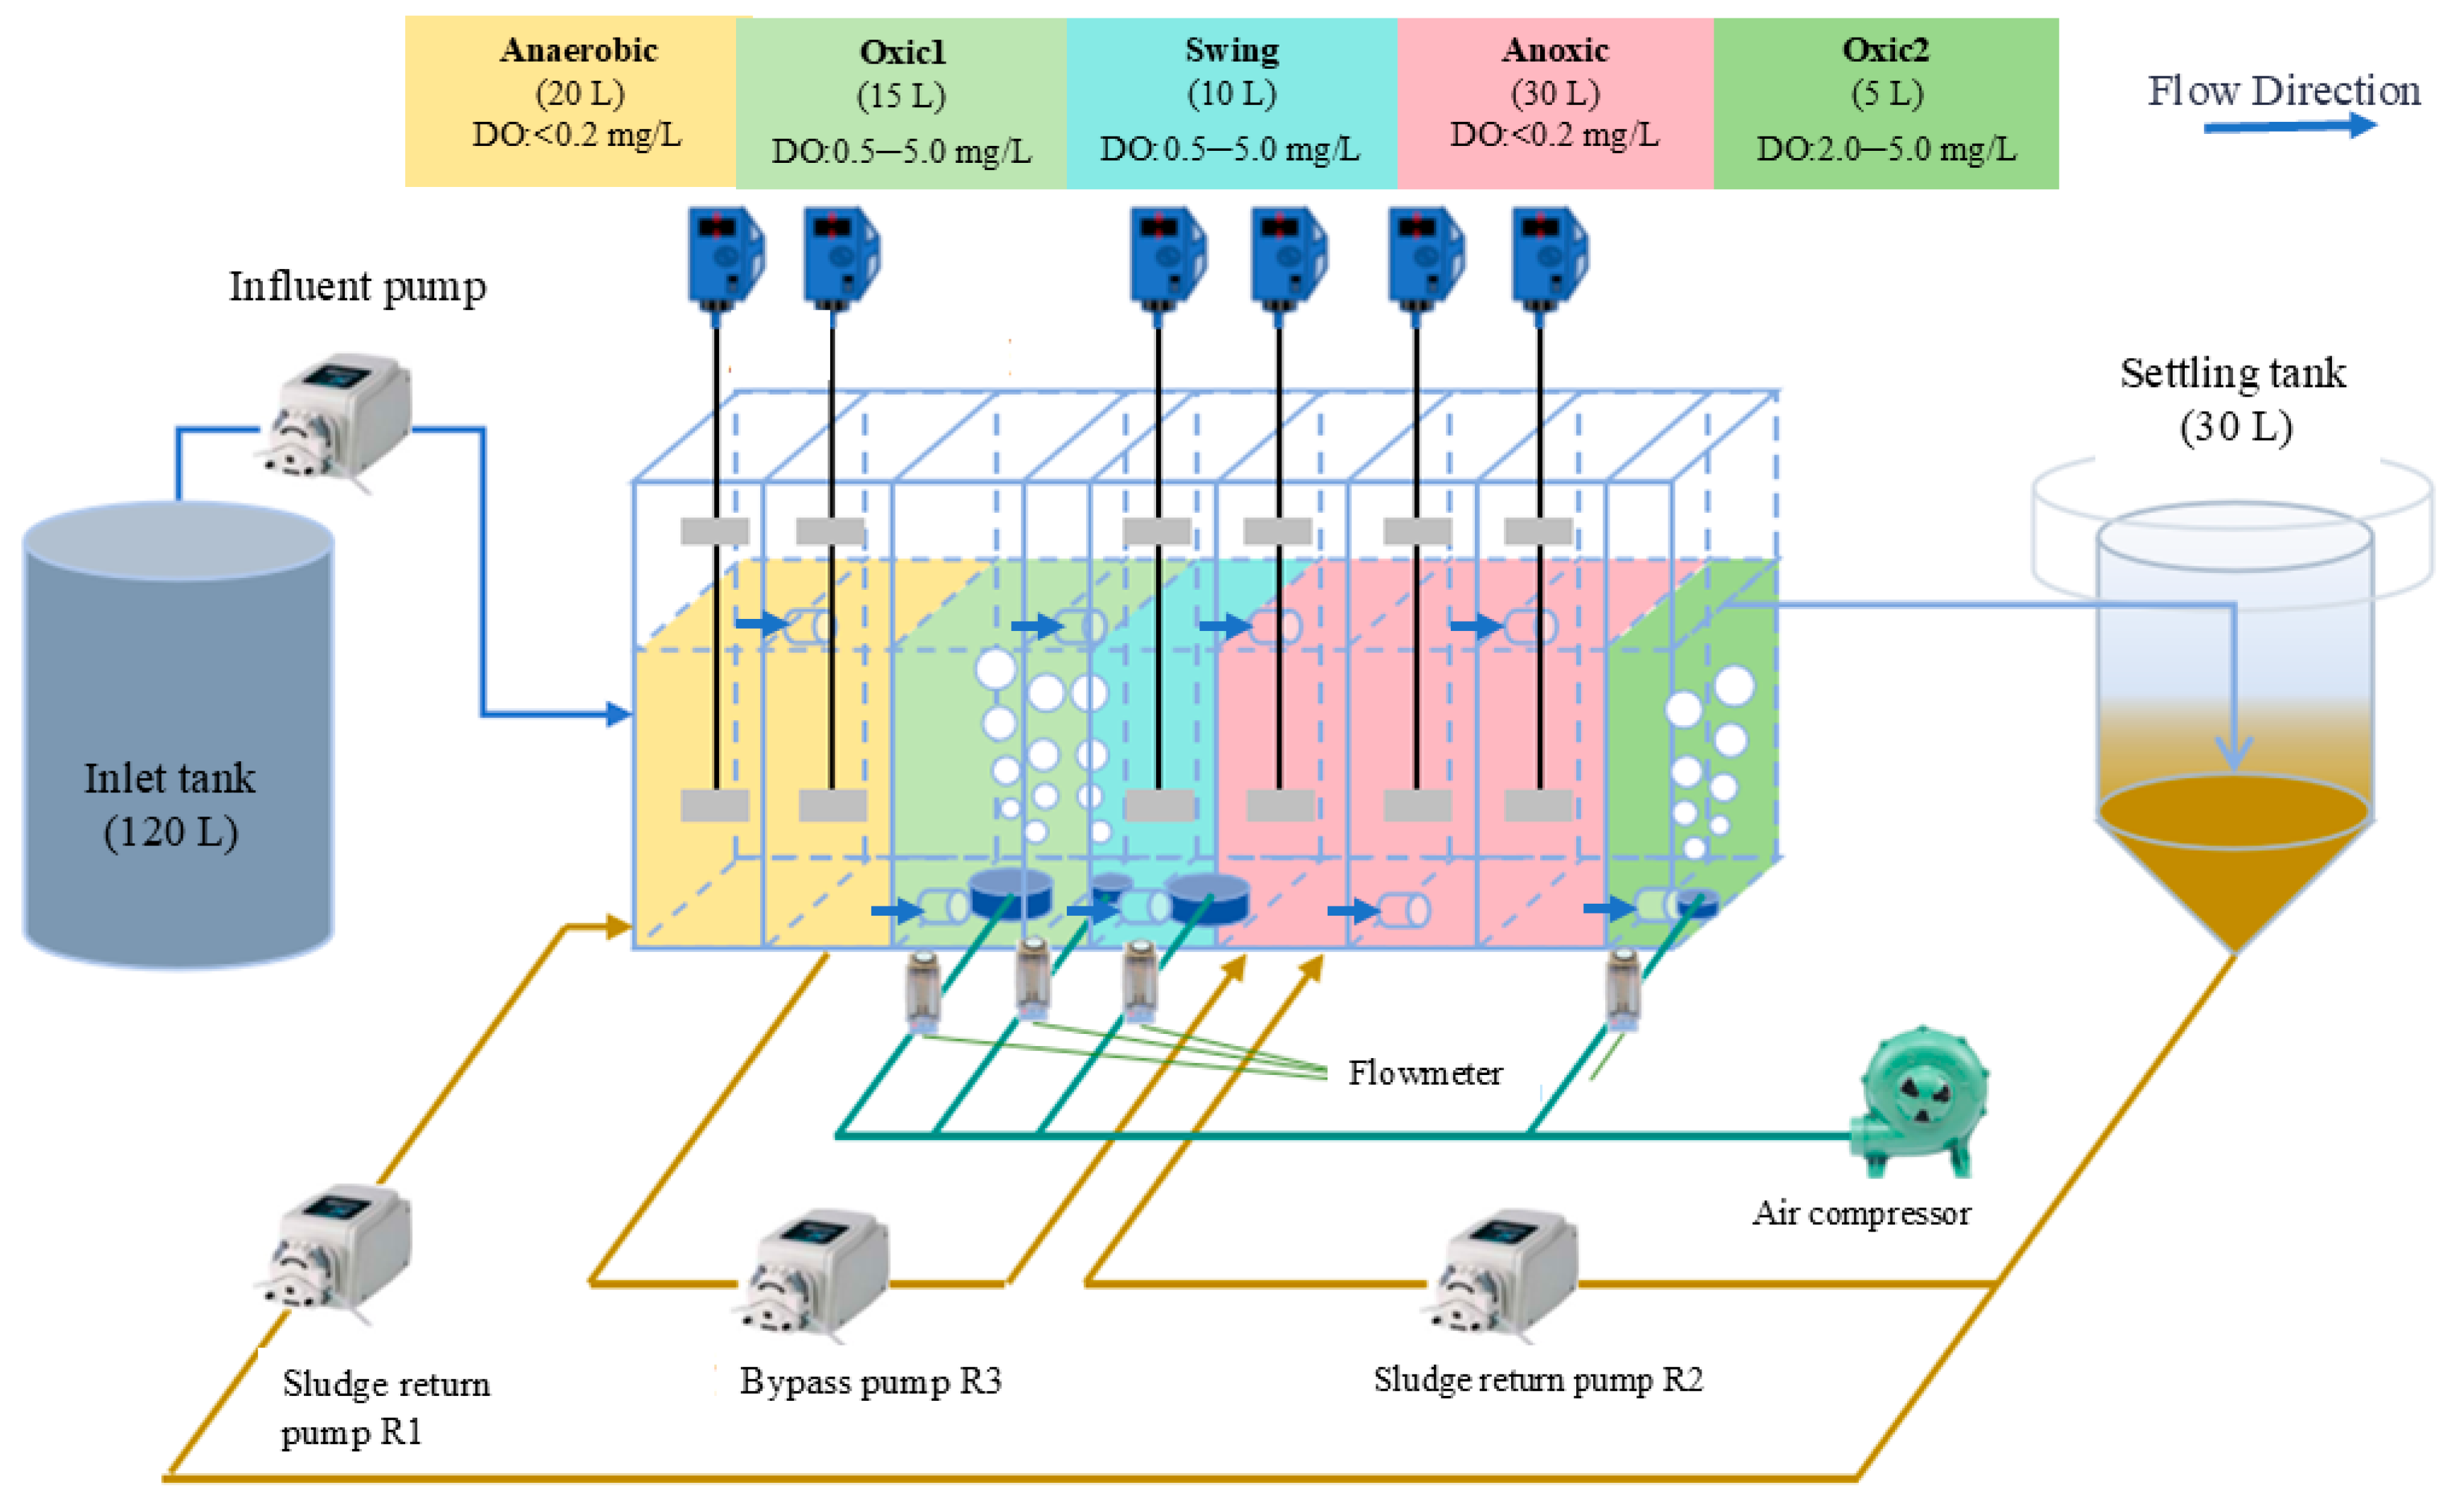
2.1. Reactor Start-Up and Operation

A continuous-flow plug-flow reactor was utilized in this study (Figure 1). The system consisted of an influent tank (120 L), a continuous-flow ASAO reactor (80 L), and a secondary clarifier (30 L). The simulated wastewater, along with a portion of the return sludge from the secondary clarifier, initially entered the anaerobic zone of the ASAO reactor. Subsequently, a fraction of the mixed liquor from the anaerobic zone flowed into the aerobic zone of the ASAO reactor, and then proceeded to the swing zone. Next, the remaining mixed liquor from the anaerobic zone, all the mixed liquor from the aerobic zone, and another portion of the return sludge from the secondary clarifier were directed to the anoxic zone. Finally, the mixed liquor was transported to the secondary clarifier for sludge–water separation. The overall HRT of the system was 16 h. The zone-specific HRT ratios were as follows: Anaerobic:Swing Aerobic (Oxic1 + Swing):Anoxic:Oxic = 2:2.5:3:0.5, corresponding to respective HRTs of 4 h (Anaerobic), 5 h (Swing Aerobic, including 3 h for Oxic1 and 2 h for Swing), 6 h (Anoxic), and 1 h (Oxic). Among these, R1 represented the first sludge return ratio, with 100% of the return sludge directed to the beginning of the anaerobic zone; R2 denoted the second sludge return ratio, with 100% of the return sludge directed to the beginning of the anoxic zone; and R3 indicated the bypass pump, where 30% of the mixed liquor at the end of the anaerobic zone was directly conveyed to the beginning of the anoxic zone. The detailed operating conditions for this stage are summarized in Table 1.

2.2. Wastewater and Inoculated Sludge

The activated sludge used in this study was obtained from the thickening tank of a municipal wastewater treatment plant located in Nanjing. The collected sludge was screened through a stainless steel mesh with a pore size of 1.0 mm to remove impurities, and then washed three times with deionized water for subsequent use. Simulated wastewater was utilized as a supplementary nutrient source to enrich the functional microbial community within the sludge. Following aeration and incubation of the sludge for 24 h, it was inoculated into the reactor, achieving an initial mixed-liquor suspended solids (MLSS) concentration of approximately 4 g/L. The influent water quality was designed to simulate low-carbon-to-nitrogen-ratio (C/N) municipal wastewater, as detailed in Table 2. The nitrogen and carbon sources in the simulated wastewater were provided by ammonium chloride and sodium acetate, respectively. The influent COD concentration was 200 mg/L, the influent NH4+-N concentration was 40 mg/L, and the influent TP concentration was 4 mg/L, providing a C/N/P ratio of approximately 50:10:1. Moreover, 1 mL of trace element solution was added per liter of simulated wastewater. The pH of the simulated wastewater was approximately 7.0.

2.3. Analytical Methods

The analysis of routine indicators in this study was performed in accordance with the national standard detection methods (Table 3). Water quality parameters were monitored every two days, with measurements taken for NH4+-N, NO3-N, NO2-N, COD, and TP in the influent and effluent, and at the end of the anaerobic, pre-aerobic, and anoxic zones. At the end of each cycle, the water quality in each compartment of the reactor was analyzed. Samples were collected and subsequently filtered through a 0.45 μm acetate cellulose membrane for further analysis. Sludge samples from each reaction zone were also collected to quantify the intracellular carbon content. The samples were first freeze-dried, and polyhydroxyalkanoates (PHAs), represented as the sum of poly-3-hydroxybutyrate (PHB) and poly-3-hydroxyvalerate (PHV), were determined using gas chromatography [6]. Gly was analyzed by the anthrone method [7].

2.4. Analysis of Microbial Composition

After the extraction of genomic DNA, the extracted genomic DNA was detected using 1% agarose gel electrophoresis. Specific primers with barcodes were synthesized based on the full-length 16S rRNA primers 27F-149R for PCR amplification. The PCR products were subsequently purified, quantified, and homogenized to form a sequencing library (SMRTBell). After library construction, the marker gene was sequenced via the PacBio sequencing platform using the single-molecule real-time sequencing (SMRT Cell) method. Subsequently, after filtering the CCS (Circular Consensus Sequencing) sequences, Optimization-CCS was obtained for OTU (Operational Taxonomic Unit) clustering, and species annotation and abundance analysis were performed to reveal the species composition of the samples. Moreover, α diversity analysis (alpha diversity), β diversity analysis (beta diversity), and significant species difference analysis were conducted.

2.5. Performance Detection of Ammonia-Oxidizing Bacteria (AOB) and Nitrite-Oxidizing Bacteria (NOB)

A total of 1000 mL of sludge was collected from the pre-aerobic zone, washed three times with deionized water, and subsequently divided into two equal portions. To one portion, ammonium chloride was added at a concentration of 20 mg/L, while sodium nitrite was added to the other portion at the same concentration. The DO level in the system was maintained at approximately 2 mg/L throughout the experiment. Samples of 10 mL were collected at time intervals of 0, 30, 60, 90, 120, 150, and 180 min. After filtration through a 0.45 μm acetate cellulose membrane, the concentrations of NO2−N and NH4+-N were determined for each sample. Finally, after the completion of the batch test, a 50 mL aliquot of the mixed liquor was taken to measure the mixed-liquor suspended solids (MLSS) and mixed-liquor volatile suspended solids (MLVSS).

2.6. Computational Methods

(1) Calculation of the contribution of PAO and GAO in the anaerobic zone to intracellular carbon storage was performed as follows [8]:
COD intra = COD i + COD w 1 2 COD ana 1.71 N O 2 , w 1 + N O 2 , i 2 N O 2 , ana 2.86 ( N O 3 , w 1 + N O 3 , i 2 N O 3 , ana )
0.5 P PAO = PRA / COD intra
P GAO = 1 P PAO
In the formula,
N O 2 , i , N O 2 , ana , N O 2 , w 1 represent the NO2⁻-N concentrations in the influent, at the end of the anaerobic tank, and at the first sludge return, respectively, with units of mg N/L;
N O 3 , i , N O 3 , ana , N O 3 , w 1 represent the nitrate nitrogen concentrations in the influent, at the end of the anaerobic tank, and at the first sludge return, respectively, with units of mg N/L;
COD i , COD ana , COD w 1 represent the chemical oxygen demand concentrations in the influent, at the end of the anaerobic zone, and at the first sludge return, respectively, with units of mg/L;
The values 1.71 and 2.86 represent the carbon consumption per 1 mg of NO2⁻ and NO3⁻ consumed, respectively, with units of mg COD/mg N;
Ppao represents the proportion of phosphate-accumulating organisms (PAOs) in the intracellular carbon source storage;
Pgao represents the proportion of glycogen-accumulating organisms (GAOs) in the intracellular carbon source storage;
PRA is the PO43⁻ release amount in the anaerobic zone, with units of mg P/L;
The value 0.5 is the value of PRA/CODintra in the polyphosphate-accumulating organism (PAO) model reported in [9], with units of mol P/mol C.
(2) The calculation methods for the nitrite accumulation rate (NAR) and total nitrogen removal efficiency (NRE) were as follows [10]:
NAR   = [ NO 2 N ] eff [ NO 2 N ] eff + [ NO 3 N ] eff × 100 %
NRE = TIN inf TIN eff TIN inf × 100 %
In the formula,
NAR and NRE represent the nitrite accumulation rate in the aerobic zone and the nitrogen removal efficiency of the reactor, in %;
[ NO 3 N ] eff , [ NO 2 N ] eff represent the nitrate and nitrite concentrations in the effluent at the end of the aerobic phase, in mg/L;
[ TI N ] inf , [ TI N ] eff represent the total nitrogen concentrations at the start of the reactor and in the effluent, in mg/L.
(3) The SND performance was calculated as follows:
E SND = 1 NO 2 N + NO 3 N NH 4 + N × 100 %
In the formula,
ESND represents the loss of nitrogen in the aerobic stage, in %;
△NO2-N represents the concentration difference of NO2-N at the end of the anaerobic and aerobic stages, in mg/L;
△NO3-N represents the concentration difference of NO3-N at the end of the anaerobic and aerobic stages, in mg/L;
△NH4+-N represents the concentration difference of NH4+-N at the end of the anaerobic and aerobic stages, in mg/L.

3. Results and Discussion

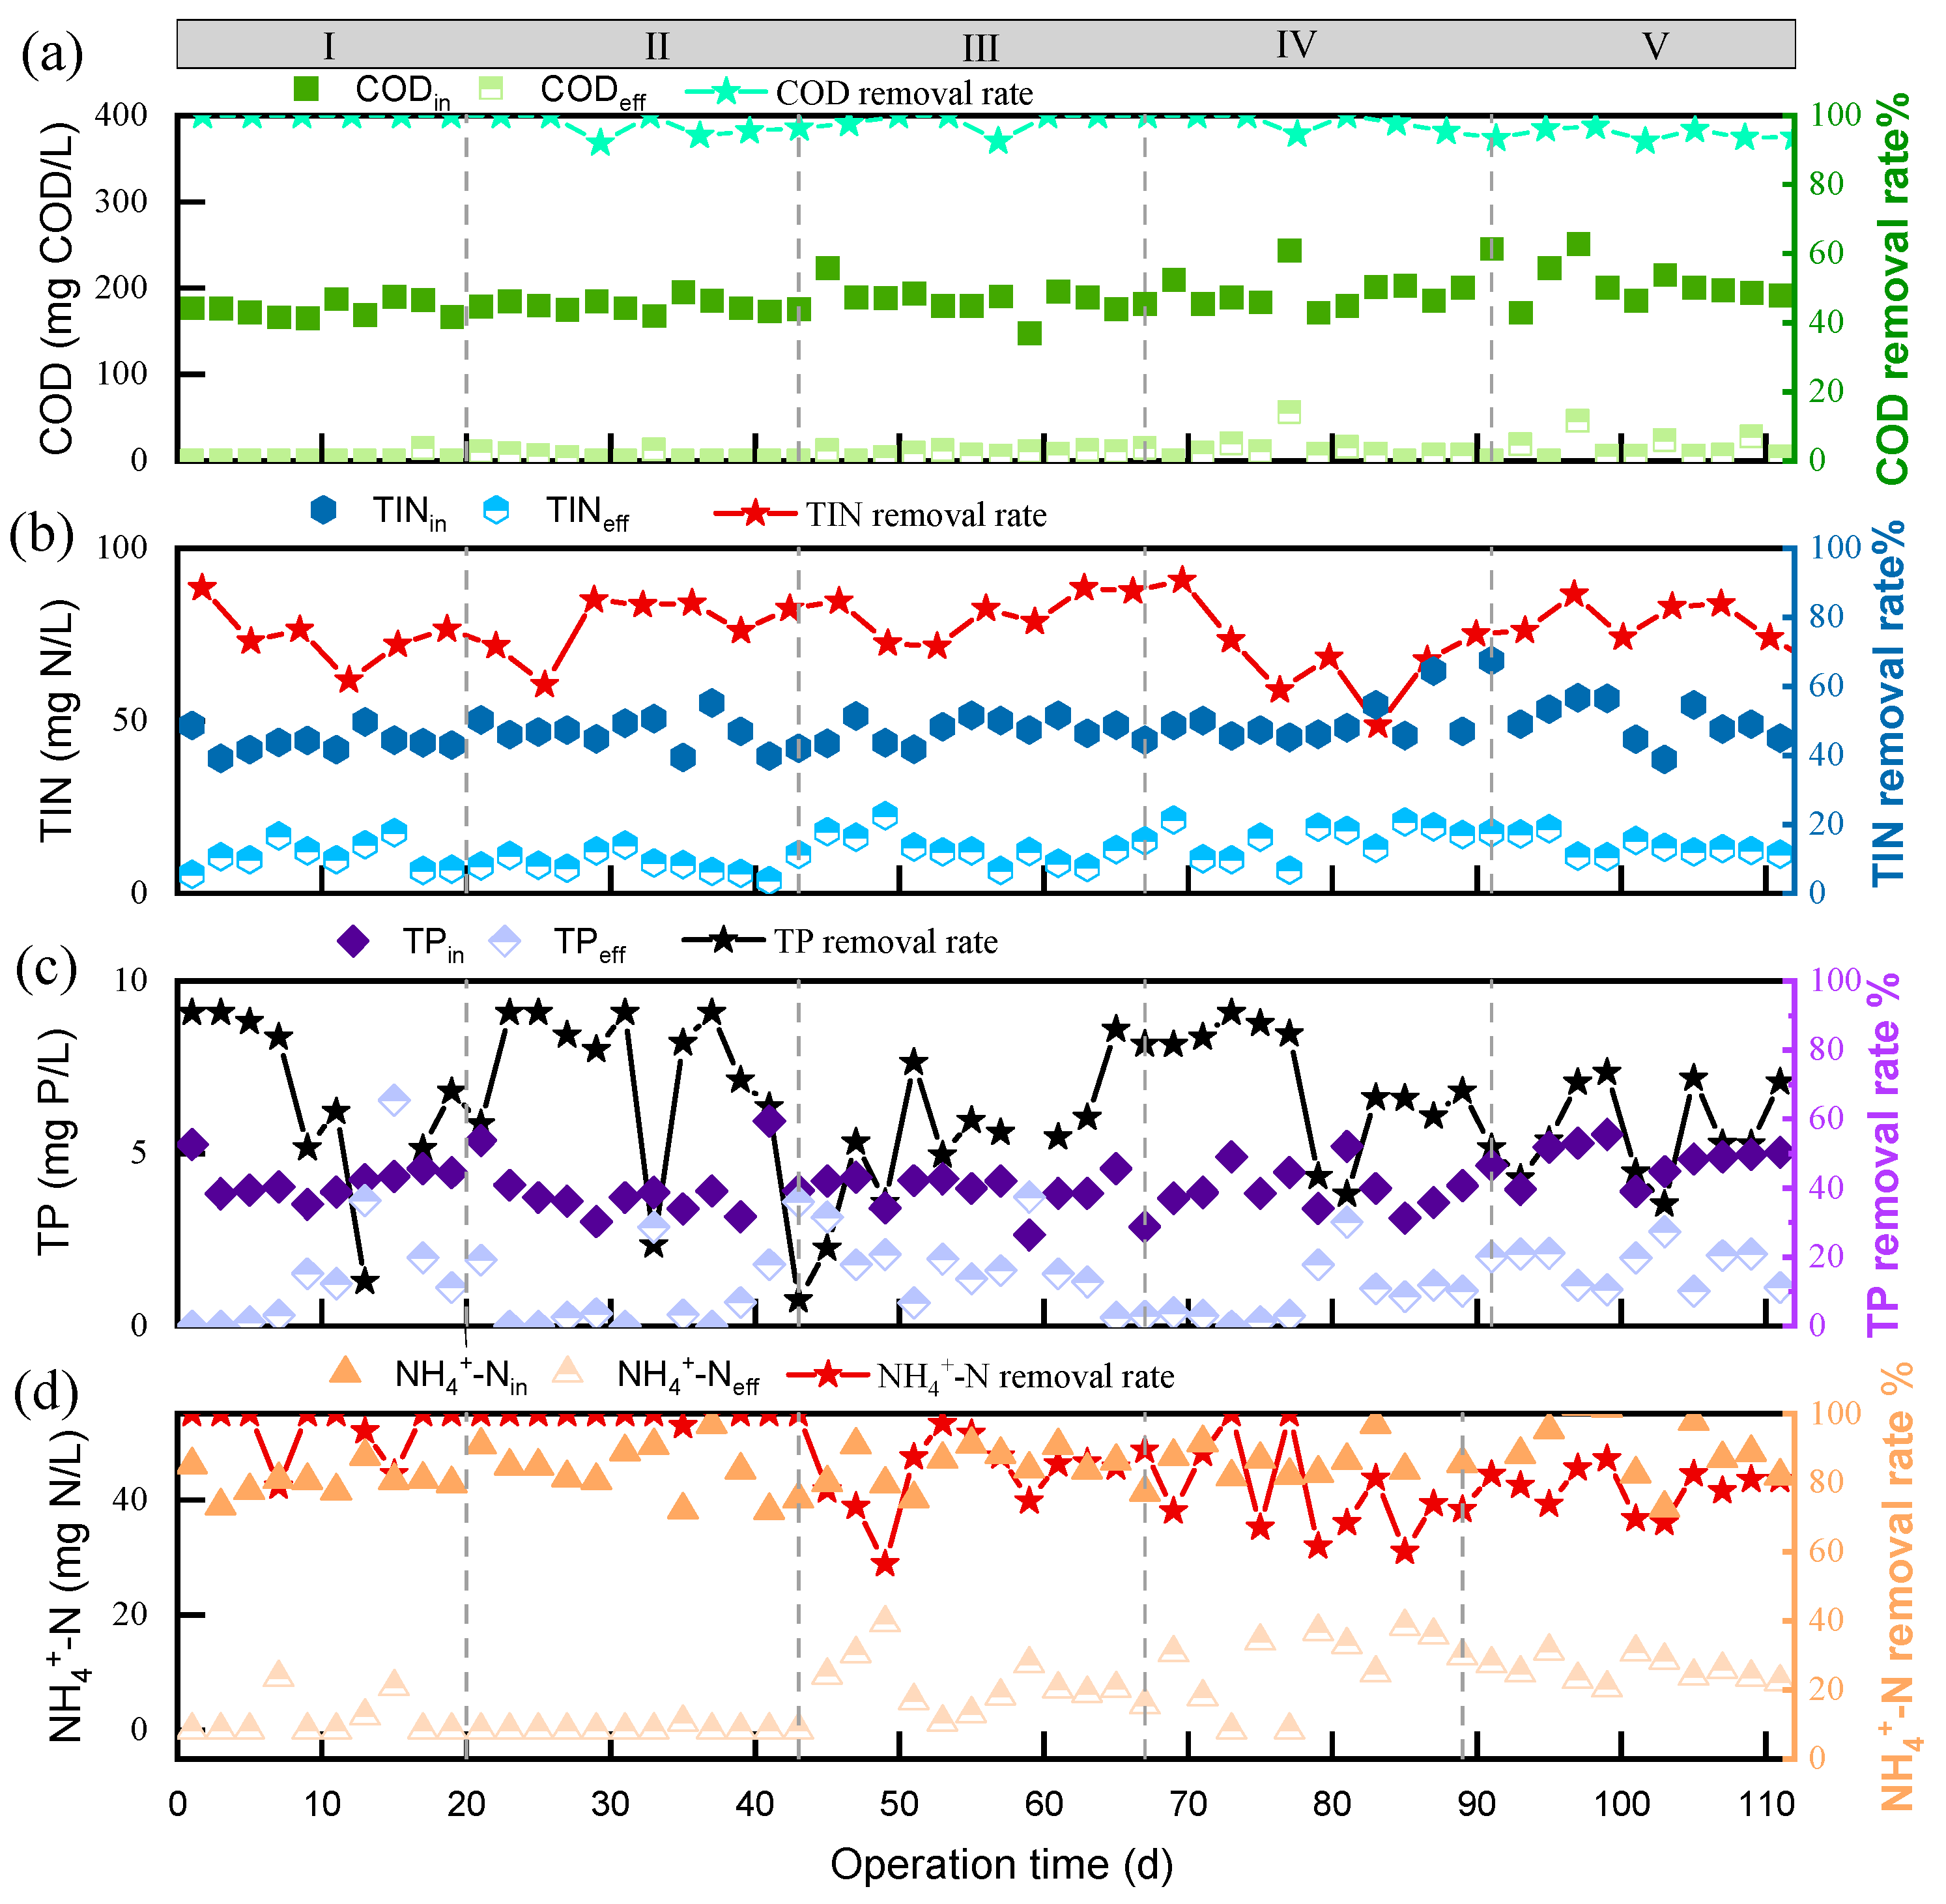
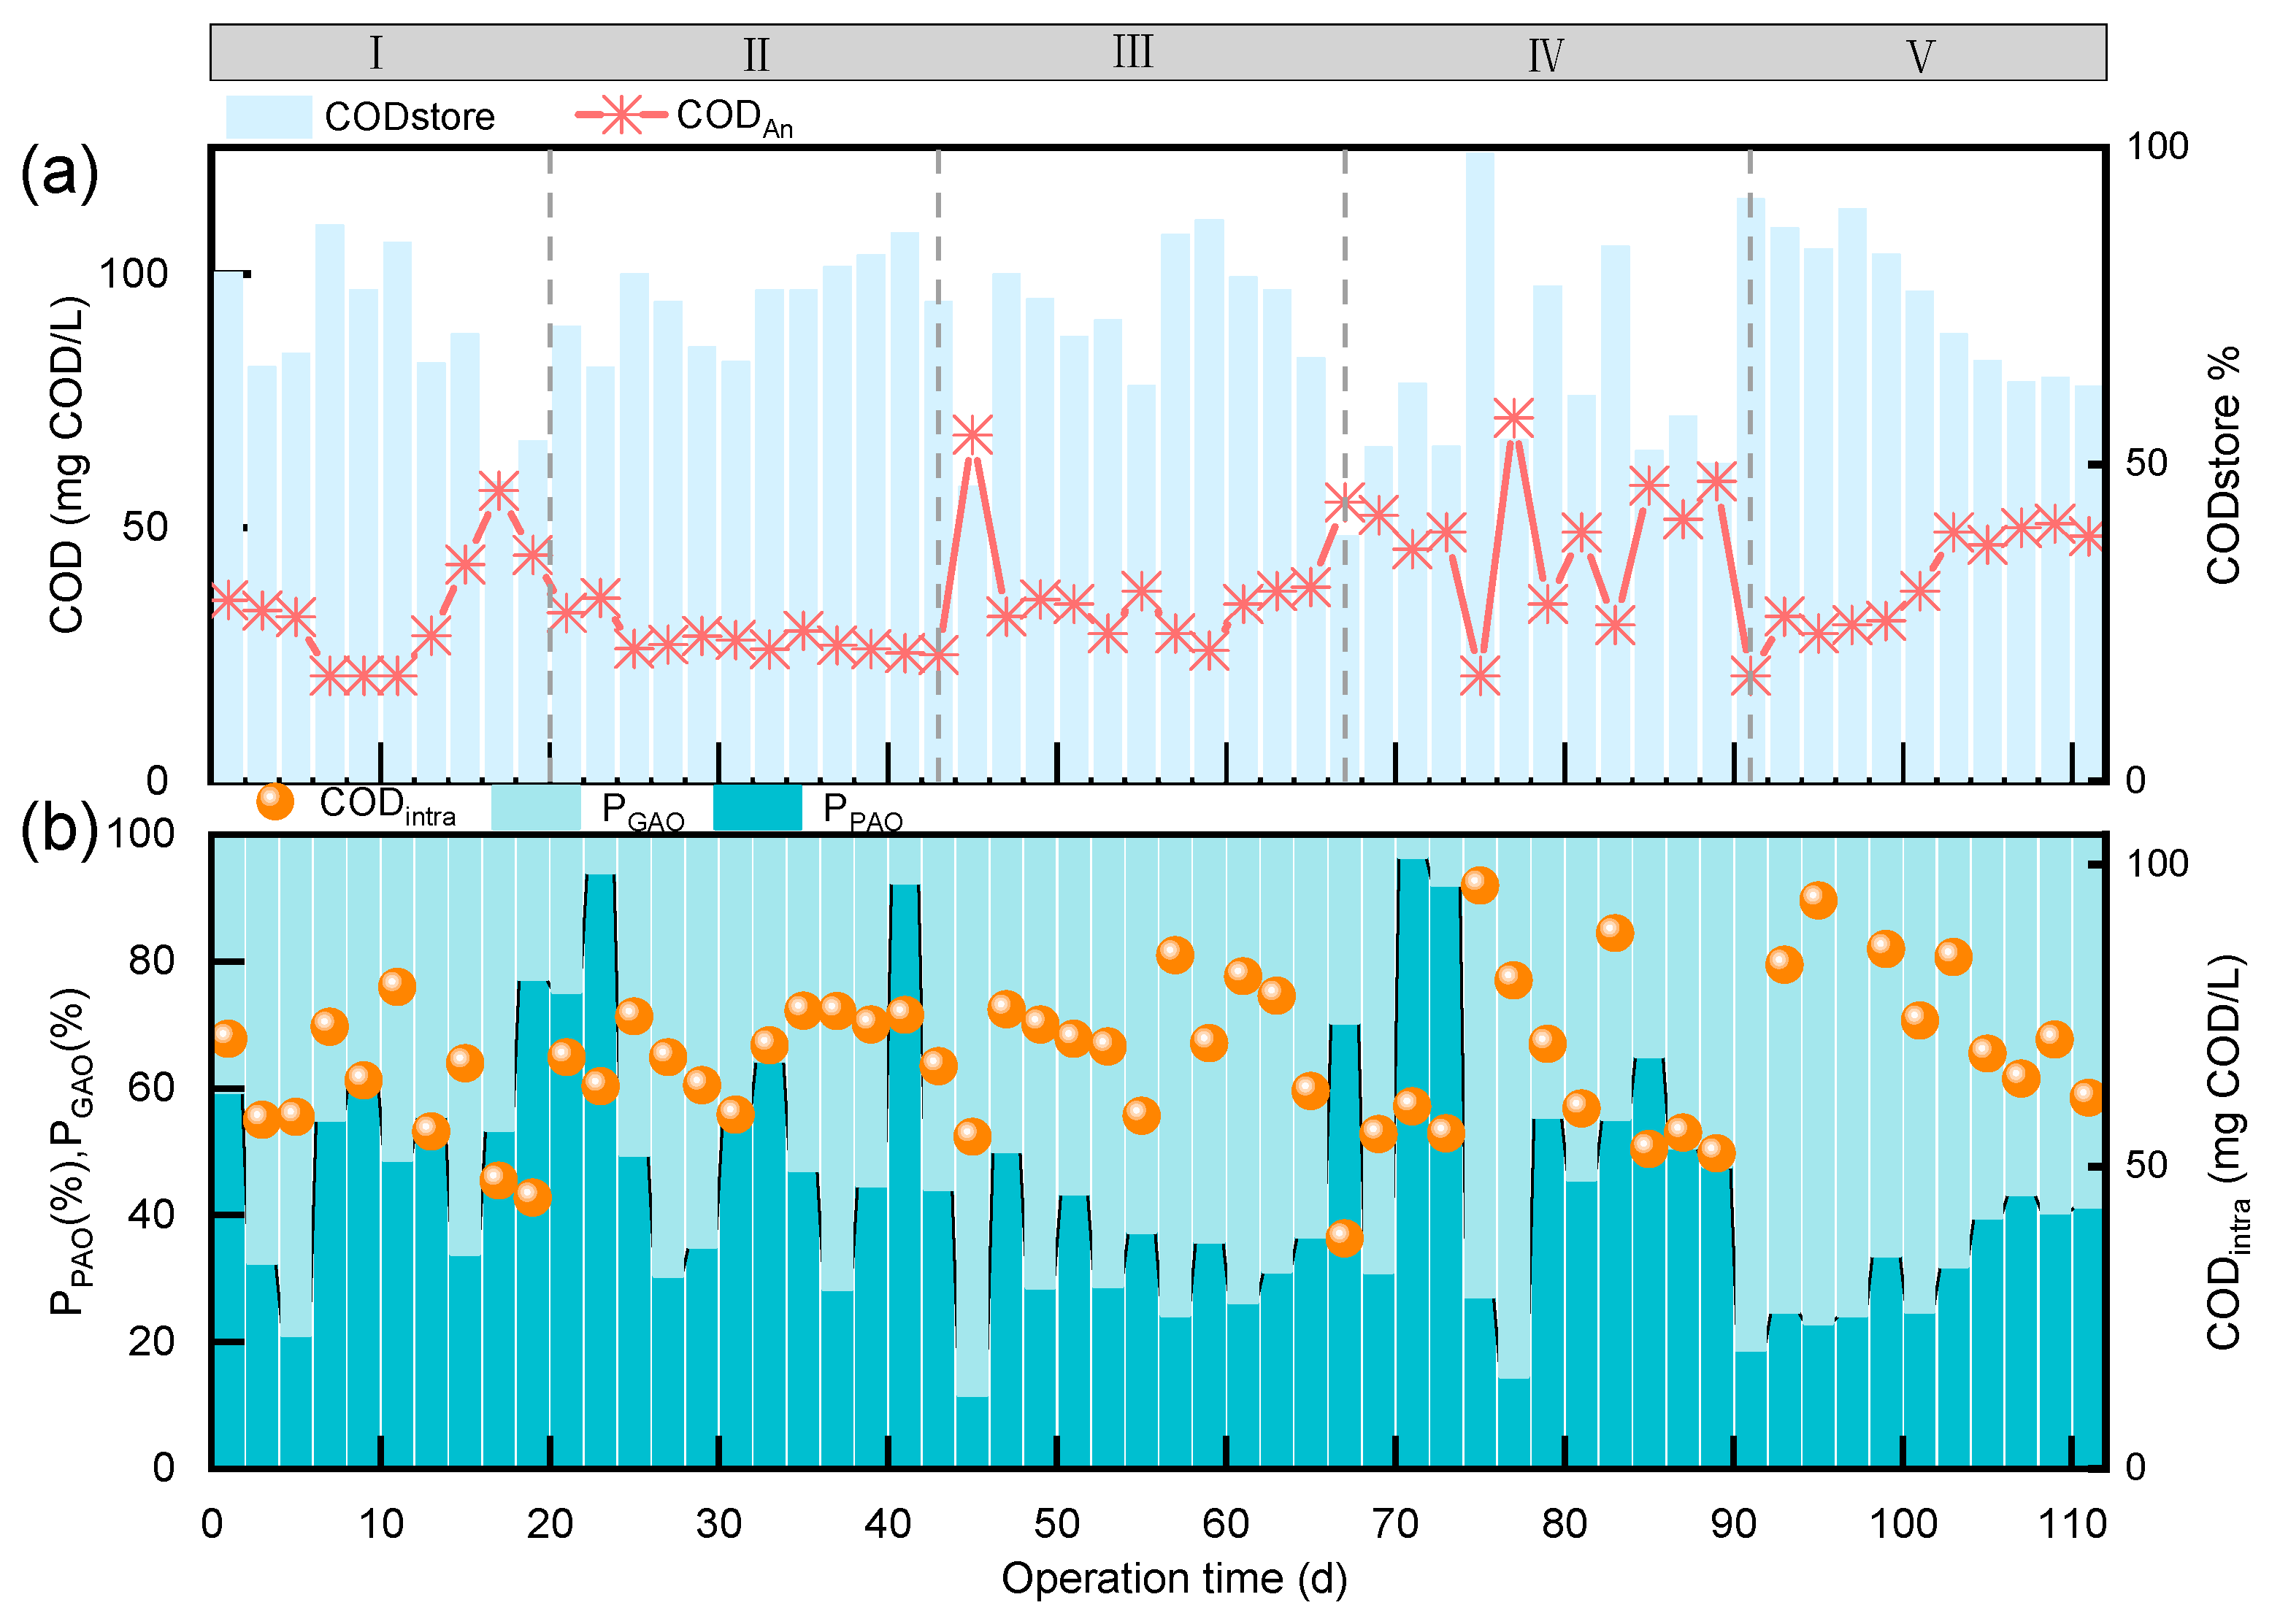
3.1. Long-Term Nitrogen and Phosphorus Removal Effects

In this study, the S zone of the ASAO reactor was designated as the aerobic zone, and an investigation was carried out into the influence of different DO combinations in the front and rear aerobic zones on the nitrogen and phosphorus removal efficiencies. The reactor operated stably for 112 days, and the influent and effluent water quality, as well as the treatment performance, are presented in Figure 2. During the first stage (1–21 days), to examine the differences in system operation under varying dissolved oxygen conditions, the experimental design incorporated a larger DO gradient to identify significant trends in performance changes. Specifically, the DO in both the front and rear aerobic zones was maintained at 4–5 mg/L. The average removal rates of NH4+-N, TP, TIN, and COD in the first stage were 95.66%, 73.34%, 76.09%, and 96.12%, respectively. Among them, the average reduction in NH4+-N in the aerobic zone was 19.76 mg/L, the average reduction in TIN was 7.93 mg/L, SND accounted for 24.03% of the total nitrogen removal, and the NAR was 10.94%. In the second stage (21–43 days), the DO in the front aerobic zone was adjusted to 2–3 mg/L, while the DO in the rear aerobic zone remained at 4–5 mg/L. The average removal rates of NH4+-N, TP, TIN, and COD were 99.78%, 76.53%, 88.18%, and 98.05%, respectively. Among them, the average reduction in NH4+-N in the aerobic zone was 18.24 mg/L, the average reduction in TIN was 7.06 mg/L, SND accounted for 18.68% of the TIN removal, and the NAR was 7.69%. Both SND and the NAR slightly decreased. After the sludge in the system was acclimated in the first stage, the nitrogen and phosphorus removal effects were both enhanced in this stage. In the third stage (44–65 d), the DO in the pre-aerobic zone further decreased to 0.5–1 mg/L, while that in the post-aerobic zone remained at 4–5 mg/L. Due to the decline in DO levels, the NH4+-N removal rate in this stage dropped to 82.26%. The average reduction in NH4+-N in the aerobic zone was 7.77 mg/L, and that for TIN was 3.16 mg/L. SND accounted for 9.09% of the total nitrogen removal, and the NAR was 22.04%. SND decreased significantly, while the NAR increased significantly. In the first few days after the DO in the pre-aerobic zone was lowered, the NH4+-N removal efficiency decreased significantly, but it improved after adaptation. It can be observed that as the DO decreased, the SND performance deteriorated, which appears to contradict many existing research findings. Yan et al. reported that SND performance was optimal at a dissolved oxygen level of 0.7 ± 0.1 mg/L, achieving a TN removal efficiency of 72.28% and an SND efficiency of 73.69% [11]. Moreover, some studies have revealed that an increase in DO levels markedly inhibits denitrification, especially at 4.5 mg/L, thereby resulting in a reduction in SND efficiency [12]. However, Sriwiriyarat et al. [13] indicated that SND requires a DO concentration of 6 mg/L to sustain efficient nitrification and generate more N2O for denitrification in high-concentration activated sludge systems. This is attributed to the fact that different DO levels enrich distinct populations of synchronous nitrification and denitrification bacteria. Studies have revealed that in SND reactors with a DO concentration of 0.2–1.0 mg/L, complete ammonia-oxidizing bacteria from the genus Nitrospira were enriched, suggesting that low DO concentrations can enhance the abundance of Nitrospira and incorporate the complete ammonia oxidation pathway into SND processes [14]. Zhao et al. [15] demonstrated that when the DO concentration was 4.7 ± 0.1 mg/L, enrichment of the Thiothrix genus occurred, enabling SND at high DO levels. At a DO concentration of 1.5 mg/L, the nitrogen removal pathway of heterotrophic nitrification–aerobic denitrification (HNAD) was more likely to prevail, with enrichment of the Paracoccus, Acinetobacter, and Thauera genera observed under these conditions [16]. In the fourth stage (66–89 days), the DO level in the pre-aerobic zone was maintained at 0.5–1 mg/L, while that in the post-aerobic zone was kept at 2–3 mg/L. The ammonia nitrogen removal performance continued to deteriorate, with the average removal rate of NH4+-N decreasing to 77.86%. Due to the prolonged period of DO in the pre-aerobic zone being below 1 mg/L, combined with relatively high DO levels in the post-aerobic zone during the early phase, the sludge quality remained stable. However, as the DO in the post-aerobic zone decreased, filamentous sludge bulking occurred in the system, leading to a Sludge Volume Index (SVI) exceeding 200. At this stage, the TIN removal efficiency significantly declined, whereas the TP removal efficiency improved due to intensified sludge bulking and sludge loss within the system. In the fifth stage (90–112 days), the DO in the pre-aerobic zone increased to 1–2 mg/L, while that in the post-aerobic zone remained at 2–3 mg/L. The ammonia nitrogen removal performance slightly improved, and the sludge bulking phenomenon was alleviated with the slight increase in DO in the pre-aerobic zone. Consequently, the TIN removal efficiency was enhanced.
As shown in Figure 3, the absorption rates of internal carbon sources by GAOs and PAOs within the system are relatively high, consistently remaining above 60%. With the reduction in DO concentration in the pre-aerobic zone, the absorption rate of internal carbon sources shows a decreasing trend. This is attributed to the decreased nitrification efficiency, leading to a lower concentration of NO3⁻-N in the effluent. Consequently, denitrifying phosphorus-removing bacteria experience reduced activity due to substrate limitation, resulting in diminished internal carbon source storage during the anaerobic phase. The carbon source absorption capabilities of GAOs and PAOs within the system are comparable. Notably, GAOs appear to exhibit better adaptability to environments with higher DO levels [17]. When the DO levels in both the pre-aerobic and post-aerobic zones decrease, PGAO drops rapidly within a short period, but adapts quickly. By comparing Figure 3 with Figure 2, it can be found that PPAO is consistent with the phosphorus removal performance of the system.
The ASAO process exhibits significantly enhanced performance compared to conventional systems (Table 4). Operating with an aerobic hydraulic retention time (HRT) of 3–5 h, it achieves a total inorganic nitrogen (TIN) removal efficiency of 88.18%, surpassing the efficiencies of A/O (50.8%), AAO (73.1–77.1%), and AOA (70.7–87.1%). Unlike AOA, which experiences temperature-dependent efficiency fluctuations (ranging from 70.7% to 87.1%), ASAO ensures stable and highly efficient nitrogen removal through synergistic pathways, including simultaneous nitrification–denitrification (SND), denitrifying phosphorus removal (DPR), and anaerobic ammonium oxidation (ANAMMOX). This approach eliminates reliance on single metabolic routes, such as partial denitrification in AOA or phosphorus-driven denitrification (PD/A) in AAO. Furthermore, the flexible swing zone in ASAO optimizes the switching between aerobic and anoxic conditions, enhancing adaptability compared to the fixed HRT frameworks of AAO (2–5.7 h) and AOA (4 h). The integration of multi-pathway denitrification and operational flexibility makes ASAO a robust solution for treating low-C/N wastewater under varying environmental conditions.

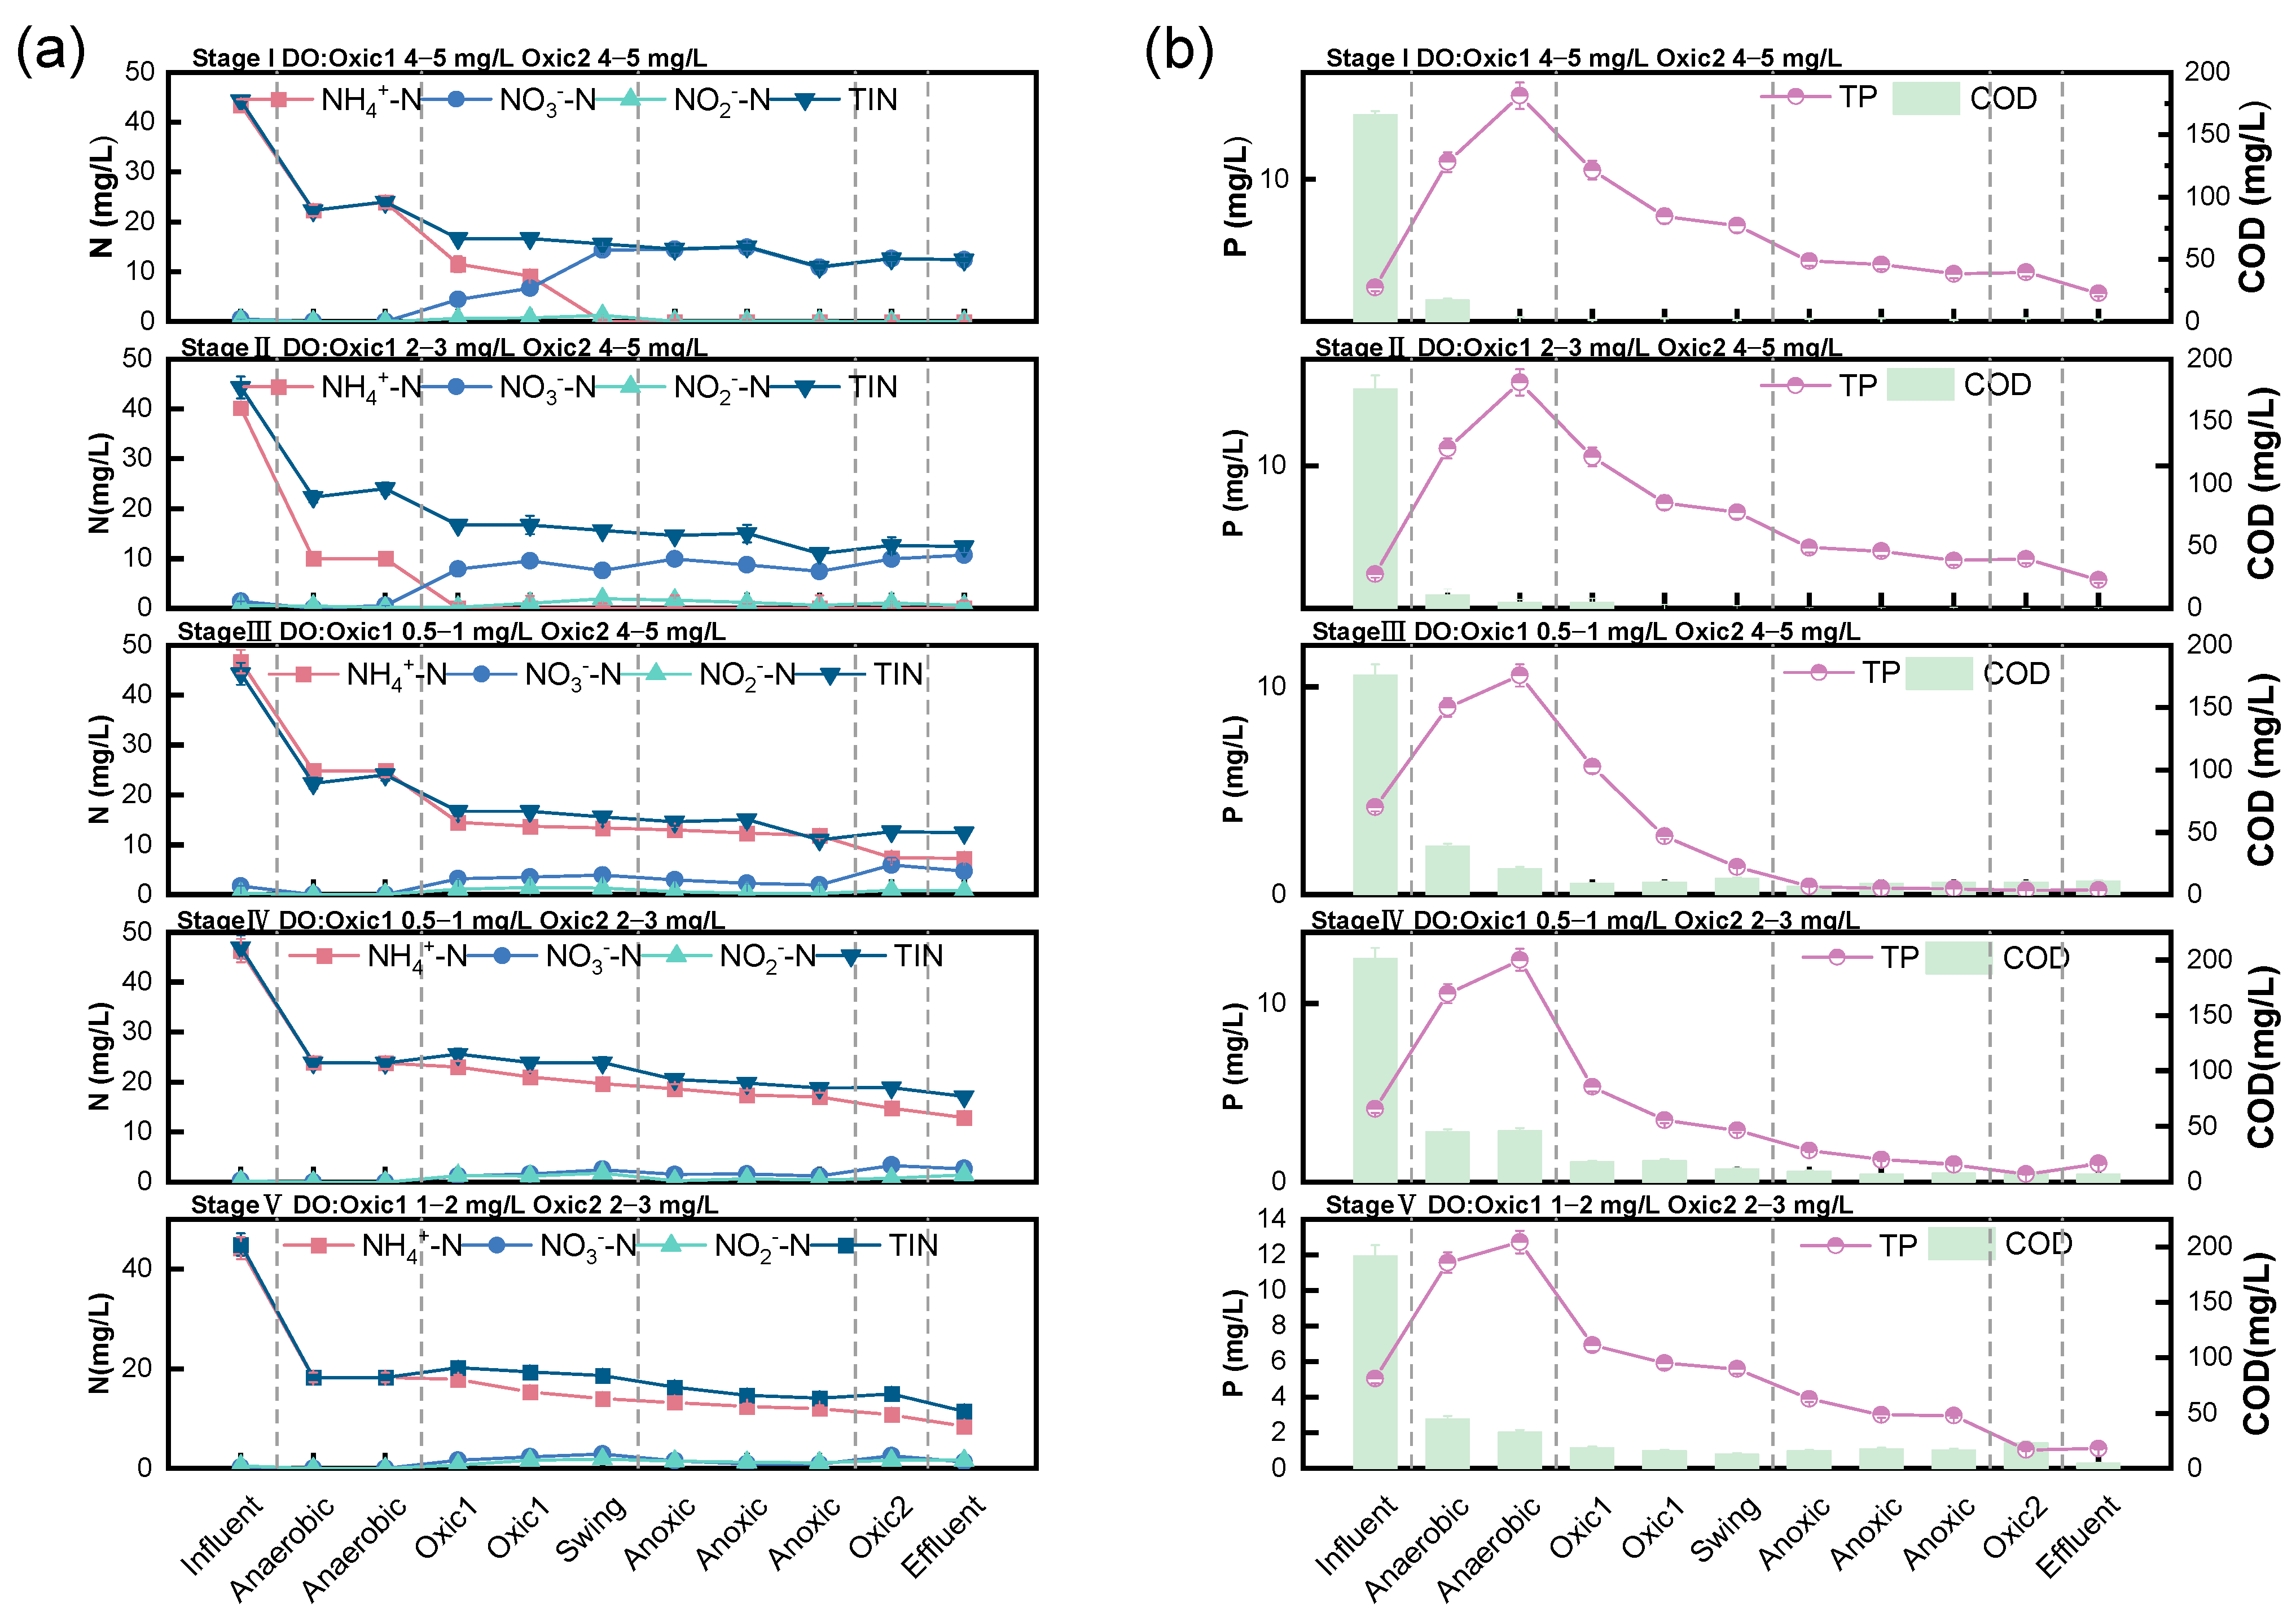
3.2. Typical Periodic Nitrogen and Phosphorus Removal Effects

As illustrated in Figure 4 and Figure 5, the majority of COD is removed in the anaerobic zone and undergoes further reduction in the aerobic zone. The accumulation of PHA reaches its maximum in the anaerobic zone, with a portion being consumed during aerobic phosphorus uptake by PAOs and another portion during denitrifying phosphorus removal in the anoxic zone. Glycogen accumulates in the anaerobic zone and continues to increase in subsequent zones, nearly reaching its peak in the post-aerobic zone. The concentration of NH4+-N significantly decreases upon entering the anaerobic zone, due to the dilution effect of the returned sludge. There is no marked change in concentration after the anaerobic zone, and it gradually decreases in the pre-aerobic zone. When entering the anoxic zone from the pre-aerobic zone with a high DO concentration, the NH4+-N concentration is nearly zero. Nevertheless, when entering the anoxic zone from the pre-aerobic zone with a low DO concentration, the ammonia nitrogen concentration abruptly rises. At this juncture, it is observed that NH4+-N is further consumed in the anoxic zone, but the concentrations of NO2-N and NO3-N entering the anoxic zone are relatively low. This suggests the presence of endogenous partial denitrification (EPD) and ANAMMOX processes within the system. Several studies have also identified that certain species of Nitrospira are complete ammonia oxidizers (COMAMMOX), which play a dominant role in low-DO nitrification reactors due to their ability to perform nitrification even under anoxic conditions [14]. In the post-aerobic zone, when the DO concentration is high, NH4+-N is further consumed, and the NO3-N concentration ascends. However, when the DO concentration in the post-aerobic zone drops, the NH4+-N concentration exiting the post-aerobic zone increases significantly. Upon entering the anaerobic zone, the TP concentration sharply increases due to phosphorus release by PAOs. However, as the DO level in the pre-aerobic zone decreases, the released TP concentration slightly diminishes. The TP concentration experiences a significant drop upon entering the pre-aerobic zone, which is attributed to aerobic phosphorus uptake by PAOs. The further reduction in TP in the anoxic zone is ascribed to denitrifying phosphorus removal by DPAOs within the system. In the post-aerobic zone, the TP concentration continues to decrease due to phosphorus uptake by PAOs. As the DO level in the pre-aerobic zone declines, the consumption of COD in the aerobic zone reduces, and the accumulation of PHA in the anaerobic zone also decreases. Concurrently, the glycogen content in the anaerobic zone rises, as PHA synthesis is derived from glycogen degradation [23]. The utilization of PHA in the pre-aerobic zone significantly decreases. Nevertheless, the reason for the increased phosphorus loss in the aerobic zone during the third and fourth stages compared to the first and second stages is that denitrifying phosphorus removal occurs in the aerobic zone under low-DO conditions. In the fifth stage, as the DO in the pre-aerobic zone recovers, the phosphorus loss decreases, which is attributed to the reduced denitrifying phosphorus removal in the pre-aerobic zone.

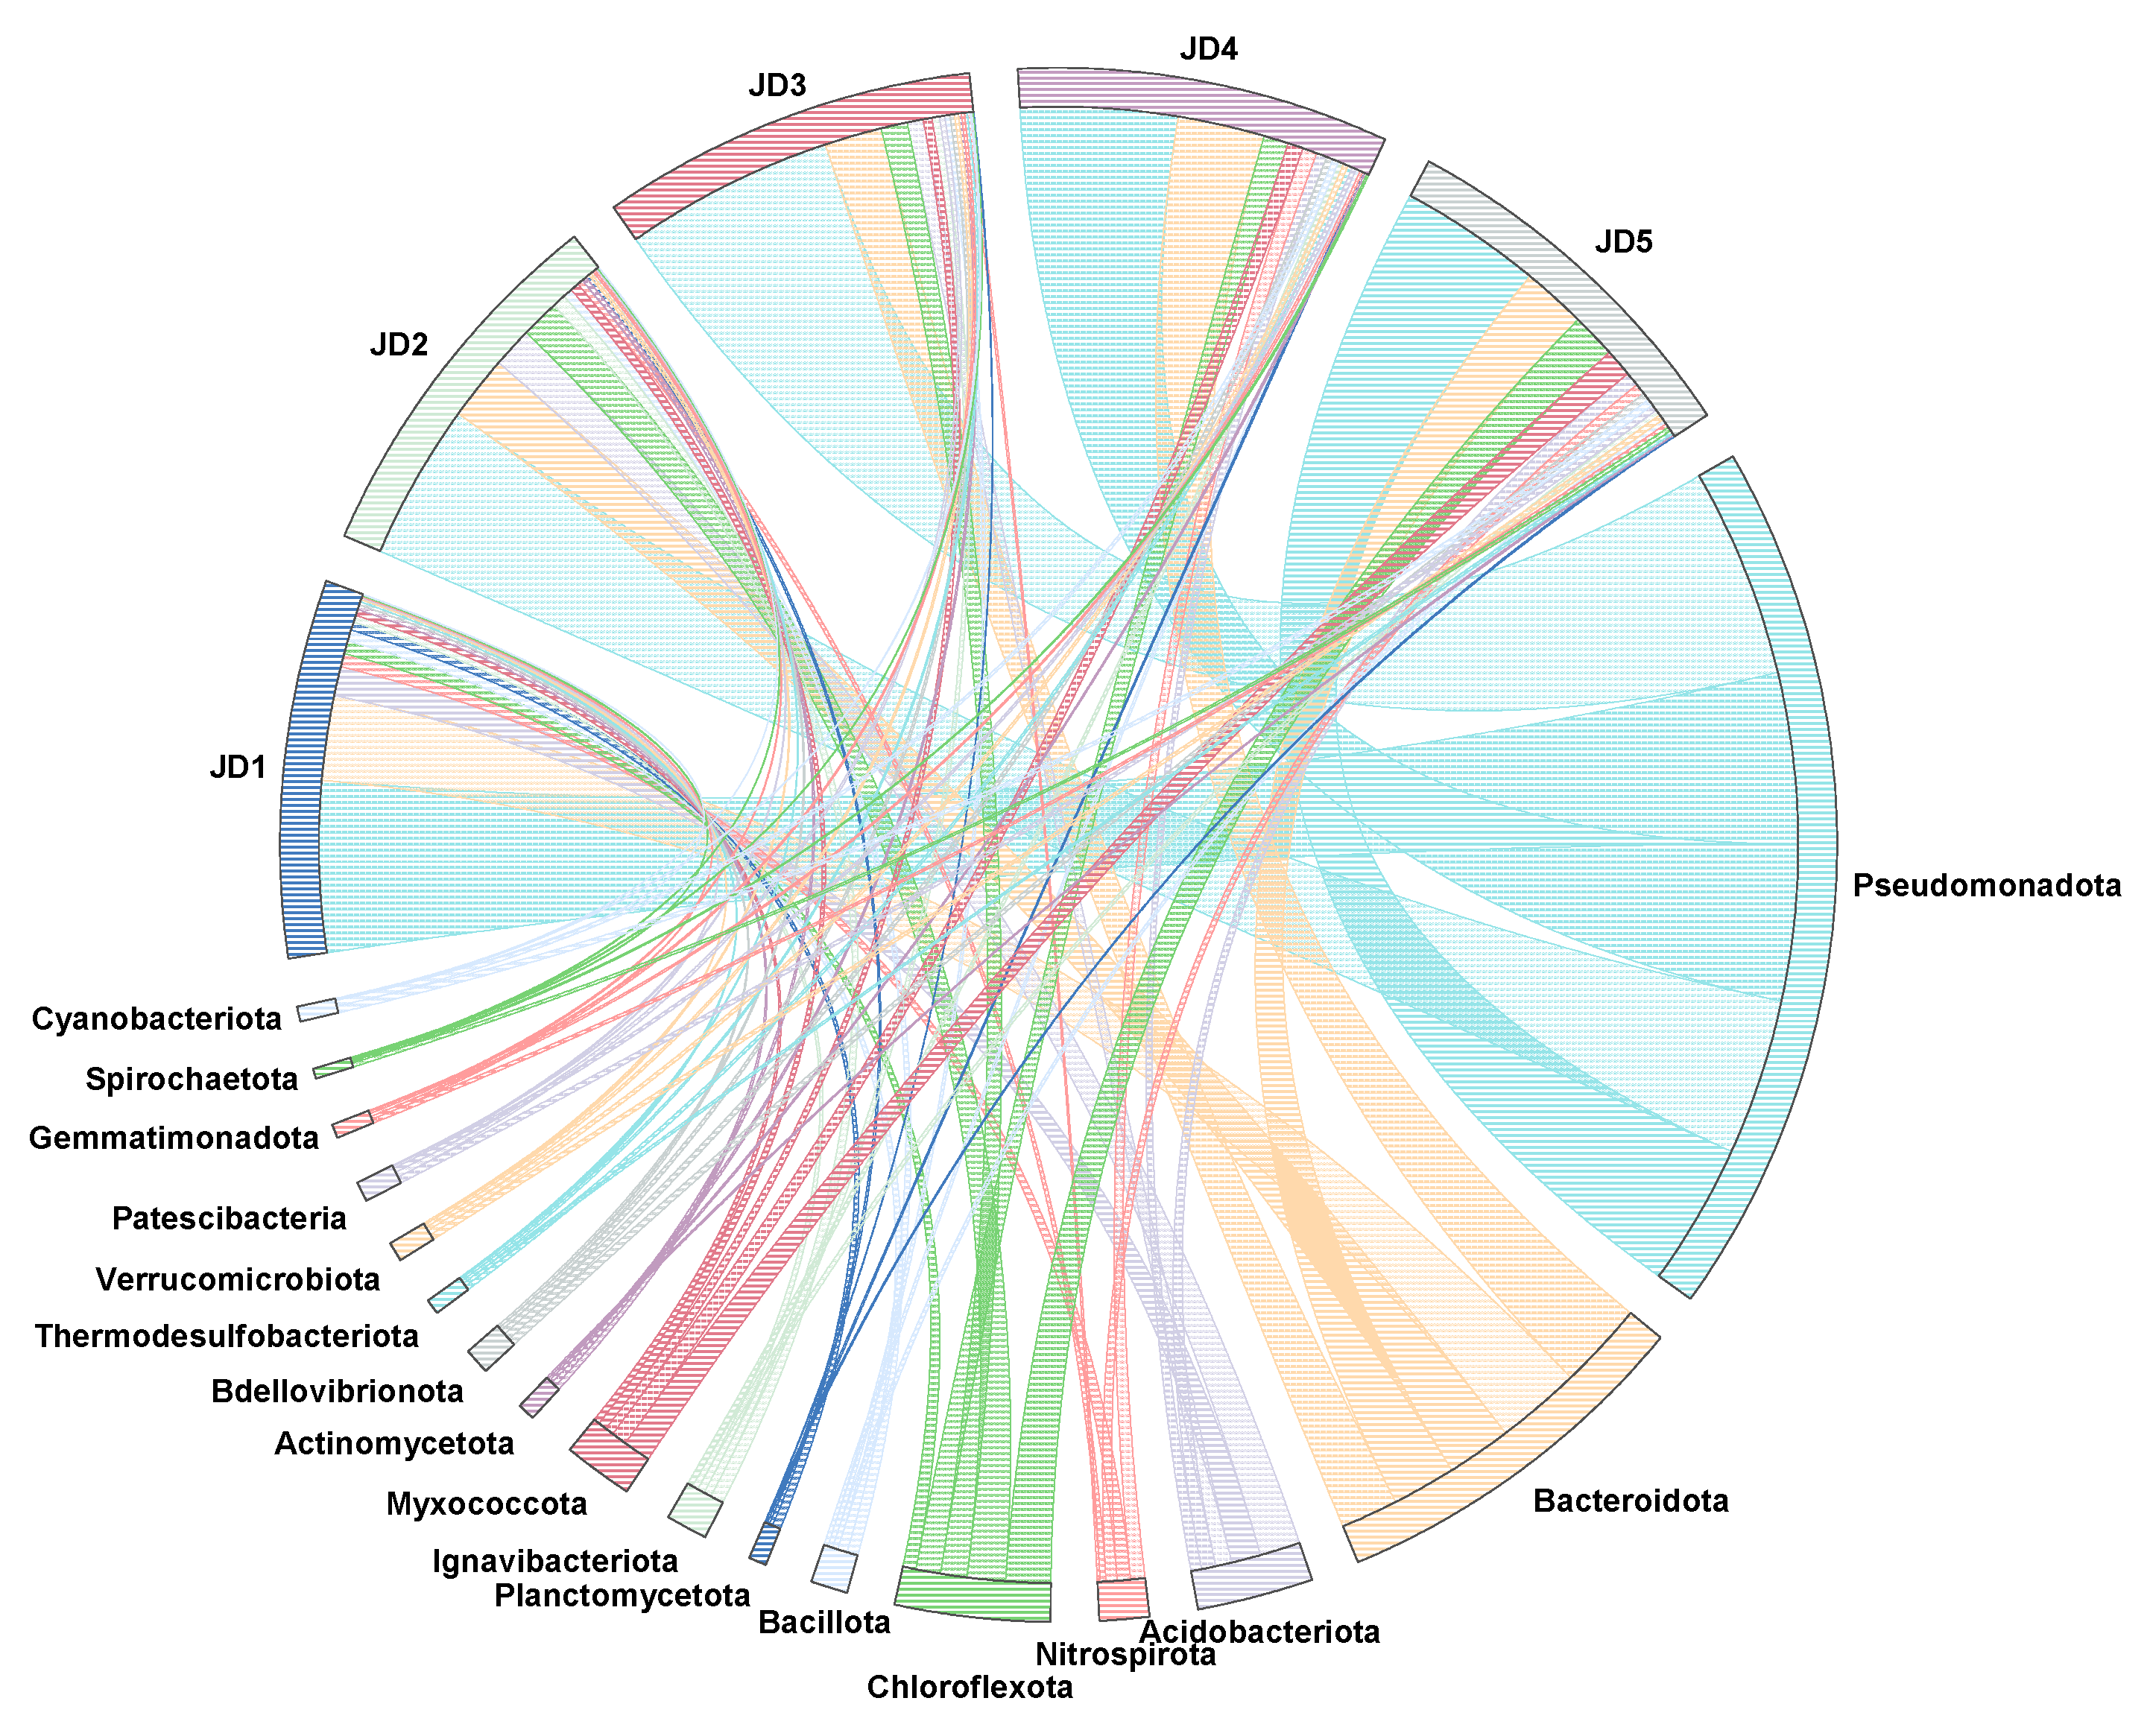
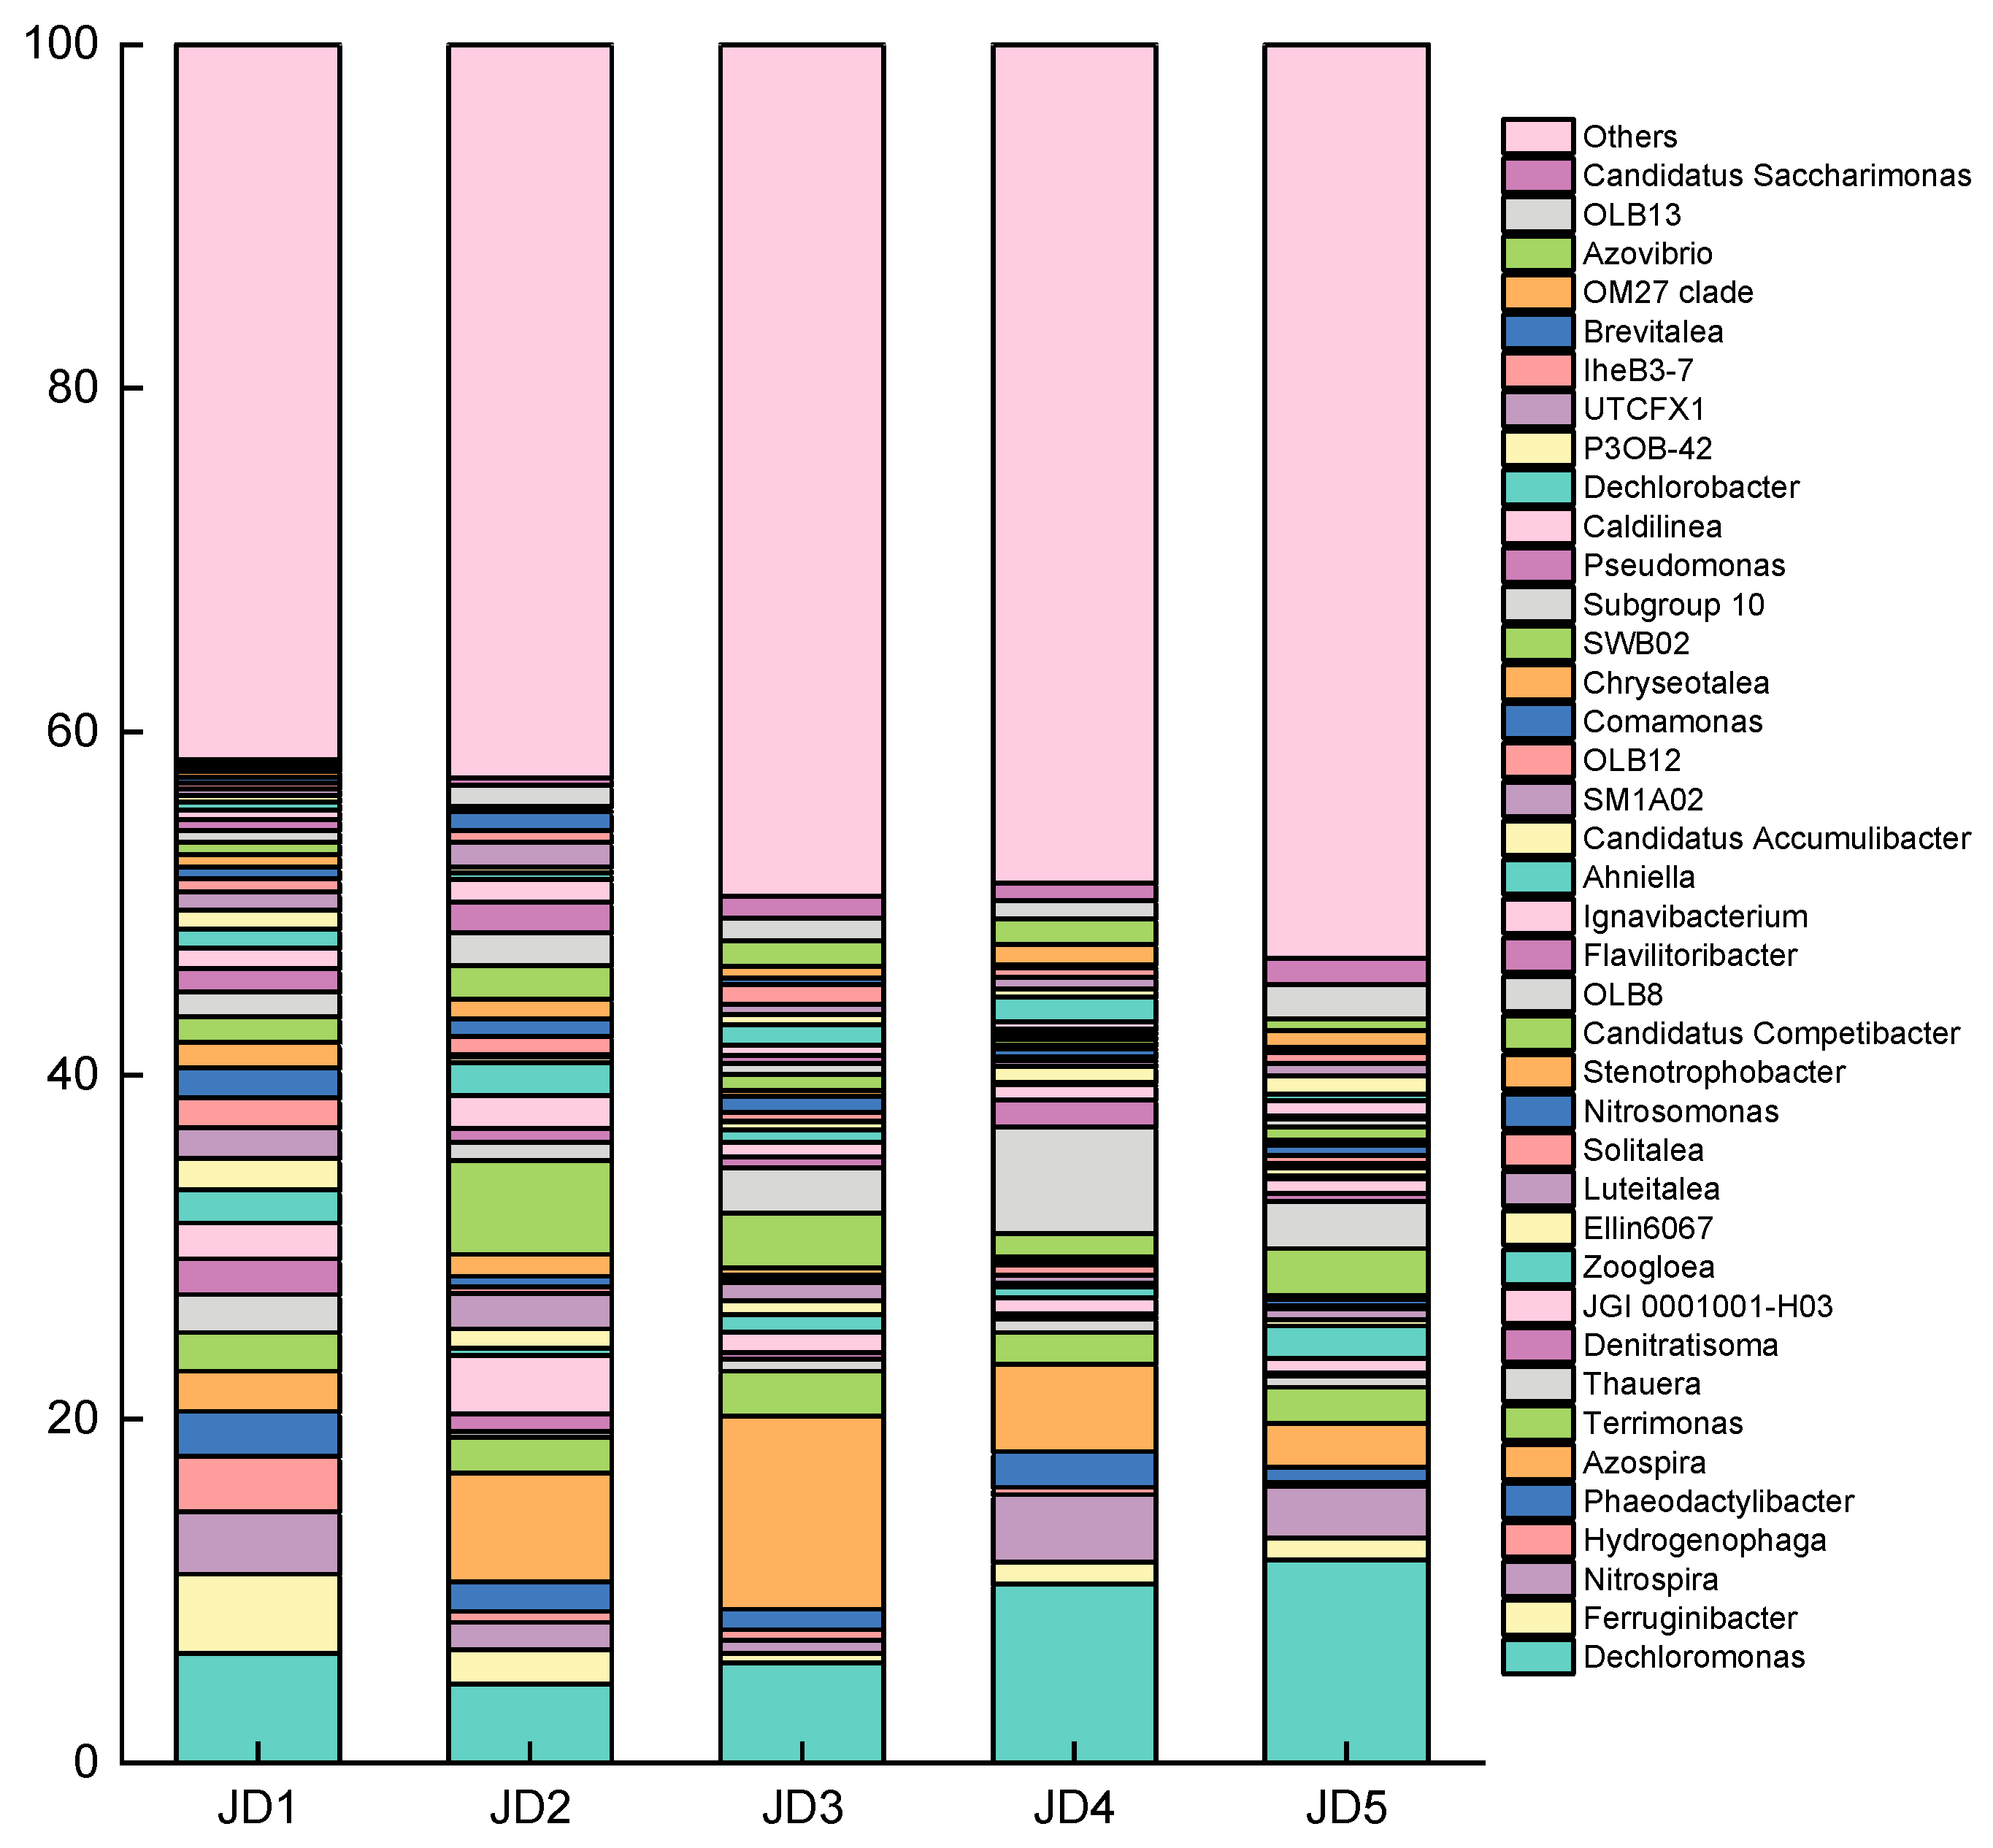
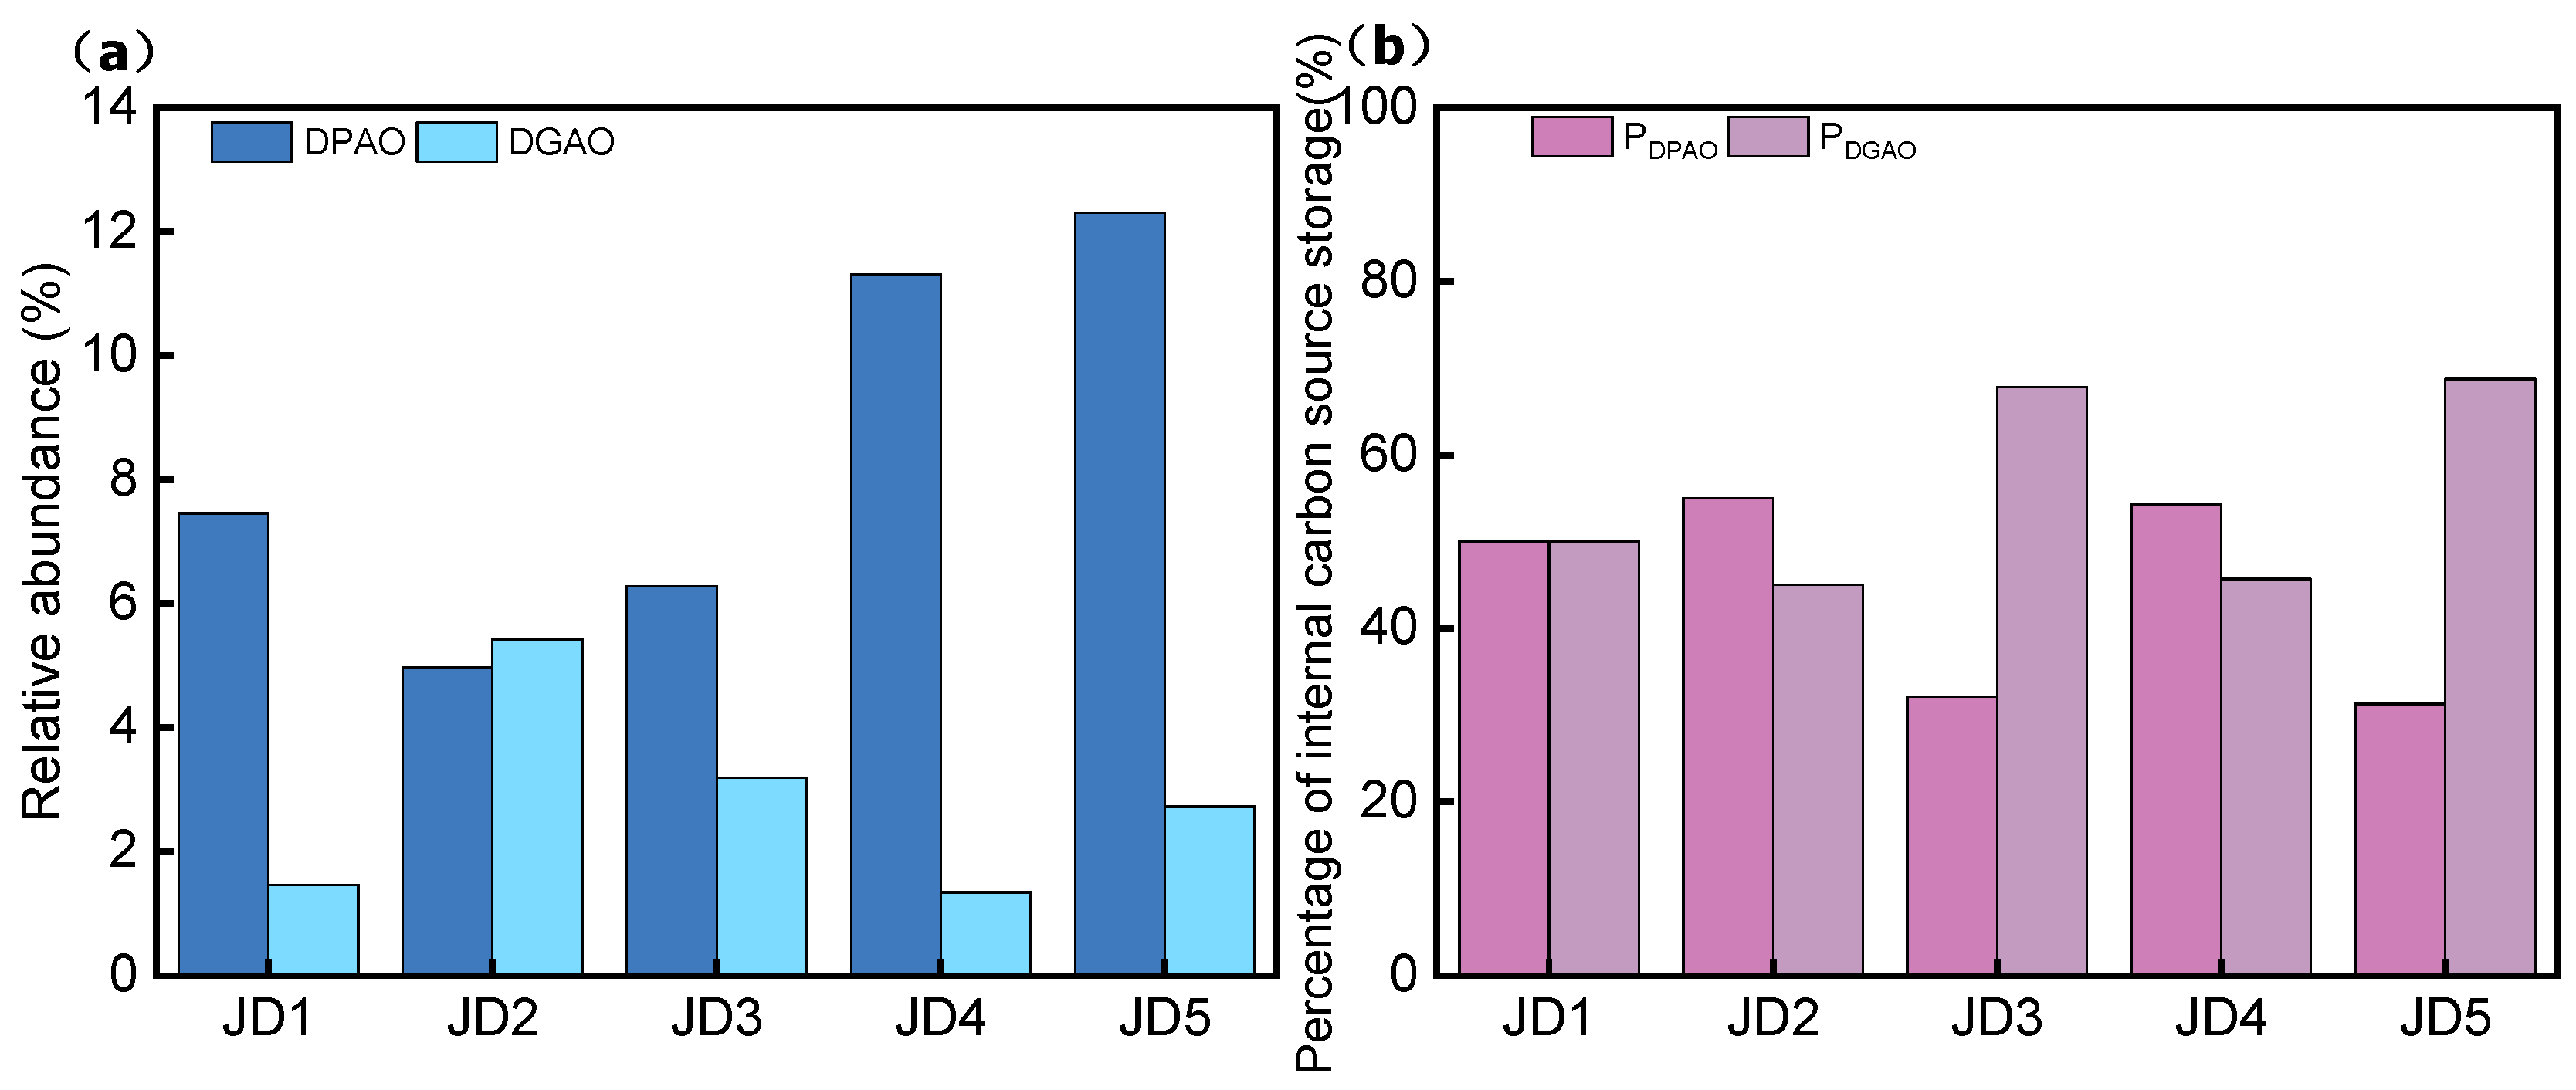
3.3. Changes in the Microbial Community Structure of the ASAO System

The microbial community structure at the phylum level was analyzed. As illustrated in Figure 6, the dominant bacterial phyla in the microbial samples across the five stages were as follows: Pseudomonadota, Bacteroidota, Acidobacteriota, Chloroflexota, Nitrospirota, and Myxococcota. The microbial genera within these phyla exhibited robust capabilities in organic matter degradation, as well as nitrogen and phosphorus removal. Throughout the various operating conditions across each stage, Pseudomonadota consistently dominated. Its relative abundance increased from 46.8% in stage I to 57.4% in stage III, and subsequently decreased to 39.1%. This phylum encompasses various denitrifying species. Fan et al. [24] discovered that the functional genes for denitrification (nirK, nirS, norB, norC, and nosZ) primarily originated from Pseudomonadota and Chloroflexota [24], with Pseudomonadota being widely present in all target functional genes. Many species with heterotrophic nitrifying and aerobic denitrifying capabilities also belong to Pseudomonadota [25]. The relative abundance of Bacteroidota decreased from 23.2% in stage I to 15.7% in stage III, and then increased again. Many members of Bacteroidota also possess denitrification functionalities. Additionally, studies have revealed that Bacteroidota was the primary producer of Volatile Fatty Acids (VFAs) in an experimental co-fermentation system [26]. Members of Acidobacteriota have the capacity to accumulate polyphosphate and glycogen and participate in nitrogen and phosphorus removal through the reduction of NO3 [27]. Microorganisms of Chloroflexota are frequently observed in filamentous biomass in wastewater treatment plants [28]. Their filamentous structure confers a competitive advantage in utilizing organic matter as a substrate. Some genera possess Dissimilatory Nitrate Reduction to Ammonium (DNRA) and denitrification genes [29]. It can be observed that the abundance of Chloroflexota significantly increased as the DO level decreased, indicating that sludge bulking occurred within the system as the DO level dropped. Nitrospira of Nitrospirota is classified as a type of NOB, and is believed to only oxidize nitrite. However, recent findings have revealed that some of its species have comammox potential, which facilitates the complete oxidation of NH4+ to NO3 [30]. Myxococcota can prey on various bacteria that cause operational issues, such as filamentous bacteria that induce sludge bulking, thereby maintaining a stable environment for wastewater treatment. From this study, it can be observed that when the abundance of Chloroflexota, which contains filamentous bacteria, increases, the abundance of Myxococcota also increases. The microbial symbiotic network (Figure 7) also reveals a symbiotic cooperative relationship between the two. In potential nitrogen metabolism, strains in the class of Myxobacteria, Salinimyxa, Polyangium, and Palsa-1104 have nirK/nirS, norB/C, and nosZ genes, indicating that the strains of the Myxococcota phylum contribute to denitrification in the activated sludge system. Research indicates that Myxococcota also possesses genes for producing PHAs [31], similarly to PHA-accumulating and glycogen-accumulating polyphosphate-accumulating organisms, which are utilized for anaerobic storage of organic matter and to obtain energy from stored PHAs [32].
As depicted in Figure 7, the microbial symbiotic network diagram reveals that the majority of the nodes originate from the aforementioned seven phyla, including Pseudomonadota (42.98%), Bacteroidota (23.14%), Acidobacteriota (9.09%), and others. It can be observed that most genera within the same phylum predominantly exhibit symbiotic cooperative relationships, whereas both symbiotic cooperation and competitive interactions exist between different phyla. The relative abundance of Bacteroidota demonstrates a negative correlation with that of Pseudomonadota. Many edges connecting Pseudomonadota and Bacteroidota are negatively correlated, indicating a competitive relationship, with Pseudomonadota being the more dominant phylum. This constitutes the primary reason for the fluctuation in the relative abundance of Bacteroidota. In the microbial symbiotic network, members of Acidobacteriota are predominantly in competitive relationships with the majority of other phyla, which explains the initial decrease in its relative abundance from 8.03% to 3.91%.
The genus-level microbial diversity of the five stages of the system was analyzed (Figure 8). The dominant genera included Dechloromonas, Nitrospira, Azospira, Thauera, Ellin6067, Candidatus Competibacter, Comamonas, and OLB8. Dechloromonas is a denitrifying bacterium that can utilize internal carbon sources for denitrification under low-DO conditions, thereby being less affected by low-carbon environments and capable of denitrification without the addition of external carbon sources [33]. Additionally, studies have discovered that Dechloromonas, as a representative functional bacterium, can employ VFA as a carbon source and NO3 as an electron acceptor to achieve phosphorus recovery under anoxic conditions [34]. In this system, the relative abundance of Dechloromonas gradually increased from 6.35% in stage I to 11.79% in later stages, which aligns with the slightly enhanced denitrifying phosphorus removal performance observed in batch experiments. OLB8 was enriched from 1.45% in stage I to 6.19% in stage IV. Genomic analysis disclosed its potential metabolic capabilities for degrading polysaccharides, proteins, and other complex molecules, as well as the potential for short-cut denitrification and intracellular polymer (Gly, Poly-P, and PHA) storage [35]. Candidatus Competibacter, as a type of DGAO, is regarded as crucial for endogenous denitrification and in situ sludge reduction [36]. The majority of Thauera are anaerobic bacteria, and some studies have identified that certain Thauera species possess aerobic denitrification capabilities. Research has revealed that Thauera bacteria have the ability to accumulate PHA and recover phosphorus, and can accumulate PHB and utilize it during denitrification when acetate is added [37]. In some wastewater treatment processes, Ellin6067 performs short-cut nitrification in the microaerobic zone, converting ammonia nitrogen to nitrite nitrogen. Pseudomonas, as an aerobic denitrifying bacterium [38], was enriched to a maximum of 1.77% in the system. The anaerobic ammonium oxidation bacteria Candidatus Anammoximicrobium, Candidatus Kuenenia, Candidatus Jettenia, and Candidatus Brocadia had the highest abundance in stage I, reaching 0.31%. The relative abundance of Candidatus Brocadia increased from 0.0085% in stage I to 0.040% in stage IV. Azospira is a genus of denitrifying bacteria [39]. Candidatus Accumulibacter is a typical denitrifying phosphorus-accumulating organism (DPAO) that uses VFA as a carbon source and oxygen as an electron acceptor for aerobic phosphorus uptake [34]. Nitrospira was initially considered to only utilize NO2 for nitrification [30], but Roots et al. [14] found that certain Nitrospira are the main ammonia oxidizers in low-DO nitrification reactors because they can perform nitrification even under anoxic conditions. The aerobic denitrifying bacterium Phaeodactylibacter can degrade organic matter in wastewater, and it can be enriched up to 2.62% in the system at the highest level.
As illustrated in Figure 9, the abundances of Dechloromonas and Candidatus Accumulibacter, which serve as DPAOs, gradually increased. In the latter three stages, their abundances were significantly higher than those of Candidatus Competibacter, which functions as a DGAO. Nevertheless, the proportion of internal carbon source storage by PDPAOs did not exhibit a marked advantage. This is attributed to the increase in the abundance of DPAO microorganisms, coupled with a decline in their metabolic activity. In the latter three stages, the DO level was excessively low, leading to a reduction in NO3 entering the anoxic zone. Due to the prolonged substrate scarcity, endogenous denitrifying bacteria proliferated extensively to compete for the limited substrate. Consequently, despite their elevated abundance, the activity of these functional bacteria remained relatively low. Studies have revealed that when microorganisms remain in a substrate-deficient environment for an extended period, they enter a dormant state [40]. The paucity of substrate can alter the coupling relationship between microbial metabolic pathways. For instance, in waterlogged soil, the coupling of γ-HCH degradation and methane production was enhanced, and the abundance of methanogens significantly increased under dilution treatment; however, the metabolic efficiency of dechlorination functional bacteria did not increase concurrently [41]. It is prevalently assumed that a high C/P ratio is conducive to the growth of GAOs and diminishes polyphosphate accumulation metabolism (PAM), while low concentrations of VFAs are beneficial for the growth of PAOs. However, Schuler et al. [42] contended that a high C/P ratio is favorable for glycogen accumulation metabolism (GAM) rather than the growth of GAOs. In the influent with a high C/P ratio (100/1), even though the microorganisms in SBR-L and SBR-H manifested GAM, GAOs did not exhibit predominant growth. Consequently, a high C/P ratio is beneficial for GAM, but does not engender the predominant growth of GAOs, and PAOs display the metabolic mode of GAOs (GAM), thereby reducing the accumulation of Poly-P and dampening the activity of denitrifying phosphorus removal [43]. This serves to elucidate why the proportion of internal carbon source storage PDGAO in DGAOs remained relatively elevated when the abundance of DPAOs was significantly greater than that of DGAOs.
Figure 10 illustrates the performances of AOB and NOB in each stage, as obtained from batch experiments. It can be observed that the activity of NOB within the system decreased significantly during the operation of the system. This was due to the sludge sequentially passing through the front aerobic zone and the rear aerobic zone in the ASAO continuous-flow reactor, thereby achieving intermittent aeration and effectively suppressing the activity of NOB [44]. Simultaneously, under a low dissolved oxygen level (0.5 mg/L), the NOB in the mixed system were more inhibited than under a high dissolved oxygen level (1.5–1.8 mg/L) [44]. Thus, it is evident that the low-DO operational conditions in the later stage of operation also inhibited the performance of NOB.

4. Conclusions and Prospects

4.1. Conclusions

(1) The ASAO system operated stably for 112 days and demonstrated excellent treatment performance for low-C/N wastewater, achieving high removal efficiencies for NH4+-N, COD, TP, and TIN. By regulating the DO levels in the front and rear aerobic zones, it was found that an appropriate reduction in DO in the front aerobic zone improved the system’s nitrogen and phosphorus removal performance. However, maintaining a low DO level in the front aerobic zone resulted in deteriorated NH4+-N removal and sludge bulking. In contrast, variations in DO in the rear aerobic zone had minimal impact on nitrogen and phosphorus removal. Therefore, a lower DO level could be applied in the rear aerobic zone to reduce aeration energy consumption. The intermittent aeration strategy effectively suppressed NOB, thereby promoting the coupling of the PN process and ANAMMOX.
(2) In addition to the traditional nitrification and denitrification processes, the ASAO system incorporated ED, DPR, SND, and ANAMMOX. The microbial genera involved in the ED process within the system comprised Dechloromonas, Candidatus Accumulibacter, and Candidatus Competibacter. Dechloromonas and Candidatus Accumulibacter are typical DPAOs, and the existence of DPAOs accounted for the DPR process in the system. Candidatus Competibacter is a typical DGAO. Owing to the relatively high C/P ratio in the system (approximately 60), PAM was diminished. Consequently, although the abundance of DPAOs was relatively high (up to 12.3%), the proportion of internal carbon source storage was relatively low. The realization of SND in the system was attributed to the presence of aerobic denitrifying bacteria. The predominant aerobic denitrifying bacterial genera within the system were Thauera, Phaeodactylibacter, and Pseudomonas. The AnAOB within the system included Candidatus Anammoximicrobium, Candidatus Kuenenia, Candidatus Jettenia, and Candidatus Brocadia. The total abundance of AnAOB was the highest in the first stage (0.31%), but only Candidatus Brocadia achieved enrichment within the system (0.0086–0.040%).

4.2. Prospects

(1) The realization of the ANAMMOX process in the small-scale system attests to the potential for low-carbon operation of the ASAO system. However, in this study, the inability to achieve effective enrichment of AnAOB bacteria was due to regular sludge discharge. In subsequent research, approaches such as adding fillers for the immobilization of AnAOB bacteria could be employed, which would be conducive to their enrichment.
(2) The ASAO system has undergone small-scale experimental trials, demonstrating its efficient and low-carbon nitrogen and phosphorus removal capabilities. Nevertheless, there is a dearth of pilot-scale and full-scale wastewater treatment plant experiments. Future studies should undertake larger-scale experiments to validate its treatment stability for large-scale influents.

Author Contributions

Data curation, J.C. and J.W.; Writing—original draft, J.C., J.W. and R.X.; Writing—review & editing, J.W. and R.X.; Visualization, J.C., J.W. and R.X. All authors have read and agreed to the published version of the manuscript.

Funding

This research was funded by the National Natural Science Foundation of China (51878243). The authors acknowledge the support received from the foundation.

Data Availability Statement

The original contributions presented in this study are included in the article. Further inquiries can be directed to the corresponding author.

Conflicts of Interest

Author Jiashun Cao was employed by the company Guohe Environmental Research Institute (Nanjing) Co., Ltd. The remaining authors declare that the research was conducted in the absence of any commercial or financial relationships that could be construed as a potential conflict of interest.

List of Abbreviations

ASAOAnaerobic–Swing–Anoxic–Oxic
AOAAnaerobic–Oxic–Anoxic
DODissolved oxygen
TINTotal inorganic nitrogen
TPTotal phosphorus
CODChemical oxygen demand
NOBNitrite-oxidizing bacteria
PHAPolyhydroxyalkanoates
GlyGlycogen
SNDSimultaneous nitrification–denitrification
ANAMMOXAnaerobic ammonium oxidation
EDEndogenous denitrification
DPRDenitrifying phosphorus removal
A/OAnaerobic–Oxic
AAOAnaerobic–Anoxic–Oxic
DPAOsDenitrifying phosphorus-accumulating organisms
DGAOsDenitrifying glycogen-accumulating organisms
AnAOBAnaerobic ammonia-oxidizing bacteria
EPDEndogenous partial denitrification
HRTHydraulic retention time
PNPartial nitrification
PHBPoly-3-hydroxybutyrate
PHVPoly-3-hydroxyvalerate
MLSSMixed-liquor suspended solids
MLVSSMixed-liquor volatile suspended solids
AOBAmmonia-oxidizing bacteria
NARNitrite accumulation rate
NRENitrogen removal efficiency
SVISludge Volume Index
HNADHeterotrophic nitrification–aerobic denitrification
PAOsPhosphate-accumulating organisms
GAOsGlycogen-accumulating organisms
COMAMMOXComplete ammonia oxidizers
VFAVolatile Fatty Acid
DNRADissimilatory Nitrate Reduction to Ammonium
PAMPolyphosphate accumulation metabolism
GAMGlycogen accumulation metabolism

References

  1. Bernat, K.; Wojnowska-Baryła, I.; Dobrzyńska, A. Denitrification with endogenous carbon source at low C/N and its effect on P(3HB) accumulation. Bioresour. Technol. 2008, 99, 2410–2418. [Google Scholar] [CrossRef]
  2. Ji, J.; Peng, Y.; Mai, W.; He, J.; Wang, B.; Li, X.; Zhang, Q. Achieving advanced nitrogen removal from low C/N wastewater by combining endogenous partial denitrification with anammox in mainstream treatment. Bioresour. Technol. 2018, 270, 570–579. [Google Scholar] [CrossRef] [PubMed]
  3. Miao, L.; Wang, S.; Li, B.; Cao, T.; Zhang, F.; Wang, Z.; Peng, Y. Effect of carbon source type on intracellular stored polymers during endogenous denitritation (ED) treating landfill leachate. Water Res. 2016, 100, 405–412. [Google Scholar] [CrossRef]
  4. Xu, X.; Liu, G.; Zhu, L. Enhanced denitrifying phosphorous removal in a novel anaerobic/aerobic/anoxic (AOA) process with the diversion of internal carbon source. Bioresour. Technol. 2011, 102, 10340–10345. [Google Scholar] [CrossRef] [PubMed]
  5. Liu, H.; Liu, J.; Zhang, L.; Wang, H.; Li, Y.; Chen, S.; Hou, Z.; Dong, W.; Peng, Y. Advanced N removal from low C/N sewage via a plug-flow anaerobic/oxic/anoxic (AOA) process: Intensification through partial nitrification, endogenous denitrification, partial denitrification, and anammox (PNEnD/A). Water Res. 2024, 267, 122452. [Google Scholar] [CrossRef] [PubMed]
  6. Oehmen, A.; Zeng, R.J.; Yuan, Z.; Keller, J. Anaerobic metabolism of propionate by polyphosphate-accumulating organisms in enhanced biological phosphorus removal systems. Biotechnol. Bioeng. 2005, 91, 43–53. [Google Scholar] [CrossRef]
  7. Zeng, R.J.; van Loosdrecht, M.C.M.; Yuan, Z.G.; Keller, J. Metabolic model for glycogen-accumulating organisms in anaerobic/aerobic activated sludge systems. Biotechnol. Bioeng. 2003, 81, 92–105. [Google Scholar] [CrossRef]
  8. Feng, Y.; Luo, S.; Zhang, Y.; Wang, S.; Peng, Y. Enhanced nutrient removal from mainstream sewage via denitrifying dephosphatation, endogenous denitrification and anammox in a novel continuous flow process. Bioresour. Technol. 2022, 351, 127003. [Google Scholar] [CrossRef]
  9. Wang, X.; Zhao, J.; Yu, D.; Chen, G.; Du, S.; Zhen, J.; Yuan, M. Stable nitrite accumulation and phosphorous removal from nitrate and municipal wastewaters in a combined process of endogenous partial denitrification and denitrifying phosphorus removal (EPDPR). Chem. Eng. J. 2019, 355, 560–571. [Google Scholar] [CrossRef]
  10. Jia, T.; Li, X.; Jiang, H.; Dan, Q.; Sui, J.; Wang, S.; Peng, Y. Advanced nitrogen removal from municipal sewage via partial nitrification-anammox process under two typical operation modes and seasonal ambient temperatures. Bioresour. Technol. 2022, 363, 127864. [Google Scholar] [CrossRef]
  11. Yan, L.; Liu, S.; Liu, Q.; Zhang, M.; Liu, Y.; Wen, Y.; Chen, Z.; Zhang, Y.; Yang, Q. Improved performance of simultaneous nitrification and denitrification via nitrite in an oxygen-limited SBR by alternating the DO. Bioresour. Technol. 2019, 275, 153–162. [Google Scholar] [CrossRef]
  12. Jin, Y.; Ding, J.; Zhan, W.; Du, J.; Wang, G.; Pang, J.; Ren, N.; Yang, S. Effect of dissolved oxygen concentration on performance and mechanism of simultaneous nitrification and denitrification in integrated fixed-film activated sludge sequencing batch reactors. Bioresour. Technol. 2023, 387, 129616. [Google Scholar] [CrossRef] [PubMed]
  13. Sriwiriyarat, T.; Ungkurarate, W.; Fongsatitkul, P.; Chinwetkitvanich, S. Effects of dissolved oxygen on biological nitrogen removal in integrated fixed film activated sludge (IFAS) wastewater treatment process. J. Environ. Sci. Health Part A 2008, 43, 518–527. [Google Scholar] [CrossRef] [PubMed]
  14. Roots, P.; Wang, Y.; Rosenthal, A.F.; Griffin, J.S.; Sabba, F.; Petrovich, M.; Yang, F.; Kozak, J.A.; Zhang, H.; Wells, G.F. Comammox Nitrospira are the dominant ammonia oxidizers in a mainstream low dissolved oxygen nitrification reactor. Water Res. 2019, 157, 396–405. [Google Scholar] [CrossRef] [PubMed]
  15. Zhao, J.; Feng, L.; Yang, G.; Dai, J.; Mu, J. Development of simultaneous nitrification-denitrification (SND) in biofilm reactors with partially coupled a novel biodegradable carrier for nitrogen-rich water purification. Bioresour. Technol. 2017, 243, 800–809. [Google Scholar] [CrossRef]
  16. Bian, X.; Wu, Y.; Li, J.; Yin, M.; Li, D.; Pei, H.; Chang, S.; Guo, W. Effect of dissolved oxygen on high C/N wastewater treatment in moving bed biofilm reactors based on heterotrophic nitrification and aerobic denitrification: Nitrogen removal performance and potential mechanisms. Bioresour. Technol. 2022, 365, 128147. [Google Scholar] [CrossRef]
  17. Bin, Z.; Bin, X.; Zhigang, Q.; Zhiqiang, C.; Junwen, L.; Taishi, G.; Wenci, Z.; Jingfeng, W. Denitrifying capability and community dynamics of glycogen accumulating organisms during sludge granulation in an anaerobic-aerobic sequencing batch reactor. Sci. Rep. 2015, 5, 12904. [Google Scholar] [CrossRef]
  18. Shen, Y.; Yang, D.; Wu, Y.; Zhang, H.; Zhang, X. Operation mode of a step-feed anoxic/oxic process with distribution of carbon source from anaerobic zone on nutrient removal and microbial properties. Sci. Rep. 2019, 9, 1153. [Google Scholar] [CrossRef]
  19. Zhao, Q.; Li, X.; Zhang, L.; Li, J.; Jia, T.; Zhao, Y.; Wang, L.; Peng, Y. Partial denitrifying phosphorus removal coupling with anammox (PDPRA) enables synergistic removal of C, N, and P nutrients from municipal wastewater: A year-round pilot-scale evaluation. Water Res. 2024, 253, 121321. [Google Scholar] [CrossRef]
  20. Zhao, Y.; Li, J.; Liu, Q.; Qi, Z.; Li, X.; Zhang, Q.; Sui, J.; Wang, C.; Peng, Y. Fast start-up and stable operation of mainstream anammox without inoculation in an A2/O process treating low COD/N real municipal wastewater. Water Res. 2023, 231, 119598. [Google Scholar] [CrossRef]
  21. Shang, T.; Zhu, X.; Gong, X.; Guo, J.; Li, X.; Zhang, Q.; Peng, Y. Efficient nitrogen removal in a total floc sludge system from domestic wastewater with low C/N: High anammox nitrogen removal contribution driven by endogenous partial denitrification. Bioresour. Technol. 2023, 378, 128995. [Google Scholar] [CrossRef] [PubMed]
  22. Gao, X.; Zhang, L.; Peng, Y.; Ding, J.; An, Z. The successful integration of anammox to enhance the operational stability and nitrogen removal efficiency during municipal wastewater treatment. Chem. Eng. J. 2023, 451, 138878. [Google Scholar] [CrossRef]
  23. Zhao, C.; Zhang, C.; Shen, Z.; Yang, Y.; Qiu, Z.; Li, C.; Xue, B.; Zhang, X.; Yang, X.; Wang, S.; et al. Ethylmalonyl-CoA pathway involved in polyhydroxyvalerate synthesis in Candidatus Contendobacter. AMB Express 2022, 12, 39. [Google Scholar] [CrossRef]
  24. Fan, Y.; Zhou, Z.; Liu, F.; Qian, L.; Yu, X.; Huang, F.; Hu, R.; Su, H.; Gu, H.; Yan, Q.; et al. The vertical partitioning between denitrification and dissimilatory nitrate reduction to ammonium of coastal mangrove sediment microbiomes. Water Res. 2024, 262, 122113. [Google Scholar] [CrossRef] [PubMed]
  25. Yang, L.; He, T.; Yuan, Y.; Xiong, Y.; Lei, H.; Zhang, M.; Chen, M.; Yang, L.; Zheng, C.; Wang, C. Enhancement of cold-adapted heterotrophic nitrification and denitrification in Pseudomonas sp. NY1 by cupric ions: Performance and mechanism. Bioresour. Technol. 2024, 414, 131574. [Google Scholar] [CrossRef] [PubMed]
  26. Zeng, D.; Ma, M.; Huang, X.; Zhang, C. Total-solids-controlled microbial response and volatile fatty acids production in sludge and chicken manure co-fermentation. J. Environ. Manag. 2025, 375, 124253. [Google Scholar] [CrossRef]
  27. Kristensen, J.M.; Singleton, C.; Clegg, L.-A.; Petriglieri, F.; Nielsen, P.H. High Diversity and Functional Potential of Undescribed “Acidobacteriota” in Danish Wastewater Treatment Plants. Front. Microbiol. 2021, 12, 643950. [Google Scholar] [CrossRef]
  28. Petriglieri, F.; Kondrotaite, Z.; Singleton, C.; Nierychlo, M.; Dueholm, M.K.D.; Nielsen, P.H. A comprehensive overview of the Chloroflexota community in wastewater treatment plants worldwide. mSystems 2023, 8, e0066723. [Google Scholar] [CrossRef]
  29. McIlroy, S.J.; Karst, S.M.; Nierychlo, M.; Dueholm, M.S.; Albertsen, M.; Kirkegaard, R.H.; Seviour, R.J.; Nielsen, P.H. Genomic and in situ investigations of the novel uncultured Chloroflexi associated with 0092 morphotype filamentous bulking in activated sludge. ISME J. 2016, 10, 2223–2234. [Google Scholar] [CrossRef]
  30. Vijayan, A.; Vattiringal Jayadradhan, R.K.; Pillai, D.; Prasannan Geetha, P.; Joseph, V.; Isaac Sarojini, B.S. Nitrospira as versatile nitrifiers: Taxonomy, ecophysiology, genome characteristics, growth, and metabolic diversity. J. Basic Microbiol. 2021, 61, 88–109. [Google Scholar] [CrossRef]
  31. Kurashita, H.; Hatamoto, M.; Tomita, S.; Yamaguchi, T.; Narihiro, T.; Kuroda, K. Comprehensive Insights into Potential Metabolic Functions of Myxococcotain Activated Sludge Systems. Microbes Environ. 2024, 39, ME24068. [Google Scholar] [CrossRef]
  32. Acevedo, B.; Oehmen, A.; Carvalho, G.; Seco, A.; Borrás, L.; Barat, R. Metabolic shift of polyphosphate-accumulating organisms with different levels of polyphosphate storage. Water Res. 2012, 46, 1889–1900. [Google Scholar] [CrossRef] [PubMed]
  33. Zhao, J.; Wang, X.; Li, X.; Jia, S.; Wang, Q.; Peng, Y. Improvement of partial nitrification endogenous denitrification and phosphorus removal system: Balancing competition between phosphorus and glycogen accumulating organisms to enhance nitrogen removal without initiating phosphorus removal deterioration. Bioresour. Technol. 2019, 281, 382–391. [Google Scholar] [CrossRef] [PubMed]
  34. Zhao, W.; Bi, X.; Peng, Y.; Bai, M. Research advances of the phosphorus-accumulating organisms of Candidatus Accumulibacter, Dechloromonas and Tetrasphaera: Metabolic mechanisms, applications and influencing factors. Chemosphere 2022, 307, 135675. [Google Scholar] [CrossRef]
  35. Kondrotaite, Z.; Valk, L.C.; Petriglieri, F.; Singleton, C.; Nierychlo, M.; Dueholm, M.K.D.; Nielsen, P.H. Diversity and Ecophysiology of the Genus OLB8 and Other Abundant Uncultured Saprospiraceae Genera in Global Wastewater Treatment Systems. Front. Microbiol. 2022, 13, 917553. [Google Scholar] [CrossRef] [PubMed]
  36. Ma, J.; Ji, Y.; Fu, Z.; Yan, X.; Xu, P.; Li, J.; Liu, L.; Bi, P.; Zhu, L.; Xu, B.; et al. Performance of anaerobic/oxic/anoxic simultaneous nitrification, denitrification and phosphorus removal system overwhelmingly dominated by Candidatus_Competibacter: Effect of aeration time. Bioresour. Technol. 2023, 384, 129312. [Google Scholar] [CrossRef]
  37. Wang, Q.; He, J. Complete nitrogen removal via simultaneous nitrification and denitrification by a novel phosphate accumulating Thauera sp. strain SND5. Water Res. 2020, 185, 116300. [Google Scholar] [CrossRef]
  38. Shu, H.; Sun, H.; Huang, W.; Zhao, Y.; Ma, Y.; Chen, W.; Sun, Y.; Chen, X.; Zhong, P.; Yang, H.; et al. Nitrogen removal characteristics and potential application of the heterotrophic nitrifying-aerobic denitrifying bacteria Pseudomonas mendocina S16 and Enterobacter cloacae DS’5 isolated from aquaculture wastewater ponds. Bioresour. Technol. 2022, 345, 126541. [Google Scholar] [CrossRef]
  39. Cai, Y.; Luo, Y.-H.; Long, X.; Zaidi, A.A.; Shi, Y.; Zhou, D.; Rittmann, B.E. Wastewater treatment for ships experiencing large temperature changes: The activated sludge/membrane-biofilm reactor. Chemosphere 2022, 307, 135852. [Google Scholar] [CrossRef]
  40. Janssen, P.H. Dormant microbes: Scouting ahead or plodding along? Nature 2009, 458, 831. [Google Scholar] [CrossRef]
  41. Yang, X.; Yuan, J.; Li, N.; Franks, A.E.; Shentu, J.; Luo, Y.; Xu, J.; He, Y. Loss of microbial diversity does not decrease γ-HCH degradation but increases methanogenesis in flooded paddy soil. Soil Biol. Biochem. 2021, 156, 108210. [Google Scholar] [CrossRef]
  42. Schuler, A.J.; Jenkins, D. Enhanced Biological Phosphorus Removal from Wastewater by Biomass with Different Phosphorus Contents, Part II: Anaerobic Adenosine Triphosphate Utilization and Acetate Uptake Rates. Water Environ. Res. 2003, 75, 499–511. [Google Scholar] [CrossRef] [PubMed]
  43. Meng, Q.; Zeng, W.; Wang, B.; Fan, Z.; Peng, Y. New insights in the competition of polyphosphate-accumulating organisms and glycogen-accumulating organisms under glycogen accumulating metabolism with trace Poly-P using flow cytometry. Chem. Eng. J. 2020, 385, 123915. [Google Scholar] [CrossRef]
  44. Xu, Z.; Zhang, L.; Gao, X.; Peng, Y. Optimization of the intermittent aeration to improve the stability and flexibility of a mainstream hybrid partial nitrification-anammox system. Chemosphere 2020, 261, 127670. [Google Scholar] [CrossRef] [PubMed]
Figure 1. A schematic diagram of the ASAO process.
Water 17 01548 g001
Figure 2. The nitrogen and phosphorus removal effects of the ASAO Pilot Unit. (a) The COD of the influent and effluent and the corresponding removal efficiency; (b) the TIN of the influent and effluent and the corresponding removal efficiency; (c) the TP of the influent and effluent and the corresponding removal efficiency; (d) the NH4+-N of the influent and effluent and the corresponding removal efficiency.
Water 17 01548 g002
Figure 3. The carbon source storage situation within the ASAO system. (a) The storage volume of internal carbon sources; (b) the storage ratios of PAOs and GAOs.
Water 17 01548 g003
Figure 4. Typical periodic nitrogen and phosphorus removal effects. (a) The overall removal efficacy of nitrogen at each stage; (b) the overall removal efficacy of COD and phosphorus at each stage.
Water 17 01548 g004
Figure 5. The full-process changes of carbon sources within typical cycles: (a) stage I, (b) stage II, (c) stage III, (d) stage IV, and (e) stage V.
Water 17 01548 g005
Figure 6. Horizontal distribution of microbial phyla (only phyla with a relative abundance of more than 1% in at least one stage are shown).
Water 17 01548 g006
Figure 7. The symbiotic network at the phylum level of microorganisms.
Water 17 01548 g007
Figure 8. The relative abundance of horizontal microorganisms (JD1, 2, 3, 4, and 5 represent stages I, II, III, IV, and V, respectively).
Water 17 01548 g008
Figure 9. Proportions of DPAOs and DGAOs. (a). Relative abundance at each stage of DPAOs and DGAOs; (b) percentage of carbon source storage within DGAOs and DPAOs.
Water 17 01548 g009
Figure 10. Performance of AOB and NOB.
Water 17 01548 g010
Table 1. The operational conditions during the whole operation.
Oxic1
DO (mg/L)
Swing
(Aerobic)
DO (mg/L)
Oxic2
DO (mg/L)
HRT
(h)
Operating Days (d)
I4–54–54–5161–21
II2–32–34–51621–43
III0.5–10.5–14–51644–65
IV0.5–10.5–12–31666–89
V1–21–22–31690–112
Table 2. Simulated wastewater quality.
Main ComponentsConcentration (mg/L)Trace ElementsConcentration (mg/L)
CH3COONa (Shanghai, China)256.41 (200 mg COD/L) FeCl3·6H2O (Shanghai, China)1500
MgSO4 (Shanghai, China)90CuSO4 (Shanghai, China)50
CaCl2 (Shanghai, China)14KI (Shanghai, China)150
NH4Cl (Shanghai, China)153 (40 mg N/L)MnCl·4H2O (Shanghai, China) 110
KH2PO4 (Shanghai, China)17.5 (4 mg P/L)NaMoO4·2H2O (Shanghai, China)60
KHCO3 (Shanghai, China)200H3BO3 (Shanghai, China) 150
CoCl2·6H2O (Shanghai, China) 150
ZnSO4·7H2O (Shanghai, China)120
Table 3. Detection methods and instruments for each index.
IndicatorDetection MethodInstrument Employed
CODRapid-digestion spectrophotometryUV spectrophotometer (PHILES UV2600, Shanghai, China)
NH4+-NNessler’s reagent photometryUV spectrophotometer (PHILES UV2600, Shanghai, China)
NO2-NUltraviolet spectrophotometryUV spectrophotometer (PHILES UV2600, Shanghai, China)
NO3-NUltraviolet spectrophotometryUV spectrophotometer (PHILES UV2600, Shanghai, China)
TNUltraviolet spectrophotometryUV spectrophotometer (PHILES UV2600, Shanghai, China)
TPUltraviolet spectrophotometryUV spectrophotometer (PHILES UV2600, Shanghai, China)
SV30Natural sedimentation for 30 minGraduated cylinder (Nanjing, China)
pHPortable sensorShanghai Bolv Instrument, Shanghai, China
PHAGas chromatographyGas chromatograph (Agilent 7820A, Santa Clara, CA, USA)
GlyAnthrone spectrophotometryUV spectrophotometer (PHILES UV2600, Shanghai, China)
DOPortable sensorShanghai Bolv Instrument, Shanghai, China
MLSSDrying and weighingOven, Shanghai, China
MLVSSDrying and weighingMuffle furnace, Shanghai, China
Table 4. The nitrogen and phosphorus removal efficiencies of various processes.
Mainstream Sewage Treatment ProcessesAerobic Zone HRTTIN Removal EfficiencyImportant Pathways for DenitrificationReferences
A/O5.8 h50.8%Conventional nitrification and denitrification[18]
AAO2 h77.1%Partial denitrifying phosphorus removal coupled with anammox[19]
AAO5.7 h73.1%Partial denitrification/anammox (PD/A)[20]
AOA4 h83.5%Nitrification–endogenous partial denitrification
and anammox
[21]
AOA4 hTemperature decreased: 70.7 ± 4.2 %
Temperature increased: 87.1 ± 2.6%
Partial denitrification/anammox (PD/A)[22]
ASAO3–5 h88.18%SND, DPR, ANAMMOXThis article
Disclaimer/Publisher’s Note: The statements, opinions and data contained in all publications are solely those of the individual author(s) and contributor(s) and not of MDPI and/or the editor(s). MDPI and/or the editor(s) disclaim responsibility for any injury to people or property resulting from any ideas, methods, instructions or products referred to in the content.

