Article

Multi-Scale Impacts of Land Use Change on River Water Quality in the Xinxian River, Yangtze River Basin

1
Key Laboratory of Health Intelligent Perception and Ecological Restoration of River and Lake, Ministry of Education, Hubei University of Technology, Wuhan 430068, China
2
Hubei Fisheries Group Co., Ltd., Wuhan 430060, China
*
Author to whom correspondence should be addressed.
Water 2025, 17(10), 1541; https://doi.org/10.3390/w17101541
Submission received: 16 April 2025 / Revised: 14 May 2025 / Accepted: 17 May 2025 / Published: 20 May 2025
(This article belongs to the Section Water Quality and Contamination)

Abstract

:
This study investigated the impact of land use change on water quality in the Xinxian River Basin amidst rapid urbanization. While previous studies have predominantly focused on single-scale buffer analyses or specific land use types, the interactions between multi-scale riparian buffers and diverse land cover dynamics remain rarely understudied, particularly in a rapidly urbanizing county in the Yangtze River Basin. Land use type data for the Xinxian River Basin in 2000, 2010, and 2020 were acquired using GIS technology, and subsequent analysis quantified land use pattern changes over this 20-year period. Additionally, 2023 land use data for riparian buffer zones (50 m, 100 m, 200 m, 400 m, and 600 m) were obtained via GIS and subjected to Redundancy Analysis (RDA) with 2023 water quality monitoring data to evaluate the impact of land use on water quality. The results revealed significant land use conversion dynamics, particularly between natural and anthropogenic cover types. Forest cover exhibited negative correlations with riverine nutrient concentrations, while built-up areas displayed strong positive associations, especially at finer scales (50–100 m buffers). Notably, the dominant influencing factor shifted from built-up land at smaller buffer scales (50–100 m) to forest land at larger scales (400–600 m), whereas agricultural land showed no significant correlation. These findings highlight scale-dependent relationships between land use and aquatic ecosystems, emphasizing the critical role of spatial planning in mitigating urbanization impacts. The work is conducive to the sustainable development of Longgan Lake National Wetland Nature Reserve and the protection of water ecology in the middle and lower reaches of the Yangtze River.

1. Introduction

Rapid urbanization and anthropogenic activities significantly alter watershed land use patterns and aquatic environments [1]. Land use changes, by modifying vegetation cover and soil permeability, directly influence regional precipitation–runoff dynamics and non-point source pollutant transport [2]. Elevated nutrient loading from surface runoff degrades river water quality, exacerbated by unsustainable land use and agricultural practices [3]. Furthermore, land use transformations impact regional biodiversity and ecosystem integrity [4]. These interconnected challenges of water pollution and ecological degradation critically impede China’s socio-economic sustainability [5].
Riparian buffers function as nutrient retention zones, effectively mitigating the transport of sediment, nutrients, and toxic chemicals in runoff via mechanisms such as sediment trapping, plant assimilation, and microbial denitrification [6]. The ecological functions of buffer zones are spatially dependent on their proximity to the water body. Furthermore, the relationship between water quality indicators and land use characteristics exhibits scale sensitivity [7]. The influence of watershed land use on river water quality has become a focal point of research both domestically and internationally [8,9,10,11], with numerous researchers emphasizing the spatio-temporal heterogeneity of this relationship.
Contrasting spatial scale dependencies emerge in land use-water quality studies: Ding et al. demonstrated stronger sub-basin scale effects compared to riparian buffers in the Dong River watershed [8]. Similarly, Ren et al.’s research in the Bao’an Lake Basin also demonstrated that the watershed scale exhibited the most significant explanatory power for water quality variations, followed by buffer zones within 250 m and 500 m radii [12]. Krishnaraj and Honnasiddaiah identified greater water quality sensitivity to riparian zone land uses than sub-catchment influences [13]. These discrepancies in findings may stem from regional variations in watershed hydrological characteristics, climatic conditions, and the intensity of anthropogenic activities. Furthermore, the selection of research scales significantly affects outcomes; smaller scales may more readily capture the influence of localized pollution sources, while larger scales are more effective in elucidating the overall effects of landscape patterns [14].
Multi-scale analysis is conducive to a comprehensive understanding of the impact of land use on river water quality [15]. These uncertainties underscore the necessity for more regional, multi-scale, and integrated studies across diverse areas. Existing research has primarily concentrated on single-scale buffer assessments or specific land-use categories; the interactions between multi-scale riparian buffers and diverse land cover dynamics remain rarely investigated, especially regarding the spatiotemporal heterogeneity of water quality responses in rapidly urbanizing counties within the middle-lower Yangtze River Basin. This study aims to address this limited focus, and its findings are expected to provide a basis for river water environment protection and river basin ecological planning in small cities.
The Xinxian River, a significant waterway traversing the urban landscape of Huangmei County, serves as the primary tributary to Longgan Lake, a critical wetland ecosystem within the Hubei section of the Yangtze River Basin. Recent economic development and anthropogenic disturbances have resulted in discernible degradation of the landscape ecological patterns and aquatic environmental quality within the Xinxian River watershed and Longgan Lake reservoir area.
This study investigated the impact of urbanization-driven land use changes on river water quality within the Xinxian River watershed. The specific objectives were (1) to characterize land use change patterns in the Xinxian River watershed from 2000 to 2020; (2) to analyze the spatial distribution of river water quality and assess land use type distribution within 50 m, 100 m, 200 m, 400 m, and 600 m riparian buffer zones; and (3) to determine the influence of land use types on river water quality at varying spatial scales and clarify the relationships between land use types and water quality indicators. This research provides a scientific foundation for land use planning and river water protection in an urbanizing county in China and contributes to the sustainable development and ecological conservation of the Longgan Lake National Wetland Nature Reserve and the Yangtze River Basin.

2. Methods

2.1. Study Area and Data Collection

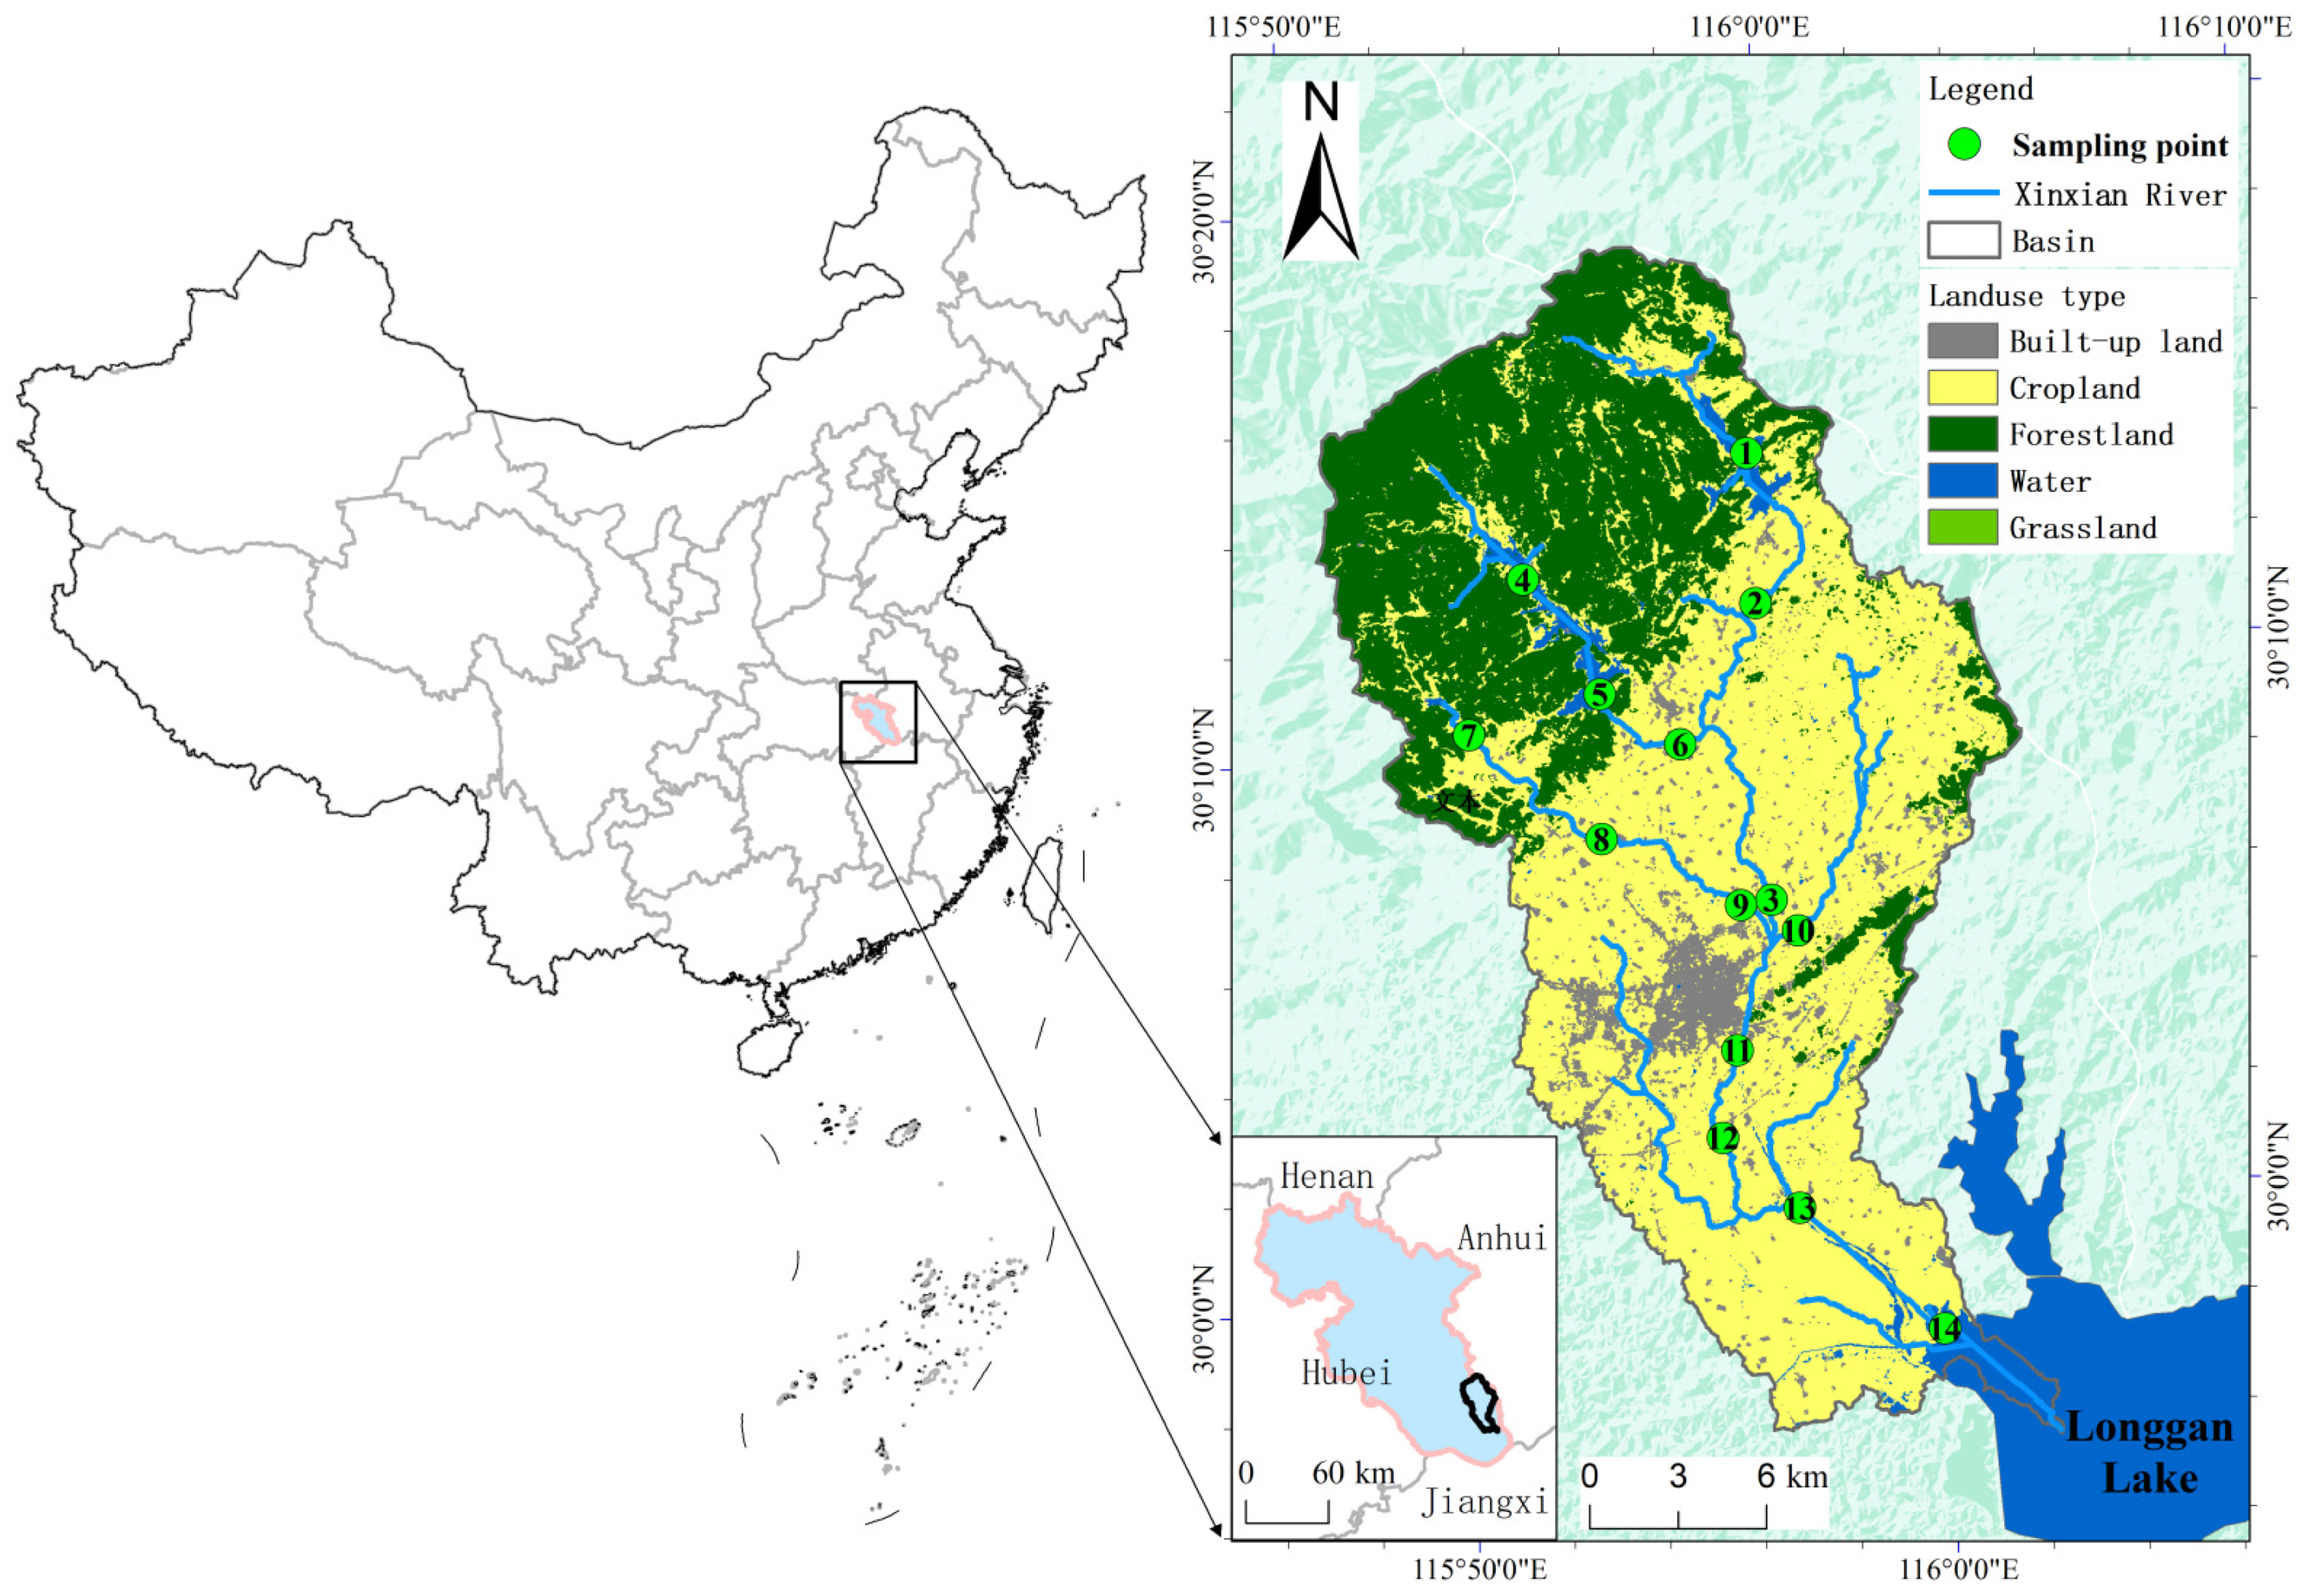
2.1.1. Overview of the Study Area

The Xinxian River (Figure 1), a 26-km waterway traversing the urban area of Huangmei County (115°43′–116°07′ E, 29°43′–30°18′ N), of which the basin area is 50,542 hm2, situated at the tri-provincial juncture of Hubei, Jiangxi, and Anhui, lies within the Yangtze River Basin. This region maintains a multifaceted relationship with the Yangtze River, encompassing geographical, economic, ecological, and cultural dimensions, wherein the river has significantly influenced local development. The Xinxian River constitutes the largest fluvial system feeding Longgan Lake, which holds the designation as a national-level wetland nature reserve.
The Xinxian River exhibits a north-to-south topographical gradient. The upper reaches, characterized by mountainous terrain, are predominantly forested. The middle reaches, flowing through the urban center of Huangmei County, are dominated by built-up land. The lower reaches, situated in a flat terrain, are primarily composed of agricultural and aquaculture areas. The Xinxian River watershed experiences a subtropical monsoon climate, marked by distinct seasonal variations, abundant precipitation, ample insolation, and a prolonged frost-free period. The average annual temperature in Huangmei County is 16.8 °C, with a maximum temperature of 39.5 °C and a minimum temperature of −12.6 °C. The basin has abundant rainfall, but the spatial and temporal distribution of rainfall is uneven. The rainfall from April to October each year accounts for 70–80% of the total annual rainfall. Huangmei County has an average annual rainfall of 1398.2 mm and an average relative humidity of 78%.
Recent economic development and anthropogenic disturbances in Huangmei County have led to discernible degradation of the landscape ecological patterns and aquatic environmental quality within the Xinxian River watershed and Longgan Lake Reservoir Area.

2.1.2. Land Use Data Sources and Data Processing

Digital Elevation Model (DEM) and Landsat 8 Operational Land Imager (OLI) remote sensing data were acquired from the Resource and Environment Science Data Center, Chinese Academy of Sciences (http://www.resdc.cn/ accessed on 10 April 2023). Land use classification, based on the Chinese Land Use/Cover Dataset (CLUD), was performed using a combination of manual visual interpretation and random forest classification. The study area was categorized into five land use types: cropland, forest land, grassland, water bodies, and built-up land. The accuracy of the land use classification was assessed using a confusion matrix, yielding an overall accuracy of 88.54% and a Kappa coefficient of 0.85.
A 30 m × 30 m resolution Digital Elevation Model (DEM) of Huangmei County and its surrounding area was acquired from the Resource and Environment Science Data Center, Chinese Academy of Sciences. The Huangmei County administrative boundary was employed to clip the DEM, generating a terrain model of the study area. Due to the presence of specific geomorphological features, the initial DEM exhibited surface depressions. These depressions were subsequently filled to produce a depression-free DEM. Utilizing flow direction data, catchment accumulation was calculated, and a surface runoff diffusion model was applied to extract the river network. The basin delineation was performed using the Basin tool within the ArcGIS Hydrology toolset, with flow direction data as the input. The extracted vector river network was then overlaid with the basin map to delineate the boundaries of individual river basins within Huangmei County.
To delineate the Xinxian River watershed, the river’s outlet point was identified. Subsequently, utilizing flow direction data, all grid cells contributing to the outlet were traced, resulting in the identification of discrete catchment basins. For analytical purposes, these individual catchments were aggregated into 14 distinct sub-basins, corresponding to 14 water quality monitoring sites established along the Xinxian River. Furthermore, based on catchment geomorphological characteristics and river flow dynamics, the Xinxian River watershed was segmented into upstream, midstream, and downstream reaches.

2.1.3. Water Sample Collection and Processing

Considering the topography, geomorphology, and hydrological characteristics of the Xinxian River watershed, 14 sampling sites (Figure 1) were established to encompass the upstream, midstream, and downstream reaches. Field samples were collected during periods of no rainfall.
River water quality monitoring was conducted in mid-October 2023. Surface water samples were collected at a depth of 10–20 cm, 2 m from the riverbank, using a water sampler (Manufactured by Global Shangqing Technology Co., Ltd. [Beijing, China]). At each monitoring site, three replicate samples were collected and homogenized. These samples were stored in high-density polyethylene plastic bottles. To remove particulate matter, original water samples were filtered in situ through 0.45 μm glass fiber filters (GF/F, 47 mm, Whatman, Metrostone, UK) on the day of collection. Both raw and filtered water samples were stored at 4 °C and processed within one week. For each sample, three parallel replicates and a blank control (CK) were analyzed, with the mean of the replicates used as the measured value. To ensure data accuracy, all water samples were collected concurrently.
Based on a comprehensive assessment of water pollution and its extent within the Xinxian River watershed, water temperature, pH, electrical conductivity (EC), dissolved oxygen (DO), ammonia nitrogen (NH3-N), total phosphorus (TP), total nitrogen (TN), and chemical oxygen demand (CODMn) were selected as water quality indicators. In situ measurements of water temperature, pH, EC, and DO were performed using a CyberScan PCD 650 multi-parameter water quality analyzer (Eutech, Singapore). Laboratory analysis of NH3-N, TP, TN, and Chl-a was conducted using an A380 UV spectrophotometer (AOELAB, Shanghai, China). Water quality testing methods are listed in Table 1.

2.2. Methodology

2.2.1. Determining the Size of the Buffer Zone

The influence of land use structure changes on riverine water quality can vary across study areas due to hydrological, climatic, and anthropogenic variability. In regions characterized by a flat terrain, buffer zones are typically delineated based on distance from monitoring sites. For rivers with well-defined riverbanks, these banks often serve as study boundaries, with buffer zones delineated according to distance from the riverbanks.
Due to the relatively distinct morphology of the Xinxian River banks, buffer zones were delineated based on radial distances from the riverbank. Informed by the existing literature [21] and the specific characteristics of the basin, buffer widths of 50, 100, 200, 400, and 600 m were selected for analysis. These buffers, in conjunction with 14 monitoring sections, generated 70 distinct spatial analysis units. The vector maps of these 70 units were overlaid with the 2023 land use classification map (derived from satellite imagery), attributing land use type information to the buffer zone polygons.
Grid cell size significantly impacts vector-to-raster data conversion speed; excessively small grid cells can substantially slow processing. Based on previous research, grid cell sizes of 5 m × 5 m, 10 m × 10 m, and 20 m × 20 m are commonly employed. Given the relatively small catchment area of the Xinxian River watershed and the study area, a grid cell size of 5 m × 5 m was selected to balance data transformation accuracy and processing efficiency.

2.2.2. Calculation of Land Use Pattern Change

Land use dynamics, a quantitative metric describing the rate of land use change, is crucial for analyzing land use type transformations and predicting future trends. The formulation for land use dynamics is as follows [22]:
K = ( U b U a ) U a × 1 T × 100 %
where K represents the attitude of a land type in a time period T; Ua and Ub represent the area of a land type before and after a time period T; and T refers to the time period, generally in years, when in years represents the annual rate of change in a land type.

2.2.3. Data Analysis

Utilizing water quality data collected in October 2023 from each monitoring section of the Xinxian River and considering the specific geographic location of the study area, concurrently, based on the 2023 land use data within the study sections, buffer zones at varying spatial scales were delineated and landscape indices were calculated using ArcGIS (Arc GIS 10.2) and Fragstats software (FRAGSTATS 4.2). Subsequently, Redundancy Analysis (RDA), performed in CANOCO 4.5, was used to analyze the relationship between river water quality and buffer zone land use across multiple spatial scales. In RDA plots, vectors pointing in the same direction indicate a positive correlation between variables, while the angle between vectors is inversely proportional to their correlation strength. Vector length represents the relative contribution of each variable. Furthermore, the explanatory power of land use indicators regarding river water quality variation was determined from the RDA results.

3. Results

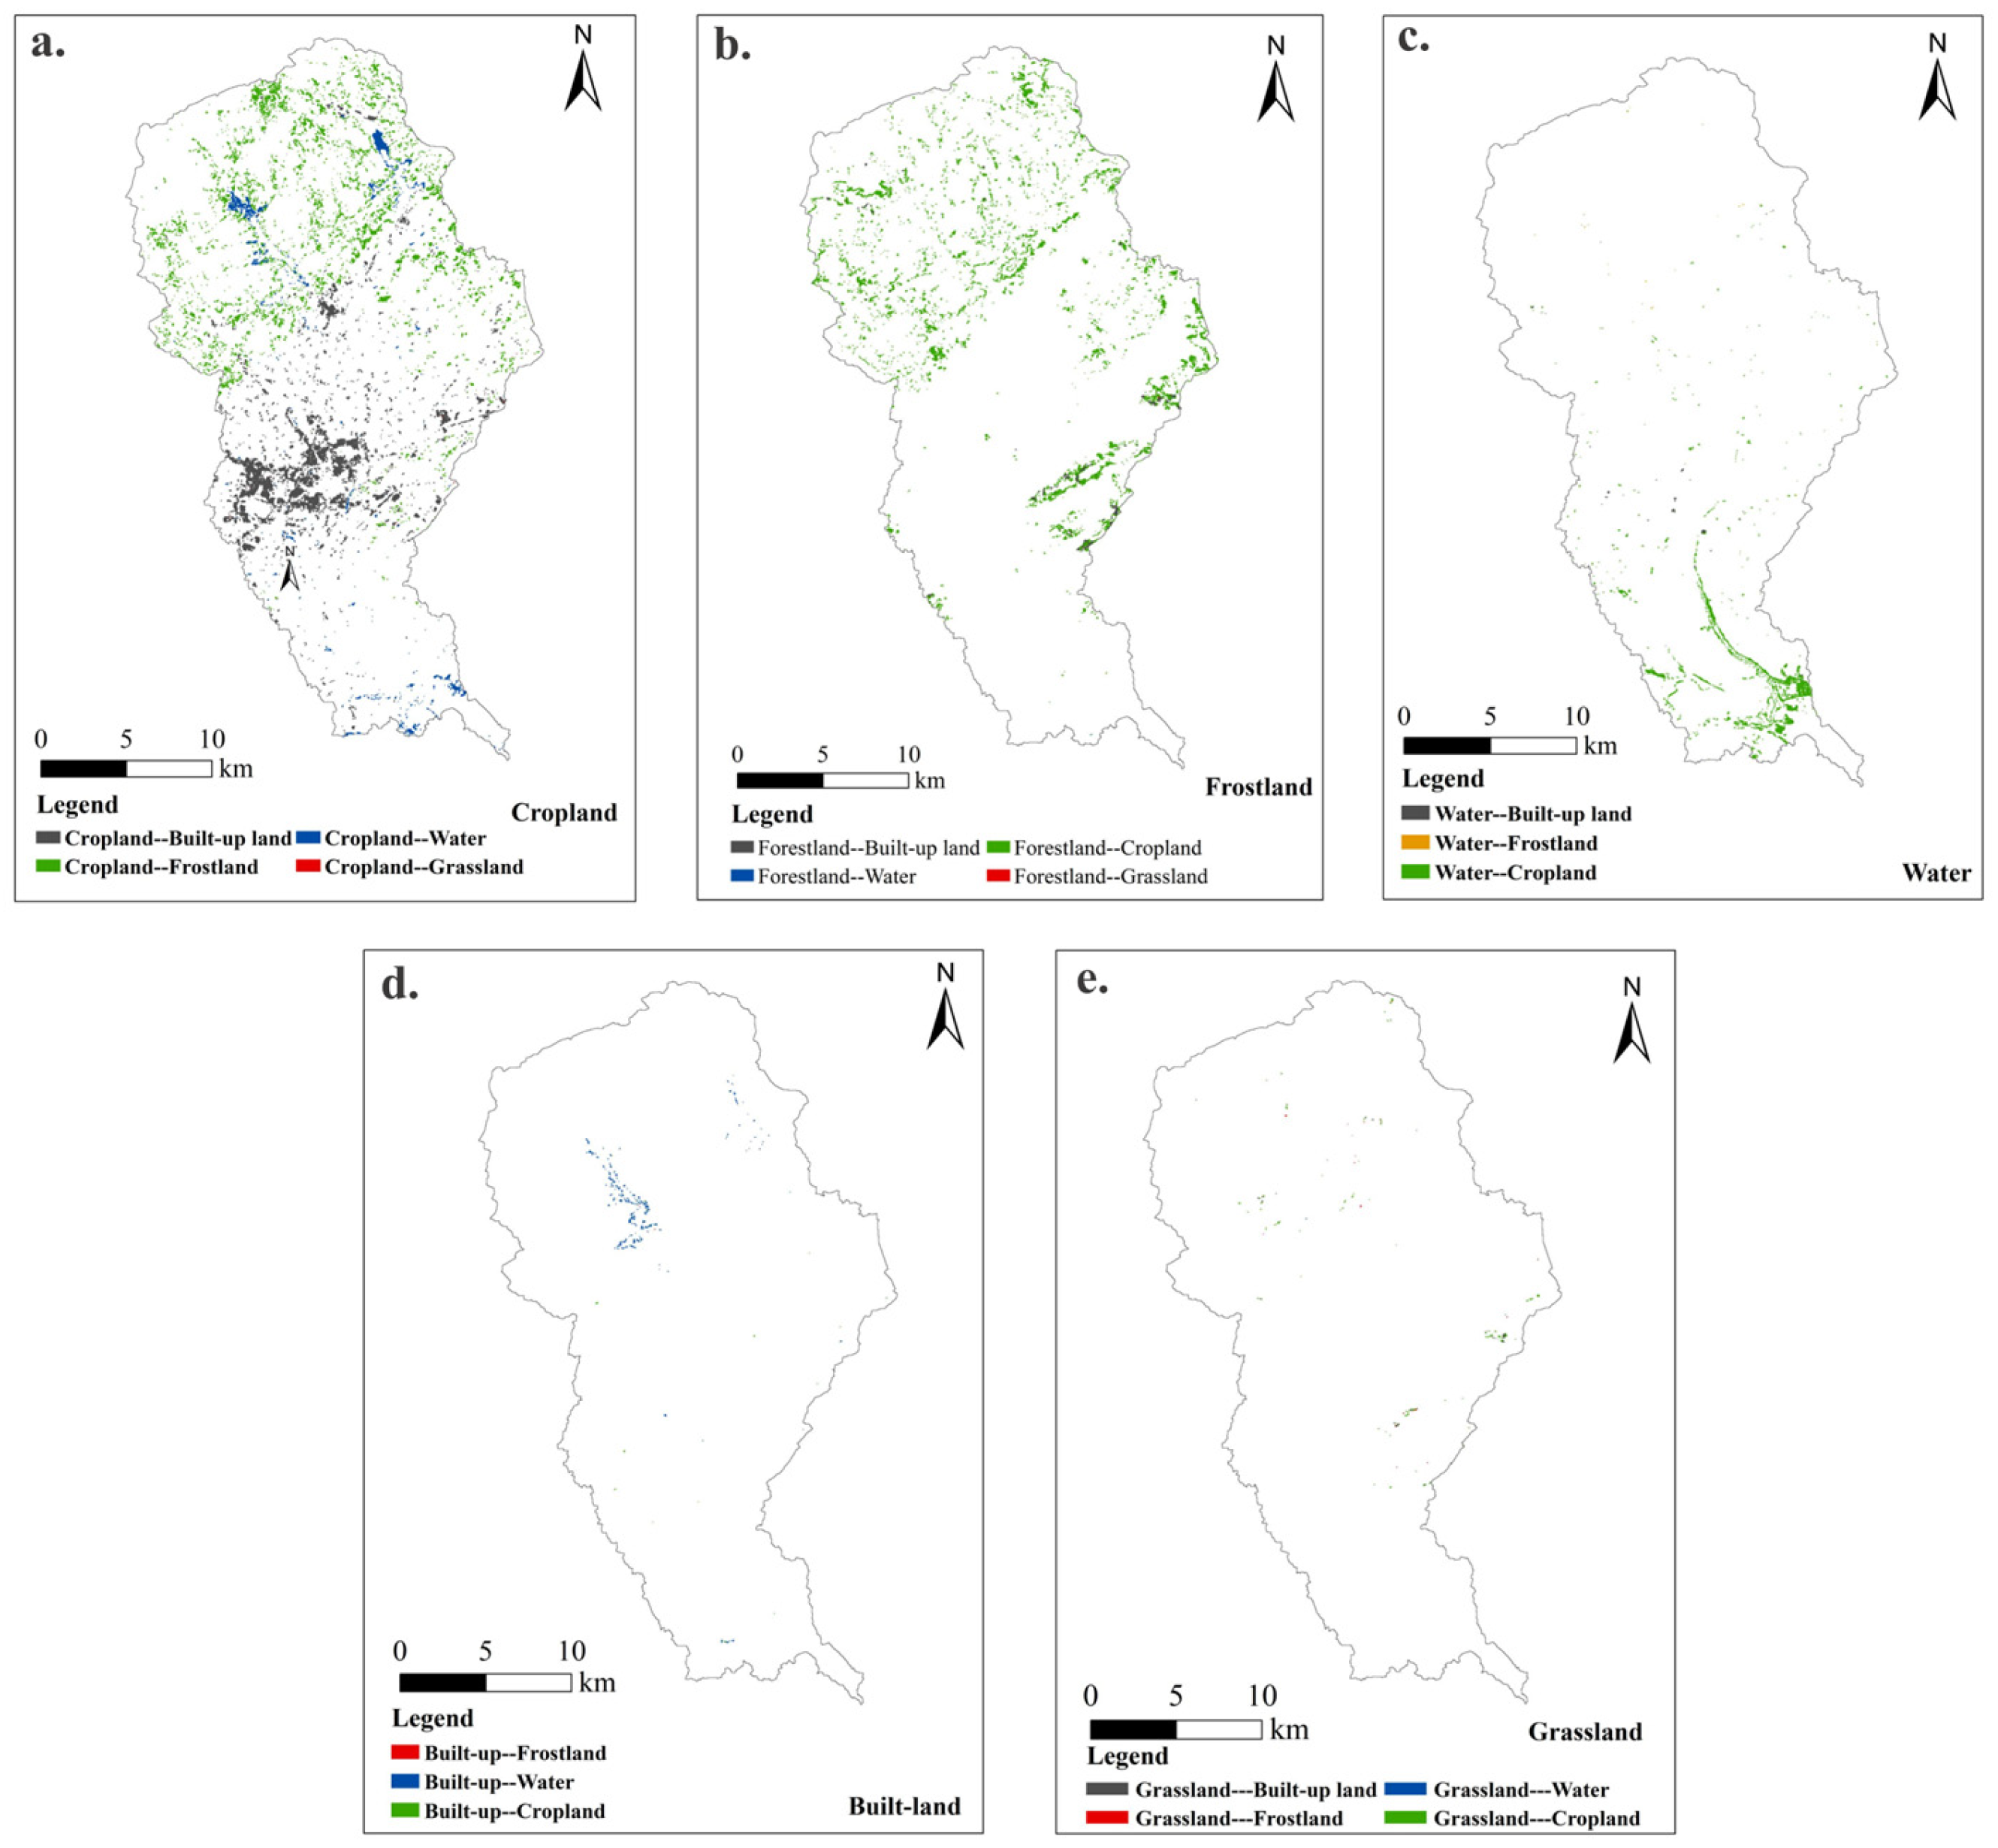
3.1. Characteristics of Land Use Type Changes

As detailed in Table 2 and Figure 2, construction land in the Xinxian River watershed showed a continuous growth trend, increasing from 2.99% in 2000 to 4.14% in 2010 and further to 6.09% in 2020. Land use dynamics analysis revealed that the expansion rate of construction land was 3.834 from 2000 to 2010 and 4.697 from 2010 to 2020, indicating an accelerating trend of urbanization in the basin.
Cultivated land, the main land use type in the study area, showed a continuous decreasing trend. Land use dynamics analysis showed that the reduction rate of cultivated land was 0.345 from 2000 to 2010 and 0.116 from 2010 to 2020, indicating a slowdown in the rate of cultivated land reduction.
Forest land area showed a trend of increasing and then decreasing. The proportion of forest land increased from 32.1% in 2000 to 33.5% in 2010 and then decreased to 31.9% in 2020. Land use dynamics analysis showed that the rate of decrease in forest land from 2010 to 2020 was greater than the rate of increase from 2000 to 2010, showing an overall decreasing trend.
The water area showed a fluctuating pattern of decreasing and then increasing. The proportion of water area decreased from 3.59% in 2000 to 3.18% in 2010, and then increased to 3.48% in 2020. Land use dynamics analysis showed that the rate of increase in water area from 2010 to 2020 was smaller than the rate of decrease from 2000 to 2010.
The grassland area showed a trend of increasing and then decreasing. The proportion of grassland increased from 0.073% in 2000 to 0.075% in 2010 and then decreased to 0.071% in 2020. The fluctuation in grassland area is considered to be within the normal range of variation.
Overall, the land use structure of the Xinxian River watershed changed significantly from 2000 to 2020, showing the characteristics of construction land expansion, cultivated land reduction, forest land increasing first and then decreasing, and water area fluctuating.
Overlaying the 2000 and 2020 land use classification maps using ArcGIS facilitated the analysis of land use type transition characteristics within the Xinxian River watershed (Table 3).
The watershed exhibited significant inter-type land use transformations, as follows: grassland displayed a preservation rate of only 46.1%, with 29.10% converted to cropland, 17.20% to built-up land, and 7.00% and 0.60% to forest land and water bodies. Cropland had a preservation rate of 90.07%, with 5.02% converted to built-up land and 3.91% to forest land. Built-up land showed a high preservation rate of 96.20%, with only 3.50% and 0.30% converted to water bodies and cropland, respectively. Forest land had a preservation rate of 91.74%, with 7.79% converted to cropland and 0.40% to built-up land. Water bodies exhibited a preservation rate of 77.30%, with 21.44% converted to cropland, 0.38% to built-up land, and 0.80% to forest land.
Spatial distribution characteristics of land use type conversions within the Xinxian River watershed were analyzed using land use data from 2000 to 2020, in conjunction with the spatial distribution maps of these conversions (Figure 3).
Analysis of the results indicates a distinct spatial heterogeneity in land use type conversion during the study period. Specifically, conversions from cultivated land to construction land were primarily concentrated in the midstream areas surrounding Huangmei County, while conversions to forest land were mainly located in the upstream mountainous regions. Conversions to water bodies were primarily distributed around the Longping and Gujiao Reservoirs. Conversions from forest land to cultivated land occurred mainly in the upstream and midstream areas, with conversions to water bodies, grassland, and construction land being spatially limited and lacking a clear distribution pattern. Conversions from construction land were mainly located near the Longping and Gujiao Reservoirs. Grassland was primarily converted to forest land, water bodies, and cultivated land, exhibiting a relatively dispersed distribution. Conversions from water bodies to cultivated land were mainly concentrated in the downstream areas, with conversions to construction land and forest land being infrequent.
In summary, land use type transformations within the Xinxian River watershed from 2000 to 2020 exhibited significant spatial heterogeneity, primarily characterized by inter-conversions among Cropland, forest land, built-up land, and water bodies.

3.2. Spatial Distribution Characteristics of River Water Quality

Fourteen water quality monitoring points were established along the Xinxian River, based on its hydrological characteristics. At each point, geographical coordinates and surrounding land use conditions were recorded and photographed (Table 4). Actual water quality data at the monitoring sites are provided in the supplementary information (Table S1: Flow Velocity Data at Monitoring Sites).
The spatial distribution of water quality parameters (Table 5) revealed that DO concentrations were generally higher at upstream monitoring sites compared to the midstream and downstream reaches. Overall, the nutrient concentrations TN, NH3-N, TP, and CODMn exhibited a trend of initial increase followed by a decrease, with upstream concentrations significantly lower than those in the midstream and downstream areas. Chl-a concentrations in the midstream and downstream were significantly elevated compared to the upstream, indicating a higher eutrophication risk. In summary, the Xin County River Basin displayed significant spatial heterogeneity in water environmental quality, with the midstream and downstream regions exhibiting a higher risk of eutrophication.

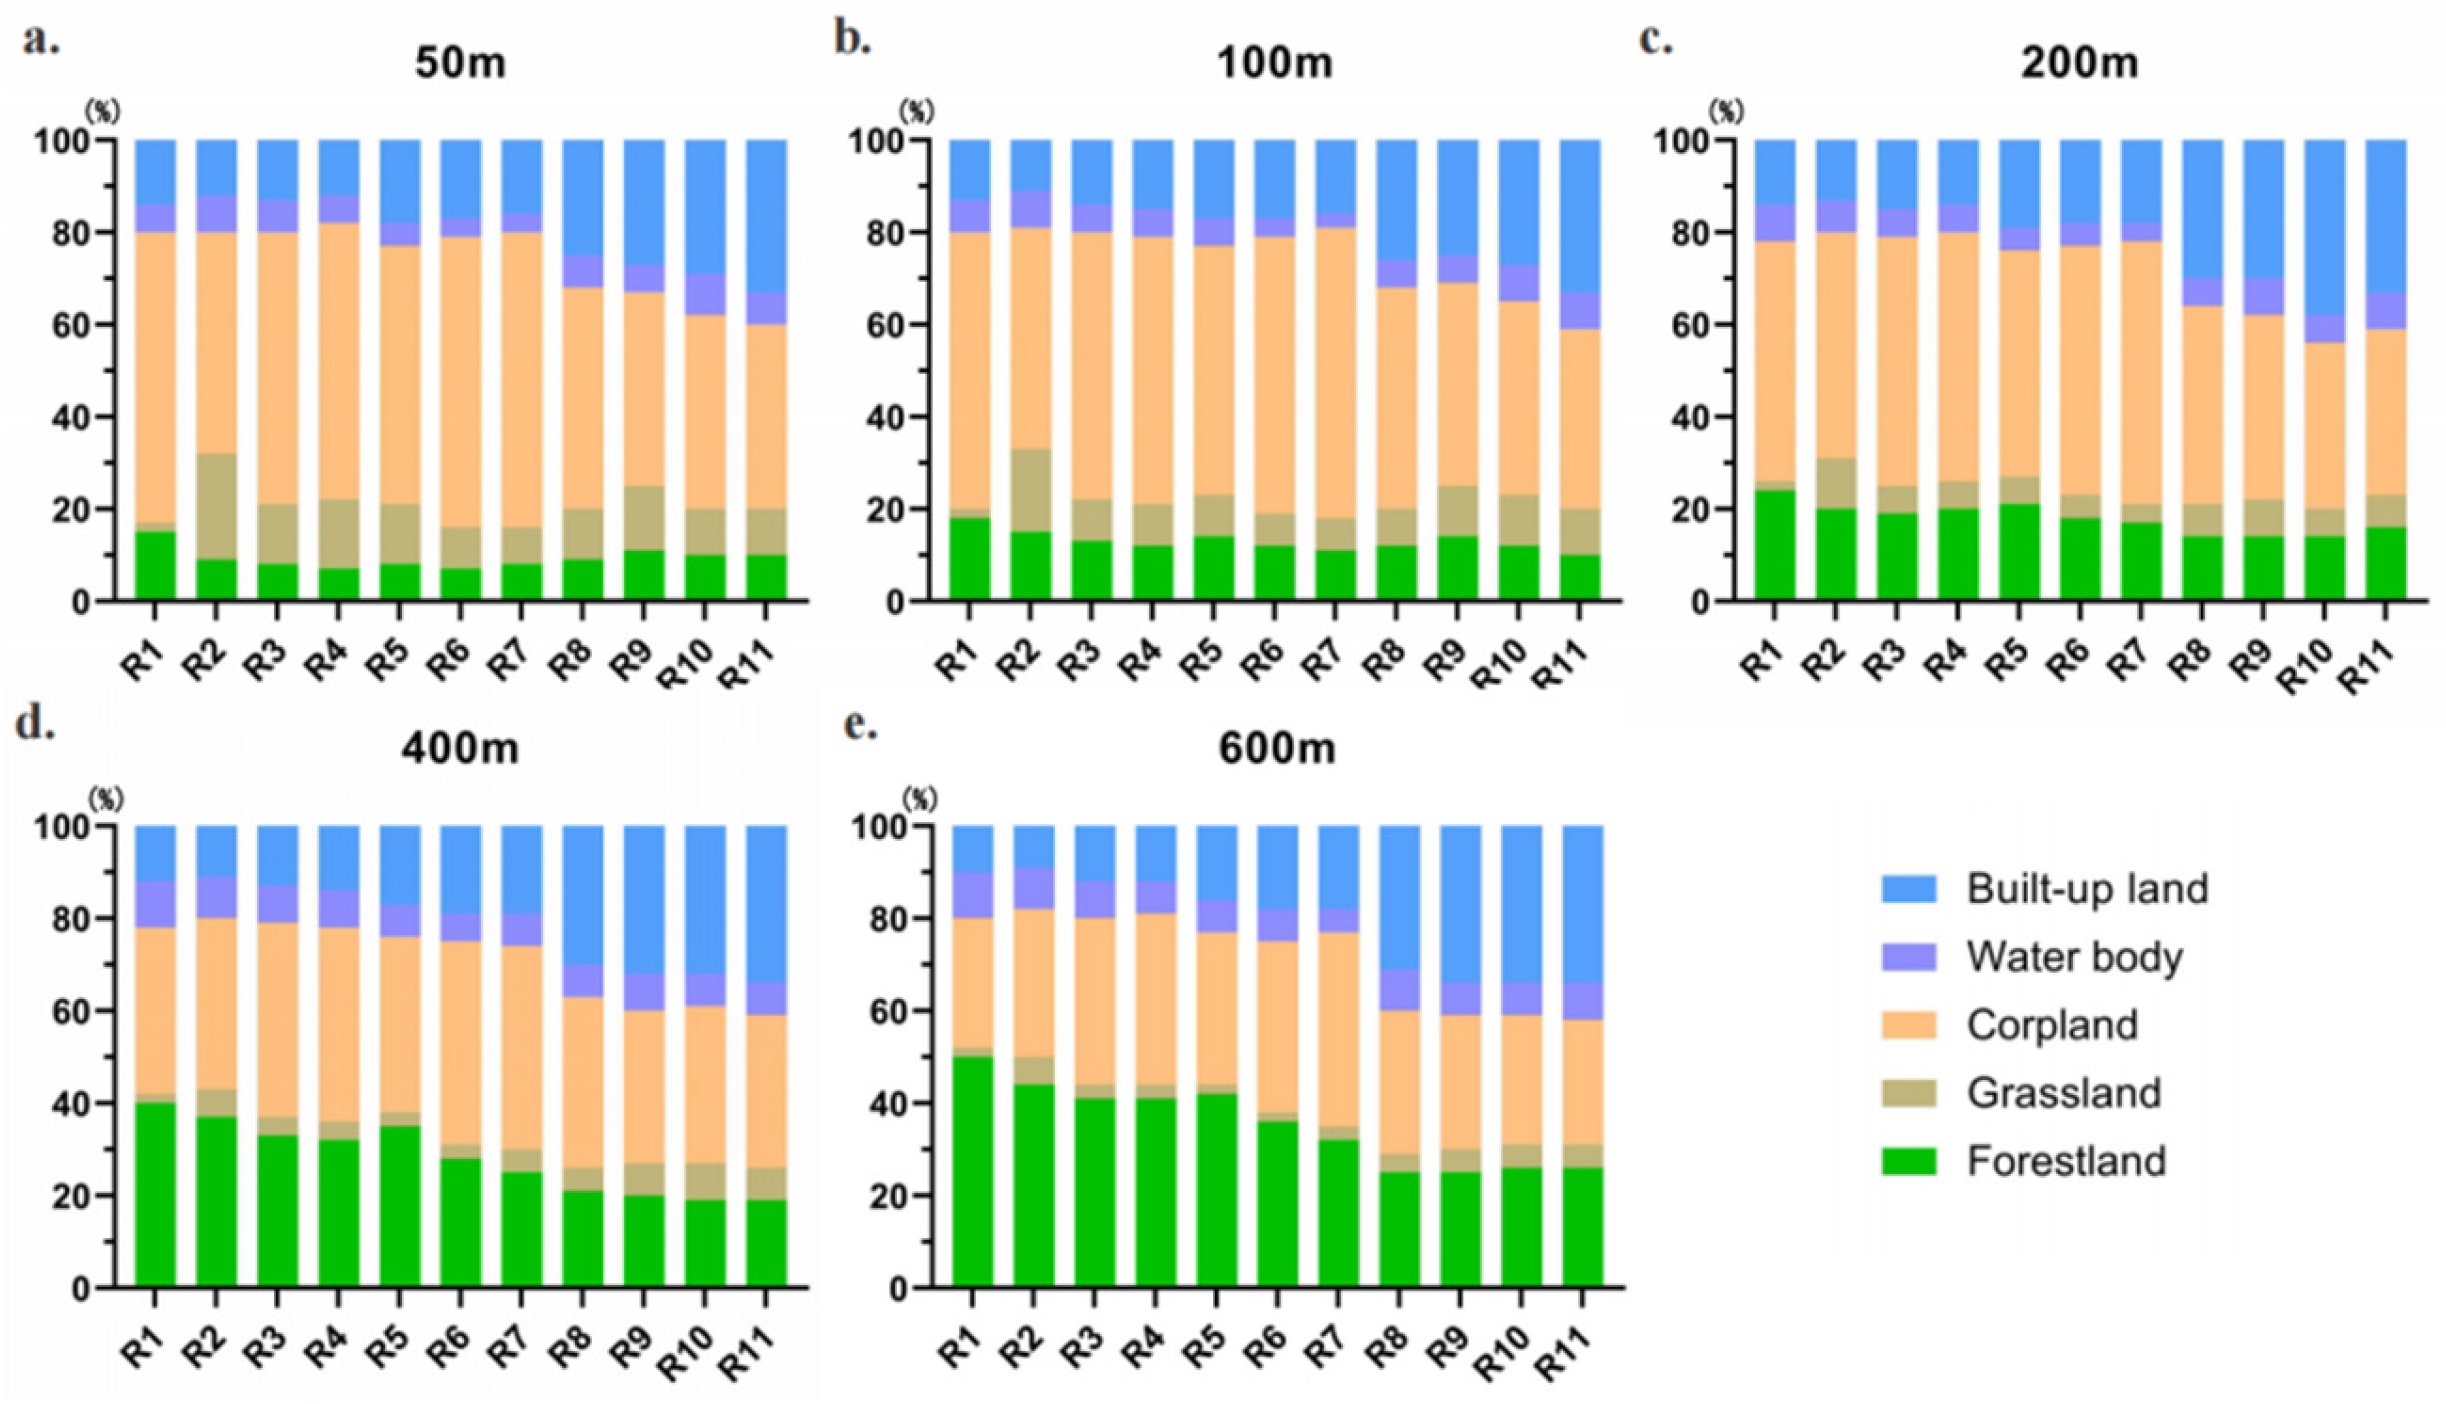
3.3. Spatial Heterogeneity of Land Use in Buffer Zones

The spatial distribution characteristics of land use types across varying buffer scales were analyzed (Figure 4). The results indicated that in the 50 m, 100 m, and 200 m buffer zones, cropland dominated, primarily located in close proximity to the riverbanks. As the buffer scale increased, the proportion of cropland gradually decreased. Conversely, in the 400 m and 600 m buffer zones, forest land significantly increased, becoming the second most prevalent land use type after cropland. Forest land was predominantly distributed at greater distances from the riverbanks. Grassland was mainly concentrated in areas closer to the riverbanks with higher soil moisture. As the buffer scale increased, the proportion of grassland gradually decreased. The proportion of built-up land exhibited a slight decrease with increasing buffer scale; although the overall change was minimal, built-up land in the upstream region tended to be located closer to the riverbanks. In the midstream urban centers, influenced by urban expansion, the correlation between built-up land distribution and river distance was weaker.
From sub-basin R1 to R14, the proportion of built-up land showed an initial increase followed by a subsequent decrease, peaking at R11 (the center of Huangmei County). The proportion of cropland exhibited an inverse trend, decreasing initially and then increasing, with the lowest point at R11, demonstrating a negative correlation with built-up land. The proportion of water bodies was higher in the upstream and downstream reaches and lower in the midstream reaches, reflecting the abundance of wetlands in the downstream. Except for the 50 m and 100 m buffer zones, the proportion of forest land gradually decreased from upstream to downstream, indicating higher forest cover upstream. The proportion of grassland was generally higher in the downstream reaches compared to the upstream and midstream.

3.4. Impact of Land Use on River Water Quality

Redundancy Analysis (RDA) was employed to investigate the correlations between five land use types and river water quality indicators (Figure 5). The analysis revealed a significant spatial scale dependence in these correlations.
Across all spatial scales, built-up land exhibited a significant positive correlation with nutrient salts (TP, TN, NH3-N, CODMn), while forest land displayed a significant negative correlation. At smaller spatial scales (50 m, 100 m, and 200 m), cropland exhibited a negative correlation with nutrient indicators such as nitrogen and phosphorus. This correlation weakened progressively with increasing spatial scale, becoming negligible at the 600 m buffer distance. The correlation between grassland and river nutrient indicators varied considerably with spatial scale. Negative correlations were observed within the 50 m and 100 m buffer zones, no significant correlation was found at 200 m, and positive correlations were detected at 400 m and 600 m. The correlation between riparian water bodies and water quality indicators was weak at near-bank distances but became negatively correlated with nutrient salt indicators at greater distances.

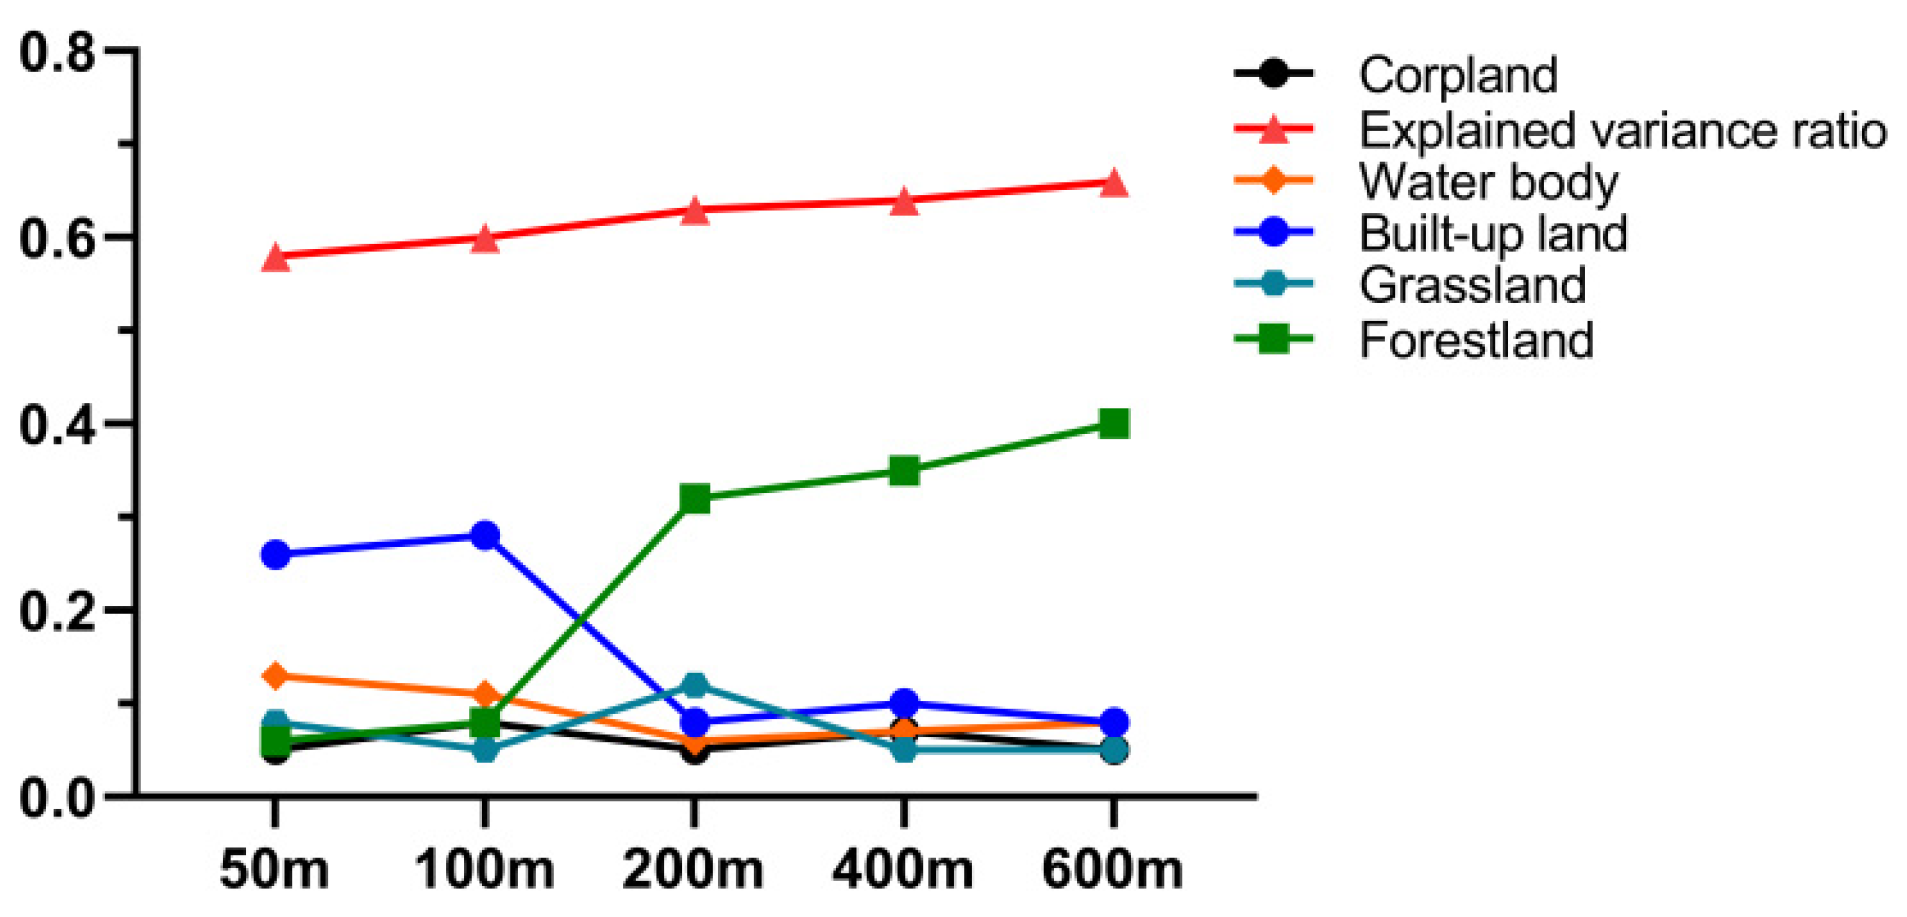
3.5. Scale Dependence

The explanatory power of land use types on river water quality indicators was quantified and visualized through correlation analysis (Figure 6), enabling a quantitative assessment of the influence of different land use types on river water environmental quality.
At the 50 m and 100 m spatial scales, built-up land exhibited a higher explanatory rate for river water quality, reaching 29% at the 100 m buffer scale. As the buffer scale increased, the influence of built-up land on river water quality gradually diminished, while the explanatory rate of forest land significantly increased, reaching 40% at the 600 m scale. Despite being the dominant landscape type in the watershed, Cropland consistently displayed an explanatory rate below 10%, indicating a limited influence on river water quality. Grassland demonstrated a peak explanatory rate of approximately 11% at the 200 m scale, with rates below 10% at all other scales. The explanatory rate of water bodies on river water quality decreased progressively with increasing spatial scale. At smaller spatial scales, built-up land was the primary factor affecting river water environmental quality. With increasing spatial scales, forest land gradually became the dominant influencing factor, while cropland and grassland exerted relatively limited influence.

4. Discussion

4.1. The Impact of Economic Development on Land Use Types

Land use pattern changes in river basins are driven by both natural and anthropogenic factors [23,24]. In the Xinxian River watershed, regional economic development, urbanization, and population growth are the primary drivers.
Significant land use structural changes occurred in the Xinxian River watershed between 2000 and 2020. The continuous expansion of built-up land and the reduction in cropland were the dominant trends, reflecting a pattern commonly observed during China’s urbanization [25]. The rapid expansion of built-up land (dynamics increasing from 3.83 to 4.71) directly indicates an accelerating urbanization rate, whereas the decelerating rate of cropland reduction (dynamics decreasing from 0.36 to 0.11) suggests the partial effectiveness of recent cropland protection policies [26]. The initial increase followed by a decrease in forest land proportion implies that despite initial success in ecological forestry protection, subsequent urbanization encroachment occurred [27]. Fluctuations in water body area reflect the significant impact of anthropogenic activities, such as fisheries development and reservoir construction, on land use patterns.
The high preservation rates of cropland (90.07%) and built-up land (96.20%) suggest their high stability, consistent with China’s cropland protection policies and urbanization trends [28]. The high conversion rate of water bodies (preservation rate 77.30%) highlights the impact of agricultural development on aquatic ecosystems [29]. Conversions from cropland to built-up land were concentrated in midstream urban areas, reflecting urban encroachment on agricultural land. Conversions from forest land to cropland were primarily located in upstream mountainous regions, potentially related to agricultural expansion, which remains a key driver of forest loss. Water body conversions were mainly observed in downstream fisheries development areas and upstream reservoir construction zones.
The rapid economic development and urbanization in the Yangtze River Basin have led to dramatic land use changes. Urban expansion, population migration, and industrial restructuring have resulted in diverse land use changes in both urban and rural areas. In rural areas, urbanization has driven industrial restructuring, leading to conversions of agricultural land to orchards and aquaculture, explaining the transformation of cropland to forest land and water bodies [30]. Urban development and agricultural activities require flat terrain near water sources, resulting in the occupation of high-quality cropland by built-up land and increased cultivation on slopes, leading to forest and grassland loss [31]. Studies have indicated that land development intensity in numerous provinces and cities within the Yangtze River Basin surpasses the national average. This has resulted in the extensive conversion of arable land to built-up land, with encroachment on forest land, water bodies, and grasslands [32].
China experienced its most rapid urbanization between 2000 and 2020, a period coinciding with the progressive strengthening of farmland protection policies and legislation [33]. Its agricultural sector is undergoing a transition from productivism to post-productivism, marked by a shift from solely pursuing output growth toward greater consideration of land quality, safety, efficiency, and ecology [34]. This transformation necessitates a change in focus from merely increasing farmland quantity to enhancing its quality and the ecological environment. Consequently, ecological factors are critical evaluation indicators for reflecting ecological quality [35]. As an ecological subsystem, farmland ecological quality primarily encompasses the status of functions such as soil and water conservation, water source conservation, air purification, climate regulation, and biodiversity protection [36]. Future land consolidation efforts should integrate regional development needs and directions, strategically differentiate land consolidation structures, and ultimately aim to optimize the overall benefits of land consolidation.
Land use type changes in the Xinxian River watershed result from a combination of natural and anthropogenic factors, with urbanization, agricultural development, and ecological protection policies as key drivers. These characteristics provide a basis for future land use planning, restructuring, and water ecology protection in Huangmei County, aiming to achieve regional sustainable development.

4.2. Spatial Distribution Characteristics of River Water Quality and Land Use Types in Buffer Zones

Water quality monitoring results in the Xinxian River revealed significant spatial differentiation. DO concentrations were generally higher in upstream sites, potentially due to faster water flow, enhanced re-aeration capacity, and abundant aquatic vegetation [37]. In contrast, lower DO concentrations were observed at monitoring sites within urban areas, likely attributed to the discharge of urban domestic sewage and oxygen consumption during organic pollutant degradation. TN and NH₃-N concentrations showed similar spatial distribution patterns, with higher concentrations in midstream and downstream sites, correlating with urban domestic sewage discharge and agricultural non-point source pollution [38]. TP concentrations exhibited a similar trend, indicating the potential combined impact of domestic sewage and agricultural activities in the midstream and downstream regions. CODMn distribution patterns further confirmed severe organic pollution in the midstream and downstream areas, where elevated CODMn levels may threaten water oxygen balance and aquatic ecosystems [39]. Chl-a concentration distribution indicated a higher eutrophication risk in the midstream region (e.g., sites R11 and R12), associated with nutrient (nitrogen and phosphorus) inputs and favorable light conditions [40]. Overall, the midstream and downstream reaches of the Xinxian River watershed face a higher eutrophication risk, necessitating effective pollution source control measures to improve river water quality.
Land use type analysis across varying buffer scales demonstrated that cropland was predominantly distributed in riparian zones, facilitating agricultural irrigation, with a gradual decrease in cropland proportion as the buffer scale increased. Forest land was primarily located at greater distances from riverbanks, while grassland was concentrated in areas with higher soil moisture. Built-up land distribution showed a weaker correlation with river distance. The Xinxian River watershed exhibited significant spatial heterogeneity in land use distribution across buffer scales. Future land use planning should consider these spatial distribution characteristics to optimize land use structure and promote regional sustainable development.

4.3. Scale Effect of Land Use on Water Quality

Different land use types exhibit varying capacities for transporting pollutants into water bodies [41]. In this study, built-up land showed a significant positive correlation with most water quality indicators, indicating its negative impact on river water quality. Similarly, Pan et al.’s [42] research in Quanzhou, China, yielded comparable conclusions, demonstrating a negative correlation between the intensity of built-up land expansion and ecological quality changes. Their findings indicated that increases in built-up land significantly accelerated the decline in ecological quality. Nitrogen and phosphorus pollution in rivers primarily originates from built-up land. This is closely associated with increased surface runoff pollutant concentrations due to urban expansion and increased impervious surface areas. Similarly, Cui et al. [43] research in the Bosten Lake Basin yielded comparable conclusions. Their study revealed significant land use changes in the basin between 2000 and 2013, characterized by a sustained and substantial increase in the area of residential and industrial land. Furthermore, water pollution exhibited a positive correlation with both cultivated land and residential-industrial land. Urban runoff often carries substantial pollutants, such as nitrogen- and phosphorus-containing organic matter, which enter rivers through surface runoff, leading to water quality deterioration. The expansion of built-up land poses a significant threat to river water environmental quality. The impact of construction land on river water quality is multifaceted and necessitates a comprehensive approach. Mitigation strategies should encompass source reduction (e.g., low-impact development (LID) and separate storm and sanitary sewer systems), process interception (e.g., rain gardens and artificial wetlands), and ecological restoration (e.g., ecological revetments and river aeration) to effectively reduce its adverse effects on river water quality.
Forest land exhibited a significant negative correlation with most water quality indicators, suggesting its role in intercepting pollutants entering rivers. The research by Caldwell et al. [10] in the southeastern United States demonstrated that concentrations of TN, TP, and suspended sediment (SS) decreased significantly with increasing forest cover, while they increased with the greater development or agricultural land cover. This is attributed to the forest land’s ability to reduce surface runoff and adsorb pollutants [44]. Forest canopies intercept rainfall, mitigating flood scouring during storm events and preventing concentrated pollutant inputs [45]. Forest vegetation effectively reduces surface runoff velocity, intercepts soil particles and suspended matter, and adsorbs and immobilizes nutrients such as nitrogen (e.g., nitrates) and phosphorus, thereby preventing excessive nutrient loading into rivers. The preservation of upstream forest cover can contribute to a reduction in the cost of downstream water treatment [46]. Forests serve as natural filters for river water, providing significant ecological benefits and requiring relatively low maintenance. This makes them particularly well-suited for pollution control along urban riverbanks, where their comprehensive benefits often substantially exceed those offered by artificial treatment facilities. Sustainable management of water conservation forests, combined with the protection and restoration of forest vegetation, can significantly enhance their water purification efficiency.
The observed negative correlation between cultivated land and TN and TP contradicts previous findings [47]. This discrepancy is primarily attributed to the limited leaching and runoff of nitrogen and phosphorus, coupled with the soil’s capacity for nutrient adsorption, leading to pollutant retention. Furthermore, the sampling period was characterized by a general absence of rainfall. Some studies have indicated that while farmland can act as a source of pollutants, it can also provide a degree of pollutant interception during non-cultivation periods [27]. Consequently, due to regional variations, a unified conclusion regarding the impact of farmland on river water quality remains elusive. Potential factors contributing to this variability include farming practices, the application rates of pesticides and fertilizers, irrigation methods, and the size of the cultivated area and its proximity to receiving water bodies. Agricultural runoff pollution can be mitigated by employing flood-tolerant herbaceous plants, such as vetiver grass, in farmland drainage ditches, and planting vegetation, such as sweet flag, on rice paddy embankments to adsorb nitrogen, phosphorus, and sediment. The construction of artificial wetlands can also effectively purify agricultural wastewater.
Grassland exhibited significant spatial scale dependence in its impact on water quality. Near-bank grasslands exhibited a purifying effect on water quality, while far-bank grasslands potentially had a negative impact. This discrepancy may arise from the predominance of natural grasslands near riverbanks, while grasslands located further from riverbanks are often situated adjacent to construction land, thus being more significantly influenced by it. Similarly, research by Chen et al. [1] in southern Alberta, Canada, also identified grassland as a land use type positively correlated with water quality indicators. Given the relatively low overall proportion of grassland area in the Xinxian River watershed, the impact of grassland on river water quality is highly susceptible to the influence of surrounding land use types. Studies have demonstrated that grasslands, functioning as permeable underlying surfaces, possess the capacity to retain and absorb nitrogen and phosphorus [48]. Furthermore, the rhizosphere microbial communities of grasslands, including nitrifying and denitrifying bacteria, facilitate the conversion of nitrates into nitrogen gas (denitrification), thereby reducing the nitrogen load in aquatic systems. Consequently, the protection of natural grassland resources is crucial for safeguarding river water quality and aquatic ecosystems.
Near-bank water bodies, often directly connected to rivers, exhibit a negligible influence on river water quality. In contrast, far-bank water bodies show a negative correlation with river nutrient indicators, suggesting their role in intercepting pollutants entering rivers. Their inherent ecosystems can mitigate a portion of these pollutants [49]. Furthermore, water bodies and wetlands not only reduce riverine pollution but also play a crucial role in regulating local climates [50]. Wetlands improve river water quality through a combination of physical, chemical, and ecological processes [51]. Their physical functions include filtering suspended solids and moderating water temperature; chemical functions involve removing nitrogen and phosphorus and immobilizing heavy metals; and ecological functions encompass flood regulation and the maintenance of hydrological balance. Therefore, wetland protection and restoration represent an ecologically effective and sustainable water quality management strategy that should be incorporated into comprehensive watershed management plans.
Research by Yan et al. [52] in the Huai River Basin demonstrated that larger areas and greater aggregation of forest and grassland were associated with better water quality. Conversely, larger areas of urban land were correlated with larger regions of poorer water quality. Built-up land and forest land are the main land use types affecting the quality of river water environment, in which the negative impact of built-up land on water quality is more significant at smaller spatial scales, while forest land has a more prominent role in improving water quality at larger spatial scales. Cropland and grassland had relatively limited impacts on river water quality, but their spatial distribution and management practices still require attention. In future watershed management, attention should be focused on the spatial distribution of built-up land and forest land and their impacts on water quality, optimizing land-use structure, and strengthening the protection of near-riverbank grasslands and wetlands, in order to promote the sustained improvement in the quality of the river’s water environment.

5. Conclusions

This study investigated the impact of land use on river water quality by analyzing land use pattern changes in the Xinxian River watershed using Redundancy Analysis (RDA), leading to the following conclusions:
From 2000 to 2020, the Xinxian River watershed experienced significant alterations in land use structure, characterized primarily by the continuous expansion of built-up land and the reduction in cropland. Substantial inter-type land use conversions occurred, exhibiting distinct spatial differentiation patterns.
Significant spatial heterogeneity was observed in the Xinxian River’s water quality, with nutrient salt concentrations (TP, TN, NH3-N, and CODMn) generally lower in the upstream reaches compared to the midstream and downstream. Land use distribution within buffer zones revealed that cropland was predominantly located near riverbanks, forest land at greater distances, grassland in areas with higher soil moisture, and built-up land distribution that exhibited a weak correlation with river distance.
Land use types significantly influenced river water quality. Built-up land displayed a positive correlation with nutrient salt indicators, while forest land showed a negative correlation. Cropland exhibited a weak correlation with nutrient salt indicators. The impact of grassland on water quality demonstrated significant spatial scale dependence. At smaller spatial scales, built-up land was the primary determinant of river water environmental quality. With increasing spatial scales, forest land gradually became the dominant influencing factor.
To maintain regional ecological balance, it is recommended to strengthen the protection of grassland and water body ecosystems and minimize anthropogenic disturbances. Watershed management should prioritize the spatial distribution of built-up land and forest land, considering their respective impacts on water quality. Optimizing land use structure is crucial for promoting sustained improvement in river water environmental quality.

Supplementary Materials

The following supporting information can be downloaded at https://www.mdpi.com/article/10.3390/w17101541/s1, Table S1: Flow Velocity Data at Monitoring Sites.

Author Contributions

Conceptualization, Y.G. and Y.L.; methodology, Y.G., Y.L. and W.L.; investigation, W.L., Y.G., X.C., X.L. and H.L.; resources, Y.L.; writing—original draft preparation, Y.G.; writing—review and editing, Y.G. and Y.L.; visualization, Y.G., X.C., X.L. and H.L.; supervision, Y.L. All authors have read and agreed to the published version of the manuscript.

Funding

This research was funded by the National Natural Science Foundation of China (Grant No. 52179131). Funding for this research was provided by [Fund Name: The impact of ecological waterfall structure on nitrogen removal in the hyporheic zone and its parameter optimization], with an award amount of RMB 600,000. The fund manager is Professor Liu Ying from Hubei University of Technology (Wuhan, Hubei, China).

Data Availability Statement

The data presented in this study are available on request from the corresponding author.

Conflicts of Interest

Author Weilin Li was employed by the company Hubei Fisheries Group Co., Ltd. The remaining authors declare that the research was conducted in the absence of any commercial or financial relationships that could be construed as a potential conflict of interest.

References

  1. Chen, Z.; An, C.; Tan, Q.; Tian, X.; Li, G.; Zhou, Y. Spatiotemporal analysis of land use pattern and stream water quality in southern Alberta, Canada. J. Contam. Hydrol. 2021, 242, 103852. [Google Scholar] [CrossRef] [PubMed]
  2. Lin, J.; Huang, J.; Prell, C.; Bryan, B.A. Changes in supply and demand mediate the effects of land-use change on freshwater ecosystem services flows. Sci. Total Environ. 2021, 763, 143012. [Google Scholar] [CrossRef] [PubMed]
  3. Ervinia, A.; Huang, J.; Huang, Y.; Lin, J. Coupled effects of climate variability and land use pattern on surface water quality: An elasticity perspective and watershed health indicators. Sci. Total Environ. 2019, 693, 133592. [Google Scholar] [CrossRef]
  4. Pei, L.; Wang, C.; Zuo, Y.; Liu, X.; Chi, Y. Impacts of Land Use on Surface Water Quality Using Self-Organizing Map in Middle Region of the Yellow River Basin, China. Int. J. Environ. Res. Public Health 2022, 19, 10946. [Google Scholar] [CrossRef]
  5. Xiao, R.; Wang, G.; Zhang, Q.; Zhang, Z. Multi-scale analysis of relationship between landscape pattern and urban river water quality in different seasons. Sci. Rep. 2016, 6, 25250. [Google Scholar] [CrossRef]
  6. Uriarte, M.; Yackulic, C.B.; Lim, Y.; Arce-Nazario, J.A. Influence of land use on water quality in a tropical landscape: A multi-scale analysis. Landsc. Ecol. 2011, 26, 1151–1164. [Google Scholar] [CrossRef]
  7. Li, S.; Gu, S.; Tan, X.; Zhang, Q. Water quality in the upper Han River basin, China: The impacts of land use/land cover in riparian buffer zone. J. Hazard. Mater. 2009, 165, 317–324. [Google Scholar] [CrossRef]
  8. Ding, J.; Jiang, Y.; Liu, Q.; Hou, Z.; Liao, J.; Fu, L.; Peng, Q. Influences of the land use pattern on water quality in low-order streams of the Dongjiang River basin, China: A multi-scale analysis. Sci. Total Environ. 2016, 551–552, 205–216. [Google Scholar] [CrossRef]
  9. Ewane, E.B. Assessing land use and landscape factors as determinants of water quality trends in Nyong River basin, Cameroon. Environ. Monit. Assess. 2020, 192, 507. [Google Scholar] [CrossRef]
  10. Cerqueira, T.C.; MCaldwell, P.V.; Martin, K.L.; Vose, J.M.; Baker, J.S.; Warziniack, T.W.; Costanza, J.K.; Frey, G.E.; Nehra, A.; Mihiar, C.M. Forested watersheds provide the highest water quality among all land cover types, but the benefit of this ecosystem service depends on landscape context. Sci. Total Environ. 2023, 882, 163550. [Google Scholar] [CrossRef]
  11. Qin, X.; Yang, Q.; Wang, L. The evolution of habitat quality and its response to land use change in the coastal China, 1985–2020. Sci. Total Environ. 2024, 952, 175930. [Google Scholar] [CrossRef] [PubMed]
  12. Ren, W.; Wu, X.; Ge, X.; Lin, G.; Feng, L.; Ma, W.; Xu, D. Study on the Water Quality Characteristics of the Baoan Lake Basin in China under Different Land Use and Landscape Pattern Distributions. Int. J. Environ. Res. Public Health 2022, 19, 6082. [Google Scholar] [CrossRef] [PubMed]
  13. Krishnaraj, A.; Honnasiddaiah, R. Multi-spatial-scale land/use land cover influences on seasonally dominant water quality along Middle Ganga Basin. Environ. Monit. Assess. 2023, 195, 1434. [Google Scholar] [CrossRef]
  14. Wang, Y.; Song, Z.; Bai, H.; Tong, H.; Chen, Y.; Wei, Y.; Wang, X.; Yang, S. Scale effects of land use on river water quality: A case study of the Tuojiang River Basin, China. Environ. Sci. Pollut. Res. Int. 2023, 30, 48002–48020. [Google Scholar] [CrossRef]
  15. Li, H.; Zhao, B.; Wang, D.; Zhang, K.; Tan, X.; Zhang, Q. Effect of multiple spatial scale characterization of land use on water quality. Environ. Sci. Pollut. Res. Int. 2023, 30, 7106–7120. [Google Scholar] [CrossRef]
  16. HJ 636-2012; Water Quality-Determination of Total Nitrogen-Alkaline Potassium Persulfate Digestion UV Spectrophotometric Method. Standardization Administration of China: Beijing, China, 2012.
  17. GB 11893-89; Water Quality—Determination of Total Phosphorus—Ammonium Molybdate Spectrophotometric Method. Standardization Administration of China: Beijing, China, 1989.
  18. HJ 535-2009; Water Quality—Determination of Ammonia Nitrogen—Nessler’s Reagent Spectrophotometry. Standardization Administration of China: Beijing, China, 2009.
  19. GB 11892-89; Water Quality—Determination of Permanganate Index. Standardization Administration of China: Beijing, China, 1989.
  20. HJ 897-2017; Water Quality—Determination of Chlorophyll A—Spectrophotometric Method. Standardization Administration of China: Beijing, China, 2017.
  21. Dai, X.; Zhou, Y.; Ma, W.; Zhou, L. Influence of spatial variation in land-use patterns and topography on water quality of the rivers inflowing to Fuxian Lake, a large deep lake in the plateau of southwestern China. Ecol. Eng. 2017, 99, 417–428. [Google Scholar] [CrossRef]
  22. Azaria, D.; Moksia, F.; Tchobsala; Pierre, K.; Tezore Bakary, P. Dynamic of land use and vegetation change in the eastern bank of Bénoué (North Cameroon). Bot. Stud. 2024, 65, 9. [Google Scholar] [CrossRef]
  23. Wu, Z.; Qian, Y. An integration method to predict the impact of urban land use change on green space connectivity under different development scenarios using a case study of Nanjing, China. Environ. Sci. Pollut. Res. Int. 2022, 29, 85243–85256. [Google Scholar] [CrossRef]
  24. Bufebo, B.; Elias, E. Land Use/Land Cover Change and Its Driving Forces in Shenkolla Watershed, South Central Ethiopia. Sci. World J. 2021, 2021, 9470918. [Google Scholar] [CrossRef]
  25. Feng, Y.; Lei, Z.; Tong, X.; Gao, C.; Chen, S.; Wang, J.; Wang, S. Spatially-explicit modeling and intensity analysis of China’s land use change 2000–2050. J. Environ. Manag. 2020, 263, 110407. [Google Scholar] [CrossRef]
  26. Li, Y.; Yen, H.; Lei, Q.; Qiu, W.; Luo, J.; Lindsey, S.; Qin, L.; Zhai, L.; Wang, H.; Wu, S.; et al. Impact of human activities on phosphorus flows on an early eutrophic plateau: A case study in Southwest China. Sci. Total Environ. 2020, 714, 136851. [Google Scholar] [CrossRef] [PubMed]
  27. Liu, S.; Dong, Y.; McConkey, K.R.; Tran, L.P.; Wang, F.; Liu, H.; Wu, G. Scientific concept and practices of life community of mountains, rivers, forests, farmlands, lakes, grasslands, and deserts in China. Ambio 2023, 52, 1939–1951. [Google Scholar] [CrossRef] [PubMed]
  28. Du, B.; Ye, S.; Gao, P.; Ren, S.; Liu, C.; Song, C. Analyzing spatial patterns and driving factors of cropland change in China’s National Protected Areas for sustainable management. Sci. Total Environ. 2024, 912, 169102. [Google Scholar] [CrossRef]
  29. Zhao, Q.; Jiang, G.; Wang, M. The Allocation Change of Rural Land Consolidation Type Structure under the Influence Factors of Different Geographical and Economic Development of China. Int. J. Environ. Res. Public Health 2023, 20, 5194. [Google Scholar] [CrossRef]
  30. Zhang, S.; Yang, P.; Xia, J.; Wang, W.; Cai, W.; Chen, N.; Hu, S.; Luo, X.; Li, J.; Zhan, C. Land use/land cover prediction and analysis of the middle reaches of the Yangtze River under different scenarios. Sci. Total Environ. 2022, 833, 155238. [Google Scholar] [CrossRef]
  31. Wang, W.; Wang, H.; Zhou, X. Forecast of policy-driven land use change and its impact on ecosystem services in China: A case study of the Yangtze River Economic Belt. Integr. Environ. Assess. Manag. 2023, 19, 1473–1484. [Google Scholar] [CrossRef]
  32. Chen, Q.; Zheng, L.; Wang, Y.; Wu, D.; Li, J. Spillover effects of urban form on urban land use efficiency: Evidence from a comparison between the Yangtze and Yellow Rivers of China. Environ. Sci. Pollut. Res. Int. 2023, 30, 125816–125831. [Google Scholar] [CrossRef]
  33. Chen, S.; Chen, Z.; Shen, Y. Can improving law enforcement effectively curb illegal land use in China? PLoS ONE 2021, 16, e0246347. [Google Scholar] [CrossRef]
  34. Li, L. Towards a protocol on fair compensation in cases of legitimate land tenure changes: Input document for a participatory process. J. Chin. Gov. 2017, 3, 124–127. [Google Scholar] [CrossRef]
  35. Feng, Y.; Yang, Q.; Tong, X.; Chen, L. Evaluating land ecological security and examining its relationships with driving factors using GIS and generalized additive model. Sci. Total Environ. 2018, 633, 1469–1479. [Google Scholar] [CrossRef]
  36. Tan, Y.; Chen, H.; Lian, K.; Yu, Z. Comprehensive Evaluation of Cultivated Land Quality at County Scale: A Case Study of Shengzhou, Zhejiang Province, China. Int. J. Environ. Res. Public Health 2020, 17, 1169. [Google Scholar] [CrossRef] [PubMed]
  37. Kalburgi, P.B.; Jha, R.; Ojha, C.S.; Deshannavar, U.B. Evaluation of re-aeration equations for river Ghataprabha, Karnataka, India and development of refined equation. Environ. Technol. 2015, 36, 79–85. [Google Scholar] [CrossRef] [PubMed]
  38. Ayele, H.S.; Atlabachew, M. Review of characterization, factors, impacts, and solutions of Lake eutrophication: Lesson for lake Tana, Ethiopia. Environ. Sci. Pollut. Res. Int. 2021, 28, 14233–14252. [Google Scholar] [CrossRef]
  39. Dong, W.; Zhang, Y.; Zhang, L.; Ma, W.; Luo, L. What will the water quality of the Yangtze River be in the future? Sci. Total Environ. 2023, 857 Pt 3, 159714. [Google Scholar] [CrossRef]
  40. Mungenge, C.P.; Wasserman, R.J.; Dondofema, F.; Keates, C.; Masina, F.M.; Dalu, T. Assessing chlorophyll-a and water quality dynamics in arid-zone temporary pan systems along a disturbance gradient. Sci. Total Environ. 2023, 873, 162272. [Google Scholar] [CrossRef]
  41. Zhou, P.; Huang, J.; Pontius, R.G., Jr.; Hong, H. New insight into the correlations between land use and water quality in a coastal watershed of China: Does point source pollution weaken it? Sci. Total Environ. 2016, 543 Pt A, 591–600. [Google Scholar] [CrossRef]
  42. Pan, W.; Wang, S.; Wang, Y.; Yu, Y.; Luo, Y. Dynamical changes of land use/land cover and their impacts on ecological quality during China’s reform periods: A case study of Quanzhou city, China. PLoS ONE 2022, 17, e0278667. [Google Scholar] [CrossRef]
  43. Cui, H.; Zhou, X.; Guo, M.; Wei, W. Land use change and its effects on water quality in typical inland lake of arid area in China. J. Environ. Biol. 2016, 37, 603–609. [Google Scholar]
  44. Pakoksung, K.; Inseeyong, N.; Chawaloesphonsiya, N.; Punyapalakul, P.; Chaiwiwatworakul, P.; Xu, M.; Chuenchum, P. Seasonal dynamics of water quality in response to land use changes in the Chi and Mun River Basins Thailand. Sci. Rep. 2025, 15, 7101. [Google Scholar] [CrossRef]
  45. Cheng, C.; Zhang, F.; Shi, J.; Kung, H.T. What is the relationship between land use and surface water quality? A review and prospects from remote sensing perspective. Environ. Sci. Pollut. Res. Int. 2022, 29, 56887–56907. [Google Scholar] [CrossRef]
  46. Piaggio, M.; Siikamäki, J. The value of forest water purification ecosystem services in Costa Rica. Sci. Total Environ. 2021, 789, 147952. [Google Scholar] [CrossRef] [PubMed]
  47. Qiu, J.; Shen, Z.; Wei, G.; Wang, G.; Xie, H.; Lv, G. A systematic assessment of watershed-scale nonpoint source pollution during rainfall-runoff events in the Miyun Reservoir watershed. Environ. Sci. Pollut. Res. Int. 2017, 25, 6514–6531. [Google Scholar] [CrossRef] [PubMed]
  48. Gavrić, S.; Leonhardt, G.; Marsalek, J.; Viklander, M. Processes improving urban stormwater quality in grass swales and filter strips: A review of research findings. Sci. Total Environ. 2019, 669, 431–447. [Google Scholar] [CrossRef]
  49. Sievers, M.; Hale, R.; Parris, K.M.; Swearer, S.E. Impacts of human-induced environmental change in wetlands on aquatic animals. Biol. Rev. Camb. Philos. Soc. 2018, 93, 529–554. [Google Scholar] [CrossRef]
  50. Shiferaw, N.; Habte, L.; Waleed, M. Land use dynamics and their impact on hydrology and water quality of a river catchment: A comprehensive analysis and future scenario. Environ. Sci. Pollut. Res. Int. 2025, 32, 4124–4136. [Google Scholar] [CrossRef]
  51. Martinez-Guerra, E.; Ghimire, U.; Nandimandalam, H.; Norris, A.; Gude, V.G. Wetlands for environmental protection. Water Environ. Res. 2020, 92, 1677–1694. [Google Scholar] [CrossRef]
  52. Yan, Z.; Li, P.; Li, Z.; Xu, Y.; Zhao, C.; Cui, Z. Effects of land use and slope on water quality at multi-spatial scales: A case study of the Weihe River Basin. Environ. Sci. Pollut. Res. Int. 2023, 30, 57599–57616. [Google Scholar] [CrossRef]
Figure 1. Geographical location map of the Xinxian River. (Numbers 1 to 14 in the figure indicate the locations of water sample collection sites).
Water 17 01541 g001
Figure 2. (a) Distribution of land use types in 2000; (b) Distribution of land use types in 2010; (c) Distribution of land use types in 2020.
Water 17 01541 g002
Figure 3. Spatial distribution of land use transitions from 2000 to 2020. ((a): Spatial distribution map of cropland transfer from 2000 to 2020; (b): Spatial distribution map of frostland transfer from 2000 to 2020; (c): Spatial distribution map of water land transfer from 2000 to 2020; (d): Spatial distribution map of built-land transfer from 2000 to 2020; (e): Spatial distribution map of grassland transfer from 2000 to 2020).
Water 17 01541 g003
Figure 4. Spatial distribution of land use in the buffer zone. ((a): Proportion of land use types within the 50-m buffer zone; (b): Proportion of land use types within the 100-m buffer zone; (c): Proportion of land use types within the 200-m buffer zone; (d): Proportion of land use types within the 400-m buffer zone; (e): Proportion of land use types within the 600-m buffer zone).
Water 17 01541 g004
Figure 5. Correlation analysis between land use and river water quality. ((a): Land use and river water quality correlation in the 50-m buffer zone; (b): Land use and river water quality correlation in the 100-m buffer zone; (c): Land use and river water quality correlation in the 200-m buffer zone; (d): Land use and river water quality correlation in the 400-m buffer zone; (e): Land use and river water quality correlation in the 600-m buffer zone).
Water 17 01541 g005
Figure 6. Distribution of explanation rates.
Water 17 01541 g006
Table 1. Water quality testing methods and standards.
Water Quality IndicatorsDetection MethodsImplementation Standards
TNAlkaline potassium persulfate digestion UV spectrophotometryHJ 636-2012 [16]
TPMolybdate spectrophotometryGB 11893-89 [17]
NH3-NNessler’s reagent spectrophotometryHJ 535-2009 [18]
CODMnDetermination of permanganate indexGB 11892-89 [19]
Chl-aSpectrophotometryHJ 897-2017 [20]
Table 2. Dynamics of land use change.
Type of Land Use2000201020202000~20102010~20202000~2020
Ratio
(%)
Ratio
(%)
Ratio
(%)
KKK
Grassland0.0730.0750.0710.256−0.591−0.175
Cropland61.259.158.4−0.345−0.116−0.228
Built-up land2.994.146.093.8344.6975.166
Forestland32.133.531.90.430−0.462−0.027
Water body3.593.183.48−1.1650.961−0.157
Total100100100
Table 3. Land use conversion rate.
20002020
GrasslandCroplandBuilt-Up LandForestlandWater BodyTotal
GrasslandTransfer rate (%)46.1029.1017.207.000.60100
CroplandTransfer rate (%)0.0290.075.023.910.98100
Built-up landTransfer rate (%)0.000.3096.200.003.50100
ForestlandTransfer rate (%)0.077.790.4091.740.00100
Water bodyTransfer rate (%)0.0821.440.380.8077.30100
Table 4. Monitoring points and surrounding conditions.
Monitoring PointsMonitoring Point CoordinatesSurrounding ConditionsMain Pollution Sources
R130.210955° N115.991872° EFarmland and villagesGround source pollution
R230.143537° N115.960534° EFarmland and villagesGround source pollution
R330.156726° N115.931034° EFarmland and villagesRural domestic sewage
R430.168153° N115.868749° EFarmland and vegetable fieldsAgricultural pollution
R530.164087° N115.963161° EVillages and vegetable fieldsRural domestic sewage
R630.089987° N115.968701° EVillages, roads and pondsLivestock and Poultry Farming
R730.163456° N115.923303° EVillages, forests and farmlandsLivestock and Poultry Farming
R830.137921° N115.900476° EFarmlandAgricultural pollution
R930.125004° N115.930469° ETowns and farmlandUrban domestic sewage
R1030.086437° N115.958231° EUrban areas and roadsUrban domestic sewage
R1130.069171° N115.952148° EUrban areas and roadsUrban domestic sewage
R1230.058221° N115.948246° EVillages and farmlandAgricultural pollution
R1330.039928° N115.949029° EVillages and farmlandAgricultural pollution
R1430.008812° N115.961683° EFarmland and fish pondsFishery wastewater
Table 5. Spatial distribution table of water quality data.
Monitoring PointsTN
(mg/L)
TP
(mg/L)
NH3-N
(mg/L)
CODMn
(mg/L)
Chl-a
(mg/m3)
DO
(mg/L)
UpstreamR10.560.0420.083.64.29.6
R40.450.0280.062.83.810.6
R50.750.0560.113.84.68.8
R70.680.0520.184.23.29.2
MidstreamR20.720.0600.165.12.87.2
R30.810.0620.216.26.26.8
R60.960.0720.285.65.27.6
R81.060.0780.366.86.87.8
R91.120.0860.427.17.25.9
R101.460.0980.647.88.26.1
R111.940.1270.7310.212.24.6
DownstreamR121.460.1020.588.211.45.2
R131.360.0940.497.67.45.6
R141.420.0920.485.98.66.3
Disclaimer/Publisher’s Note: The statements, opinions and data contained in all publications are solely those of the individual author(s) and contributor(s) and not of MDPI and/or the editor(s). MDPI and/or the editor(s) disclaim responsibility for any injury to people or property resulting from any ideas, methods, instructions or products referred to in the content.

