

Photocatalytic Degradation of Trichloroethylene Under Different Environmental Conditions: Kinetics and Carbon Isotope Effects


Abstract
1. Introduction
2. Materials and Methods
2.1. Materials
2.2. Experiments of Photocatalytic Degradation of TCE
2.3. Analytical Methods
2.4. Calculation of Isotope Enrichment Factor (ε)
3. Results and Discussion
3.1. Kinetic Effects of Environmental Conditions on TCE Photocatalytic Degradation
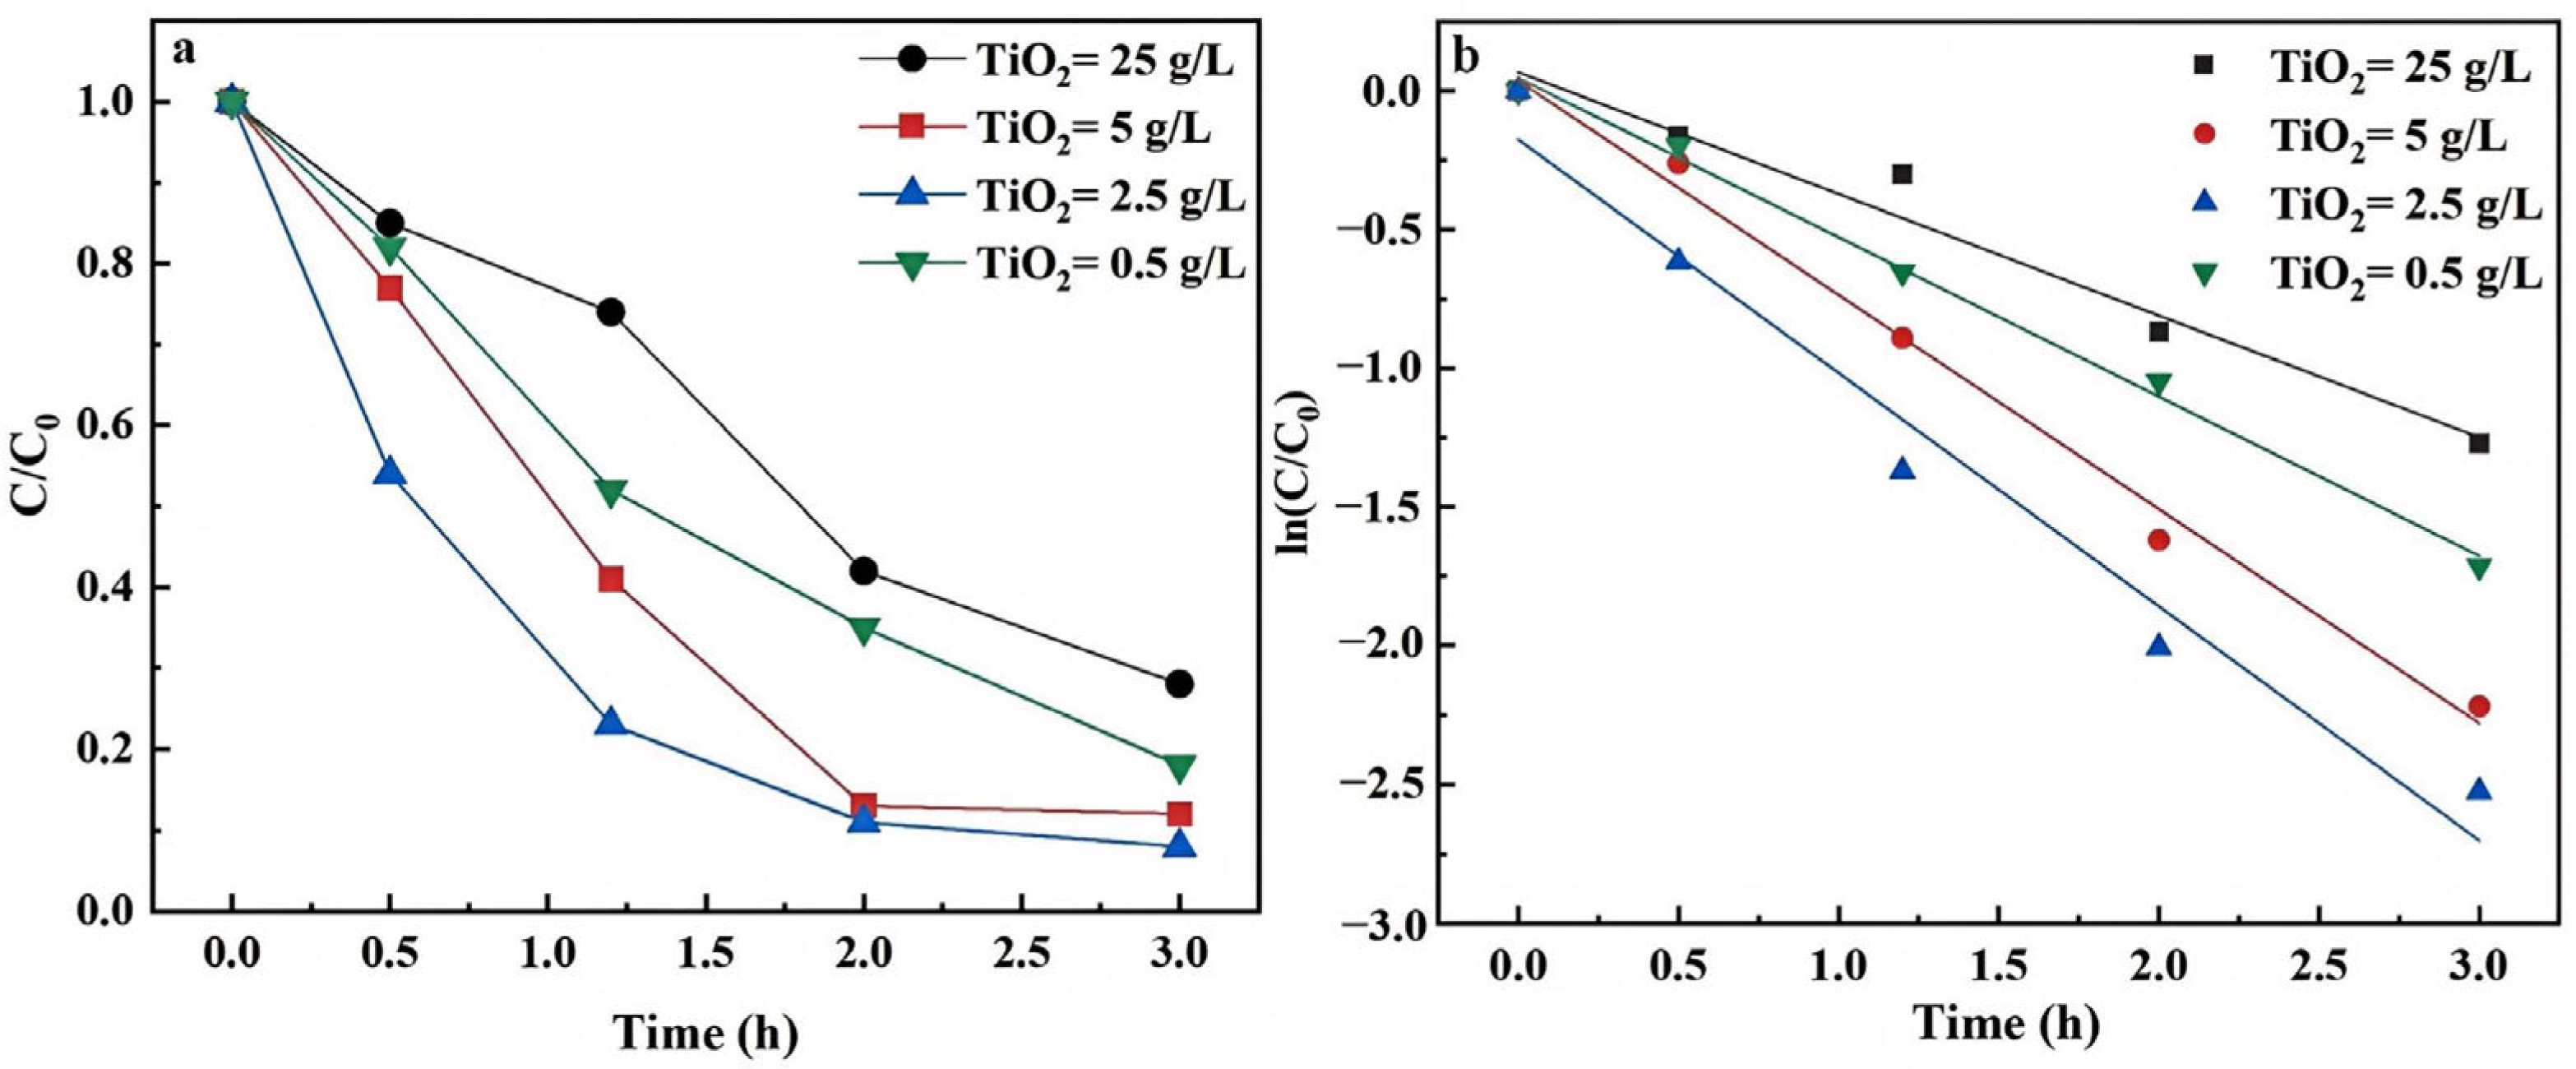
3.1.1. Catalyst Dosage and Types
3.1.2. TCE Concentrations
3.1.3. O2
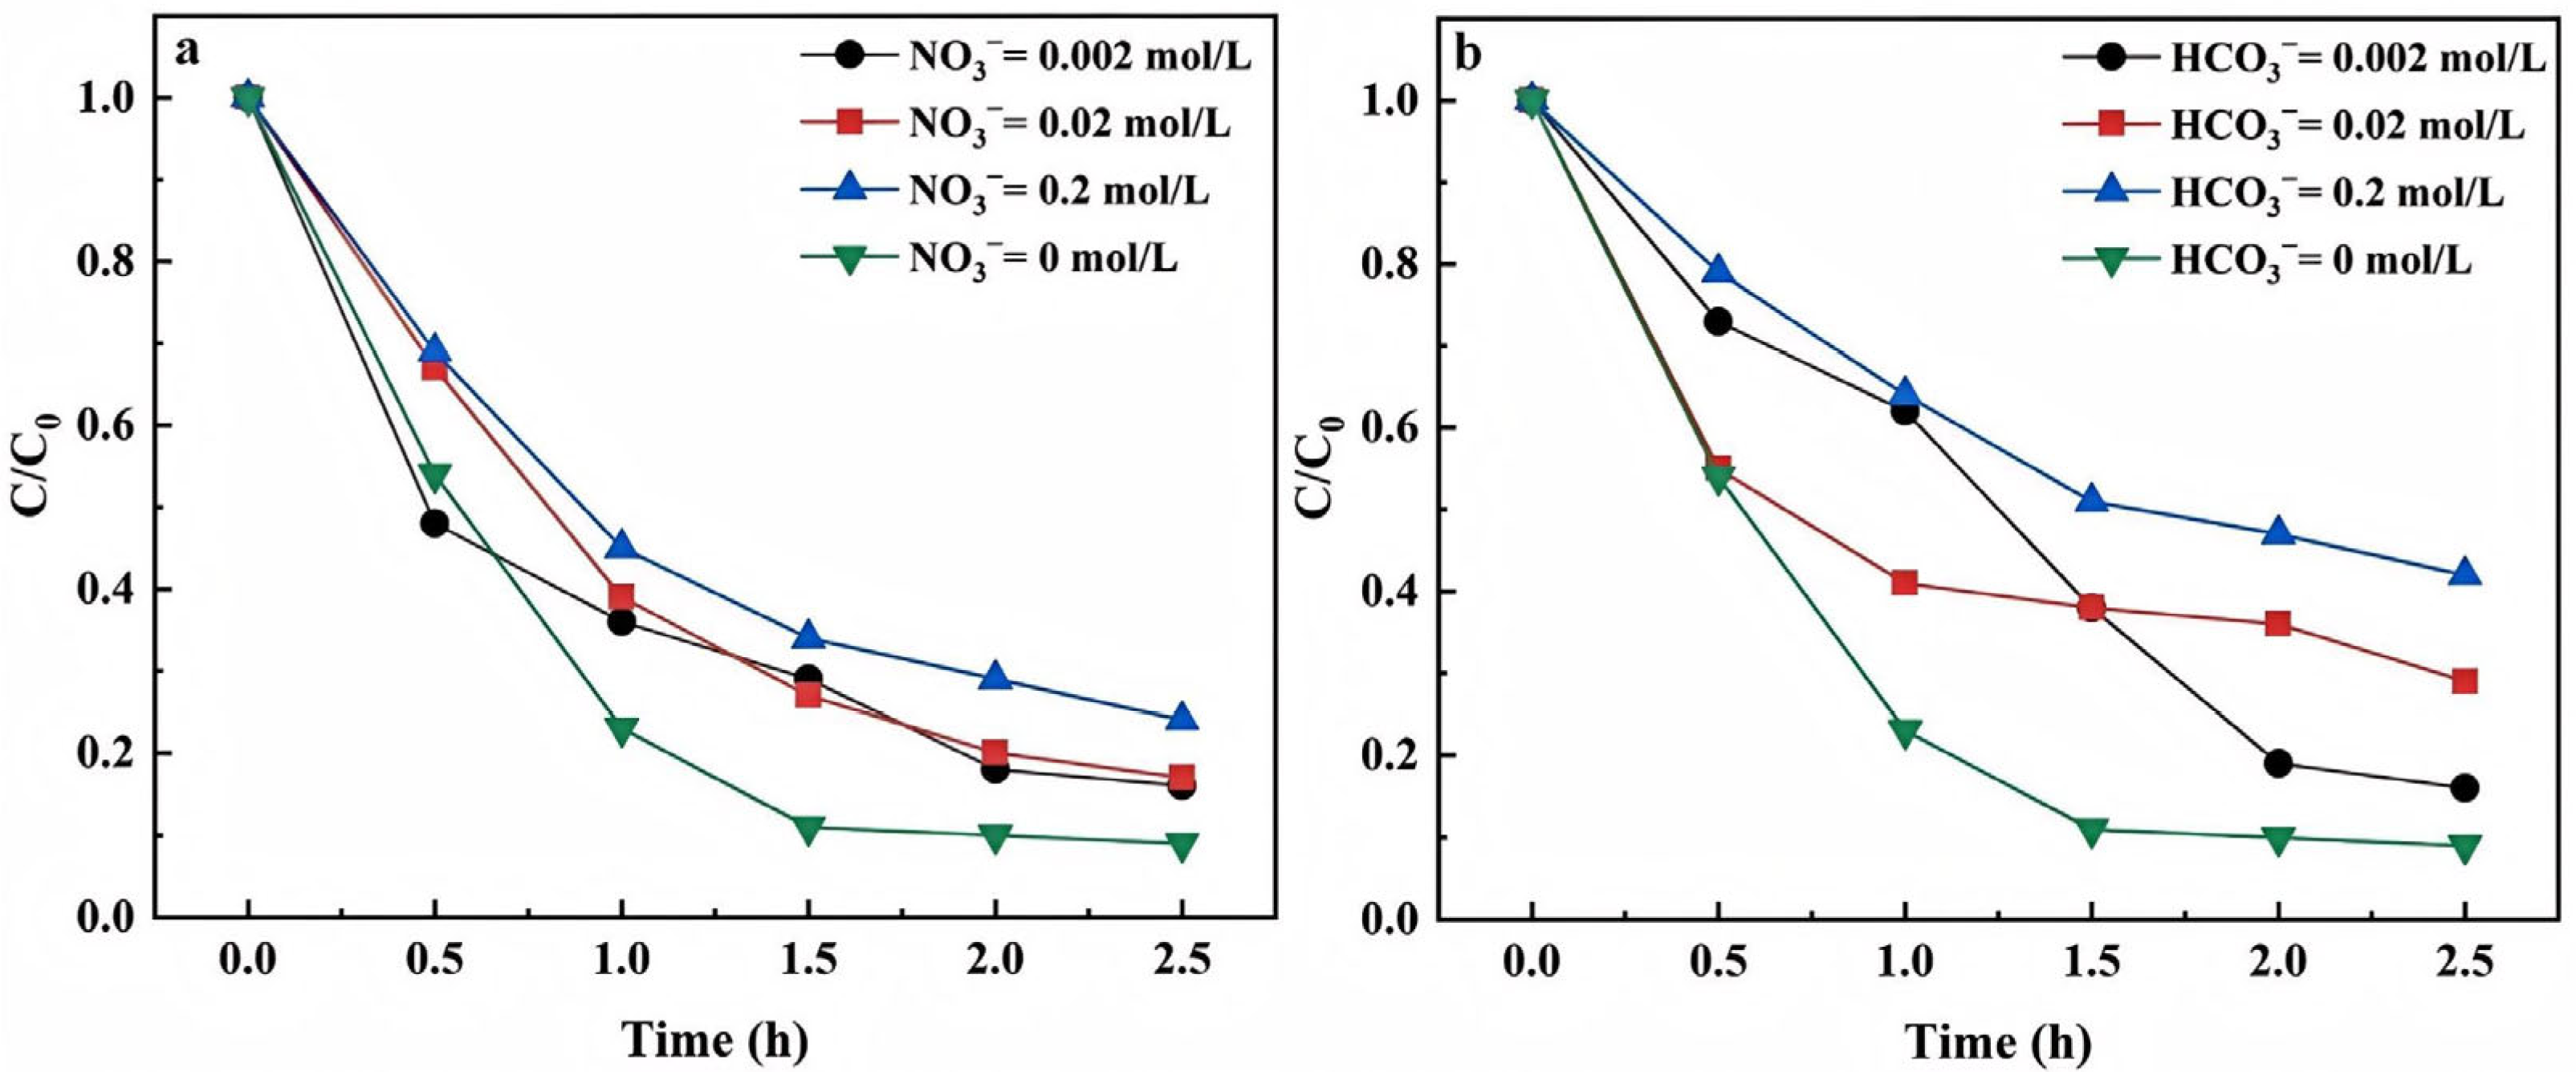
3.1.4. Concentrations of Anions
- NO3− Concentrations
- HCO3− concentrations
3.1.5. Cation Types
3.2. Isotope Effects of Environmental Conditions on Photocatalytic Degradation of TCE
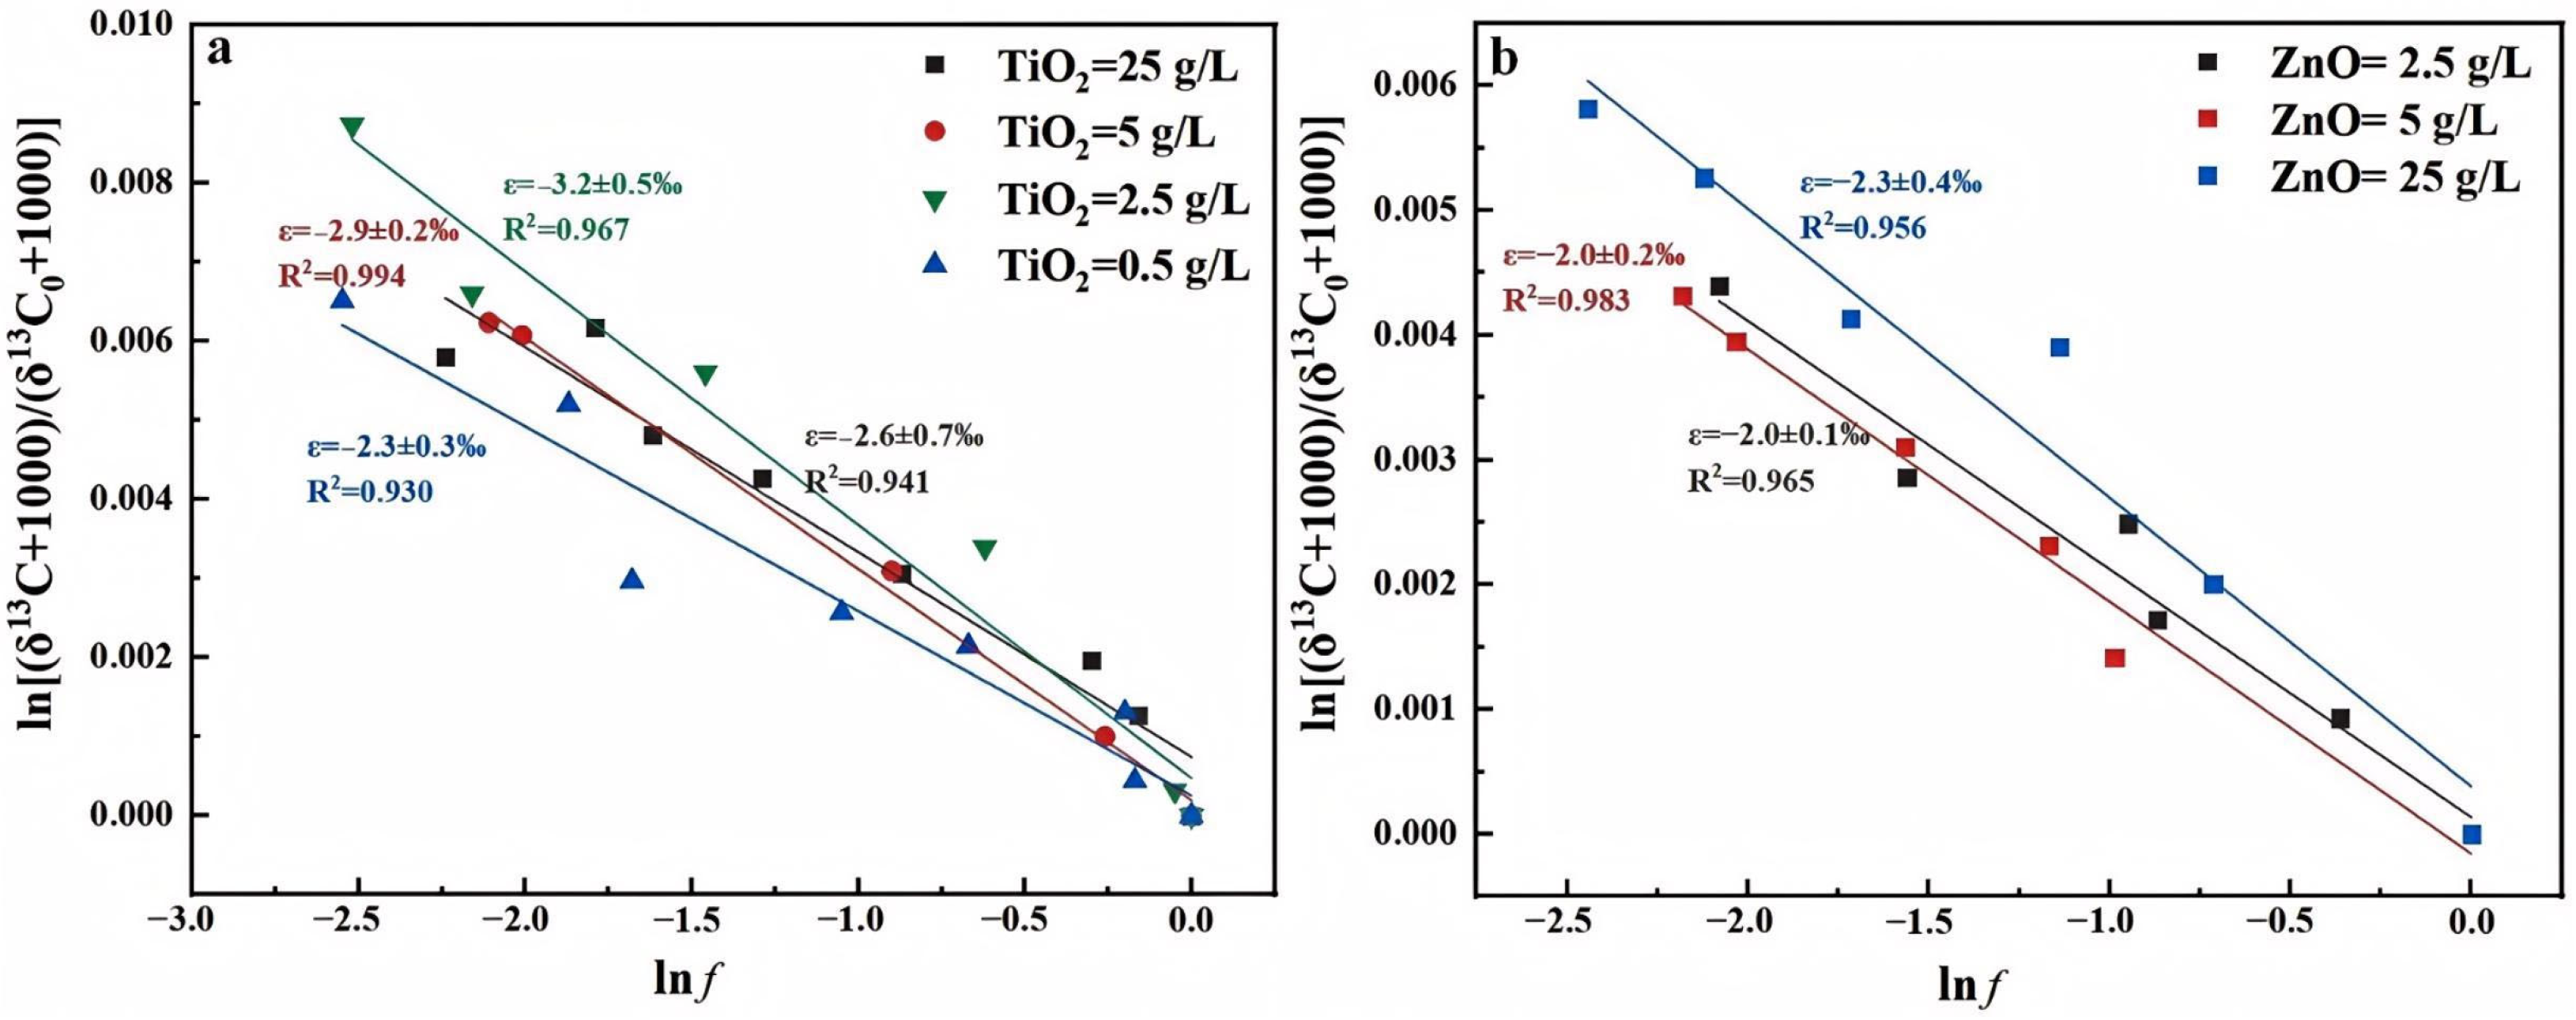
3.2.1. Catalyst Dosage and Types
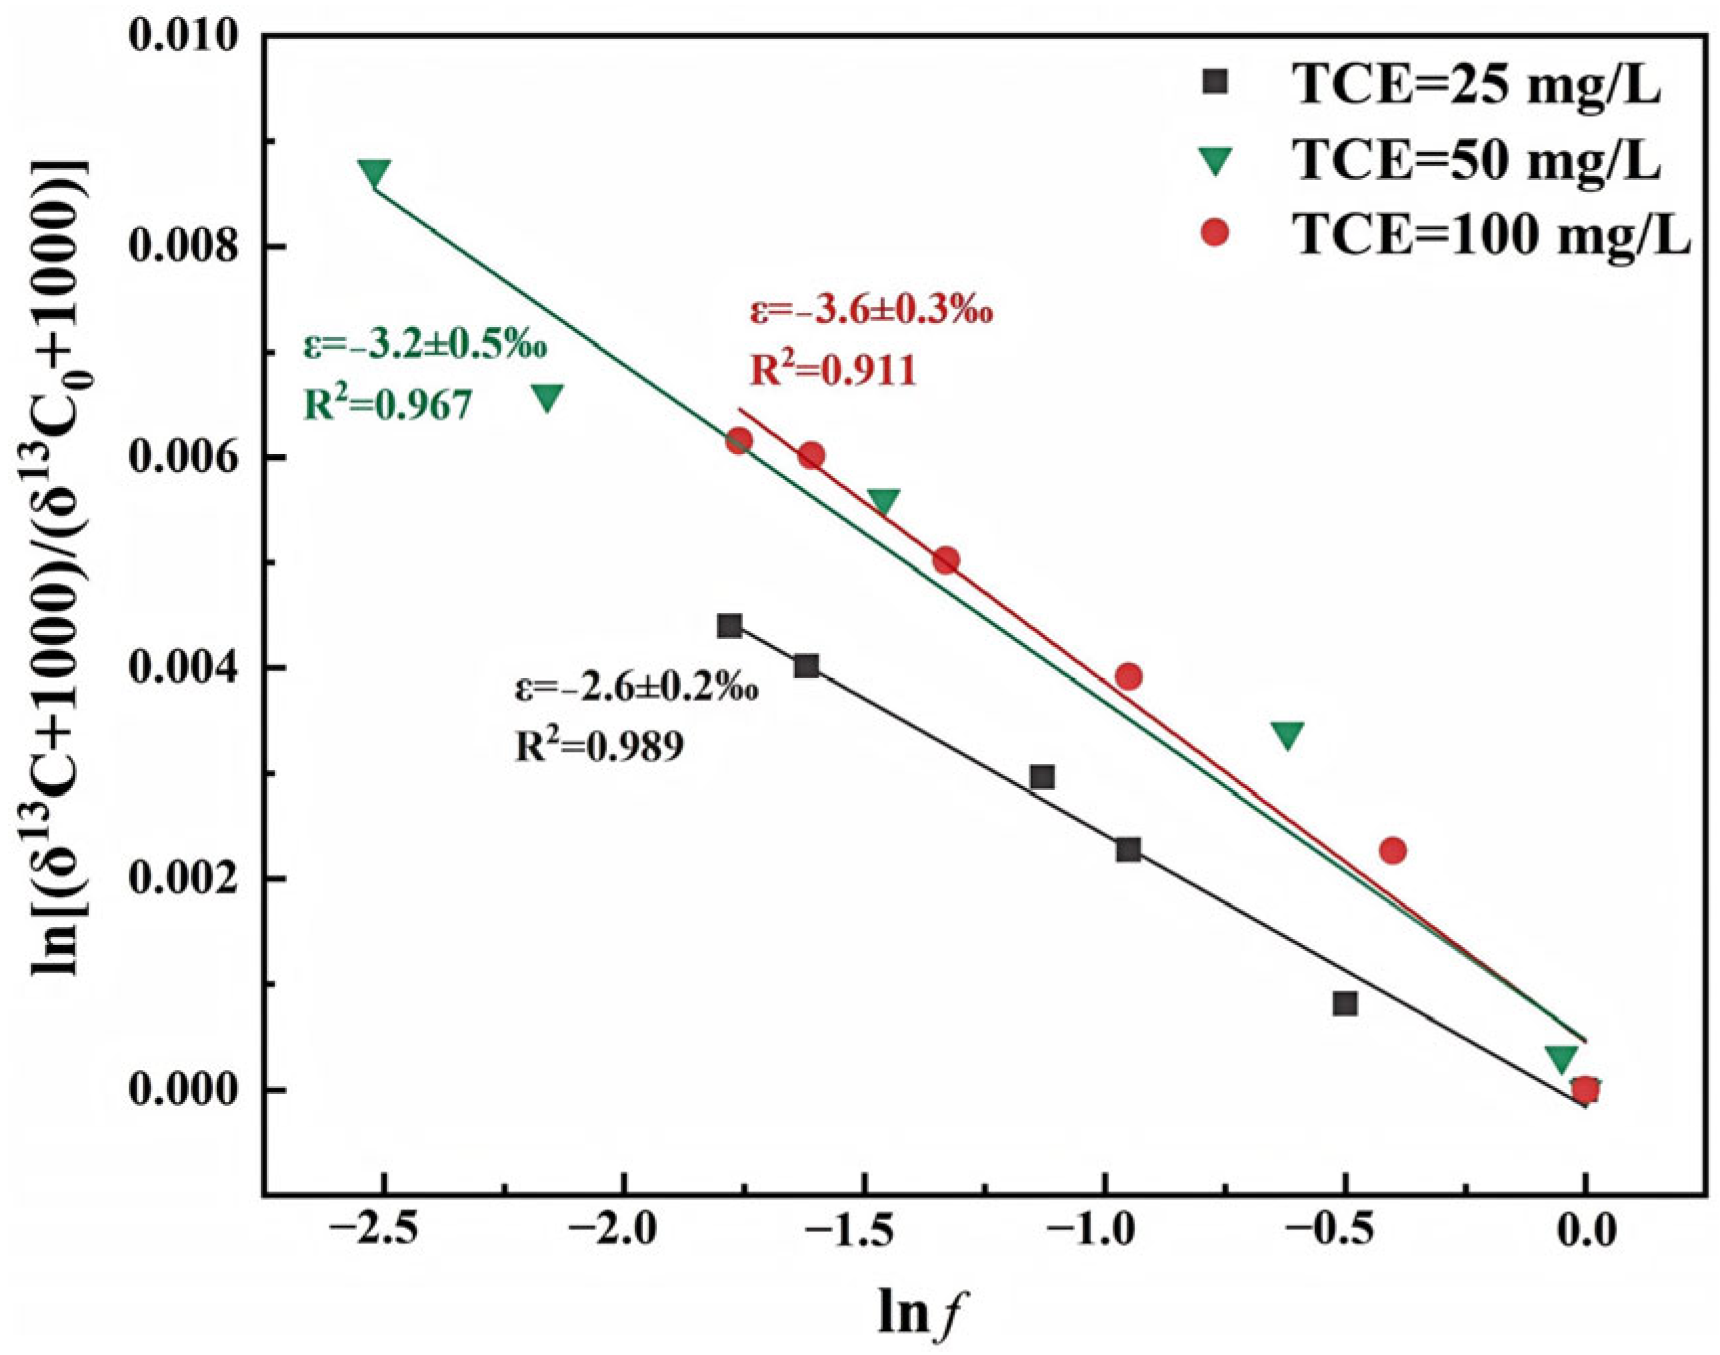
3.2.2. TCE Concentrations
3.2.3. O2
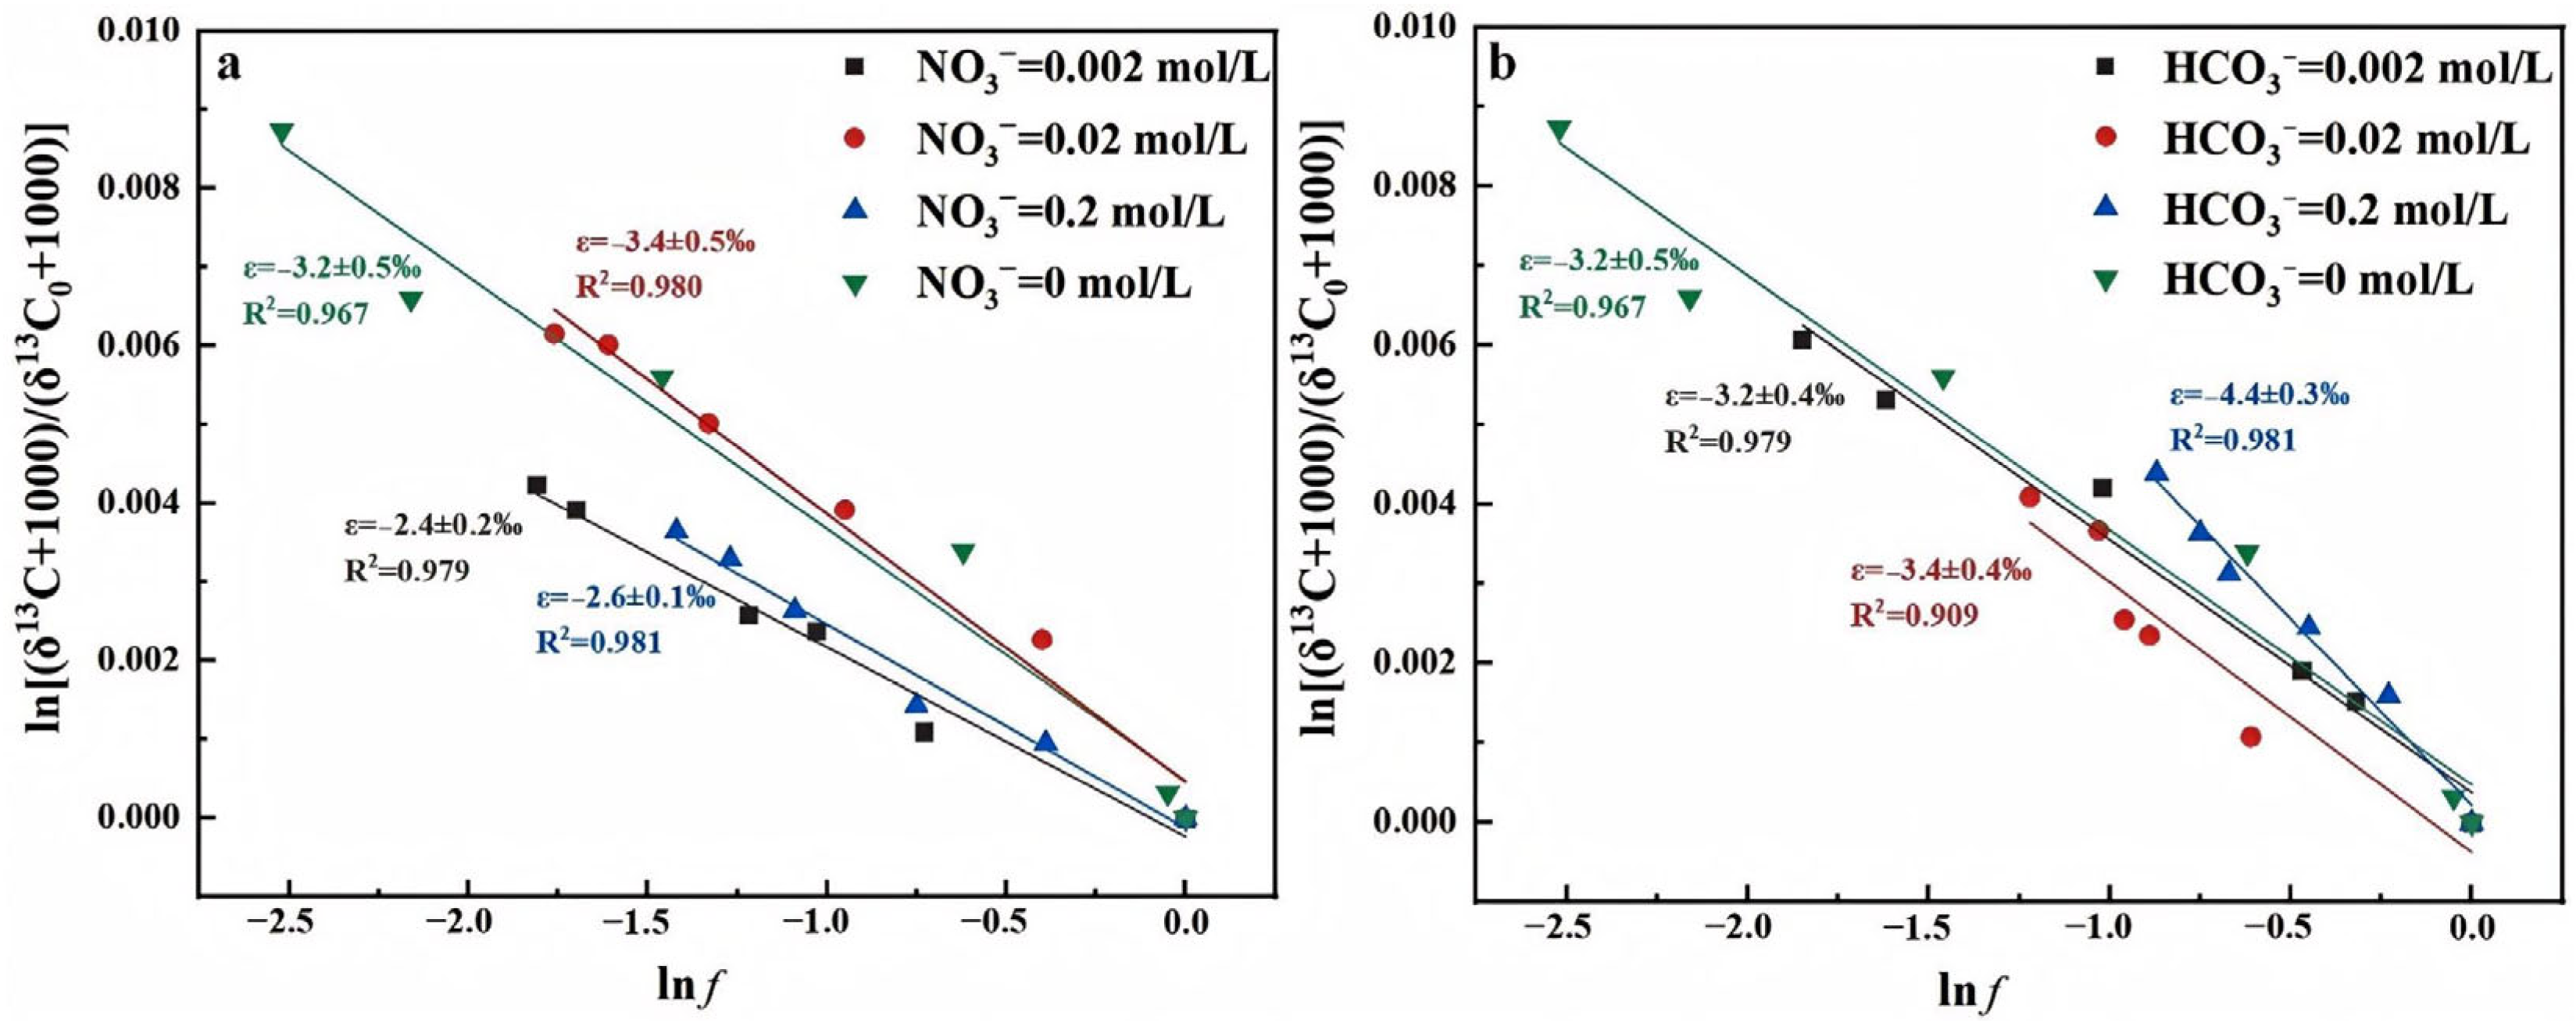
3.2.4. Concentrations of Anions
- NO3− Concentrations
- HCO3− Concentrations
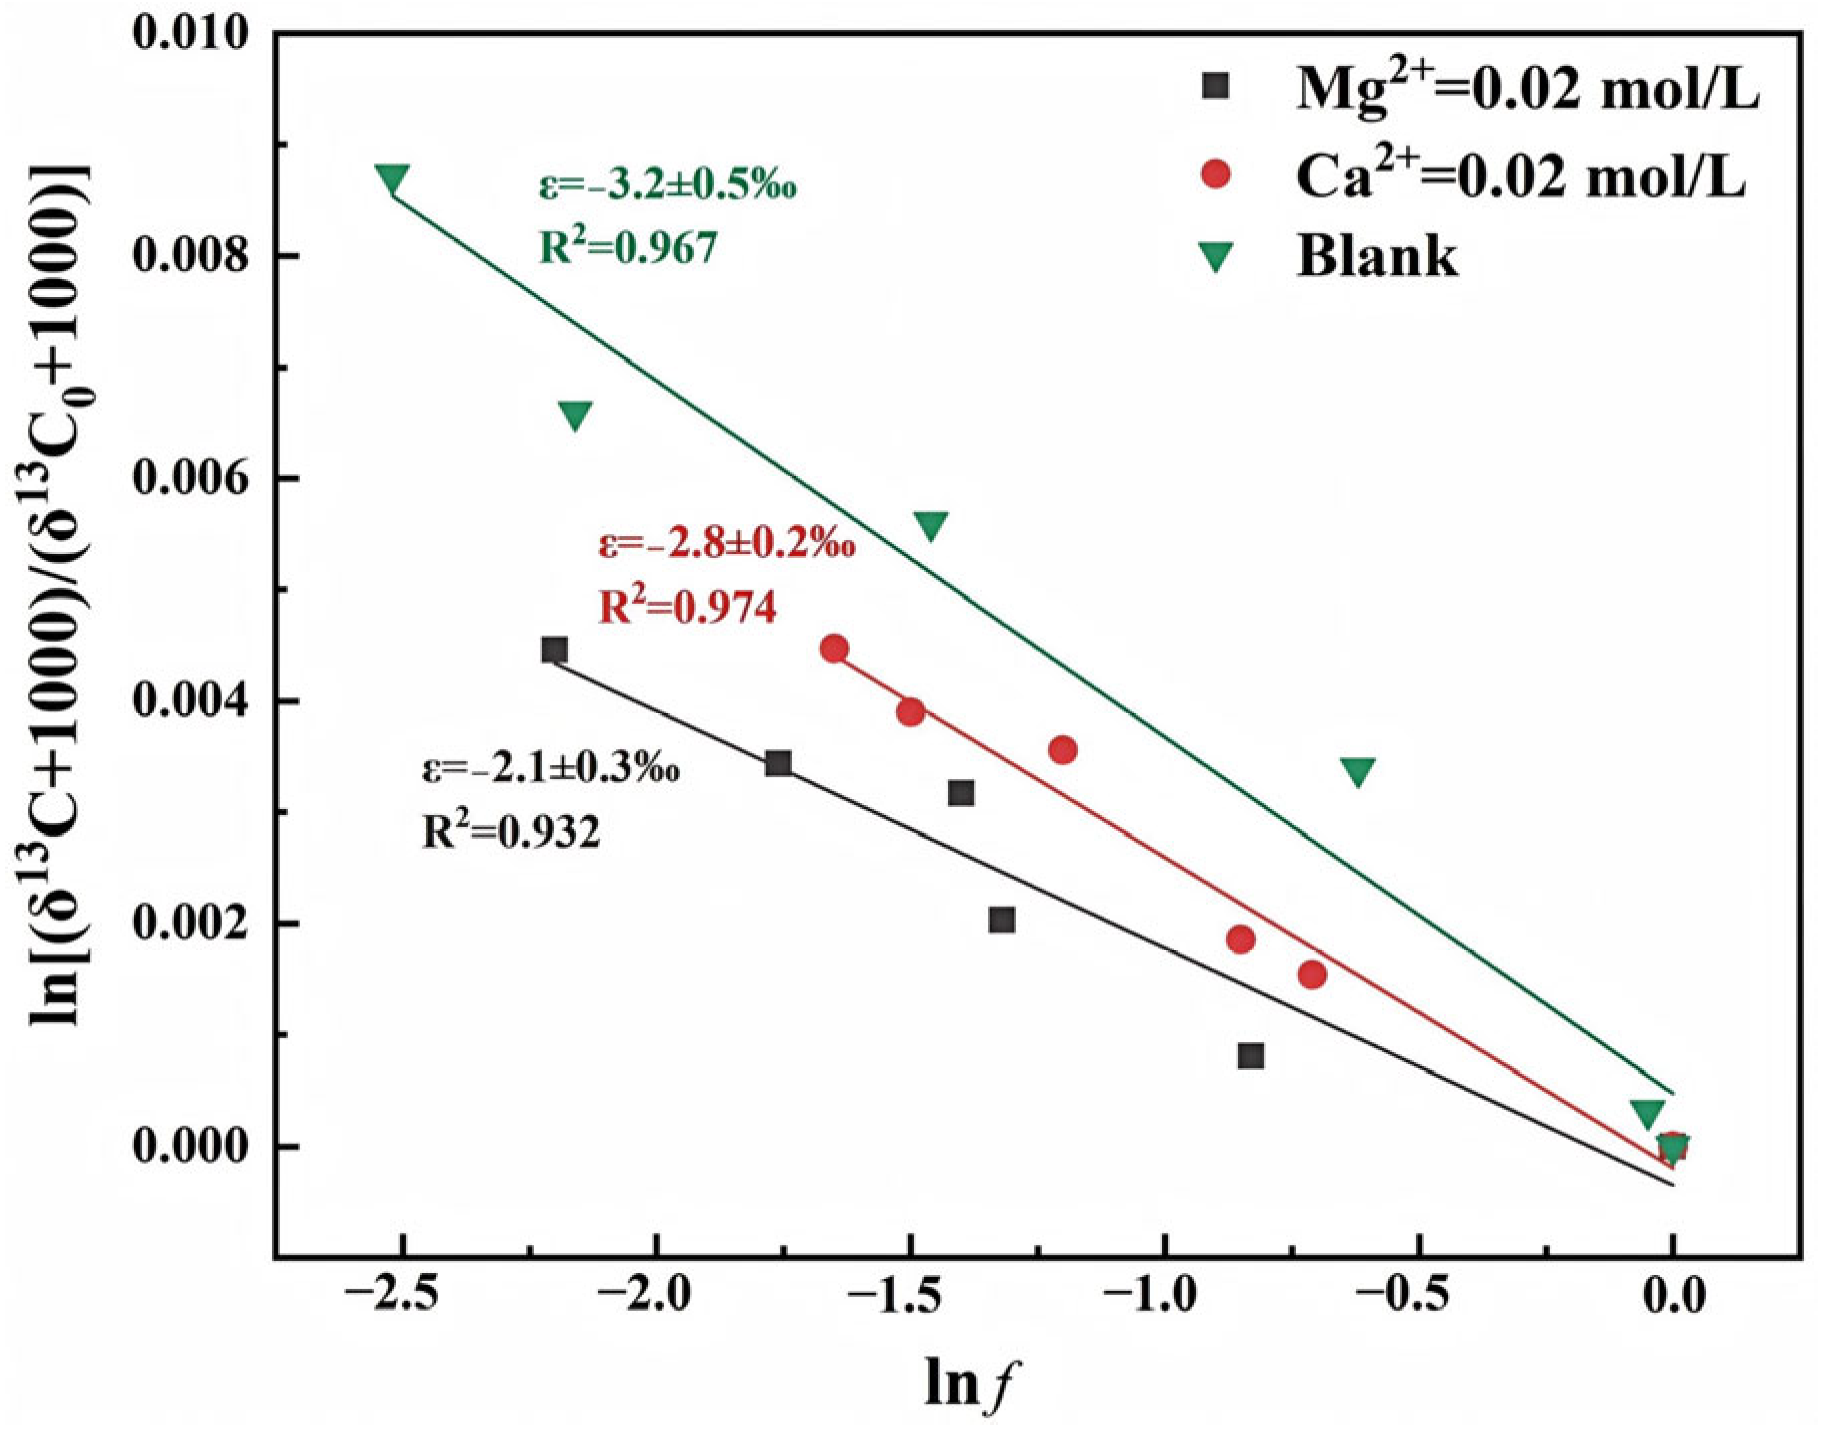
3.2.5. Cation Types
4. Conclusions
Author Contributions
Funding
Data Availability Statement
Acknowledgments
Conflicts of Interest
References
- Zhu, L.; Jia, X.; Xie, H.; Zhang, J.; Zhu, Q. Trichloroethylene exposure, multi-organ injury, and potential mechanisms: A narrative review. Sci. Total Environ. 2024, 946, 174029. [Google Scholar] [CrossRef] [PubMed]
- Huang, B.; Lei, C.; Wei, C.; Zeng, G. Chlorinated volatile organic compounds (Cl-VOCs) in environment—Sources, potential human health impacts, and current remediation technologies. Environ. Int. 2014, 71, 118–138. [Google Scholar] [CrossRef] [PubMed]
- Moran, M.J.; Zogorski, J.S.; Squillace, P.J. Chlorinated Solvents in Groundwater of the United States. Environ. Sci. Technol. 2007, 41, 74–81. [Google Scholar] [CrossRef]
- Weerasooriya, R.; Dharmasena, B. Pyrite-assisted degradation of trichloroethene (TCE). Chemosphere 2001, 42, 389–396. [Google Scholar] [CrossRef] [PubMed]
- Wu, X.; Gu, X.; Lu, S.; Xu, M.; Zang, X.; Miao, Z.; Qiu, Z.; Sui, Q. Degradation of trichloroethylene in aqueous solution by persulfate activated with citric acid chelated ferrous ion. Chem. Eng. J. 2014, 255, 585–592. [Google Scholar] [CrossRef]
- Siegel Scott, C.; Jinot, J. Trichloroethylene and Cancer: Systematic and Quantitative Review of Epidemiologic Evidence for Identifying Hazards. Int. J. Environ. Res. Public Health 2011, 8, 4238–4271. [Google Scholar] [CrossRef]
- Elkin, E.R.; Harris, S.M.; Su, A.L.; Lash, L.H.; Loch-Caruso, R. Placenta as a target of trichloroethylene toxicity. Environ. Sci. Process. Impacts 2020, 22, 472–486. [Google Scholar] [CrossRef]
- Kim, J.O. Gaseous TCE and PCE removal by an activated carbon biofilter. Bioprocess Eng. 1997, 16, 331–337. [Google Scholar] [CrossRef]
- Russell, H.H.; Matthews, J.E.; Sewell, G.W. TCE removal from contaminated soil and ground water 1. In Epa Environmental Engineering Sourcebook; CRC Press: Boca Raton, FL, USA, 2019; pp. 87–99. [Google Scholar]
- Erto, A.; Andreozzi, R.; Lancia, A.; Musmarra, D. Factors affecting the adsorption of trichloroethylene onto activated carbons. Appl. Surf. Sci. 2010, 256, 5237–5242. [Google Scholar] [CrossRef]
- Wen, L.-L.; Zhang, Y.; Chen, J.-X.; Zhang, Z.-X.; Yi, Y.-Y.; Tang, Y.; Rittmann, B.E.; Zhao, H.-P. The dechlorination of TCE by a perchlorate reducing consortium. Chem. Eng. J. 2017, 313, 1215–1221. [Google Scholar] [CrossRef]
- Liang, S.H.; Chen, K.F.; Wu, C.S.; Lin, Y.H.; Kao, C.M. Development of KMnO4-releasing composites for in situ chemical oxidation of TCE-contaminated groundwater. Water Res. 2014, 54, 149–158. [Google Scholar] [CrossRef] [PubMed]
- Loomer, D.B.; Al, T.A.; Banks, V.J.; Parker, B.L.; Mayer, K.U. Manganese Valence in Oxides Formed from in Situ Chemical Oxidation of TCE by KMnO4. Environ. Sci. Technol. 2010, 44, 5934–5939. [Google Scholar] [CrossRef] [PubMed]
- Tsai, T.T.; Kao, C.M.; Surampalli Rao, Y.; Weng, C.H.; Liang, S.H. Treatment of TCE-Contaminated Groundwater Using Fenton-Like Oxidation Activated with Basic Oxygen Furnace Slag. J. Environ. Eng. 2010, 136, 288–294. [Google Scholar] [CrossRef]
- Huang, B.; Isse, A.A.; Durante, C.; Wei, C.; Gennaro, A. Electrocatalytic properties of transition metals toward reductive dechlorination of polychloroethanes. Electrochim. Acta 2012, 70, 50–61. [Google Scholar] [CrossRef]
- Strycharz, S.; Newman, L. Use of Native Plants for Remediation of Trichloroethylene: II. Coniferous Trees. Int. J. Phytoremediation 2009, 11, 171–186. [Google Scholar] [CrossRef]
- Brar, S.K.; Gupta, S.K. Biodegradation of trichloroethylene in a rotating biological contactor. Water Res. 2000, 34, 4207–4214. [Google Scholar] [CrossRef]
- Kocamemi, B.A.; Çeçen, F. Biological removal of the xenobiotic trichloroethylene (TCE) through cometabolism in nitrifying systems. Bioresour. Technol. 2010, 101, 430–433. [Google Scholar] [CrossRef]
- Wang, H.; Li, X.; Zhao, X.; Li, C.; Song, X.; Zhang, P.; Huo, P.; Li, X. A review on heterogeneous photocatalysis for environmental remediation: From semiconductors to modification strategies. Chin. J. Catal. 2022, 43, 178–214. [Google Scholar] [CrossRef]
- Chen, D.; Cheng, Y.; Zhou, N.; Chen, P.; Wang, Y.; Li, K.; Huo, S.; Cheng, P.; Peng, P.; Zhang, R.; et al. Photocatalytic degradation of organic pollutants using TiO2-based photocatalysts: A review. J. Clean. Prod. 2020, 268, 121725. [Google Scholar] [CrossRef]
- AlMohamadi, H.; Awad, S.A.; Sharma, A.K.; Fayzullaev, N.; Távara-Aponte, A.; Chiguala-Contreras, L.; Amari, A.; Rodriguez-Benites, C.; Tahoon, M.A.; Esmaeili, H. Photocatalytic Activity of Metal- and Non-Metal-Anchored ZnO and TiO2 Nanocatalysts for Advanced Photocatalysis: Comparative Study. Catalysts 2024, 14, 420. [Google Scholar] [CrossRef]
- Fawzi Suleiman Khasawneh, O.; Palaniandy, P. Removal of organic pollutants from water by Fe2O3/TiO2 based photocatalytic degradation: A review. Environ. Technol. Innov. 2021, 21, 101230. [Google Scholar] [CrossRef]
- Dong, C.; Fang, W.; Yi, Q.; Zhang, J. A comprehensive review on reactive oxygen species (ROS) in advanced oxidation processes (AOPs). Chemosphere 2022, 308, 136205. [Google Scholar] [CrossRef]
- Li, K.; Stefan, M.I.; Crittenden, J.C. UV Photolysis of Trichloroethylene: Product Study and Kinetic Modeling. Environ. Sci. Technol. 2004, 38, 6685–6693. [Google Scholar] [CrossRef] [PubMed]
- Seleš, P.; Vengust, D.; Radošević, T.; Kocijan, M.; Einfalt, L.; Kurtjak, M.; Shvalya, V.; Knaflič, T.; Bernik, S.; Omerzu, A.; et al. Altering defect population during the solvothermal growth of ZnO nanorods for photocatalytic applications. Ceram. Int. 2024, 50, 26819–26828. [Google Scholar] [CrossRef]
- Pasang, T.; Namratha, K.; Parvin, T.; Ranganathaiah, C.; Byrappa, K. Tuning of band gap in TiO2 and ZnO nanoparticles by selective doping for photocatalytic applications. Mater. Res. Innov. 2015, 19, 73–80. [Google Scholar] [CrossRef]
- Thullner, M.; Centler, F.; Richnow, H.-H.; Fischer, A. Quantification of organic pollutant degradation in contaminated aquifers using compound specific stable isotope analysis—Review of recent developments. Org. Geochem. 2012, 42, 1440–1460. [Google Scholar] [CrossRef]
- Palau, J.; Jamin, P.; Badin, A.; Vanhecke, N.; Haerens, B.; Brouyère, S.; Hunkeler, D. Use of dual carbon–chlorine isotope analysis to assess the degradation pathways of 1,1,1-trichloroethane in groundwater. Water Res. 2016, 92, 235–243. [Google Scholar] [CrossRef]
- Elsner, M.; Couloume, G.L.; Mancini, S.; Burns, L.; Lollar, B.S. Carbon Isotope Analysis to Evaluate Nanoscale Fe(O) Treatment at a Chlorohydrocarbon Contaminated Site. Groundw. Monit. Remediat. 2010, 30, 79–95. [Google Scholar] [CrossRef]
- Nijenhuis, I.; Nikolausz, M.; Köth, A.; Felföldi, T.; Weiss, H.; Drangmeister, J.; Großmann, J.; Kästner, M.; Richnow, H.-H. Assessment of the natural attenuation of chlorinated ethenes in an anaerobic contaminated aquifer in the Bitterfeld/Wolfen area using stable isotope techniques, microcosm studies and molecular biomarkers. Chemosphere 2007, 67, 300–311. [Google Scholar] [CrossRef]
- Coplen, T.B.; Brand, W.A.; Gehre, M.; Groning, M.; Meijer, H.A.; Toman, B.; Verkouteren, R.M. Guest Editorial After two decades a second anchor for the VPDB d 13 C scale y. Rapid Commun. Mass Spectrom. 2006, 20, 3165–3166. [Google Scholar] [CrossRef]
- Julien, M.; Gilbert, A.; Yamada, K.; Robins, R.J.; Höhener, P.; Yoshida, N.; Remaud, G.S. Expanded uncertainty associated with determination of isotope enrichment factors: Comparison of two point calculation and Rayleigh-plot. Talanta 2018, 176, 367–373. [Google Scholar] [CrossRef] [PubMed]
- Liu, Y.; Zhou, A.; Gan, Y.; Li, X. Variability in carbon isotope fractionation of trichloroethene during degradation by persulfate activated with zero-valent iron: Effects of inorganic anions. Sci. Total Environ. 2016, 548–549, 1–5. [Google Scholar] [CrossRef]
- Liu, Y.; Zhou, A.; Gan, Y.; Li, X. Effects of inorganic anions on carbon isotope fractionation during Fenton-like degradation of trichloroethene. J. Hazard. Mater. 2016, 308, 187–191. [Google Scholar] [CrossRef] [PubMed]
- Min, N.; Yao, J.; Li, H.; Zhu, J.; Kümmel, S.; Schaefer, T.; Herrmann, H.; Richnow, H.H. Carbon isotope fractionation of di-(2-ethylhexyl)-phthalate during photosensitized degradation by •OH and SO4− for characterization of reaction mechanisms. Chem. Eng. J. 2023, 475, 145950. [Google Scholar] [CrossRef]
- Zhang, Y.; Zhou, A.; Xu, J.; Ouyang, Z.; Han, L.; Liu, Y. Using compound-specific isotope analysis to identify the mechanism of acetochlor degradation during oxygenation of hyporheic zone sediment. Environ. Pollut. 2024, 340, 122855. [Google Scholar] [CrossRef]
- Liu, W.; Yang, Q.; Wang, Z.; Lv, X.; Yang, Z. Photocatalytic degradation of trichloroethylene over BiOCl under UV irradiation. Appl. Organomet. Chem. 2018, 32, e4354. [Google Scholar] [CrossRef]
- Bamiduro, G.J.; Zahran, E.M. Pd@Bi2Ru2O7/BiVO4 Z-Scheme Heterojunction Nanocomposite Photocatalyst for the Degradation of Trichloroethylene. ACS Appl. Mater. Interfaces 2023, 15, 59337–59347. [Google Scholar] [CrossRef] [PubMed]
- Liu, Y.; Zhou, A.; Gan, Y.; Li, X. Roles of hydroxyl and sulfate radicals in degradation of trichloroethene by persulfate activated with Fe2+ and zero-valent iron: Insights from carbon isotope fractionation. J.Hazard. Mater 2018, 344, 98–103. [Google Scholar] [CrossRef]
- Liu, Y.; Zhou, A.; Gan, Y.; Liu, C.; Yu, T.; Li, X. Stable carbon isotope fractionation during trichloroethene degradation in magnetite-catalyzed Fenton-like reaction. J. Contam. Hydrol. 2013, 145, 37–43. [Google Scholar] [CrossRef]
- Slater, G.F.; Dempster, H.S.; Sherwood Lollar, B.; Ahad, J. Headspace analysis: A new application for isotopic characterization of dissolved organic contaminants. Environ. Sci. Technol. 1999, 33, 190–194. [Google Scholar] [CrossRef]
- Hmoudah, M.; Paparo, R.; Chianese, C.; El-Qanni, A.; Salmi, T.; Tesser, R.; Di Serio, M. Ibuprofen photodegradation promoted by ZnO and TiO2–P25 nanoparticles: A comprehensive kinetic, reaction mechanisms, and thermodynamic investigation. Water Process Eng. 2025, 69, 106598. [Google Scholar] [CrossRef]
- Gnanaprakasam, A.; Sivakumar, V.M.; Sivayogavalli, P.L.; Thirumarimurugan, M. Characterization of TiO2 and ZnO nanoparticles and their applications in photocatalytic degradation of azodyes. Ecotoxicol. Environ. Saf. 2015, 121, 121–125. [Google Scholar] [CrossRef] [PubMed]
- Tolosana-Moranchel, A.; Pecharromán, C.; Faraldos, M.; Bahamonde, A. Strong effect of light scattering by distribution of TiO2 particle aggregates on photocatalytic efficiency in aqueous suspensions. Chem. Eng. J. 2021, 403, 126186. [Google Scholar] [CrossRef]
- Tekbaş, M.; Yatmaz, H.C.; Bektaş, N. Heterogeneous photo–Fenton oxidation of reactive azo dye solutions using iron exchanged zeolite as a catalyst. Micropor. Mesopor. 2008, 115, 594–602. [Google Scholar] [CrossRef]
- Buxton, G.V.; Greenstock, C.L.; Helman, W.P.; Ross, A.B. Critical Review of rate constants for reactions of hydrated electrons, hydrogen atoms and hydroxyl radicals (•OH/•O−) in Aqueous Solution. Mater. Res. Innov. 1988, 7, 513–886. [Google Scholar] [CrossRef]
- Siedlecka, E.M.; Więckowska, A.; Stepnowski, P. Influence of inorganic ions on MTBE degradation by Fenton’s reagent. J. Hazard. Mater. 2007, 147, 497–502. [Google Scholar] [CrossRef]
- Shah, N.S.; He, X.; Khan, H.M.; Khan, J.A.; O’Shea, K.E.; Boccelli, D.L.; Dionysiou, D.D. Dionysiou, Efficient removal of endosulfan from aqueous solution by UV–C/peroxides: A comparative study. J. Hazard. Mater 2013, 263 Pt 2, 584–592. [Google Scholar] [CrossRef]
- Cherchi, A.; Da Pelo, S.; Ibba, A.; Mana, D.; Buosi, C.; Floris, N. Benthic foraminifera response and geochemical characterization of the coastal environment surrounding the polluted industrial area of Portovesme (South-Western Sardinia, Italy). Mar. Pollut. Bull. 2009, 59, 281–296. [Google Scholar] [CrossRef]
- Al-Ahmadi, M.E. Hydrochemical characterization of groundwater in wadi Sayyah, Western Saudi Arabia. Appl. Water Sci. 2013, 3, 721–732. [Google Scholar] [CrossRef]
- Wang, S.-Z.; Wang, J.-L. Radiation–induced degradation of sulfamethoxazole in the presence of various inorganic anions. Chem. Eng. J. 2018, 351, 688–696. [Google Scholar] [CrossRef]
- Wang, J.; Wang, S. Effect of inorganic anions on the performance of advanced oxidation processes for degradation of organic contaminants. Chem. Eng. J. 2021, 411, 128392. [Google Scholar] [CrossRef]
- Neta, P.; Huie, R.E.; Ross, A.B. Rate constants for reactions of inorganic radicals in aqueous solution. J. Phys. Chem. Ref. Data 1988, 17, 1027–1284. [Google Scholar] [CrossRef]
- Thomas, K.; Volz-Thomas, A.; Mihelcic, D.; Smit, H.G.; Kley, D. On the exchange of NO 3 radicals with aqueous solutions: Solubility and sticking coefficient. J. Atmos. Chem. 1998, 29, 17–43. [Google Scholar] [CrossRef]
- Xu, H.; Hao, Z.; Feng, W.; Wang, T.; Li, Y. Mechanism of Photodegradation of Organic Pollutants in Seawater by TiO2-Based Photocatalysts and Improvement in Their Performance. ACS Omega 2021, 6, 30698–30707. [Google Scholar] [CrossRef]
- Lair, A.; Ferronato, C.; Chovelon, J.-M.; Herrmann, J.-M. Naphthalene degradation in water by heterogeneous photocatalysis: An investigation of the influence of inorganic anions. J. Photochem. Photobiol. A Chem. 2008, 193, 193–203. [Google Scholar] [CrossRef]
- Dunphy Guzman, K.A.; Finnegan, M.P.; Banfield, J.F. Influence of Surface Potential on Aggregation and Transport of Titania Nanoparticles. Environ. Sci. Technol. 2006, 40, 7688–7693. [Google Scholar] [CrossRef]
- Autin, O.; Hart, J.; Jarvis, P.; MacAdam, J.; Parsons, S.A.; Jefferson, B. The impact of background organic matter and alkalinity on the degradation of the pesticide metaldehyde by two advanced oxidation processes: UV/H2O2 and UV/TiO2. Water Res. 2013, 47, 2041–2049. [Google Scholar] [CrossRef] [PubMed]
- Poulson, S.R.; Chikaraishi, Y.; Naraoka, H. Carbon isotope fractionation of monoaromatic hydrocarbons and chlorinated ethylenes during oxidation by Fenton’s reagent. Geochim. Cosmochim. Acta Suppl. 2003, 67, 382. [Google Scholar]
- Zwank, L.; Elsner, M.; Aeberhard, A.; Schwarzenbach, R.P.; Haderlein, S.B. Carbon isotope fractionation in the reductive dehalogenation of carbon tetrachloride at iron (hydr) oxide and iron sulfide minerals. Environ. Sci. Technol. 2005, 39, 5634–5641. [Google Scholar] [CrossRef]
- Chen, G.; Hoag, G.E.; Chedda, P.; Nadim, F.; Woody, B.A.; Dobbs, G.M. The mechanism and applicability of in situ oxidation of trichloroethylene with Fenton’s reagent. J. Hazard. Mater. 2001, 87, 171–186. [Google Scholar] [CrossRef]
- Glaze, W.H.; Kenneke, J.F.; Ferry, J.L. Chlorinated byproducts from the titanium oxide-mediated photodegradation of trichloroethylene and tetrachloroethylene in water. Environ. Sci. Technol. 1993, 27, 177–184. [Google Scholar] [CrossRef]
- Hunkeler, D.; Aravena, R.; Parker, B.L.; Cherry, J.A.; Diao, X. Monitoring Oxidation of Chlorinated Ethenes by Permanganate in Groundwater Using Stable Isotopes: Laboratory and Field Studies. Environ. Sci. Technol. 2003, 37, 798–804. [Google Scholar] [CrossRef] [PubMed]
- Poulson, S.R.; Naraoka, H. Carbon Isotope Fractionation during Permanganate Oxidation of Chlorinated Ethylenes (cDCE, TCE, PCE). Environ. Sci. Technol. 2002, 36, 3270–3274. [Google Scholar] [CrossRef]
- Schüth, C.; Bill, M.; Barth, J.A.C.; Slater, G.F.; Kalin, R.M. Carbon isotope fractionation during reductive dechlorination of TCE in batch experiments with iron samples from reactive barriers. J. Contam. Hydrol. 2003, 66, 25–37. [Google Scholar] [CrossRef]
- Dayan, H.; Abrajano, T.; Sturchio, N.; Winsor, L. Carbon isotopic fractionation during reductive dehalogenation of chlorinated ethenes by metallic iron. Org. Geochem. 1999, 30, 755–763. [Google Scholar] [CrossRef]
- Audí-Miró, C.; Cretnik, S.; Otero, N.; Palau, J.; Shouakar-Stash, O.; Soler, A.; Elsner, M. Cl and C isotope analysis to assess the effectiveness of chlorinated ethene degradation by zero-valent iron: Evidence from dual element and product isotope values. Appl. Geochem. 2013, 32, 175–183. [Google Scholar] [CrossRef]
- Lojkasek-Lima, P.; Aravena, R.; Shouakar-Stash, O.; Frape, S.K.; Marchesi, M.; Fiorenza, S.; Vogan, J. Evaluating TCE abiotic and biotic degradation pathways in a permeable reactive barrier using compound specific isotope analysis. Groundw. Monit. Remediat. 2012, 32, 53–62. [Google Scholar] [CrossRef]
- Yan, Y.E.; Schwartz, F.W. Kinetics and Mechanisms for TCE Oxidation by Permanganate. Environ. Sci. Technol. 2000, 34, 2535–2541. [Google Scholar] [CrossRef]
- Liang, X.-M.; Dong, Y.-R.; Kuder, T.; Krumholz, L.R.; Philp, R.P.; Butler, E.C. Distinguishing Abiotic and Biotic Transformation of Tetrachloroethylene and Trichloroethylene by Stable Carbon Isotope Fractionation. Environ. Sci. Technol. 2007, 41, 7094–7100. [Google Scholar] [CrossRef]
- Gafni, A.; Lihl, C.; Gelman, F.; Elsner, M.; Bernstein, A. δ13C and δ37Cl Isotope Fractionation To Characterize Aerobic vs Anaerobic Degradation of Trichloroethylene. Environ. Sci. Technol. Lett. 2018, 5, 202–208. [Google Scholar] [CrossRef]
- Gafni, A.; Gelman, F.; Ronen, Z.; Bernstein, A. Variable carbon and chlorine isotope fractionation in TCE co-metabolic oxidation. Chemosphere 2020, 242, 125130. [Google Scholar] [CrossRef] [PubMed]


Disclaimer/Publisher’s Note: The statements, opinions and data contained in all publications are solely those of the individual author(s) and contributor(s) and not of MDPI and/or the editor(s). MDPI and/or the editor(s) disclaim responsibility for any injury to people or property resulting from any ideas, methods, instructions or products referred to in the content. |
© 2025 by the authors. Licensee MDPI, Basel, Switzerland. This article is an open access article distributed under the terms and conditions of the Creative Commons Attribution (CC BY) license (https://creativecommons.org/licenses/by/4.0/).
Share and Cite
Wang, Y.; Dong, Y.; Xing, L.; Guan, Y.; Liu, C. Photocatalytic Degradation of Trichloroethylene Under Different Environmental Conditions: Kinetics and Carbon Isotope Effects. Water 2025, 17, 1533. https://doi.org/10.3390/w17101533
Wang Y, Dong Y, Xing L, Guan Y, Liu C. Photocatalytic Degradation of Trichloroethylene Under Different Environmental Conditions: Kinetics and Carbon Isotope Effects. Water. 2025; 17(10):1533. https://doi.org/10.3390/w17101533
Chicago/Turabian StyleWang, Yufeng, Yaqiong Dong, Lantian Xing, Yuanxiao Guan, and Changjie Liu. 2025. "Photocatalytic Degradation of Trichloroethylene Under Different Environmental Conditions: Kinetics and Carbon Isotope Effects" Water 17, no. 10: 1533. https://doi.org/10.3390/w17101533
APA StyleWang, Y., Dong, Y., Xing, L., Guan, Y., & Liu, C. (2025). Photocatalytic Degradation of Trichloroethylene Under Different Environmental Conditions: Kinetics and Carbon Isotope Effects. Water, 17(10), 1533. https://doi.org/10.3390/w17101533