Article

Asymmetric Impacts of Urbanization on Extreme Hourly Precipitation Across the Yangtze River Delta Urban Agglomeration During 1978–2012

by
Xiaomeng Song
1,*,
Jinjiang Wei
1,
Jiachen Qi
1,2,
Jianyun Zhang
3,4,5 and
Xiaojun Wang
3,4,*
1
School of Resources and Geosciences, China University of Mining and Technology, Xuzhou 221116, China
2
Wujin District Water Resources Bureau, Changzhou 213161, China
3
National Key Laboratory of Water Disaster Prevention, Nanjing Hydraulic Research Institute, Nanjing 210029, China
4
Research Center of Climate Change, Ministry of Water Resources, Nanjing 210029, China
5
Yangtze Institute for Conservation and Development, Nanjing 210096, China
*
Authors to whom correspondence should be addressed.
Water 2025, 17(10), 1531; https://doi.org/10.3390/w17101531
Submission received: 2 April 2025 / Revised: 11 May 2025 / Accepted: 16 May 2025 / Published: 19 May 2025
(This article belongs to the Special Issue Analysis of Extreme Precipitation Under Climate Change)

Abstract

:
Significant progress has been made in understanding how extreme precipitation responds to climate warming across various time scales. However, the impact of urbanization on these events remains unclear. This study aims to thoroughly examine the effects of urbanization on extreme hourly precipitation (EHP) and its spatial heterogeneity based on dynamic station classification methods and various EHP indices using high-resolution records of hourly precipitation in the Yangtze River Delta (YRD) urban agglomeration. We also explore how urbanization has contributed to changes in extreme precipitation and the associated uncertainties. The results indicate an overall increase in all EHP indices across the YRD, with significant increases being more pronounced in urban areas. Furthermore, the changes in the EHP correlate positively with urbanization, showing greater increases at higher levels of urbanization. While the impact of urbanization on the EHP changes cannot be overlooked, its contribution appears relatively limited, with the contributions being less than 50%. The effects of urbanization on precipitation changes are predominantly positive, with noticeable spatial heterogeneity for different sub-regions and temporal variations during various stages or levels of urbanization. Moreover, urbanization effects and contributions are influenced by the urban–rural classification methods, especially regarding their contributions.

1. Introduction

In the past decades, we have witnessed a concerning rise in global warming [1,2], accompanied by a significant escalation in human activities, particularly in rapid urbanization on the Earth, with the rate of the global urbanization population increasing from 30% to 55% during 1950–2018 [3]. These factors have brought substantial changes in the frequency, intensity, and scale of global hydrometeorological extreme events [4,5], which substantially affect human society and ecosystems [6,7] and have become a hotspot issue in the fields of global climate change and water sciences [8,9]. For example, the patterns of extreme precipitation across the globe have changed significantly, with clear regional variations [10]; that is, the changes are not uniform in space and vary by region with various amplitudes [11,12]. Despite advances in understanding the changes in precipitation extremes at daily or longer scales according to the sixth report of the Intergovernmental Panel on Climate Change (IPCC), there is very low confidence regarding changes in short-duration extreme precipitation, which can lead to dangerous flash flooding and pose a threat to life, infrastructure, and the landscape [5]. Therefore, it is crucial to fully understand the changes in extreme precipitation at various spatial and temporal scales, especially in short durations and at high resolutions, for regional sustainable development.
Urbanization is a complex human–nature process [13] characterized by converting natural to artificial surfaces and a boom in urban population [14]. Urbanization forms urban canopy layers of buildings; changes local land cover; modifies the radiation, thermal, and dynamic characteristics of the underlying surface [15,16,17]; and makes the land cover in urban areas quite different from the surrounding areas [18]. These changes result in unique urban climates at micro to regional scales [19], making urban areas sensitive and vulnerable to climate change. Thus, with continued global warming, the hydrologic cycle intensifies and urban dwellings’ densification results in more extreme weather and climate events in urban areas [20]. At present, many previous studies have indicated that extreme precipitation is increasing in urban areas worldwide on both daily and sub-daily time scales [21,22,23,24]. This trend exhibits higher magnitudes compared to the surrounding areas, as evidenced by historical observations and numerical simulations [15,25,26]. Moreover, the impact of urbanization on extreme precipitation varies in different regions [27], due to factors such as the size [28], shape [29], and geographical context [16] of cities, as well as the background climate [30,31]. For example, Miao et al. [32] found in a case study of Beijing that the city plays an important role in the movement of storms and precipitation, and the change in precipitation is related to the degree of urbanization. Song et al. [33] used precipitation observation data from 1950 to 2012 to analyze the temporal trend and spatial distribution of precipitation in Beijing and found that the precipitation decreased significantly. Yang et al. [17] revealed differences in exposure to extreme precipitation among global urban areas and studied the urban development patterns contributing to these changes. Nevertheless, the physical mechanisms by which urbanization affects precipitation are still poorly understood and controversial [34] due to the complexity of the hydrological cycle, limited observational data, and uncertainties of numerical simulations [20]. Therefore, it is essential to examine the impact of urbanization on extreme precipitation in various conditions, particularly in urban agglomerations comprising multiple cities with varying levels of urbanization.
Generally, statistical analysis based on the observation records from the ground gauges is the simplest method to determine the effect of urbanization on precipitation changes. However, its limitations are also apparent, such as the lack of long-term and high-resolution precipitation observed records and the selection criteria of urban and paired rural stations [35,36]. Observation stations should be categorized as either urban or rural based on objective criteria [37,38,39]. Thus, many classification methods were proposed to identify the urban and rural stations based on the built-up area, land use, population, and night-time light. In addition, due to different methods for dividing urban and rural stations, the results will also be deviations [40]. Besides, due to rapid urbanization, many rural stations became enveloped by expanding urban areas within a short period, and climate records (e.g., precipitation, temperature, etc.) at these stations are increasingly influenced by urbanization [41], meaning that the contribution of urbanization effects may be underestimated based on the static classification of urban/rural stations [42]. Therefore, it is crucial to dynamically categorize the stations to reduce the uncertainties in measuring the impact of urbanization on extreme precipitation.
China has undergone rapid urbanization since the economic reforms and opening up in 1978, leading to the development of metropolitan areas and urban agglomerations such as the Yangtze River Delta (YRD), Beijing–Tianjin–Hebei (BTH), and Pearl River Delta (PRD). During the past decades, the YRD has grown to be one of the most rapidly urbanized and densely populated metropolitan agglomerations in the world [15], with 11% of China’s population and generating 25% of its gross domestic product [43]. The YRD lies in the lower reaches of the Yangtze River, bordered by the Yellow Sea and the East China Sea. Its unique topographical features and subtropical marine monsoon climate contribute to an intricate network of rivers, elevating the risk of flooding. The rapid urbanization in the region profoundly impacts the local hydrological environment and water cycle, particularly for precipitation changes. For example, Zeng et al. [44] explored the evolution characteristics of the precipitation in the YRD and found that the precipitation displayed the inter-annual, interdecadal, as well as longer quasiperiodic changes over a century; Han et al. [45] investigated the changing properties of daily scale precipitation extremes in the YRD during 1957–2013 and detected a significant increase in precipitation extremes characterized by a larger increasing magnitude in heavy rain days and amounts for these big cities of Shanghai, Nanjing, Hangzhou, and Ningbo. Xie et al. [43] analyzed how extreme precipitation of varying durations responds to urbanization in the YRD and highlighted that shorter, intense rainfall events appear to be closely associated with urban areas.
In summary, many studies have suggested that rapid urbanization alters extreme precipitation patterns in both time and space across three areas at daily or sub-daily scales [15,20,41,46,47,48]. Despite these findings, most studies have primarily focused on the effects of urbanization on extreme precipitation at the region-averaged or single-city scales, leaving the spatial heterogeneity of urbanization’s contribution to changes in extreme precipitation under different conditions largely unexplored. Moreover, existing studies with statistical methods primarily use static classification of urban/rural stations based on different indicators without considering dynamic changes from rural/suburban to suburban/urban areas under rapid urbanization. In addition, compared with daily precipitation, short-term extreme precipitation can better reflect the detailed characteristics of short-term heavy rain [15] due to its short duration, large precipitation intensity, small occurrence probability, and high-risk coefficient [49,50]. Recent studies highlighted that extreme precipitation is more intense and frequent in urban than rural areas at the hourly than daily scale [51,52].
Therefore, this study aims to answer two key questions: (1) how urbanization affects extreme hourly precipitation (EHP) characteristics across the YRD urban agglomeration, and (2) whether urban effects on precipitation extremes differ under different stages of urbanization. Here we seek to unravel the impacts of urbanization on the EHP and their spatial heterogeneity using the dynamic station classification methods and high-resolution short-duration precipitation records in the YRD urban agglomeration. Thus, in this work, we first defined the EHP indices to describe the characteristics of precipitation extremes across the YRD and categorized the meteorological stations into urbanized, urbanizing, and rural stations based on different data sources. Subsequently, we examined the urban–rural differences at various types of stations throughout different urbanization levels and stages to assess how urbanization contributes to the EHP. Finally, we explored the effects of urbanization on the EHP in different sub-regions and their uncertainties.

2. Materials and Methods
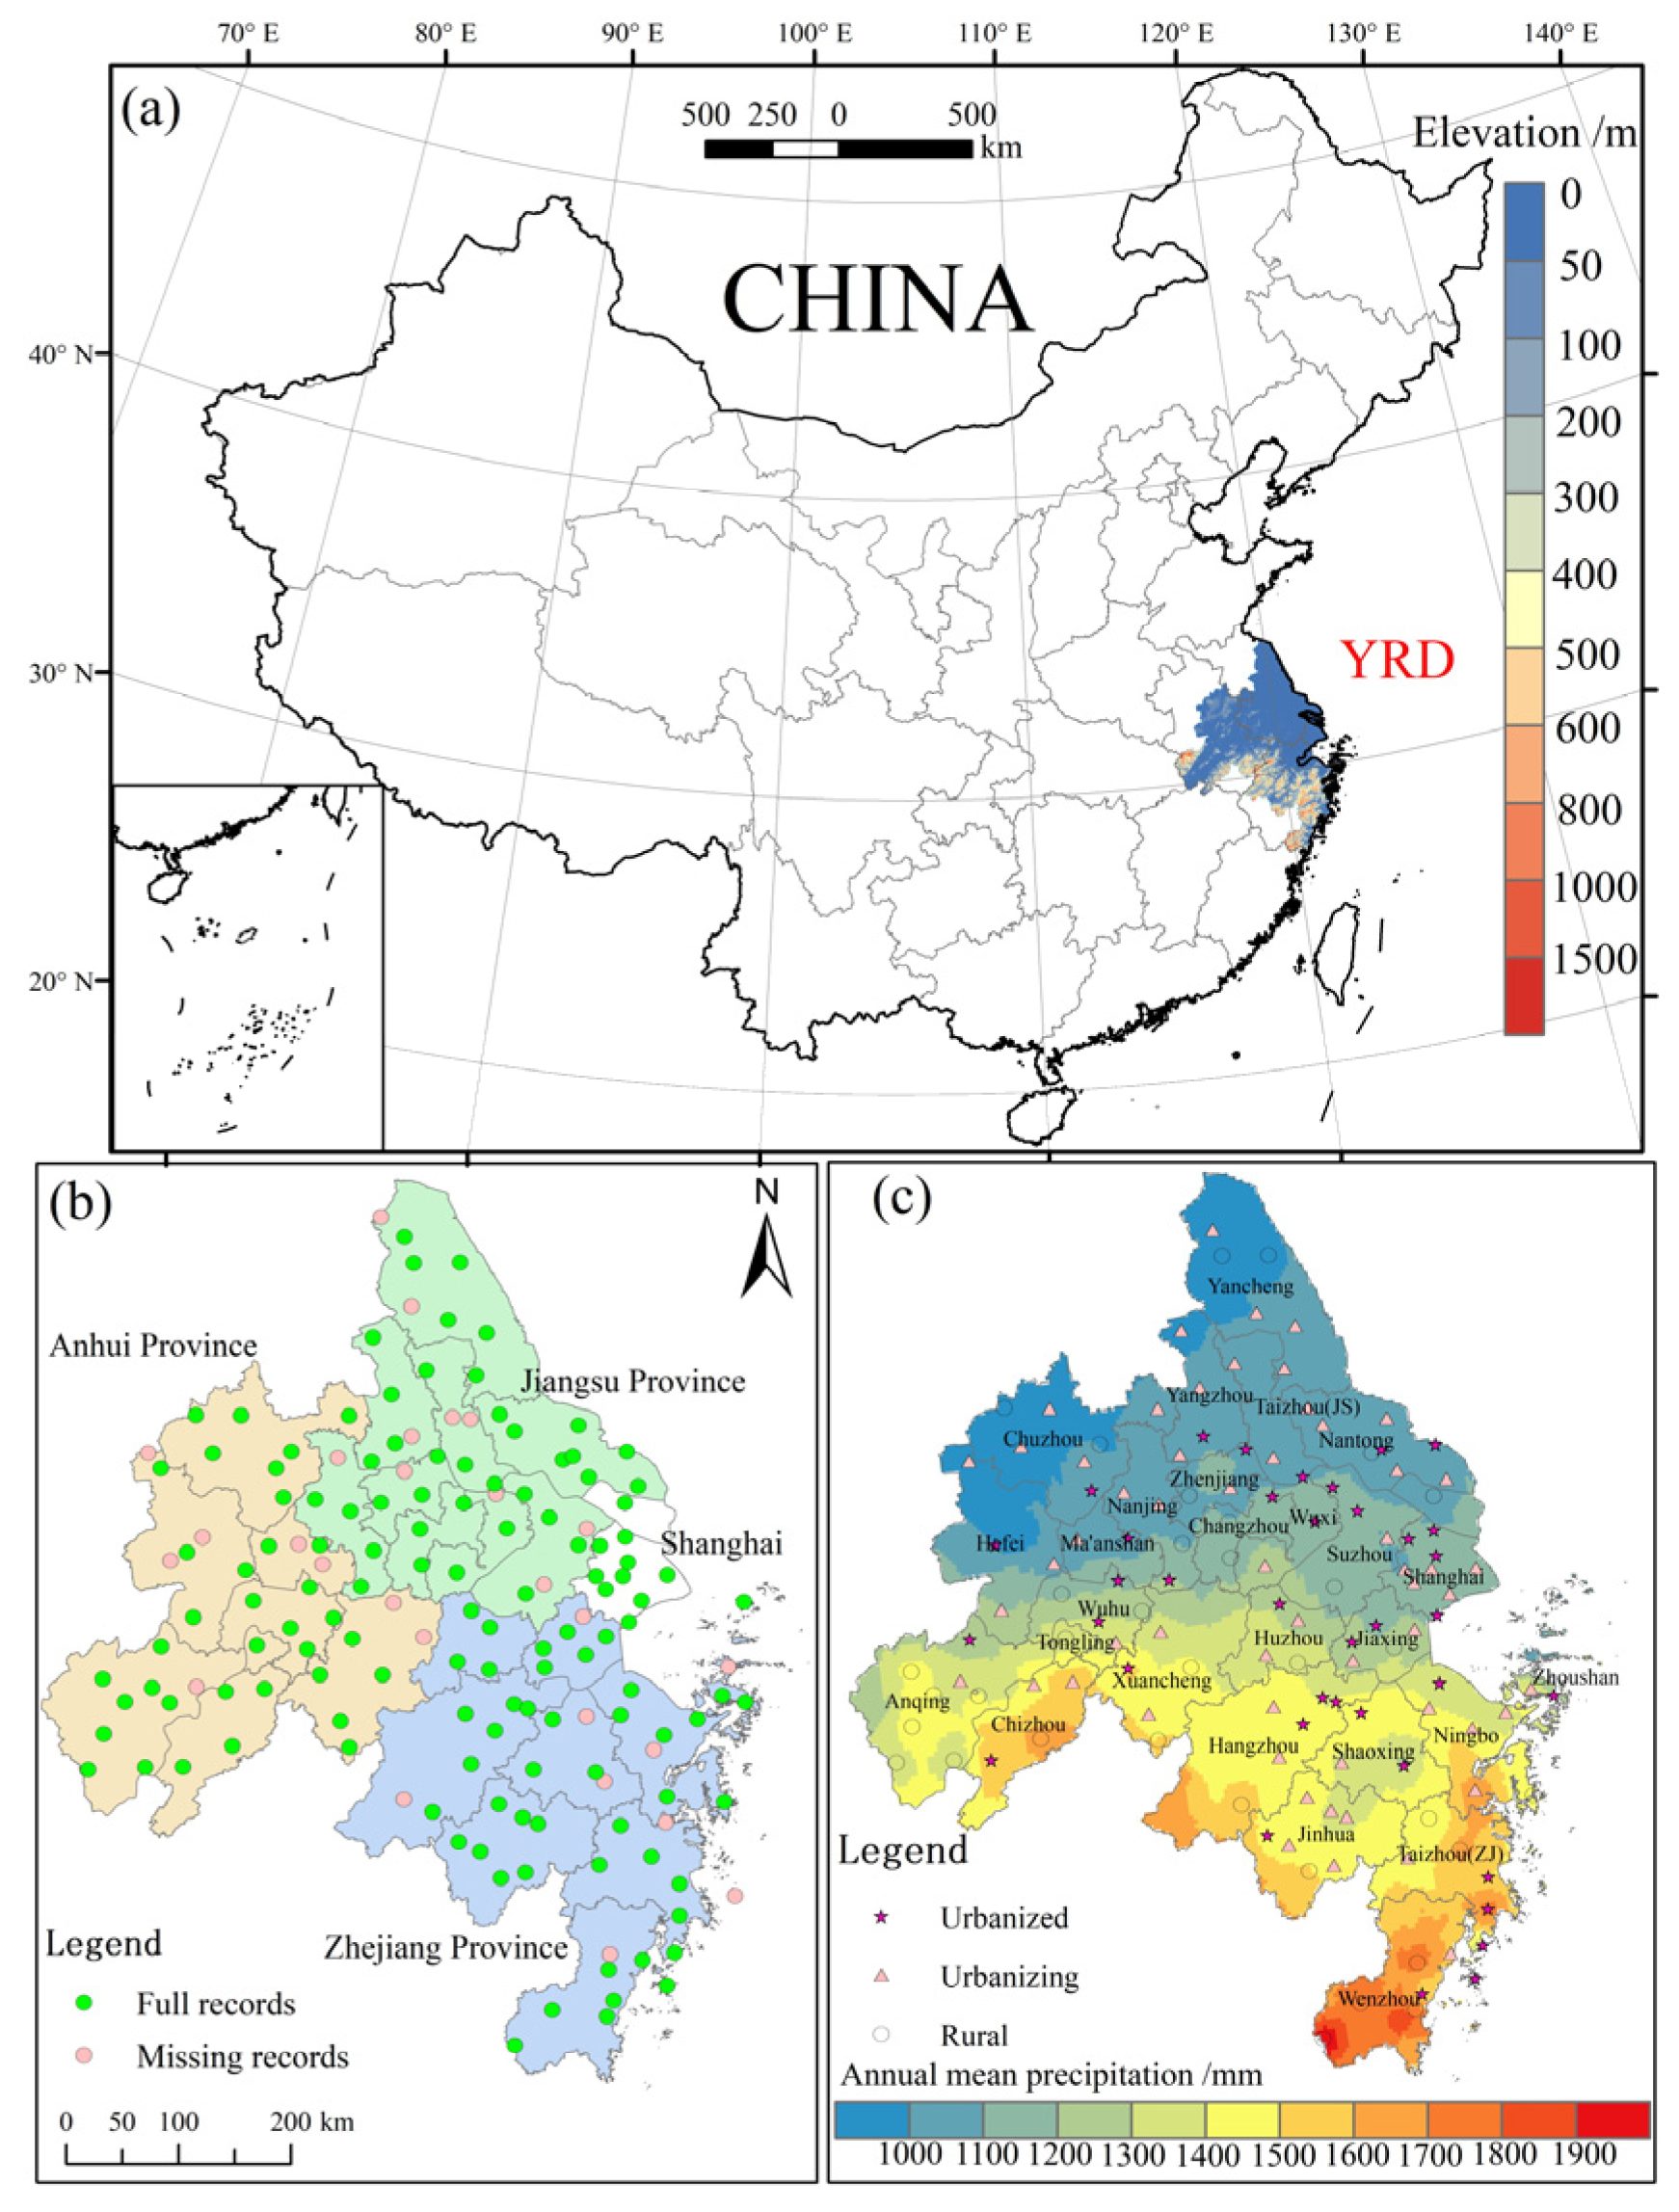
2.1. Study Area

The YRD urban agglomeration (32°34′ E–29°20′ E, 115°46′ N–123°25′ N, Figure 1a), located in the lower reaches of the Yangtze River, is an illuvial plain formed before the Yangtze River enters the sea. According to “Yangtze River Delta Urban Agglomeration Development Plan” (2016) and “The Outline of the Regional Integration Development Plan of the Yangtze River Delta” (2019) released by the Chinese Central Government, the YRD urban agglomeration consists of 27 cities across Shanghai, Jiangsu Province, Zhejiang Province, and Anhui Province (Figure 1b), covering an area of around 22.5 × 10⁴ km2. It has a marine monsoon subtropical climate, with a hot and humid summer and a cool and dry winter. Due to its coastal location and climate conditions, the YRD urban agglomeration is also affected by the maritime climate, with more rainfall and typhoons in summer. The annual mean precipitation ranges from 908 to 1980 mm (Figure 1c). Additionally, the YRD urban agglomeration consists of one core megacity, Shanghai, and five metropolitan circles, such as Nanjing (including Yangzhou and Zhenjiang), Hangzhou (including Huzhou, Jiaxing, and Shaoxing), Hefei (including Wuhu and Ma’anshan), SuXiChang (including Suzhou, Wuxi, and Changzhou), and Ningbo (including Taizhou) urban agglomerations.

2.2. Data Sources

There are 157 meteorological stations in the YRD urban agglomeration operated by the China Meteorological Administration (CMA) [53,54], but only 130 out of the total have complete hourly meteorological records from May to September between 1978 and 2012, as shown in Figure 1b. Thus, the hourly precipitation data from these 130 stations are used for the following analysis (Table S1). All these data underwent internal consistency checks and quality control by the CMA [55,56,57,58,59] and have been widely used in many previous studies [60,61].
Land use and population distribution datasets in 1990 and 2015 were downloaded from the Resource and Environmental Science and Data Center, Chinese Academy of Sciences (available online: http://www.resdc.cn, access on 20 December 2024), with a spatial resolution of 1 km × 1 km. DMSP/OLS night-time light images in 1992 and 2013 are sourced from the geographic and national monitoring cloud platform (available online: http://www.dsac.cn/, access on 20 December 2024).
Figure 2 shows the spatial distribution of land use types, population density, and night-time light, indicating that rapid urbanization in the YRD has altered land surface characteristics, with increased population density, light intensity, and urban construction land areas during the past decades. For example, the changes in land use were evident during 1990–2015 (Figure 2a,b), with a declining trend in farmland and grassland and a rapid increase in the proportion of urban areas and other construction lands at a growth rate of 15.76% and 50.85%, respectively. Similarly, there was a significant increase in night-time lighting in the YRD urban agglomeration from 1992 to 2013 (Figure 2d,e), with the grids at a high value larger than 50 increasing by 16.64-fold from 2216 to 39081, particularly in the one core megacity and five metropolitan circles. The population density ranged from 44 to 15,727 people/km2 in 1990, and the highest population density increased to 41,884 people/km2 in 2015, with the mean increasing from 509 to 659 people/km2 (Figure 2g,h). In summary, there have been noticeable changes in the YRD urban agglomeration during the past three decades, and all the changes are more apparent in the eastern coastal areas.

2.3. Methods

The overall methodology is presented in Figure 3. In general, the first step is to collect and preprocess multi-source datasets, involving the in situ precipitation data, remotely sensed products, and socioeconomic data. Subsequently, the following key steps are to define and identify the hourly scale extreme precipitation (Step 2) and dynamically classify the urban and rural stations (Step 3). Next, we will characterize the spatial and temporal variations in extreme precipitation across the YRD (Step 4) and quantify their response to urbanization (Step 5). Finally, the uncertainty from different methods of urban–rural classification and spatial heterogeneity of urban effects is discussed. The details about these steps are described below.

2.3.1. Definition of the EHP

The minimum observation precision for effective hourly precipitation is 0.1 mm, and then it is set to differentiate wet and dry hours [62]. Generally, extreme precipitation indices are widely defined by fixed thresholds or percentile-based thresholds. Thus, referring to the earlier work [54], we use five hourly scale extreme precipitation indices following a set of sub-daily and hourly precipitation indices defined by Alexander et al. [63] and Li et al. [61], as shown in Table 1 and Figure S1.

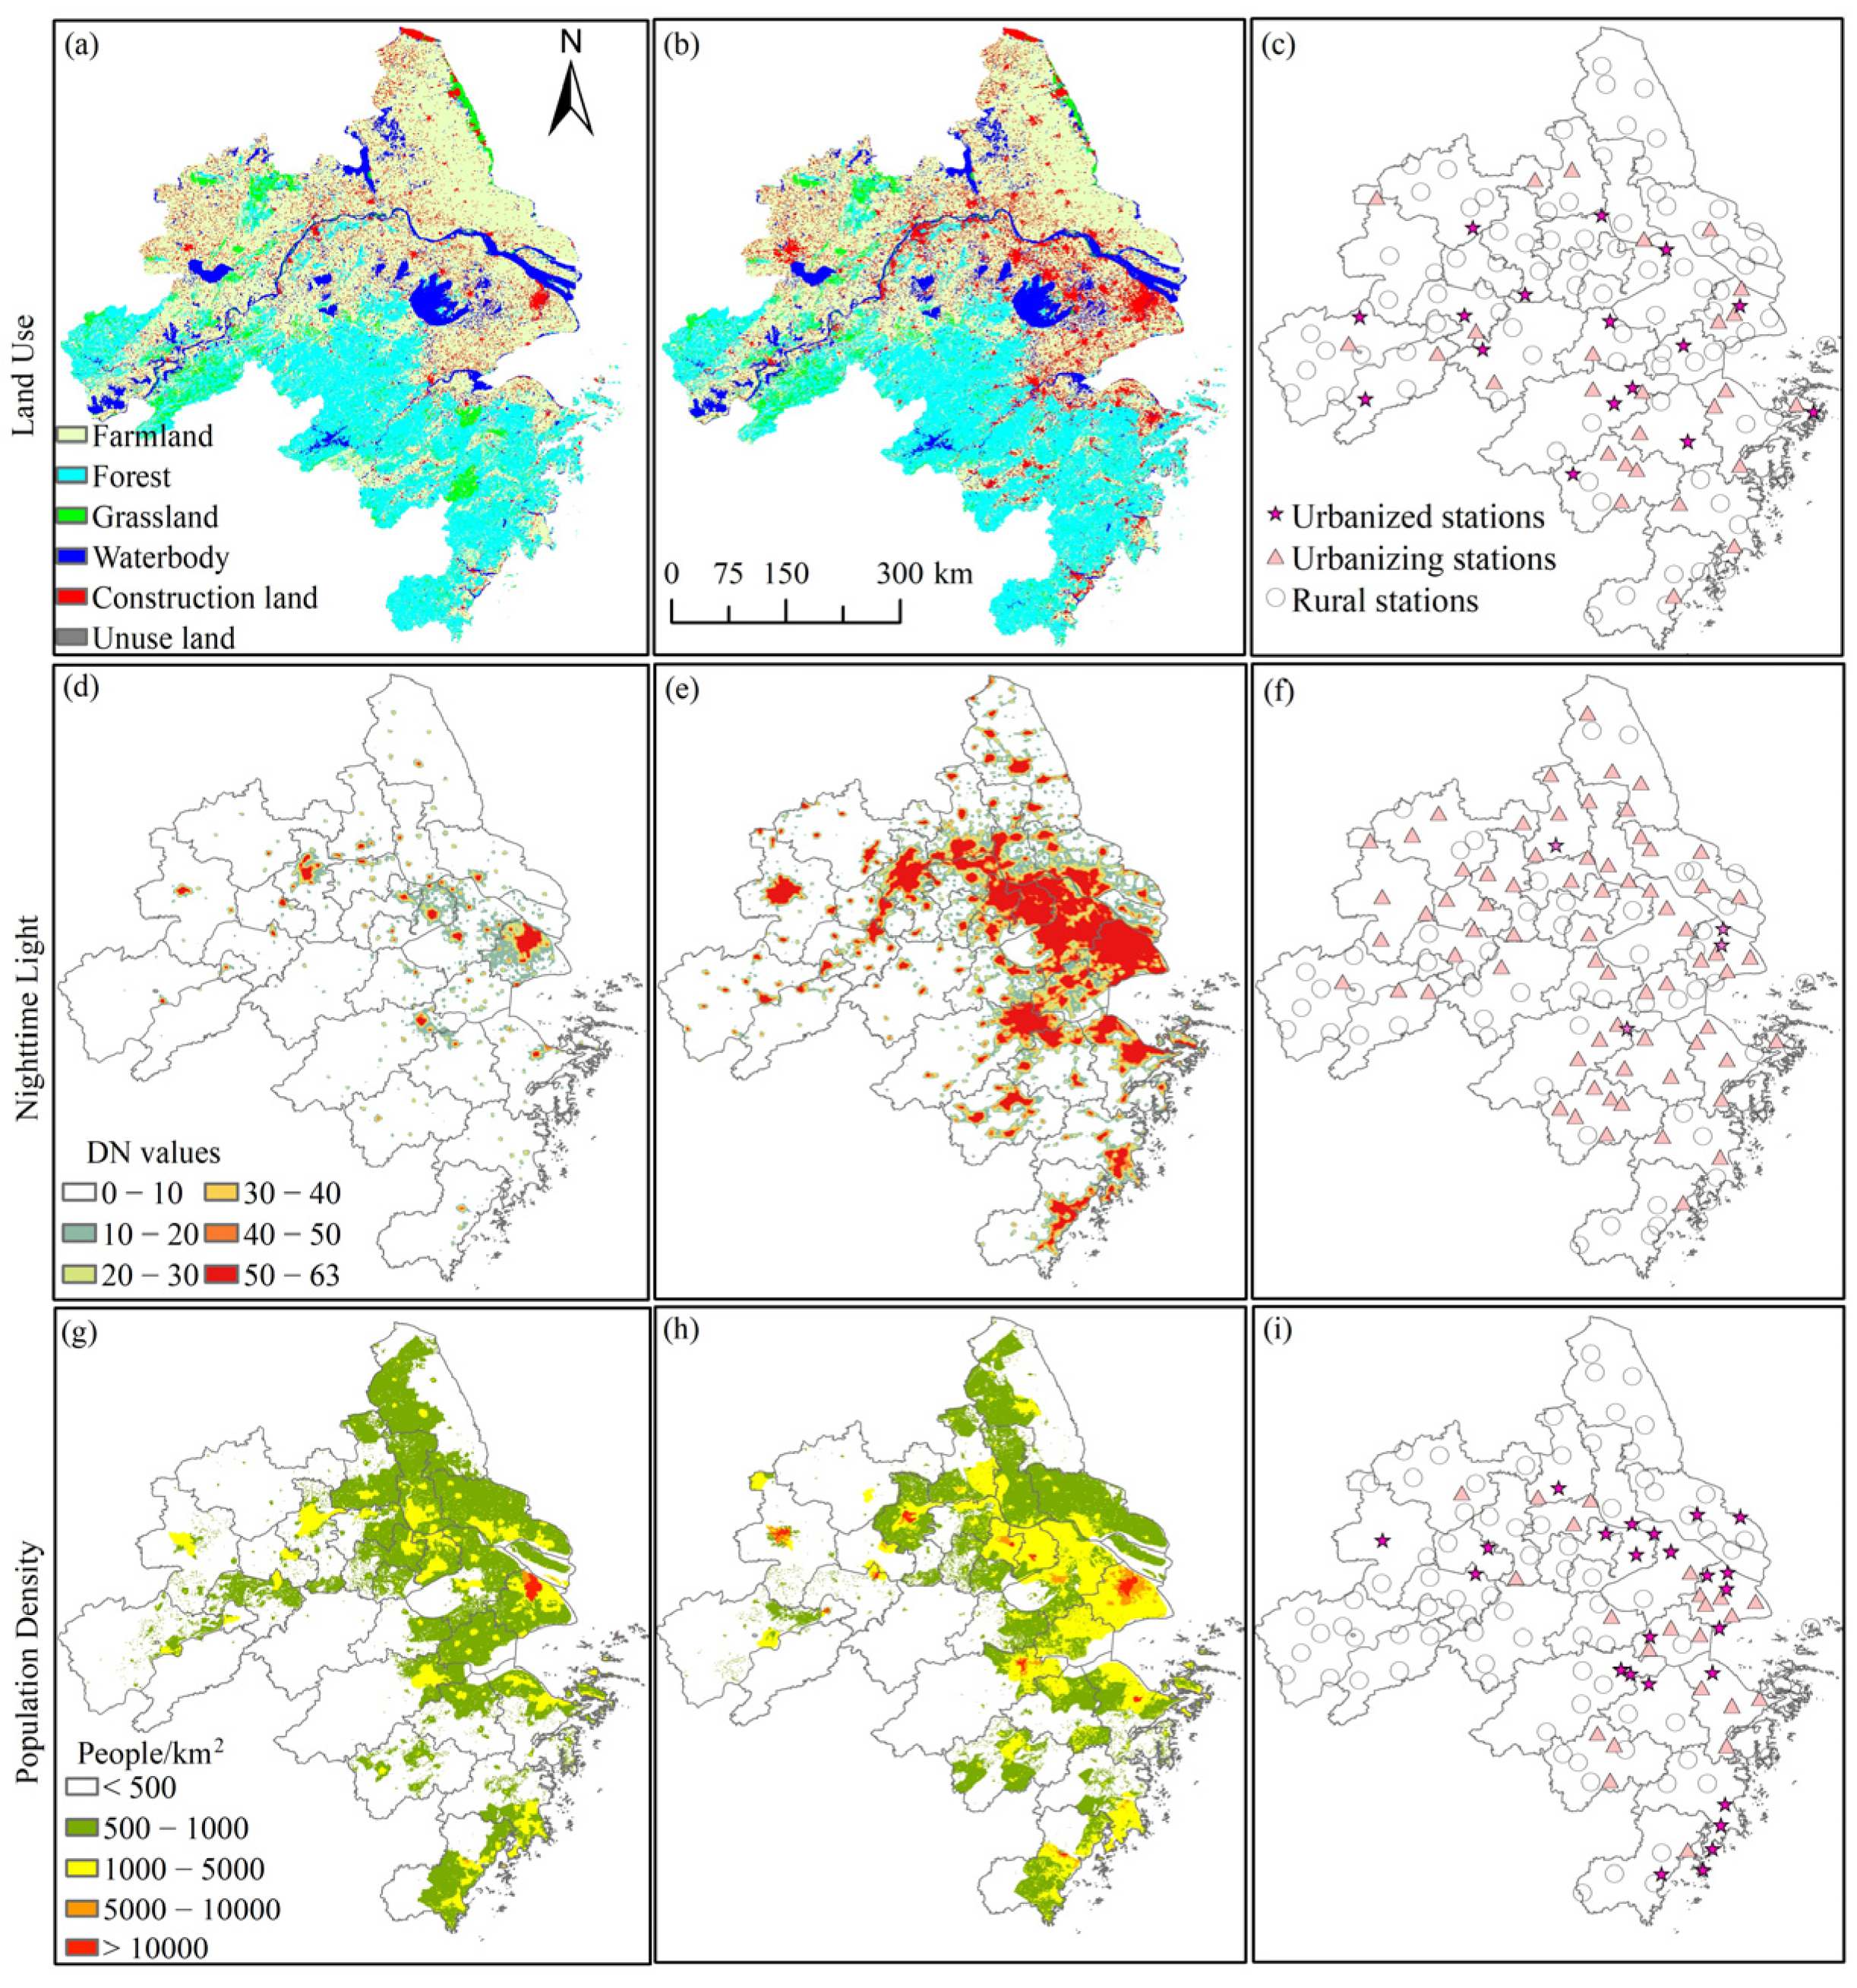
2.3.2. Characterizing the Stages and Levels of Urbanization

As mentioned above, urbanization processes are dynamic and complex. In this work, we divided the period from 1978 to 2012 into two urbanization stages, roughly with the year 1995 as the dividing point: the steady urbanization period from 1978 to 1995 and the rapid urbanization development from 1996 to 2012. This classification of urbanization stages is consistent with the previous studies in China [64], with a clear distinction in 1995 from the initial to middle stage of urbanization based on the population urbanization rates.
Generally, the measure applied in city size or level is that of population, which has many merits but various problems as well [65]. As such, the measurement of the physical infrastructure of the urban area (e.g., urban built-up area) provides an alternative means to study city size distributions and urban agglomerations, which use satellite remote sensing data and night-time light to provide fine-grain spatial and temporal assessments of city-size infrastructure [66]. Thus, in this work, we also use the urban built-up areas from the China City Statistical Yearbook (1985–2013) to identify the urbanization levels during 1984–2012 across the YRD urban agglomeration, as shown in Figure S2. Moreover, the expansion of impervious surfaces is most relevant to local conditions. Therefore, a normalized index quantifying impervious surface proportion is adapted to represent urbanization levels in each city, which can be defined as follows:
U P B U A = B U A T o t a l × 100 %
where UPBUA refers to the percentage of the urban built-up area relative to total area; BUA and Total are the urban built-up area and total area in each city, respectively.

2.3.3. Classification of Urban and Rural Stations

DMSP/OLS night-time lighting data [22], population density [62], and land use [67] data are used to classify the station types for each meteorological observation station within the YRD urban agglomeration. Thus, we divide the meteorological stations into urban and rural stations based on the selection criteria using land use, night-time light, and population datasets.
Specifically, following our previous studies [40,46], two criteria are used to identify an urban station: ① if the proportion of built-up area (construction land in land use data) is greater than 33% within the 2 km buffer zone surrounding the station under investigation and ② the station is located in the area which is already classified as urban using population density and/or the night-time light data. For the second criterion, an area with a population density larger than 1000 people/km2 or the digital number of night-time light larger than 50 is defined as an urban area. Moreover, a station is considered urbanized (rural) when it is urban (rural) in both the first and second urbanization stages; one is an urbanizing station if it is categorized as a rural station in the first stage but as an urban station in the second stage. The details of the classification results can be seen in Figure 2c,f,i.
Considering the above results, a station can be classified as urbanized if it meets one or more conditions. It is considered a rural site if it is categorized as rural based on all three datasets. Stations that do not meet the above criteria for either urbanized or rural are classified as urbanizing stations. Finally, the integrated urban–rural classification results can be seen in Figure 1c.

2.3.4. Evaluating the Urbanization Effects on Extreme Precipitation Changes

The methodology proposed by Song et al. [40] was adopted to investigate the contribution of urbanization to precipitation change using two indices when comparing urban and rural scenarios (Scenario I: urbanized and rural stations, Scenario II: urbanizing and rural stations, and Scenario III: urbanized and urbanizing stations). Firstly, CRmean is defined as the contribution ratio of urbanization from the mean values, indicating the mean differences between the urban and rural areas:
C R m e a n = Δ R u r r u r b a n = r u r b a n i z e d r r u r a l r u r b a n i z e d × 100 % Scenario   I r u r b a n i z i n g r r u r a l r u r a b n i z i n g × 100 % Scenario   II r u r b a n i z e d r u r b a n i z i n g r u r a n i z e d × 100 % Scenario   III
r u r b a n i z e d = P ¯ u r b a n i z e d _ p o s t P ¯ u r b a n i z e d _ p r e P ¯ u r b a n i z e d _ p r e × 100 % r u r b a n i z i n g = P ¯ u r b a n i z i n g _ p o s t P ¯ u r b a n i z i n g _ p r e P ¯ u r b a n i z i n g _ p r e × 100 % r r u r a l = P ¯ r u r a l _ p o s t P ¯ r u r a l _ p r e P ¯ r u r a l _ p r e × 100 %
where P ¯ is the mean value of extreme precipitation for different areas and periods, with the subscripts pre and post meaning the corresponding values in the pre- and post-urbanization periods and urbanized, urbanizing, and rural for the station types, respectively. The r represents the rate of change in precipitation between the pre- and post-urbanization periods. ΔRu-r is the difference in the change rates between urban and rural areas, which can indicate the urban effect on precipitation changes. If it is larger than 0, the urban effect is positive; that is, urbanization induced higher increases or less decreases in extreme precipitation across urban areas compared to that in rural areas. Here, CRmean > 0 (CRmean < 0) means the positive (negative) contribution.
Additionally, CRslope is defined as the ratio of the slope from the trends in the urban–rural differences of extreme precipitation (DEP) series to those of the urban extreme precipitation series, which can be seen as a measure of the urbanization contribution to extreme precipitation changes:
C R s l o p e = b D E P b u r b a n × 100 %
where burban and bDEP are the slopes of urban precipitation and DEP time series. The index bDEP can also be used to represent the urbanization effect.

2.3.5. Regional Variations in Urbanization Effects and Contributions

Previous studies have shown that the impact of urbanization on the EHP is inconsistent in different regions and terrain conditions. Here, we aim to analyze the impact of urbanization on the EHP in “One Core and Five Circles” across the YRD urban agglomeration. Besides, we choose stations with lower elevations (0~100 m) in these areas to minimize the topographical influence on the changes in the EHP. Finally, sixty-nine stations are used to analyze the regional differences in the urbanization effects on the extreme hourly precipitation, with 10 stations in Shanghai (4-5-1 for urbanized–urbanizing–rural), 11 in Nanjing (3-6-2), 15 in Hangzhou (7-6-2), 11 in Hefei (4-5-2), 9 in SuXiChang (4-2-3), and 13 in Ningbo (5-6-2), as shown in Figure S3.

3. Results

3.1. Changes in the EHP Across YRD

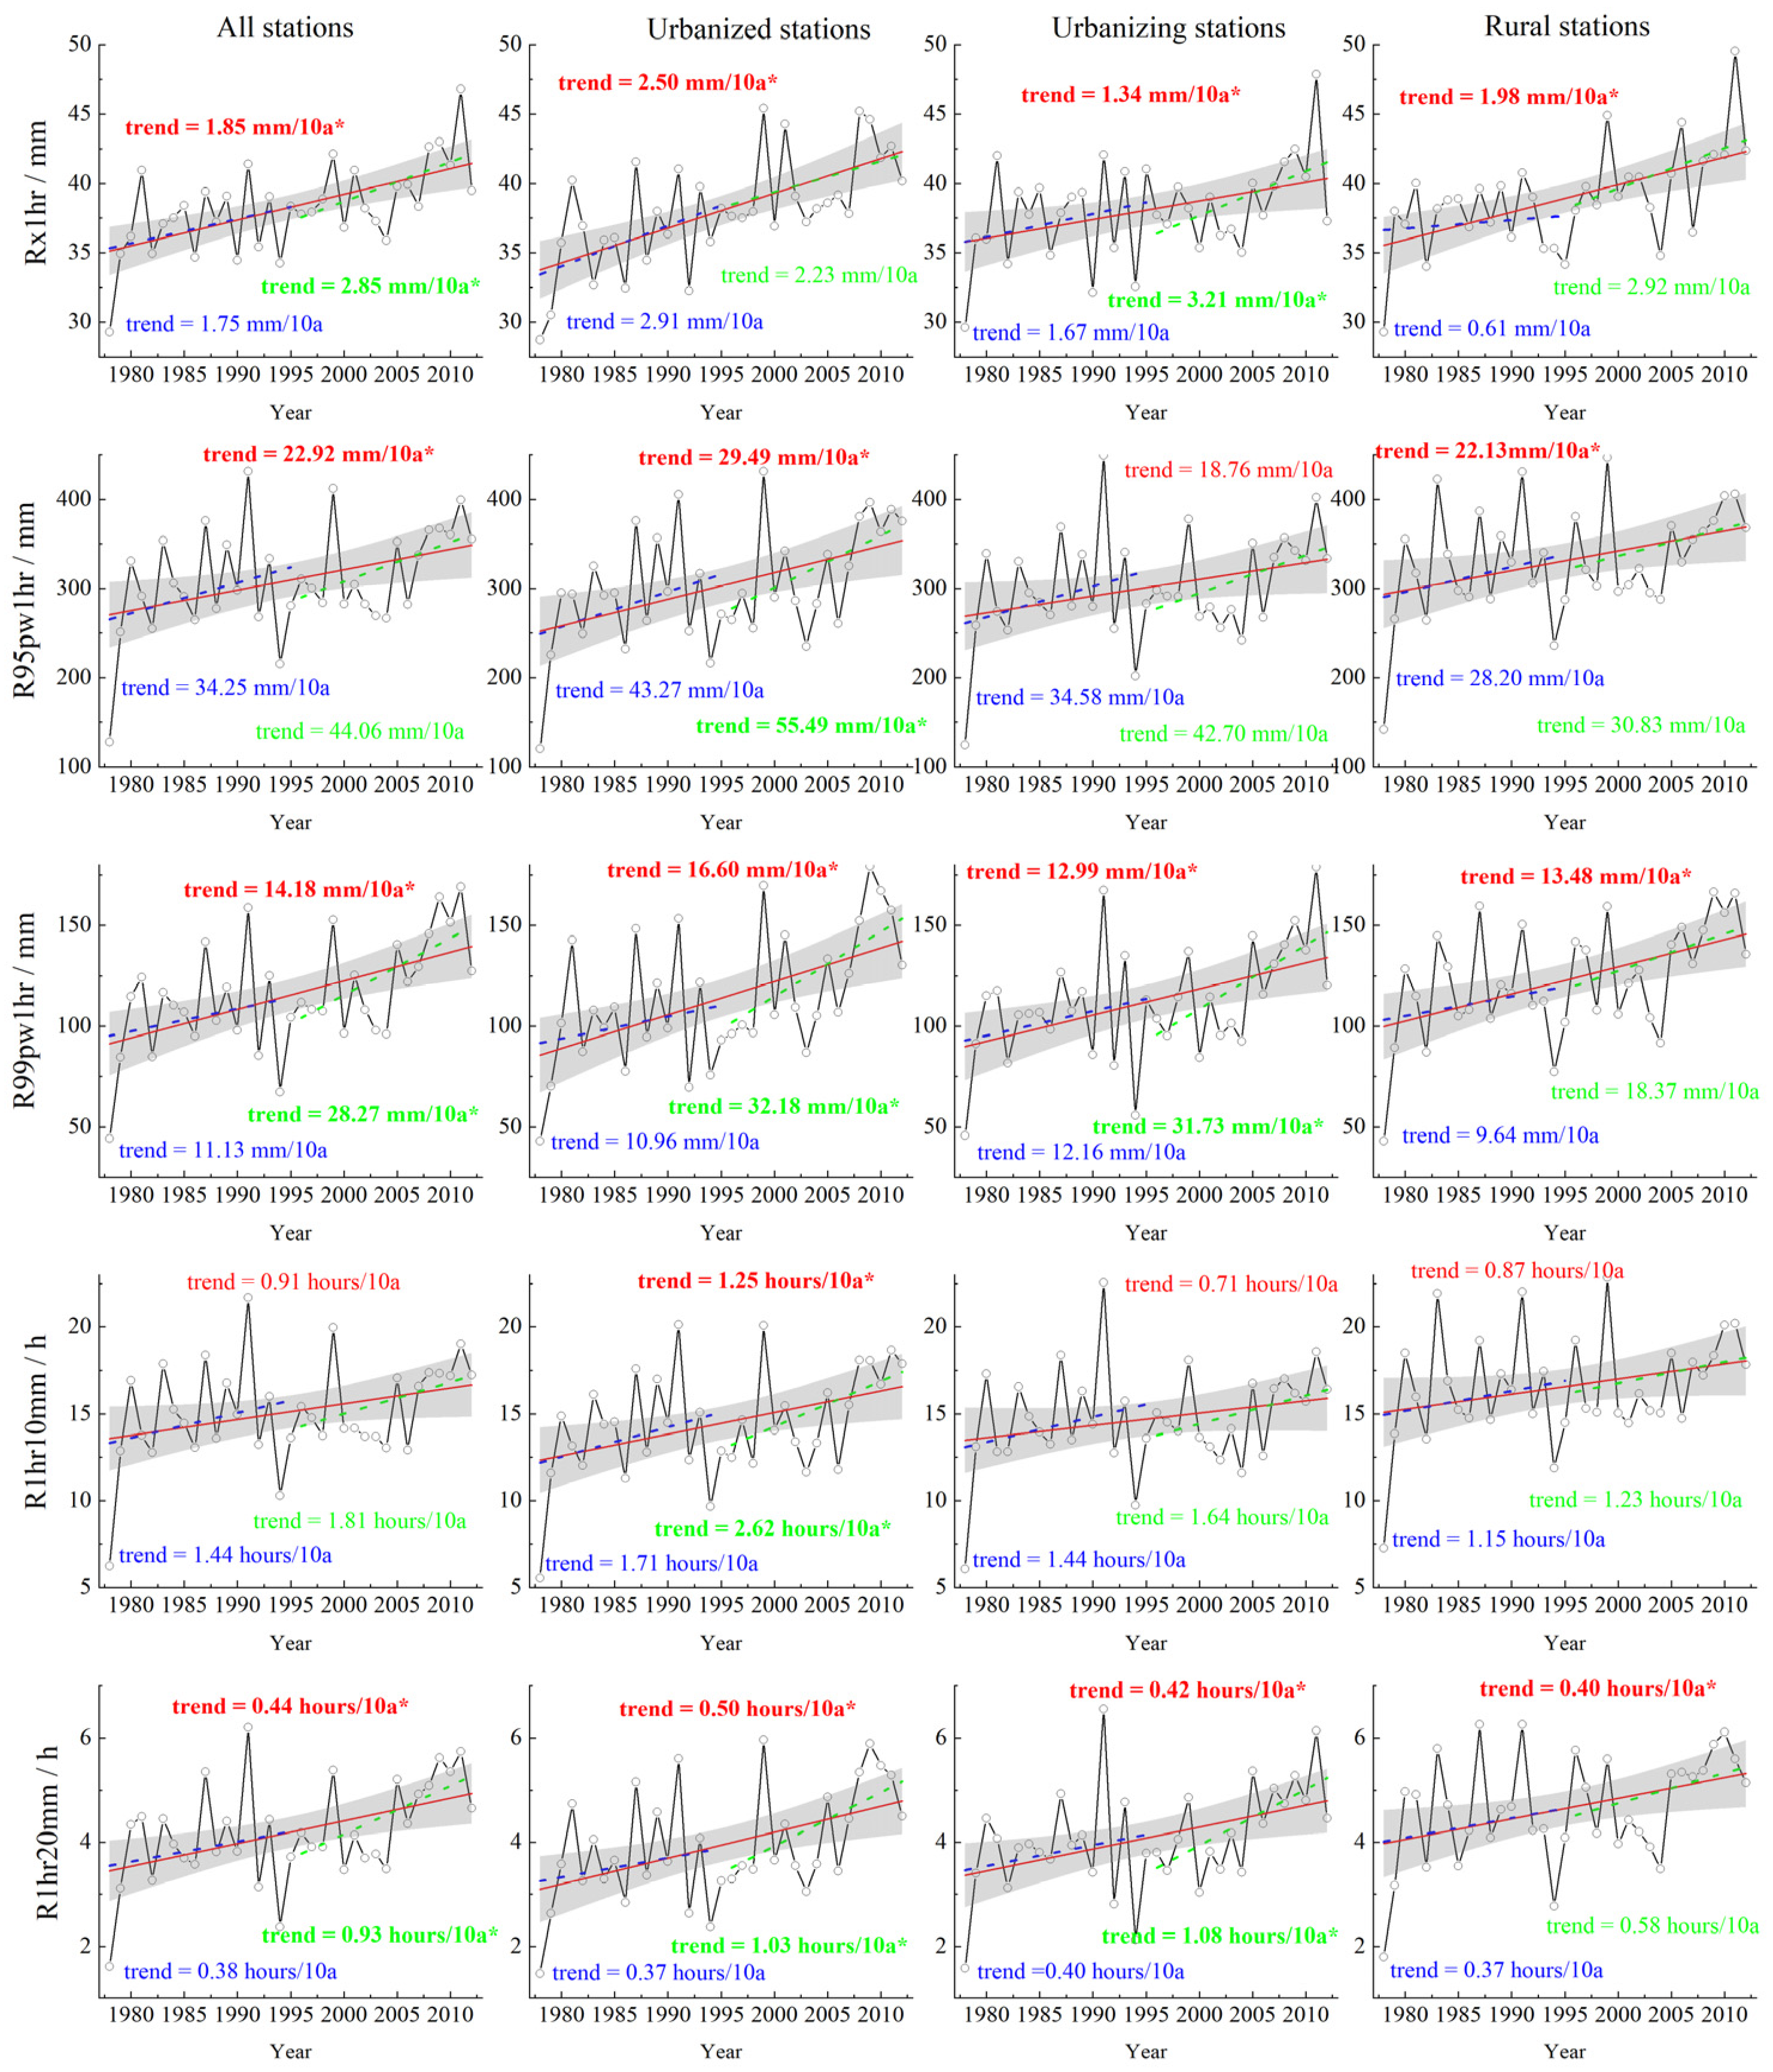
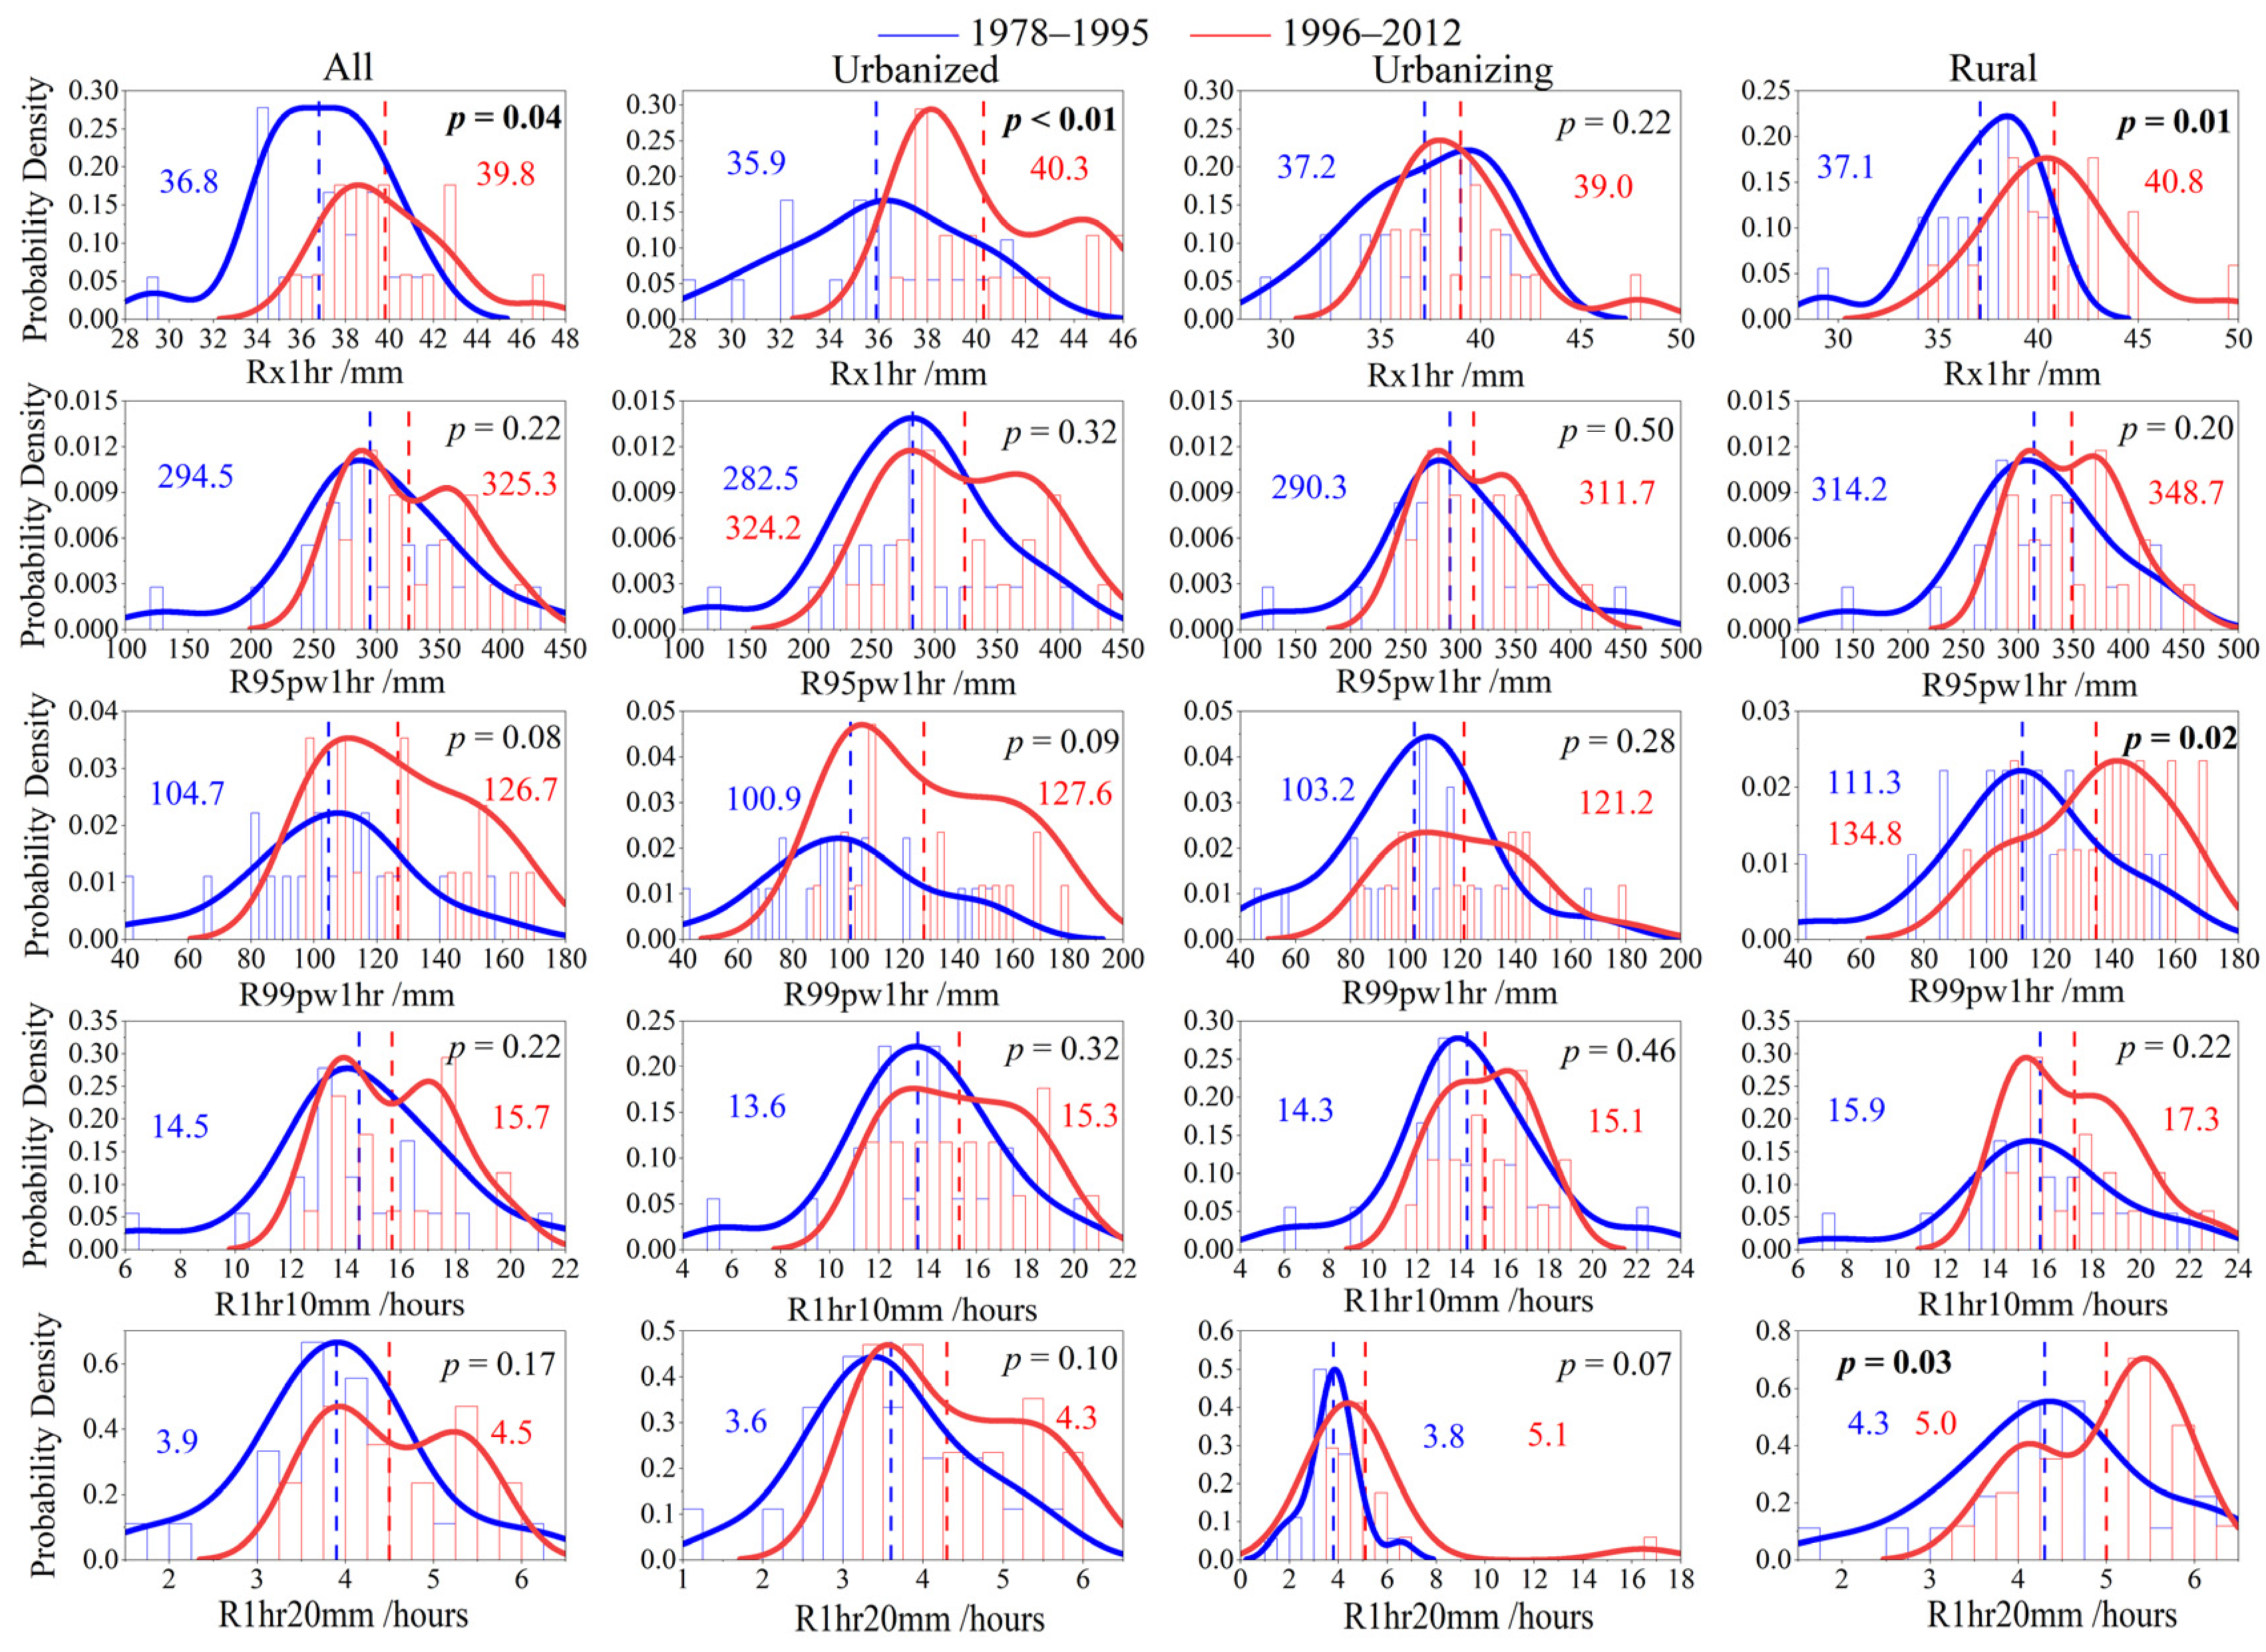
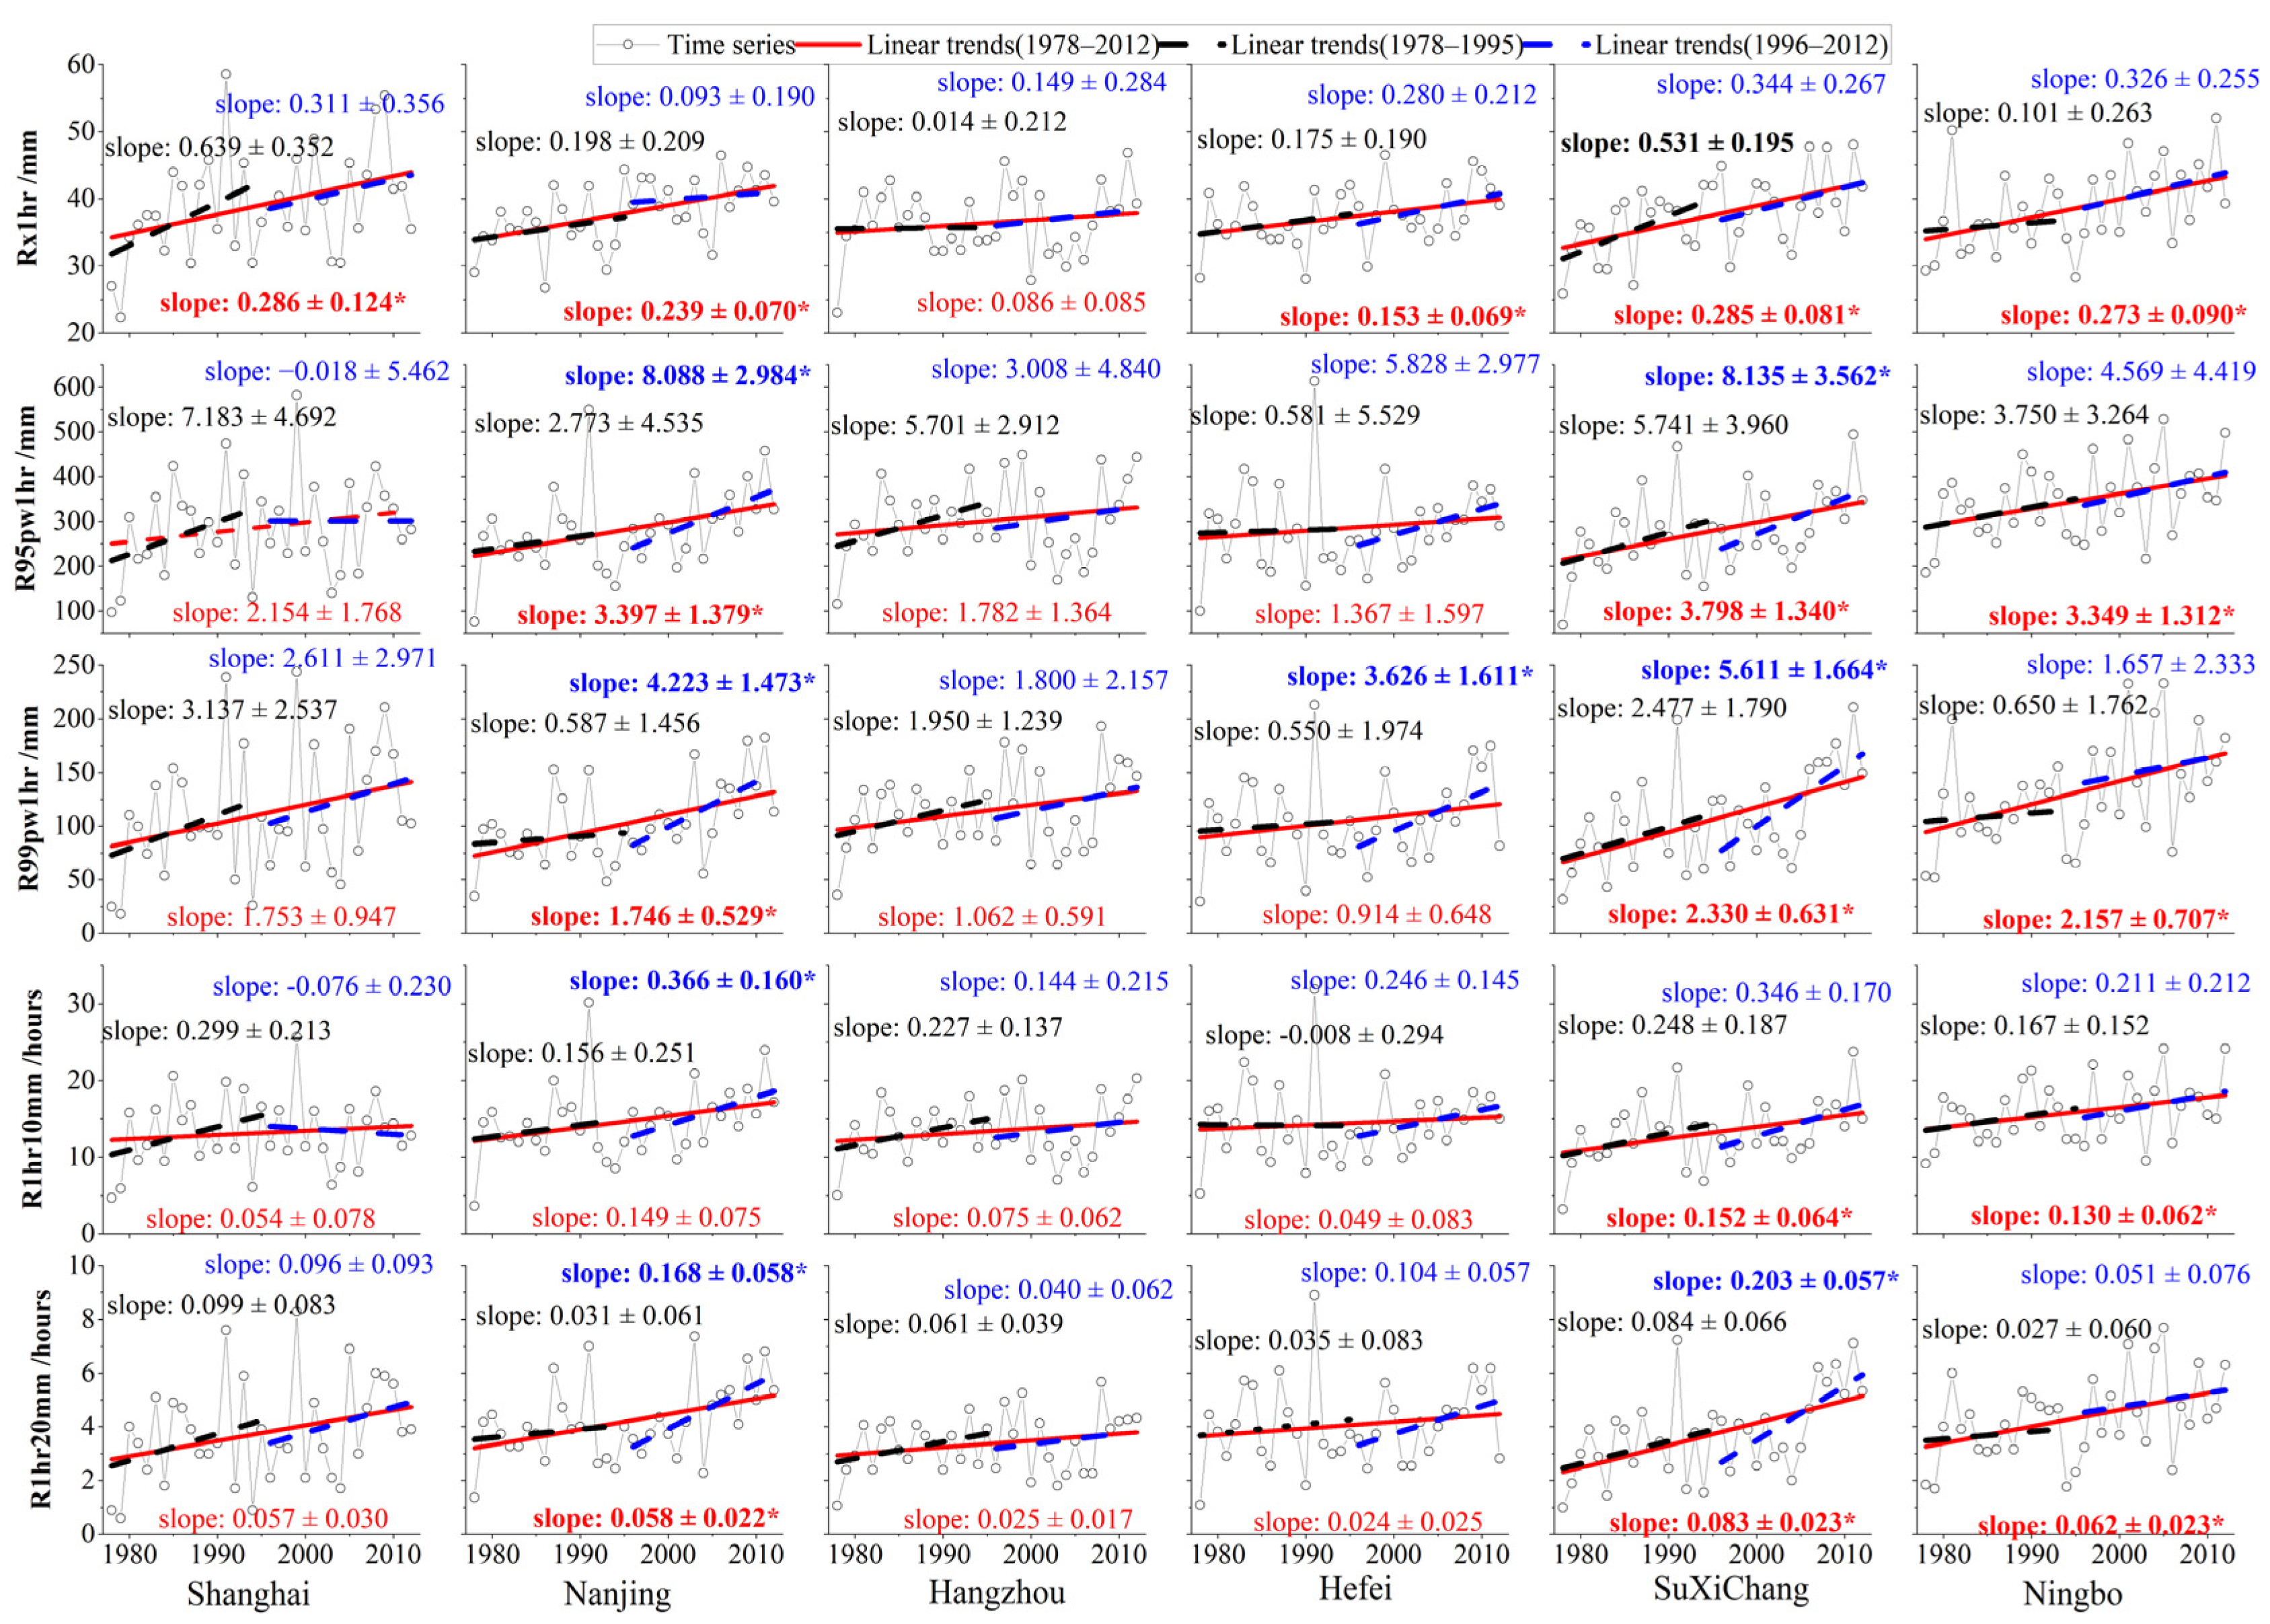
3.1.1. Temporal Variations in the EHP

Firstly, the mean series of the EHP across the YRD urban agglomeration is estimated using the arithmetic average method based on all stations, urban and rural stations, as shown in Figure 4. The all station means show overall positive trends for all the EHP indices, with mean decadal increases of 1.85 ± 0.43 mm, 22.92 ± 9.14 mm, 14.18 ± 3.92 mm, 0.91 ± 0.46 h, and 0.44 ± 0.14 h for Rx1hr, R95pw1hr, R99pw1hr, R1hr10mm, and R1hr20mm, respectively. All the indices, except for R1hr10mm, demonstrate significant trends at a significance level of α = 0.05. To a certain extent, these increases are likely driven by the urbanization process, with rates in the rapid urbanization stage (1996–2012) almost twice (1.54 times for Rx1hr and 1.92~2.11 times for other indices) as high as those of the full period and greater than those in the slow urbanization stage from 1978 to 1995. The increasing rates observed in the YRD are similar to those recorded in individual cities within the region but are slightly higher than the changes documented across China in previous studies. For example, the rates of Rx1hr for Shanghai (1.52 mm/decade), Nanjing (1.81 mm/decade), Hangzhou (1.65 mm/decade), Hefei (1.72 mm/decade), and the national average (1.72 mm/decade) from 1985 to 2012 have been reported [27]. Besides, Li et al. [61] also reported that significantly positive trends could be found in the five indices on the country and basin scales from 1970 to 2018, especially over the Southeast and Yangtze River basins. Increasing the EHP may lead to higher summer rainfall in the YRD urban agglomeration, as demonstrated by Han et al. [68]. Positive trends have been observed in urbanized, urbanizing, and rural stations from 1978 to 2012. Most of these trends are statistically significant (e.g., all five indices for urbanized, four for rural, and three for urbanizing stations), particularly regarding Rx1hr, R99pw1hr, and R1hr20mm. Overall, urbanized stations show the highest trend rates compared to urbanizing and rural stations, with ratios of 1.19~1.85 and 1.23~1.44 times, respectively. Comparing the two stages of urbanization, we also found that all indices increased more during the rapid urbanization stage than in the slow urbanization stage. Moreover, an ANCOVA (Analysis of Covariance) [69,70] was used to examine the effects of station classification on the linear regression results, as shown in Table 2. Even though urban–rural classification has a significant effect on some indices, particularly for the frequency indices (R1hr10mm and R1hr20mm) of extreme precipitation, its effect was not statistically distinguishable for most cases, with all the cases showing no significant difference at the first stage (1978–1995).
Additionally, as shown in Figure 5, all mean values of the EHP in the rapid urbanization stage (1996–2012) are higher than those in the early stage (1978–1995), with an increasing rate of 8.15–21.01% (all stations), 12.25–26.46% (urbanized stations), 4.8–34.21% (urbanizing stations), and 8.88–21.11% (rural stations), respectively. Nevertheless, based on the two-sample Kolmogorov–Smirnov test, most probability density functions (PDFs) are not significantly different. The right bias of PDFs indicates that the probability of high values of extreme indices in the rapid urbanization stage will increase based on the same threshold. Overall, rapid urbanization may induce higher increases in the EHP, especially for these high-threshold extreme events (e.g., R99pw1hr and R1hr20mm) and high-level urbanization areas. These findings align with earlier studies in China, indicating that extreme precipitation is becoming more intense and frequent in the southern and eastern regions [61].
In summary, the YRD region shows a positive trend in the EHP during the full period and different urbanization stages, with higher increases in the urban areas and the rapid urbanization stage. The findings suggest that urbanization positively influences the rise in the EHP in the YRD urban agglomeration. Additionally, rapid urbanization may lessen the differences in the EHP between urban and rural areas, as rural areas also develop during the urbanization process. It also shows a more significant impact on the increase in the EHP at urbanized stations; that is, the magnitudes of these impacts are related to the levels of urbanization.

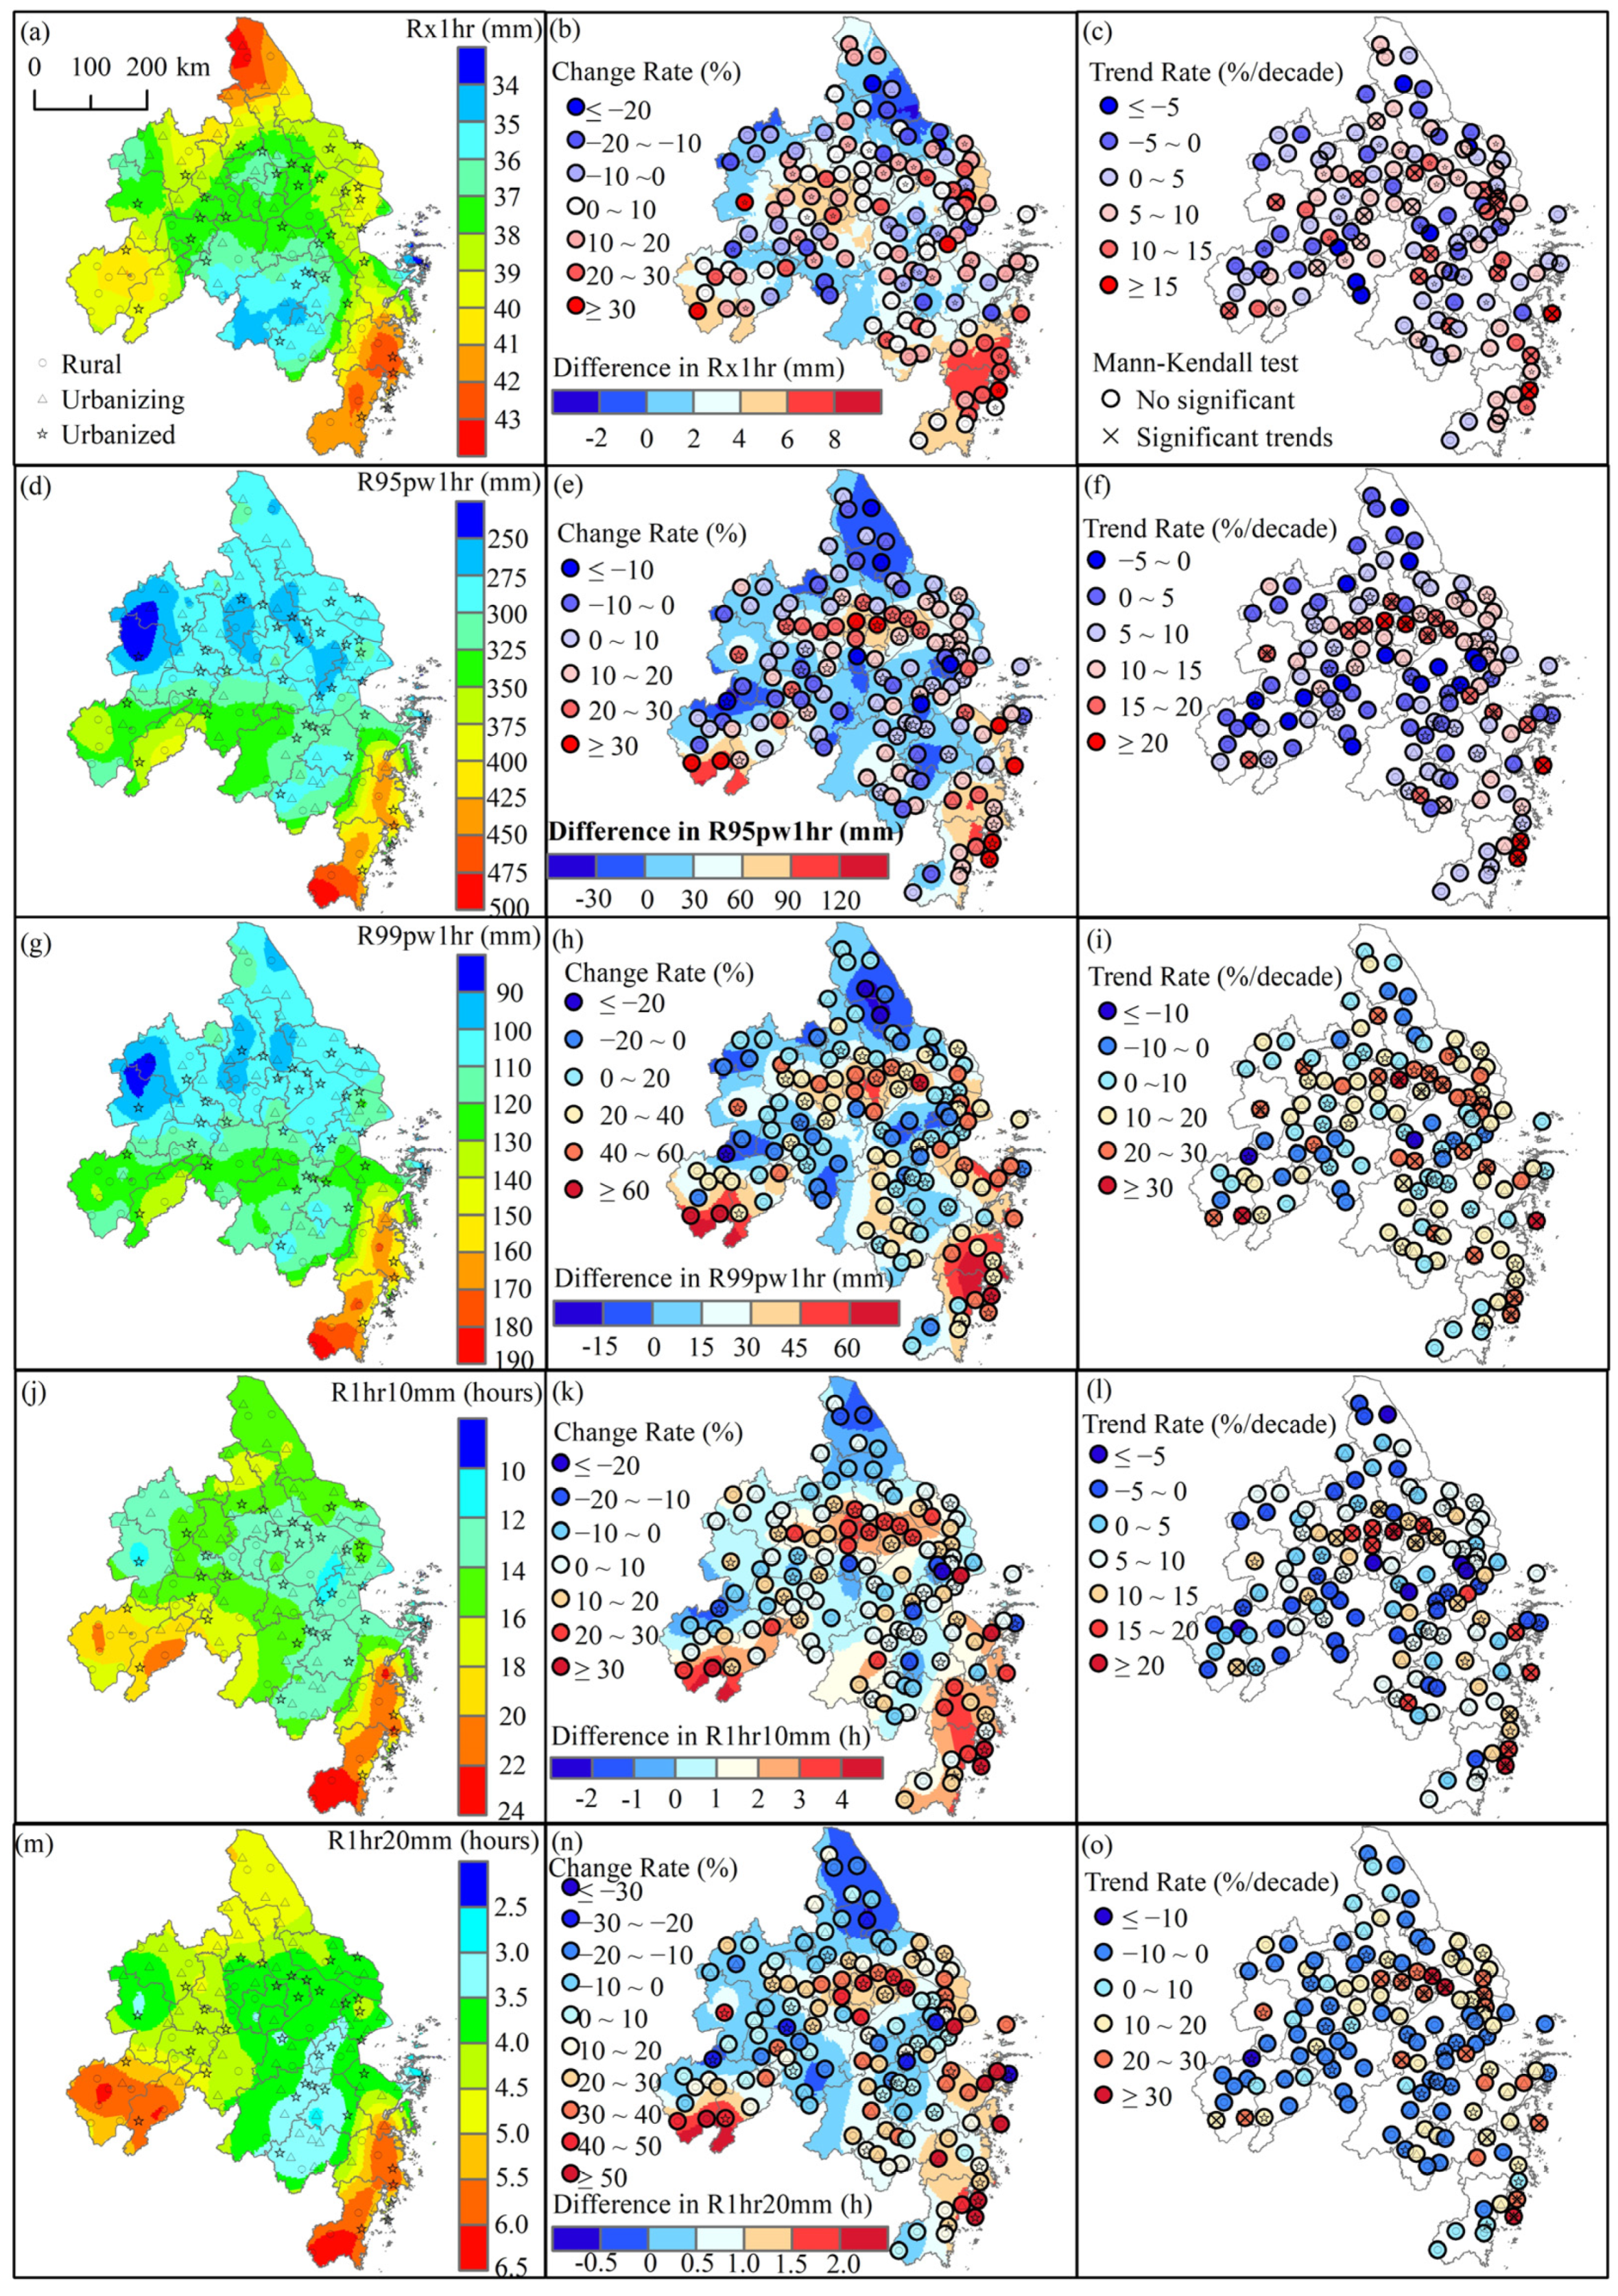
3.1.2. Spatial Patterns of the EHP

Figure 6 illustrates the spatial distribution of the EHP indicators in the YRD urban agglomeration from 1978 to 2012. Overall, Rx1hr decreases from the northern and southern sides toward the middle, with high values exceeding 40 mm located in the southeast coastal area. The spatial distribution of R95pw1hr and R99pw1hr exhibits a notable similarity, with high-value areas predominantly located on the southern side of the study area. Notably, the values peak at around 480 mm and 190 mm, respectively. The distribution of R1hr10mm and R1hr20mm values follows a clear decreasing trend from the south and west to the northeast. The high-value area for R1hr10mm spans the southern side for 23 h, while the high-value area for R1hr20mm is situated in the western mountainous area for 6.7 h. As shown in Figure 5, there is a similar spatial distribution of the differences in the means of the EHP indicators between the two stages of urbanization, with the high values located in the central and southeast areas. The spatial patterns of the EHP are consistent with the earlier work by Jiang et al. [38]. Additionally, the spatial statistical indicators, such as the coefficient of variation (CV) and Moran’s Index [71], are used to examine the spatial variations for various EHP indices across the YRD, as shown in Table 3. A larger CV refers to the presence of striking variation within the extreme precipitation, and a positive Moran’s Index means the adjacent observations in geography have similar characteristics. Overall, the results show that all the indices are highly clustered in space with a lower CV and higher Moran’s Index, but various indices show different spatial cluster/outlier patterns (see Figure 7).
More than 2/3 of the stations show an increasing trend from the early stage to the later stage, with the highest change rates in urbanized stations (11.29%, 13.84%, 23.21%, 11.61%, and 18.94%), followed by rural (9.09%, 10.38%, 19.49%, 8.09%, and 15.27%) and urbanizing (4.71%, 6.83%, 15.17%, 5.08%, and 14.02%) stations, for Rx1hr, R95pw1hr, R99pw1hr, R1hr10mm, and R1hr20mm, respectively (see Figure S4).
Similarly, the evidence from the majority of stations (76.92%, 88.46%, 87.69%, 86.92%, and 86.15%) indicates an upward trend across all indicators (Rx1hr, R95pw1hr, R99pw1hr, R1hr10mm, and R1hr20mm) based on Theil–Sen’s test. However, only 12.31~15.38% of stations show a significantly increasing trend at a level of α = 0.05, with 19 stations for Rx1hr, 18 for R95pw1hr, 20 for R99pw1hr, 17 for R1hr10mm, and 16 for R1hr20mm. Moreover, the urbanized, urbanizing, and rural stations with increasing (significant trends at a level of α = 0.05) EHP indicators account for 86.84%~94.74% (18.42%~23.68%), 66.67%~87.72% (3.51%~15.79%), and 82.86%~88.58% (8.33%~16.67%), respectively (see Figure S5). This suggests a notable trend in increasing extreme precipitation across different types of stations, but urbanization has a certain promoting effect on the growth of the EHP.

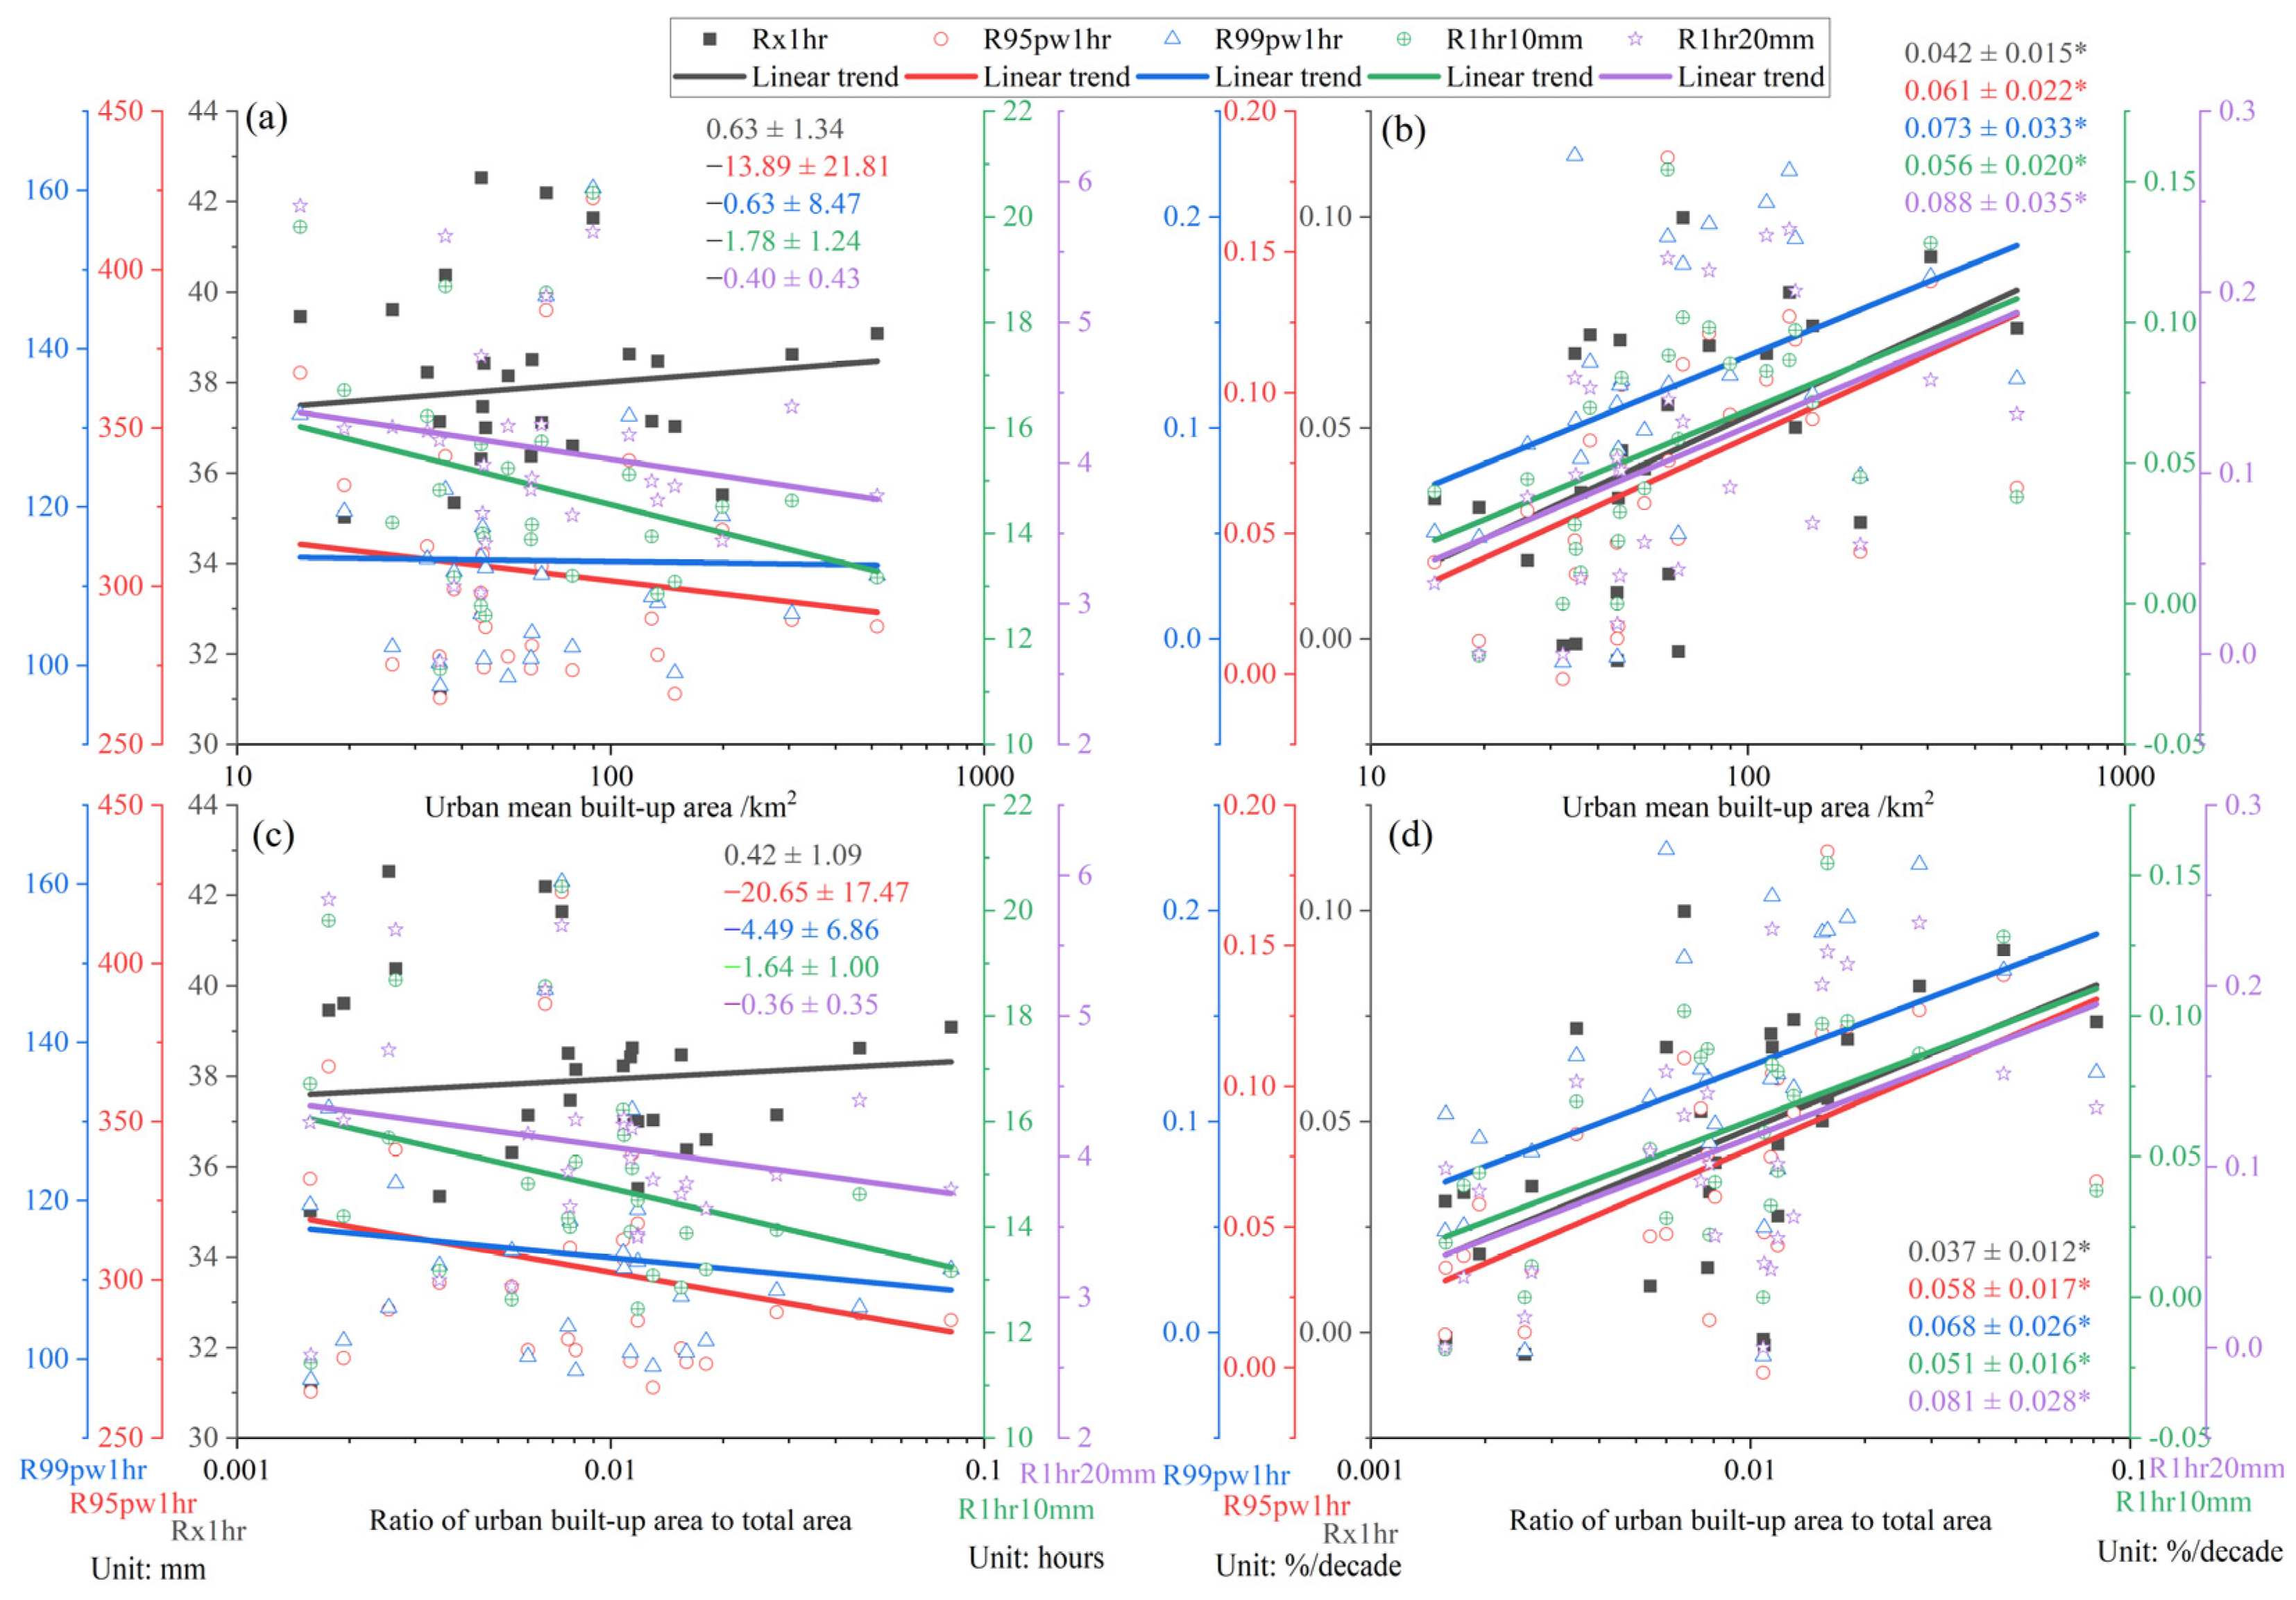
3.2. Relationship Between Urbanization Levels and Extreme Hourly Precipitation

Here, we examine changes in the EHP over the past few decades and investigate the potential relationship to rapid urbanization. Our findings reveal that each city experienced a significant increase in urban built-up areas from 1984 to 2012 (see Figure S2). Specifically, the urban built-up areas across the YRD urban agglomeration expanded from 858 km2 to 5435 km2. The urban built-up areas vary substantially among the cities, with mean values ranging from 14.76 km2 in Chizhou to 516.52 km2 in Shanghai. Overall, the proportion of urban built-up areas to total land area has risen from 0.35% to 2.22% across the YRD. Shanghai has the highest proportion at 8.16% (ranging from 2.85% to 13.97%), while Xuancheng has the lowest at 0.16% (ranging from 0.05% to 0.39%). Next, we explore the connection between extreme hourly precipitation and the levels of urbanization in 27 cities, as illustrated in Figure 8, and we calculate their correlation coefficients (Table 4). The analysis reveals that the relationships between the mean values of the EHP and both urban built-up areas and their proportion relative to total areas are not statistically significant. However, we do find significant relationships between the change rates of EHP indices and urbanization levels, both in terms of urban mean built-up areas and their proportions. Specifically, the change rates of the EHP tend to increase significantly with higher urbanization levels at a significance level of α = 0.05.
Moreover, we also analyze the relationship between the EHP and regional urban built-up areas in each year across the YRD urban agglomeration during 1984–2012 and estimate their correlation coefficients based on Spearman correlations, as shown in Figure 9 and Figure S6. Overall, positive correlations are found for all variables, especially for the Rx1hr, R99pw1hr, and R1hr20mm at a 0.05 significance level. That is, the EHP is increasing as regional urban built-up areas increase, with the higher trends at the urban stations compared to those at the rural stations.

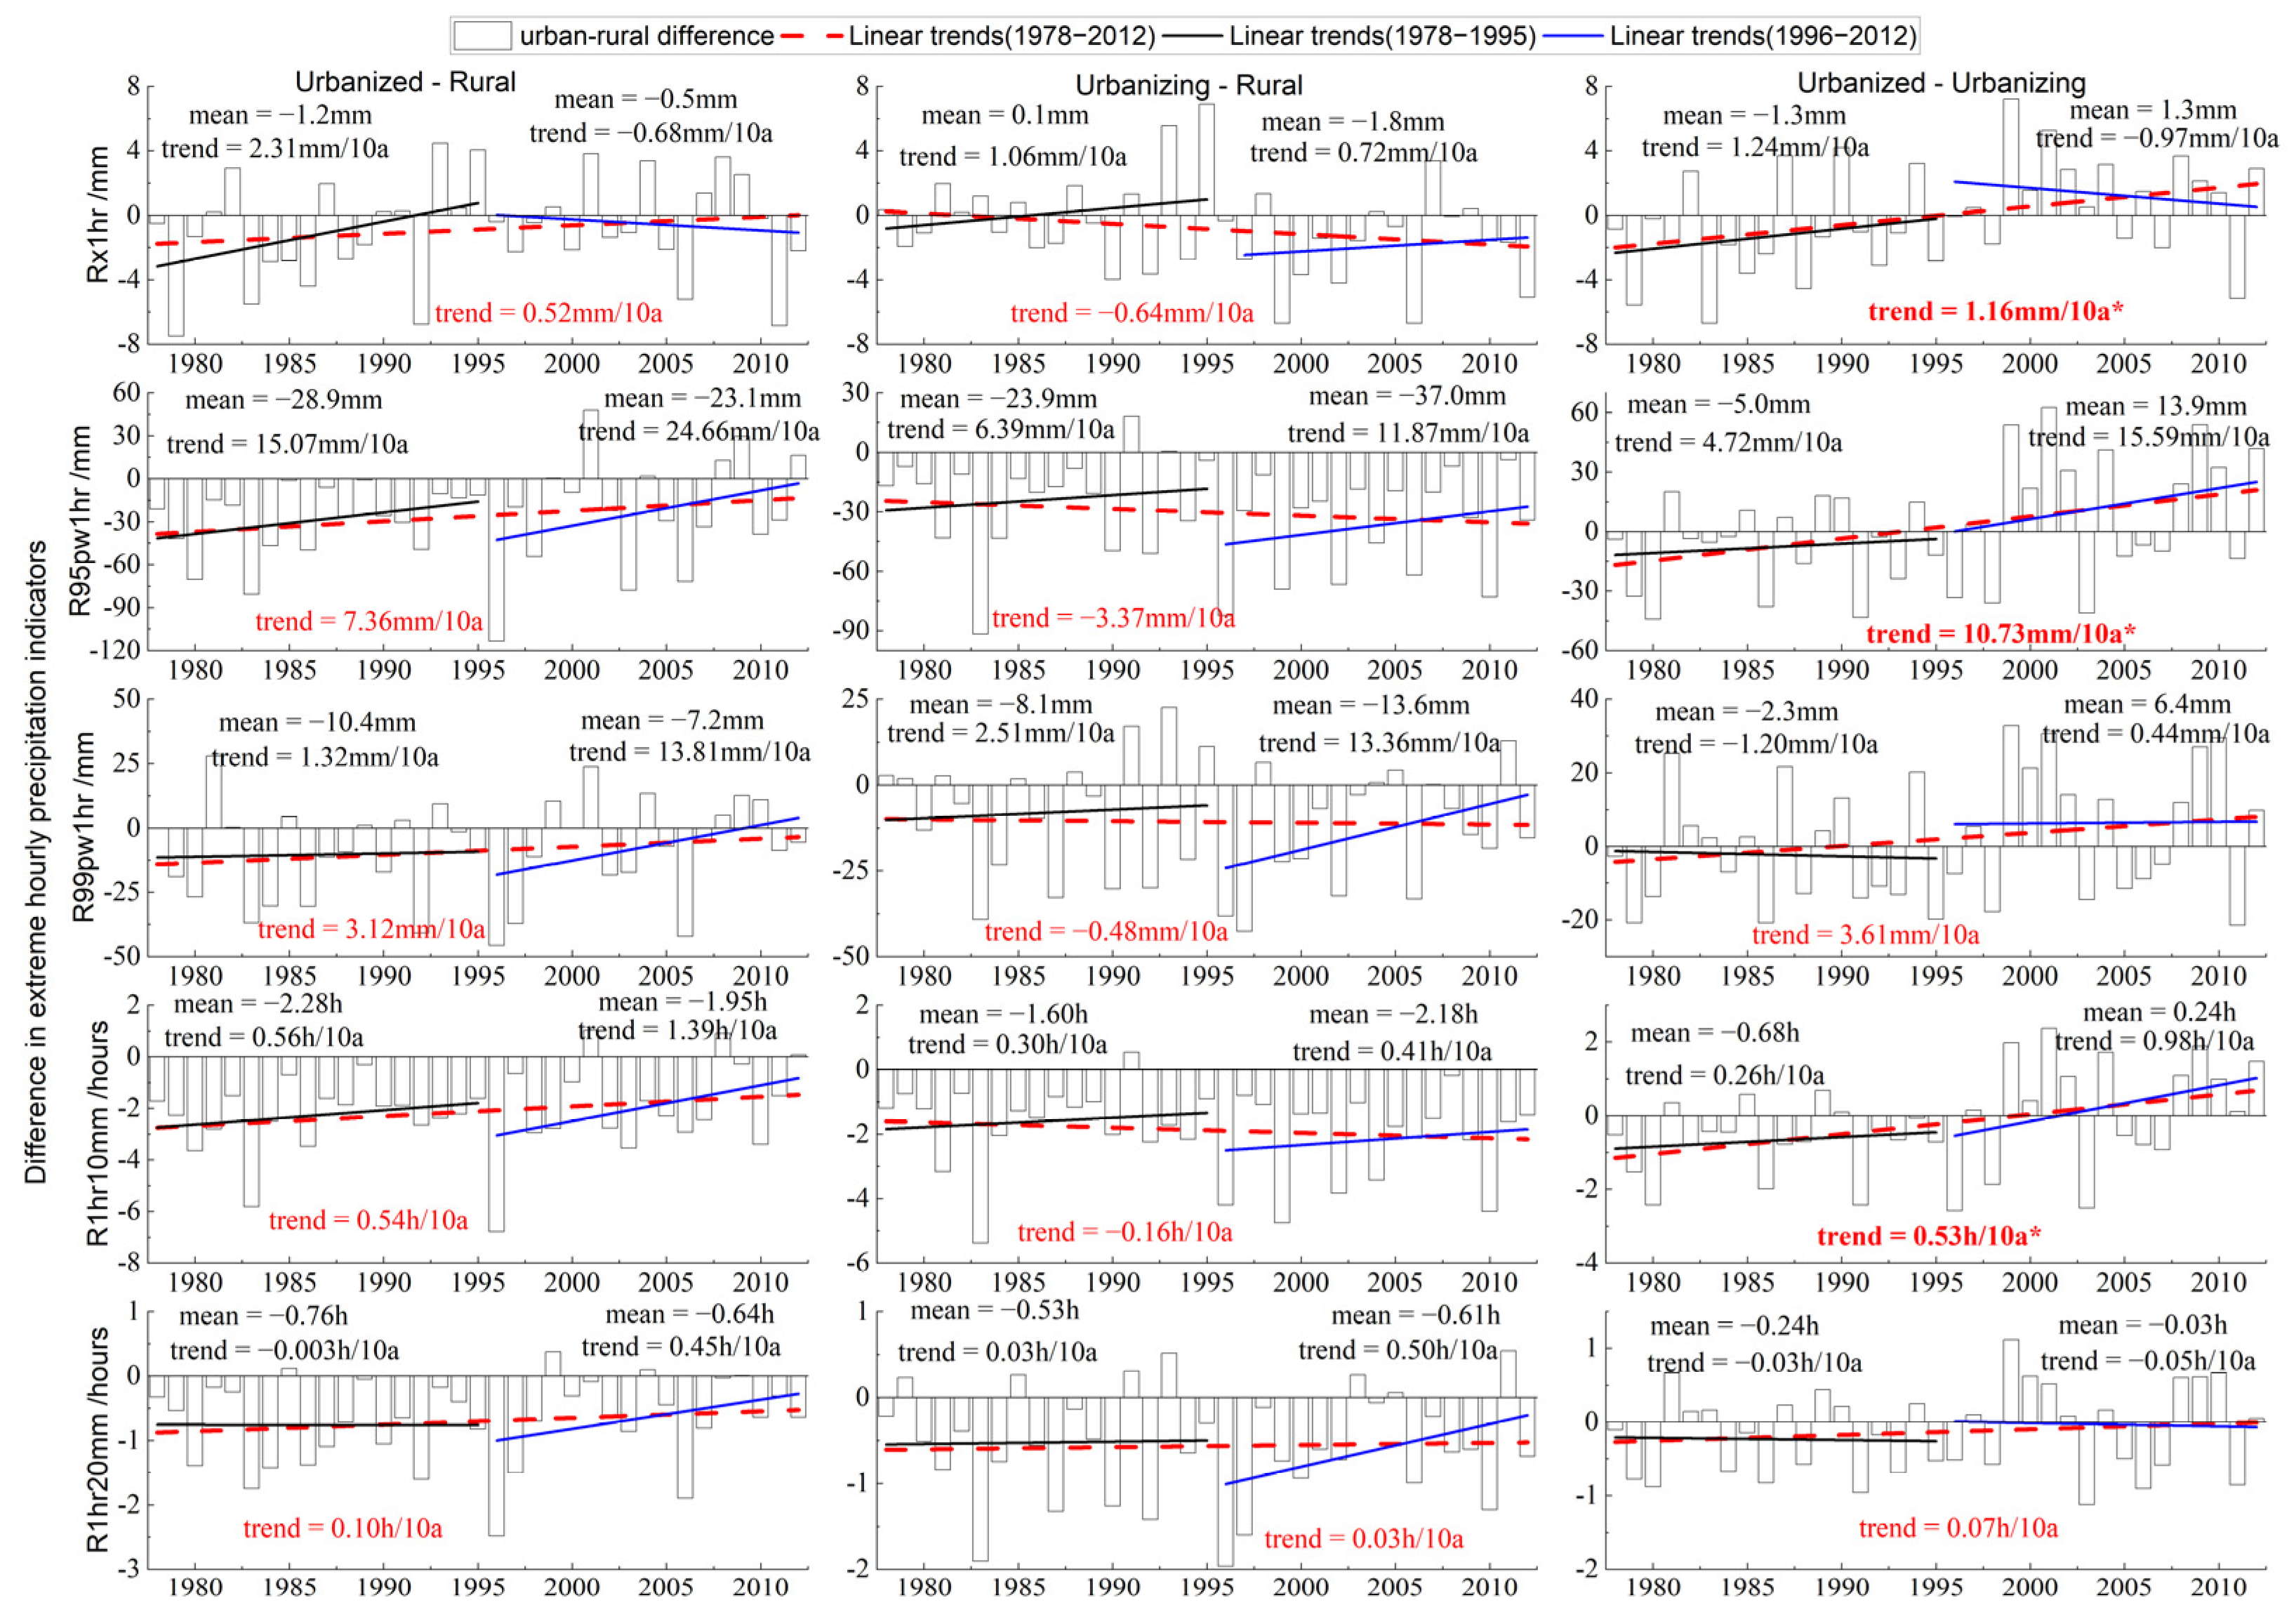
3.3. Impact of Urbanization on the Changes in Extreme Hourly Precipitation

To explore the urban–rural differences in the EHP across the YRD urban agglomeration, the differences between various types of stations were classified into three scenarios: urbanized–rural (Scenario I), urbanizing–rural (Scenario II), and urbanized–urbanizing (Scenario III). Figure 10 shows the changes in urban–rural differences for the above scenarios. From the values of urban–rural differences, the majority of urban–rural differences are negative values for the three scenarios, especially for Scenarios I and II, indicating that urbanized (urbanizing) stations generally have lower values compared to rural stations. However, their differences change from negative values in the early stage to positive ones in the later stage for Scenario III, meaning that urban-induced changes in urbanized stations are higher than those in urbanizing stations. The positive trends of urban–rural differences in the period of 1978–2012 for Scenarios I and III represent the role of urbanization in amplifying the intensification of extreme precipitation. In other words, the EHP increased faster over urbanized areas than in rural and urbanizing areas. However, the majority of the urban–rural differences for Scenario II are negative, implying the amplification role of urbanization in decreasing extreme precipitation, with a higher increase in rural areas than in urbanizing areas. From the different stages of urbanization, most of them are positive trends (80% for Scenario I, 100% for Scenario II, and 60% for Scenario III), but the higher increasing magnitudes are in the second stage rather than in the first stage. Urbanization has distinct effects on the EHP due to the different conditions or stages.
Table 5 shows the contribution rates of urbanization to the EHP based on the CRmean and CRslope. Overall, urbanization affects various indicators differently, both positively and negatively, across the whole area. Specifically, from the CRmean index, when comparing urbanized stations with rural/urbanizing ones, the overall contribution of urbanization to the changes in the EHP is positive. However, for Scenario II, most of them (4 out of 5) are negative. Similar results are observed from the CRslope index between 1978 and 2012, but with varying magnitudes. Additionally, about 73.33% of cases (11 out of 15) show a higher contribution rate in the later stage of urbanization compared to the early stage, implying that the contributions of urbanization to the changes in the EHP may be related to the urbanization levels. Certainly, the consistent results from CRmean and CRslope imply that urbanization’s contribution to the regional changes in the EHP is rational, with their contributions less than 50% for most of the indices. To some extent, urbanization may not be a dominant driving factor for the observed changes in the EHP, particularly under global warming and climate change, which requires paying more attention to this issue in future work.

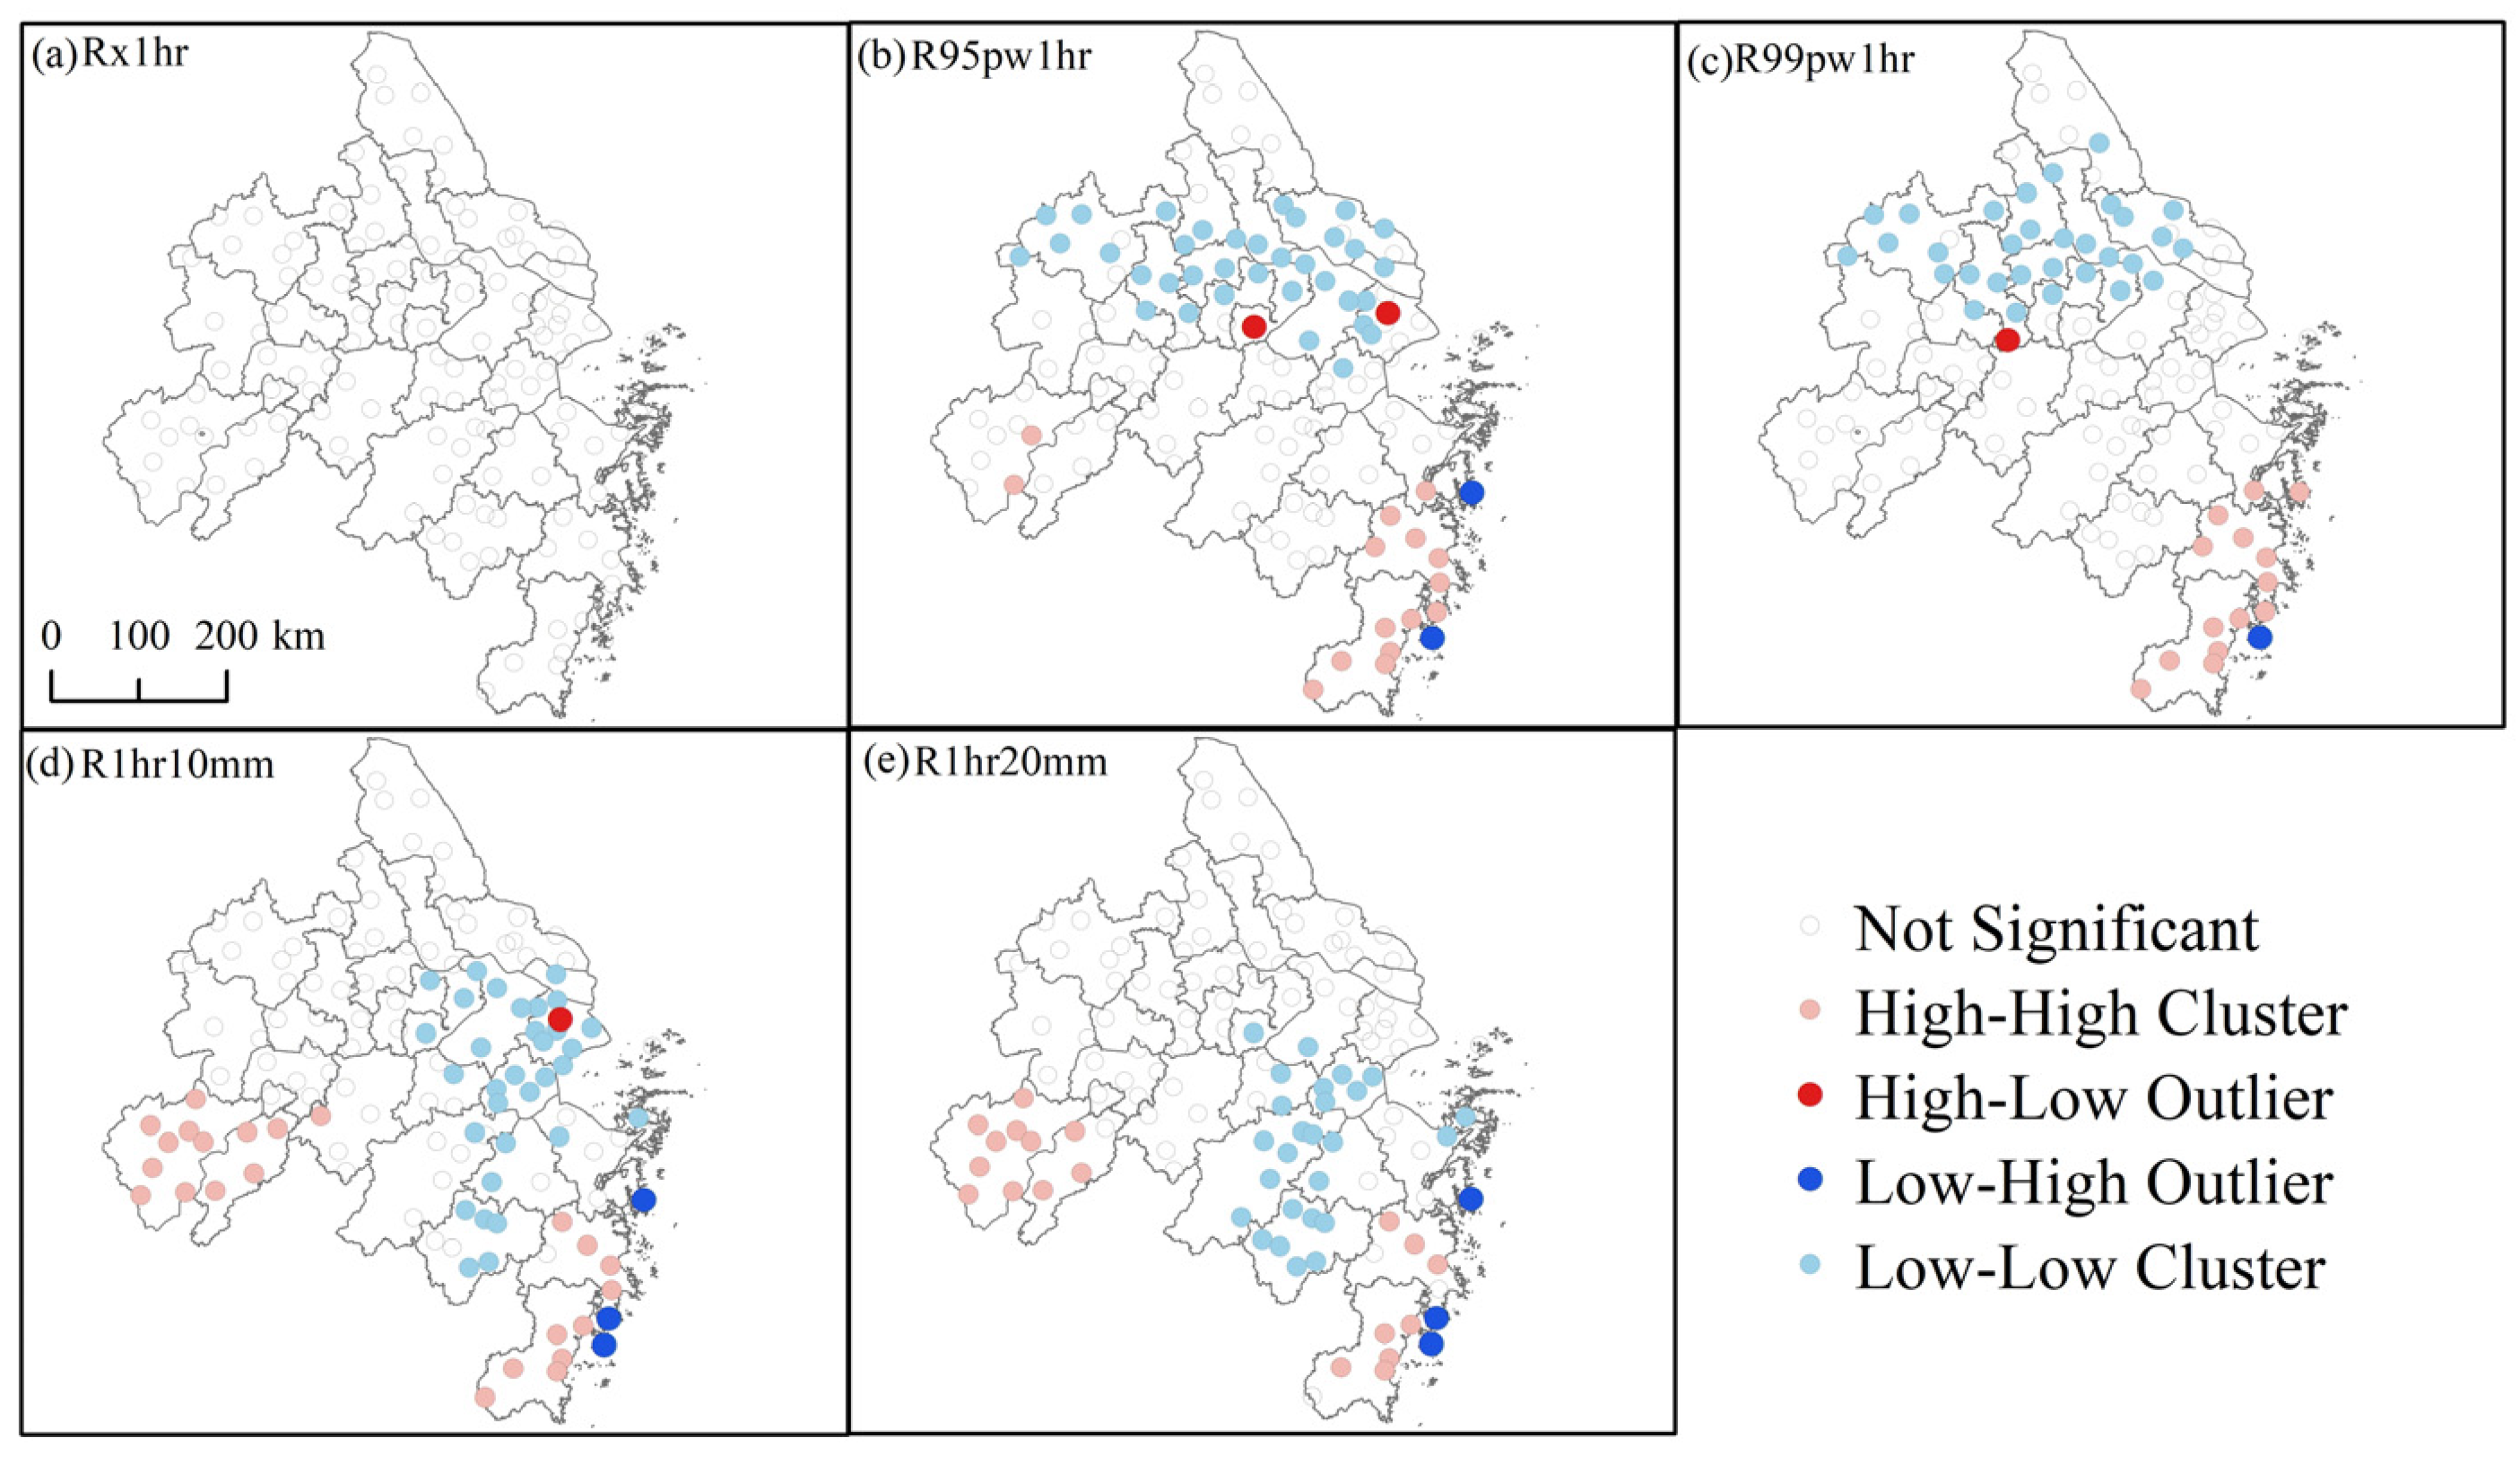
3.4. Spatial Heterogeneity of Urbanization Effects on Extreme Hourly Precipitation

Figure 11 shows that all indices are increasing for six sub-regions with various magnitudes, which are consistent with those in the YRD (Figure 4). About half of them (sixteen out of thirty) show significant increases, with five in Rx1hr; three in R95pw1hr, R99pw1hr, and R1hr20mm; and two in R1hr10mm, particularly in SuXiChang and Ningbo, with all being significant increases. However, there is no significant change in the Hangzhou metropolitan area, and most of them are nonsignificant in Shanghai and Hefei. From the perspective of the two different stages of urbanization development, their trends in different sub-regions are inconsistent. For the Shanghai region, except for R1hr20mm, the slope of all other indicators in the early stage of urbanization development is larger than that in the later stage of urbanization. Similar results can be seen in the Hangzhou metropolitan area, except for Rx1hr. However, for the other four metropolitan areas, most of the indices show a higher trend at the later stage than in the early stage. There are significant temporal and spatial variations in extreme hourly precipitation changes over the YRD due to changing environmental conditions.
Figure 12 shows the trends and their rates of change in the EHP for different types of stations (i.e., urbanized, urbanizing, and rural stations), different periods (i.e., 1978–1995, 1996–2012, and 1978–2012), and sub-regions. Similarly, almost all trends are positive for the three types and six sub-regions in 1978–2012, with only Rx1hr and R1hr20mm for rural stations in Hefei demonstrating slightly decreasing trends at rates of −2% (−0.72 mm) and −0.09% (−0.004 h) per decade, respectively (Figure S7). Only one third of them show significant increases, mainly located in Nanjing (10 of 15), SuXiChang (8 of 15), and Ningbo (6 of 15), particularly in urban areas (e.g., urbanized and urbanizing stations). Certainly, the same trends are also found in 1978–1995 and 1996–2012, with the increasing trends accounting for 87.78% and 83.33% for all the stations and indices, respectively. Moreover, there are notable differences in the magnitudes of trend rates among these types of stations and sub-regions, with higher means and lower standard deviations in urban areas compared to rural areas (Figure S8), particularly from 1996 to 2012. In a sense, rapid urbanization may play a positive role in intensifying the EHP over urban areas; that is, it may enhance the effects of urbanization on the changes in the EHP, resulting in a higher increase in urban areas.
Here, the two indices based on the changes in means and trends (Section 2.3.4) are also used to quantify the effects of urbanization on the EHP (see Figure 13) and to identify the urbanization’s contributions (see Figure 14) for different sub-regions. The results from the two indices are the same but with different magnitudes. The effects of urbanization on the EHP exhibit strong spatial heterogeneity across the YRD urban agglomeration, with obvious differences among the six sub-regions and three urban–rural scenarios. Overall, the positive effects are mainly found in the Hefei (100% for the slope index and 86.67% for the mean index), SuXiChang (86.87% and 93.33%), and Ningbo (80% and 73.33%) metropolitan areas, and the negative roles are observed in the Shanghai (60% and 73.33%), Nanjing (66.67% and 53.33%) and Hangzhou (86.67% and 80%) metropolitan areas. Moreover, urbanization shows a positive effect on the changes in the EHP for the urbanized–rural and urbanized–urbanizing scenarios, accounting for 56.67% (60%) and 76.67% (76.67%) using the slope (mean) index, respectively. However, the negative effects are dominant for the urbanizing–rural scenario with 56.67% and 63.33% based on the slope and mean indices, respectively. Thus, it may be correlated with the urbanization levels, but the urbanization effects show significant spatial and temporal variations.
The contributions of urbanization to changes in the EHP indices are similar across the two indices, though they differ in magnitude (Figure 14). Additionally, contrasting contributions are observed in various sub-regions and urban–rural scenarios, which align with the previous findings regarding urban effects. We discovered that some contributions exceed ±100%, indicating that other factors also play a significant role in changes in the EHP, though those factors were not identified in this study. Overall, the differing results from various sub-regions and urban–rural scenarios suggest that urbanization affects the EHP in varying ways. These findings emphasize that the impacts of urbanization are complex and may be influenced by additional factors, such as local conditions, climate variations, and natural fluctuations.

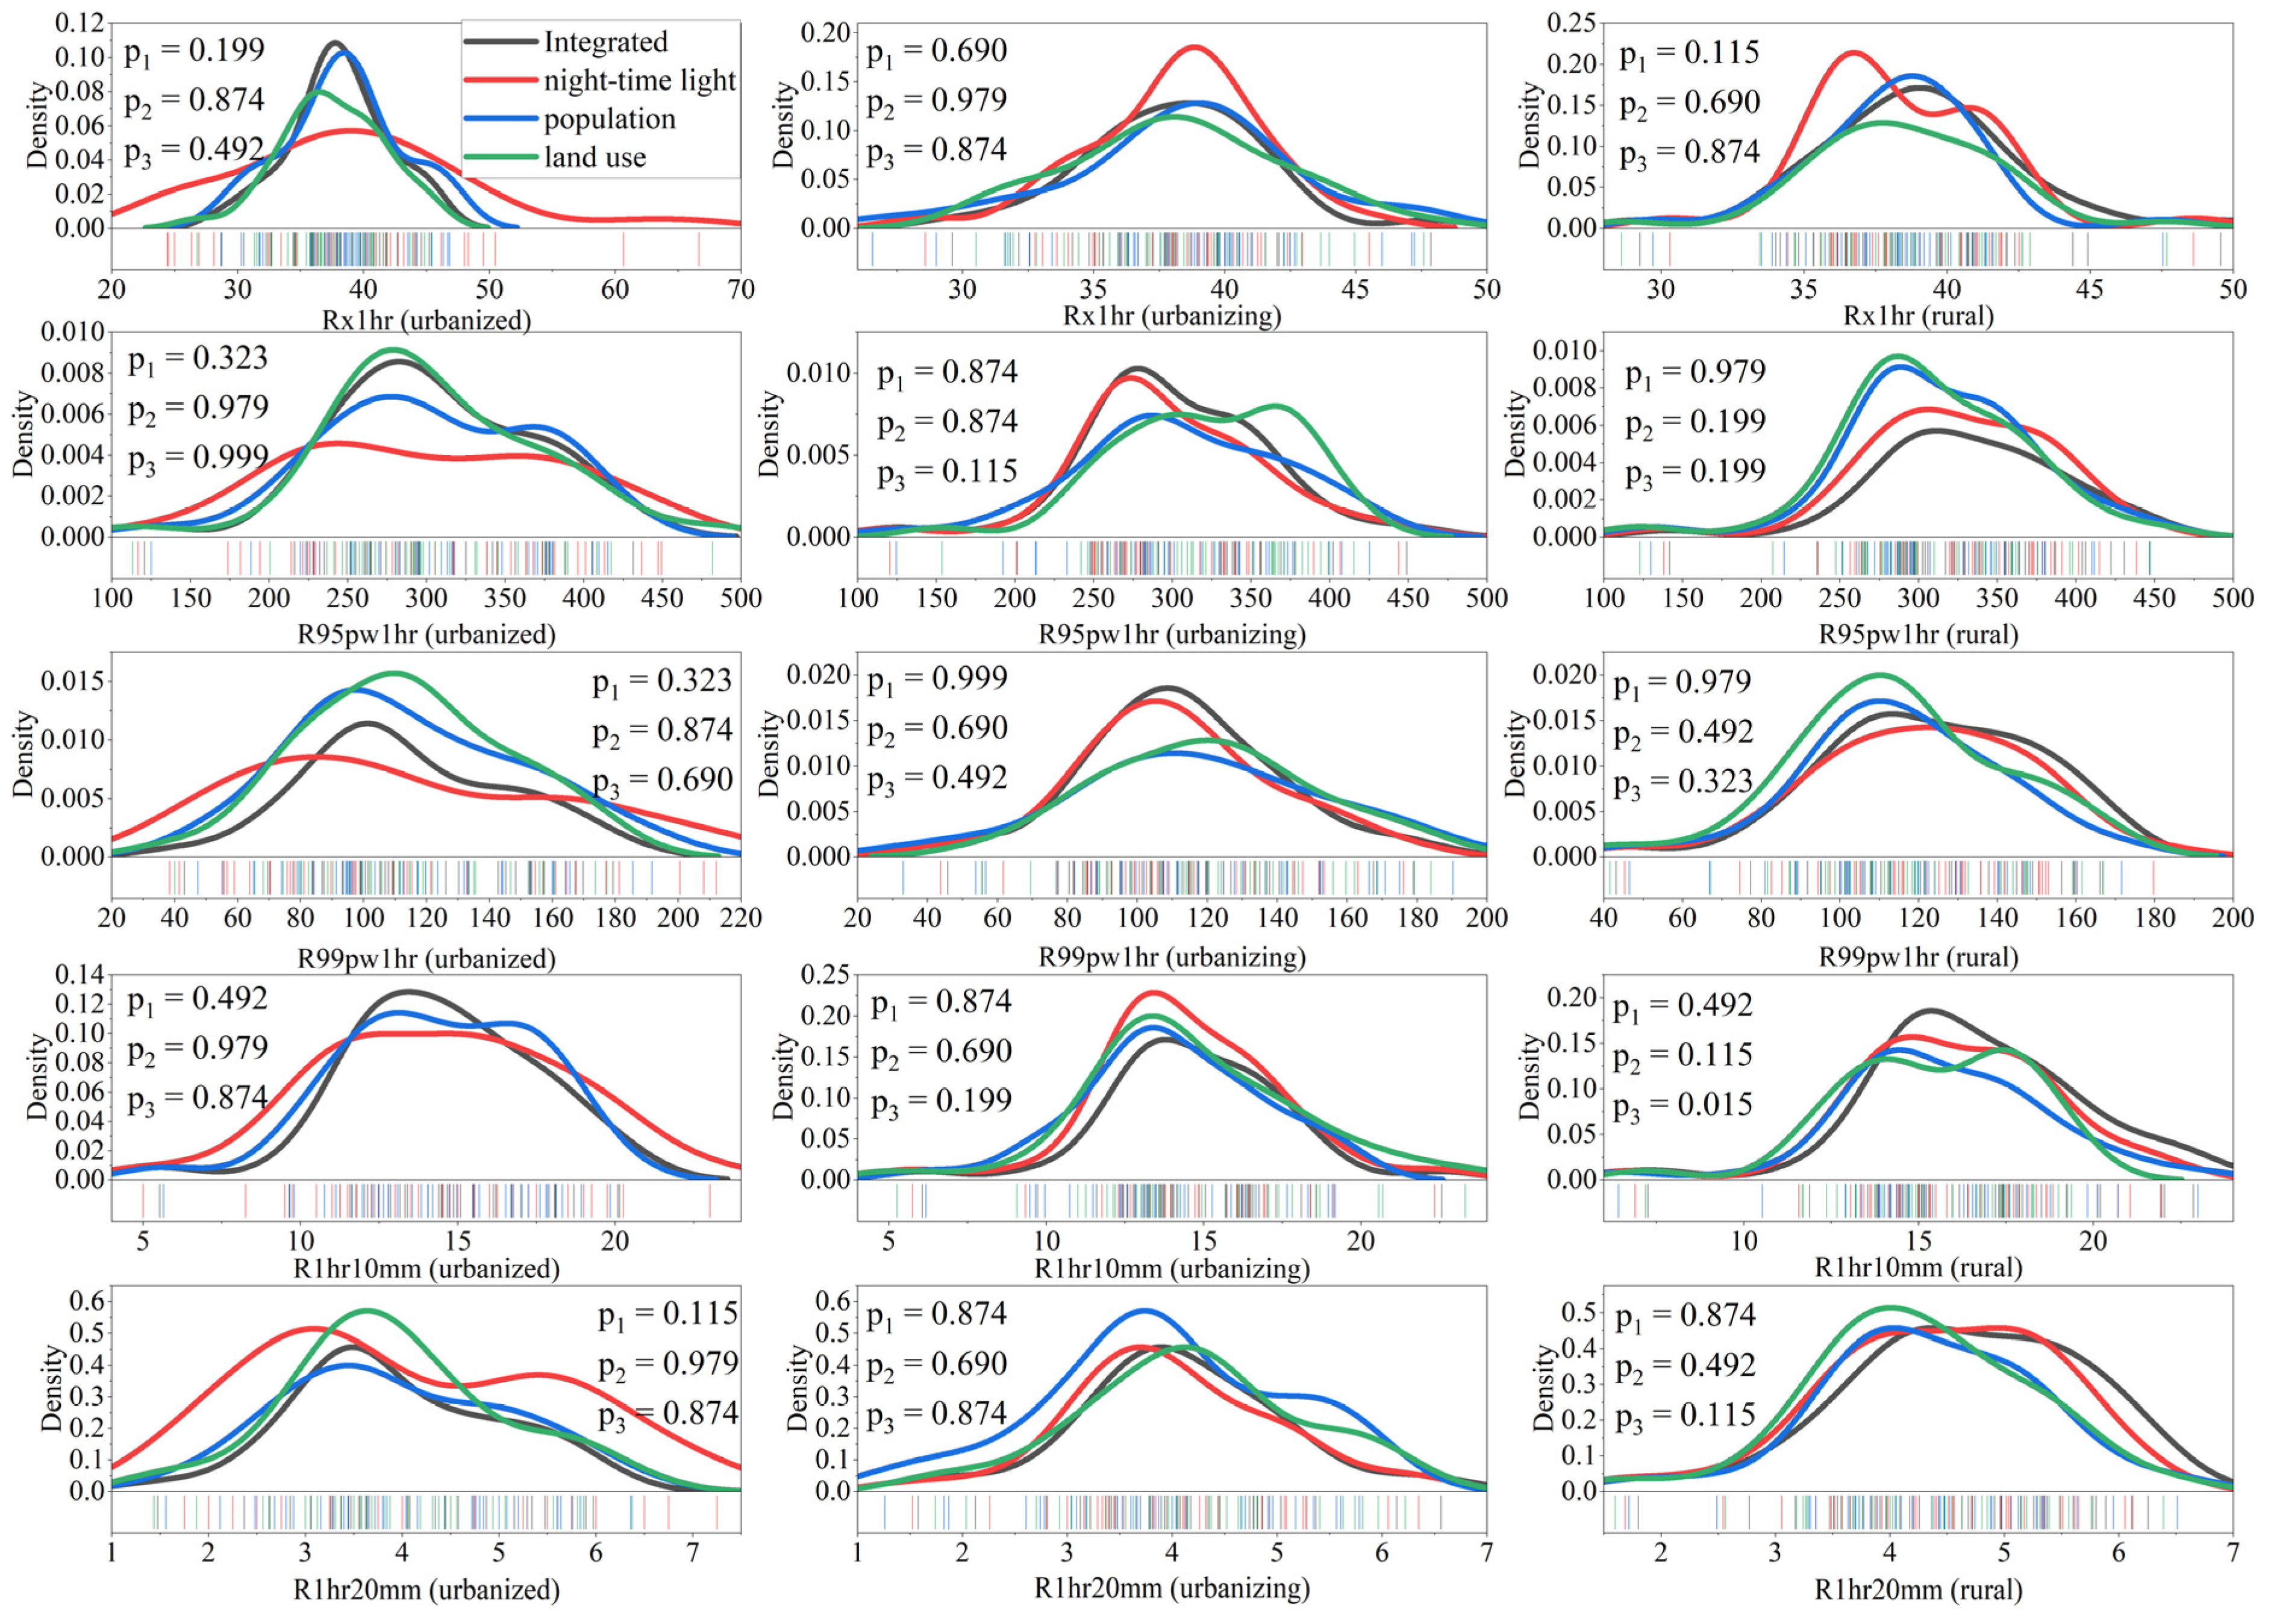
3.5. Uncertainty Analysis of Urbanization Effects

As previously stated, a crucial step is to identify the urban and rural stations with the four methods: the integrated method used in this work and the single-source classification methods based on night-time light, population, and land use data. In the above section, we use an integrated method to examine the possible impacts of urbanization on the changes in the EHP. Here, we aim to assess the results and their uncertainties from different urban–rural classification methods. We found that the extreme precipitation series based on the four methods are not significantly different, with similar probability density functions, as shown in Figure 15.
Then, we estimate the effects of urbanization on the changes in the EHP across the YRD urban agglomeration from 1978 to 2012, as shown in Figure 16. The results from the four urban–rural classification methods reveal varying impacts of urbanization on the EHP. In most cases, urbanization has a positive effect, accounting for contributions of 66.67% (73.33%), 60% (53.33%), 100% (100%), and 53.33% (40%) as measured by mean-based (slope-based) methods across integrated, night-time light, population, and land use classifications, respectively. Additionally, urbanization predominantly contributes positively to changes in the EHP for Scenarios I and III, while its negative impact is noticeable in Scenario III. Notably, all contributions are positive when evaluated using the population method. In summary, although the effects of urbanization on changes are fundamentally similar across different contexts, the contributions significantly vary depending on the classification methods, with the larger magnitudes observed among the four approaches.

4. Discussion

Here, we found that all the EHP indices showed a positive trend over the YRD, particularly in the urban stations with a higher magnitude at the rapid urbanization stage. Moreover, the changes in the EHP are significantly correlated with rapid urbanization, such as the indices about urban built-up areas and their proportions to total areas. Overall, our findings are consistent with previous studies, such as Jiang et al. [38], who revealed that both non-TC (tropical cyclones) and TC-induced extreme hourly precipitation showed increasing trends over the YRD urban agglomeration, with statistically significant larger increases at urban stations than those at the nearby rural stations; Mou et al. [72] found that urbanization has an increasing effect on regional extreme precipitation, with more extreme precipitation and a greater growth rate in highly urbanized areas.
Besides, our findings highlighted that the effects of urbanization on the changes in the EHP across the YRD are relatively limited, with its contribution being less than 50%, but there are differences for various sub-regions and urban–rural scenarios, which is largely consistent with the work of Fu et al. [20]. Although the effects of urbanization on the EHP may be correlated with urbanization levels and stages, their physical mechanisms are not clear and complex. In this work, we found that the high urbanization level (i.e., urbanized stations) can enhance the higher increases in extreme precipitation, but the low urbanization level (i.e., urbanizing stations) has the least increases (even less than that of rural stations). That is, the contrasting results on urban effects are found in the YRD urban agglomeration. These distinct precipitation responses to different urban development patterns were also described in the literature [17], with dispersed urban development offering relief from the impacts of enhanced extreme precipitation. Similarly, Tang et al. [26] found that the frequency and amount of the EHP are lower at the stations with high urbanization levels, but the intensity increases with urbanization levels. By analyzing the urban–rural differences in the EHP indices across the YRD regarding dynamic urban–rural classification methods and various assessment indices, our results indicate that the impacts of urbanization on the EHP are complex, with significant regional differences and relations with many factors, such as urbanization levels, urbanization stages, and local conditions.
As mentioned above, the critical task is to identify the urban and rural areas to quantify their differences and further analyze the possible effects of urbanization on the precipitation changes. Thus, in this work, we dynamically classify the urban–rural areas for different stages of urbanization development and propose an integrated method from the multi-source dataset, such as night-time light, land use, and population density data, to conduct the comparative classification of urban–rural stations. Compared to the single-source classification method, the integrated classification method enables better identification of urban stations, resulting in a more thorough analysis of the potential impacts of urbanization on precipitation changes. The discussion includes the uncertainties associated with urban–rural classification methods, which can lead to differing results due to variations between urban and rural stations. Despite this, our study consistently demonstrates the effects of urbanization in most cases, though the magnitude of urbanization’s contributions varies across different methods. This suggests that these methods can effectively quantify the urban effects on the EHP. Particularly, the long-term dynamic urban–rural classifications with high-resolution remote sensing data or innovative techniques can enhance this assessment.
Previous studies have shown that rapid urbanization has accelerated the frequency of extreme precipitation events in urban areas [73]. This phenomenon results in varying patterns due to differences in climate and topography. The mechanisms by which urbanization affects extreme precipitation are complex and depend on several factors, including changes in land use, the rise in anthropogenic heat (AH) associated with urbanization (such as the urban heat island effect (UHI)), and emissions from aerosols [36]. Urbanization alters underlying surface characteristics like soil moisture, roughness, and albedo, significantly changing the environment in urban areas [74,75]. For instance, the dense clusters of buildings create urban canopy layers that increase surface roughness and reduce wind speed [76]. Such changes affect the movement paths of air masses, enhance mechanical turbulence, and increase low-level convergence within urban regions [20], which can exacerbate convective extreme precipitation [77]. The UHI effect raises temperatures in the lower atmosphere, intensifying vertical motion over urban areas, enhancing water vapor transport, and increasing upward convergence. As a result, this can lead to stronger convection and greater short-term extreme precipitation intensity [78]. Additionally, aerosols released by urban activities can influence precipitation by affecting the heating profile, cloud formation, and microphysical processes in urban environments [79]. On one hand, higher aerosol concentrations can decrease the efficiency of cloud droplet collision and coalescence, which may reduce the frequency of precipitation from shallow clouds [80]. On the other hand, aerosols can promote cloud droplet growth through condensation and help transform them into ice crystals through updrafts. This process can thicken the cloud and promote strong convection, leading to thunderstorms and heavy convective precipitation [81,82]. It is necessary to clarify that in our study, urbanization only refers to changes in land use and does not account for the effects of aerosols and AH, even though urban aerosols and anthropogenic heat may increase downwind convectional rainfall, the intensity and frequency of extreme precipitation, and its spatial distribution [83]. Therefore, a comprehensive investigation of how urban factors affect extreme precipitation should be considered in future research.
Here, our study solely focuses on the effect of urbanization on the EHP, without considering the possible influence of thermal factors, atmospheric circulation conditions, and other factors (e.g., climatological and topographic characteristics). Moreover, climate change can also enhance or mitigate urbanization effects in different regions [84,85]. Therefore, further research is necessary to investigate the urbanization effects resulting from climate change, and some attempts should be made to combine statistical methods with physical models to construct a more scientific and precise system for analyzing the changes in the EHP and their relationships with rapid urbanization. The establishment of a kinetic rainfall model, incorporating principles of atmospheric dynamics and thermodynamics, will create a dynamic model that accurately reflects the processes of rainfall formation and evolution.

5. Conclusions

In this work, we examined the changes in the EHP and their responses to rapid urbanization across the YRD urban agglomeration from 1978 to 2012 using the observed hourly scale meteorological records and five extreme precipitation indices (i.e., Rx1hr, R95pw1hr, R99pw1hr, R1hr10mm, and R1hr20mm). The main conclusions are as follows:
(1)
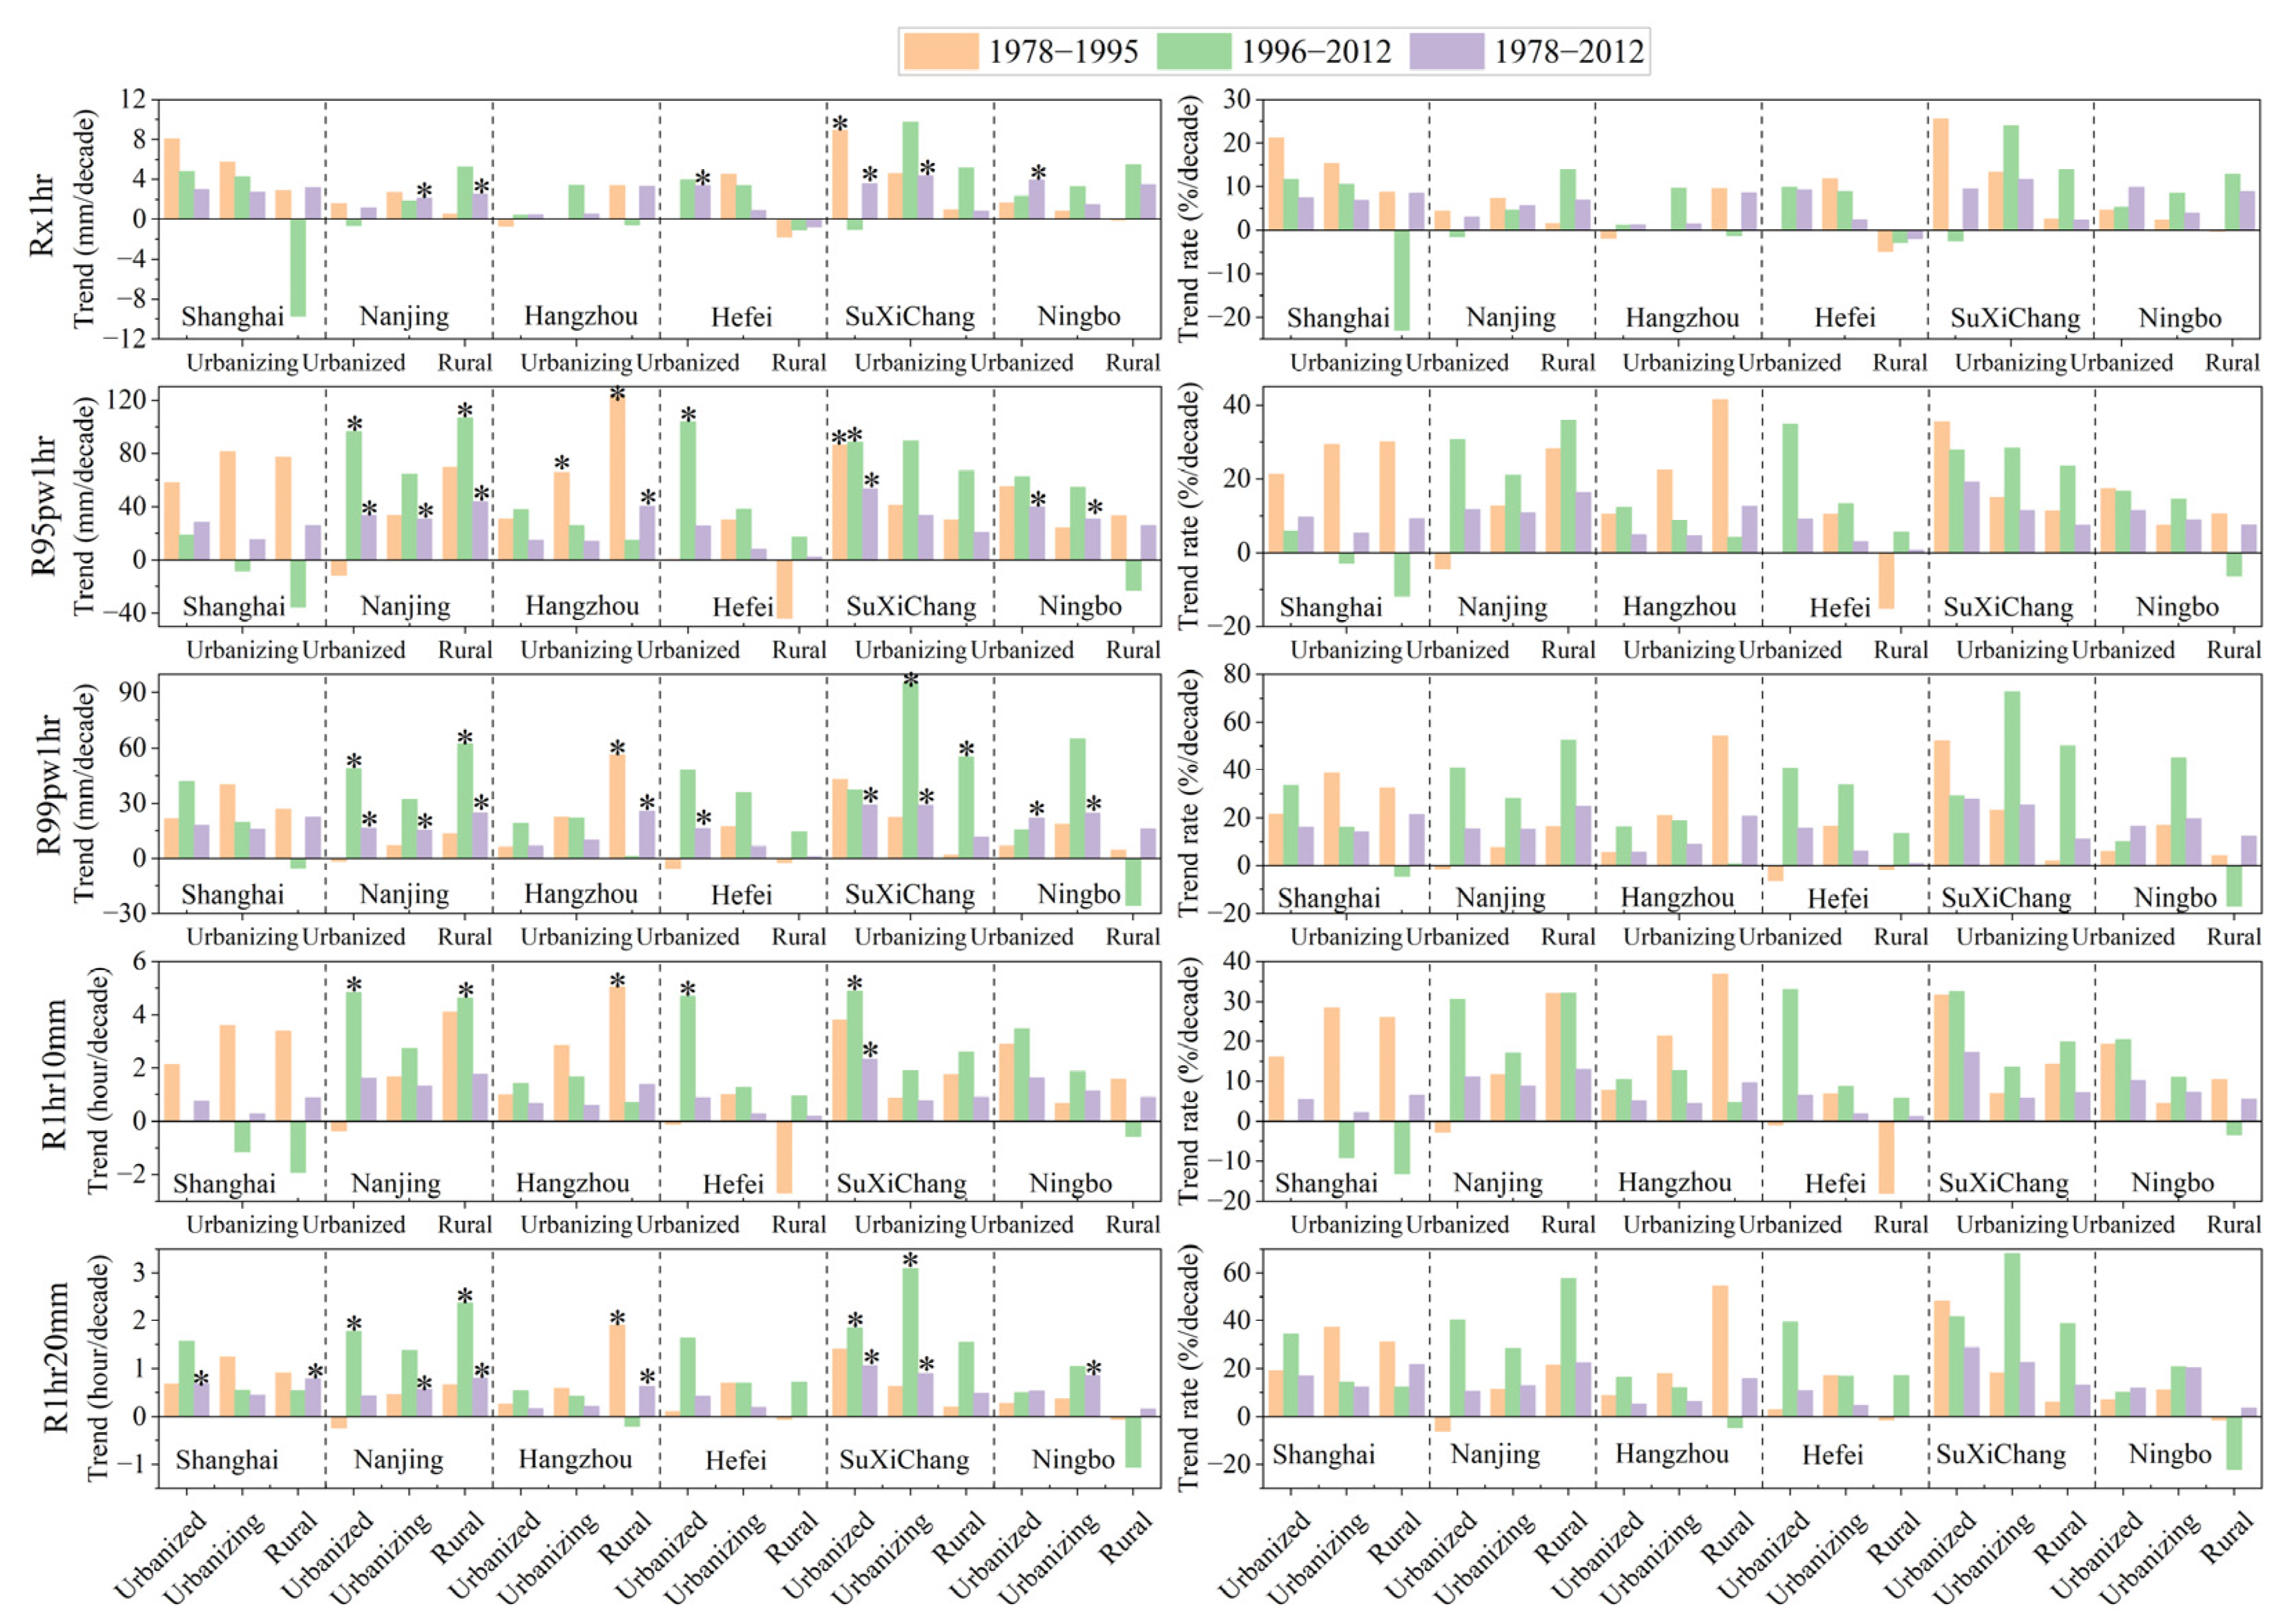
The YRD urban agglomeration shows a positive trend in all EHP indices during different periods for various types of stations, with higher increases in the urban areas and at the rapid urbanization stage. Spatially, the EHP decreases from the southeastern to the northwestern part of the YRD region, with similar patterns for each index during different periods.
(2)
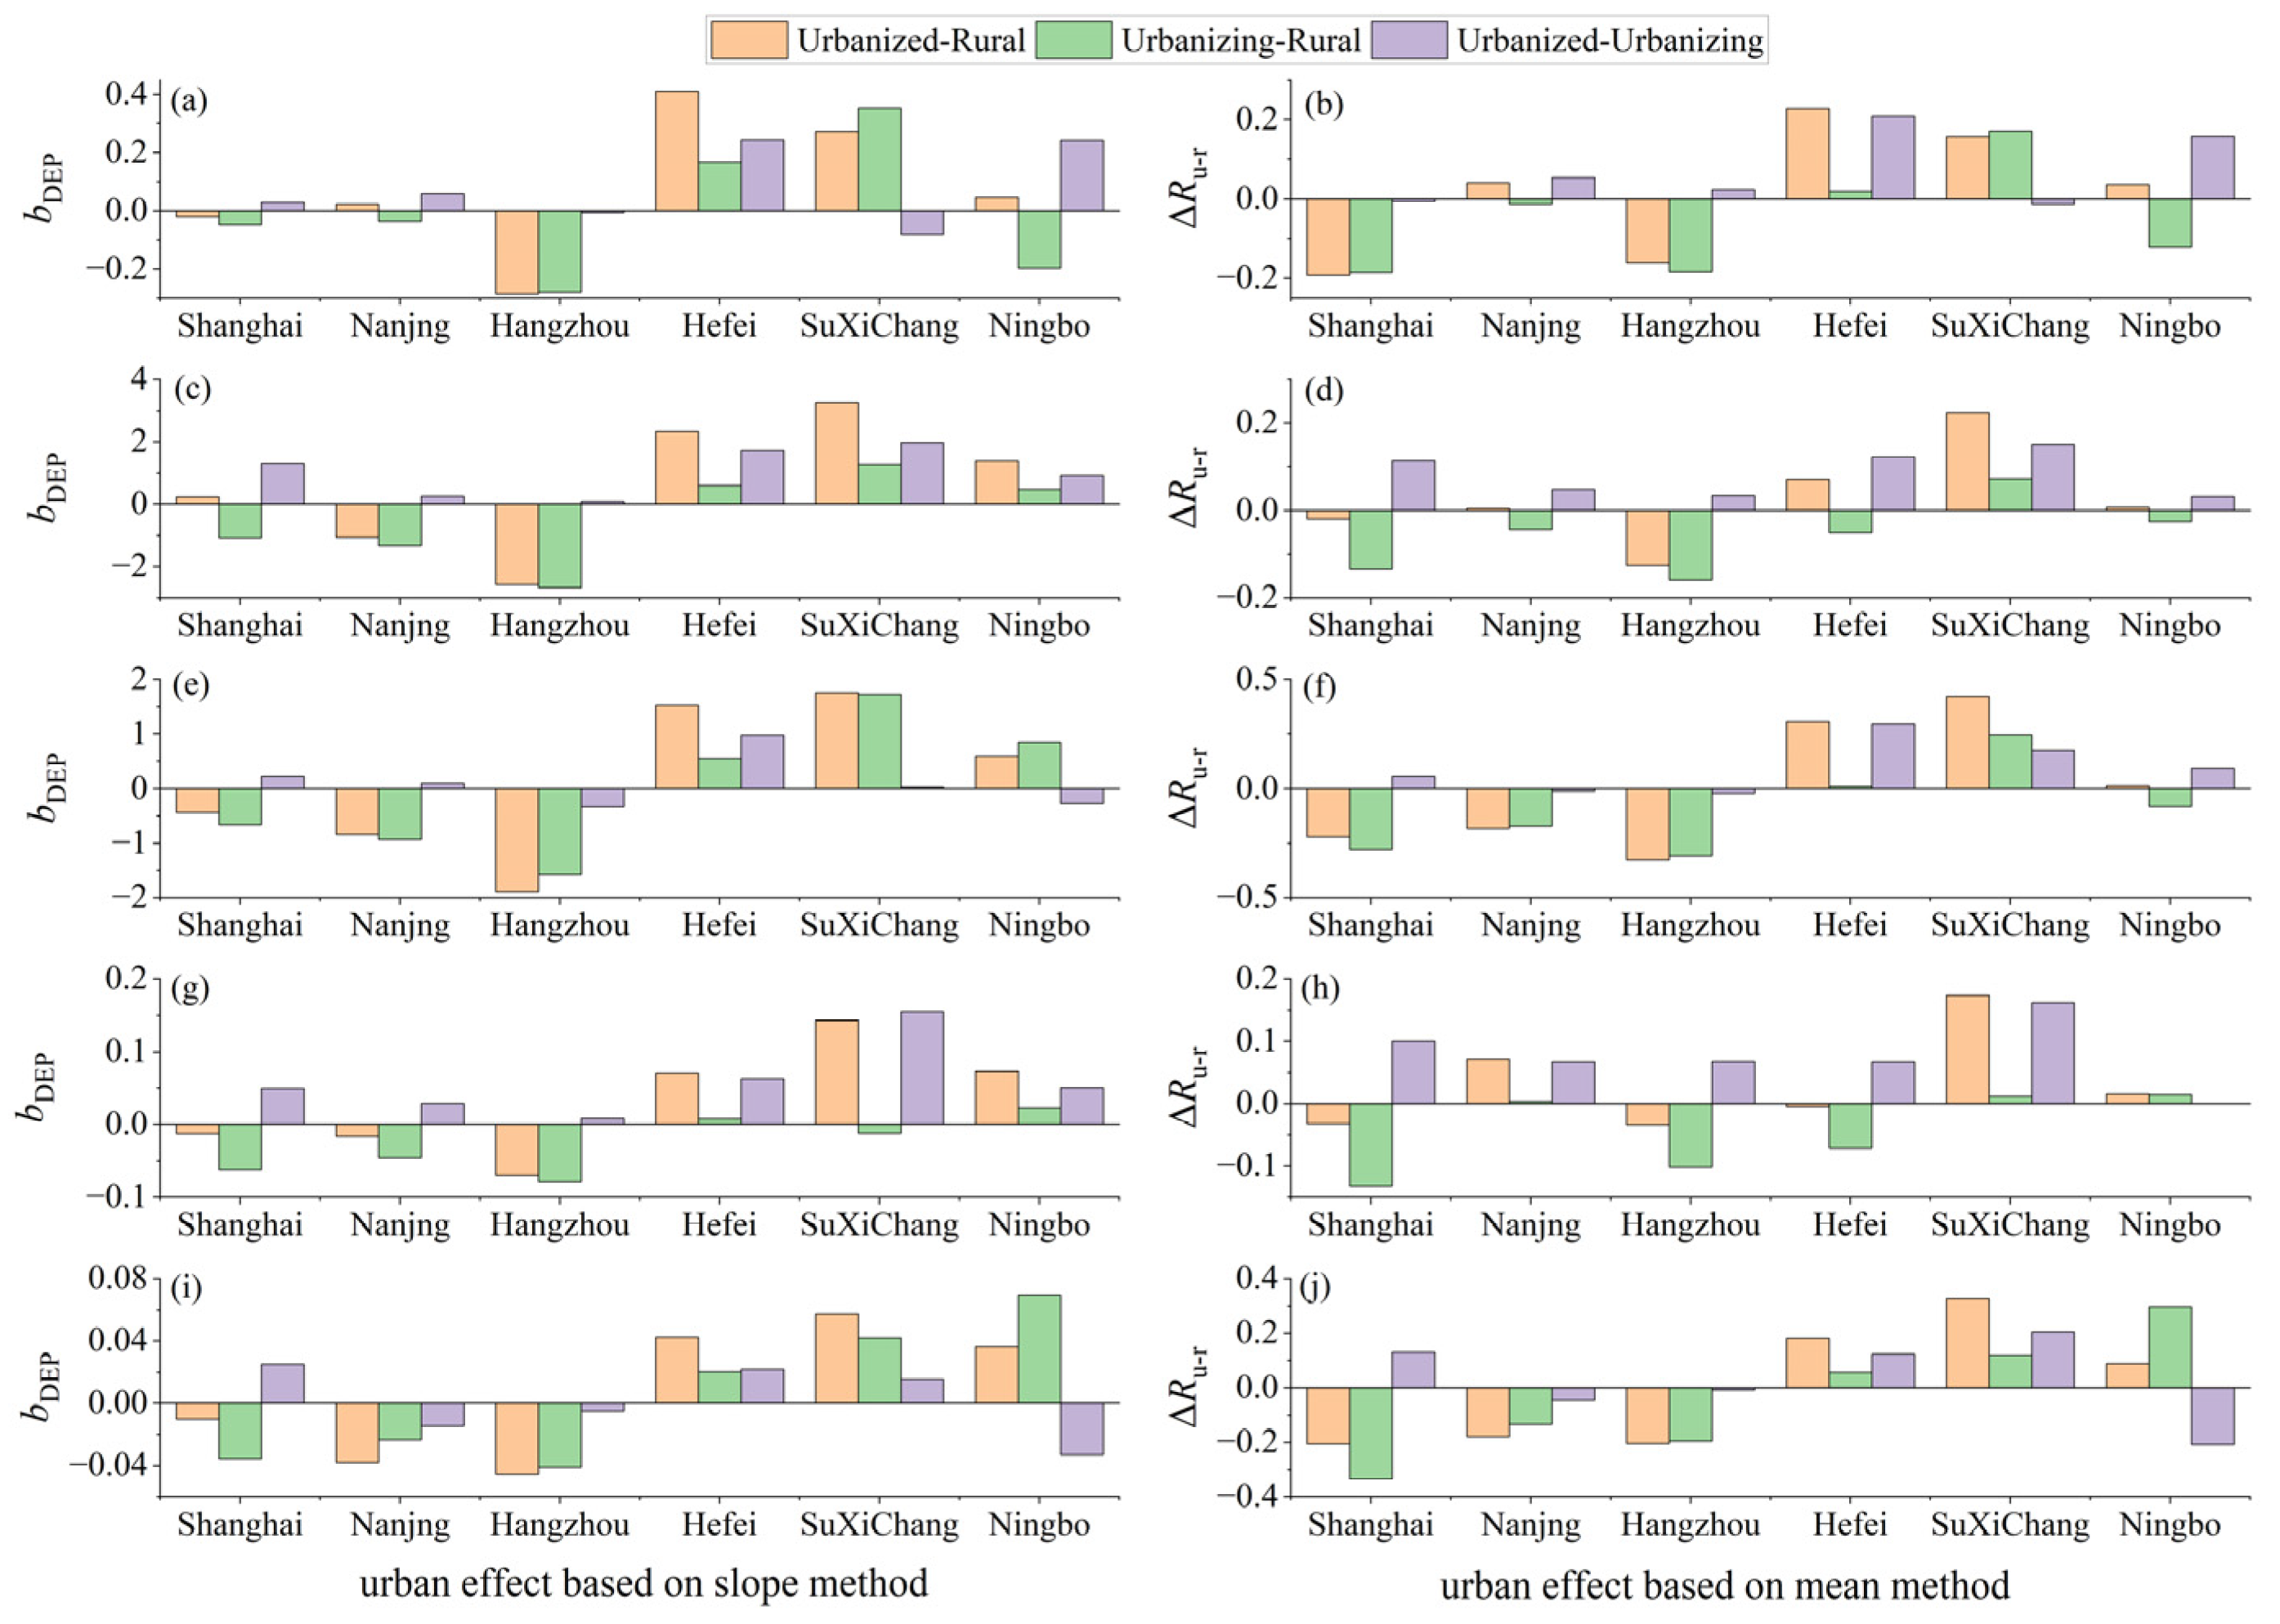
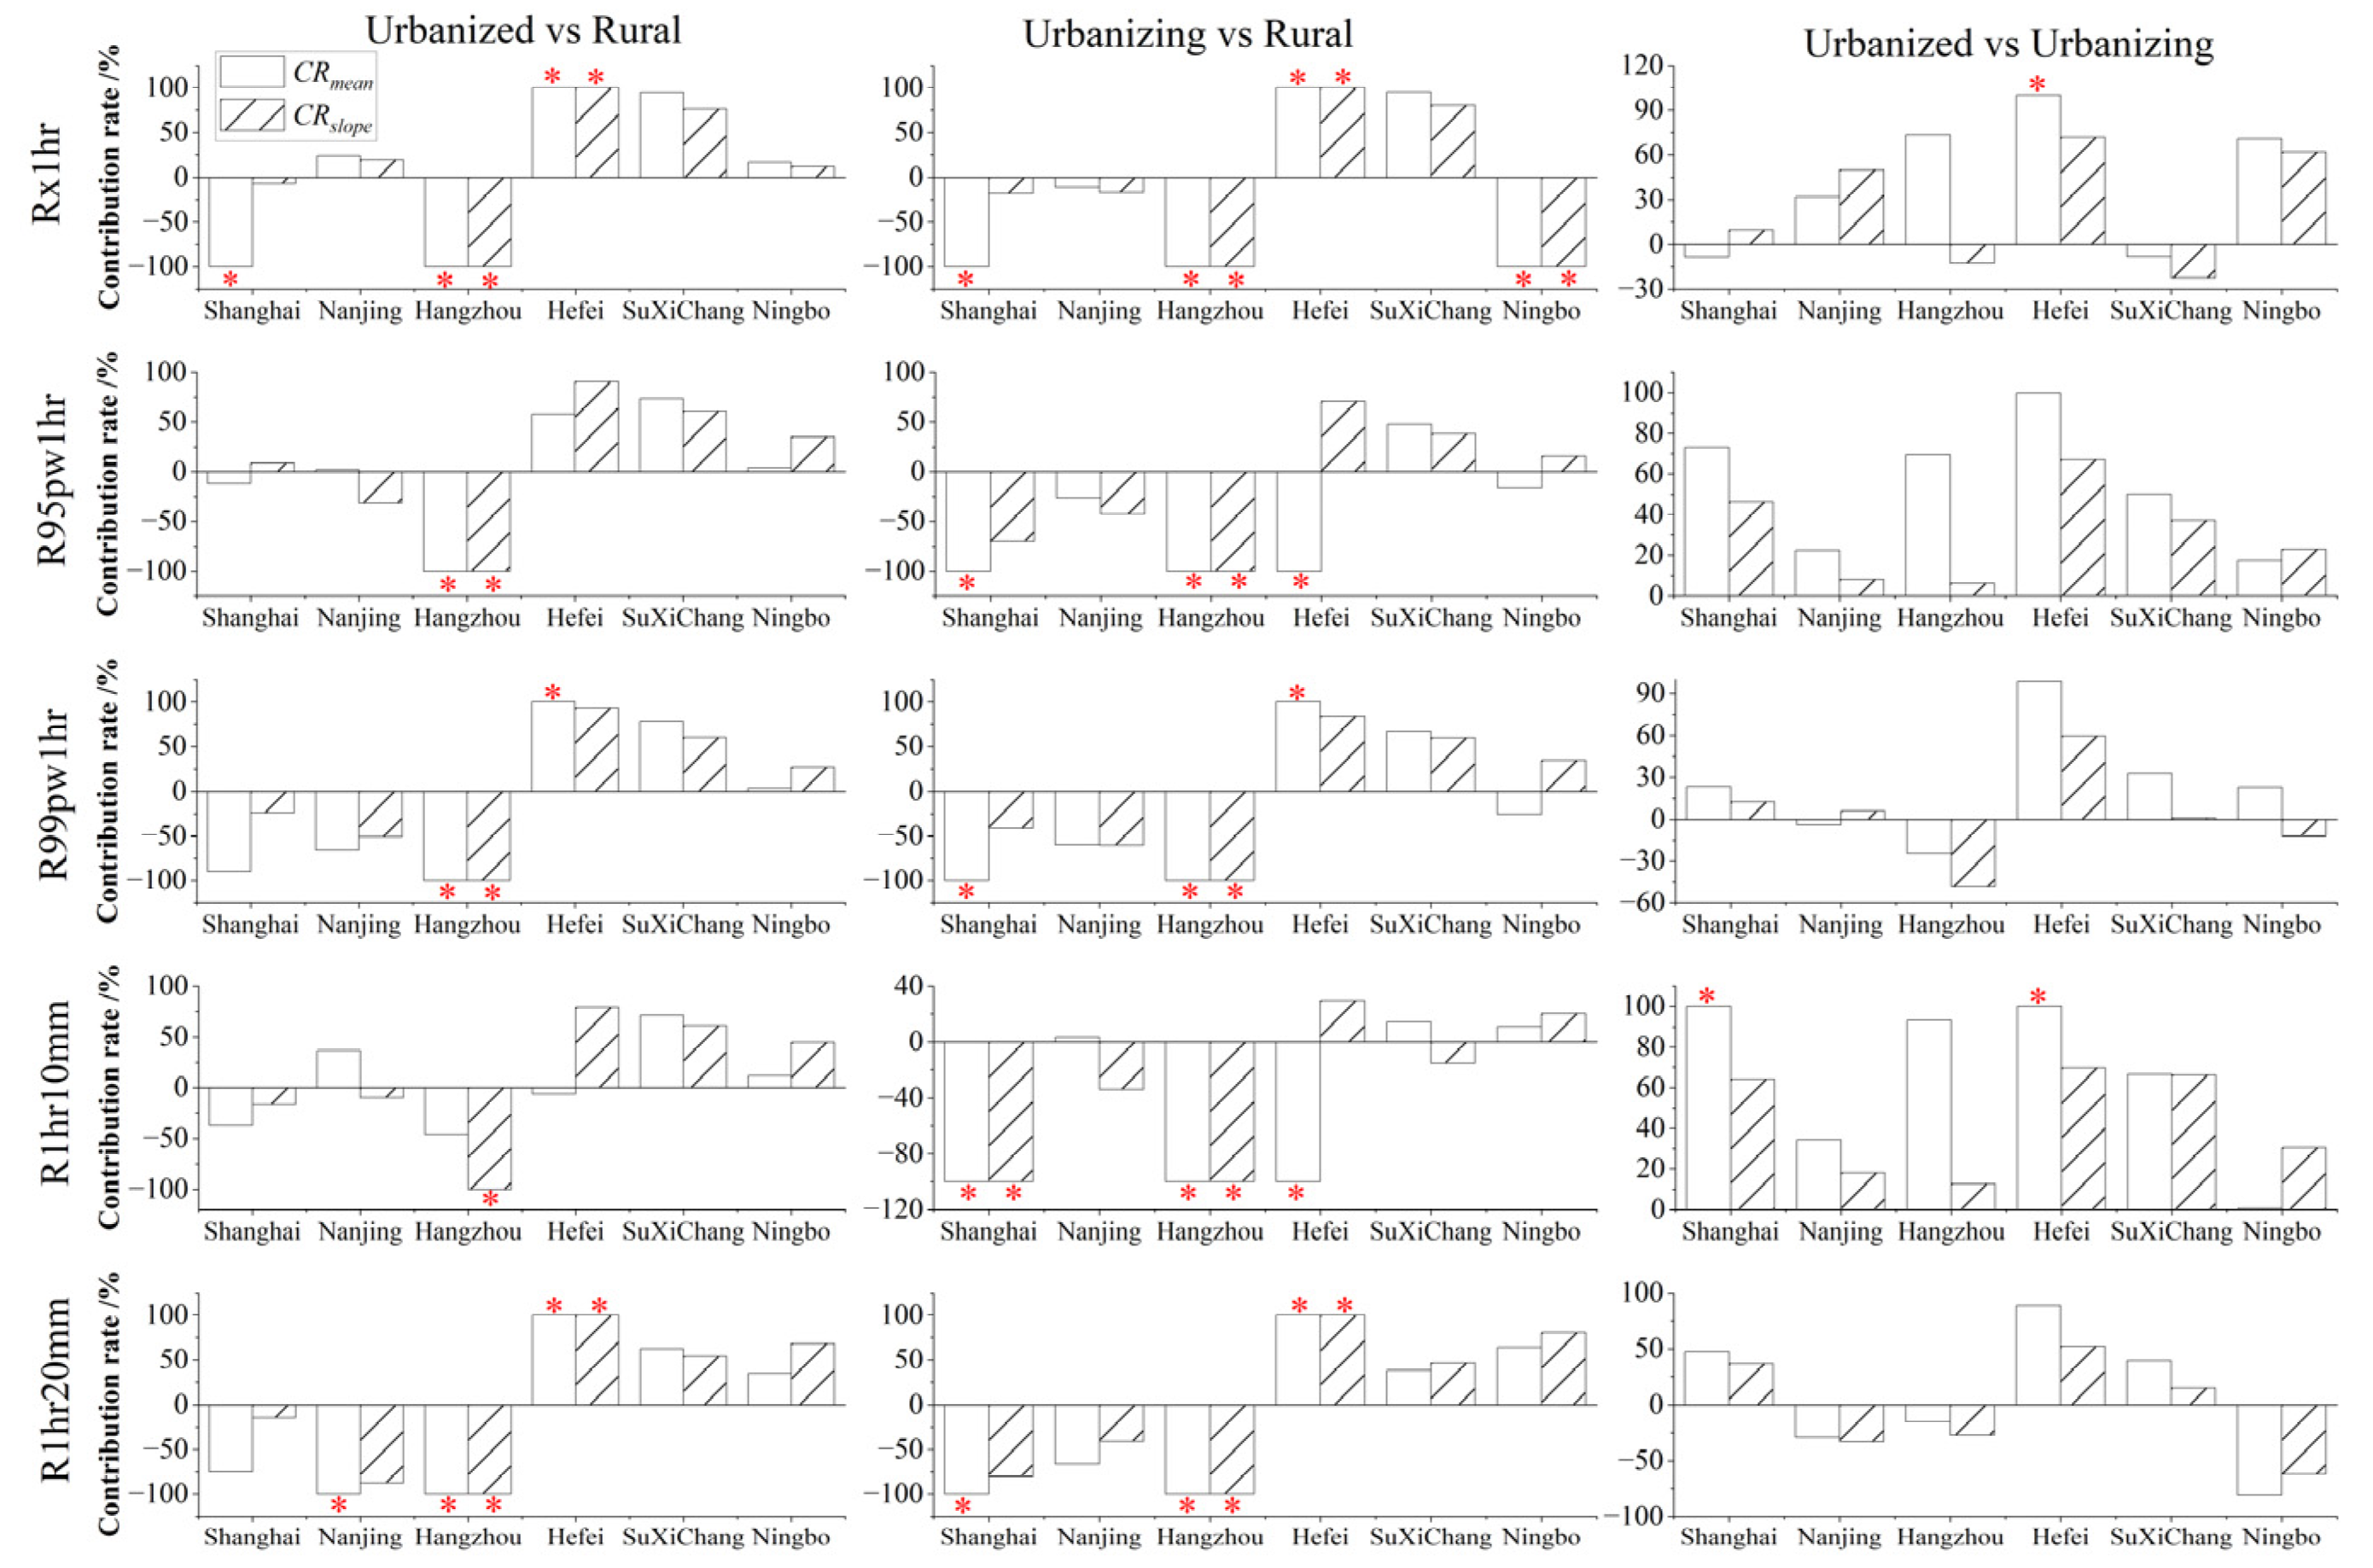
Urbanization significantly enhances the EHP, showing a clear positive relationship. As urbanization levels increase, the frequency and intensity of the EHP are likely to rise. Besides, urbanization increases the positive differences in the EHP between urban and rural areas while decreasing the negative differences. Certainly, the results based on the mean and slope methods indicate that urbanization positively affects changes in the EHP for most cases across different urban–rural scenarios and periods. However, the contributions of urbanization are relatively limited, with most of them being less than 50%.
(3)
Urbanization effects and their contributions to the changes in the EHP vary across different sub-regions with obvious spatial heterogeneity. The positive effects are mainly found in the Hefei, SuXiChang, and Ningbo metropolitan areas, but the negative ones are dominantly observed in the Shanghai, Nanjing, and Hangzhou metropolitan areas. The contrasting results reveal that urbanization plays a complex role in the precipitation changes under changing environments.
(4)
The urban–rural classification methods directly affect the assessment results about urbanization effects and contributions to the changes in the EHP. Despite larger uncertainties in their results, most cases show positive effects of urbanization on the EHP with varying magnitudes in the urbanization’s contributions.

Supplementary Materials

The following supporting information can be downloaded at https://www.mdpi.com/article/10.3390/w17101531/s1: Figure S1: The illustration for definition of five extreme hourly precipitation indices used in this study; Figure S2: Changes in urban built-up areas (BUAs) and their proportions to the total areas (UPBUA) across YRD urban agglomeration in 1984–2012; Figure S3: The stations used in the sub-regions of “One Core and Five Circles”; Figure S4: The change rates and trend rates for each index in various stations; Figure S5: Statistical results of trends in various extreme hourly precipitation indices; Figure S6: Relationship between extreme hourly precipitation and urban built-up areas across the YRD urban agglomeration in each year during 1984–2012; Figure S7: Changes in extreme hourly precipitation of three types of stations for different sub-regions across YRD urban agglomeration during the period of 1978–2012; Figure S8: Trend rates of various extreme hourly precipitation indices for different regions; Table S1: Details of 130 meteorological stations and their classification results used in this study.

Author Contributions

Conceptualization, X.S.; methodology, X.S.; software, J.Q.; validation, J.W. and J.Q.; formal analysis, J.Q.; investigation, J.W.; resources, X.W.; data curation, X.S.; writing—original draft preparation, J.Q. and X.S.; writing—review and editing, all authors; visualization, J.W. and X.S.; supervision, X.S.; project administration, X.S., J.Z. and X.W.; funding acquisition, X.S., J.Z. and X.W. All authors have read and agreed to the published version of the manuscript.

Funding

This research was jointly funded by the National Natural Science Foundation of China (no. 51979271, 52121006, and U2243228), the Natural Science Foundation of Jiangsu Province, China (no. BK20211247), and the Research Project of Jiangsu Provincial Department of Natural Resources (no. 2021003 and 2022022).

Data Availability Statement

The land use and population datasets are from the Resource and Environmental Science and Data Center, CAS (available online: http://www.resdc.cn, access on 20 December 2024). DMSP/OLS night-time light images are sourced from the geographic and national monitoring cloud platform (available online: http://www.dsac.cn/, access on 20 December 2024). Other data will be made available upon request to the corresponding author.

Acknowledgments

We are thankful to Feng Kong (China Agricultural University) for his help with the precipitation data and to Freda Guo for her invitation to the Special Issue.

Conflicts of Interest

The authors declare no conflicts of interest.

References

  1. Rummukainen, M. Climate change: Changing means and changing extremes. Clim. Change 2013, 121, 3–13. [Google Scholar] [CrossRef]
  2. Easterling, D.R.; Meehl, G.A.; Parmesan, C.; Changnon, S.A.; Karl, T.R.; Mearns, L.O. Climate extremes: Observations, modeling, and impacts. Science 2000, 289, 2068–2074. [Google Scholar] [CrossRef] [PubMed]
  3. Song, X.M.; Xu, N.T.; Zhang, J.Y.; He, R.M. Urban flooding in China: Current status, causes and challenges. Adv. Water Sci. 2024, 35, 357–373. [Google Scholar] [CrossRef]
  4. Xu, T.Y.; Yang, Z.Y.; Gao, X.C.; Zhou, J.J. A Study on the Evolution of Urban Underlying Surfaces and Extreme Rainfall in the Pearl River Delta. Water 2024, 16, 267. [Google Scholar] [CrossRef]
  5. Ayat, H.; Evans, J.P.; Sherwood, S.C.; Soderholm, J. Intensification of subhourly heavy rainfall. Science 2022, 378, 655–659. [Google Scholar] [CrossRef]
  6. Kotz, M.; Levermann, A.; Wenz, L. The effect of rainfall changes on economic production. Nature 2022, 601, 223–227. [Google Scholar] [CrossRef]
  7. Seddon, A.W.R.; Macias-Fauria, M.; Long, P.R.; Benz, D.; Willis, K.J. Sensitivity of global terrestrial ecosystems to climate variability. Nature 2016, 531, 229–232. [Google Scholar] [CrossRef]
  8. Song, X.M.; Zhang, J.Y.; Zhan, C.S.; Liu, C.Z. Review for impacts of climate change and human activities on water cycle. J. Hydraul. Eng. 2013, 44, 779–790. [Google Scholar] [CrossRef]
  9. Song, X.M.; Zhang, J.Y.; Kong, F.Z.; Wang, G.Q.; He, R.M.; Zhu, K. Spatio-temporal variation characteristics of precipitation extremes in Beijing. Adv. Water Sci. 2017, 28, 161–173. [Google Scholar] [CrossRef]
  10. Donat, M.G.; Alexander, L.V.; Yang, H.; Durre, I.; Vose, R.; Dunn, R.J.H.; Willett, K.M.; Aguilar, E.; Brunet, M.; Caesar, J.; et al. Updated analyses of temperature and precipitation extreme indices since the beginning of the twentieth century: The HadEX2 dataset. J. Geophys. Res.-Atmos. 2013, 118, 2098–2118. [Google Scholar] [CrossRef]
  11. Tabari, H. Climate change impact on flood and extreme precipitation increases with water availability. Sci. Rep. 2020, 10, 13768. [Google Scholar] [CrossRef]
  12. Li, S.; Chen, Y.N.; Wei, W.; Fang, G.H.; Duan, W.L. The increase in extreme precipitation and its proportion over global land. J. Hydrol. 2024, 628, 130456. [Google Scholar] [CrossRef]
  13. Chen, S.Y.; Huang, Q.X.; Muttarak, R.; Fang, J.Y.; Liu, T.; He, C.Y.; Liu, Z.W.; Zhu, L. Updating global urbanization projections under the Shared Socioeconomic Pathways. Sci. Data 2022, 9, 137. [Google Scholar] [CrossRef]
  14. Yang, L.; Niyogi, D.; Tewari, M.; Aliaga, D.; Chen, F.; Tian, F.Q.; Ni, G.H. Contrasting impacts of urban forms on the future thermal environment: Example of Beijing metropolitan area. Environ. Res. Lett. 2016, 11, 034018. [Google Scholar] [CrossRef]
  15. Wang, J.; Chen, F.; Doan, Q.V.; Xu, Y.P. Exploring the effect of urbanization on hourly extreme rainfall over Yangtze River Delta of China. Urban. Clim. 2021, 36, 100781. [Google Scholar] [CrossRef]
  16. Yang, L.; Smith, J.; Niyogi, D. Urban Impacts on Extreme Monsoon Rainfall and Flooding in Complex Terrain. Geophys. Res. Lett. 2019, 46, 5918–5927. [Google Scholar] [CrossRef]
  17. Yang, L.; Yang, Y.X.; Shen, Y.; Yang, J.C.; Zheng, G.; Smith, J.; Niyogi, D. Urban development pattern’s influence on extreme rainfall occurrences. Nat. Commun. 2024, 15, 3997. [Google Scholar] [CrossRef]
  18. Zhang, N.; Gao, Z.Q.; Wang, X.M.; Chen, Y. Modeling the impact of urbanization on the local and regional climate in Yangtze River Delta, China. Theor. Appl. Climatol. 2010, 102, 331–342. [Google Scholar] [CrossRef]
  19. Qian, Y.; Chakraborty, T.C.; Li, J.F.; Li, D.; He, C.L.; Sarangi, C.; Chen, F.; Yang, X.C.; Leung, L.R. Urbanization Impact on Regional Climate and Extreme Weather: Current Understanding, Uncertainties, and Future Research Directions. Adv. Atmos. Sci. 2023, 40, 333. [Google Scholar] [CrossRef]
  20. Fu, Y.Y.; Jiang, S.J.; Mao, Y.N.; Wu, G.C. Urbanization reshapes extreme precipitation metrics in typical urban agglomerations of Eastern China. Atmos. Res. 2024, 300, 107253. [Google Scholar] [CrossRef]
  21. Niyogi, D.; Lei, M.; Kishtawal, C.; Schmid, P.; Shepherd, M. Urbanization Impacts on the Summer Heavy Rainfall Climatology over the Eastern United States. Earth Interact. 2017, 21, 1–17. [Google Scholar] [CrossRef]
  22. Wu, M.W.; Luo, Y.L.; Chen, F.; Wong, W.K. Observed Link of Extreme Hourly Precipitation Changes to Urbanization over Coastal South China. J. Appl. Meteorol. Clim. 2019, 58, 1799–1819. [Google Scholar] [CrossRef]
  23. Zhu, X.D.; Zhang, Q.; Sun, P.; Singh, V.P.; Shi, P.J.; Song, C.Q. Impact of urbanization on hourly precipitation in Beijing, China: Spatiotemporal patterns and causes. Glob. Planet. Change 2019, 172, 307–324. [Google Scholar] [CrossRef]
  24. Golroudbary, V.R.; Zeng, Y.J.; Mannaerts, C.M.; Su, Z.B. Response of Extreme Precipitation to Urbanization over the Netherlands. J. Appl. Meteorol. Clim. 2019, 58, 645–661. [Google Scholar] [CrossRef]
  25. Paul, S.; Ghosh, S.; Mathew, M.; Devanand, A.; Karmakar, S.; Niyogi, D. Increased Spatial Variability and Intensification of Extreme Monsoon Rainfall due to Urbanization. Sci. Rep. 2018, 8, 3918. [Google Scholar] [CrossRef]
  26. Tang, Y.L.; Xu, G.R.; Wan, R.; Wang, X.F. Characteristics of summer hourly precipitation under different urbanization background in central China. Sci. Rep. 2022, 12, 7551. [Google Scholar] [CrossRef]
  27. Huang, X.W.; Wang, D.S.; Ziegler, A.D.; Liu, X.P.; Zeng, H.; Xu, Z.B.; Zeng, Z.Z. Influence of urbanization on hourly extreme precipitation over China. Environ. Res. Lett. 2022, 17, 044010. [Google Scholar] [CrossRef]
  28. Schmid, P.E.; Niyogi, D. Impact of city size on precipitation-modifying potential. Geophys. Res. Lett. 2013, 40, 5263–5267. [Google Scholar] [CrossRef]
  29. Zhang, W.F.; Yang, J.C.; Yang, L.; Niyogi, D. Impacts of City Shape on Rainfall in Inland and Coastal Environments. Earth’s Future 2022, 10, e2022EF002654. [Google Scholar] [CrossRef]
  30. Lalonde, M.; Oudin, L.; Bastin, S. Urban effects on precipitation: Do the diversity of research strategies and urban characteristics preclude general conclusions? Urban. Clim. 2023, 51, 101605. [Google Scholar] [CrossRef]
  31. Vo, T.T.; Hu, L.Q.; Xue, L.L.; Li, Q.; Chen, S.S. Urban effects on local cloud patterns. Proc. Natl. Acad. Sci. USA 2023, 120, e2216765120. [Google Scholar] [CrossRef]
  32. Miao, S.G.; Chen, F.; Li, Q.C.; Fan, S.Y. Impacts of Urban Processes and Urbanization on Summer Precipitation: A Case Study of Heavy Rainfall in Beijing on 1 August 2006. J. Appl. Meteorol. Clim. 2011, 50, 806–825. [Google Scholar] [CrossRef]
  33. Song, X.M.; Zhang, J.Y.; AghaKouchak, A.; Sen Roy, S.; Xuan, Y.Q.; Wang, G.Q.; He, R.M.; Wang, X.J.; Liu, C.S. Rapid urbanization and changes in spatiotemporal characteristics of precipitation in Beijing metropolitan area. J. Geophys. Res.-Atmos. 2014, 119, 11250–11271. [Google Scholar] [CrossRef]
  34. Zhang, N.; Zhu, L.F.; Zhu, Y. Urban heat island and boundary layer structures under hot weather synoptic conditions: A case study of Suzhou City, China. Adv. Atmos. Sci. 2011, 28, 855–865. [Google Scholar] [CrossRef]
  35. Stewart, I.D.; Oke, T.R. Local Climate Zones for Urban Temperature Studies. Bull. Am. Meteorol. Soc. 2012, 93, 1879–1900. [Google Scholar] [CrossRef]
  36. Huang, J.Y.; Li, X.G.; Tian, Y.; Sun, J.; Yang, Q.Y.; Yang, M.Q.; Wang, S.B. A novel evaluation method-based effect analysis of urbanization on extreme precipitation in Guangxi, South China. Theor. Appl. Climatol. 2024, 155, 5957–5971. [Google Scholar] [CrossRef]
  37. Yang, X.C.; Leung, L.R.; Zhao, N.Z.; Zhao, C.; Qian, Y.; Hu, K.J.; Liu, X.P.; Chen, B.D. Contribution of urbanization to the increase of extreme heat events in an urban agglomeration in east China. Geophys. Res. Lett. 2017, 44, 6940–6950. [Google Scholar] [CrossRef]
  38. Jiang, X.L.; Luo, Y.L.; Zhang, D.L.; Wu, M.W. Urbanization Enhanced Summertime Extreme Hourly Precipitation over the Yangtze River Delta. J. Clim. 2020, 33, 5809–5826. [Google Scholar] [CrossRef]
  39. Ren, G.Y.; Li, J.; Ren, Y.Y.; Chu, Z.Y.; Zhang, A.Y.; Zhou, Y.Q.; Zhang, L.; Zhang, Y.; Bian, T. An Integrated Procedure to Determine a Reference Station Network for Evaluating and Adjusting Urban Bias in Surface Air Temperature Data. J. Appl. Meteorol. Clim. 2015, 54, 1248–1266. [Google Scholar] [CrossRef]
  40. Song, X.M.; Mo, Y.C.; Xuan, Y.Q.; Wang, Q.J.; Wu, W.Y.; Zhang, J.Y.; Zou, X.J. Impacts of urbanization on precipitation patterns in the greater Beijing-Tianjin-Hebei metropolitan region in northern China. Environ. Res. Lett. 2021, 16, 014042. [Google Scholar] [CrossRef]
  41. Lei, C.G.; Yu, Z.H.; Sun, X.M.; Wang, Y.F.; Yuan, J.; Wang, Q.; Han, L.F.; Xu, Y.P. Urbanization effects on intensifying extreme precipitation in the rapidly urbanized Tai Lake Plain in East China. Urban. Clim. 2023, 47, 101399. [Google Scholar] [CrossRef]
  42. Kang, C.X.; Luo, Z.J.; Zong, W.; Hua, J. Impacts of Urbanization on Variations of Extreme Precipitation over the Yangtze River Delta. Water 2021, 13, 150. [Google Scholar] [CrossRef]
  43. Xie, X.; Qin, D.J.; Xiao, M.Z.; Lin, K.R. Urbanization Enhances Shorter-Duration Precipitation Intensity in the Yangtze River Delta Region. J. Geophys. Res.-Atmos. 2025, 130, e2024JD043300. [Google Scholar] [CrossRef]
  44. Zeng, H.L.; Gao, X.Q.; Zhang, W. Evolution characteristics of the precipitation in the Yangtze River delta based on the probability density. Chin. Phys. 2005, 14, 1265–1271. [Google Scholar]
  45. Han, L.F.; Xu, Y.P.; Pan, G.B.; Deng, X.J.; Hu, C.S.; Xu, H.L.; Shi, H.Y. Changing properties of precipitation extremes in the urban areas, Yangtze River Delta, China, during 1957–2013. Nat. Hazards 2015, 79, 437–454. [Google Scholar] [CrossRef]
  46. Song, X.M.; Qi, J.C.; Zou, X.J.; Zhang, J.Y.; Liu, C.S. Potential Effects of Urbanization on Precipitation Extremes in the Pearl River Delta Region, China. Water 2022, 14, 2466. [Google Scholar] [CrossRef]
  47. Xie, X.; Lin, K.R.; Xiao, M.Z.; Zhou, X.D.; Zhao, G.; Yamazaki, D. How Does Heavy Precipitation of Varying Durations Respond to Urbanization in China? Earth’s Future 2024, 12, e2023EF004412. [Google Scholar] [CrossRef]
  48. Li, F.G.; Pan, X.; Xu, N.; Meng, X.J.; Li, Z.Q.; Guluzade, R.; Dai, Y.; Yang, Y.B. Does Urbanization Exacerbate Asymmetrical Changes in Precipitation at Divergent Time Scales in China? Earth’s Future 2024, 12, e2023EF004355. [Google Scholar] [CrossRef]
  49. Huang, R.P.; Chen, S.F.; Ding, W.Y.; Chen, W.; Hu, P. Fine-scale characteristics of hourly intense rainfall in pre-summer and post-summer rainy seasons in Guangdong Province over coastal South China. Theor. Appl. Climatol. 2022, 150, 1083–1095. [Google Scholar] [CrossRef]
  50. Hitchens, N.M.; Brooks, H.E.; Schumacher, R.S. Spatial and Temporal Characteristics of Heavy Hourly Rainfall in the United States. Mon. Weather Rev. 2013, 141, 4564–4575. [Google Scholar] [CrossRef]
  51. Li, F.G.; Yang, Y.B.; Ali, H.; Xie, J.K.; Dai, Y.; LI, Z.Q.; Wang, Z.W.; Pan, X.; Fowler, H. Assessing the consistent and divergent impacts of urbanization on heavy rainfall in Chinese urban agglomerations. Commun. Earth Environ. 2025, 6, 302. [Google Scholar] [CrossRef]
  52. Deng, Z.F.; Wu, X.S.; Villarini, G.; Wang, Z.L.; Zeng, Z.Y.; Lai, C.G. Stronger exacerbation of extreme rainfall at the hourly than daily scale by urbanization in a warming climate. J. Hydrol. 2024, 633, 131025. [Google Scholar] [CrossRef]
  53. Xu, W.H.; Li, Q.X.; Wang, X.L.; Yang, S.; Cao, L.J.; Feng, Y. Homogenization of Chinese daily surface air temperatures and analysis of trends in the extreme temperature indices. J. Geophys. Res.-Atmos. 2013, 118, 9708–9720. [Google Scholar] [CrossRef]
  54. Qi, J.C.; Song, X.M. Spatiotemporal changes of extreme hourly precipitation in the Yangtze River Delta urban agglomeration during 1978–2012. Water Resour. Hydropower Eng. 2023, 54, 75–92. [Google Scholar] [CrossRef]
  55. Dou, Y.W.; Qu, Y.G.; Tao, S.W.; Hu, B.K. The application of quality control procedures for real-time data from automatic weather stations. Meteorol. Mon. 2008, 34, 77–81. [Google Scholar] [CrossRef]
  56. Cao, L.J.; Zhu, Y.N.; Tang, G.L.; Yuan, F.; Yan, Z.W. Climatic warming in China according to a homogenized data set from 2419 stations. Int. J. Climatol. 2016, 36, 4384–4392. [Google Scholar] [CrossRef]
  57. Ren, Z.H.; Yu, Y.; Zou, F.L.; Xu, Y. Quality detection of surface historical basic meteorological data. J. Appl. Meteorol. Sci. 2012, 23, 739–747. [Google Scholar]
  58. Zhao, Y.F.; Liao, J.; Zhang, Q.; Chen, J.; Gong, X.; Shi, Y.; Shi, M.Y.; Yang, D.; Fan, S.H.; Zhou, X.D.; et al. Development of China Ground Climate Normal Value Dataset from 1991 to 2020. Chin. J. Atmos. Sci. 2024, 48, 555–571. [Google Scholar] [CrossRef]
  59. Shen, Y.; Pan, Y.; Yu, J.J.; Zhao, P.; Zhou, Z.J. Quality assessment of hourly merged precipitation product over China. Trans. Atmos. Sci. 2013, 36, 37–46. [Google Scholar] [CrossRef]
  60. Han, L.F.; Yu, X.Q.; Xu, Y.P.; Deng, X.J.; Yang, L.; Li, Z.W.; Lv, D.Q.; Xiao, M. Enhanced Summertime Surface Warming Effects of Long-Term Urbanization in a Humid Urban Agglomeration in China. J. Geophys. Res.-Atmos. 2021, 126, e2021JD035009. [Google Scholar] [CrossRef]
  61. Li, X.; Zhang, K.; Bao, H.J.; Zhang, H.D. Climatology and changes in hourly precipitation extremes over China during 1970-2018. Sci. Total Environ. 2022, 839, 156297. [Google Scholar] [CrossRef] [PubMed]
  62. Fu, X.S.; Yang, X.Q.; Sun, X.G. Spatial and diurnal Diurnal Variations of Summer Hourly Rainfall Over Three Super City Clusters in Eastern China and Their Possible Link to the Urbanization. J. Geophys. Res.-Atmos. 2019, 124, 5445–5462. [Google Scholar] [CrossRef]
  63. Alexander, L.V.; Fowler, H.J.; Bador, M.; Behrangi, A.; Donat, M.G.; Dunn, R.; Funk, C.; Goldie, J.; Lewis, E.; Rogé, M.; et al. On the use of indices to study extreme precipitation on sub-daily and daily timescales. Environ. Res. Lett. 2019, 14, 125008. [Google Scholar] [CrossRef]
  64. Fang, C.L.; Yu, D.L. China’s New Urbanization: Development Paths, Blueprints and Patterns; Springer: Berlin, Germany, 2016; p. 329. [Google Scholar]
  65. Hu, Y.N.; Connor, D.S.; Stuhlmacher, M.; Peng, J.; Yurner, B.L., II. More urbanization, more polarization: Evidence from two decades of urban expansion in China. npj Urban. Sustain. 2024, 4, 33. [Google Scholar] [CrossRef]
  66. Peng, J.; Lin, H.X.; Chen, Y.Q.; Blaschke, T.; Luo, L.W.; Xu, Z.H.; Hu, Y.N.; Zhao, M.Y.; Wu, J.S. Spatiotemporal evolution of urban agglomerations in China during 2000–2012: A nighttime light approach. Landsc. Ecol. 2020, 35, 421–434. [Google Scholar] [CrossRef]
  67. Liao, W.L.; Liu, X.P.; Li, D.; Luo, M.; Wang, D.G.; Wang, S.J.; Baldwin, J.; Lin, L.J.; Li, X.; Feng, K.S.; et al. Stronger Contributions of Urbanization to Heat Wave Trends in Wet Climates. Geophys. Res. Lett. 2018, 45, 11310–11317. [Google Scholar] [CrossRef]
  68. Han, L.F.; Wang, L.H.; Chen, H.M.; Xu, Y.P.; Sun, F.P.; Reed, K.; Deng, X.J.; Li, W.K. Impacts of Long-Term Urbanization on Summer Rainfall Climatology in Yangtze River Delta Agglomeration of China. Geophys. Res. Lett. 2022, 49, e2021GL097546. [Google Scholar] [CrossRef]
  69. Briciu, A.E.; Mihaila, D.; Graur, A.; Oprea, D.I.; Prisacariu, A.; Bistricean, P.I. Changes in the Water Temperature of Rivers Impacted by the Urban Heat Island: Case Study of Suceava City. Water 2020, 12, 1343. [Google Scholar] [CrossRef]
  70. Tu, M.C.; Traver, R. Clogging Impacts on Distribution Pipe Delivery of Street Runoff to an Infiltration Bed. Water 2018, 10, 1045. [Google Scholar] [CrossRef]
  71. Zhuang, Q.; Liu, S.G.; Zhou, Z.Z. Spatial Heterogeneity Analysis of Short-Duration Extreme Rainfall Events in Megacities in China. Water 2020, 12, 3364. [Google Scholar] [CrossRef]
  72. Mou, Y.L.; Gao, X.C.; Yang, Z.Y.; Xu, T.Y.; Feng, J. Variation characteristics and the impact of urbanization of extreme precipitation in Shanghai. Sci. Rep. 2022, 12, 17618. [Google Scholar] [CrossRef]
  73. Sui, X.X.; Yang, Z.L.; Shepherd, M.; Niyogi, D. Global scale assessment of urban precipitation anomalies. Proc. Natl. Acad. Sci. USA 2024, 121, e2311496121. [Google Scholar] [CrossRef]
  74. Luo, M.; Lau, N.C. Urban Expansion and Drying Climate in an Urban Agglomeration of East China. Geophys. Res. Lett. 2019, 46, 6868–6877. [Google Scholar] [CrossRef]
  75. Luo, Y.L.; Zhang, J.H.; Yu, M.; Liang, X.D.; Xia, R.D.; Gao, Y.Y.; Gao, X.Y.; Yin, J.F. On the Influences of Urbanization on the Extreme Rainfall over Zhengzhou on 20 July 2021: A Convection-Permitting Ensemble Modeling Study. Adv. Atmos. Sci. 2023, 40, 393–409. [Google Scholar] [CrossRef]
  76. Qiao, Z.; Wang, N.; Chen, J.Y.; He, T.; Xu, X.L.; Liu, L.; Sun, Z.Y.; Han, D.R. Urbanization accelerates urban warming by changing wind speed: Evidence from China based on 2421 meteorological stations from 1978 to 2017. Environ. Impact Assess. Rev. 2023, 102, 107189. [Google Scholar] [CrossRef]
  77. Zhang, W.; Villarini, G.; Vecchi, G.A.; Smith, J.A. Urbanization exacerbated the rainfall and flooding caused by hurricane Harvey in Houston. Nature 2018, 563, 384–388. [Google Scholar] [CrossRef]
  78. Liu, H.Y.; Zou, L.; Xia, J.; Chen, T.; Wang, F.Y. Impact assessment of climate change and urbanization on the nonstationarity of extreme precipitation: A case study in an urban agglomeration in the middle reaches of the Yangtze river. Sustain. Cities Soc. 2022, 85, 104038. [Google Scholar] [CrossRef]
  79. Han, P.P.; Li, S.; Zhao, K.; Wang, T.J.; Xie, M.; Zhuang, B.L.; Li, M.M.; Liu, C. Effects of anthropogenic aerosols and sea salt aerosols during a summer precipitation event in the Yangtze River Delta. Atmos. Res. 2023, 284, 106584. [Google Scholar] [CrossRef]
  80. Xiao, H.; Liu, X.T.; Li, H.Q.; Yue, Q.; Feng, L.; Qu, J.X. Extent of aerosol effect on the precipitation of squall lines: A case study in South China. Atmos. Res. 2023, 292, 106886. [Google Scholar] [CrossRef]
  81. Cao, Q.M.; Jiang, B.L.; Shen, X.D.A.; Lin, W.S.; Chen, J.W. Microphysics effects of anthropogenic aerosols on urban heavy precipitation over the Pearl River Delta, China. Atmos. Res. 2021, 253, 105478. [Google Scholar] [CrossRef]
  82. Feng, T.C.; Yuan, T.A.; Cao, J.H.; Wang, Z.K.; Zhi, R.; Hu, Z.Y.; Huang, J.P. The influence of dust on extreme precipitation at a large city in North China. Sci. Total Environ. 2023, 901, 165890. [Google Scholar] [CrossRef] [PubMed]
  83. Li, Y.N.; Wang, W.W.; Chang, M.; Wang, X.M. Impacts of urbanization on extreme precipitation in the Guangdong-Hong Kong-Macau Greater Bay Area. Urban. Clim. 2021, 38, 100904. [Google Scholar] [CrossRef]
  84. Chapman, S.; Watson, J.E.M.; Salazar, A.; Thatcher, M.; McAlpine, C.A. The impact of urbanization and climate change on urban temperatures: A systematic review. Landsc. Ecol. 2017, 32, 1921–1935. [Google Scholar] [CrossRef]
  85. Lin, L.J.; Gao, T.; Luo, M.; Ge, E.J.; Yang, Y.J.; Liu, Z.; Zhao, Y.Q.; Ning, G.C. Contribution of urbanization to the changes in extreme climate events in urban agglomerations across China. Sci. Total Environ. 2020, 744, 140264. [Google Scholar] [CrossRef]
Figure 1. (a) Location of study area for the YRD urban agglomeration; (b) meteorological stations used in this study with full records; and (c) the spatial distribution of annual mean precipitation and different types of stations.
Water 17 01531 g001
Figure 2. Changes in urbanization indicators (a and b for land use, d and e for night-time light, and g and h for population density) and classification of the stations based on these indicators (c,f,i). The DN values of night light mean the average of the visible band digital number values with no further filtering, and data values range from 0 to 63.
Water 17 01531 g002
Figure 3. The framework of this study.
Water 17 01531 g003
Figure 4. Observed changes in the mean values of the EHP for all, urbanized, urbanizing, and rural stations. The black solid line with open circle shows the annual mean of the EHP. The red solid lines are the linear trends for the entire period (1978–2012), and the blue and green dashed lines represent the linear trends for the pre-urbanization (1978~1995) and post-urbanization (1996~2012) periods, respectively. The grey shadow indicates the 95% confidence interval for the trends of the linear fit. Bold font with a star symbol means a significant trend at a level of α = 0.05.
Water 17 01531 g004
Figure 5. Kernel smooth-based probability density functions of the EHP across the YRD urban agglomeration during 1978–1995 (blue solid lines) and 1996–2012 (red solid lines). The p-values indicate whether the differences in the two distributions for the EHP are significant based on the two-sample Kolmogorov–Smirnov test. Blue and red dashed lines are the mean values for the two stages.
Water 17 01531 g005
Figure 6. (a) Spatial distribution of the mean values for Rx1hr from 1978 to 2012, and similar results for R95pw1hr (d), R99pw1hr (g), R1hr10mm (j) and R1hr20mm (m); (b) Spatial patterns of the differences in the mean for Rx1hr from the early stage to the later stage of urbanization, and similar results for R95pw1hr (e), R99pw1hr (h), R1hr10mm (k) and R1hr20mm (n); and (c) spatial trends for Rx1hr, and similar for R95pw1hr (f), R99pw1hr (i), R1hr10mm (l) and R1hr20mm (o). The mean calculates the difference in extreme precipitation indicators from 1996 to 2012 minus the ones from 1978 to 1995. The change rate is determined by dividing the difference by the mean from 1978 to 2012. Trends for each station are calculated using Sen’s slope, and the trend rate is determined by dividing the slope by the mean value from 1978 to 2012. Significant trends are identified using the Mann–Kendall test at a level of α = 0.05.
Water 17 01531 g006
Figure 7. Results of cluster and outlier analysis based on Ansellin Local Moran’s I using the ArcGIS 10.8 software for Rx1hr (a), R95pw1hr (b), R99pw1hr (c), R1hr10mm (d) and R1hr20mm (e).
Water 17 01531 g007
Figure 8. Relationship between urbanization levels and extreme hourly precipitation indices. The left panel is the relationship between mean values of extreme hourly precipitation and urban mean built-up areas (a) and their proportions to total areas (c). The right panel is the relationship between change rates of extreme hourly precipitation and urban mean built-up areas (b) and their proportions to total areas (d).
Water 17 01531 g008
Figure 9. Spearman correlation coefficients (SCCs) between the EHP and urban built-up areas across the YRD urban agglomeration during 1984–2012. The same correlations between the EHP and the proportion of urban built-up areas to total areas are found for the correlation coefficients. * means a significant correlation based on two-tailed t-test at a level of α=0.05.
Water 17 01531 g009
Figure 10. Changes in urban–rural differences in extreme hourly precipitation: The bar charts show the relative differences for the three scenarios. The black and blue solid lines show the linear trends during the periods of 1978–1995 and 1996–2012, respectively. The red dashed lines are the linear trends of 1978–2012. Bold numbers with star symbols denote significant trends at a level of α = 0.05.
Water 17 01531 g010
Figure 11. Changes in extreme hourly precipitation for different sub-regions across YRD urban agglomeration during the period of 1978–2012. Black solid lines with open circles are time series of extreme hourly precipitation based on all stations for each sub-region. Red solid line means linear trends during the entire period (1978–2012), but black and blue dashed lines are linear trends for the early (1978–1995) and late (1996–2012) stages of urbanization, respectively. Bold font with a star means a significant trend at a 0.05 level.
Water 17 01531 g011
Figure 12. Linear trends (left panel) and their rates (right panel) of EHP for different types of stations and sub-regions across YRD during the periods of 1978–1995, 1996–2012, and 1978–2012. Trend rate (%/decade) is estimated by the trends (mm/decade or hours/decade) dividing the mean values of EHP indices. * means the significant changes at a level of α = 0.05.
Water 17 01531 g012
Figure 13. Results of urban effects on the EHP ((a,b) for Rx1hr, (c,d) for R95pw1hr, (e,f) for R99pw1hr, (g,h) for R1hr10mm, (i,j) for R1hr20mm) for six sub-regions and three urban–rural scenarios across YRD during 1978–2012. The left panel is estimated based on urban–rural differences, and the right panel is estimated from mean values.
Water 17 01531 g013
Figure 14. Comparison of the contribution of urbanization to the EHP from two methods for different sub-regions. CRslope is estimated based on the trends during 1978–2012. Red star means the absolute value for the contribution of urbanization is larger than 100%, and it is noted as 100% in this figure.
Water 17 01531 g014
Figure 15. The probability density functions of EHP series for urbanized, urbanizing, and rural stations using various urban–rural classification methods (the integrated method and single-source methods of night-time light, population, and land use data). The Kolmogorov–Smirnov test detects the differences between the two series based on different urban–rural classification methods, with p1 for integrated and night-time light, p2 for integrated and population, and p3 for integrated and land use. The p-value is less than 0.05 meaning that the two series are significant difference.
Water 17 01531 g015
Figure 16. Urban effects on the changes in the EHP based on mean-based method (a) and slope-based method (b), and their contributions (c,d) for different urban–rural classification methods and urban–rural scenarios across the YRD in 1978–2012. I, II, and III are the urbanized vs. rural, urbanizing vs. rural, and urbanized vs. urbanizing scenarios, respectively.
Water 17 01531 g016
Table 1. The EHP indices used in this work.
IndexMethodDefinitionUnits
Rx1hrMaximum valueMaximum 1 h precipitationmm
R95pw1hrPercentile-based thresholdTotal precipitation for hourly precipitation greater than the 95th percentile of the hourly precipitation seriesmm
R99pw1hrTotal precipitation for hourly precipitation greater than the 99th percentile of the hourly precipitation seriesmm
R1hr10mmFixed thresholdNumber of hours with hourly precipitation greater than 10 mmhours
R1hr20mmNumber of hours with hourly precipitation greater than 20 mmhours
Table 2. The p-values of ANCOVA for the effects of urban–rural classification on the linear regression models.
Rx1hrR95pw1hrR99pw1hrR1hr10mmR1hr20mm
Full period0.4060.048 *0.1720.004 *0.005 *
First part0.4230.3240.5080.1210.106
Second part0.1810.0660.2140.012 *0.026 *
Note: * the p-value less than 0.05 means that there are significant differences between urban and rural stations for their linear regression models.
Table 3. The results of Moran’s Index and CV for five extreme hourly precipitation indices in the YRD during 1978–2012.
MeanStandard DeviationCVGlobal Moran’s IndexZ-Score
Rx1hr38.283.360.090.286.00
R95pw1hr309.4648.530.160.4710.08
R99pw1hr115.4218.600.160.469.75
R1hr10mm15.122.860.190.5210.94
R1hr20mm4.191.020.240.469.63
Note: when Z-score is larger than 2.56, the p-value is less than 0.01.
Table 4. Spearman correlation coefficients (SCCs) of extreme hourly precipitation and urban built-up areas and their proportions to total areas for different sub-regions.
Urban Mean Built-Up AreaRatio of Urban Built-up Area to Total Area
Mean values in 1978–2012Rx1hr0.102−0.056
R95pw1hr−0.090−0.297
R99pw1hr−0.034−0.203
R1hr10mm−0.237−0.374
R1hr20mm−0.140−0.267
Change rates per decadeRx1hr0.523 *0.540 *
R95pw1hr0.659 *0.676 *
R99pw1hr0.473 *0.508 *
R1hr10mm0.640 *0.582 *
R1hr20mm0.487 *0.528 *
Note: * means p < 0.05.
Table 5. Contribution of urbanization to extreme hourly precipitation changes.
Contribution RateCRmean/%CRslope/%
1978–19951996–20121978–2012
Scenario I: urbanized–ruralRx1hr18.2179.31−31.8220.00
R95pw1hr25.7428.2447.0826.09
R99pw1hr20.1612.7342.8618.67
R1hr10mm31.2735.2953.8533.33
R1hr20mm28.05−0.7540.0020.00
Scenario II: urbanizing–ruralRx1hr−109.6764.719.38−46.15
R95pw1hr−48.6618.5027.87−17.55
R99pw1hr−20.9821.3141.96−3.85
R1hr10mm−58.6421.4325.00−28.57
R1hr20mm10.567.5045.457.50
Scenario III: urbanized–urbanizingRx1hr60.9941.38−31.8248.00
R95pw1hr50.0411.9626.6337.12
R99pw1hr34.01−10.911.5521.69
R1hr10mm56.6817.6538.4641.67
R1hr20mm19.55−7.50−5.0020.00
Disclaimer/Publisher’s Note: The statements, opinions and data contained in all publications are solely those of the individual author(s) and contributor(s) and not of MDPI and/or the editor(s). MDPI and/or the editor(s) disclaim responsibility for any injury to people or property resulting from any ideas, methods, instructions or products referred to in the content.

