Abstract
This paper investigated sectoral water use and trends in the Mzimvubu to Tsitsikamma Water Management Area 7 (WMA7). The investigation considered the Water Authorisation and Registration Management System (WARMS) database and field surveys as a source of water use information. The study was able to successfully make use of time series statistical analysis to show water use trends for identified priority sectors over a 5-year period by sourcing historical water use data of the study area. Further, the groundwater stress index and streamflow impact were applied to assess water use impacts on the surface and groundwater. The WARMS database and field survey results identified major sectoral water users such as agriculture (irrigation), municipal water services, dam storage, afforestation, power generation, recreation, mining, and industries. Study findings revealed that the agricultural sector is a major water user, with an estimated 60% of the total water requirement over a 5-year period (2018 to 2022). The application of the groundwater stress index revealed that the majority of the Quaternary catchments have surplus groundwater available. The application of streamflow impact revealed that the majority of catchments have low flow or no flow. The rise of water use clearly indicates a lack of water use compliance and enforcement. An increase in total water use could put water resources under stress, including an impact on the aquatic ecosystem, reduced water quality, and economic and social consequences. Therefore, the study recommends that a follow-up on compliance of surface water and groundwater use licenses be regularly conducted.
1. Introduction
Water plays a significant role in community health, economic development, and natural environments [1]. The world faces an increasingly large set of water resource challenges as water shortages and water use conflicts become more commonplace [1]. A study by Arto [2] reported that, during the 21st century, the use of water has doubled more than the rate of population growth, making scarcity of water one of the most urgent challenges facing human society in the last century. Further, water stress caused by climate change and pollution, global population growth, and increasing water demand are some of the most important factors affecting the global and local availability of freshwater resources [2,3]. Guo et al. [4] indicated that by identifying and understanding factors that influence water consumption patterns, water management strategies to encourage water conservation and promote sustainable water usage practices can be developed. In Sub-Saharan Africa, for example, Pavelic et al. [5] revealed that the availability of groundwater supplies has influenced the spread of human settlements. Recently, groundwater supply has become the preferred source of water supply to meet the growing water demand of the rural communities and the small urban towns in the region. Over 100 million rural population in Sub-Saharan Africa is estimated to be serviced by groundwater for domestic purposes [5].
South Africa is water-scarce and semi-arid, and water is of critical strategic importance to all development [6]. Thus, it is important that water resources are utilized in a sustainable manner to cater for current and future water users. A study by Jovanovic et al. [7] found that the highest volumes of water use in the country were recorded for taking water (18.5 billion m3/a), storing water (5.2 billion m3/a), disposal of waste (4.5 billion m3/a), discharging wastewater (1.2 billion m3/a), removing underground water (1.1 billion m3/a) and afforestation (1.0 billion m3/a). Further, the study noted that the general trends in water use are a reflection of geography and land use, population size, economic activities, and degree of urbanization. Donnenfeld et al. [8] reported that the country is over-exploiting its renewable water resources. To this end, withdrawals of water are projected to increase in all three economic sectors by 2035 (mining, industrial, and agricultural). Previously, du Plessis [9] had indicated that water use has grown unhindered due to a high rate of economic growth, demographic pressure, urbanization, irrigation expansion, and pollution. Further, the study estimated that the country’s total requirements for water use will double over the next 30 years. In addition, the country is currently facing a multi-faceted water crisis, such as deterioration of water infrastructure, imbalance between water supply and demand, water quality deterioration, lack of legislative enforcement, skill shortage, and illegal water use [10]. All these water challenges pose potential threats that could lead to the country experiencing a water crisis [9]. A study by Donnenfeld et al. [8] revealed that more than 60% of the country’s rivers are currently being over-exploited, and only one-third of the country’s main rivers are in good condition. Thus, requirements to set aside water for ecology, basic human needs (BHNs), and recreational uses are declining [11]. A study by Pfister et al. [12] reported that the environmental impacts of water consumption and water stress are manifold. Thus, water consumption affects both terrestrial and aquatic ecosystems. For instance, terrestrial ecosystems downstream of the location of water use may suffer from water stress through reduced natural water availability and groundwater depletion [12].
A recent study by Mulangaphuma et al. [13] reported that water quality in some catchments within WMA7 is deteriorating each day, and that could be attributed to water use in the area. Further, the study revealed that catchments had water quality problems such as nutrients, ammonium, and siltation (turbidity). In addition, increased groundwater pollution and over-abstraction were observed in the eastern part of the study area. Previously, a study by Cobbing [14] revealed that spring flow and groundwater levels had significantly dropped due to over-abstraction for irrigation in major Karst aquifers. Further, the study revealed that high levels of nitrate were observed in groundwater, which could be due to anthropogenic activities in the study area. According to the South African Department of Water and Sanitation, the Department receives high volumes of water use applications on a monthly basis for WMA7. Based on the above findings, it is necessary to assess water use, both surface and groundwater, to provide a practical and accurate characterization of the water users and pollution sources in the study area.
The South African National Water Act (NWA) [15] and National Environmental Management Act (NEMA) [16] recognize that sustainable use of water for the benefit of all users is achieved through better water resource management. Both these overarching pieces of legislation take into consideration the use of the natural environment in a sustainable way for generations to come. Chapter 4 of the NWA deals with water use, and it is broadly defined in the Act. According to the NWA, water use includes storing, diverting, taking, and discharging water, as well as any activities that reduce streamflow. In general, water use activities are regulated through the granting of formal water rights, such as licenses, permits, or concessions, to ensure compliance with water use conditions [17]. Although Bea et al. [18] highlighted that illegal water use often contributes to over-exploitation, unreliability of water-related data, and severe gaps in policy implementation, unlawful water use is very difficult to estimate. The overall aim of the current study is to quantify sectoral water use for both surface and groundwater in order to understand the demand side of water availability within Water Management Area 7 (WMA7). This Water Management Area, located predominantly in the Eastern Cape Province, has been historically understudied, yet it represents an important developing region in South Africa where water use is expected to increase considerably over time. Further, the catchments within the WMA7 are important for conservation and have recognizable protected areas, natural heritage, and cultural and historical sites that require protection. Alley et al. [1] reported that, as competition for water grows due to irrigation, human population growth, energy production, and the environment, the need for water resource assessment for use by sectors to aid water resource managers also grow. The specific objectives were: (1) To identify priority sectoral water use per catchment in WMA7. The expected output of this objective was a comprehensive list of identified surface and groundwater users and their uses per catchment. (2) To determine water use trends for identified priority sectors over a 5-year period by sourcing historical water use data of the study area. (3) To determine water resource use impacts in the study area. Due to the diversity and complexity of water use patterns and socio-economic development in the study area, a clear understanding between water uses, water resource deterioration, and water use conditions enforcement remains elusive. Therefore, improved information on water withdrawal, discharge, and return flow by sector will allow water resource managers and policymakers to make more effective decisions for the future.
2. Materials and Methods
This section provides a site description and a brief backdrop to the water use status in WMA7, and details on methodologies used to determine the extent of sectoral water use, as well as how and why these methods were selected.
2.1. Study Area Description
The study area (WMA7) is situated mainly in the Eastern Cape Province, and it consists of major and smaller drainage regions. The five primary catchments, namely Mbashe, Gamtoos, Sundays, Great Kei, and Great Fish, and associated rivers were considered for the current study because they were understudied. The current study covered a total catchment area of approximately 124,730 km2, consisting of over 300 Quaternary catchments [13]. Figure 1 shows a locality map and associated landcover of the study area. Landcover is dominated by vegetation, which is strongly influenced by the climate conditions of the area. The landcover varies from Karoo shrubbery to sparse grass and lush coastal forests in the west, with savanna grassland dominating the rest of the study area [19].
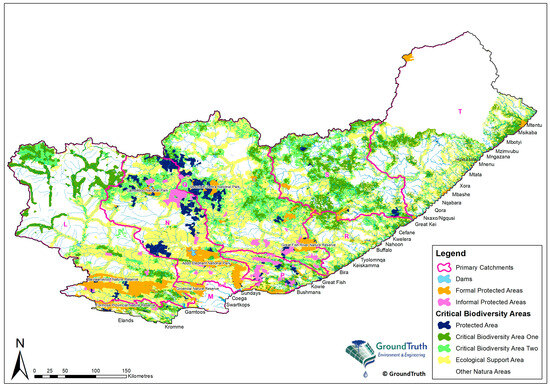
Figure 1.
The locality map and landcover of Water Management Area 7 (WMA 7). The primary catchment areas within South Africa are designated with letters, such as “T” “L”, “M”, “Q” and “S” (being in our current study area for the Mzimvubu and Tsitsikamma). This naming system simplifies identification and organisation of watersheds across South Africa. It ensures consistency and standardisation across regions and provinces, making it easier to map, manage, and reference specific areas. Thus, each primary catchment is represented by a single letter, corresponds to distinct natural boundaries that reflect the flow of water across regions. This hierarchical system extends beyond primary catchments to include secondary, tertiary, and quaternary catchment areas. Secondary catchments, such as “T9,” further subdivide the primary catchment into smaller regions to reflect more localised watershed boundaries. Tertiary catchments, like “T90,” provide even greater detail by focusing on finer hydrological divisions within the secondary catchments. Finally, quaternary catchments, such as “T90A,” represents the most detailed level of division, offering precise delineation for specific tributaries or sub-regions. This tiered approach supports effective water resource management by enabling detailed data collection, targeted planning, and efficient resource allocation at multiple scales.
Details for five major catchments and associated rivers in the study area are shown in Table 1. The naming system of water resources simplifies the identification and organization of watersheds across the country. Thus, each primary catchment is represented by a single letter, corresponding to distinct natural boundaries that reflect the flow of water across regions. Further, the allocation of letters is and was relatively arbitrarily defined and allocated.

Table 1.
Major catchments and associated rivers in Water Management Area 7 [13].
The climate of WMA7 is strongly influenced by its location relative to the sea and the topography [20]. Rainfall is in the range of 200 mm/a to 600 mm/a, with the coastal areas receiving higher rainfall than the inland areas [20]. Further, the water resources are not evenly distributed across the study area, with the natural runoff much greater toward the coast, where higher rainfalls occur [20]. Major aquifer systems of the study area are the Cape and Karoo Supergroups [13].
The main catchment developments and water users in the study area are briefly summarized per drainage region, as indicated in Figure 1. The Gamtoos catchment (Primary catchment L) has the largest irrigated areas, which use quite a volume of water. As a result, main water users in the catchment include irrigated agriculture and afforestation [19]. Further, the lower reach of the coastal sub-area of the Tsitsikamma River is heavily afforested and infested with alien invasive vegetation. Commercial forest tracts have been reported in the Gamtoos catchment above Loerie Dam and the upper Swartkops River [20]. The Gamtoos Water Scheme receives its water from Kouga Dam for irrigation, where deciduous fruit and citrus are grown. The use of water in Gqeberha and Uitenhage is on the rise due to industrial and manufacturing activities [20].
Figure 1 depicts that the majority of the land in the Sundays catchment (Primary catchment N) is used for agricultural purposes, especially in the upper catchment around the Darlington Dam [13]. Further, this catchment is also dominated by livestock grazing and limited forestry activities. The major town is Makhanda, which is located in the upper reaches of the Sundays River, with several other small towns such as Aberdeen, Peaston, and Graaff-Reinet, and with some coastal towns.
The Great Fish catchment (Primary catchment Q) is not rich in natural resources (minerals). As such, there are no observed mining activities. Agriculture is of major importance to the catchment; citrus and vegetable crops are grown [21]. Further, industrial activities such as agro-processing, food, and dairy processing are dominant in the big towns.
Figure 1 shows that the major towns in the Great Kei catchment (Primary catchment S) are East London, Queenstown, and Bisho, the latter two being the inland regional centers. DWS [20] reported that the Keiskamma River is dominated by several irrigation developments (citrus). Further, the Buffalo River is also dominated by commercial vegetable farming, such as tomatoes, maize, lucerne, and cabbage. The study [20] revealed that the presence of higher rainfall in the areas of the Amathole Mountains, the upper Keiskamma and Buffalo Rivers led to high afforestation.
The Mbashe catchment (Primary catchment T) is characterized by subsistence and commercial farming. Approximately 24,600 ha of commercial forestry dominate the upper Mthatha catchment above the Mthatha Dam. Several hydroelectric schemes, one in the Mbashe River and two in the Mthatha River, are found in the study area [13]. Further, inter-basin water transfer is between the Kei and Mbashe Rivers. The forestry sector is situated upstream of Mthatha Dam and is the largest water user, estimated at 37 million m3/a [20]. Further, forestry has an impact on the yield of the dam. The urban sectors (in Mthatha and Lusikisiki) are the main water users with over 15 million m3/a [20]. Groundwater use is scattered across the catchment.
2.2. Data Collection
Two approaches have been used to collect water use data in the study area: national databases (Water Authorisation and Registration Management System, National Groundwater Archive, and Hydstra) and field assessment. These approaches were adopted with modification from the studies done by Jovanovic et al. [7], DWS [21], and Kapangaziwiri et al. [22].
Secondary and primary data collection as a method applied to investigate sectoral water use, trends, and impacts provided baseline information to achieve the objectives of the current study. Primary data were generated by the researcher through assessment in order to understand water use activities in the study area. As reported by Goundar [23], there are advantages associated with primary data, such as data ownership, up-to-date information, freedom to collect data specific to the research needs, etc. In the current study, more comprehensive and reliable data were gathered through the combination of field assessments, national databases, and other relevant sources.
- (a)
- Primary data collection
The objective was to generate up-to-date water resource information in WMA7. After a review of various studies and national databases, a field assessment was undertaken between 2021 and 2023 as a part of the ground-truthing process for the determination of the water resource classes, the reserve and resource quality objectives (RQOs) study. Further, the assessment aimed to provide a balance between water resource protection and use through the determination of water resource classes.
Field assessment preparations for surface water required tools such as Google Earth (version 10.79.03), Geographic Information System (GIS) (https://dwa.maps.arcgis.com/home), and Global Positioning System (GPS) (Garmin GPSMAP 67i) to locate water users and landcover features in the study area. Google Earth imagery was used to provide landcover information for areas that were not easily accessible, like protected areas, mountainous areas, and water bodies. Further, the assessment targeted areas (within the study area) with historical water resource data, such as gauging weirs/streamflow gauging stations, borehole sites, and ecological water requirements (EWRs) sites, or environmental flows sites. EWRs refers to the flow patterns (such as duration, timing, and magnitude) and quality of water needed to sustain a riverine ecosystem in a particular condition [24]. Twenty-one EWRs sites and 28 gauging stations were visited in the study area, and these EWRs sites were adopted from the study by DWS [25] while the gauging stations’ data were obtained from the DWS (www.dws.gov.za/hydrology, accessed on 28 February 2025). At each EWRs site, selection of cross sections was done, assessment of the cross-sectional profile of the river channel was conducted using a Total Station (a survey instrument) at each EWRs site, a survey of longitudinal water slope was conducted, discharge was measured with the aid of a current meter, GPS coordinates and pictures of the site were captured [26]. Assessment at the EWRs sites included macro-invertebrates, vegetation, instream and riparian habitat, hydrology, fish, benthic diatoms, and in-situ water quality. The results were important to ascertain whether the objectives of maintaining and/or improving the ecological condition of the riverine ecosystem to facilitate sustainable use of the resource while maintaining the integrity of ecology were met [27]. Figure 2 depicts the spatial distribution of EWRs sites in the study area.
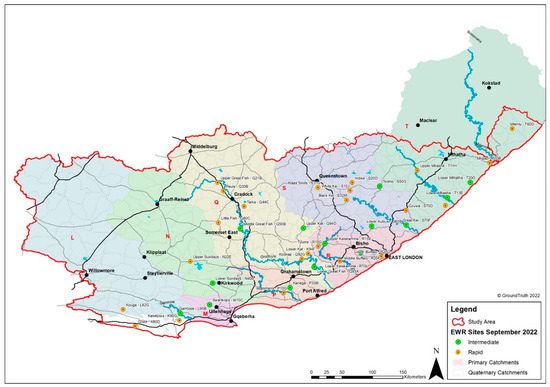
Figure 2.
Map showing the location of various ecological water requirements sites in WMA 7 [28]. The primary catchment areas within South Africa are designated with letters, such as “T” “L”, “M”, “Q” and “S” (being in our current study area for the Mzimvubu and Tsitsikamma). This naming system simplifies identification and or-ganisation of watersheds across South Africa. It ensures consistency and standardisation across regions and provinces, making it easier to map, manage, and reference specific areas. Thus, each primary catchment is represented by a single letter, corresponds to distinct natural boundaries that reflect the flow of water across regions. This hierarchical system extends beyond primary catchments to include secondary, tertiary, and quaternary catchment areas. Secondary catchments, such as “T9,” further subdivide the primary catchment into smaller regions to reflect more localised watershed boundaries. Tertiary catchments, like “T90,” provide even greater detail by focusing on finer hydrological divisions within the secondary catchments. Finally, quaternary catchments, such as “T90A,” represents the most detailed level of division, offering precise delineation for specific tributaries or sub-regions. This tiered approach supports effective water resource management by enabling detailed data collection, targeted planning, and efficient resource allocation at multiple scales.
Similarly, field assessment for groundwater was conducted as part of the hydrocensus for the determination of water resource classes, the reserve and resource quality objectives study in WMA7. The assessment was a follow-up on the groundwater source data from the databases. A total of 116 groundwater sites were visited during the study. At each borehole or groundwater monitoring site, the following sampling techniques were applied: GPS was used to record site coordinates and elevation, a dip meter was used to record borehole depths and water levels, water sampling by use of a bailer, tap or grab sample where possible [25]. During assessment, water levels were measured at 78 of the 116 groundwater monitoring points. Further, water level data were used to produce a contoured layer of “depth to groundwater” of the catchment within WMA7 [29].
- (b)
- Secondary data collection
The objective was to collate water use registration information and identify the main licensed water users within the study area. An extensive review of previous studies and national databases was undertaken to understand the water use setting in the study area. Similar to Evenson [30], the National Groundwater Archive (NGA) and Water Authorisation and Registration Management System (WARMS) databases for water resources were acquired to provide a spatial distribution of water use in the study area. As observed by Jovanovic et al. [7], the WARMS database is primarily used to account for the registered volumes of water used by different sectors, such as agriculture, industry, urban, etc. Further, it should be noted that WARMS is not a database of actual water use. Rather, it refers to the registered (licensed) water volumes. The Registration Guide of DWS [31] provides explanatory information and definitions of water uses in line with the National Water Act [15]. Water use includes storing, diverting, taking, discharging of water, and any activities that reduce streamflow [15]. According to NWA [15], water users requiring registration are individuals (e.g., farmers, small-holders, landowners or lessees), communities, companies and businesses, Water User Associations, and Water Services Providers (e.g., Water Boards). The WARMS provided adequate information required to identify which users are located where, water use volume, and possibly, water quality issues in the study area.
In addition, the water resource study [32] provided water use estimates and consumption rates, which were compared against registered water use volumes from the WARMS database. Obtained estimated water use volumes from WR2012 datasets, applied the following consumption rates: afforestation (100 mm/a), alien vegetation (120 mm/a), and agriculture (6000 m3/ha/a). These rates were based on average water use from neighboring catchments. Further, the data from WR2012 and WARMS were used where there were no specific models available for the purpose of understanding the level of utilization in the catchments [33]. It should be noted that households are not required to be registered if water use is part of the services offered by a water services provider, such as a municipality or a Water Board [7]. In this case, the municipality or Water Board must register its use. According to the WARMS database, the South African Department of Water and Sanitation (DWS) received 218 water use license applications between 2018 and 2022 for both surface and groundwater in the study area. Out of 218 water use license applications, 204 applications were granted, and only 14 license applications were declined. Thus, the high volume of approved water use licenses puts pressure on already stressed water resources in the study area [34].
The NGA is described as a system of the South African Department of Water and Sanitation which allows the public to access groundwater-related data (https://www.dws.gov.za/groundwater/nga.aspx, accessed in 18 July 2024). It is a web database system which has free data access available online. Borehole yields are listed in the NGA per Quaternary catchment to derive the geometric mean borehole yields for the study area. Further, the data sources provided information on water user descriptions such as water user type, water use by sector, authorization, and volume. A bullet-point list depicts the national databases and various studies consulted for water use information in the study area. In addition, the list shows how water data was incorporated into the current study.
- List of water users for both surface water and groundwater
- -
- Water Authorisation and Registration Management System (WARMS): The database was used in the study to identify water users and to address study objectives 1 and 2
- -
- National Groundwater Archive (NGA): It is an online groundwater database that is freely accessible to the public. It was used to locate boreholes, retrieve data, and address study objectives 1 and 2.
- Demographic data sources
- -
- Statistics South Africa (StatsSA) provided the current study with water use data for domestic and municipal water supply services. The data was used to estimate current water use and trends.
- -
- Nelson Mandela Bay Metro Municipality: The municipality provided the current study with actual water uses and population growth data of its jurisdiction.
- -
- Buffalo Metro Municipality: The municipality provided the current study with actual water uses and population growth data of its jurisdiction.
- Hydrological data sources
- -
- Hydstra: A hydrological database. It provided the current study with monthly flows. www.dws.gov.za/hydrology; 21 January 2025.
- -
- Water Resource 2012 (WR2012): A model developed in 2012. It provided water use estimates and consumption rates for the study area.
- Water uses for both surface water and groundwater
- -
- Reconciliation strategy study for the water resources in the Algoa systems. Provided the current study with surface and groundwater use for the Algoa water systems.
- -
- Reconciliation strategy study for the water resources in the Amathole systems. Provided the current study with surface and groundwater use for the Amathole water systems.
- -
- South African Department of Water and Sanitation (Directorate: compliance, monitoring and enforcement section). Provided the study with water use data for WMA7.
- The determination of water resource classes and the reserve and resource quality objectives study are in WMA7. The study provided the following data:
- -
- recharge,
- -
- basic human needs, and
- -
- environmental water requirements sites.
Mulangaphuma et al. [13] defined Hydstra as a commercial hydrological information system for the storage, editing, retrieval, manipulation, and analysis of surface water and groundwater time series data to support water resources management in the country.
Additional information such as water availability was incorporated into the current study because water use is closely linked with availability, and they are a function of the total flow of water through a catchment or basin. Water availability refers to all water that can be available for desired use [28]. Thus, it includes locally available surface water, groundwater resources, and usable return flows. In addition, hydrometeorological data (rainfall, evaporation, and streamflow data) for each respective catchment were gathered to determine water availability in the study area. Rain gauge data were compared with measured streamflow to determine water availability using rainfall runoff models (WRSM2000/Pitman Model).
- (c)
- Trend analysis
After sourcing all data required from the databases, literature, and field assessment, a trend analysis was done over a 5-year period, from 2018 to 2022. Trend analysis determines whether the measured values of water withdrawals and quality variables increase or decrease during a time period [35]. In the current study, trend analysis was done for water use and population growth, especially for major cities in the study area. Statistical analysis (Microsoft Excel 2016) was used to analyze trends over time. Further, a comparison of field assessment and secondary data was done to provide trends. The intrinsic interest, in the current study, was to understand whether changes in water availability and/or flows arise out of environmental concern and activity. In this subsection, results were presented using a graphic format, pie charts, and mapping. A GIS tool was used to analyze spatial data trends for the groundwater stress index. A hydrograph was used to analyze streamflow time series data for surface water. Data availability for both surface and groundwater could provide further evidence on whether high water levels of abstraction are affecting the sustainability of the resource or not.
- (d)
- Water use impacts
Two different approaches, such as groundwater stress index and water use impacts on streamflow or river flow, were applied to assess the impacts of water use on surface and groundwater of the study area. Further, the approaches seek to reconcile the water balance by estimating current groundwater use and availability (sourced from DWS, 2023, WEM/WMA7/00/CON/RDM/1122) to determine a stress index. The applied approaches were adopted with modification from studies done by WRC [36], DWS [26,28], and Shiferaw et al. [37].
- (i).
- Groundwater stress index
The objective is to determine the impacts of groundwater use on groundwater in the study area. The available data for groundwater recharge and use were used to quantify the stress index in the study area. The data for groundwater recharge was obtained from the determination of water resource classes, the reserve and resource quality objectives in Water Management Area 7. The concept of stressed water resources is addressed in the National Water Act [15] but not defined. However, WRC [36] indicated that the groundwater stress index reflects water availability versus water use. In a water resource where water use exceeds recharge, the resource is deemed stressed. A study by Sorensen et al. [34] revealed that the stress index, though a useful tool, has some limitations in accurately capturing the complexities of groundwater systems. Further, the stress index does not fully account for factors like climate change’s impacts on recharge and aquifer heterogeneity. In the current study, the stress index was based on groundwater use divided by the aquifer recharge, not the total recharge, since much of the recharge is lost as interflow and is not available to boreholes in the regional aquifer. In the current study, the assessment of groundwater impact by water users was done on a Quaternary catchment scale. In accordance with WRC [36], the stress index was defined as follows:
where
Stress Index (SI) = GWuse/Re
GWuse = groundwater use
Re = recharge
The above-mentioned equation is applicable to catchment in the long term. The groundwater use data were acquired from the databases (WARMS and NGA) and other sources (as mentioned in the bullet-point list) and were further divided by recharge to provide an estimation of the volume of groundwater in surplus or deficit per Quaternary catchment. Therefore, the volume is then translated into a stress index to express the degree of impact. Groundwater recharge is the water coming into the catchment [26] and is largely controlled by the precipitation distribution, which in turn is related to the topography [34]. In the determination of groundwater recharge, a study by DWS [26] applied the chloride mass balance (CMB) and cumulative rainfall departure (CRD) methods because these methods are capable of providing integrated and long-term estimates of recharge. The CMB method was based on the following equation: % recharge = chloride concentration in rainfall/chloride concentration in groundwater × 100 [36]. The CRD method was based on the premise that groundwater level fluctuations are caused by rainfall events [26]. Consequently, mean annual precipitation was used to calculate the mean recharge for the area. The estimation of recharge is one of the most important components within the groundwater resource directed measures (GRDMs) process since it is used to calculate both the stress index and the available groundwater volume for allocation per resource unit. This allocable volume ultimately determines whether or not additional license applications for groundwater can be approved.
For the current study, a GIS approach was used to distribute the volume of surplus or deficit groundwater into six main geometric interval categories and five intermediate geometric interval categories as presented in Table 2. The algorithm created intervals by minimizing the sum of squares of the number of elements in each ecological category. The stress index categories ranged from A (natural) to F (critically modified), with associated ranges of stress index volumes and associated percentages, as indicated in Table 2. Once the stress index was calculated, the present status category for each groundwater unit was set as per the categories shown in Table 2.
Table 2.
Summary of stress index categories [28].
- (ii).
- Streamflow impacts
The objective of examining the impact of water use on streamflow is significant because water use alters the natural water cycle, changes surface runoff, river flows, groundwater recharge, and overall water availability [28]. Further, this results in a decreased streamflow during dry periods and potential groundwater reserve depletion. In the current study, the methods by DWS [28] and Shiferaw et al. [37] were applied with modification.
To realize the objectives of the current study, both primary and secondary flow data obtained from field assessment, national database (Hydstra), and other sources mentioned in the previous bullet-point list, such as the recalibrated data for the Algoa and Amatole reconciliation studies [27], were used. Baseflow and natural flow time series obtained from these studies were used and adjusted by catchment area to obtain the flows at the selected EWRs sites and gauging weirs or streamflow gauging stations in the study area. The monitoring stations are managed and maintained by the South African Department of Water and Sanitation. Several flow monitoring stations are equipped with real-time telemetry data transmission systems, and monthly data is downloaded from dataloggers. Transmitted data from systems is accessible at www.dws.gov.za/hydrology, accessed on 18 February 2025. However, the streamflow method did not consider the impact of various factors such as climate change, other natural processes, and human activities that could potentially affect water availability, quality, and system health. Field assessments were undertaken in May 2022 and November 2022 to collect present-day flow data. The present-day modeled flows were from both WR2012 and from the updated, recalibrated Algoa and Amatole studies. Briefly, the following sampling techniques were applied during field assessment: At each EWRs site and selected gauging weirs, selection of cross sections was undertaken, assessment of the cross-sectional profile (vertical subsection) of the river channel was conducted using a Total Station at each site, the width and depth of each subsection was measured, a current meter was put in a flowing water to measure the water velocity in each subsection, the subsection area was then multiplied by the water velocity to calculate the discharge in each subsection and then the discharge of each subsection was added to calculate the total discharge. The discharge data, for October 2021 to September 2022, in million cubic meters per second (m3/s), were then analyzed and interpreted using a hydrograph. Hydrograph results (baseflow, natural flow, and present-day flow) were then linked to water users in the study area.
The groundwater stress index and water use impacts on streamflow were applied to estimate the degree of water use impact on both water resources (surface and groundwater). Therefore, the degree of change from natural to present state could be attributed to water uses in and around water resources. The application of these methods was important as they gave a clear picture of the state of water resources in the study area.
2.3. Data Analysis
Masangu [38] reported that statistical analysis is done to discover patterns among the data. In the current study, the identification of sectoral water users from the WARMS dataset was analyzed by using descriptive statistical analysis (Microsoft Excel 2016). The expected output of this analysis was a comprehensive list of identified surface and groundwater users and their uses. The list of sectoral water users and associated uses was presented in pie charts for a better understanding.
To achieve the second objective of the current study, a time series statistical analysis was used to show water use trends for identified priority sectors over a 5-year period by sourcing historical water use data for the study area. This was achieved by calculating total water use per sector for each catchment. The water use output was presented in graph form to show the consumption level per user group.
To achieve the third objective, GIS and hydrographs were applied to analyze the impacts of water resource use on surface and groundwater. The GIS tool was applied to determine spatial distributions of groundwater stress index for the study area. In addition, a GIS approach was used to analyze the stress index by balancing the volume of surplus or deficit groundwater into six main geometric interval categories and to show the spatial distribution of water users. The volume was then translated into a stress index to express the degree of impact. Hydrographs provided baseflow, natural, and present-day flow time series for the study area. Subsequently, the flow time series provided ecologists with a better understanding of how much water stress has changed from natural to present conditions due to changes in flow.
3. Results and Discussion
This section provides results on water use and discusses both surface water and groundwater in WMA7.
3.1. Surface Water Results
3.1.1. Surface Water Use Identification
Water use data were collated from a variety of sources, including the WARMS database, local municipalities, previous and current studies, as previously indicated in Table 2. Major sectoral water users such as agriculture (irrigation), municipal, hydro power generation, water storage, mining, afforestation, industries, recreation, and agriculture (livestock watering) were identified and considered in the assessment. The consideration was based on the total volume of water use from 2018 to 2022, as indicated in Figure 3.
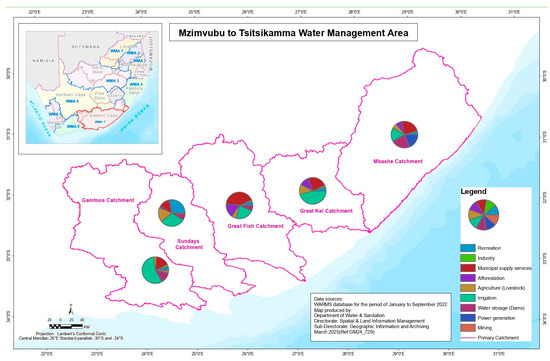
Figure 3.
Major sectoral water use identified in Water Management Area 7 for the 2018 to 2022 period.
The total water use volume for identified users in the study area was estimated to be 2.1 billion m3/a over a 5-year period. In line with global trends, Figure 3 shows that the agricultural sector is a major water user in the study area, with an estimated 60% of the total water requirement used for irrigation over a 5-year period (2018 to 2022). A study by Donnenfeld [8] gave a global estimation that about 70% of available freshwater is used by the agricultural sector, although that figure varies significantly by region. In the current study, the sector is dominated by commercial vegetable farming, such as tomatoes, maize, lucerne, and cabbage. This is followed by municipal supply services (17%), water storage (13%), and the remainder for industry, afforestation, mining, power generation, and recreation. As shown in Figure 3, the Gamtoos catchment has the largest irrigated areas, which use quite a volume of water. The Gamtoos Water Scheme receives its water from Kouga Dam for irrigation (deciduous fruit and citrus).
3.1.2. Water Use Trends
Figure 4 shows the sectoral water use trend over a 5-year period (2018-2022) for catchments within WMA7. The water use was based on estimated total volumes registered in the WARMS database.
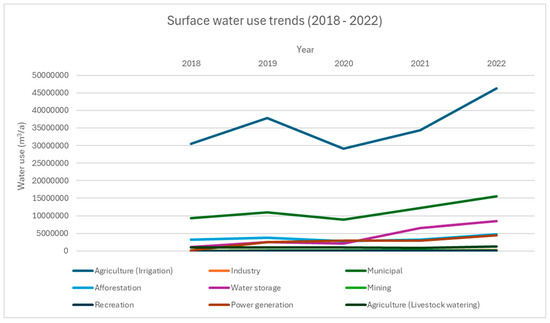
Figure 4.
Water use trend per primary catchment in Water Management Area 7 from 2018 to 2022.
Figure 4 shows fluctuating growth in water use across the catchments from 2018 to 2022. Trend analysis showed that total water use increased over time. Increases in water use indicate that more licenses were issued. Figure 4 shows that sectoral water use by agriculture and municipalities increased over time. An increase in total water use could put water resources under stress. Moreover, the impact of climate change may exacerbate current water resource challenges, affecting the supply, demand, and water quality in WMA7. The water use dropped slightly between 2020 and early 2022. This could be due to drought (due to erratic rainfall) and the outbreak of COVID-19, which led to the country’s lockdown during the period.
- (i).
- Water use trends in the two major cities
To obtain a specific picture of the total use pattern in the study area, the total water use pattern was scaled down to a local authority or municipal level. Globally, the UN [39] estimated that more than 55% of the global population lives in cities and that 394 of the world’s cities have a population that exceeds 1 million inhabitants. As a result, the expansion of urban areas continues to pose a significant threat to natural dynamics, water resource availability, and quality [39]. In the current study, municipal supply services are one of the major water consumers. Two cities (Gqeberha and East London) in the Nelson Mandela Bay Municipality (NMBM) and Buffalo Metropolitan Municipality (BMM) were examined. Municipal water use represents the amount of water withdrawn to provide the needs of the two cities, including households, industries, commercial, and mining uses to produce the goods and services society desires. The NMBM historical water use and population growth data were sourced from the Algoa reconciliation study [27] and outlined in Figure 5.
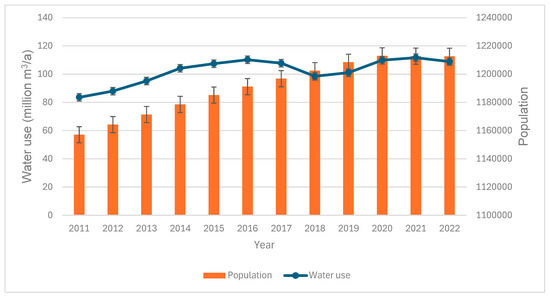
Figure 5.
Historical water use and population of the Nelson Mandela Bay Municipality for a 12-year period.
The NMBM total water use trend analysis shows that the water use pattern is high and not stable. The recorded total water use was estimated at 108.9 million m3/a in 2022, for a total population of 1.2 million in the same year. Figure 5 shows that population growth and water requirement percentage growth are not in sync. A study by Arto [2] reported that high population growth significantly impacts water use, primarily by increasing demand (from drinking to irrigation) and straining water resources. Subsequently, it leads to challenges such as increased competition for limited resources, scarcity of water, and potential water resource deterioration (due to reduced river flows). As the global population rises, so does the need for water for various uses, including irrigation, industry, and domestic use. All these put significant pressure on surface and groundwater supplies. It should be noted that the water used by the NMBM includes water supplied to the Coega Socio-Economic Zone (SEZ). The Coega SEZ is an area dedicated mainly to industrial development and is strategically placed adjacent to the Port of Ngqura to encourage the establishment of export-oriented industries. Coega SEZ’s water use was 1.9 million m3/a, inclusive of 1.0 million m3/a for potable use and 0.9 million m3/a for industrial use (potable supply as a temporary measure). Further, the municipality has many water challenges, from a historic drought (due to below average rainfall) since 2015, to water supply lost to leaks, aging, and poorly maintained water infrastructure [27]. In addition, water use is depressed during drought periods, especially with punitive water restrictions in place (2018–2019). Following the drought, the extent of recovery of NMBM water requirements depended on the extent of change in consumer behavior and changes in water supply connectivity.
The BMM historic water use trends and population growth are indicated in Figure 6.
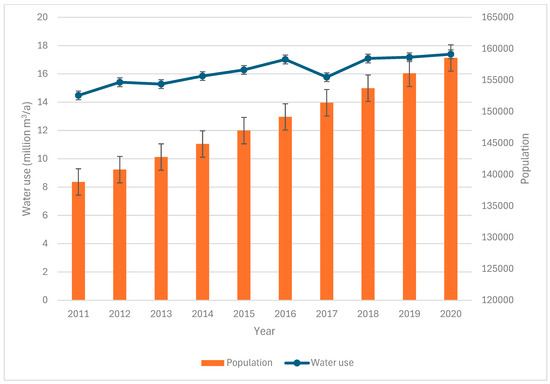
Figure 6.
Water use trend and population growth for the Buffalo Metro Municipality from 2011 to 2020.
The BMM total water use trend was not stable and was on the rise. Water use has increased more than the rate of population growth, putting water availability under tremendous pressure to cater for current and future water users. The total population has had a linear growth trend from 2011 to 2020. As previously reported by Arto [2], the population trends and population growth directly and indirectly impact the demand for services such as water supply and water for economic production. The trend shows that the water consumption rate was sitting at 138 Mm3/a in 2011, while in 2020, the water consumption rate increased to 155 Mm3/a. However, a sudden drop in water use was recorded in 2017, which coincided with the year the municipality experienced severe drought, followed by water restrictions. The domestic and industrial sector is the biggest water user in the BMM with a total allocation of 110.55 million m3/a. Water use from industries and domestic sources grew on average by 3.9% per annum over the period. The key drivers of this growth have been population growth and economic development [40]. The historic water requirements for domestic and industrial use were obtained from Amatola Water (AW) and DWS [40].
3.1.3. Water Use Impacts on Streamflow
Figure 7 shows monthly hydrographs for the Great Kei, Gamtoos, Great Fish, Sundays, and Mbashe catchments within the Mzimvubu to Tsitsikamma Water Management Area 7 (WMA7). The monthly hydrographs define natural (NAT), baseflow (BF), and present-day (PRS) flows, as shown in Figure 8. Further, the monthly flow time series was examined from October 2021 to September 2022 to understand water use impacts on streamflow.
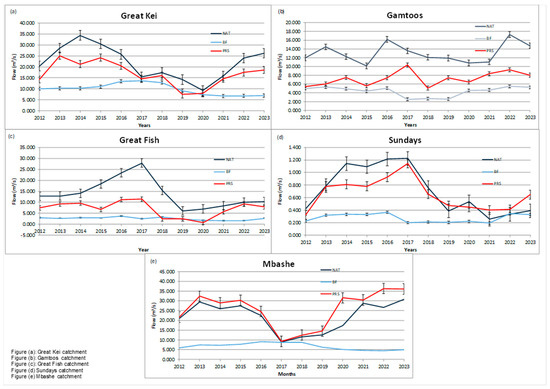
Figure 7.
Yearly hydrographs for the Great Kei, Gamtoos, Great Fish, Sundays, and Mbashe catchments in Water Management Area 7, for the 2012 to 2023 period.
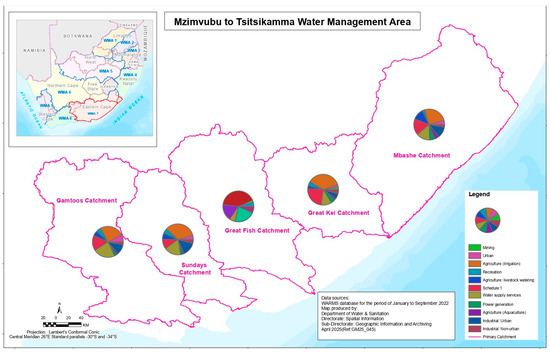
Figure 8.
Current groundwater uses per catchment in Water Management Area 7 (WMA7).
Figure 7a shows that a yearly average natural flow was recorded at 33.453 m3/s of natural mean annual runoff (nMAR), while a yearly average present-day flow was recorded at 25.265 m3/s, which indicates water use impacts on the river flow. Further, these graphs show that during winter, the river flow can be very low, while during summer, the river flow can be very high. The Great Kei catchment consists of two major rivers: the Keiskamma and Buffalo. The Keiskamma River is dominated by several irrigation developments (citrus), and the Buffalo River is also dominated by commercial vegetable farming, such as tomatoes, maize, lucerne, and cabbage. Further, there are several important regional water schemes in the Great Kei catchment that supply water to urban and rural communities in the tribal areas.
Figure 7b shows that, from 2017 to 2019, the catchment experienced the lowest average flow (i.e., baseflow) due to drought. In the following year (2020), flow picked up, and with the highest average flow conditions (according to the natural flows). The yearly average natural flow was recorded at 17.045 m3/s, and the yearly average present-day flow was recorded at 7.901 m3/s. In this catchment, a study by Mulangaphuma et al. [13] reported commercial forest tracts above Loerie Dam and the upper Swartkops River. In addition, the Gamtoos Water Supply Scheme receives its water from Kouga Dam for irrigation, where deciduous fruit and citrus are grown. The use of water in Gqeberha and Uitenhage is on the rise due to industrial and manufacturing activities [19].
Figure 7c shows that flows follow a similar pattern. The nMAR was recorded at 17.542 m3/s, while the yearly average present-day flow was recorded at 13.132 m3/s. This is a clear indication of water abstraction in the Great Fish catchment. However, the Upper Great Fish is upstream of the Orange-Fish transfer scheme and provides some indication of the natural characteristics of the river before the transfer scheme began. Although the river is perennial, it has some seasonal tendencies with very low flows during drier periods. Further, this system is naturally seasonal to ephemeral and more flood-driven. The low or no flows in the river are further enhanced by water use in the upper catchments. Similarly, the flows at this EWRs site on the Lower Little Fish River are impacted by the Orange River (Gariep Dam) transfer to the Fish River. In line with the national water use trends, agriculture (irrigation) is one of the major consumers of water and is very important to the catchment; citrus and vegetable crops are grown [19]. In addition, industrial activities such as agro-processing, food, and dairy processing are dominant in the big towns.
Figure 7d shows that the Sundays catchment is characterized by low or no flows in most parts of the catchment. The natural mean annual runoff was recorded at 1.254 m3/s, while the yearly average present-day flow was recorded at 1.037 m3/s. The upper catchment is used for agricultural purposes, especially around Darlington Dam [13]. Further, this catchment is also dominated by livestock grazing and limited forestry activities. This site provides some indication of the natural characteristics of the Sundays River before the Lower Sunday water transfer scheme began. The river was dry during the surveys as it is naturally seasonal to ephemeral and more flood-driven. However, the Groot River is naturally perennial to seasonal with highly variable flows between years and large flooding events.
In contrast, Figure 7e recorded a natural mean runoff of 29.663 m3/s, while the yearly average present-day flow was recorded at 33.725 m3/s, which clearly shows a higher present-day flow than natural flow. Therefore, the Mbashe catchment has an inter-basin water transfer between the Kei and Mbashe Rivers. Several hydroelectric schemes, one in the Mbashe River and two in the Mthatha River, are found in the study area [19].
Based on Figure 7, all catchments have relatively high natural flows by South African standards. These natural annual flows are an indication of the original average flows that occurred before the influence of consumptive use and man-made infrastructure. However, for the purpose of water use or water abstraction in the study area, the variability of the flow needs to be taken into consideration. This is because if water is abstracted at unsustainable levels, it has the potential to reduce the overall amount of water flowing downstream in the river system [41].
3.2. Groundwater Results
3.2.1. Groundwater Use Identification
All major groundwater use activities in WMA7 were identified and assessed as shown in Figure 9. According to the WARMS database, registered groundwater use is scattered across Water Management Area 7. The groundwater assessment covered a total of 4266 registered groundwater resources in the study area, of which 3727 were boreholes and 539 were springs. The current groundwater use, from boreholes and springs, is presented, as shown in Figure 9.
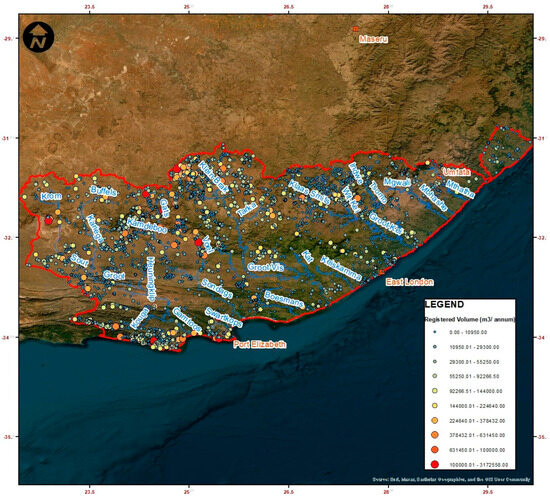
Figure 9.
Spatial distribution of groundwater uses in Water Management Area 7.
The total groundwater use in the study area was estimated at 149.33 Mm3/a. In line with surface water, the largest component of groundwater use was recorded by the irrigation sector (53%), followed by water supply service (24%), Schedule 1 (9%), and the remaining groundwater use sectors account for 14%. Schedule 1 water use refers to the use of water for domestic purposes, such as gardening, watering of livestock, etc. [29]. Groundwater use was estimated to increase due to several towns that rely solely on groundwater.
- (i).
- Spatial distribution of water uses in Water Management Area 7
The objective is to show the spatial distribution and associated volume of water use in Water Management Area 7, as indicated in Figure 9.
As shown in Figure 9, the majority of groundwater users are located mainly in the southern coastal areas and the western part, especially in the Karoo, due to erratic rainfall. In addition, most groundwater resources are in the ‘low use’ category. However, the western part of the study area shows a high concentration of groundwater use in Quaternary catchments around the Nelson Mandela Bay Municipality. This is due to industrialization and severe drought experienced from 2017 to early 2022, which resulted in extensive groundwater exploration (municipal and private) occurring in the catchment. However, it must be noted that groundwater resources occur in clusters, which indicates that the cumulative use of individual groundwater resources is much greater [26].
3.2.2. Groundwater Use Trends
Groundwater users such as mining, recreation, urban, agriculture (livestock watering), agriculture (aquaculture), agriculture (irrigation), industry (non-urban), water supply services, schedule 1, power generation, and industry (urban) were identified and analyzed to show groundwater use trends over 5-year period (2018–2022) for the study area, as shown in Figure 10.
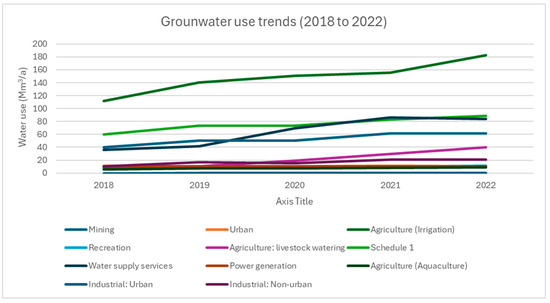
Figure 10.
Groundwater use trends for Water Management Area 7 (WMA7).
Groundwater use for agriculture (irrigation) has followed a pattern similar to surface water use. In accordance with the databases, total water use for irrigation was estimated at 178.33 Mm3/a over a 5-year period. Over the years, the main irrigated crops within the study area included vegetables, pastures, deciduous fruit, citrus, and lucerne. Irrigation and Schedule 1 remain the largest water use sectors in WMA7.
3.2.3. Groundwater Use Impact
The objective is to determine the degree of impact caused by groundwater use on the groundwater resource in WMA7, through the stress index. The stress index is an important tool to provide critical information on water availability versus use. Figure 11 shows the spatial distribution of the groundwater stress index across WMA7.
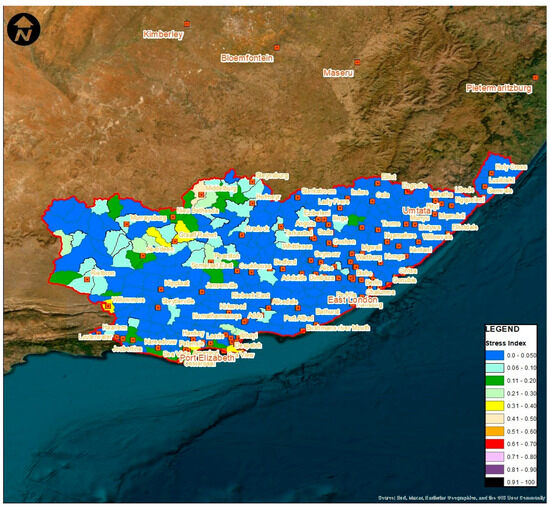
Figure 11.
Spatial distribution of the groundwater stress index in Water Management Area 7 [26].
As shown in Figure 11, the groundwater stress index results revealed that the majority of the Quaternary catchments have surplus groundwater available, i.e., groundwater use is less than recharge. In addition, the majority of Quaternary catchments of the study area fall in the stress index category A (Natural) with 79%, followed by stress index category A/B (Natural to Good) with 10%, and category B (Good) with 6%. In addition, groundwater recharge is spatially variable and generally decreases in a westerly direction in the study area. This is due to the western half of the catchment receiving less than 17.50 Mm3/a of recharge per annum, which increases to more than 200 Mm3/a in the northeast. The results of the current study revealed that no Quaternary catchments had ecological categories below D, which is regarded as an unsustainable state.
4. Conclusions
This study aimed to identify and quantify sectoral water use for both surface and groundwater in order to understand the demand side of water availability within Water Management Area 7 (WMA7). The Water Authorisation and Registration Management System (WARMS) database and field assessments were undertaken to investigate sectoral water use in the study area. Study findings revealed the following:
- A total water use volume for surface water was estimated at 2.1 billion m3/a, while groundwater recorded 643.44 Mm3/a over a 5-year period.
- Agriculture (irrigation) is the largest water user for both surface and groundwater with an estimated 60% of the total requirement.
- Trend analysis revealed that water uses increase over time over a 5-year period.
- The application of groundwater stress index revealed that the majority of the Quaternary catchments have surplus groundwater available, i.e., groundwater use is less than recharge.
- While on surface water, revelations suggested that the activities had an impact on streamflow because most catchments had a low flow.
The study’s findings revealed that yearly flow time series (from 2012 to 2023) clearly indicated the influence of consumptive use and water use authorization in the study area. An increase in total water use could put water resources under stress, including impacts on the aquatic ecosystem, reduced water quality, and economic and social consequences.
Based on this importance, the study will ultimately assist the DWS in water resource management within WMA7 and also assist in making informed decisions regarding the authorization of future water use and put appropriate water use conditions on the proposed developments. It will further enhance and support the ongoing water resource protection measures study that collectively aims to ensure that significant water resources in the country are protected, while allowing economic development. The current study recommends that a follow-up on compliance of surface water and groundwater use licenses be regularly conducted. Further, it recommends the application of current study findings in other settings to improve the protection of water resources, especially in water management areas where water use applications are on the rise.
Author Contributions
Conceptualization, L.M. and N.J.; methodology, L.M.; formal analysis, L.M.; data curation, L.M.; writing—original draft preparation, L.M.; writing—review and editing, N.J.; supervision, N.J. All authors have read and agreed to the published version of the manuscript.
Funding
This research was funded by the South African Department of Water and Sanitation.
Data Availability Statement
Publicly available datasets were analyzed in the paper. The data can be found here: [https://www.dws.gov.za/wem/WRCS/kft.aspx] (accessed on 20 November 2024).
Acknowledgments
The authors gratefully acknowledge GroundTruth cc for supporting the study with data. In addition, the authors acknowledge James Mapulana for assisting with the study area maps.
Conflicts of Interest
The authors declare no conflicts of interest.
Abbreviations
The following abbreviations are used in this manuscript:
| BHNs | Basic Human Needs |
| BMM | Buffalo Metro Municipality |
| CRD | Cumulative Rainfall Departure |
| CMB | Chloride Mass Balance |
| DWS | Department of Water and Sanitation |
| EWRs | Ecological Water Requirements |
| GPS | Global Positioning System |
| GIS | Geographic Information System |
| GRDMs | Groundwater Resource Directed Measures |
| NEMA | National Environmental Management Act |
| NGA | National Groundwater Archive |
| nMAR | Natural Mean Annual Runoff |
| NMBM | Nelson Mandela Bay Municipality |
| NWA | National Water Act |
| UN | United Nations |
| WARMS | Water Authorization and Registration Management System |
| WMA | Water Management Area |
| WR2012 | Water Resource 2012 |
| WRC | Water Research Commission |
References
- Alley, W.M.; Evenson, E.J.; Barber, N.L.; Bruce, B.W.; Dennehy, K.F.; Freeman, M.C.; Freeman, W.O.; Fischer, J.M.; Hughes, W.B.; Kennen, J.G.; et al. Progress Toward Establishing a National Assessment of Water Availability and Use; U.S. Geological Survey Circular 1384; U.S. Geological Survey: Drive Reston, VA, USA, 2013; 34p.
- Arto, I.; Andreoni, V.; Rueda-Cantuche, J.M. Global use of water resources: A multi-regional analysis of water use, water footprint and water trade balance. Water Resour. Econ. 2016, 15, 1–14. [Google Scholar] [CrossRef]
- Mazzoni, F.; Blokker, E.J.M.; Alvisi, S.; Franchini, M. An enhanced method for automated end-use classification of household water data. J. Hydroinformatics 2024, 26, 408–423. [Google Scholar] [CrossRef]
- Guo, H.; Liu, X.; Zhang, Q. Identifying daily water consumption patterns based on K-means Clustering, Agglomerative Hierarchical Clustering, and Spectral Clustering algorithms. AQUA Water Infrastruct. Ecosyst. Soc. 2024, 73, 870–887. [Google Scholar] [CrossRef]
- Pavelic, P.; Giordano, M.; Keraita, B.; Ramesh, V.; Rao, T. Groundwater Availability and Use in Sub-Saharan Africa: A Review of 15 Countries; International Water Management Institute (IWMI): Colombo, Sri Lanka, 2012. [Google Scholar] [CrossRef]
- Mwendera, E.; Atyosi, Y. A Review of Water Storage for Socio-Economic Development in South Africa. J. Water Resour. Prot. 2018, 10, 266–286. [Google Scholar] [CrossRef]
- Jovanovic, N.; Lushozi, N.; Israel, S.; Van Niekerk, A.; Muller, J.; Stephenson, G.; Munch, Z.; Jarmain, C. Integrated Land Use and Water Use in Water Management Areas, with a View on Future Climate and Land Use Changes; Water Research Commission Report No. K5/2520; Water Research Commission: Pretoria, South Africa, 2020. [Google Scholar]
- Donnenfeld, Z.; Crookes, C.; Hedden, S. A Delicate Balance: Water Scarcity in South Africa; Water Research Commission, Institute for Security Studies: Pretoria, South Africa, 2018. [Google Scholar]
- du Plessis, A. South Africa’s Water Availability and Use. In Freshwater Challenges of South Africa and its Upper Vaal River; Springer Water; Springer: Cham, Switzerland, 2017. [Google Scholar] [CrossRef]
- Department of Water and Sanitation, South Africa. National Water Resource Strategy 3; Department of Water and Sanitation: Pretoria, South Africa, 2023. [Google Scholar]
- Barlow, P.M.; Alley, W.M.; Myers, D.N. Hydrologic Aspects of Water Sustainability and Their Relation to a National Assessment of Water Availability and Use U.S. Geological Survey; Universities Council on Water Resources Water Resources Update, Issue 127; U.S. Geological Survey: Drive Reston, VA, USA, 2004.
- Pfister, S.; Bayer, P.; Koehler, A.; Hellweg, S. Projected water consumption in future global agriculture: Scenarios and related impacts. Sci. Total. Environ. 2011, 409, 4206–4216. [Google Scholar] [CrossRef] [PubMed]
- Mulangaphuma, L.H.; Odusanya, D.; Jovanovic, N. Evaluation of River and Groundwater Quality in the Mzimvubu to Tsitsikamma Water Management Area (WMA7). Water 2024, 16, 1654. [Google Scholar] [CrossRef]
- Cobbing, J.E. An Updated Water Balance for the Grootfontein Aquifer near Mahikeng; Faculty of Science, Nelson Mandela University: Port Elizabeth, South Africa, 2018. [Google Scholar] [CrossRef]
- Republic of South Africa. National Water Act (NWA) (Act No. 36 of 1998); Government Gazette No. 39299; Government Printer: Cape Town, South Africa, 1998. [Google Scholar]
- Republic of South Africa (RSA). National Environmental Management Act (NEMA) (Act No. 107 of 1998); Government Printers: Pretoria, South Africa, 1998. [Google Scholar]
- De Stefano, L.; Bea, M.; Carmody, E.; van Dyk, G.; Fernández-Lop, A.; Fuentelsaz, F.; Hatcher, C.; Hernández, E.; O’Donnell, E.; Rouillard, J.J. How to Tackle Illegal Water Abstractions? Taking Stock of Experience and Lessons Learned; Botin Fundacion: Madrid, Spain, 2020; ISBN 978-84-15469-90-2. [Google Scholar]
- Bea, M.; Fuentelsaz, F.; Fernández-Lop, A. Actions to Detect and Combat Illegal Water Use in Spain. 2020. Available online: https://www.researchgate.net/publication/342159293_Actions_to_detect_and_combat_illegal_water_use_in_Spain_Two_case_studies (accessed on 28 February 2025).
- Department of Water and Sanitation, South Africa. Determination of Water Resource Classes, Reserve and RQOs in the Keiskamma and Fish to Tsitsikamma Catchment: Inception Report; Report No. WEM/WMA7/00/CON/RDM/0121; Department of Water and Sanitation: Pretoria, South Africa, 2021. [Google Scholar]
- Department of Water and Sanitation, South Africa. Determination of Water Resource Classes, Reserve and RQOs in the Keiskamma and Fish to Tsitsikamma Catchment: River Field Survey Report 1; Report No. WEM/WMA7/00/CON/RDM/0722; Department of Water and Sanitation: Pretoria, South Africa, 2022. [Google Scholar]
- Department of Water and Sanitation, South Africa. Provision of General Modelling and Water Resource Evaluation Services for Allocable Water Quantification and to Support Integrated Water Resource Planning (Kouga, Baviaans, Gamtoos and Kromme Rivers)—Surface Water Quality Report; Department of Water and Sanitation: Pretoria, South Africa, 2023. [Google Scholar]
- Kapangaziwiri, E.; Kahinda, J.M.; Dzikiti, S.; Ramoelo, A.; Cho, M.; Mathieu, R.; Naidoo, M.; Seetal, A.; Pienaar, H. Validation and verification of lawful water use in South Africa: An overview of the process in the KwaZulu-Natal Province. Phys. Chem. Earth Parts A/B/C 2017, 105, 274–282. [Google Scholar] [CrossRef]
- Goundar, S. Chapter 3—Research Methodology and Research Method. In Cloud Computing; Goundar, S., Ed.; Research Gate Publications: Berlin, Germany, 2012. [Google Scholar]
- Department of Water and Sanitation, South Africa. Development of Procedures to Operationalise Resource Directed Measures. Main Report; Report No. RDM/WE/00/CON/ORDM/0117, Prepared by Rivers for Africa eFlows Consulting (Pty) Ltd.; Department of Water and Sanitation: Pretoria, South Africa, 2017. [Google Scholar]
- Department of Water and Sanitation, South Africa. Determination of Water Resource Classes, Reserve and RQOs in the Keiskamma and Fish to Tsitsikamma Catchment: Groundwater PES and Quantification of the Reserve Report; Report No. WEM/WMA7/00/CON/RDM/1122; Department of Water and Sanitation: Pretoria, South Africa, 2023. [Google Scholar]
- Department of Water and Sanitation, South Africa. Determination of Water Resource Classes, Reserve and RQOs in the Keiskamma and Fish to Tsitsikamma Catchment: Final Groundwater Report; Report No. WEM/WMA7/00/CON/RDM/1223; Department of Water and Sanitation: Pretoria, South Africa, 2023. [Google Scholar]
- Department of Water and Sanitation, South Africa. Algoa WSS Water Allocations, Requirements and Return Flows Report; Department of Water and Sanitation: Pretoria, South Africa, 2023. [Google Scholar]
- Department of Water and Sanitation, South Africa. Determination of Water Resource Classes, Reserve and RQOs in the Keiskamma and Fish to Tsitsikamma Catchment: Ecological Water Requirements Quantification for Rivers Report; Report No. WEM/WMA7/00/CON/RDM/1923; Department of Water and Sanitation: Pretoria, South Africa, 2023.
- Department of Water and Sanitation, South Africa. Determination of Water Resource Classes, Reserve and RQOs in the Keiskamma and Fish to Tsitsikamma Catchment; Basic Human Needs Report, Report No. WEM/WMA7/00/CON/RDM/0922; Department of Water and Sanitation: Pretoria, South Africa, 2024. [Google Scholar]
- Evenson, E.J.; Jones, S.A.; Barber, N.L.; Barlow, P.M.; Blodgett, D.L.; Bruce, B.W.; Douglas-Mankin, K.; Farmer, W.H.; Fischer, J.M.; Hughes, W.B.; et al. Continuing Progress Toward a National Assessment of Water Availability and Use; U.S. Geological Survey Circular 1440; U.S. Geological Survey: Drive Reston, VA, USA, 2018; p. 64. [CrossRef]
- Department of Water and Sanitation, South Africa. A Guide to the Registration of Water Use Under the National Water Act (Act 36 of 1998); Department of Water and Sanitation: Pretoria, South Africa, 2000. Available online: https://www.dws.gov.za/Projects/WARMS/Registration/R000218/updatedwateruserregistrationguideNew2.pdf (accessed on 25 June 2024).
- Water Resources of South Africa Study, WR2012. 2012. Available online: http://waterresourceswr2012.co.za/resource-centre/ (accessed on 21 January 2025).
- WRC. Water Resources of South Africa, 2012 Study (WR2012); WRC Project No. K5/2143/1; WRC: Pretoria, South Africa, 2012. [Google Scholar]
- Sorensen, J.P.R.; Davies, J.; Ebrahim, G.Y.; John, L.; Marchant, B.P.; Ascott, M.J.; Bloomfield, J.P.; Cuthbert, M.O.; Holland, M.; Jensen, K.H.; et al. The influence of groundwater abstraction on interpreting climate controls and extreme recharge events from well hydrographs in semi-arid South Africa. Hydrogeol. J. 2021, 29, 2773–2787. [Google Scholar] [CrossRef]
- Antonopoulos, V.Z.; Papamichail, D.M.; Mitsiou, K.A. Statistical and trend analysis of water quality and quantity data for the Strymon River in Greece. Hydrol. Earth Syst. Sci. 2001, 5, 679–691. [Google Scholar] [CrossRef]
- WRC. Groundwater Resource Directed Measure Manual; WRC Project: K8/891; WRC: Pretoria, South Africa, 2012. [Google Scholar]
- Shiferaw, N.; Habte, L.; Waleed, M. Land use dynamics and their impact on hydrology and water quality of a river catchment: A comprehensive analysis and future scenario. Environ. Sci. Pollut. Res. 2025, 32, 4124–4136. [Google Scholar] [CrossRef] [PubMed]
- Masangu, T.G. Allocation and Use of Water for Domestic and Productive Purposes: An Exploratory Study from the Letaba River Catchment. Master’s Thesis, University of Western Cape, Cape Town, South Africa, 2009. [Google Scholar]
- UN (United Nations). World Urbanization Prospects: The 2011 Revision; United Nations, Department of Economic and Social Affairs (Population Division): New York, NY, USA, 2011. [Google Scholar]
- Department of Water and Sanitation, South Africa. Amathole WSS Water Allocations, Water Requirements and Return Flows Report; Prepared by Myra Consulting (Pty) Ltd. for Zutari (Pty) Ltd. as Part of the Support on Development, Updating and Review of Strategies to Reconcile Water Availability and Requirements in South Planning Area Study; Department of Water and Sanitation: Pretoria, South Africa, 2023. [Google Scholar]
- McGrane, S.J. Impacts of urbanisation on hydrological and water quality dynamics, and urban water management: A review. Hydrol. Sci. J. 2025, 61, 2295–2311. [Google Scholar] [CrossRef]
Disclaimer/Publisher’s Note: The statements, opinions and data contained in all publications are solely those of the individual author(s) and contributor(s) and not of MDPI and/or the editor(s). MDPI and/or the editor(s) disclaim responsibility for any injury to people or property resulting from any ideas, methods, instructions or products referred to in the content. |
© 2025 by the authors. Licensee MDPI, Basel, Switzerland. This article is an open access article distributed under the terms and conditions of the Creative Commons Attribution (CC BY) license (https://creativecommons.org/licenses/by/4.0/).