Article

The Spatio-Temporal Impact of Land Use Changes on Runoff in the Yiluo River Basin Based on the SWAT and PLUS Model

College of Agricultural Equipment Engineering, Henan University of Science and Technology, Luoyang 471000, China
*
Author to whom correspondence should be addressed.
Water 2025, 17(10), 1516; https://doi.org/10.3390/w17101516 (registering DOI)
Submission received: 16 April 2025 / Revised: 11 May 2025 / Accepted: 13 May 2025 / Published: 17 May 2025
(This article belongs to the Section Hydrology)

Abstract

:
As a major tributary of the Yellow River, the Yiluo River holds vital importance for regional water resource management and ecological sustainability. In this study, the SWAT (version 2012) and PLUS models were used in combination to simulate the hydrological responses of the basin and to analyze how land use changes have influenced runoff dynamics over time. During the calibration and validation periods, the Nash–Sutcliffe efficiency coefficient (NS) and coefficient of determination (R2) for the SWAT model both exceeded 0.8, while the Kappa coefficient for the PLUS model indicated an overall accuracy of 0.91, confirming the applicability of both models to the Yiluo River Basin. However, despite strong annual performance, potential monthly or seasonal simulation uncertainties should be acknowledged and warrant further analysis. From 2000 to 2020, the areas of forest land, water, urban land, and unused land in the Yiluo River Basin increased by 795.15 km2, 29.33 km2, 573.67 km2, and 0.25 km2, respectively, while cultivated land and grassland decreased by 814.50 km2 and 583.89 km2. The spatial distribution of the annual average runoff depth generally exhibited a pattern of “higher in the upstream and lower in the downstream”. An increase in the forestland and grassland areas was found to suppress runoff generation, whereas the expansion of urban land promoted runoff production. Implementing water-sensitive land use strategies—such as expanding forest cover and conserving grasslands—is crucial for reducing the negative hydrological impacts of urban land expansion. Such measures can improve runoff regulation, enhance groundwater recharge, and support the sustainable management of water resources within the basin. Assuming climate conditions remain constant, land use in the Yiluo River Basin in 2025 and 2030 is expected to remain dominated by cultivated land and forestland. Under this scenario, the annual average runoff is projected to increase by 0.42% and 0.51% compared to in 2020, respectively.

1. Introduction

Land use/cover change (LUCC) is a crucial factor in global environmental transformation. As one of the primary ways human activities influence the natural environment, land use change has impacted approximately 32% of the global land area over the past six decades [1]. With the intensification of global land use change, it has become a focal point in studies on climate and hydrological responses, drawing widespread attention from researchers and experts. Land use primarily influences watershed runoff by altering the underlying surface conditions, water cycle, and soil erosion processes, thereby exerting a significant impact on runoff generation, hydrological mechanisms, and overall hydrological regimes [2,3].
The mechanisms by which land use change influences runoff generation include but are not limited to precipitation interception, soil surface evapotranspiration, groundwater recharge, and soil infiltration processes [4,5]. Recent studies have emphasized that the temporal dynamics of land use/land cover (LULC) change—particularly in rapidly evolving watersheds—can significantly impact the accuracy of hydrological simulations. For instance, a study by Yonaba R et al. demonstrated that incorporating dynamic LULC input in SWAT modeling substantially improved the simulation of runoff processes in a Sahelian watershed, particularly when dealing with the so-called “Sahelian paradox” (i.e., increasing runoff despite declining rainfall). Their results showed that LULC change had a greater contribution to runoff variability than climate, reinforcing the importance of dynamic LULC integration in hydrological modeling frameworks [6]. In the Xichuan River Basin located in the loess hilly and gully region, studies have shown that changes in the underlying surface are the primary factor contributing to runoff reduction. Among land use types, grassland and forestland exhibit better interception effects than cropland, and vegetation restoration has a particularly significant impact on reducing runoff [7]. The SWAT model is widely used to simulate hydrological processes in watersheds. It considers the variations in climate and surface conditions across both space and time, making it well suited for hydrological simulations in complex basins. For instance, Liu et al. applied the SWAT distributed hydrological model and employed scenario simulation methods to construct three natural scenarios and three extreme scenarios. They studied the land use alterations in the basin over the period from 1990 to 2010 and evaluated how different land use types influenced runoff and sediment transport. Their findings indicated that, apart from cropland, runoff responded most significantly to changes in forestland [8]. Similarly, Dash et al. studied the impact of land use on runoff using the SWAT model and found that the expansion of agricultural land led to increased runoff during the monsoon season. Among all land use types, unused land was the most sensitive to changes in runoff, followed by construction land and recreational land [9].
In land use scenario prediction, both domestic and international researchers commonly use models such as CA-Markov, FLUS, CLUE-S, and PLUS to study the spatial distribution and changing trends of land use. As an illustration, Ezimand K et al. used the CA-Markov model to predict the development of construction land in Iran by 2031 [10]; Shao et al. employed the FLUS model to simulate land use changes in Beijing under different development scenarios [11]; Li et al. used the CLUE-S model to assess cropland suitability in the Naoli River Basin [12]; and Zhou et al. applied the PLUS model to analyze the optimal allocation of territorial space under various scenarios for the Shuangliao–Dongfeng area in Jilin Province by 2030 [13]. A notable study by Yonaba R et al. utilized a Multilayer Perceptron (MLP) neural network to model LULC dynamics in northern Burkina Faso. This study highlighted the strong human–environment relationship in Sahelian landscapes, with the major transformation being the conversion of degraded soils to croplands. The models projected substantial increases in cultivated areas by 2030 and 2050, emphasizing the importance of careful planning to balance agricultural production and natural resource conservation [14]. Compared with other models, the PLUS model can more accurately simulate nonlinear land use changes at the patch scale and performs better in multi-scenario simulations. For instance, in a study on land use change in the middle Heihe River Basin, Jiang et al. compared several models and found that the PLUS model outperformed others in simulation accuracy [15].
Protecting the ecology and promoting high-quality development in the Yellow River Basin are key national strategies [16,17]. The Yiluo River plays a key role in the Yellow River system, with its runoff changes having a direct effect on flood management and water resources downstream. The existing studies have analyzed the attribution of runoff changes using the Budyko hypothesis [18] or assessed spatial variations in soil erosion based on the InVEST model [19]. However, the specific impacts of land use change on surface runoff have not been thoroughly investigated, nor have predictions of future land use and runoff changes been adequately addressed.
This study centers on the Yiluo River Basin and utilizes the SWAT and PLUS models to analyze, simulate, and project watershed runoff responses to land use changes. The primary objective is to quantify the effects of different land use types on hydrological processes and to offer scientific insights for soil and water resource management within the basin. By clarifying the complex interactions between land use dynamics and runoff behavior, the research supports integrated watershed management strategies that align development with hydrological sustainability. Effectively managing land use change is essential for maintaining watershed health, improving water quality, and strengthening ecosystem resilience in the face of climate variability.

2. Materials and Methods

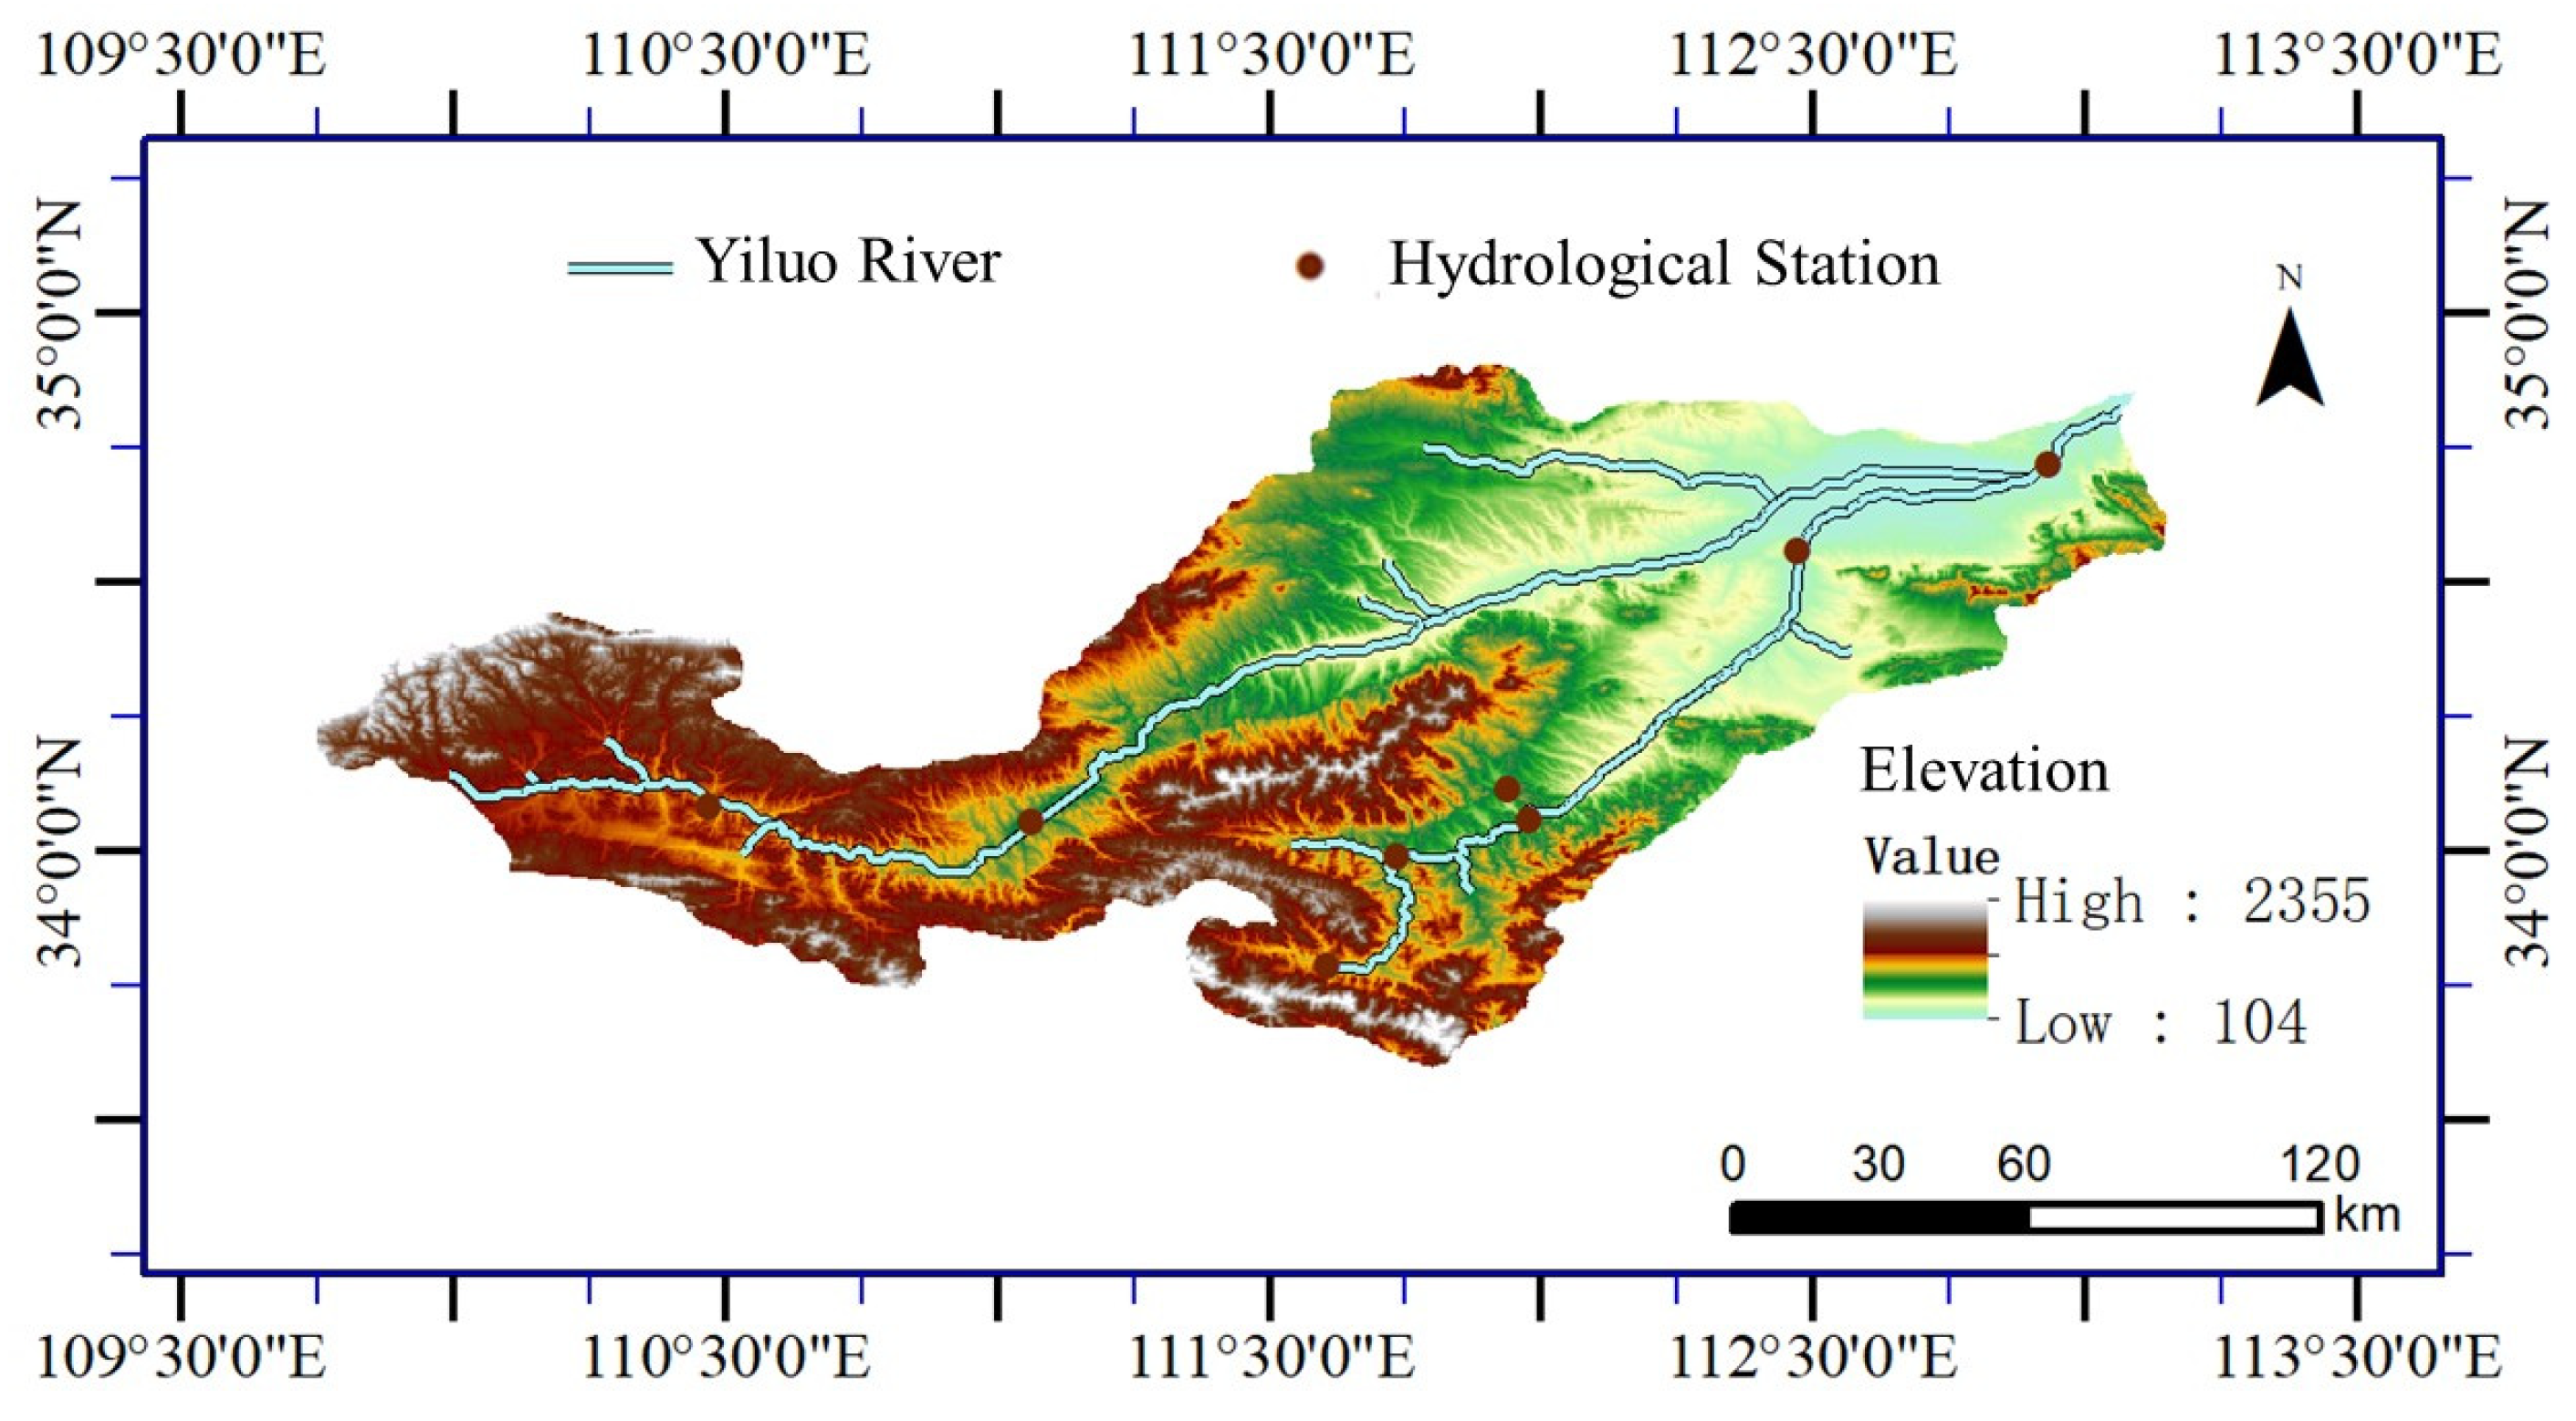
2.1. Overview of the Study Area

The Yiluo River, the largest tributary on the southern bank downstream of the Xiaolangdi Reservoir, flows through the region (109°43′–113°11′ E, 33°39′–34°54′ N) (Figure 1). The Yi River originates in Taowan Town, Luanchuan County, on the southern slope of the Xiong’er Mountains, with a total length of 264.9 km and a basin area of approximately 6100 km2, flowing through Song County and Yichuan County. The Luo River originates in Lantian County, Shaanxi Province, with a total length of 446.9 km and a basin area of 18,881 km2 [20], passing through Luonan, Lushi, and Luoyang, and it joins the Yi River in Yanshi District of Luoyang City to form the Yiluo River [21].

2.2. Data Source

The input data required for the SWAT model in this study and their sources are listed in Table 1. The DEM data were obtained from the Geospatial Data Cloud website; the land use raster data were sourced from Wuhan University’s CLCD 30 m resolution dataset. The soil-type raster data used in this study were derived from the Harmonized World Soil Database (HWSD), which provides global coverage with a standard spatial resolution of approximately 1 km. Although this resolution may be relatively coarse for hydrological modeling at the small watershed scale and could introduce some uncertainty in simulating infiltration and runoff processes, the dataset is highly compatible with various hydrological models and has been widely applied. Meteorological data were obtained from the National Meteorological Data Center, including daily records from 13 meteorological stations—such as Luonan, Danfeng, Lushi, and Gongyi—for the period 2000–2020. Measured runoff data from 2000 to 2020 were selected as the basis for model calibration and validation, ensuring that the simulation results align with actual observations in terms of temporal variation and magnitude, thereby enhancing the accuracy and reliability of the model.

2.3. Data Processing

According to the national standard “Land Use Current Status Classification”, the land use data of the Yiluo River Basin were reclassified, and a corresponding land-use-type index table was established. The reclassified land use types of the Yiluo River Basin were grouped into six categories: AGRL (cultivated land), FRST (forestland), PAST (grassland), WATR (water bodies), URBN (urban land), and BARR (unused land).
The soil data of the Yiluo River Basin were reclassified using the HWSD. After reclassification, the main soil types were categorized into four categories: Podzolic soils, Leached soils, Alluvial soils, and Lithic soils. Other soil types have a very small proportion and are not considered.
The meteorological stations in the Yiluo River Basin include Luonan, Danfeng, Lushi, Luoning, Luanchuan, Mianchi, Xinan, Yiyang, Songxian, Yichuan, Mengjin, Yanshi, and Gongyi, totaling 13 stations. In this study, data from these stations are used as the base data input into the SWAT model for simulating weather conditions in the watershed.

2.4. SWAT Model and Its Construction

The SWAT model is a widely used mathematical model in the fields of hydrology and environmental research. It is employed to assess changes in surface runoff and water quality, as well as the impact of land use changes on water resources [22]. In this study, a river network compatible with the model was generated based on a predefined river system. The watershed was then divided into sub-basins according to the set watershed area threshold. Catchment areas and corresponding parameters were calculated, resulting in a total of 22 sub-basins and 192 Hydrologic Response Units (HRUs) in the Yiluo River Basin. After inputting meteorological data (precipitation, temperature, relative humidity, solar radiation, and wind speed), the SWAT model was run for hydrological simulation analysis.
The period from 2000 to 2001 was designated as the warm-up phase, 2002 to 2015 as the calibration period, and 2016 to 2020 as the validation period. The observed runoff data from the Heishiguan hydrological station within the basin were used as the calibration standard, with 500 iterations set for the calibration process. For evaluating the goodness of fit between the simulated and observed values, the Nash–Sutcliffe efficiency (NS) and the coefficient of determination (R2) were selected as the evaluation metrics. When both the R2 and NS values exceed 0.5, the results of the model simulation can be used for reference [23]. For impact assessment and decision-support studies such as this one, higher performance standards (typically NS and R2 > 0.7) are recommended to ensure simulation robustness and reliability.

2.5. PLUS Model

The PLUS model leverages advanced algorithms to accurately simulate land use changes and their evolution over time. These algorithms consider various dynamic factors and spatial interactions, enabling precise modeling of land expansion and transformation processes. In this study, based on land use data from 2000 to 2020 and under a natural scenario, the driving factors listed in Table 2 were selected to predict future land use patterns. The selection of these factors was informed by our previously published research. By using the LEAS module of the PLUS model combined with the random forest algorithm, the relative contributions of each factor to land use were evaluated, which provided information for us to select the most relevant factors in the current study [24]. In related studies, it can also be proven that driving factors such as population have a very significant impact on land use change, thereby enhancing the credibility of the simulation results [14].
In this study, the neighborhood weights for AGRL, FRST, PAST, WATR, URBN, and BARR were set to 0.40, 0.48, 0.03, 0.01, 0.07, and 0.01, respectively. Based on the land use transition patterns in the Yiluo River Basin from 2000 to 2020, and taking into account fundamental policies such as urban–rural integration development, the land use conversion cost matrix was accordingly established.

2.6. Sensitivity Analysis and Selection of Key Parameters

In this study, 16 key parameters were selected for accurate model calibration to ensure the reliability and accuracy of the simulation results. Sensitivity analysis revealed that GW_DELAY, REVAPMN, ALPHA_BF, SOL_K, and ESCO were the five most influential parameters affecting the simulation results (Table 3). These highly sensitive parameters are mainly related to key hydrological processes such as groundwater recharge, baseflow recession, soil moisture evaporation compensation, and soil hydraulic conductivity. They highlight the critical role of groundwater dynamics and soil water regulation in the runoff generation process.
This finding indicates that subsurface processes make a significant contribution to runoff in the study area. Therefore, special attention should be paid to parameter selection and calibration to improve both simulation accuracy and the physical interpretability of the results.

3. Results

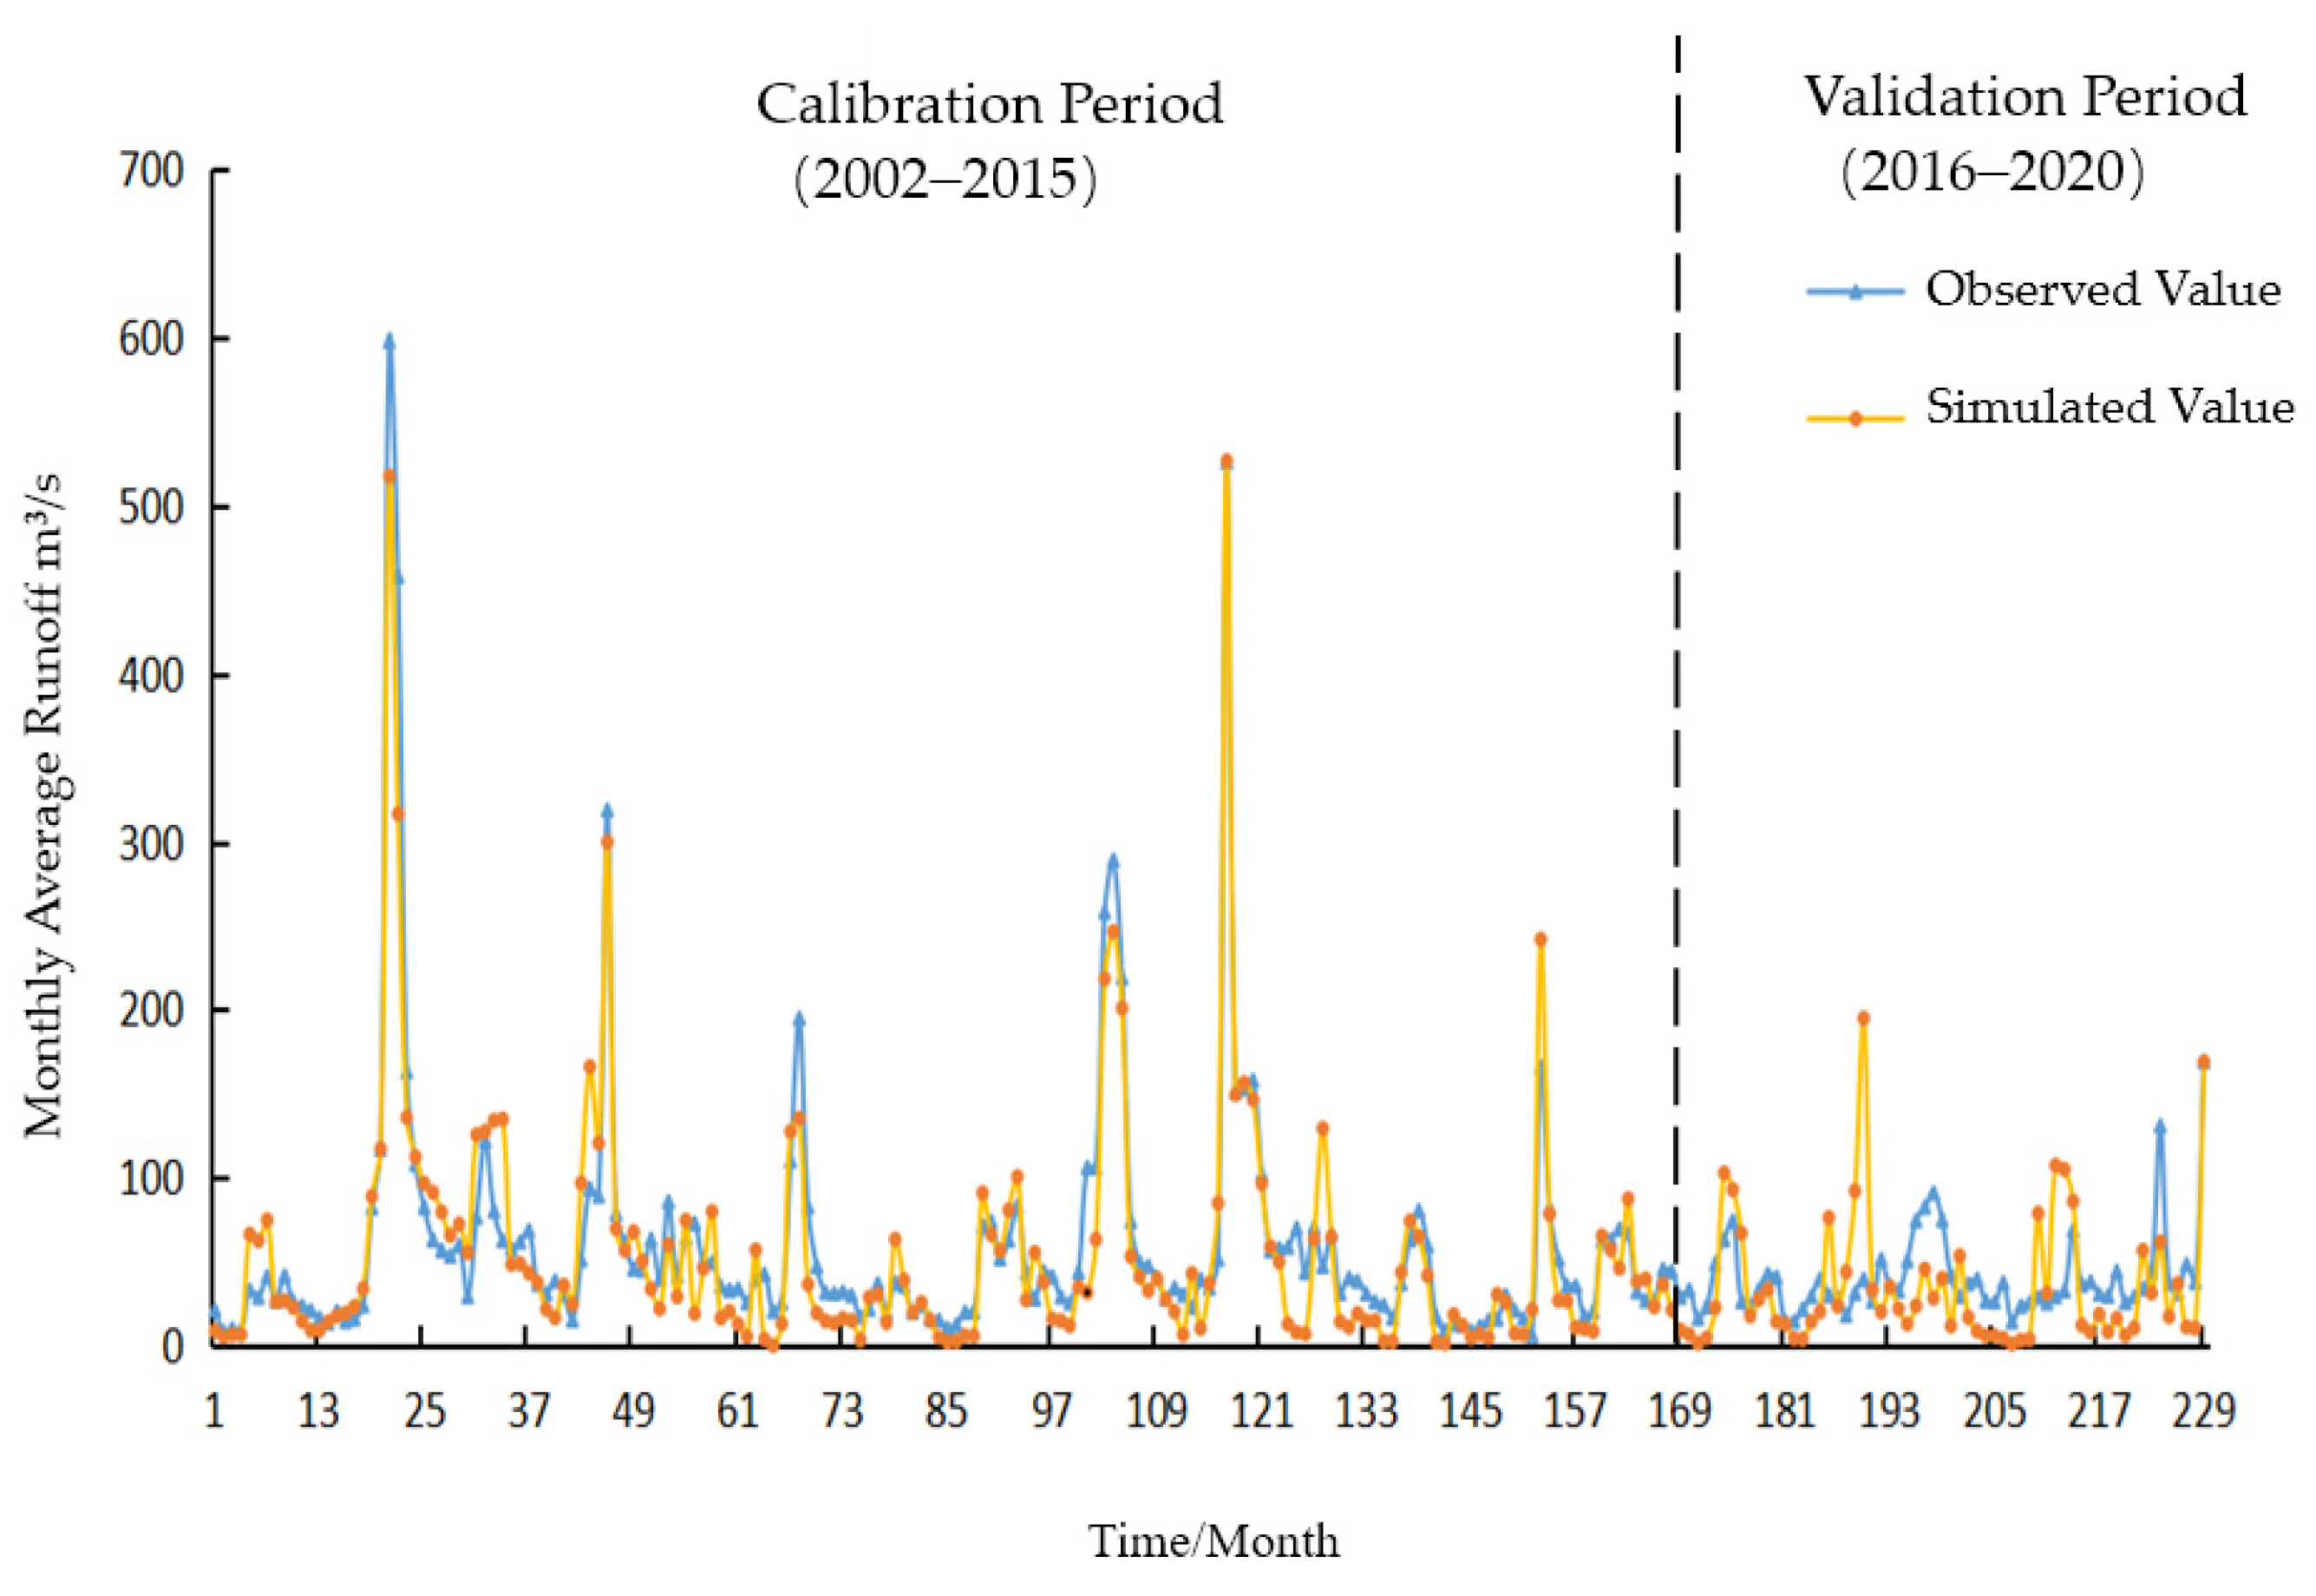
3.1. Model Calibration and Validation Results

After multiple iterations of model calibration, the final calibration results are shown in Figure 2. The calculated average annual net runoff is presented in Table 4. As shown in the table, both the NS and R2 values during the calibration period are relatively high, with both exceeding 0.85. However, during the validation period, the NS and R2 values also exceed 0.8, demonstrating that the model maintains acceptable accuracy. Overall, the model is suitable for the Yiluo River Basin and can be applied to subsequent research.

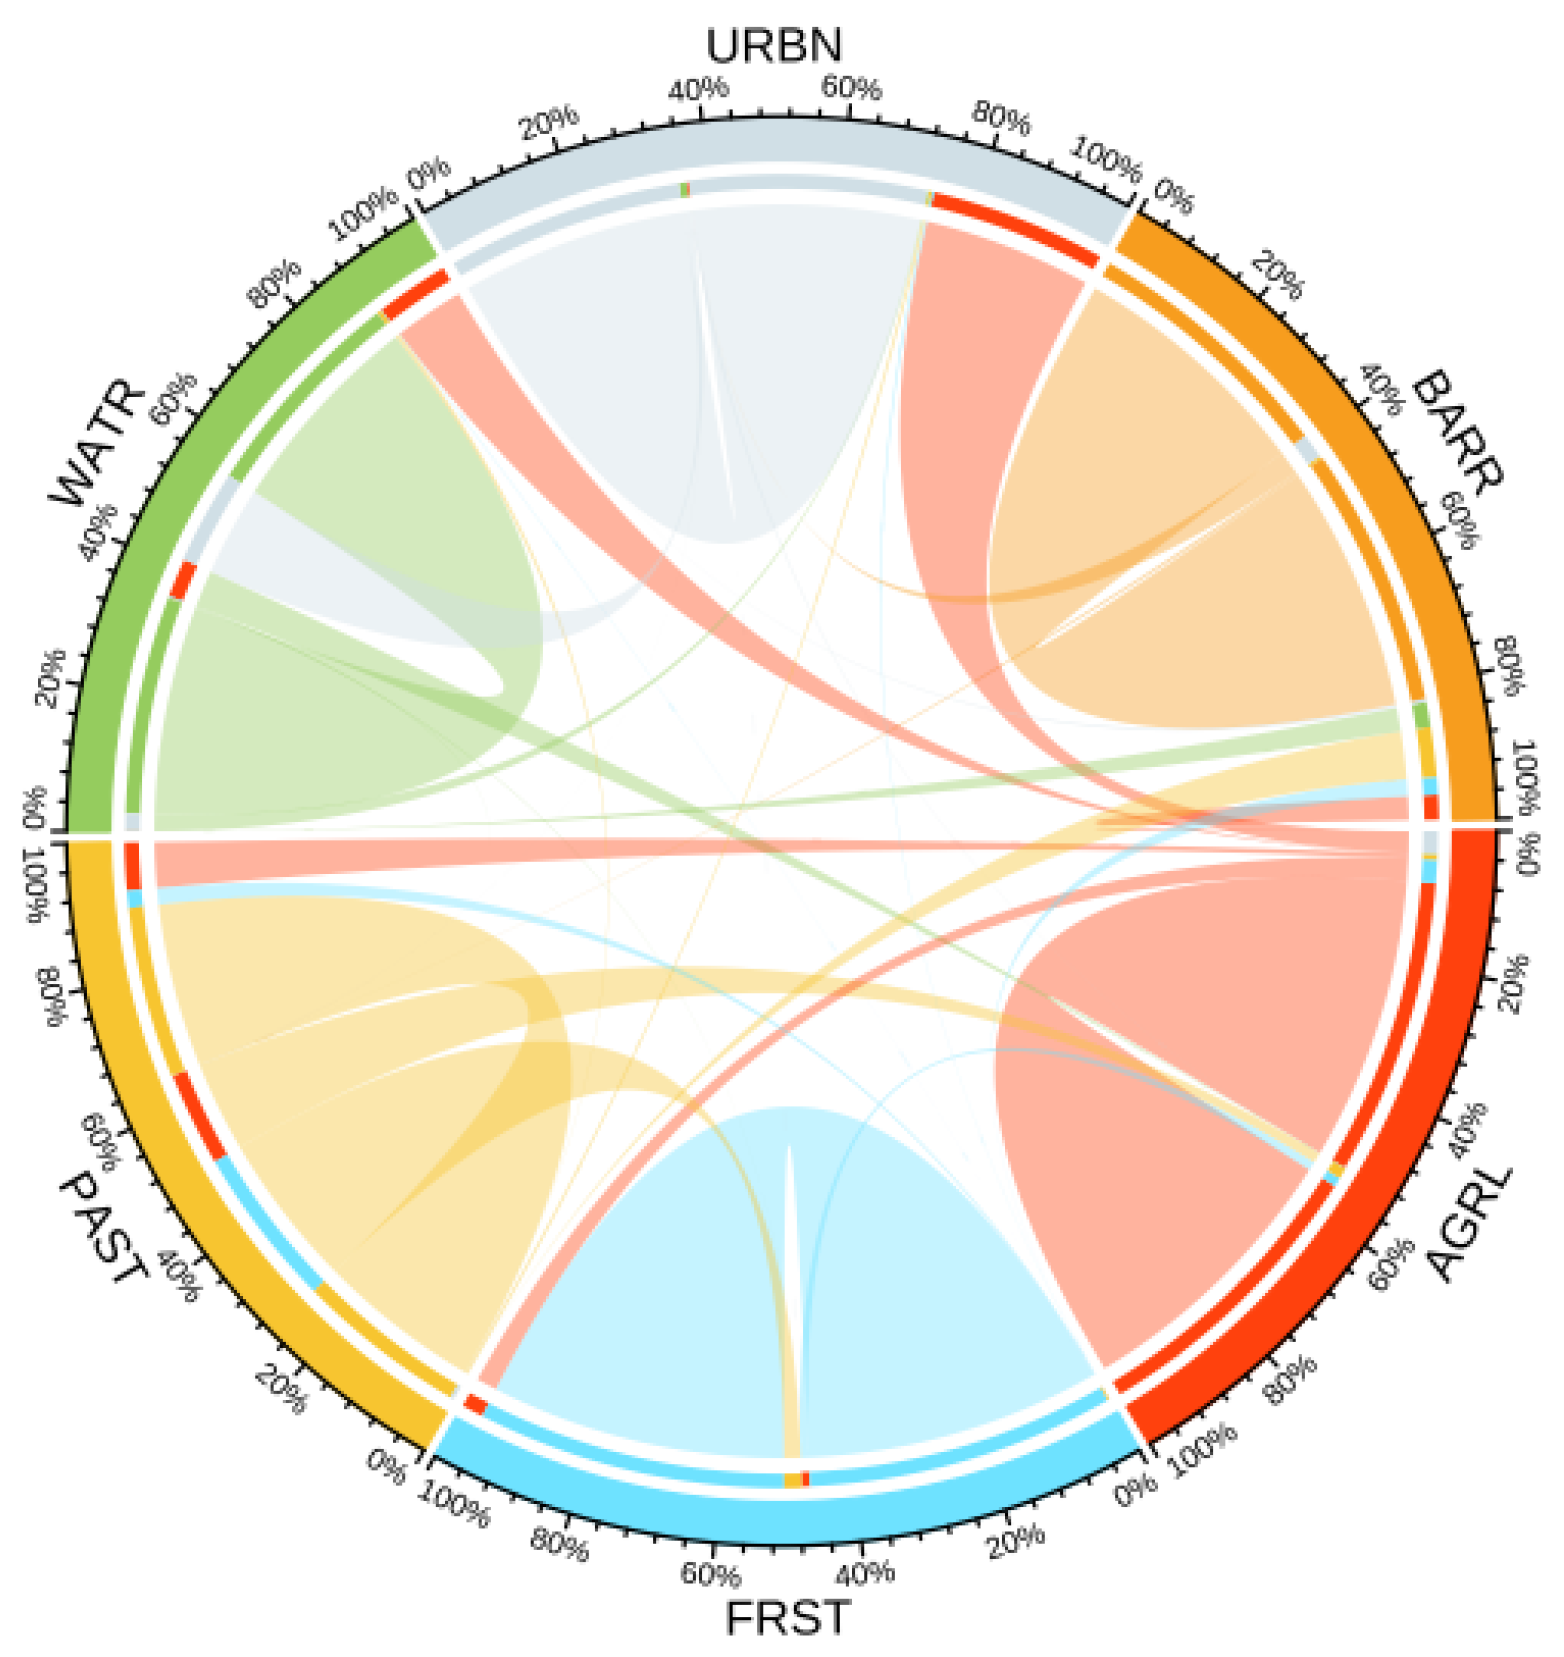
3.2. Land Use Change

Figure 3 shows the area proportions by land use type in the Yiluo River Basin in 2000, 2005, 2010, 2015, and 2020. The main land use types in the basin during this period were AGRL, FRST, PAST, and URBN, with AGRL and FRST occupying the largest proportions. AGRL exhibited a steady decline, with a total decrease of 814.51 km2, while FRST increased by 795.15 km2 over the same period. PAST, although accounting for a smaller proportion, underwent fluctuations—ultimately resulting in a net loss of 583.89 km2. URBN steadily increased by 573.67 km2. Water areas and BARR accounted for very small proportions. Water areas gradually increased, with a total increase of 29.33 km2, while BARR remained essentially unchanged.
Figure 4 shows the land use transition map for the Yiluo River Basin from 2000 to 2020. The largest transition occurred from AGRL, mainly converting to FRST and URBN. The second-largest transition was from PAST, primarily to FRST and AGRL. Among all land use conversions, FRST had the largest influx, mainly from AGRL and PAST. Overall, there were significant transitions among AGRL, FRST, and PAST, along with a notable increase in URBN, primarily originating from AGRL.

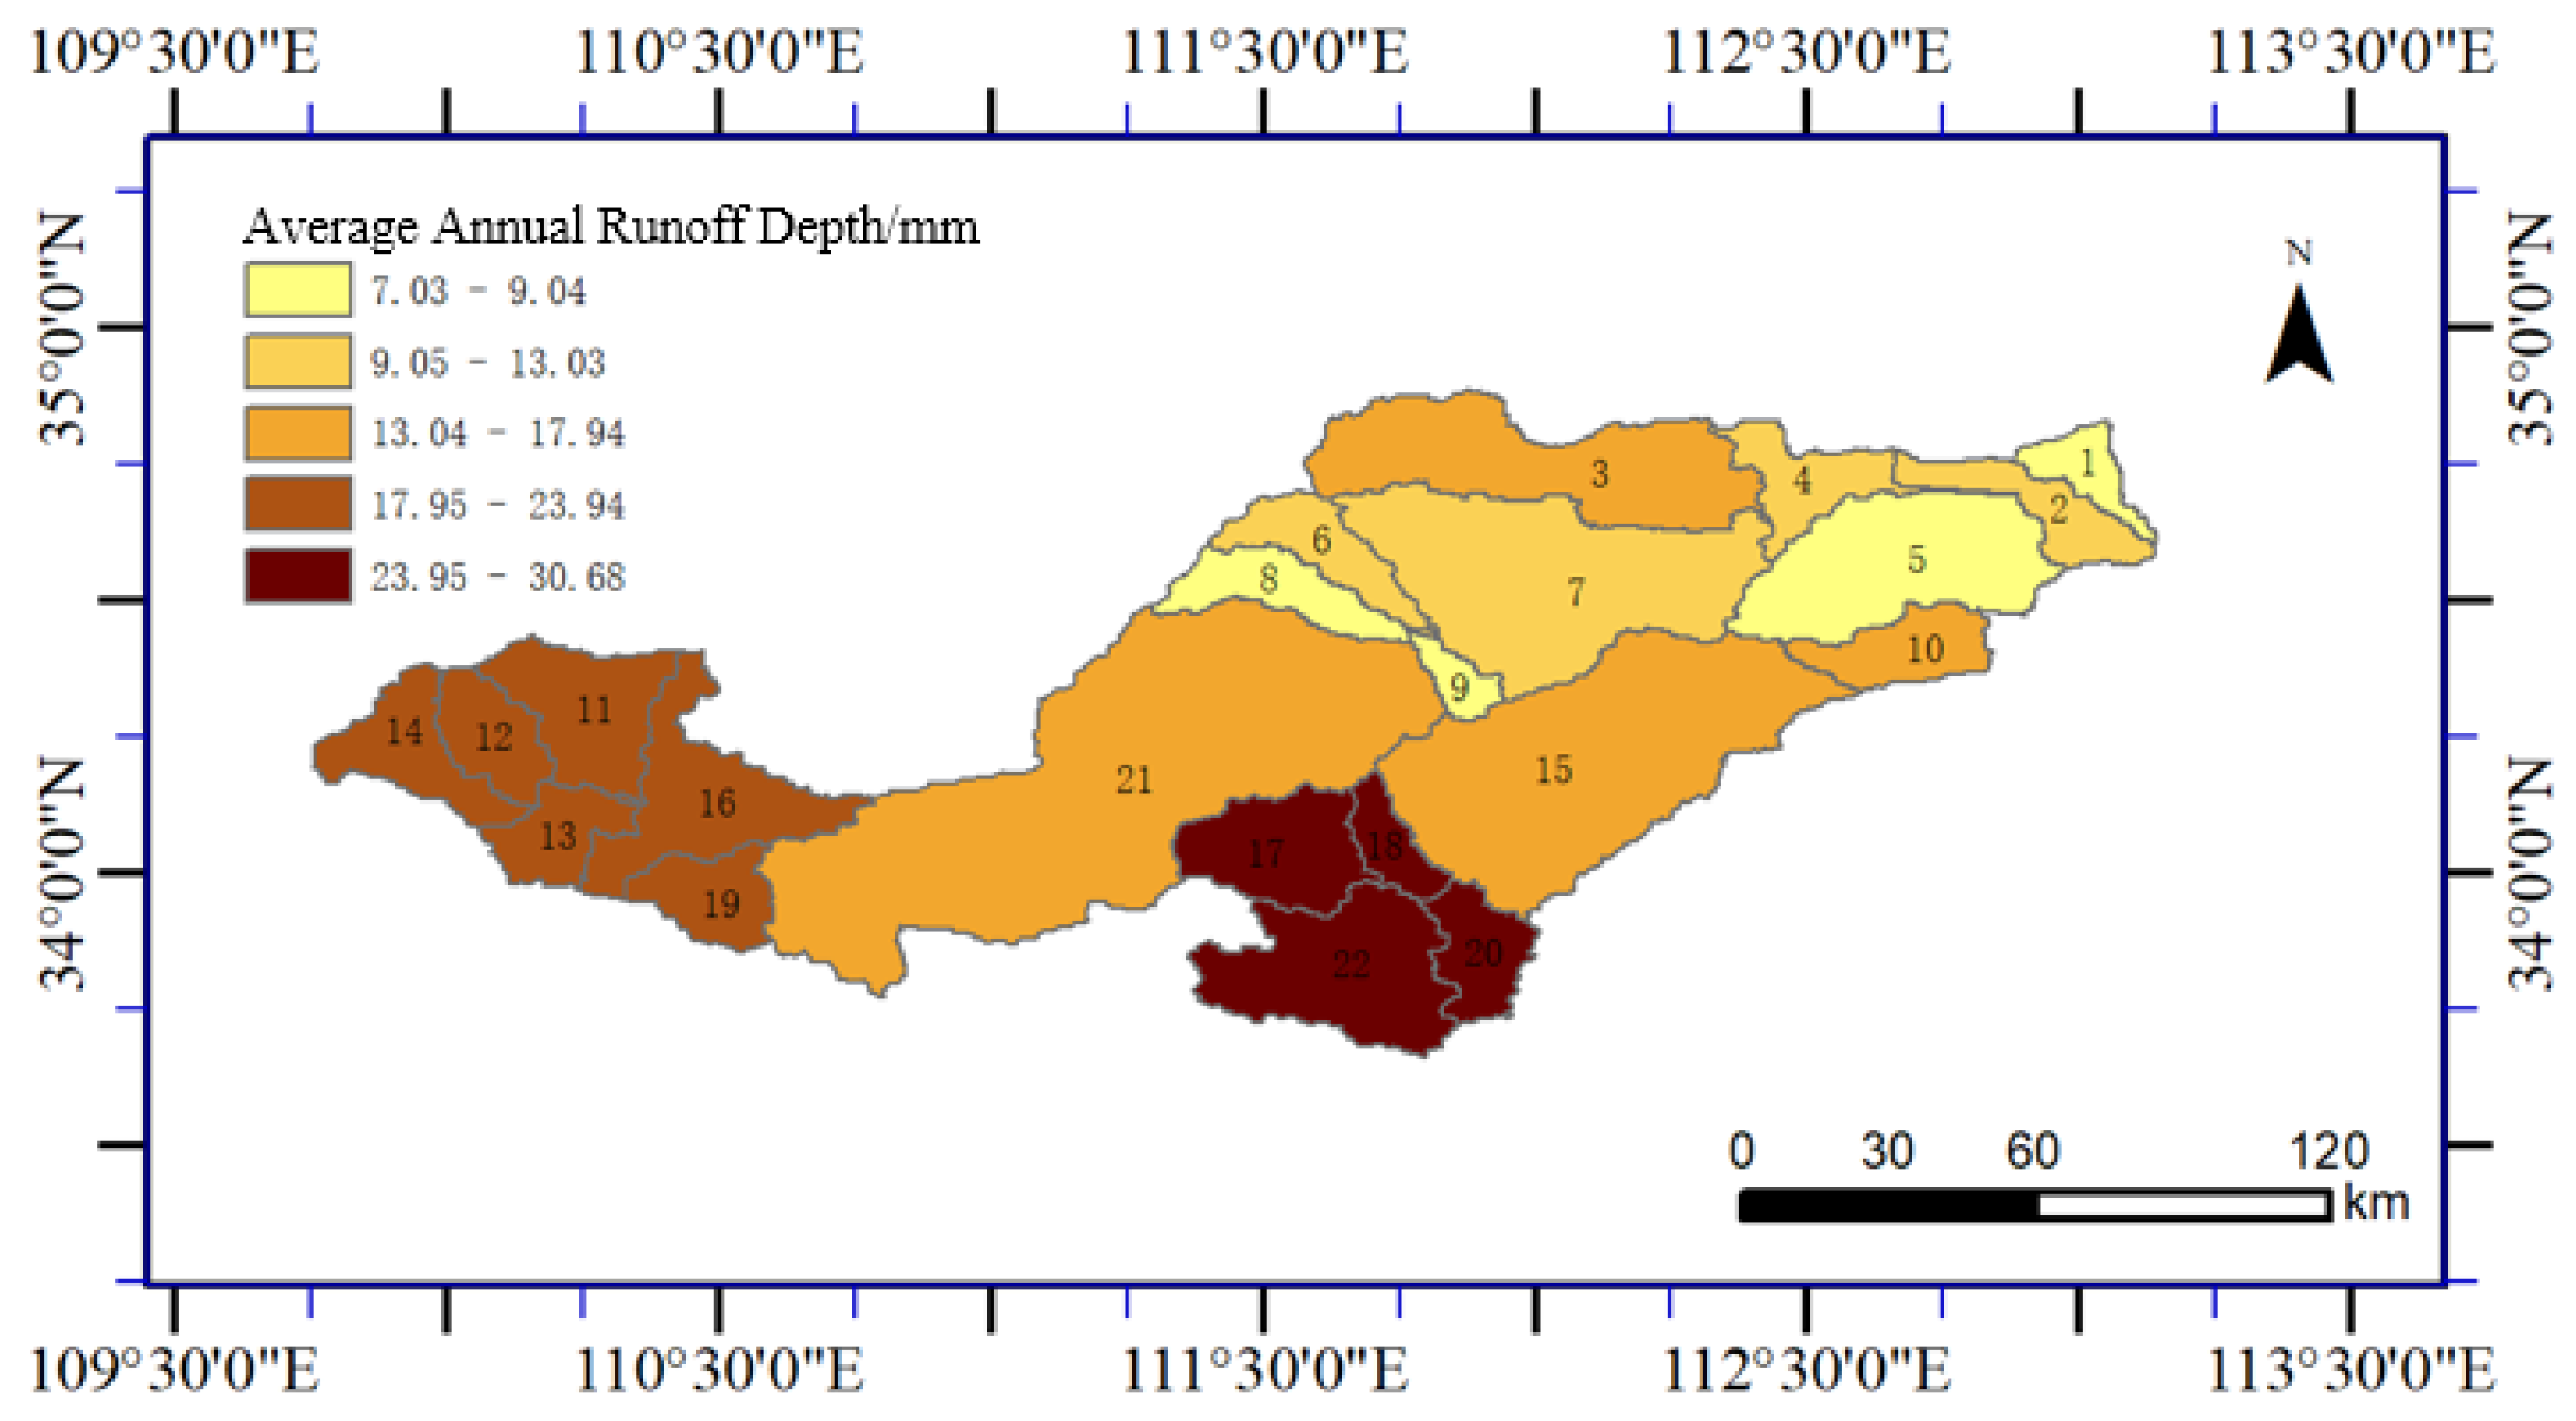
3.3. Response of Runoff to Land Use Change

The land use data for the five periods were sequentially substituted into the model, while the meteorological, soil, and other input data were kept constant. The runoff data corresponding to the five land use scenarios were then obtained, as shown in Table 5. Table 5 shows that the average annual runoff in the Yiluo River Basin increased overall from 2002 to 2020 across the five land use scenarios. The simulated runoff values are slightly lower than the observed values, further demonstrating that the model parameters are suitable for application in the Yiluo River Basin. However, it should be noted that keeping meteorological inputs constant introduces certain limitations. In reality, runoff is co-regulated by both land use patterns and climate variability. By not incorporating temporal changes in precipitation and temperature, the model may underestimate the full variability and dynamics of the actual runoff under changing environmental conditions. This simplification limits the applicability of the results in the context of climate change impact assessments.
Figure 5 illustrates the spatial variation in the average annual runoff depth across the Yiluo River Basin, highlighting areas with relatively higher or lower runoff depths. A clear difference in the runoff depth is observed between the upstream and downstream regions. Overall, the average annual runoff depth in the Yiluo River Basin follows a pattern of being higher in the upstream regions and lower in the downstream regions, with high runoff depths mainly occurring in the upstream areas.
Figure 6 illustrates the variation in the average annual runoff depth across sub-basins during four time periods: 2000–2005, 2005–2010, 2010–2015, and 2015–2020. From 2000 to 2005, the runoff depth generally increased across the basin, with the exception of several sub-basins, showing increases ranging from 0 to 5.05%. A similar trend was observed from 2005–2010, with increases in most sub-basins ranging from 0 to 4.18%. During 2010–2015, the runoff depth decreased by 0–4.17% in most upstream and central areas, while downstream regions showed slight increases of 0–2.97%. In the final period (2015–2020), although a small number of sub-basins experienced declines, the majority still exhibited an upward trend, with increases ranging from 0 to 3.40%. Overall, the Yiluo River Basin demonstrated a general upward trend in the average annual runoff depth from 2000 to 2020.
To further explore the impact mechanism of land use types on runoff, four representative sub-basins with the most significant runoff increases during the four time periods were selected for detailed analysis: Sub-basin 20 (2000–2005, maximum increase of 5.08%), Sub-basin 22 (2005–2010, maximum increase of 4.18%), Sub-basin 11 (2010–2015, maximum increase of 2.97%), and Sub-basin 21 (2015–2020, maximum increase of 3.40%). Table 6 shows the land-use-type area proportions within these sub-basins.
Preliminary analysis suggests that the increase in the average annual runoff depth in Sub-basin 20 may be associated with a decrease in the FRST area (9.7%) and an increase in the AGRL area (8.52%). In Sub-basin 22, runoff changes may relate to slight decreases in FRST (0.88%) and an expansion of URBN (0.83%). For Sub-basins 11 and 21, runoff increases coincided with reductions in the PAST areas (2.05% and 4.18%, respectively) and increases in the FRST areas (2.33% and 3.87%, respectively).
The analysis indicates that expanding the forest and PAST areas helps reduce runoff generation, while the increase in the URBN area promotes runoff generation. In comparison, the reduction in the PAST area and the increase in the FRST area both promote runoff generation, indicating that the effect of PAST reduction on runoff generation is greater than the suppressive effect of FRST. Overall, from 2000 to 2020, the Yiluo River Basin experienced a reduction of 583.89 km2 in PAST, an increase of 573.67 km2 in URBN, and an increase of 795.15 km2 in FRST. The increase in the FRST area surpasses both the decrease in PAST and the rise in URBN. However, the total reduction in PAST and increase in URBN is 1157.56 km2, which is larger than the increase in FRST. This indicates that the impact of land use changes in promoting runoff outweighs its suppressing effect, resulting in an overall increase in runoff in the Yiluo River Basin.

3.4. Land Use and Runoff Prediction

Using land use data from 2000 to 2020, the PLUS model for the Yiluo River Basin was developed, achieving a Kappa coefficient of 0.91, indicating that the model parameters are suitable for the Yiluo River Basin. Figure 7 shows the predicted land use types for the Yiluo River Basin in 2025 and 2030 based on the PLUS model. In both 2025 and 2030, AGRL and FRST will remain the primary land use types in the Yiluo River Basin (with proportions of 89.09% in 2025 and 89.10% in 2030), and the overall pattern has not undergone significant changes.
By inputting the land use data for 2025 and 2030 into the SWAT model, the average annual runoff depth in the Yiluo River Basin for those years was simulated, as shown in Figure 8. The spatial distribution pattern of the runoff depth remains largely consistent with that of 2020. The total average annual runoff is projected to reach 1.62 × 10⁹ m3 in 2025 and 1.63 × 10⁹ m3 in 2030, reflecting increases of 0.42% and 0.51%, respectively, compared to in 2020.

4. Discussion

4.1. Applicability of the SWAT Model in the Yiluo River Basin

The SWAT model simulation results show that, although the SWAT model is suitable for the Yiluo River Basin, it has certain limitations. From the model simulation results, the peak runoff was simulated well and aligned with the actual conditions, but the simulation during the dry season was poor, with a noticeable difference between the simulated and actual values, though the general trend remained similar. Overall, compared to the actual runoff, the simulated annual average runoff was consistently lower than the actual annual average runoff. Analyzing these two situations, it is believed that the SWAT model was initially developed based on the hydrological characteristics of the United States, and its calculation methods and parameter settings are more suited to the environmental and climatic conditions of North America. Therefore, when the model is applied to the Yiluo River Basin in China, due to differences in climate conditions, land use patterns, and hydrological characteristics, it may not accurately simulate the hydrological processes of local areas, resulting in a generally lower simulated annual runoff [25]. Furthermore, while the SWAT model performs well in large-scale regions, its performance is weaker in small-scale areas or regions with complex terrain, especially in areas with significant variations in hydrological processes. In these cases, the model’s spatial resolution and local adaptability are weaker. As a result, the input data and simulation results may be affected by larger errors, which impact the accuracy of the dry season simulation, leading to poor simulation performance during the dry season [26]. Therefore, localized calibration using field monitoring data is necessary to improve performance, and the adoption of SWAT+, with its enhanced spatial flexibility, may offer better adaptability to the basin’s heterogeneous terrain. Additionally, in this study, maintaining consistent meteorological, soil, and other conditions while simulating runoff based on changes in land use types also reflects a limitation of the model in this research.

4.2. Watershed Management

By applying the SWAT and PLUS models to the Yiluo River Basin, this study identifies and predicts spatial hotspots of significant runoff generation. These high-runoff areas are often associated with increased flood risks, particularly during extreme hydrological events [27]. Special attention should be given to the upstream mountainous regions, where the terrain and rainfall patterns make them prone to flash floods and debris flows [28]. Proactive monitoring and the implementation of flood mitigation measures are essential to reduce the occurrence and impact of such disasters. Beyond flood control, the adoption of sustainable land use practices—such as reforestation, grassland restoration, and soil conservation—is critical for decreasing surface runoff and enhancing natural disaster resilience. Effective land management contributes to improved water infiltration, reduced erosion, and the preservation of ecological functions across the watershed.
Integrating hydrological modeling with land use planning can support adaptive watershed governance in the face of climate change. These insights offer valuable guidance for policymakers seeking to align land development with water security and environmental sustainability goals. Building an institutional capacity for early warning systems and community-based disaster preparedness is equally vital for ensuring long-term resilience in vulnerable areas of the basin.

4.3. Limitations

Piao et al. examined the impact of climate change on water resources in China, finding that both climate change and human activities play a crucial role in driving hydrological variability [29]. Land use change, as noted by Zhang et al., is typically considered a component of human-induced impacts [30]. However, land use change directly modifies hydrological processes by influencing factors such as the infiltration rate, soil permeability, water-holding capacity, surface roughness, surface water retention, and connectivity of river networks, all of which play a role in runoff generation [31], leading to changes in surface interception and evapotranspiration [32]. Therefore, human activities play a key role in the watershed hydrological cycle [33]. However, research on the mechanisms through which land use changes lead to alterations in hydrological processes is relatively limited and requires further exploration. The accuracy of the SWAT and PLUS models used in this study still needs improvement. The Harmonized World Soil Database (HWSD) selected for this study has a resolution of 1 km × 1 km, which provides a relatively coarse analysis of soil data types, potentially affecting the actual simulation scenarios and causing significant impacts on runoff simulation. Future research could use more precise soil data types, which might result in model evaluation indicators greater than 0.9. Additionally, accurately and comprehensively depicting DEM depressions and improving and integrating the SWAT model code with high-resolution land use data are crucial for capturing runoff characteristics that represent the watershed and making reliable future predictions [34,35]. Moreover, although the analysis indicates that the correlation between land use types and runoff in the sub-basins aligns with general hydrological principles, the explanatory power of the model remains limited due to the absence of statistical validation. To more rigorously quantify the causal relationship between land use changes and runoff dynamics, future research could incorporate methods such as sensitivity analysis or regression modeling to enhance the reliability and precision of the findings. Given that this study primarily focuses on the impact of land use changes on runoff, meteorological, soil, and other conditions were held constant during the simulations, which were based solely on land use variations. This represents another limitation of the runoff modeling approach. Future studies could simulate runoff using both meteorological and land use variables to produce more accurate results. Additionally, integrating dynamic land use/land cover data with projected climate scenarios would provide a more realistic representation of potential hydrological changes. This comprehensive approach would improve the authenticity of hydrological modeling under shifting environmental conditions by capturing the combined effects of human activities and climate drivers on watershed processes [6].
Furthermore, as hydrological processes are influenced by both spatial and temporal heterogeneity [36], future studies should consider integrating remote sensing data and time-series land use data to capture dynamic land surface changes more accurately. The integration of multiple models or the coupling of SWAT with other process-based or machine learning models [37,38,39] may also enhance the robustness of simulations and improve the interpretation of complex interactions between land use and hydrological responses. Multi-model coupling approaches can more effectively address the uncertainties and nonlinear feedbacks within watershed systems, offering more scientific, integrated, and sustainable decision-support tools for water resource management under the influence of climate change and socio-economic transformations [40,41].

5. Conclusions

(1)
Using land use, soil-type, and meteorological data from 2000 to 2020, a SWAT model was developed for the Yiluo River Basin. Both the NS and the R2 values exceeded 0.8 during the calibration and validation periods, indicating that the model performs well in simulating hydrological processes in the basin.
(2)
A PLUS model was developed for the Yiluo River Basin, with a Kappa coefficient of 0.91, demonstrating high accuracy and strong reliability in simulating land use changes.
(3)
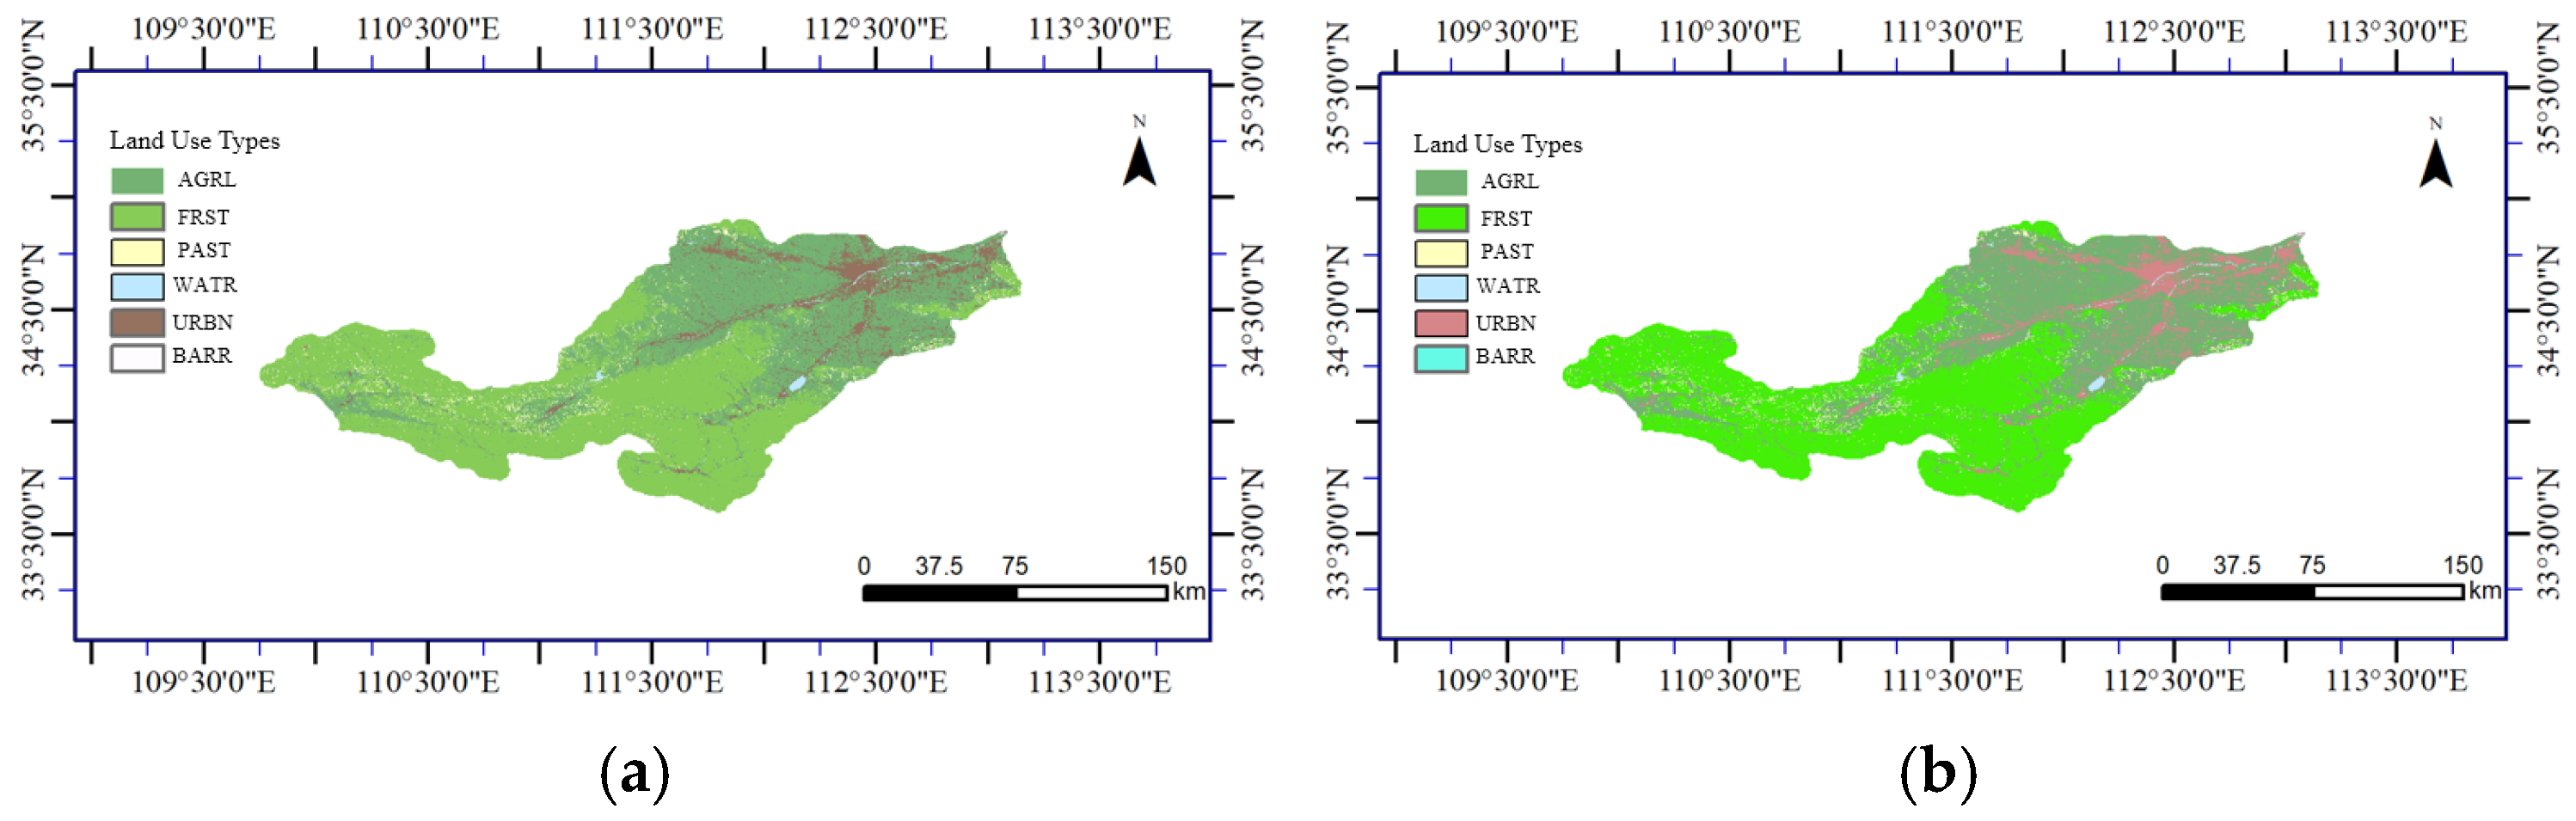
Between 2000 and 2020, the Yiluo River Basin experienced notable land use changes. Forest, WATR, and URBN areas increased by 795.15 km2, 29.33 km2, and 573.67 km2, respectively, while URBN and PAST areas declined by 814.50 km2 and 583.89 km2. These changes reflect a significant shift in land use structure and highlight the accelerating process of urbanization in the region.
(4)
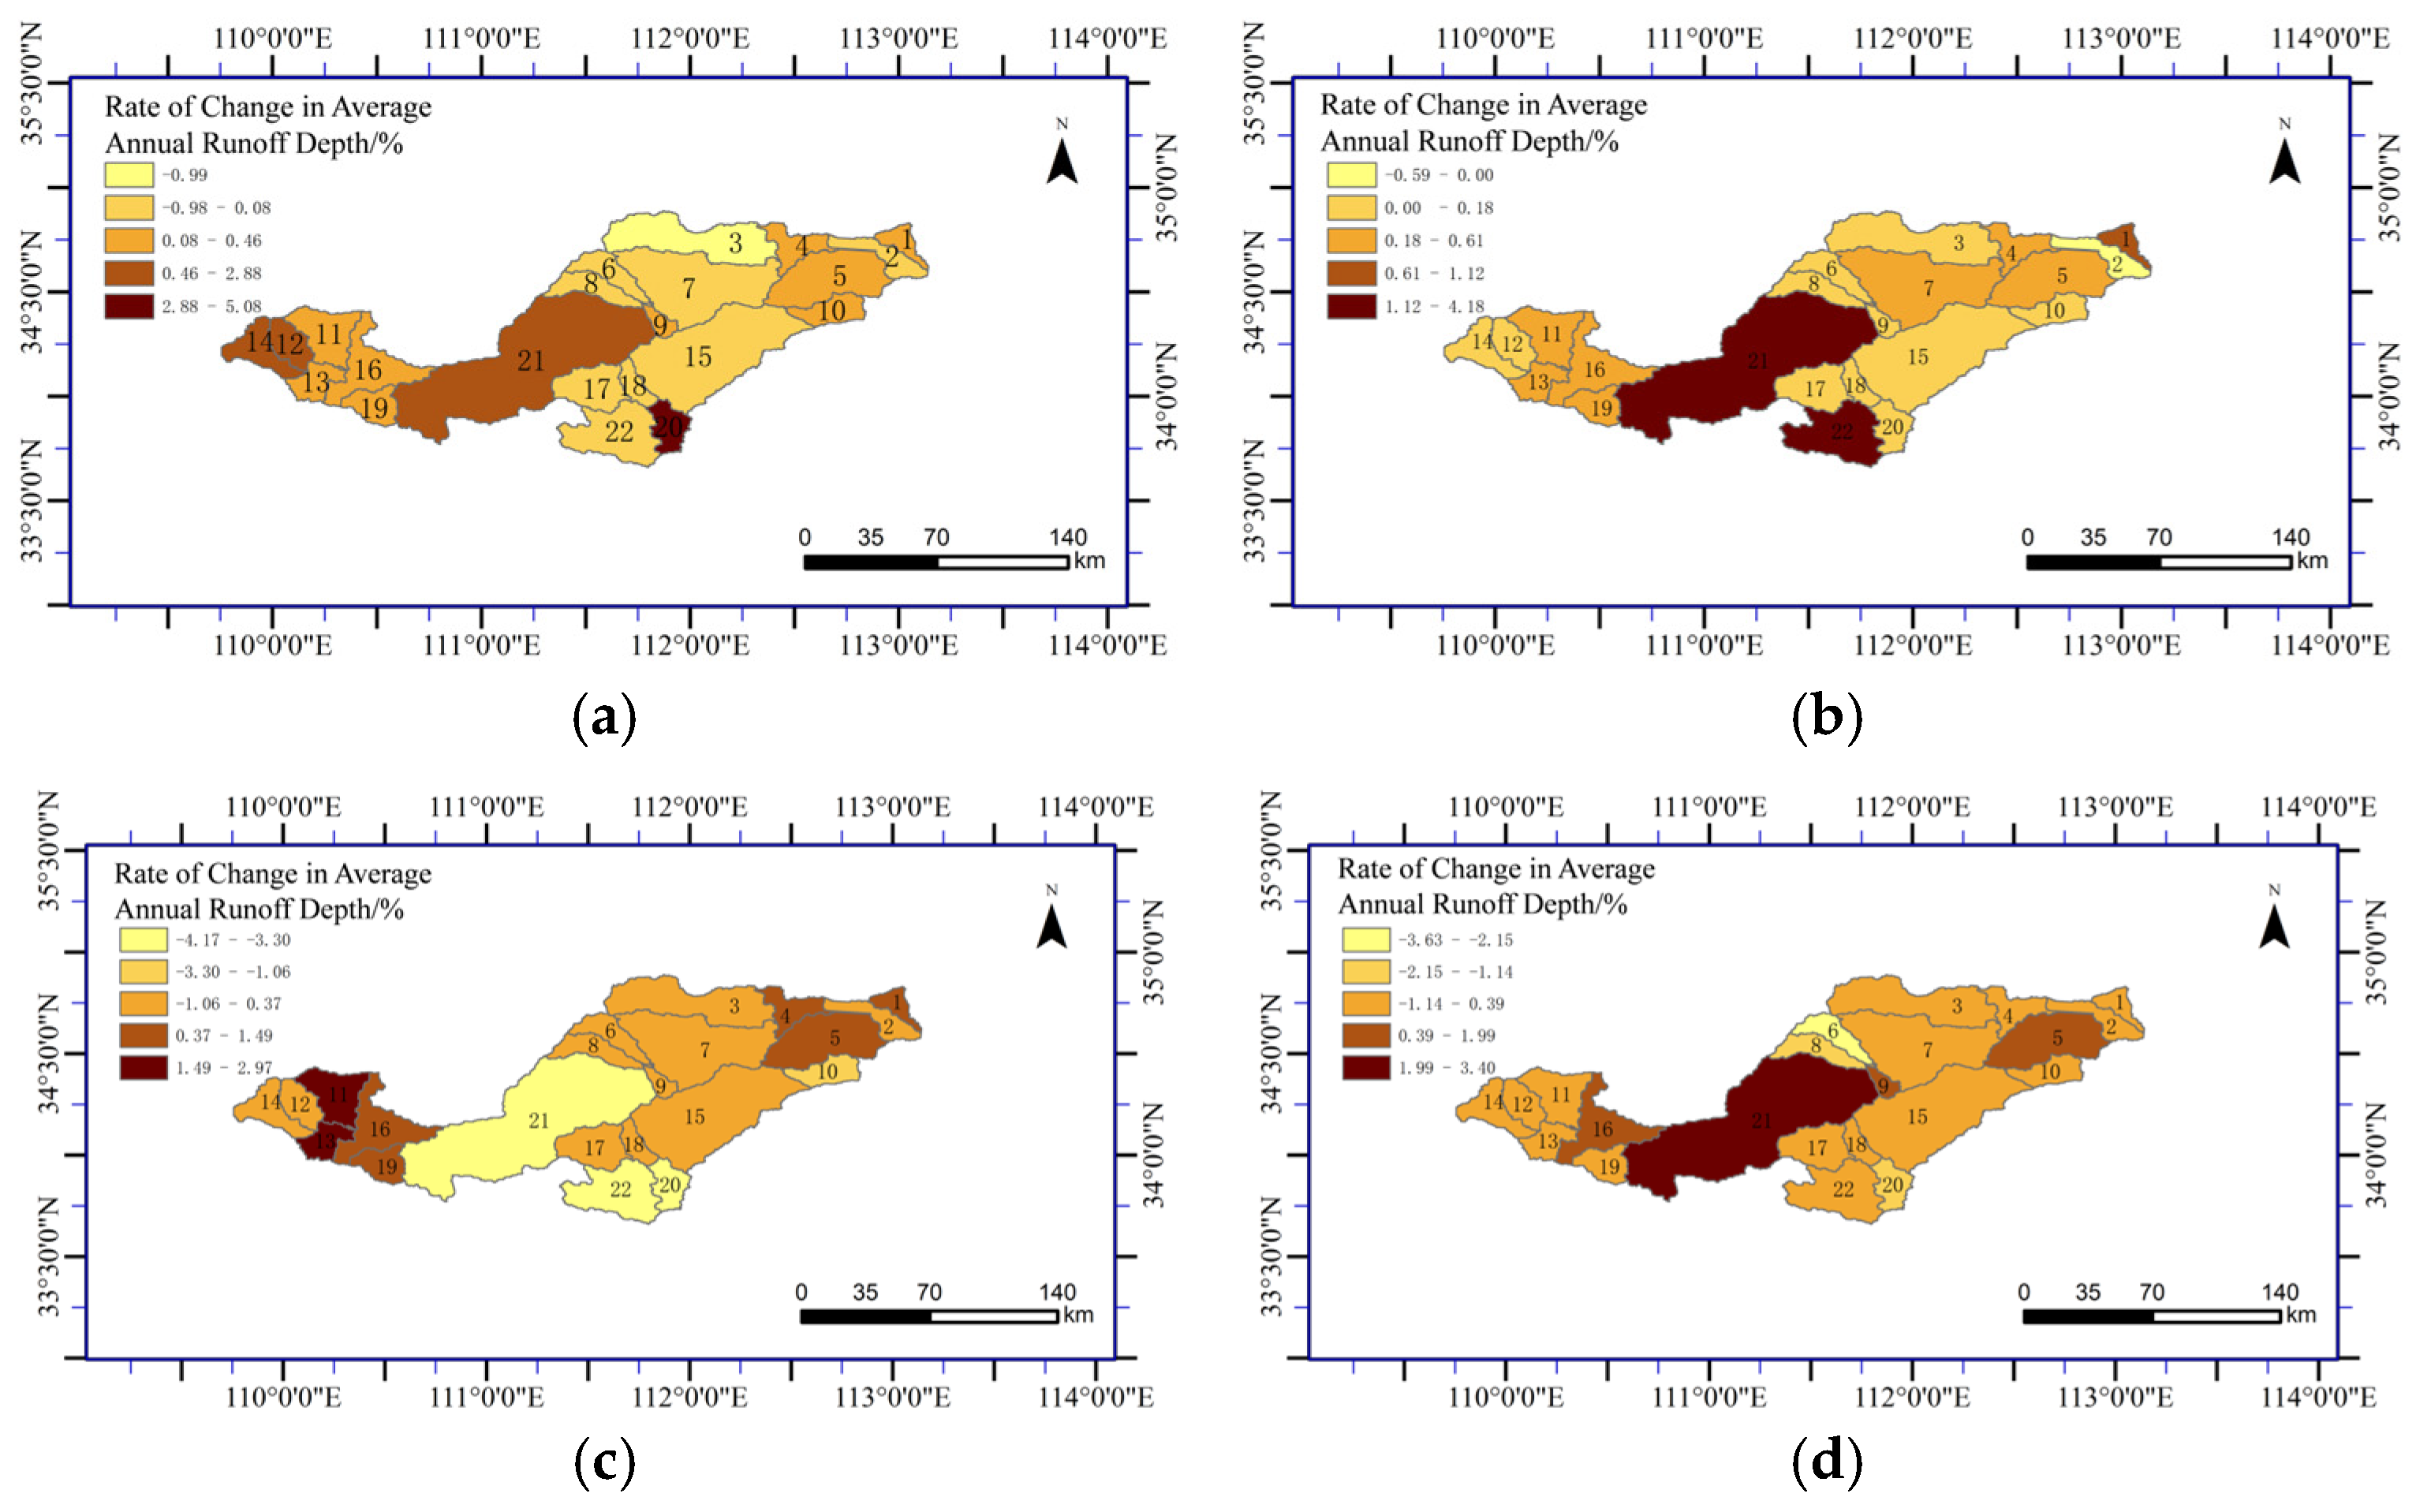
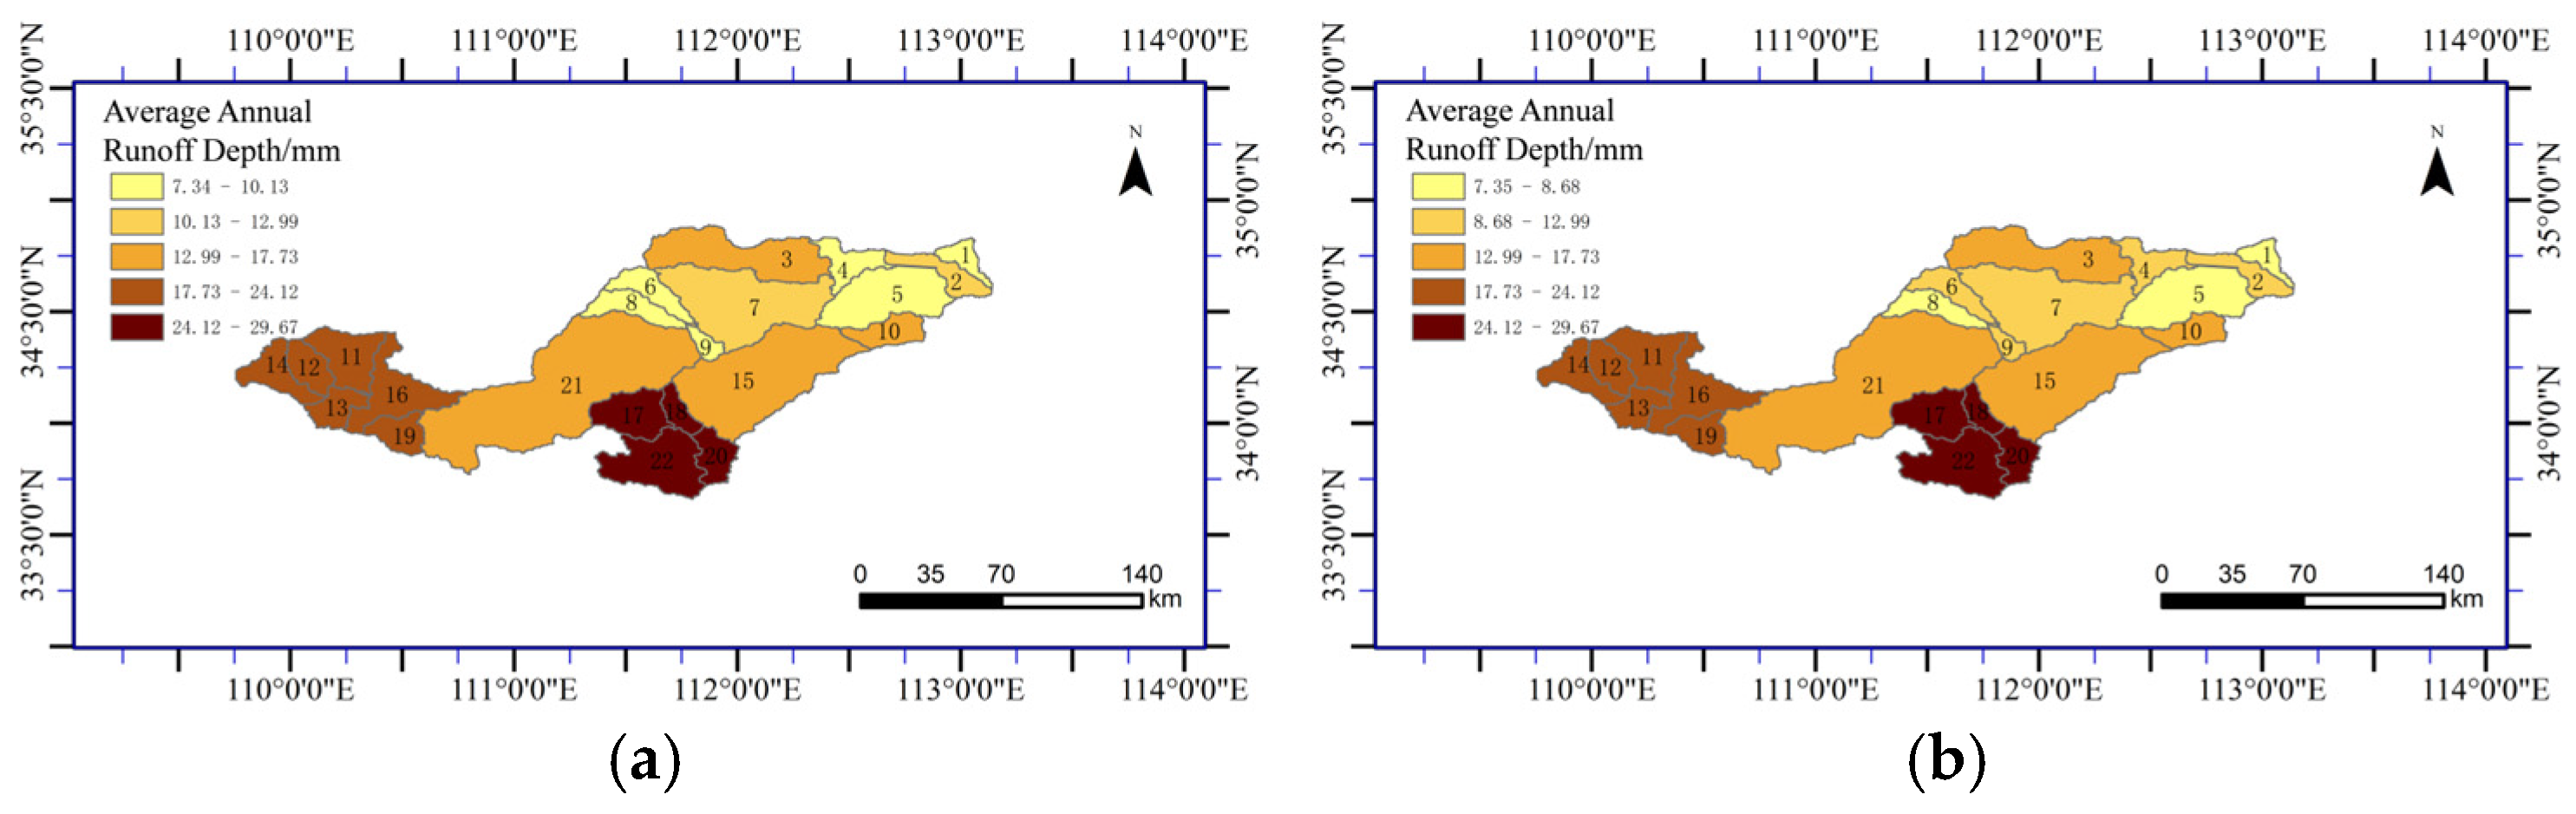
In the Yiluo River Basin, the annual average runoff depth shows a clear pattern of being higher in the upstream and lower in the downstream. Increases in FRST and PAST help suppress runoff, while the expansion of URBN tends to enhance it.
(5)
In 2025 and 2030, land use in the Yiluo River Basin will still be primarily composed of arable land and forest. The annual average runoff is expected to increase by 0.42% and 0.51%, respectively, compared to in 2020.

Author Contributions

N.Z. was responsible for the conceptualization, funding acquisition, project administration, and manuscript review and editing. F.G. developed the methodology, contributed to software preparation, and wrote the original draft. K.M. and Y.T. were in charge of software development and data validation. H.W. and J.W. conducted formal analysis and visualization. All authors have read and agreed to the published version of the manuscript.

Funding

The Young Backbone Teacher Project of Henan University of Science and Technology (13450005), the National Natural Science Foundation of China (32202952), and the Henan Provincial Science and Technology Research Project (252102320219).

Data Availability Statement

The original contributions presented in this study are included in the article. Further inquiries can be directed to the corresponding authors.

Acknowledgments

The authors gratefully acknowledge the financial support provided by the Young Backbone Teacher Project of Henan University of Science and Technology (13450005), the National Natural Science Foundation of China (32202952), and the Henan Provincial Science and Technology Research Project (252102320219).

Conflicts of Interest

The authors declare no conflicts of interest.

References

  1. Winkler, K.; Fuchs, R.; Rounsevell, M.; Herold, M. Global land use changes are four times greater than previously estimated. Nat. Commun. 2021, 12, 2501. [Google Scholar] [CrossRef]
  2. Chen, C. Impacts of land use/land cover change and climate change on the runoff in Yuan River basin based on SWAT model. Sci. Soil Water Conserv. 2020, 18, 52–59. [Google Scholar]
  3. Kindu, M.; Schneider, T.; Döllerer, M.; Yang, F.; Zuo, Q. Scenario modelling of land use/land cover changes in Munessa-Shashemene landscape of the Ethiopian highlands. Sci. Total Environ. 2018, 622, 534–546. [Google Scholar] [CrossRef] [PubMed]
  4. Zeng, S.; Xia, J.; Du, H.; Zhang, L.; Chen, X.; Wang, R.; Aditya, S. Effects of climate change, land use and cover change and CO2 enrichment on runoff: A case study of the Luanhe River basin. Adv. Water Sci. 2014, 25, 10–20, (Chinese with English abstract). [Google Scholar]
  5. Zhang, T.; Chen, Y.; Li, Q. Effects of land-use change on the spatio-temporal patterns of runoff and sediment in the Danjiang River Basin. Resour. Environ. Yangtze Basin 2022, 31, 1797–1811, (Chinese with English abstract). [Google Scholar]
  6. Yonaba, R.; Biaou, A.C.; Koïta, M.; Tazen, F.; Mounirou, L.A.; Zouré, C.O.; Queloz, P.; Karambiri, H.; Yacouba, H. A dynamic land use/land cover input helps in picturing the Sahelian paradox: As-sessing variability and attribution of changes in surface runoff in a Sahelian watershed. Sci. Total Environ. 2021, 757, 143792. [Google Scholar] [CrossRef]
  7. Shi, Y.; Wang, J.; Cheng, F.; Wang, Y.; Luo, Z.; Guo, H. Variation trend and attribution identification of runoff in Xichuan River Basin in loess hilly and gully region in recent 50 years. Sci. Soil Water Conserv. 2024, 22, 51–58, (Chinese with English abstract). [Google Scholar]
  8. Liu, X.; Zhang, H.; Luo, Z.; Zhang, J.; An, N. Response of runoff and sediment yields to land use change in Fu River watershed based on SWAT model. Res. Soil Water Conserv. 2024, 31, 79–89, (Chinese with English abstract). [Google Scholar]
  9. Dash, S.S.; Naik, B.; Kashyap, P.S. Assessment of land use/ land cover change derived catchment hydrologic response: An integrated parsimonious hydrological modeling and alteration analysis based approach. J. Environ. Manag. 2024, 2024, 356. [Google Scholar] [CrossRef]
  10. Ezimand, K.; Aghighi, H.; Ashourloo, D.; Shakiba, A. The analysis of the spatio-temporal changes and prediction of URBNs and urban heat islands using multi-temporal satellite imagery. Sustain. Cities Soc. 2024, 103, 105231. [Google Scholar] [CrossRef]
  11. Shao, Z.; Chen, R.; Zhao, J.; Xia, C.; He, Y.; Tang, F. Spatio-temporal evolution and prediction of carbon storage in Beijing’s ecosystem based on FLUS and InVEST models. Acta Ecol. Sin. 2022, 42, 9456–9469, (Chinese with English abstract). [Google Scholar]
  12. Li, H.; Chen, G.; Wang, S.; Zhang, Z.; Zhang, Z.; Jin, H. Suitability evaluation of AGRL in Naoli River Basin based on CLUE-S scenario simulation. Trans. Chin. Soc. Agric. Mach. 2023, 54, 329–339, (Chinese with English abstract). [Google Scholar]
  13. Zhou, Y.; Qin, T.; Pei, Y.; Gao, Y.; Guan, Y.N.; Kou, F.J. Land use simulation and multi-scenario prediction based on PLUS model and ground substrate. Geol. Rev. 2024, 70 (Suppl. S1), 315–318, (Chinese with English abstract). [Google Scholar]
  14. Yonaba, R.; Koïta, M.; Mounirou, L.A.; Tazen, F.; Queloz, P.; Biaou, A.C.; Niang, D.; Zouré, C.; Karambiri, H.; Yacouba, H. Spatial and transient modelling of land use/land cover (LULC) dynamics in a Sahelian landscape under semi-arid climate in northern Burkina Faso. Land Use Policy 2021, 103, 105305. [Google Scholar] [CrossRef]
  15. Jiang, X.; Duan, H.; Liao, J.; Song, X.; Xue, X. Land use in the Gan-Lin-Gao region of middle reaches of Heihe River Basin based on a PLUS-SD coupling model. Arid. Zone Res. 2022, 39, 1246–1258, (Chinese with English abstract). [Google Scholar]
  16. Xu, H.; Shi, N.; Wu, L.; Zhang, D. Measurement of high-quality development level and its spatiotemporal evolution in the Yellow River Basin. Resour. Sci. 2020, 42, 115–126, (Chinese with English abstract). [Google Scholar]
  17. Liu, J.; Huang, L.; Zuo, Q. Evaluation of harmonious development of economy-population-resource-environment in the lower reaches of the Yellow River. Resour. Sci. 2021, 43, 412–422, (Chinese with English abstract). [Google Scholar]
  18. Ni, Y.; Yu, Z.; Lv, X.; Ma, L.; Zhang, Q.; Wang, J. Analysis on attribution of runoff evolution in Yiluo River basin in the past 50 years. J. Hydraul. Civ. Eng. 2022, 2022, 59–66, (Chinese with English abstract). [Google Scholar]
  19. Zhang, J. Study on soil conservation function of Yiluo River Basin based on InVEST model. Henan Sci. Technol. 2023, 42, 86–90, (Chinese with English abstract). [Google Scholar]
  20. Liang, G. Landscape Dynamics and Runoff Effects in the Yiluo River Basin. Ph.D. Thesis, Henan University, Kaifeng, China, 2010. (Chinese with English abstract). [Google Scholar]
  21. Wang, Z.; Shang, R.; Chen, H.; Ma, M. Analysis of water quality change trend of Yiluo River based on Kendall test method. J. North China Univ. Water Resour. Electr. Power (Nat. Sci. Ed.) 2021, 42, 17–23, (Chinese with English abstract). [Google Scholar]
  22. Almeida, M.; Coelho, P. Improving the accuracy of an integrated watershed-reservoir water quality modeling approach (SWAT and CE-QUAL-W2) in data scarce watersheds. J. Hydrol. 2024, 644, 132076. [Google Scholar] [CrossRef]
  23. Wang, Y.; Chen, Y.; Lu, W.; Tian, Y. The hydrological response to different land use scenarios in the Minjiang River Basin. J. Soil Water Conserv. 2020, 34, 30–36, (Chinese with English abstract). [Google Scholar]
  24. Zhao, N.; Gao, F.; Qin, L.; Sang, C.; Yao, Z.; Liu, B.; Zhang, M. Simulated Multi-Scenario Analysis of Land Use and Carbon Stock Dynamics in the Yiluo River Basin Using the PLUS-InVEST Model. Sustainability 2025, 17, 1233. [Google Scholar] [CrossRef]
  25. Arnold, J.G.; Moriasi, D.N.; Gassman, P.W.; Abbaspour, K.C.; White, M.J.; Srinivasan, R.; Santhi, C.; Harmel, R.D.; van Griensven, A.; Van Liew, M.W.; et al. SWAT: Model use, calibration, and validation. Trans. ASABE 2012, 55, 1491–1508. [Google Scholar] [CrossRef]
  26. Gassman, P.W.; Reyes, M.R.; Green, C.H.; Arnold, J.G. The soil and water assessment tool: Historical development, applications, and future research directions. Trans. ASABE 2007, 50, 1211–1250. [Google Scholar] [CrossRef]
  27. Cheng, X.; Wang, H.; Chen, B.; Li, Z.; Zhou, J. Comparative analysis of flood prevention and control at LID facilities with runoff and flooding as control objectives based on InfoWorks ICM. Water 2024, 16, 374. [Google Scholar] [CrossRef]
  28. Špitalar, M.; Gourley, J.J.; Lutoff, C.; Kirstetter, P.E.; Brilly, M.; Carr, N. Analysis of flash flood parameters and human impacts in the US from 2006 to 2012. J. Hydrol. 2014, 519, 863–870. [Google Scholar] [CrossRef]
  29. Piao, S.; Ciais, P.; Huang, Y.; Shen, Z.; Peng, S.; Li, J.; Zhou, L.; Liu, H.; Ma, Y.; Ding, Y.; et al. The impacts of climate change on water resources and agriculture in China. Nature 2010, 467, 43–51. [Google Scholar] [CrossRef]
  30. Zhang, L.; Dawes, W.R.; Walker, G.R. Response of mean annual evapotranspiration to vegetation changes at catchment scale. Water Resour. Res. 2001, 37, 701–708. [Google Scholar] [CrossRef]
  31. Jiang, N.; Ni, F.; Deng, Y.; Wu, M.; Yue, Z.; Zhu, M.; Ren, H.; Wang, Y. The impact of future climate and land use changes on runoff in the Min-Tuo River Basin. J. Water Clim. Change 2024, 15, 5518–5539. [Google Scholar] [CrossRef]
  32. Yang, H.; Luo, P.; Wang, J.; Mou, C.; Mo, L.; Wang, Z.; Fu, Y.; Lin, H.; Yang, Y.; Bhatta, L.D. Ecosystem evapotranspiration as a response to climate and vegetation coverage changes in Northwest Yunnan, China. PLoS ONE 2015, 10, e0134795. [Google Scholar] [CrossRef] [PubMed]
  33. Song, X.; Zhang, J.; Zhan, C.; Liu, C. Review for impacts of climate change and human activities on water cycle. J. Hydraul. Eng. 2013, 44, 779–790, (Chinese with English abstract). [Google Scholar]
  34. Chen, C.; Gan, R.; Feng, D.; Yang, F.; Zuo, Q. Quantifying the contribution of SWAT modeling and CMIP6 inputting to streamflow prediction uncertainty under climate change. J. Clean. Prod. 2022, 364, 132675. [Google Scholar] [CrossRef]
  35. Chen, J.; Du, C.; Nie, T.; Han, X.; Tang, S. Study of non-point pollution in the Ashe River Basin based on SWAT model with different land use. Water 2022, 14, 2177. [Google Scholar] [CrossRef]
  36. Guo, P.; Wang, Y.; Yan, Y.; Wang, F.; Lyu, J.; Ge, W.; Chen, H.; Jiao, J. Assessing the Spatiotemporal Variations in the Hydrological Response of the Qin River Basin in Loess Plateau, China. Remote Sens. 2024, 16, 1603. [Google Scholar] [CrossRef]
  37. Noori, N.; Kalin, L.; Isik, S. Water quality prediction using SWAT-ANN coupled approach. J. Hydrol. 2020, 590, 125220. [Google Scholar] [CrossRef]
  38. Liang, Z.; Tang, T.; Li, B.; Liu, T.; Wang, J.; Hu, Y. Long-term streamflow forecasting using SWAT through the integration of the random forests precipitation generator: Case study of Danjiangkou Reservoir. Hydrol. Res. 2018, 49, 1513–1527. [Google Scholar] [CrossRef]
  39. Waheed, A.; Jamal, M.H.; Javed, M.F.; Muhammad, K.I. A CMIP6 multi-model based analysis of potential climate change effects on watershed runoff using SWAT model: A case study of kunhar river basin, Pakistan. Heliyon 2024, 10, e28951. [Google Scholar] [CrossRef]
  40. Sitterson, J.; Knightes, C.; Parmar, R.; Wolfe, K.; Avant, B.; Muche, M. An overview of rainfall-runoff model types. 2018. In Proceedings of the 9th International Congress on Environmental Modelling and Software, Ft. Collins, CO, USA, 24–28 June 2018. [Google Scholar]
  41. Asadi, S.; Jimeno-Sáez, P.; López-Ballesteros, A.; Senent-Aparicio, J. Comparison and integration of physical and interpretable AI-driven models for rainfall-runoff simulation. Results Eng. 2024, 24, 103048. [Google Scholar] [CrossRef]
Figure 1. Digital Elevation Model (DEM) of the Yiluo River Basin.
Water 17 01516 g001
Figure 2. SWAT model runoff simulation results.
Water 17 01516 g002
Figure 3. Land-use-type area proportions in the Yiluo River Basin.
Water 17 01516 g003
Figure 4. Land use inflow and outflow map of the Yiluo River Basin from 2000 to 2020.
Water 17 01516 g004
Figure 5. Average annual runoff depth in the Yiluo River Basin (2010 land use data).
Water 17 01516 g005
Figure 6. Average annual runoff depth change rate from 2000 to 2020. (a) 2000–2005, (b) 2005–2010, (c) 2010–2015, (d) 2015–2020.
Water 17 01516 g006
Figure 7. Land use types of the Yiluo River Basin in 2025 and 2030. (a) Land use types in 2025 and (b) land use types in 2030.
Water 17 01516 g007
Figure 8. Average annual runoff depth of the Yiluo River Basin in 2025 and 2030. (a) Average annual runoff depth in 2025 and (b) average annual runoff depth in 2030.
Water 17 01516 g008
Table 1. Sources of data.
Data NameData AccuracyData SourceData Year
Land use data 30 mResource and Environmental Science Data Platform (http://www.resdc.cn (accessed on 5 April 2024))2020
DEM30 mGeospatial Data Cloud (www.gscloud.cn)2000–2020
Soil type1 kmHarmonized World Soil Database (https://gaez.fao.org/pages/hwsd) (accessed on 5 April 2024)2009
Meteorological datadaily scaleThe National Meteorological Data Center (https://data.cma.cn/ (accessed on 5 April 2024))2000–2020
Runoff datamonthly scaleThe National Earth System Science Data Center and The Yellow River Conservancy Commission (http://www.geodata.cn/main/ http://www.yrcc.gov.cn/ (accessed on 5 April 2024))2000–2020
Table 2. Information on driving factors.
Data TypeData NameData Description
Natural factorsDEMDirect input
SlopeCalculated from DEM
AspectCalculated from DEM
Soil typeDirect input
Social factorsDistance to roadsEuclidean distance
Distance to railwaysEuclidean distance
Distance to residential areasEuclidean distance
Distance to WATREuclidean distance
Population densityResampled to 30 m resolution
Table 3. Kappa simulation effect.
Serial NumberParameter NameOptimal Value
1v__GW_DELAY.gw268.559448
2v__REVAPMN.gw−33.110527
3v__ALPHA_BF.gw25.127949
4r__SOL_K.sol−20.801529
5v__ESCO.hru15.403322
6r__ALPHA_BNK.rte−14.272413
7v__CANMX.hru11.714357
8v__SURLAG.bsn9.826532
9v__CH_N2.rte8.715669
10v__GW_REVAP.gw8.035896
11r__SOL_AWC.sol4.97311
12v__GWQMN.gw−4.388701
13v__CH_K2.rte−3.759947
14r__SOL_BD.sol−1.236726
15r__OV_N.hru0.123613
16r__CN2.mgt0.103597
Note: v__ = variable parameter; r__ = rate/ratio parameter. Suffixes: .gw = groundwater; .hru = hydrologic unit; .rte = river reach; .sol = soil; .bsn = basin; .mgt = management.
Table 4. Calibration and validation results.
PeriodTimeSiteMeasured Value (m3/s)Simulated Value (m3/s)NSR2
Calibration Period2002–2015Heishiguan61.7556.740.890.89
Validation Period2016–2020Heishiguan33.9532.890.820.83
Table 5. Comparison of average annual runoff changes under five land use scenarios with actual data (m3/s).
Year20002005201020152020Actual
2002–201556.5456.6756.7457.3157.6461.75
2016–202032.5332.7232.933.5233.6638.71
2002–202050.2250.3750.4751.0551.3355.69
Table 6. Land-use-type area proportion of sub-basins.
Sub-BasinLand Use TypeInitial Area Proportion (%)Final Area Proportion (%)Change
20AGRL8.528.52
FRST10090.3−9.7
PAST0.970.97
WATR
URBN0.210.21
BARR
22AGRL7.997.85−0.14
FRST88.8587.97−0.88
PAST2.382.580.2
WATR0.030.02−0.01
URBN0.771.60.83
BARR
11AGRL12.512.2−0.3
FRST76.7779.12.33
PAST10.58.45−2.05
WATR
URBN0.250.270.02
BARR
21AGRL29.4629.490.03
FRST57.4361.33.87
PAST10.576.39−4.18
WATR0.380.40.02
URBN2.162.420.26
BARR0.010.01
Note: —indicates that this land use type is not present.
Disclaimer/Publisher’s Note: The statements, opinions and data contained in all publications are solely those of the individual author(s) and contributor(s) and not of MDPI and/or the editor(s). MDPI and/or the editor(s) disclaim responsibility for any injury to people or property resulting from any ideas, methods, instructions or products referred to in the content.

