1. Introduction
Valves, as fluid control components, are widely used to regulate the pressure, flow rate, and direction of fluid media in transport pipelines [
1,
2]. In centrifugal pump open cavitation tests, due to the sharp pressure differences before and after the valve and the irregular flow cross-section, bubbles are prone to precipitate at the valve, leading to cavitation at the valve and downstream pipeline. This causes damage to the valve and affects the performance of the cavitation testing system [
3,
4,
5,
6]. Therefore, it is necessary to conduct design and characteristic studies on pump cavitation regulation valves.
To prevent cavitation issues in valves during operation, researchers have studied the occurrence and prevention of valve cavitation phenomena. To investigate the temporal variation in the flow state in valves, Qu [
7] conducted experimental analysis on the flow resistance coefficient of a DN600 valve and predicted the cavitation phenomenon. Subsequent researchers also predicted cavitation phenomena in valves by examining relevant coefficients and changes in the flow domain. Couzinet [
8] used numerical simulation to validate discharge coefficients, predict saturated steam in safety valves under vacuum conditions, and qualitatively analyze safety valve cavitation phenomena. Vatasal [
9], based on a fluid dynamics model, demonstrated that bubble erosion in valves affects hydraulic characteristics and concluded that low-pressure regions through the valve seat can predict cavitation phenomena. In the exploration of valve cavitation patterns and the prediction of cavitation phenomena, scholars have progressed from identifying cavitation patterns to researching methods to mitigate its effects. Factors causing cavitation during valve operation include the design of the valve structure and associated boundary conditions. Therefore, cavitation can be controlled and improved by optimizing valve structural parameters and adjusting boundary conditions.
The structural parameters of valves significantly influence the internal flow field, and modifying these parameters can effectively prevent cavitation damage [
10,
11]. The structural parameters of the valve play a crucial role in its flow field characteristics. Gholami [
12], using the Singhal cavitation model and the standard
k-
ε turbulence model, explored the relationship between the intensity of cavitation behind a water flow regulator valve and the inclination angle of the needle valve body. Kapranova [
13] investigated the impact of two key factors—throttle hole diameter and valve opening—on the hydrodynamic cavitation intensity in butterfly control valves during the initial cavitation bubble formation stage, analyzing bubble distribution within a porous separator-butterfly valve assembly. Cavitation control valves often have an impact on the downstream flow domain of the valve, making the structural parameters and cavitation characteristics of the downstream region an important subject of study. Lee [
14] studied the reasons for cavitation in a directional stop valve through numerical simulation, highlighting the influence of the valve body tail length on cavitation phenomena. Liu [
15] examined the flow patterns inside a rotary valve, investigating the relationship between valve inlet size and cavitation intensity in the downstream pipeline. Wang [
16] conducted computational studies on flow and cavitation inside control valves, examining the effects of structural parameters (rounded edges, cone angles, and outflow hole structures) on flow and cavitation characteristics. To mitigate cavitation in valves, researchers have proposed external devices such as baffles [
17], throttling devices [
18,
19,
20] and drainage devices [
21].
Changes in boundary conditions are also a focal point in cavitation research [
22]. During fluid flow, pressure, temperature, and velocity can have varying effects on the flow domain. Han [
23] performed numerical studies on the internal flow and cavitation characteristics of a cone valve, revealing the relationship between backpressure conditions and cone valve cavitation characteristics. Zheng [
24], using two-phase flow cavitation control equations and the RNG
k-
ε turbulence model, studied high-pressure control valves and found that increased operating temperature and inlet pressure expand the bubble region and enhance cavitation intensity. Ou [
25], based on the Schnerr–Sauer cavitation model and the RNG
k-
ε turbulence model, conducted numerical simulations of relief valves, exploring the effects of different valve openings and inlet/outlet pressures on cavitation characteristics. Gao [
26], using the RNG
k-
ε turbulence model and multiphase flow cavitation model, investigated the cavitation characteristics of hydraulic valves, exploring the effects of valve outlet area, inlet velocity, and outlet pressure on cavitation characteristics. Qian [
27] simulated the cavitation characteristics of pilot-controlled stop valves, examining the effects of different inlet velocities and valve core displacements on cavitation characteristics.
Currently, most researchers focus on understanding the mechanisms of cavitation in existing valves or adjusting valve structural parameters and boundary conditions to minimize the impact of cavitation. However, there is relatively little research on designing and modifying valve structures specifically to suppress cavitation. To address the issue of cavitation caused by irregular flow cross-sections in valves, this study designs a novel cavitation regulation valve. The design ensures that the valve maintains a consistent and nearly circular cross-sectional shape at different openings, preventing cavitation. Additionally, this study controls the inlet and outlet pressure differentials and investigates the effects of various structural parameters, such as the number of valve flaps and the shapes of the valve inlet and outlet, on cavitation phenomena.
2. Study on the Design of a Novel Valve
This section analyzes the causes of cavitation in traditional cavitation regulation valves and the associated hazards in cavitation experiments, introducing the concept of a circular flow cross-section structure. It provides a detailed description of the geometric model of the novel valve and explains how structural adjustments allow the valve to maintain a consistent and nearly circular cross-sectional shape at different openings.
2.1. Design Principles of the Novel Valve
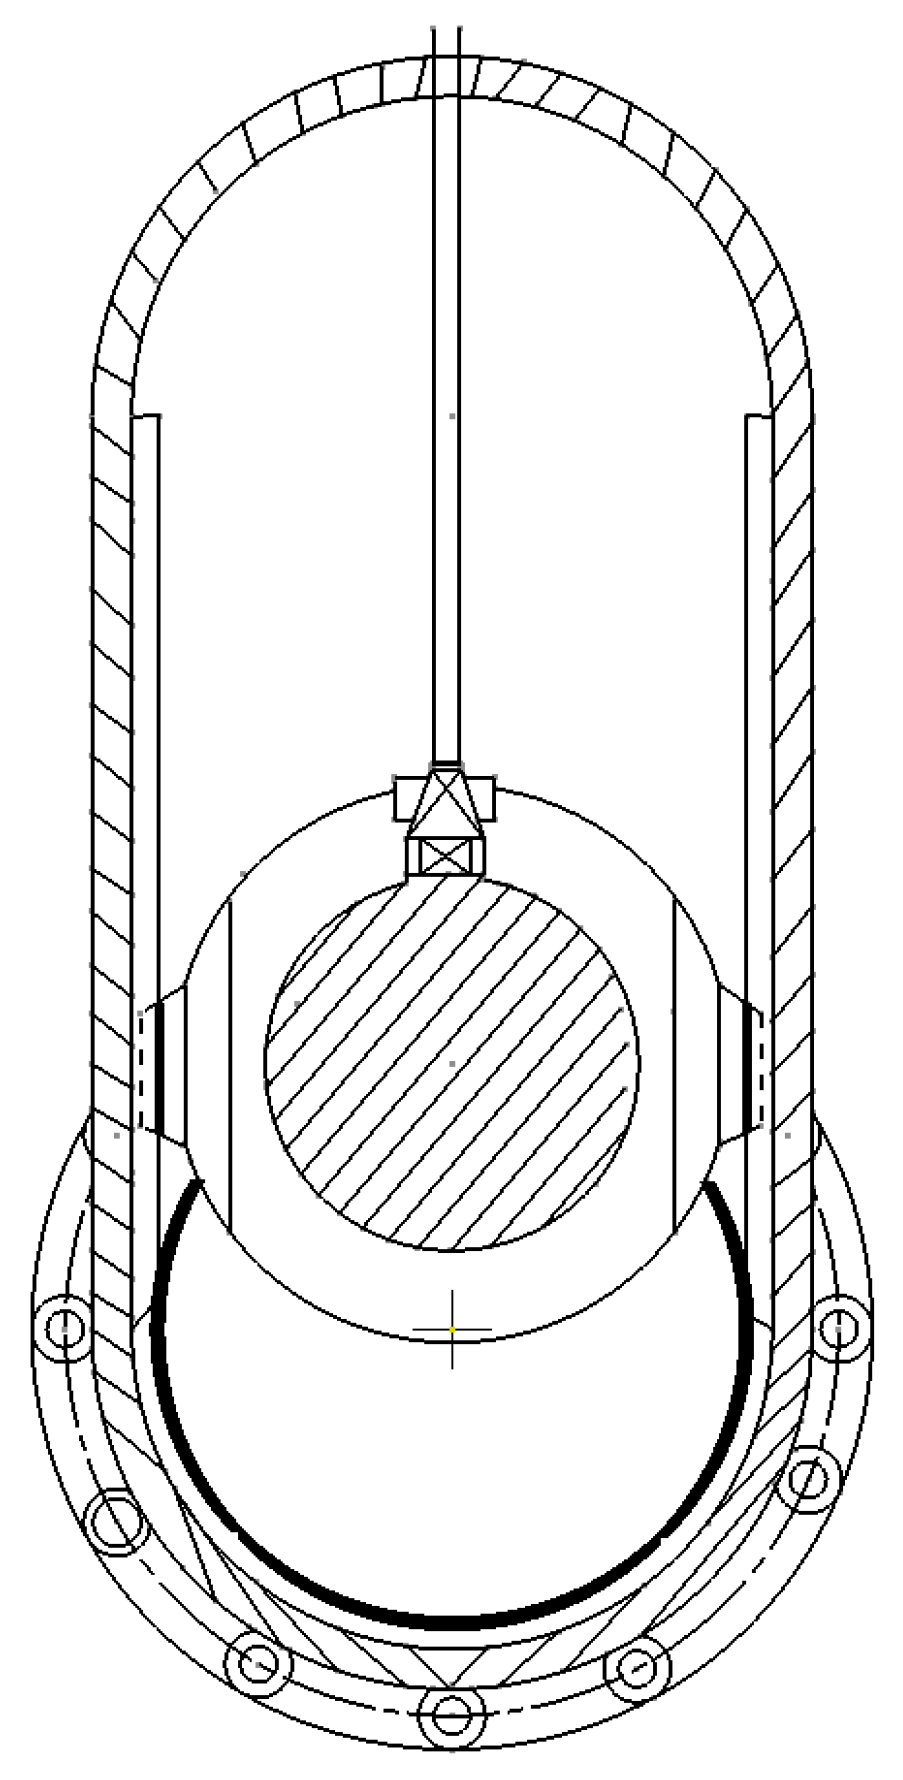
Irregular flow cross-sections in traditional cavitation regulation valves lead to cavitation phenomena [
19]. Traditional cavitation regulation valves, such as gate valves, have crescent-shaped flow cross-sections, as shown in
Figure 1. As the valve opening increases, the flow cross-section undergoes irregular changes. The narrowing flow path results in a significant increase in flow velocity and a sharp drop in static pressure, which can cause vaporization and bubble formation at the valve. These bubbles subsequently collapse due to pressure recovery, leading to cavitation at the valve. During pump cavitation testing, cavitation in the regulation valve can occur before the pump itself experiences cavitation. This not only severely affects the performance and lifespan of the valve but also introduces considerable errors in the assessment of pump cavitation performance. Therefore, controlling and reducing the impact of cavitation on regulation valves is a critical consideration in valve design and application.
The flow cross-section of the novel valve is designed to be circular, which is more conducive to fluid passage. Compared to the irregular flow cross-sections of traditional valves, a circular cross-section generates less resistance during fluid flow, allowing the fluid to pass more smoothly through the circular conduit, thereby reducing turbulence and energy loss. Additionally, a circular cross-section helps create a uniform velocity distribution, minimizing dead zones (the low-speed or static region formed by uneven velocity distribution or flow obstruction during fluid flow) and vortices within the conduit.
2.2. Structural Design of the Novel Valve
The valve consists of several identical flaps, which are connected at fixed points to form a deformable circular opening. Each flap has a fixed point and a movable point. The flaps are mechanically connected to achieve synchronous movement. As the flaps move, their overlapping sections change, thereby adjusting the valve opening. The mechanical connection for synchronous flap movement is achieved through a combination of fixed points, movable points, and a control ring. One end of each flap is fixed at a point on the outer ring of the cover plate, while the other end is connected to a movable point on another cover plate, with these movable points linked by the control ring. The control ring is an annular component located on the valve’s cover plate, featuring multiple slots or protrusions that connect to the movable points of each flap. When the control ring rotates, it drives the movable points of the flaps along a predetermined path, ensuring synchronous opening and closing of all flaps.
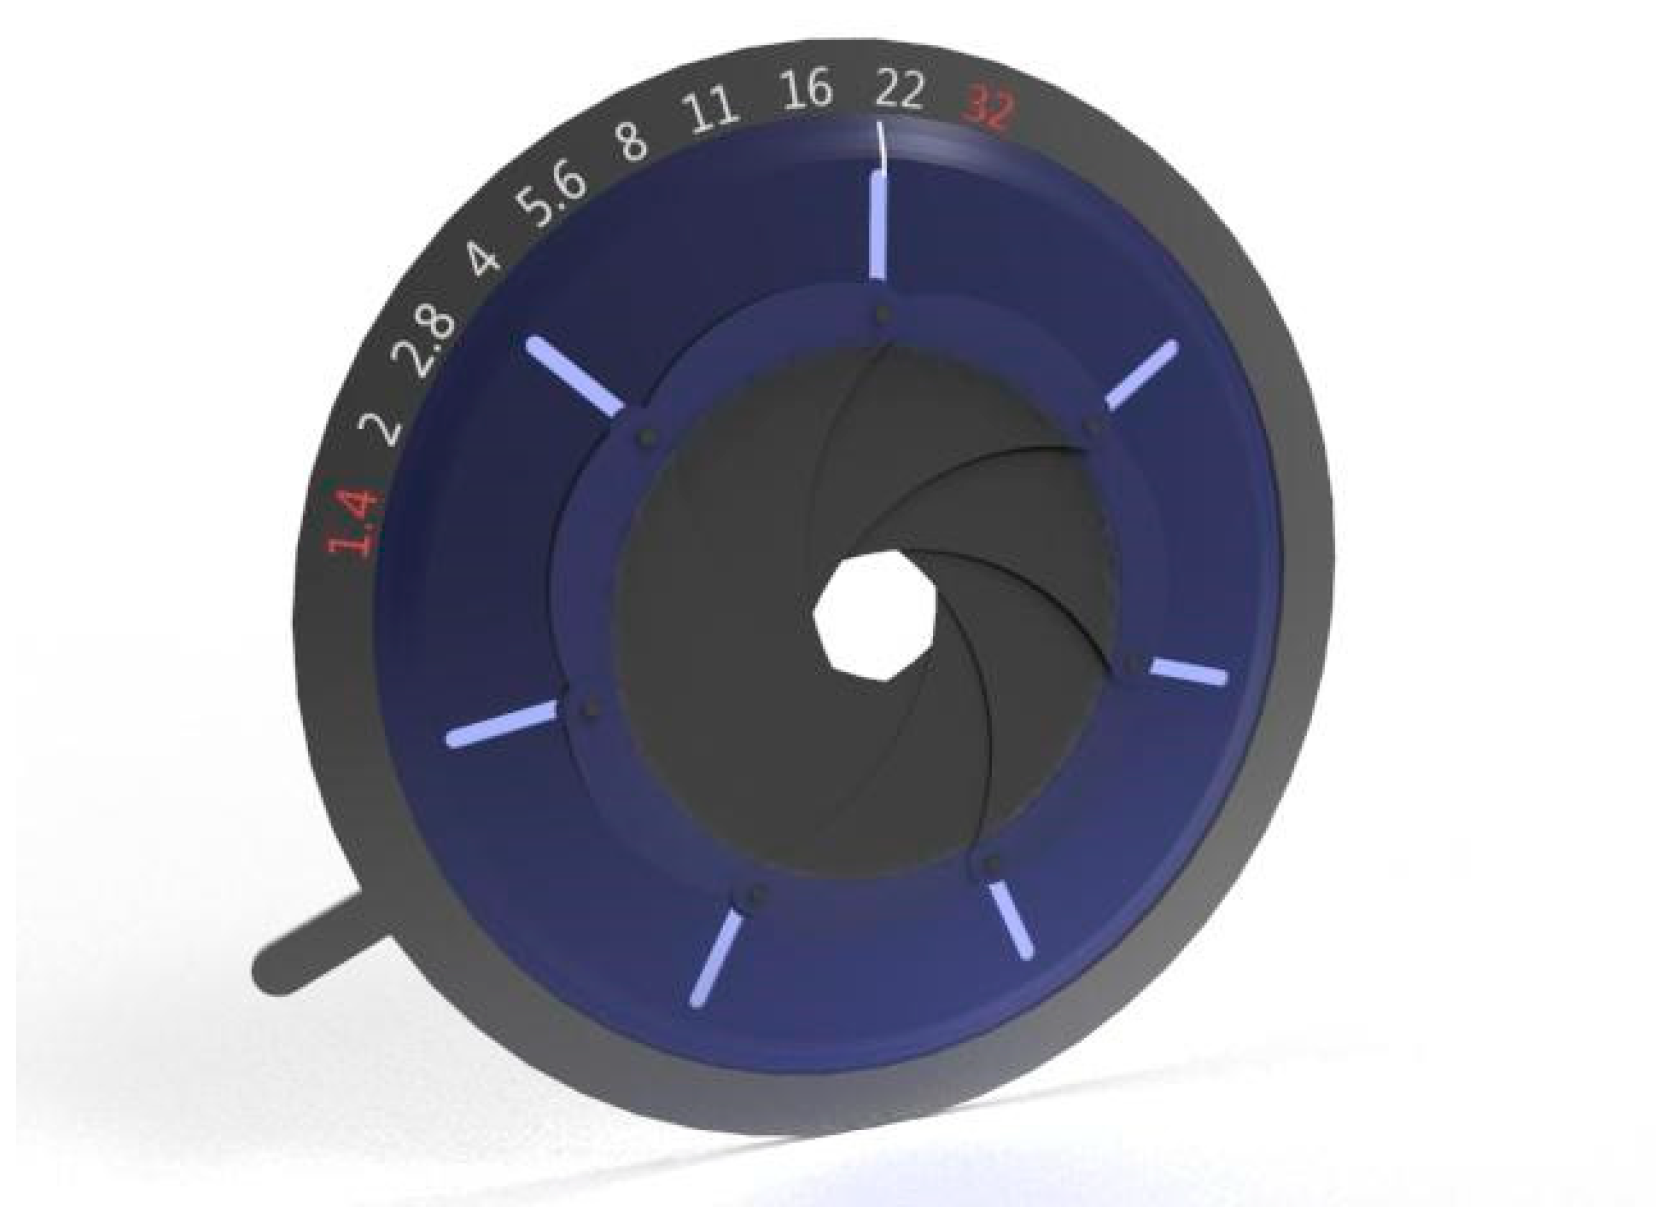
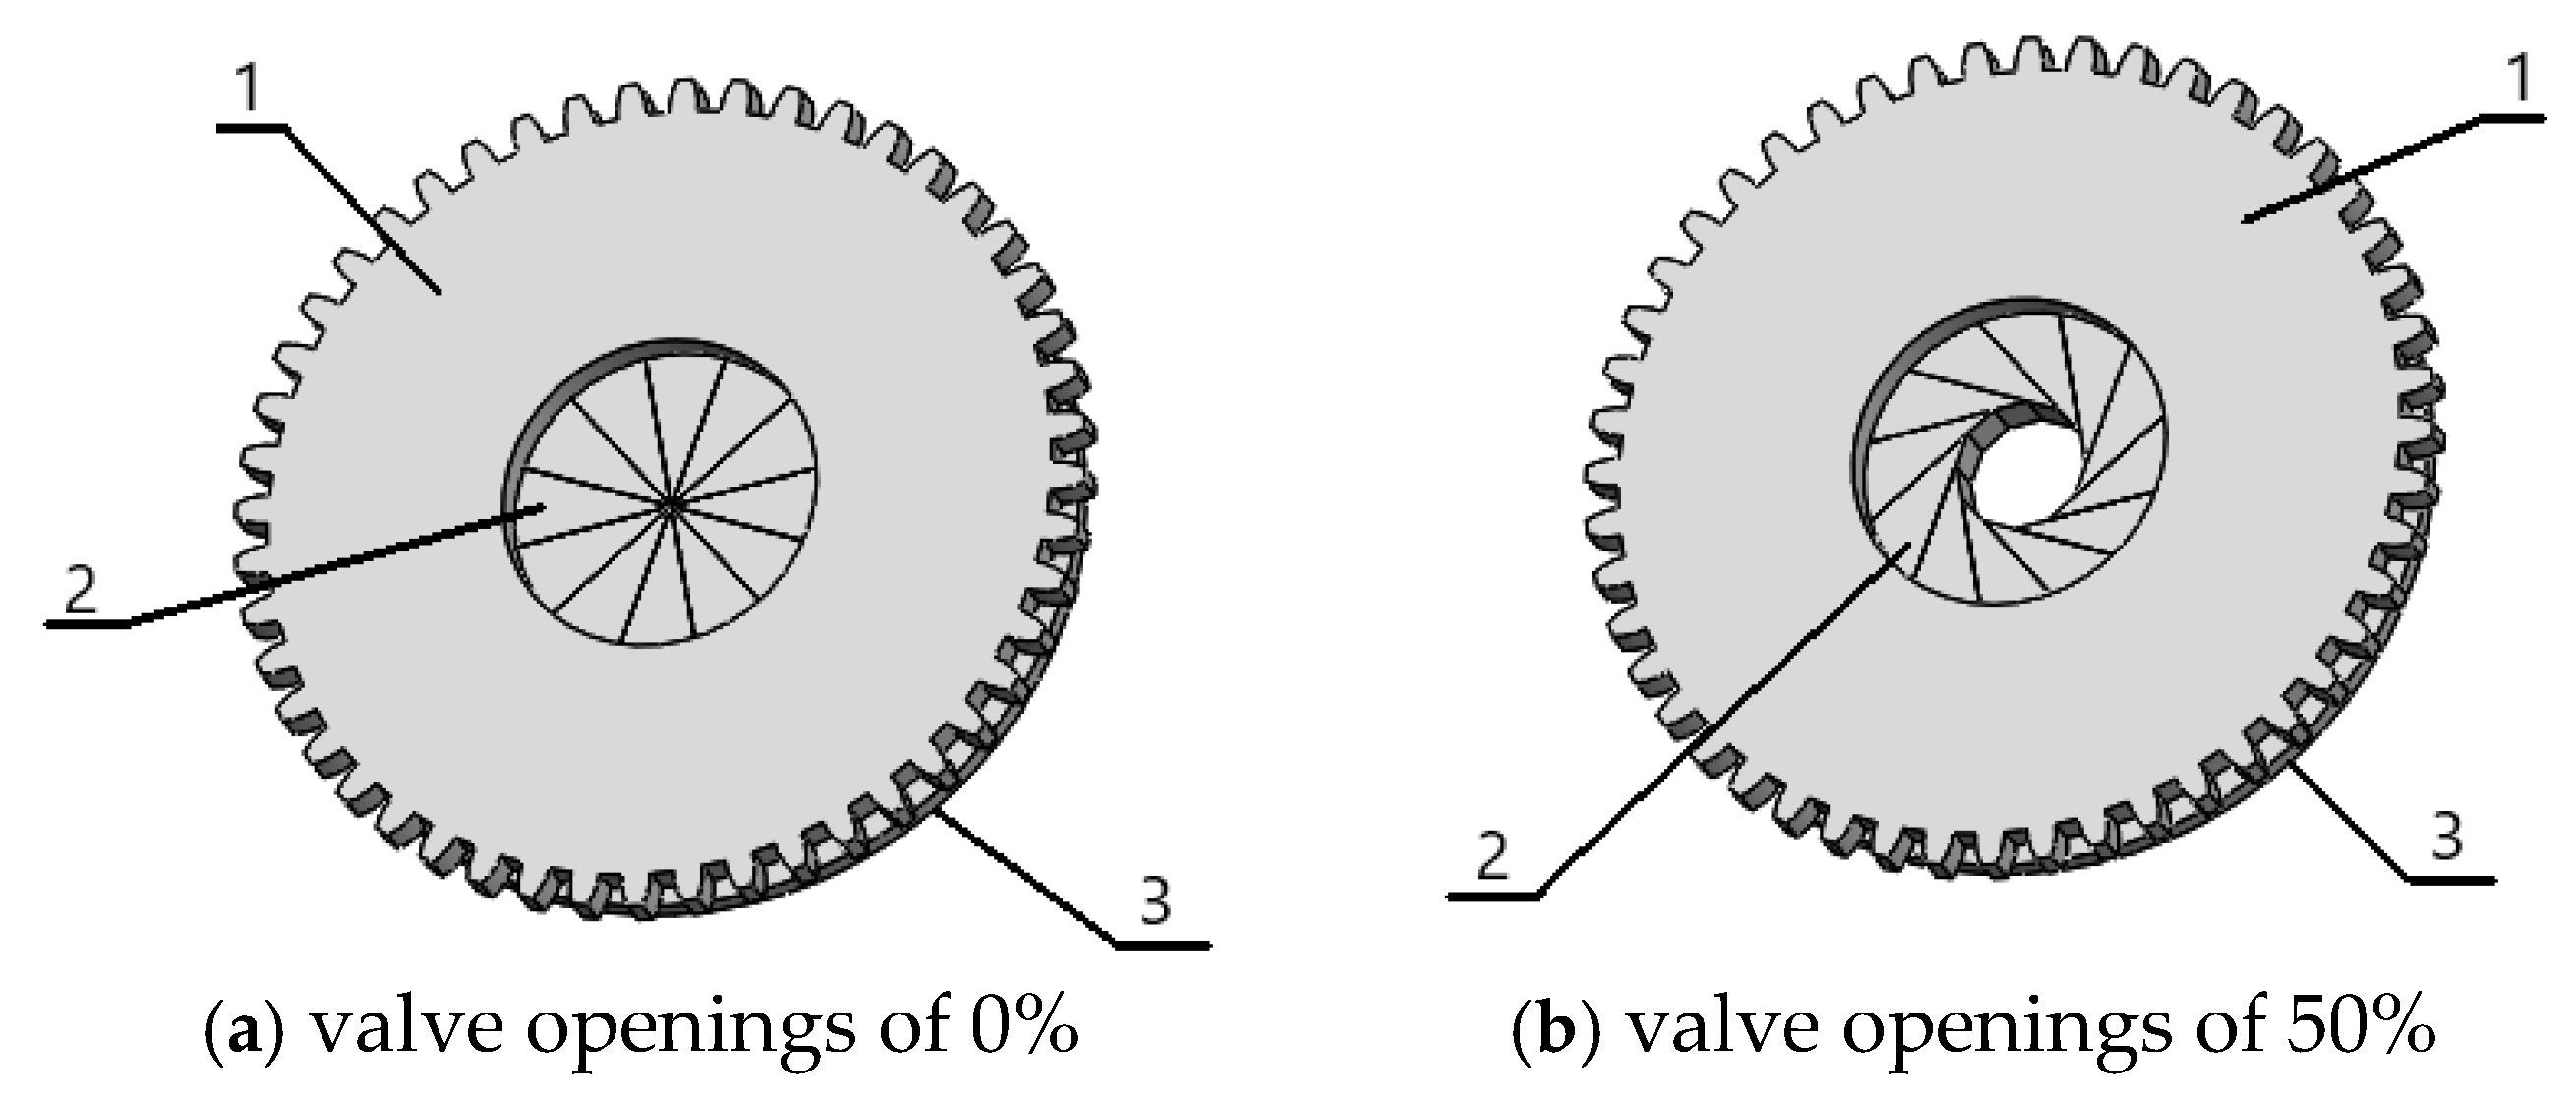
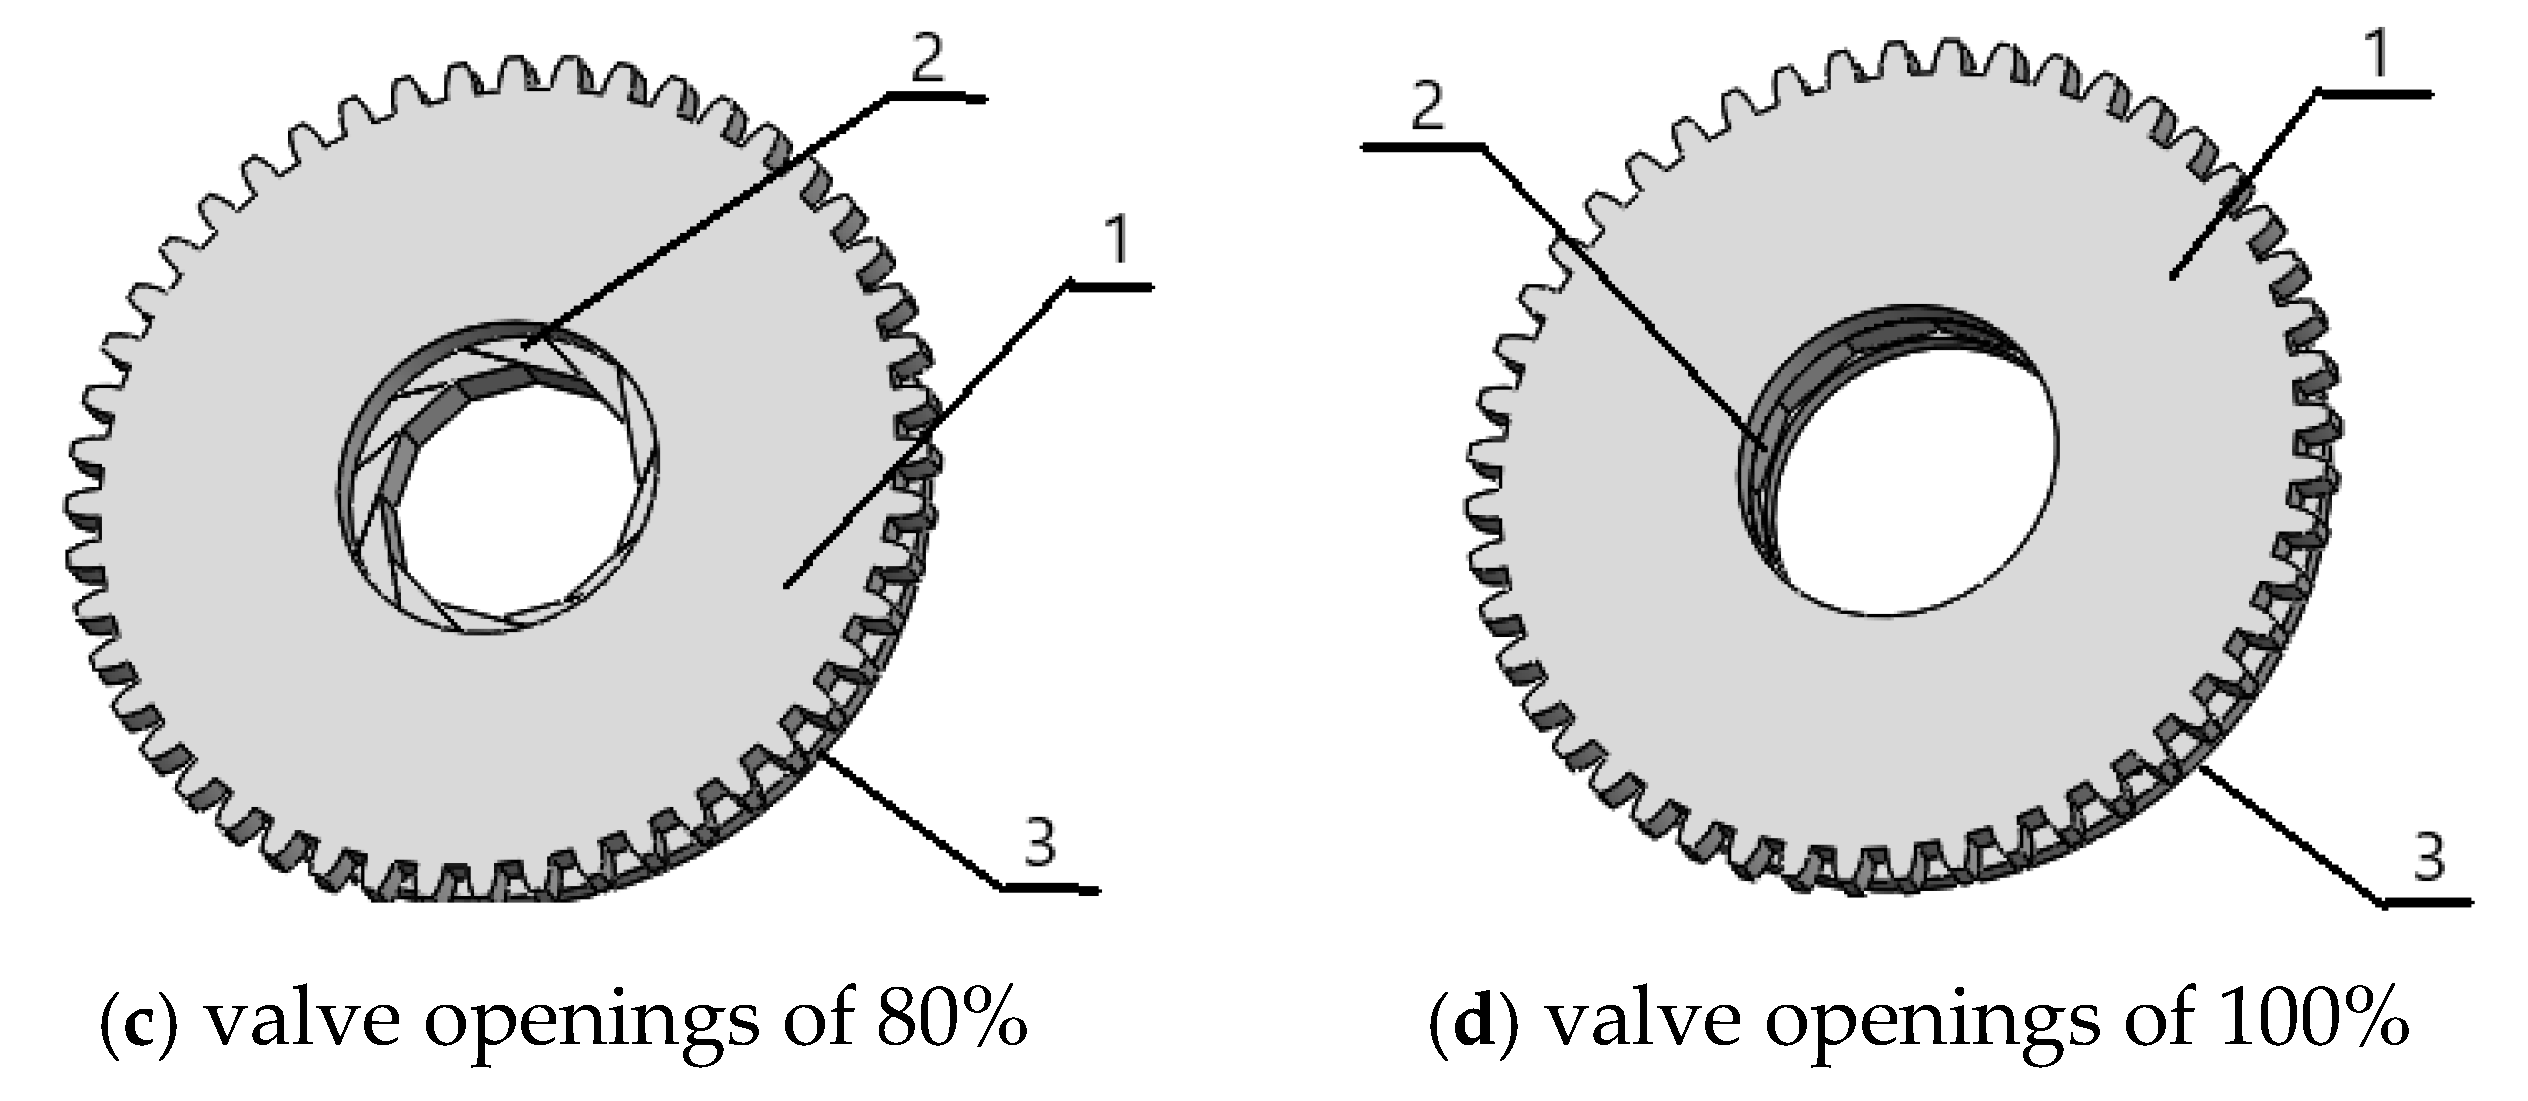
Therefore, the novel cavitation valve is designed with 12 identical flaps to maintain a circular flow cross-section. The movement direction and distance of the flaps are restricted to ensure that the flow cross-section remains consistent at different valve openings, similar to the adjustment of a camera aperture, as illustrated in
Figure 2.
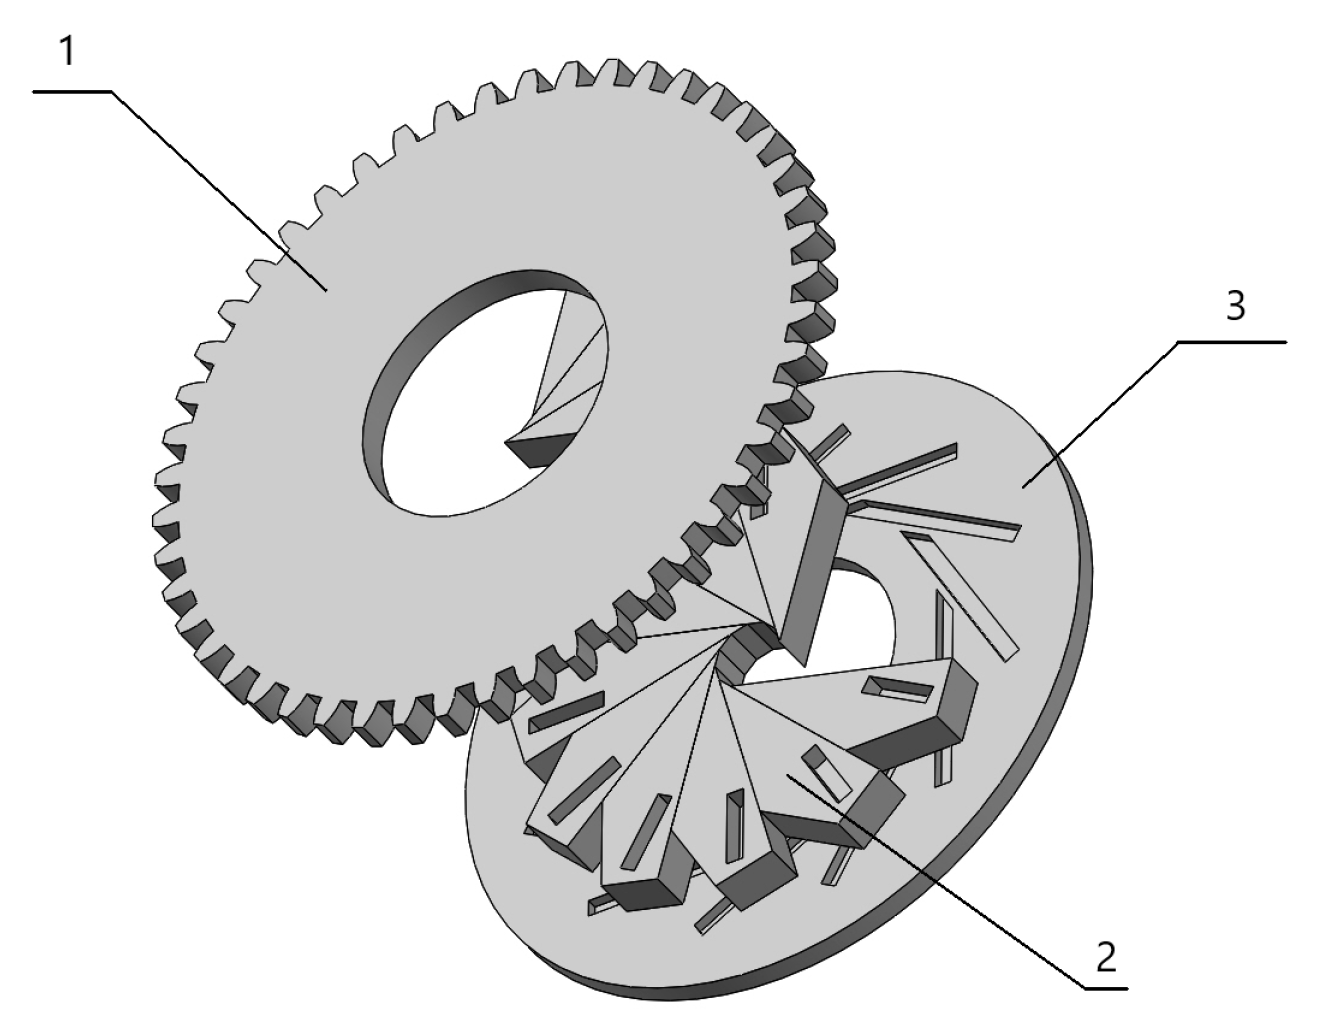
A structural schematic of the cavitation regulation valve at DN75 (nominal diameter of 75 mm) is shown in
Figure 3. The control section of the novel cavitation regulation valve consists of a front cover plate, a rear cover plate, and 12 identical valve flaps. Each flap has mortise and tenon structures on both sides, which are perpendicular to each other and correspond to the tenon structures on the front and rear cover plates. The front end of each flap forms a 30° angle, with the other three angles being 135°, 105°, and 90°. The two sides forming the 30° angle are 80 mm and 113 mm in length, respectively, with a flap thickness of 20 mm.
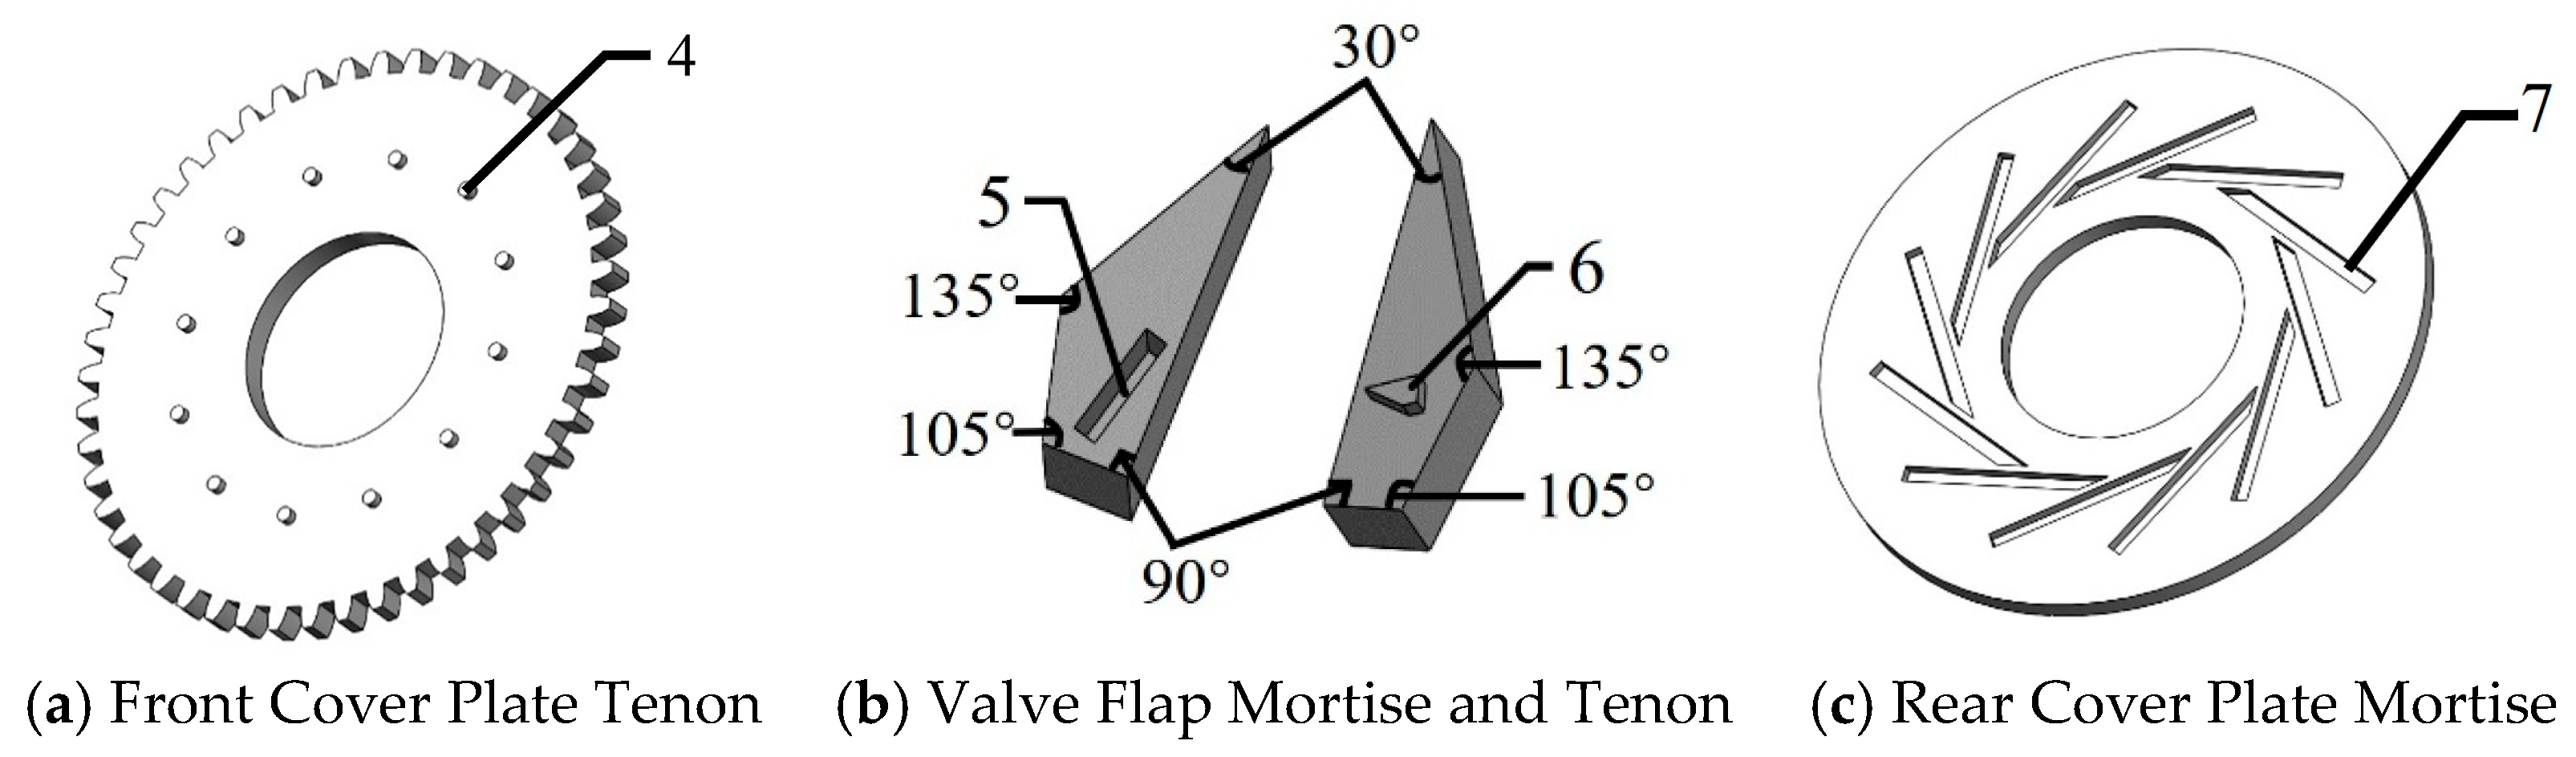
The mortise and tenon structures are shown in
Figure 4. The interaction between the mortise and tenon ensures that the valve flow area remains nearly circular. The direction of the valve flap mortise is perpendicular to the direction of the rear cover plate mortise. The valve flap mortise is aligned along the diameter of the rear cover plate to control the radial movement of the valve flap, while the rear cover plate mortise is set perpendicular to the diameter of the rear cover plate to control the tangential movement of the valve flap.
By interlocking the tenon and mortise, the length of the mortise can be controlled to adjust the movement distance of the valve flap, thereby jointly controlling the valve opening. Due to the tight connection between the valve flaps, the flow cross-section forms a near-circular regular polygon, addressing the issue of irregular flow areas and reducing bubble formation at the valve.
Figure 5 illustrates a structural schematic of the valve at different openings, where (a), (b), (c), and (d) represent valve openings of 0%, 50%, 80%, and 100%, respectively.
3. Numerical Analysis of the New Valve
To investigate the impact of the cavitation characteristics of the newly designed valve, a simulation model was established using numerical analysis methods. When performing simulations with CFD, it is essential to utilize the fundamental equations of fluid dynamics: the mass conservation equation, the momentum conservation equation, and the energy conservation equation. Additionally, since regions of pressure below the saturation vapor pressure may occur during the experiment, leading to vaporization of the liquid in these areas, it is necessary to incorporate multiphase flow models, turbulence models, and cavitation models in the numerical simulation phase to enhance calculation accuracy.
3.1. Mathematical Model and Boundary Conditions
In this study, the realizable k-ε turbulence model, mixture multiphase flow model, and Schnerr and Sauer cavitation model were employed for calculations. The fluid medium was water at a temperature of 25 °C, with an outlet pressure of 0.095 MPa. The pressure–velocity coupling method used was SIMPLEC. The simulation was set to transient with a time step of 0.0001 s, residuals converging to 10−5, and a total of 5000 iterations for the calculation results.
For the numerical simulation of the new cavitation control valve, the phase change of the liquid state was calculated, considering only the vaporization phenomenon. The mesh quantity and the convergence and stability of the calculation results were also taken into account. Therefore, the mixture model was chosen as the multiphase flow model.
Continuity Equation [
28,
29]:
where
is the density of the mixture fluid, and
is the mass average velocity.
Momentum Equation:
where
is the pressure, and
is the dynamic viscosity of the mixture fluid.
The Schnerr and Sauer model is used as the cavitation model. The expression for the cavitation rate is shown in Equations (3) and (4):
If the pressure in the flow region is lower than the saturation vapor pressure, the liquid will vaporize:
If the pressure in the flow region is higher than the saturation vapor pressure, the vapor will condense:
where
is the vaporization coefficient, with a value of 1;
is the condensation coefficient, with a value of 0.2;
is the gas-phase density;
is the liquid-phase density;
is the mixture density;
is the absolute pressure at the given temperature;
is the saturation vapor pressure of water at the given temperature;
is the gas volume fraction; and
is the bubble radius.
The realizable
k-
ε model, used as the turbulence model, can be expressed as:
where
.
In the equations, is the eddy viscosity coefficient; is an empirical constant, typically taken as 0.09; is the turbulent kinetic energy; is the turbulence dissipation rate; is the turbulent Prandtl number for ; is the production term of k due to the mean velocity gradients; is the turbulent Prandtl number for ; and are user-defined source terms; is a constant with a value of 1.9; and is the molecular kinematic viscosity.
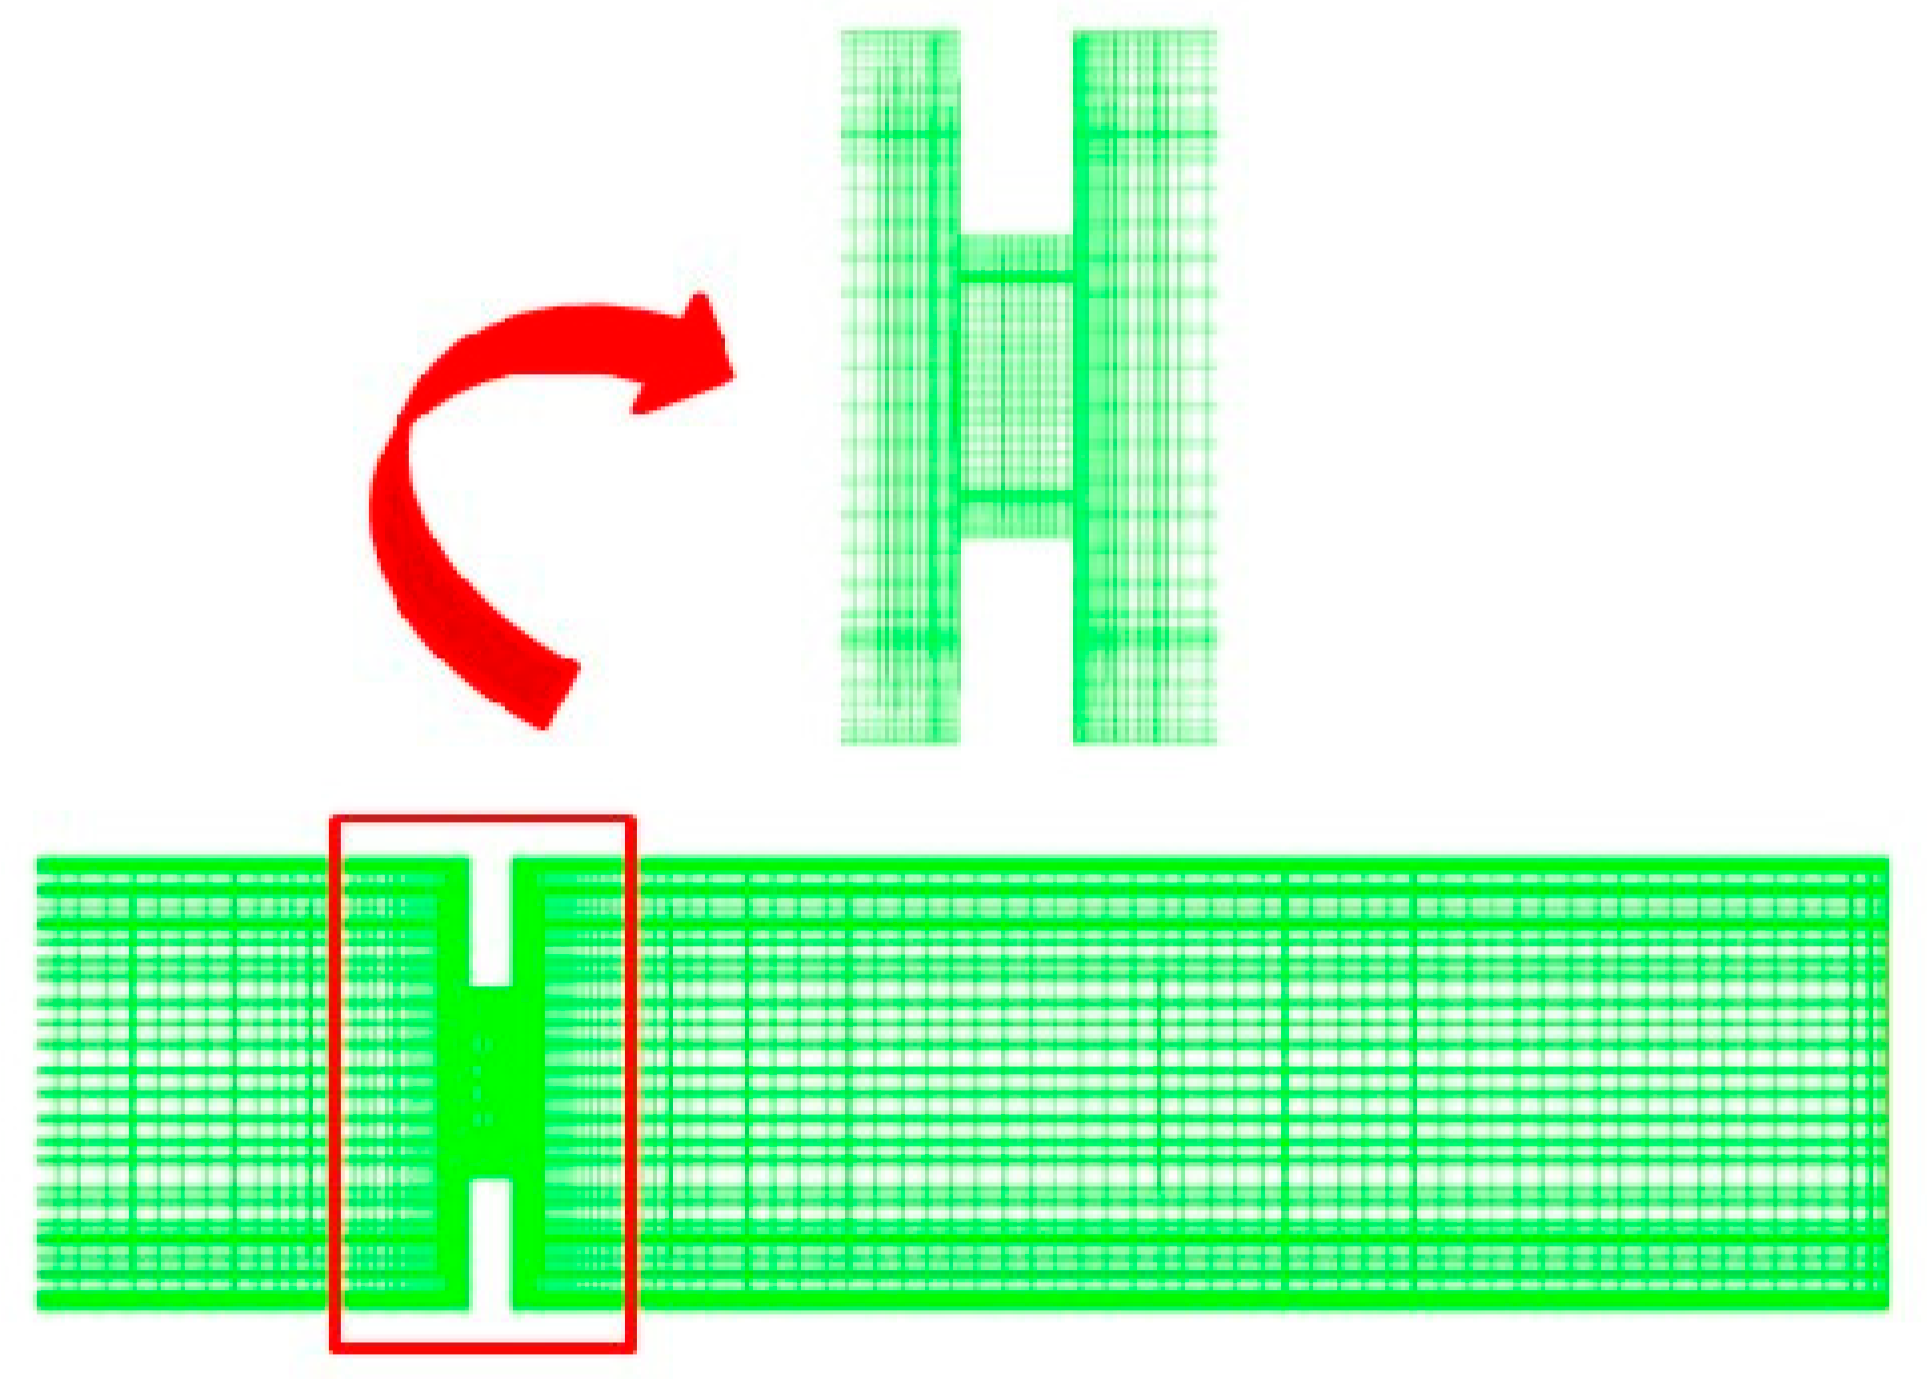
3.2. Mesh Generation
The mesh generation was performed using ICEM 2022, as shown in
Figure 6. The novel cavitation valve was configured with eight valve flaps, a DN80, and a valve thickness of 20 mm. The inlet and outlet pipe lengths were set to 8-times the nominal diameter of the inlet and outlet pipes, respectively. To enhance the accuracy of the simulation and ensure the solution data closely match the experimental results, local mesh refinement was applied in the vicinity of the valve.
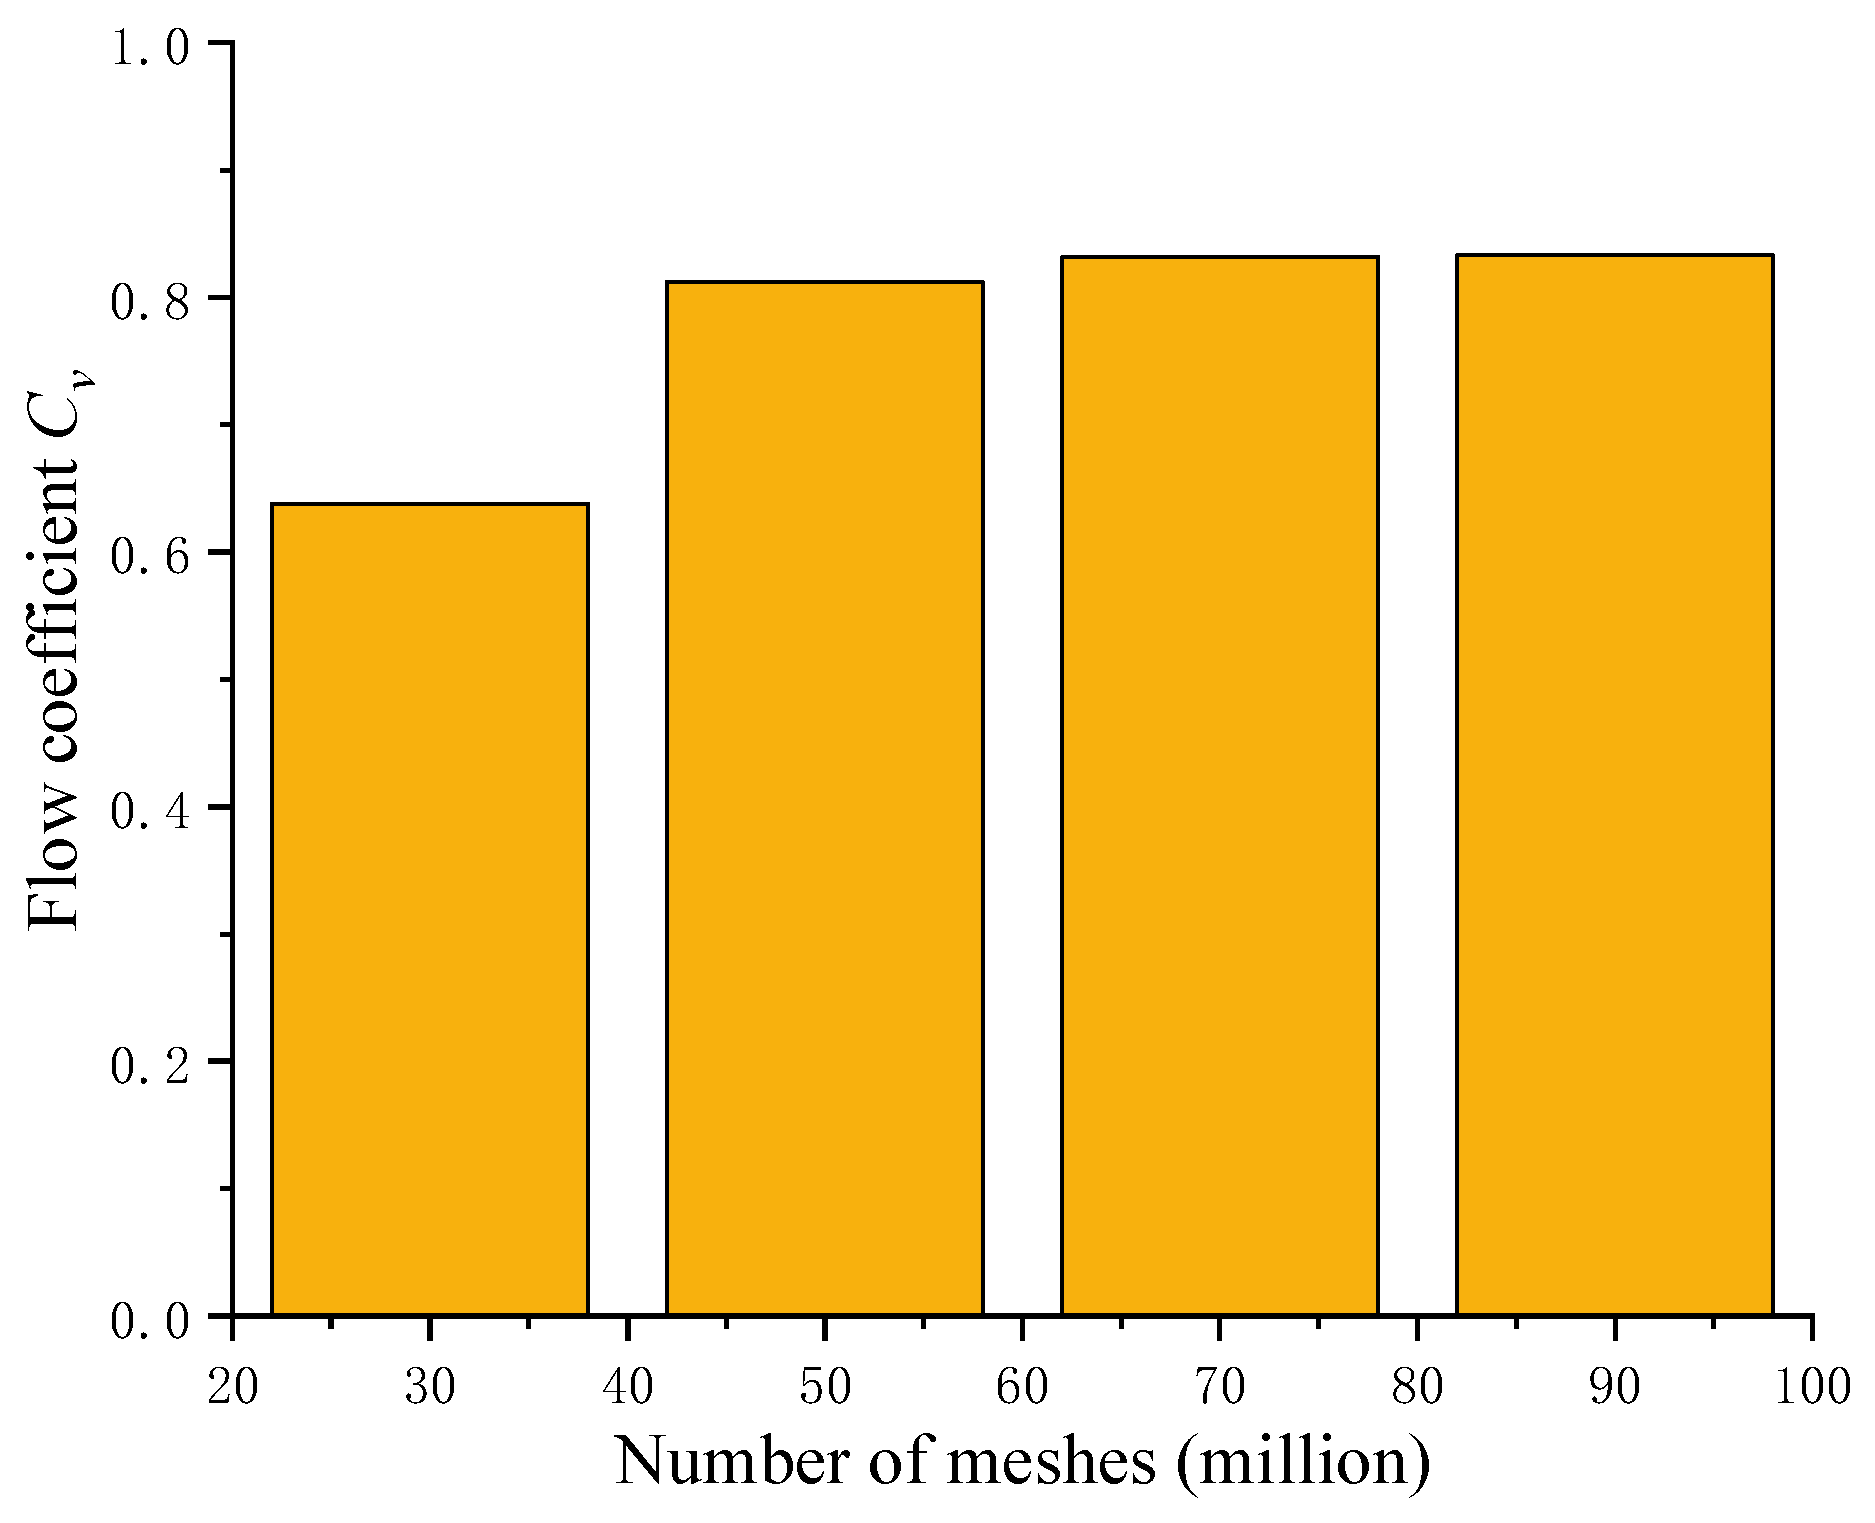
The numerical simulation of the novel cavitation control valve was conducted, and the flow coefficients
for different mesh counts with the valve fully open were obtained, as shown in
Figure 7. A mesh count of 700,000 was selected, resulting in a final mesh count of 761,542 elements, with a mesh quality above 0.7.
4. Influence of the Number of Valve Flaps on the Flow State
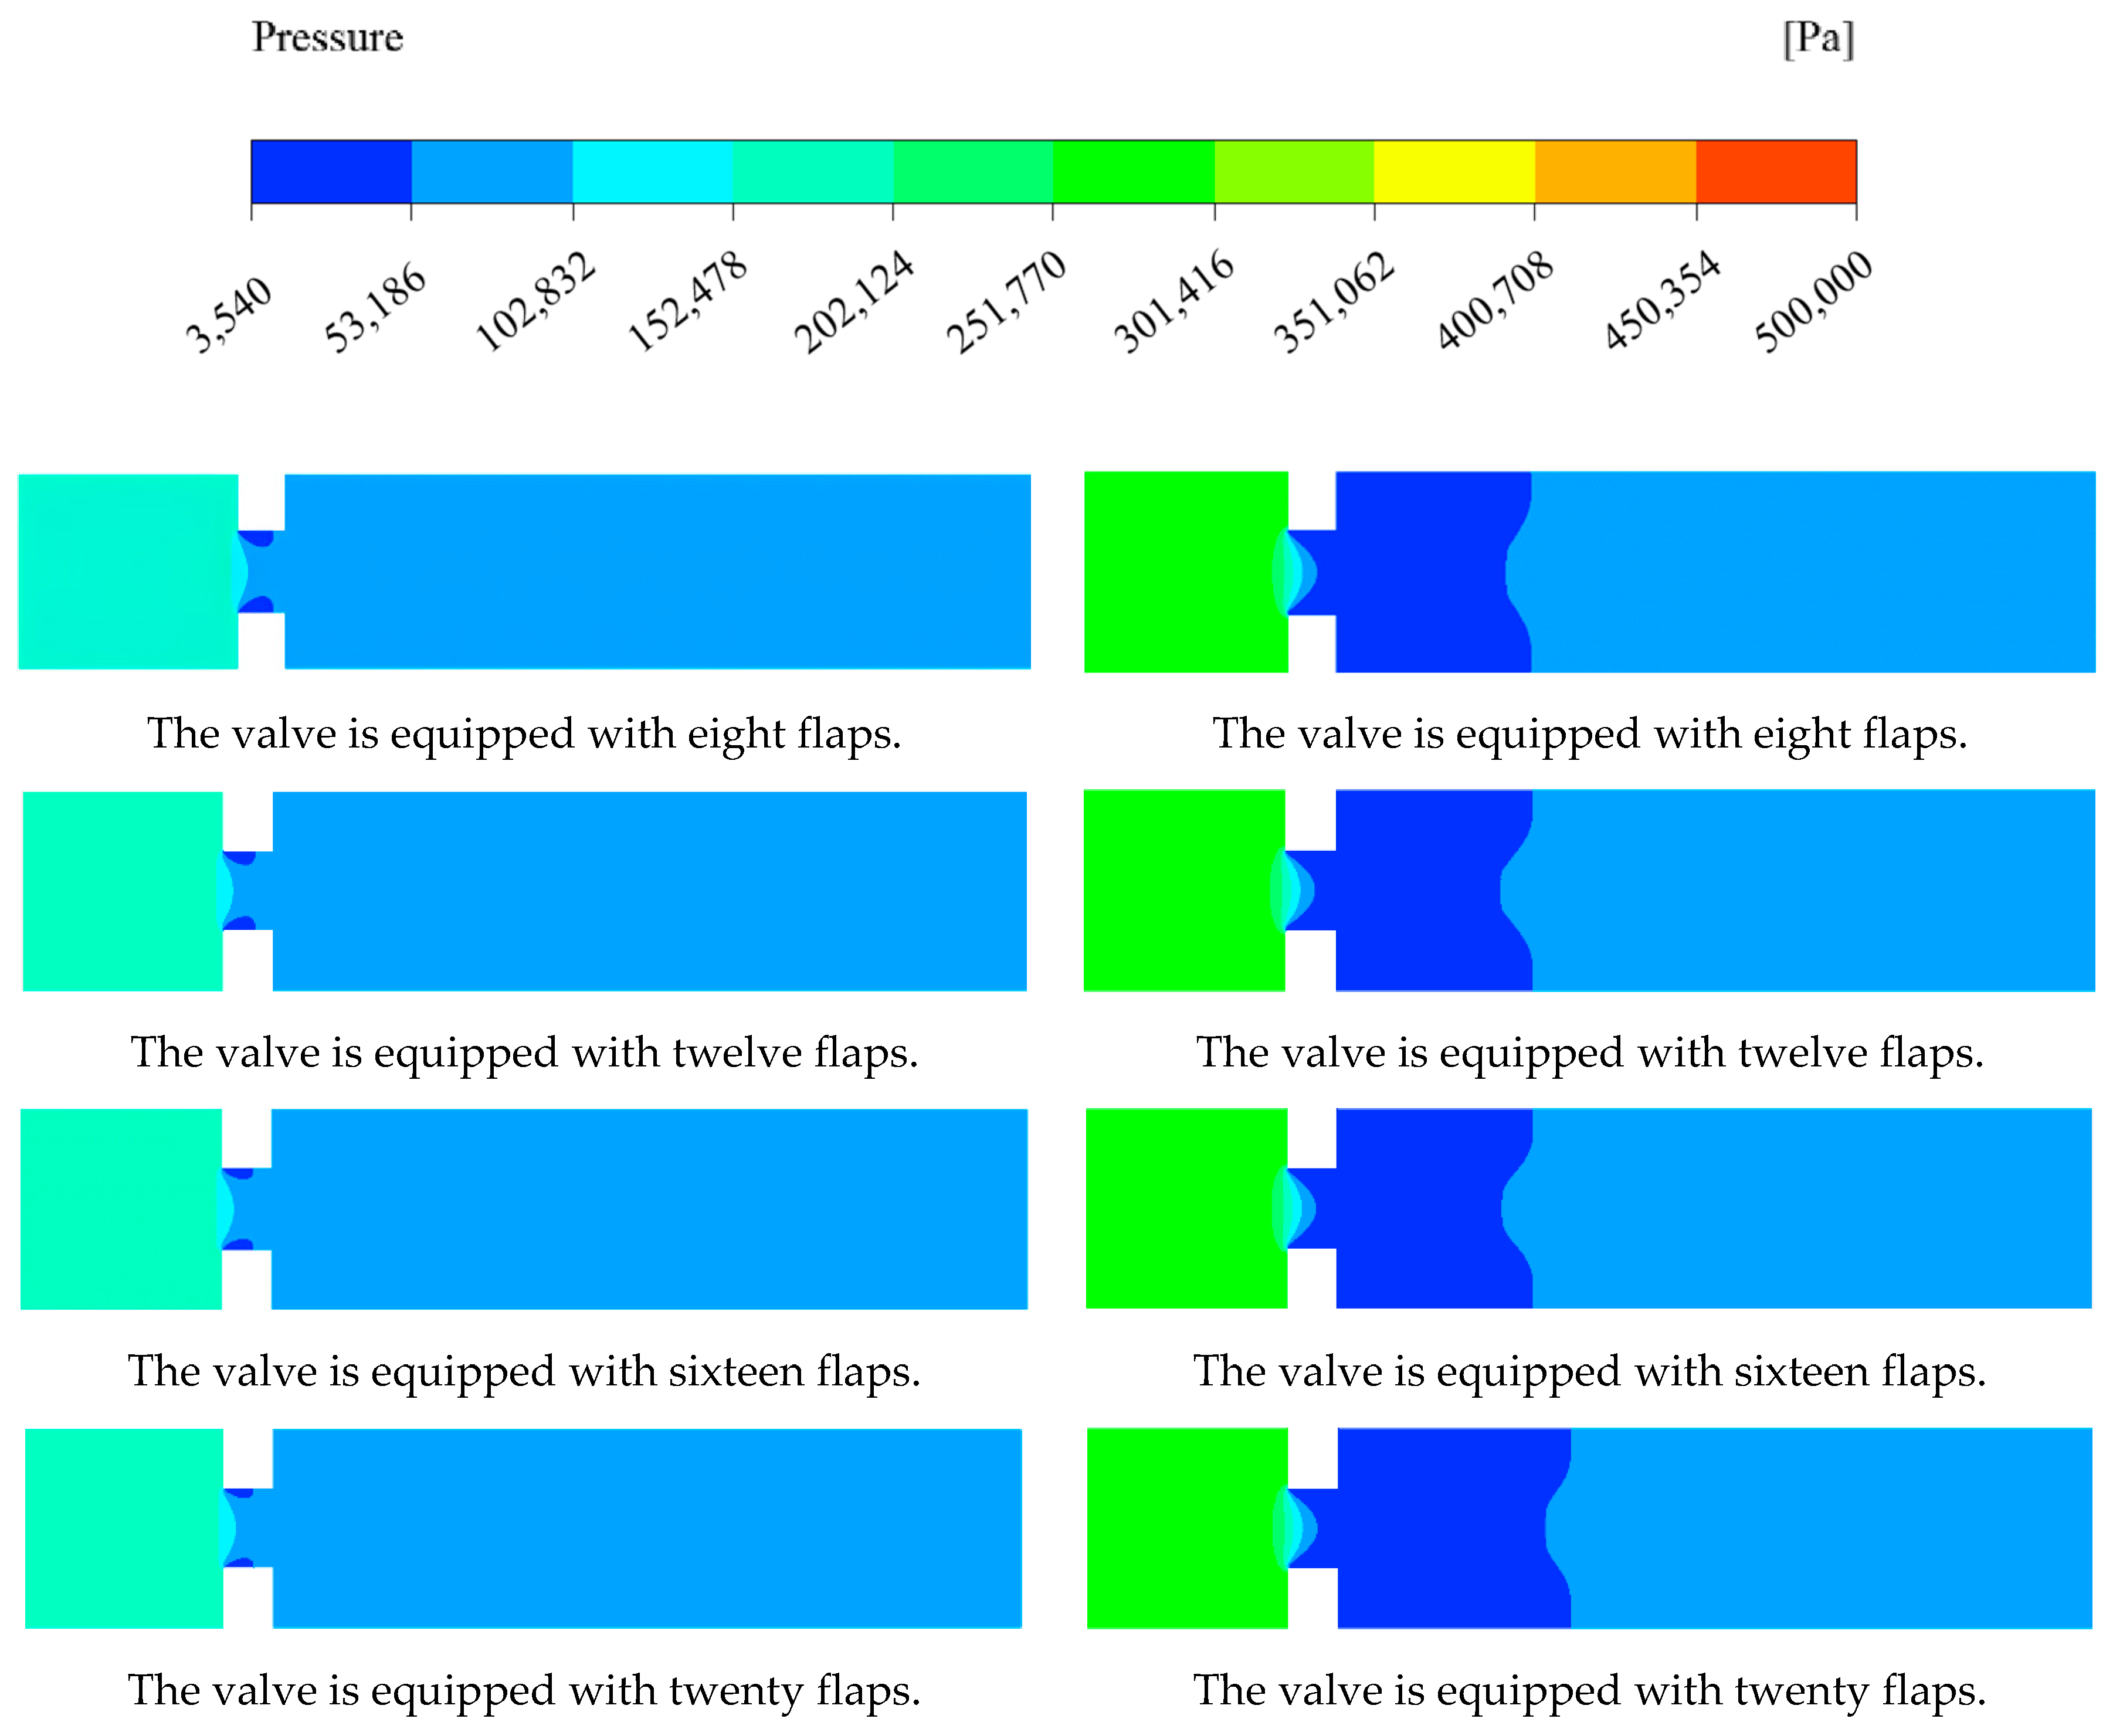
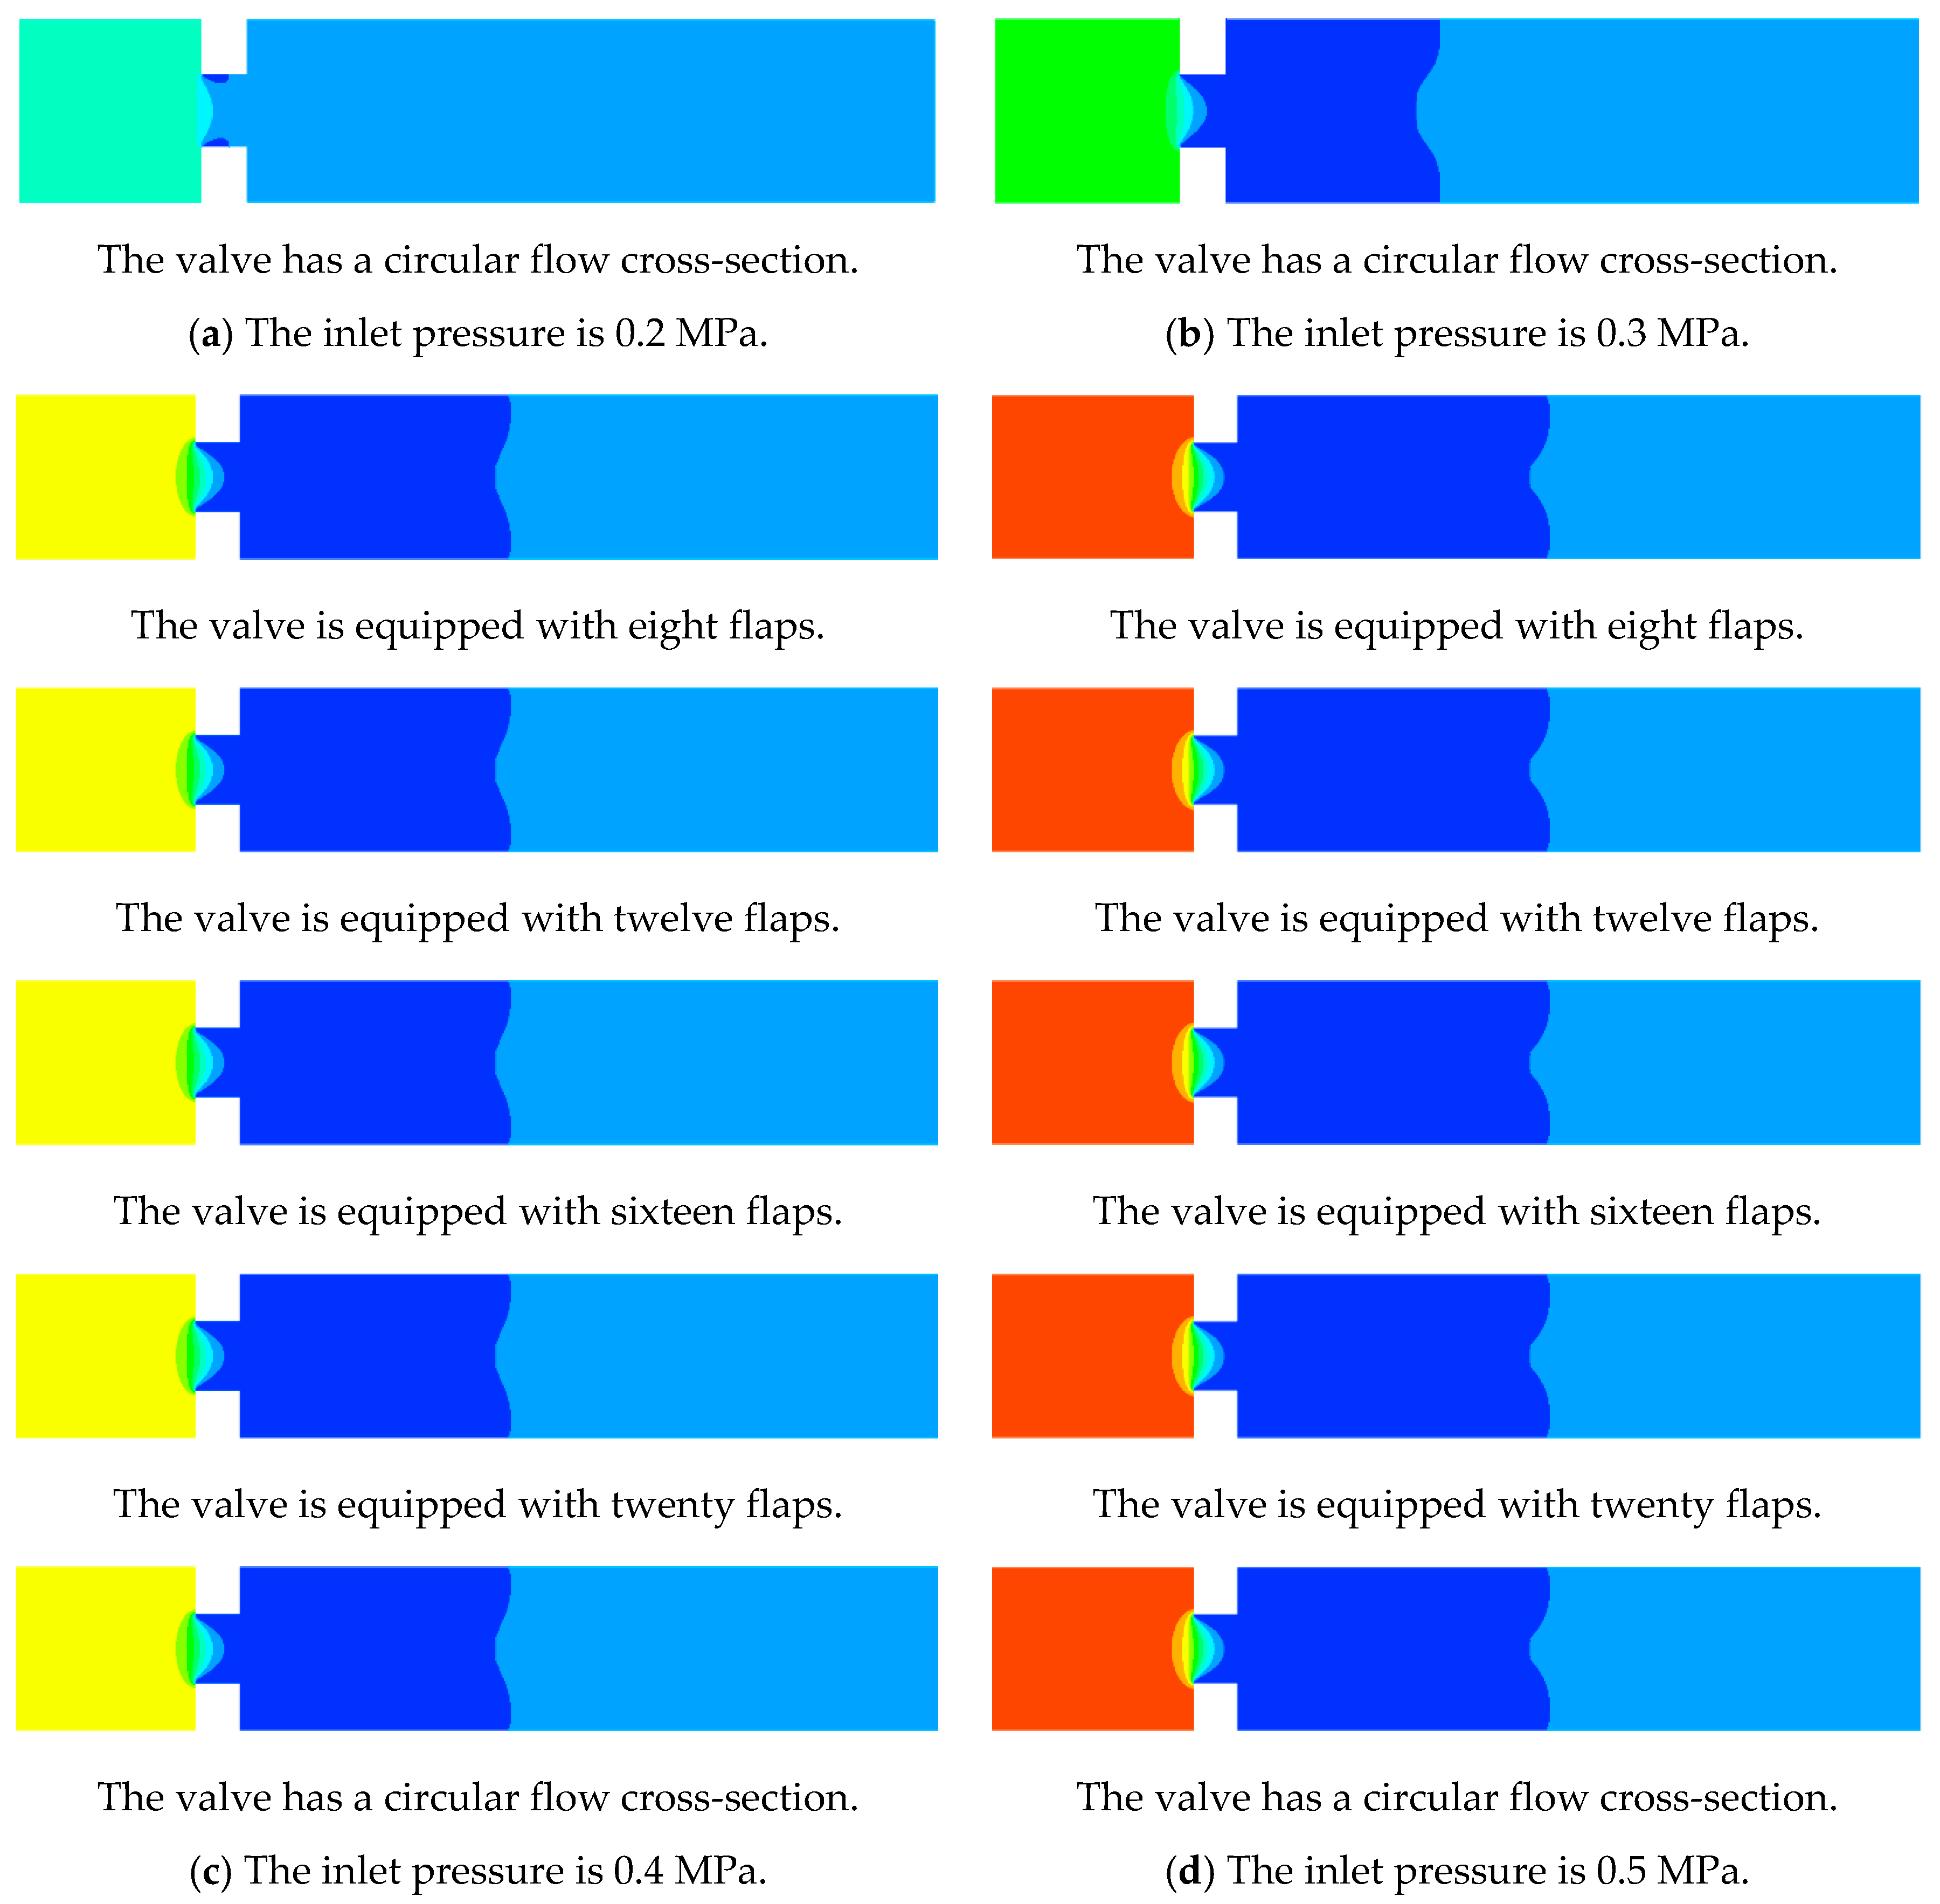
From a structural perspective, increasing the number of valve flaps can make the flow cross-section closer to a circle, smoothing the edges of the regular polygonal flow cross-section. The valve disc thickness is 20 mm, and the valve opening is set at 15%. Set the outlet pressure P1 to 0.095 MPa and vary the inlet pressure P0 of the valve to 0.2 MPa, 0.3 MPa, 0.4 MPa, and 0.5 Mpa (in the open test of centrifugal pumps, this is the classic low- to medium-pressure region), with the number of valve flaps set to 8, 12, 16, and 20.
4.1. Pressure Distribution Patterns
Increasing the number of valve flaps has a stabilizing effect on the distribution of the pressure field within the flow domain, and it plays a positive role in cavitation resistance. As shown in
Figure 8a, under an inlet pressure of 0.2 MPa, the flow field pressure distributions for valve configurations with varied flap counts exhibit consistent trends, with no low-pressure zones observed in the pressure fields upstream and downstream of the valve. The main area of influence is at the valve flaps. Low-pressure zones form at the valve flaps, but the area of these low-pressure zones decreases as the number of valve flaps increases. The formation of the low-pressure zone near the valve disc is attributed to the flow velocity enhancement induced by cross-sectional variations in the flow passage when fluid traverses the valve assembly. In accordance with Bernoulli’s principle, this velocity increment corresponds to a reduction in static pressure, thereby establishing a localized pressure depression in the valve proximity. Notably, as the quantity of valve discs increases, the flow passage geometry progressively approximates a circular configuration. This geometric optimization mitigates abrupt cross-sectional transitions, consequently diminishing the spatial extent of the low-pressure region associated with valve disc operation. Consequently, the degree of variation in the internal pressure field of the valve is significantly reduced, and the range of pressure fluctuations diminishes.
When the inlet pressure increases to 0.3 Mpa, 0.4 Mpa and 0.5 Mpa, the low-pressure zone extends into the pipeline behind the valve. At this stage, the increase in the number of valve flaps has no significant effect on the overall pressure changes, because as the inlet pressure increases, the pressure difference becomes the dominant factor in the internal pressure distribution contour changes. Therefore, when the inlet and outlet pressure variations are relatively small, increasing the number of valve flaps can effectively control the formation and spread of low-pressure regions within the valve, preventing large-scale fluid vaporization. As the inlet and outlet pressure variations become larger and the low-pressure zone extends behind the valve, the change in the number of valve flaps has a minimal impact on the pressure field within the flow domain, with almost no pressure fluctuations. Thus, the influence of the number of valve flaps on the internal pressure field is significant under conditions of small inlet and outlet pressure variations.
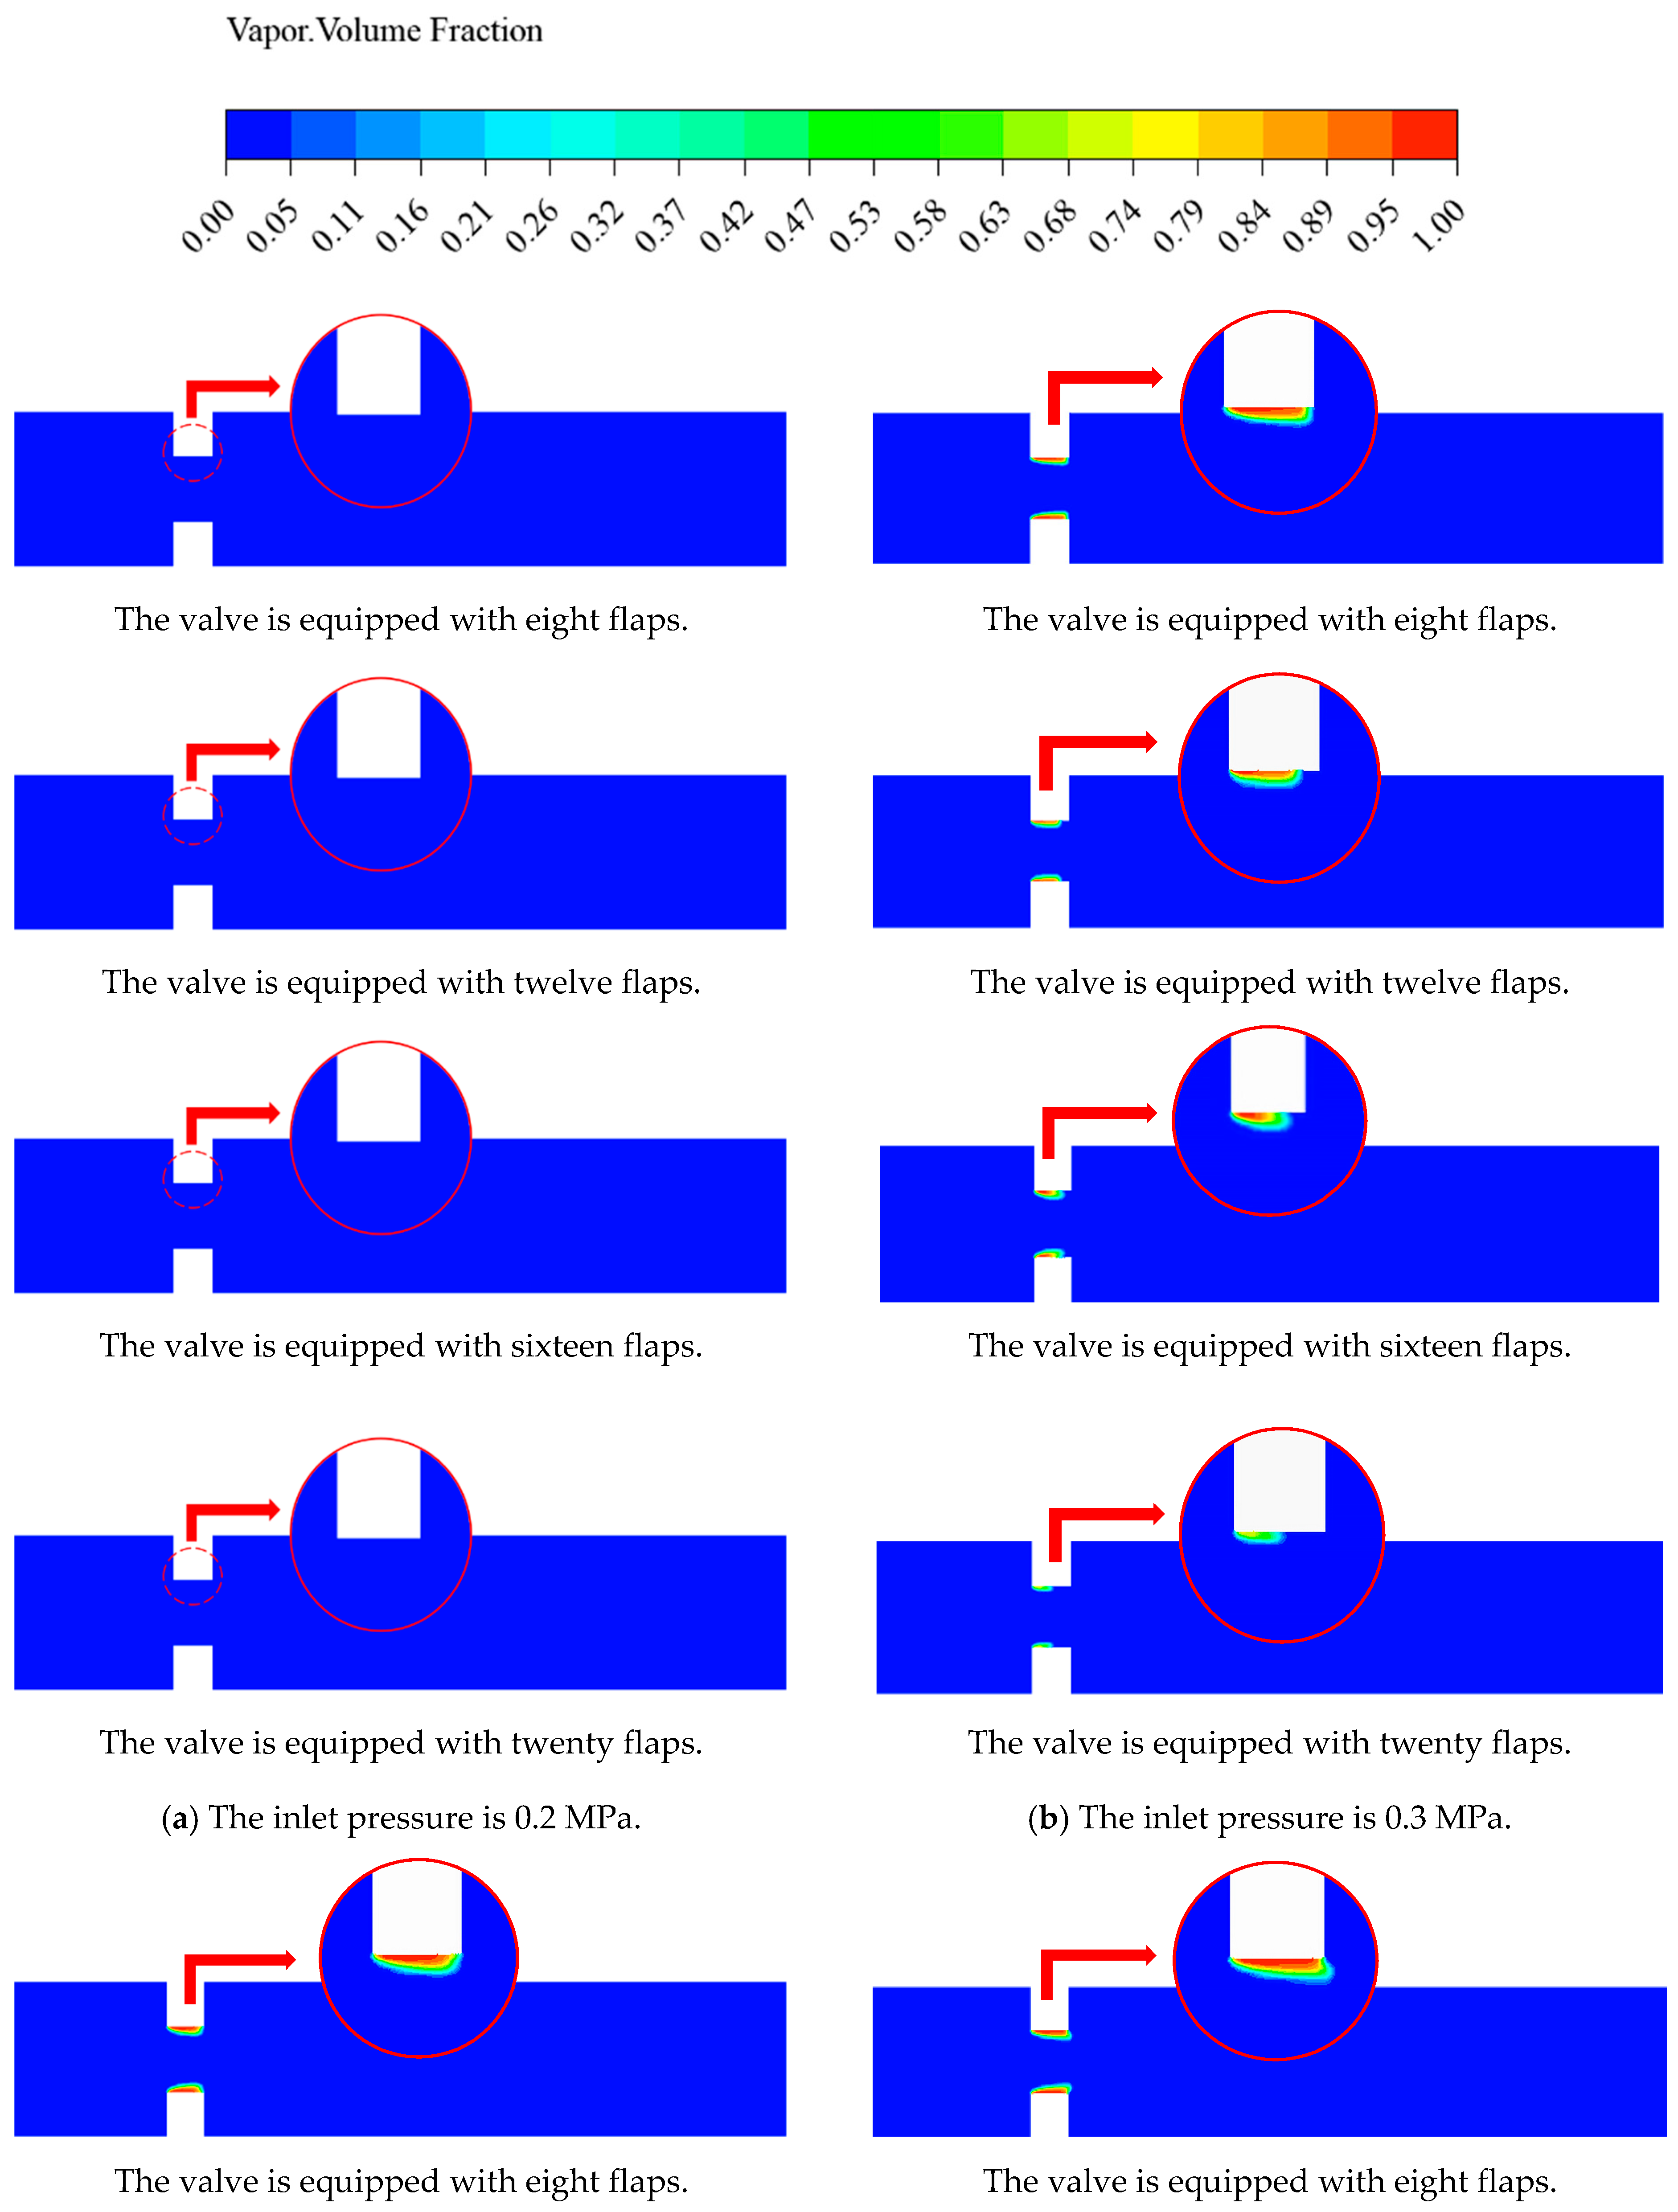
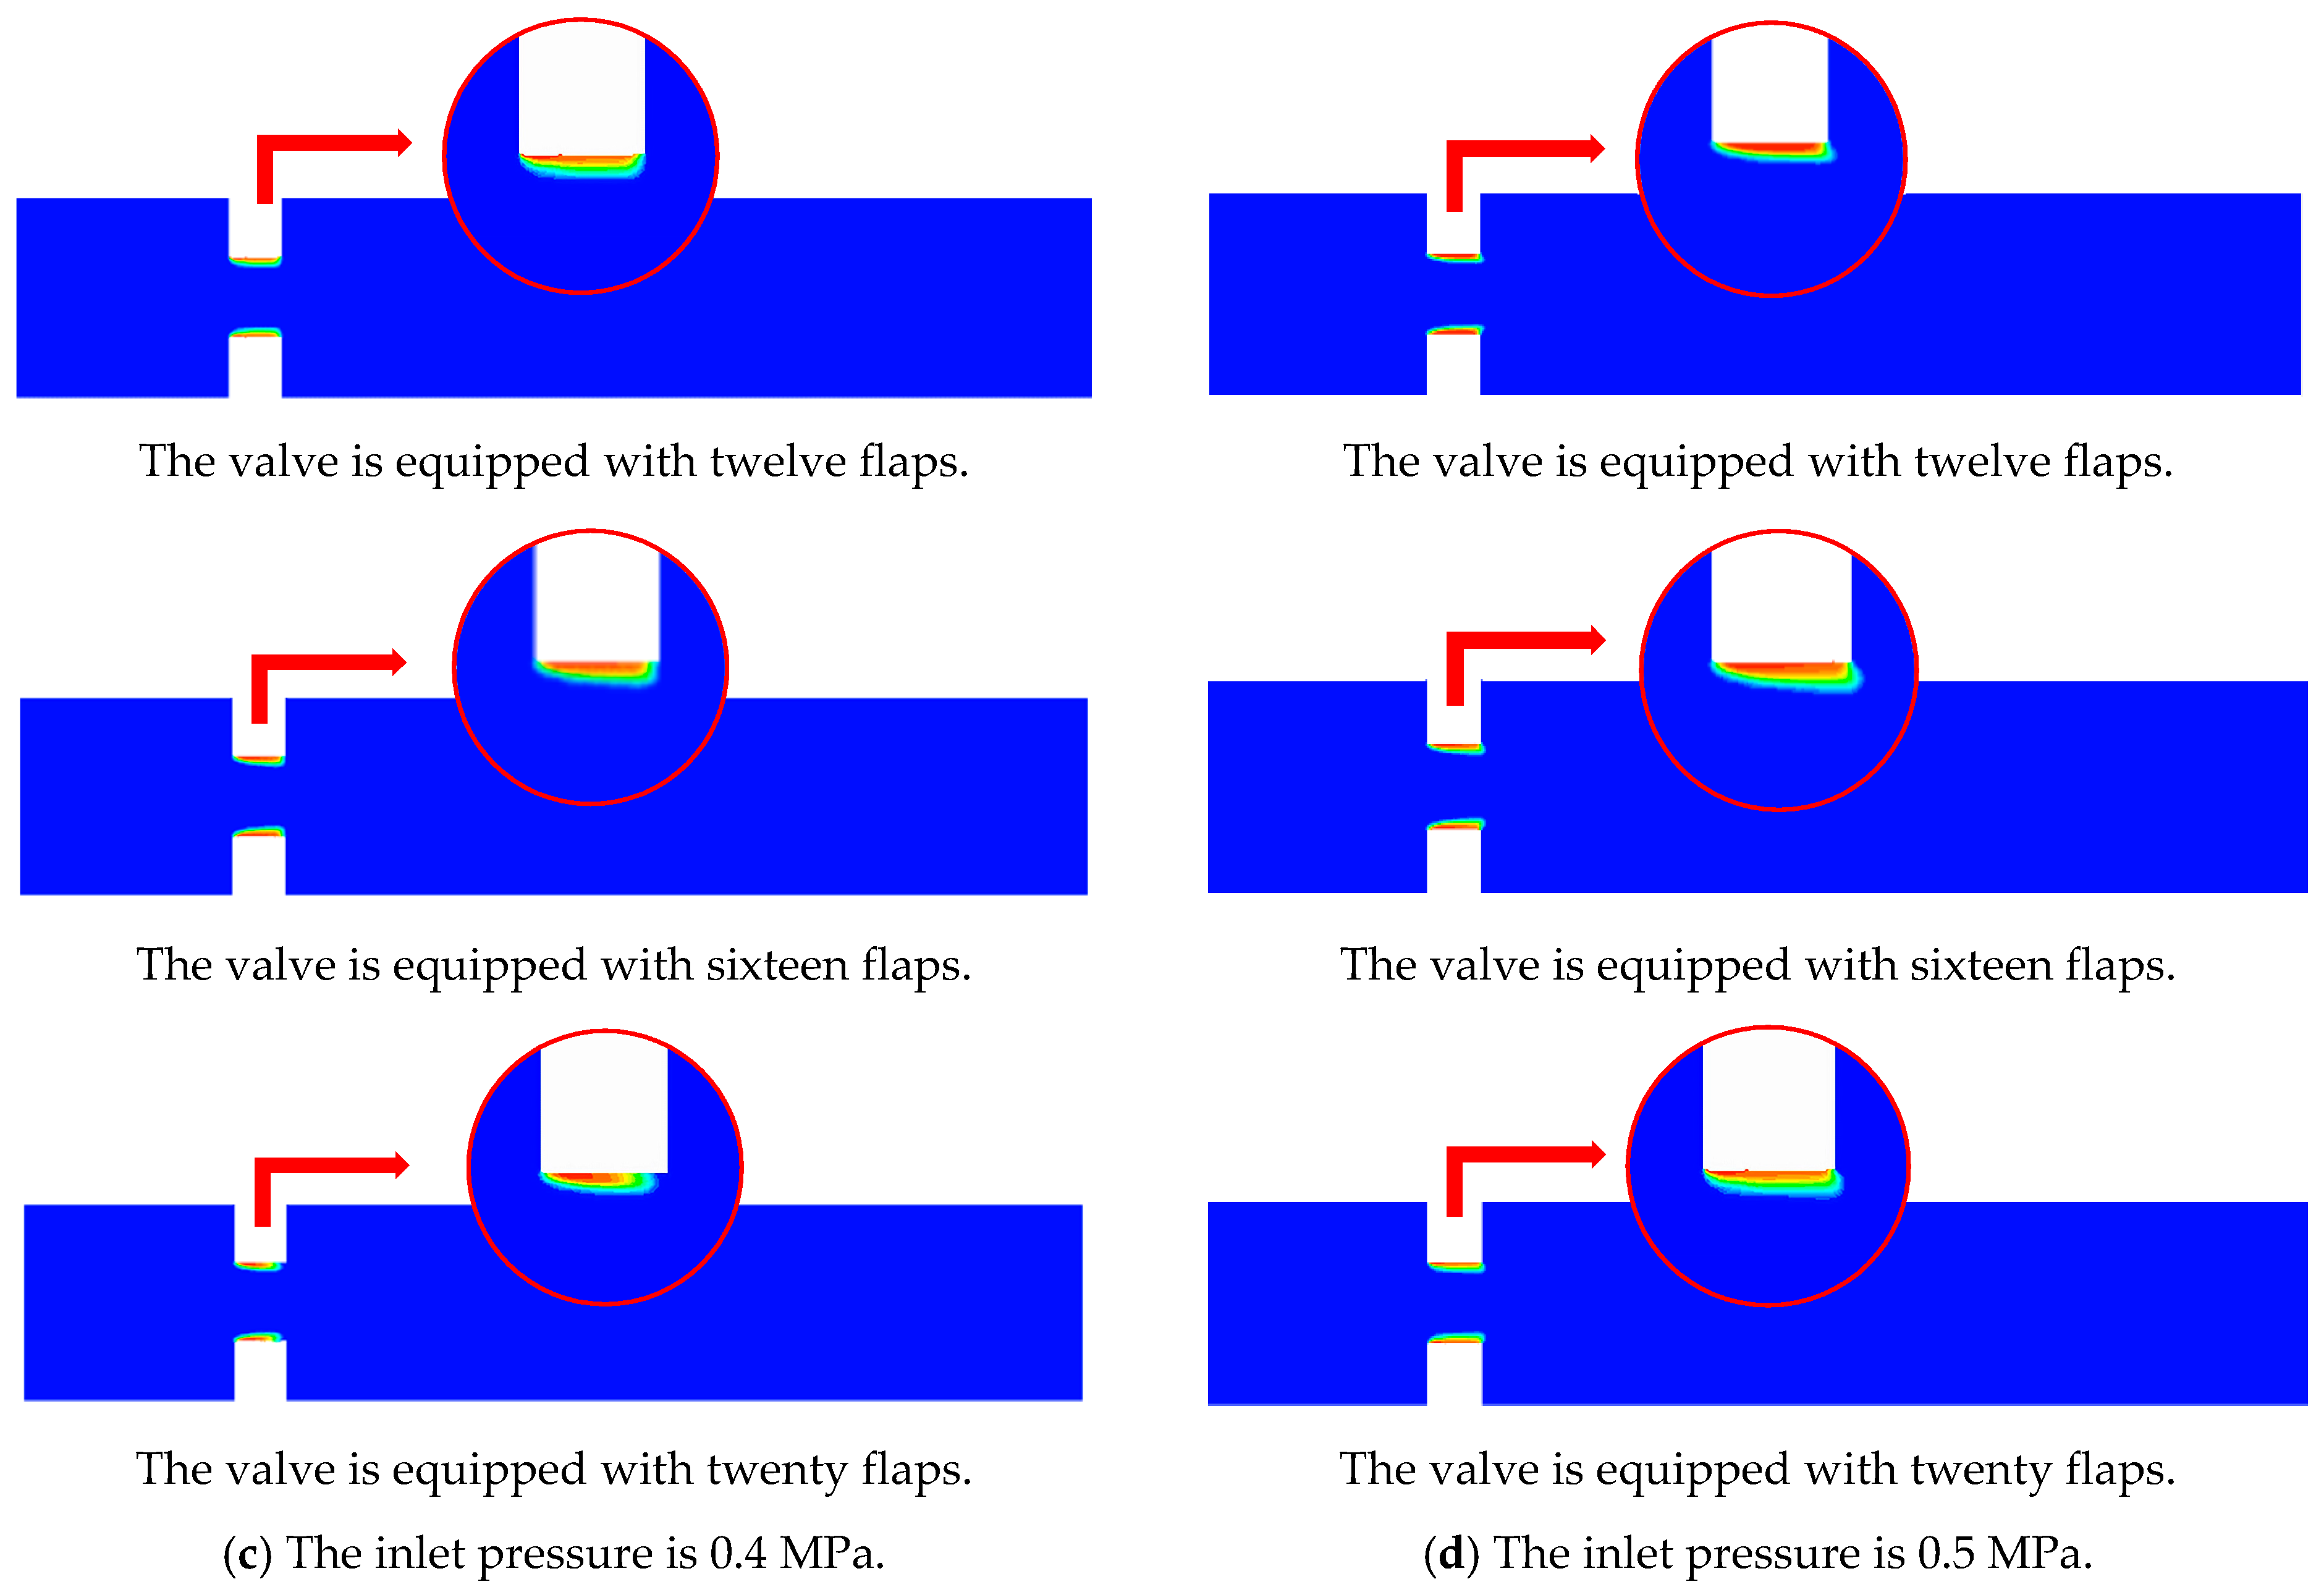
4.2. Gas Volume Fraction Distribution Patterns
The gas volume fraction distribution contours on the symmetry plane for different numbers of valve flaps are shown in
Figure 9. Under an inlet pressure of 0.2 MPa, the gas volume fraction distribution for different numbers of valve flaps exhibits bubble-free distributions, demonstrating the absence of cavitation inception under minimal pressure differential conditions across the valve assembly. When the inlet pressures are both 0.3 MPa, the gas volume fraction distribution contours in the flow domain reveal bubble formation at the valve. This region forms a low-pressure zone where bubbles precipitate. It can be observed that with an increasing number of valve flaps, the flow field at the valve becomes more stable, the range of bubble formation reduces, and the area of vaporization within the valve decreases. When the inlet pressure is increased to 0.4 MPa and 0.5 MPa, the area of the low-pressure region is larger compared to that at 0.3 MPa, but increasing the number of valve flaps still reduces the area of the low-pressure region. This indicates that increasing the number of valve flaps in the structural parameters, making the regular polygonal flow cross-section of the valve closer to a circular shape, can effectively reduce valve vaporization and improve cavitation resistance, consistent with the conclusions from the structural analysis. Increasing the number of valve discs has a practical upper limit for suppressing the occurrence of cavitation in the flow domain. However, due to constraints in materials, manufacturing processes, and valve size in practical production and daily use, the number of valve discs cannot be increased indefinitely. Therefore, it is necessary to maximize the number of valve discs within this practical upper limit to effectively suppress the occurrence of cavitation in the valve.
5. Influence of Valve Inlet and Outlet Shapes on Flow Conditions
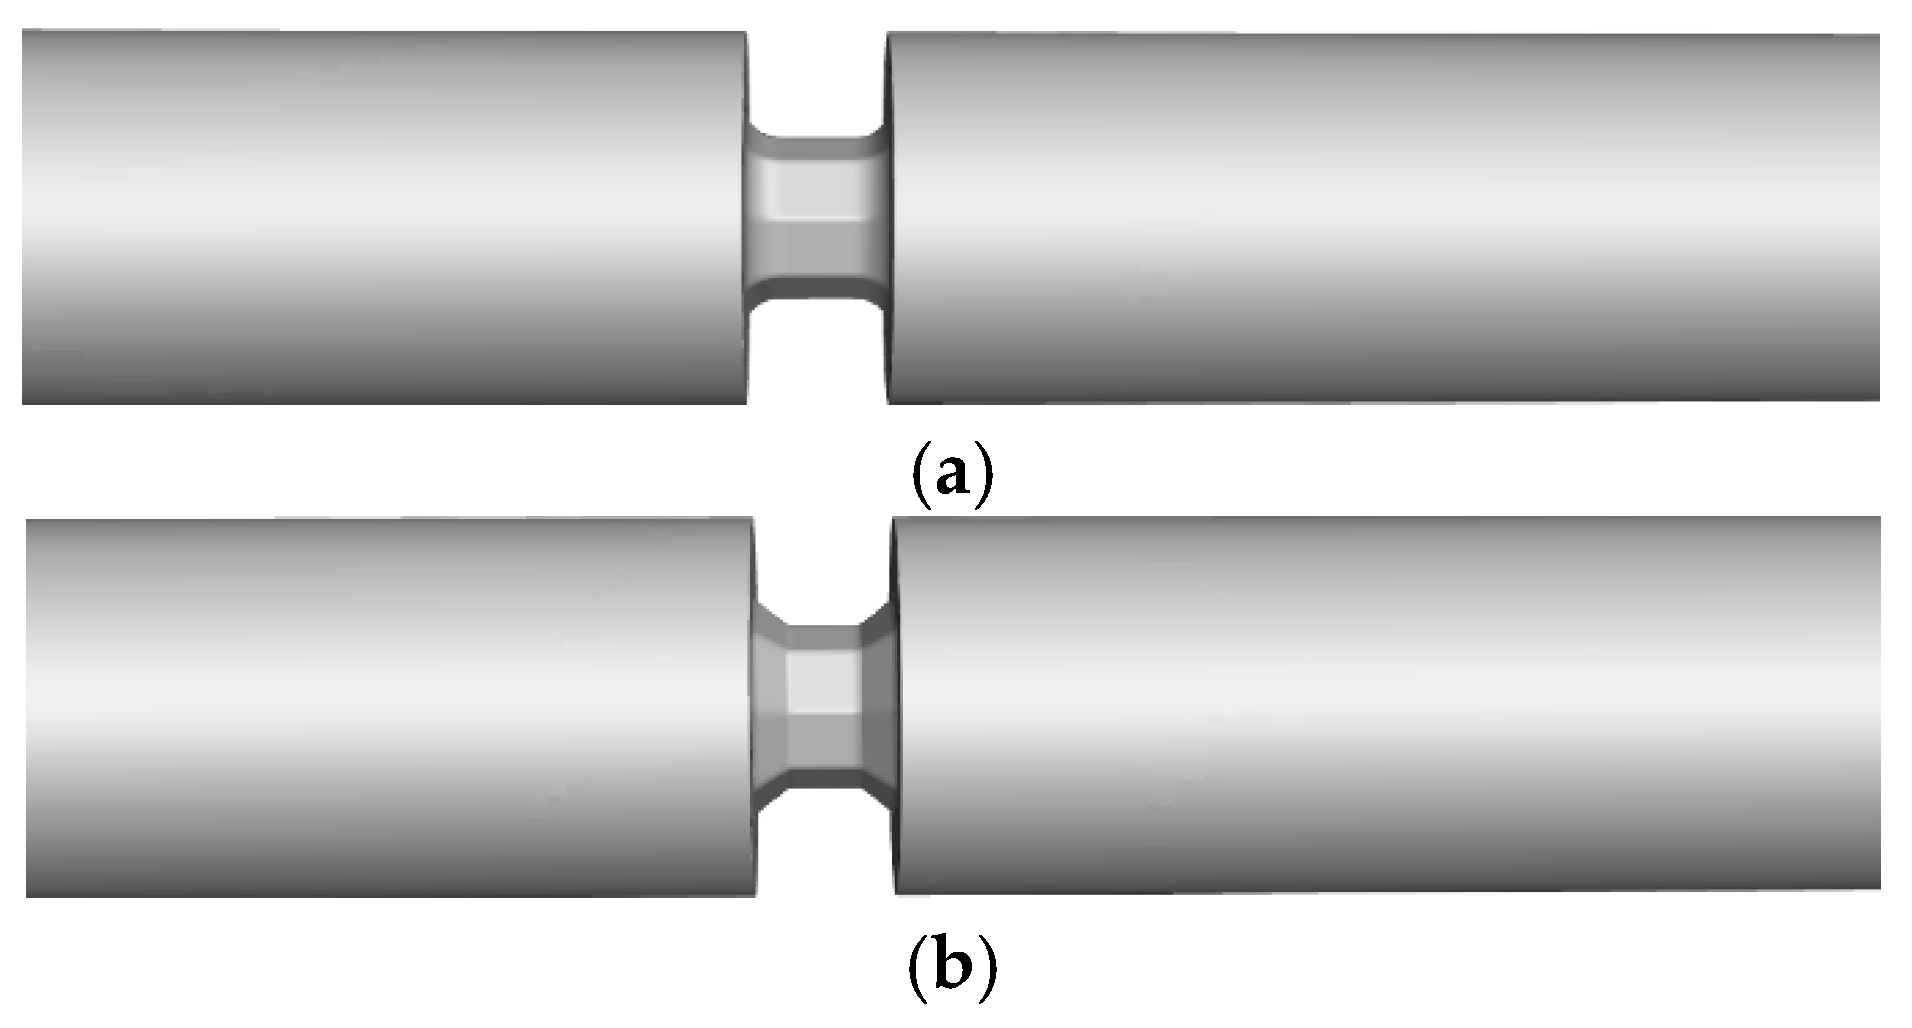
This study investigates the impact of altering the shapes of valve inlet and outlet structures on the flow characteristics of the valve. Set the number of valve flaps to 20 and control the valve opening at 15%. This section examines two specific configurations: (1) a rounded corner with a radius of 5 mm at the valve inlet and outlet, and (2) a chamfered edge with a 5 mm straight edge. The valve disc thickness is 20 mm, and the valve opening is set at 15%. Its structure is shown in
Figure 10.
5.1. Pressure Distribution Patterns
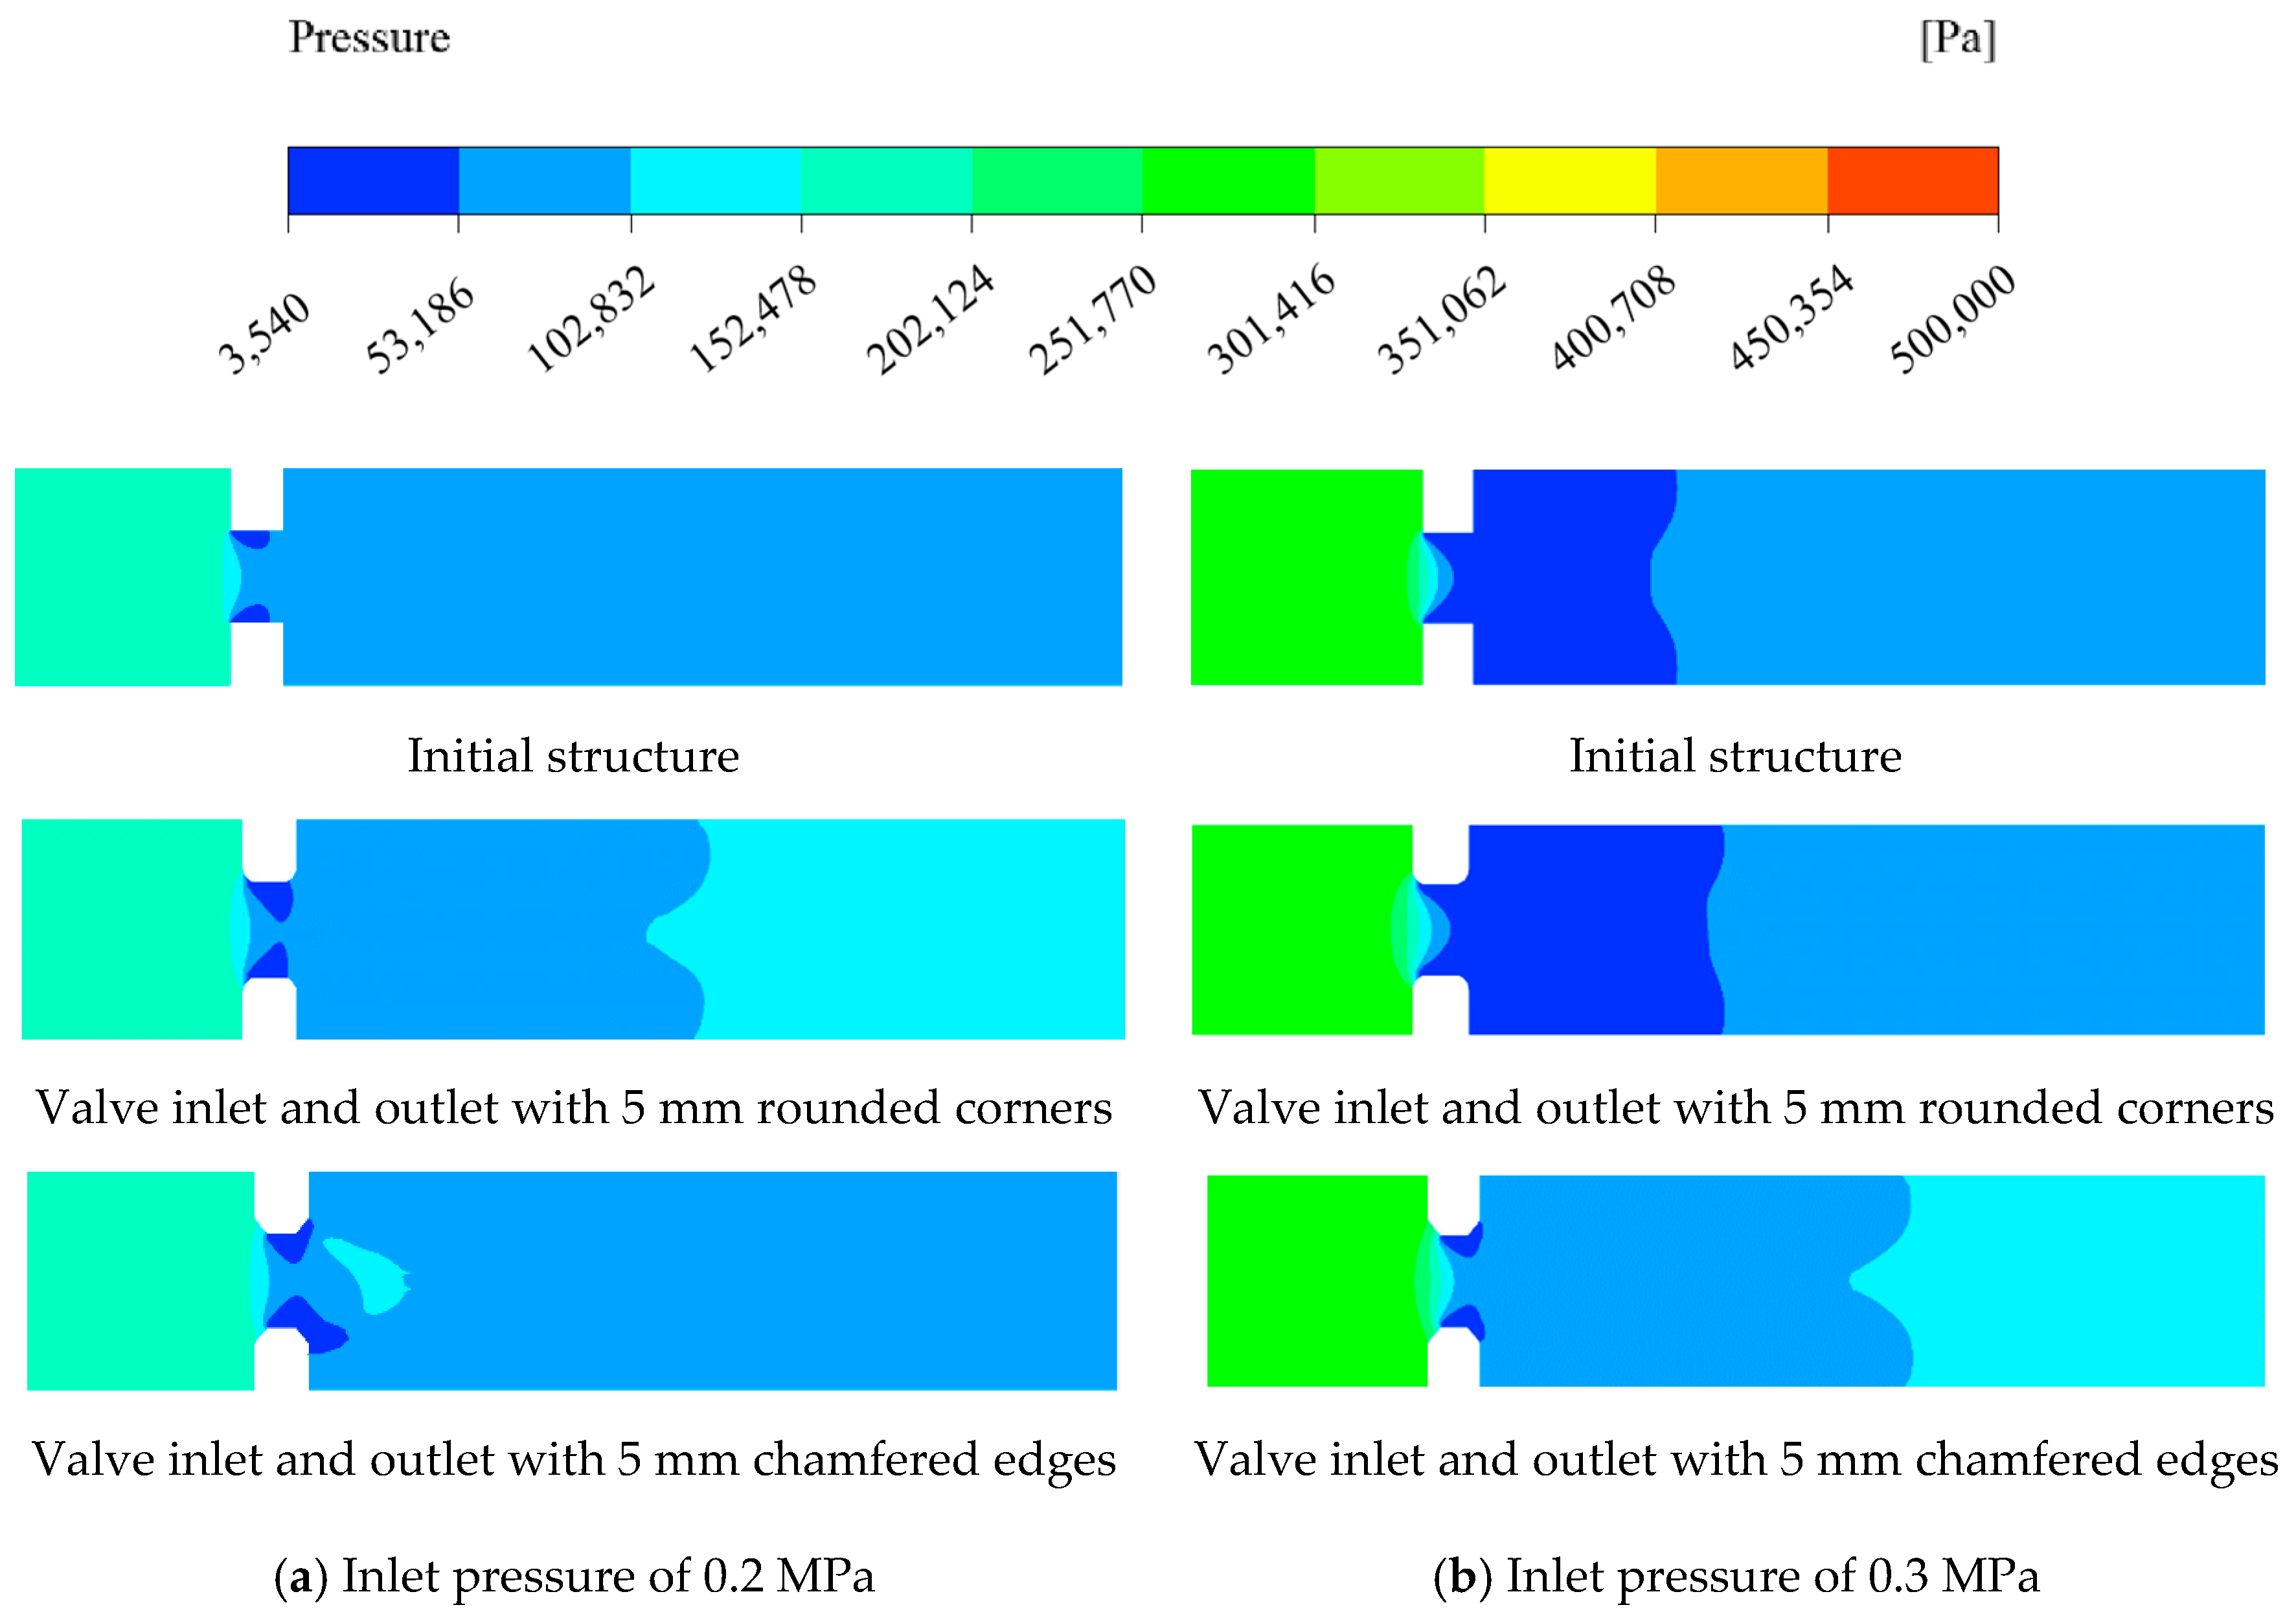
As shown in
Figure 11a, the changes in the valve inlet and outlet structures significantly impact the pressure field within the flow domain. Both the rounded and chamfered edges result in an enlarged low-pressure region at the valve. The pressure contour for the valve with rounded edges shows an annular low-pressure zone around the valve, protruding in the flow direction. In contrast, the pressure contour for the chamfered edge valve extends even further downstream of the valve. Compared to the initial structure, both the rounded- and chamfered-edge designs create a larger low-pressure region earlier, which can lead to cavitation at the valve. The modifications to the valve inlet and outlet shapes not only fail to mitigate the abrupt pressure changes in the flow domain but also increase the extent of the low-pressure region, resulting in a poorer pressure distribution in the valve flow field.
As shown in
Figure 11b, when the inlet pressure is increased to 0.3 MPa, the pressure distribution for the valve with rounded edges is more uniform compared to when the inlet pressure is 0.2 MPa. However, the low-pressure region shifts downstream relative to the initial structure, indicating a negative impact on the pressure field optimization in the valve flow domain. The pressure distribution of the chamfered-edge valve spreads to the back side of the valve, even in the low-pressure region at an inlet pressure of 0.3 MPa. Preliminary analysis of the pressure field suggests that the changes in both valve structures are not beneficial for optimizing the pressure field in the valve flow domain.
5.2. Gas Volume Fraction Distribution Patterns
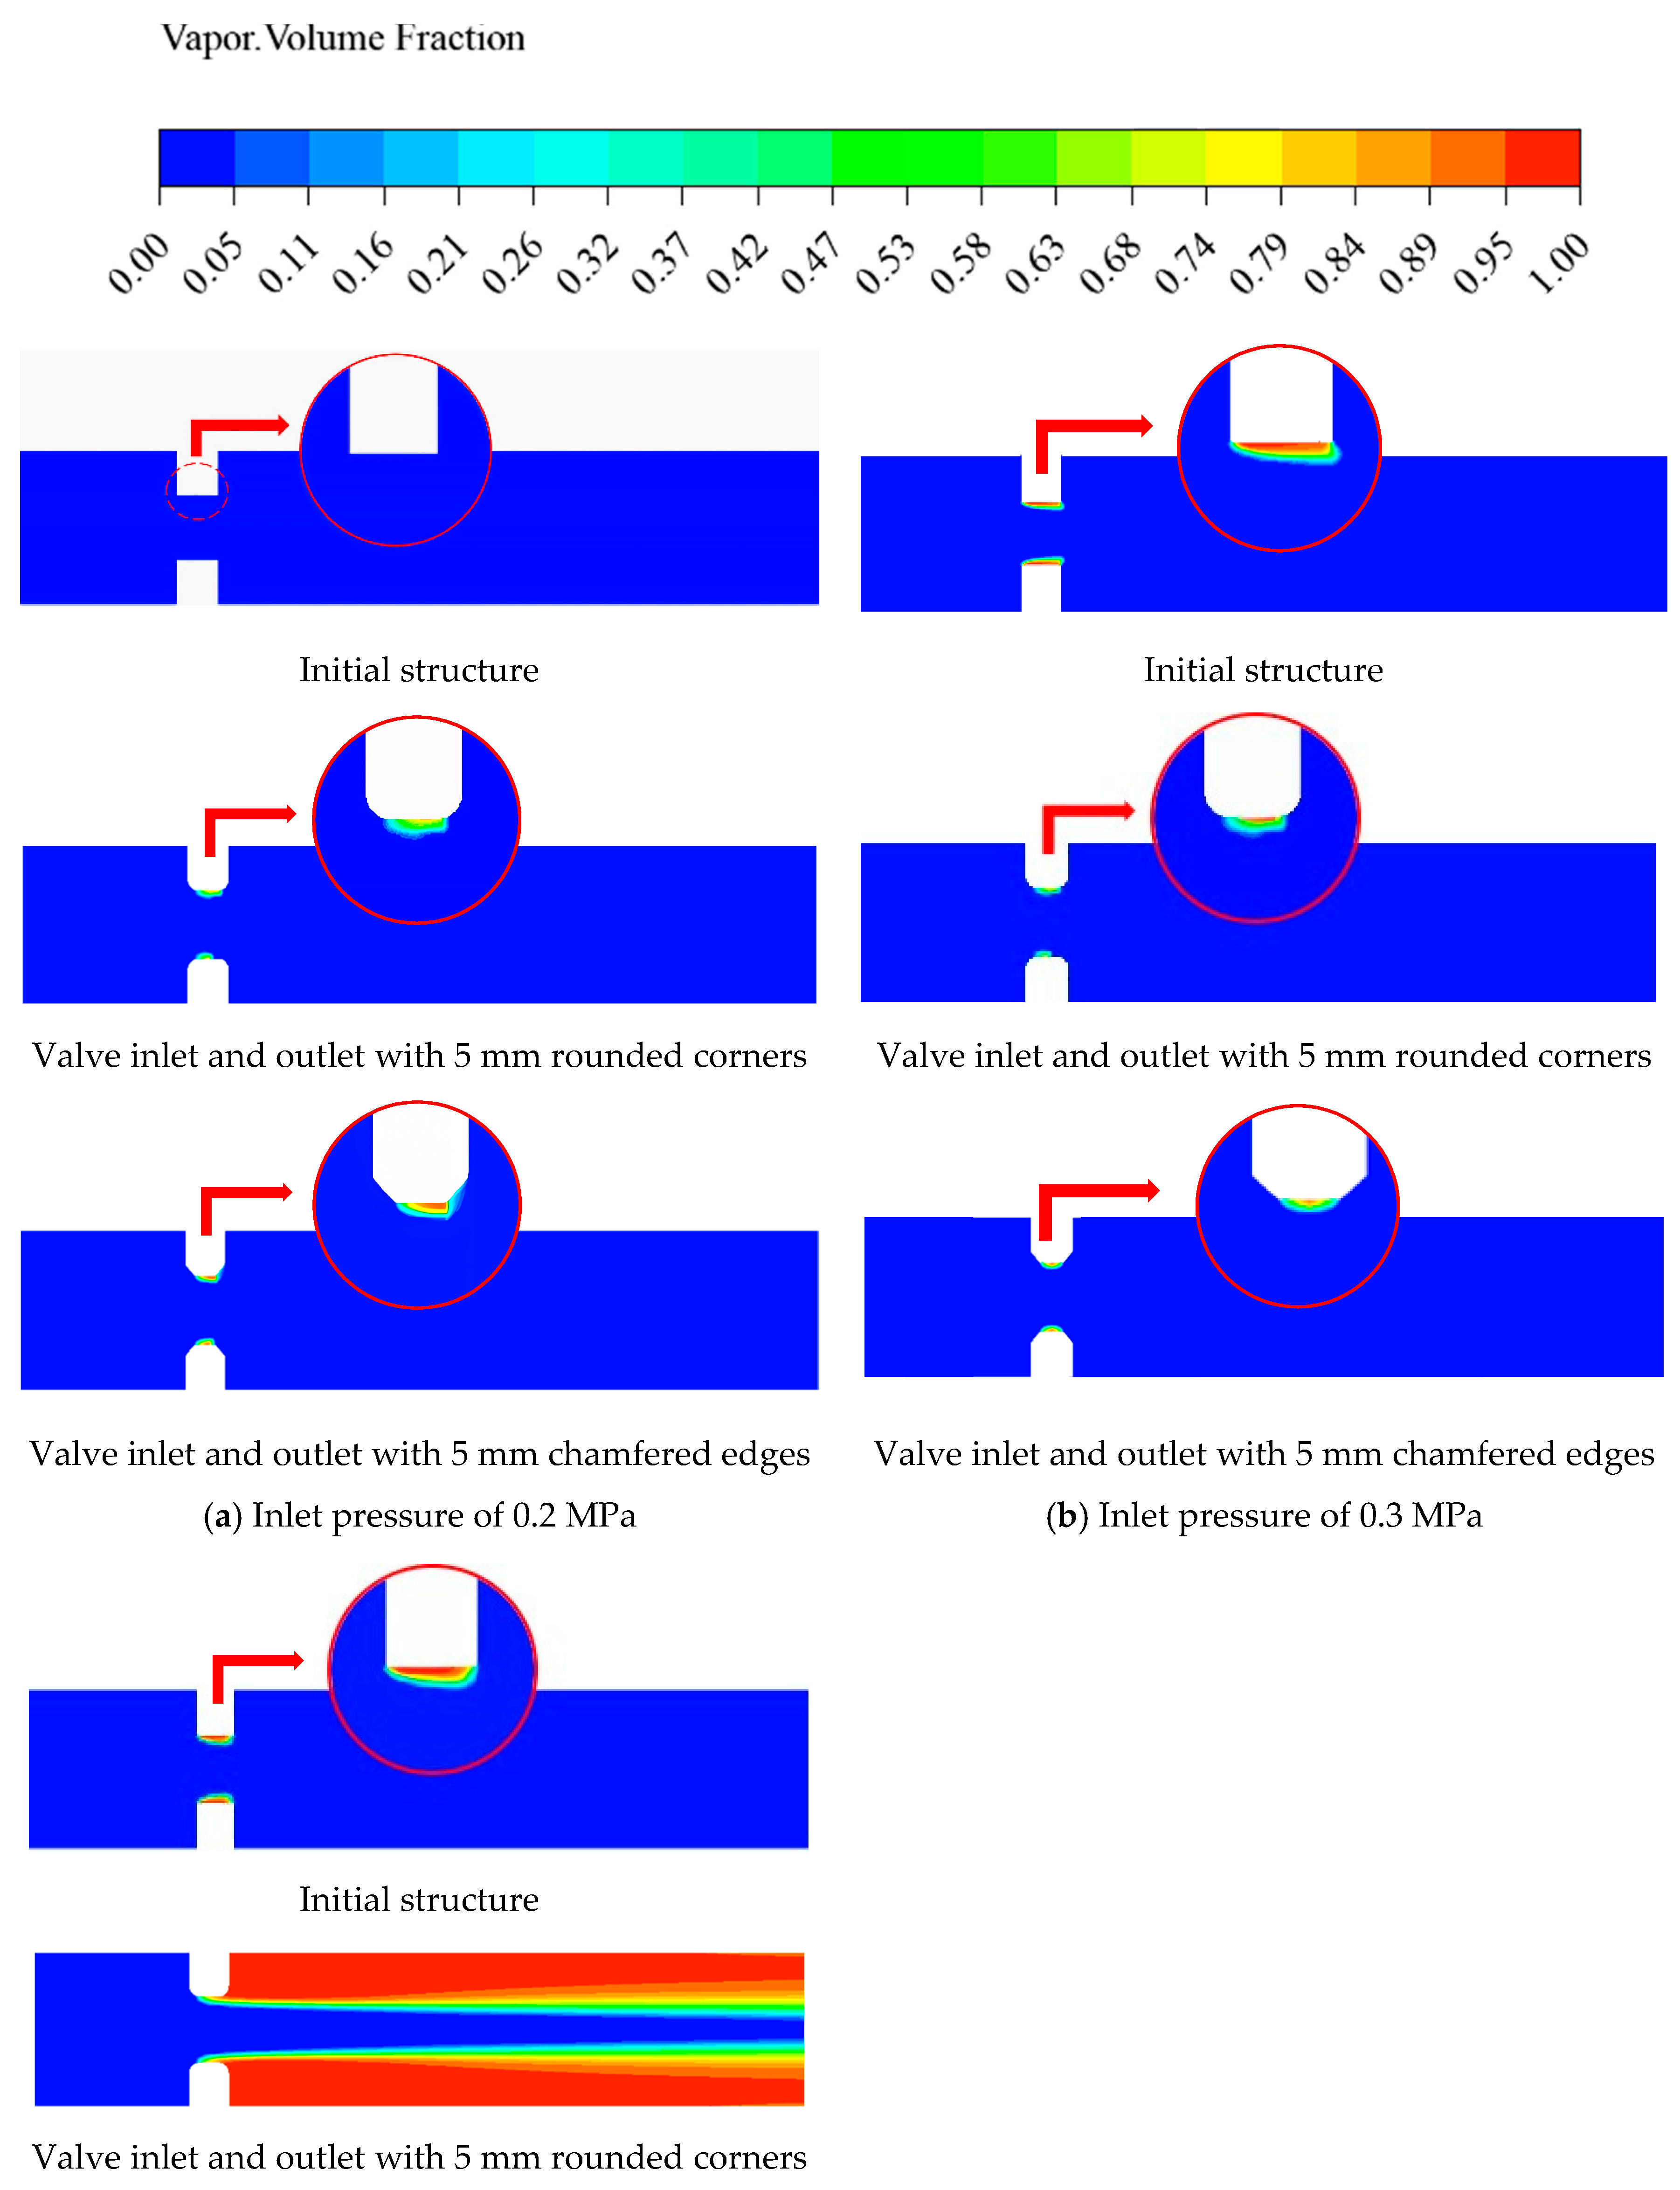
To investigate whether cavitation occurs in the low-pressure regions formed in the aforementioned structures, an analysis of the gas volume fraction was conducted.
As shown in
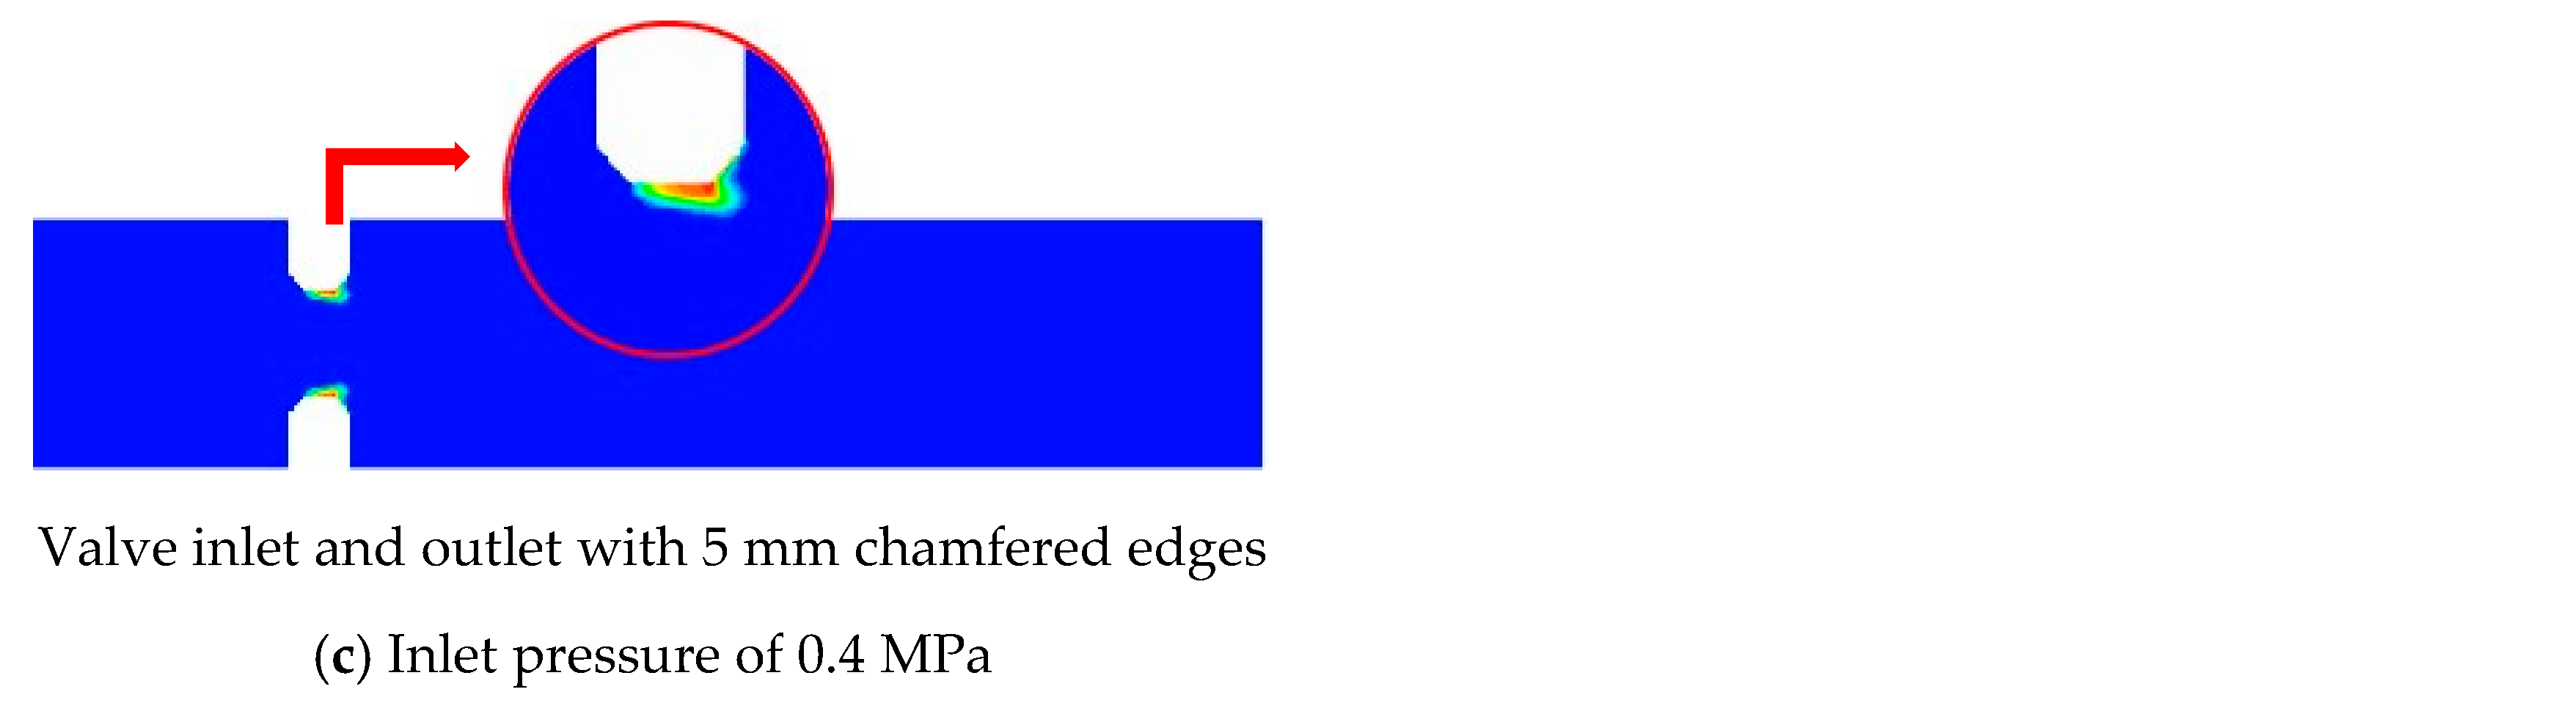
Figure 12a,b, changing the valve inlet and outlet shapes leads to bubble formation at the valve, whereas the initial structure does not exhibit significant bubble formation under this condition. This indicates that modifications to the valve structure do not improve the ability to suppress bubble formation at the flow cross-section or enhance cavitation resistance in the flow domain. To determine if this pattern holds under all conditions, the inlet pressure was changed to 0.4 MPa, as shown in
Figure 12c. It was observed that the valve with rounded inlet and outlet shapes generated a large number of bubbles inside and downstream of the valve, indicating severe cavitation. This structure has a negative effect on cavitation suppression and will not be discussed further in subsequent research.
Additionally, bubbles form at the valve for the remaining two structures, with the chamfered-edge structure exhibiting a smaller gas volume fraction range. Under this condition, the chamfered-edge structure at the valve inlet and outlet suppresses cavitation, contrary to the conclusion at an inlet pressure of 0.2 MPa. Comparing the gas volume fraction contour plots on the symmetry plane at different inlet pressures, the bubble growth is slower for the chamfered-edge structure. This indicates that, although cavitation occurs earlier than in the initial structure, the gas volume fraction changes more slowly with increasing inlet pressure, effectively suppressing cavitation within the flow domain.
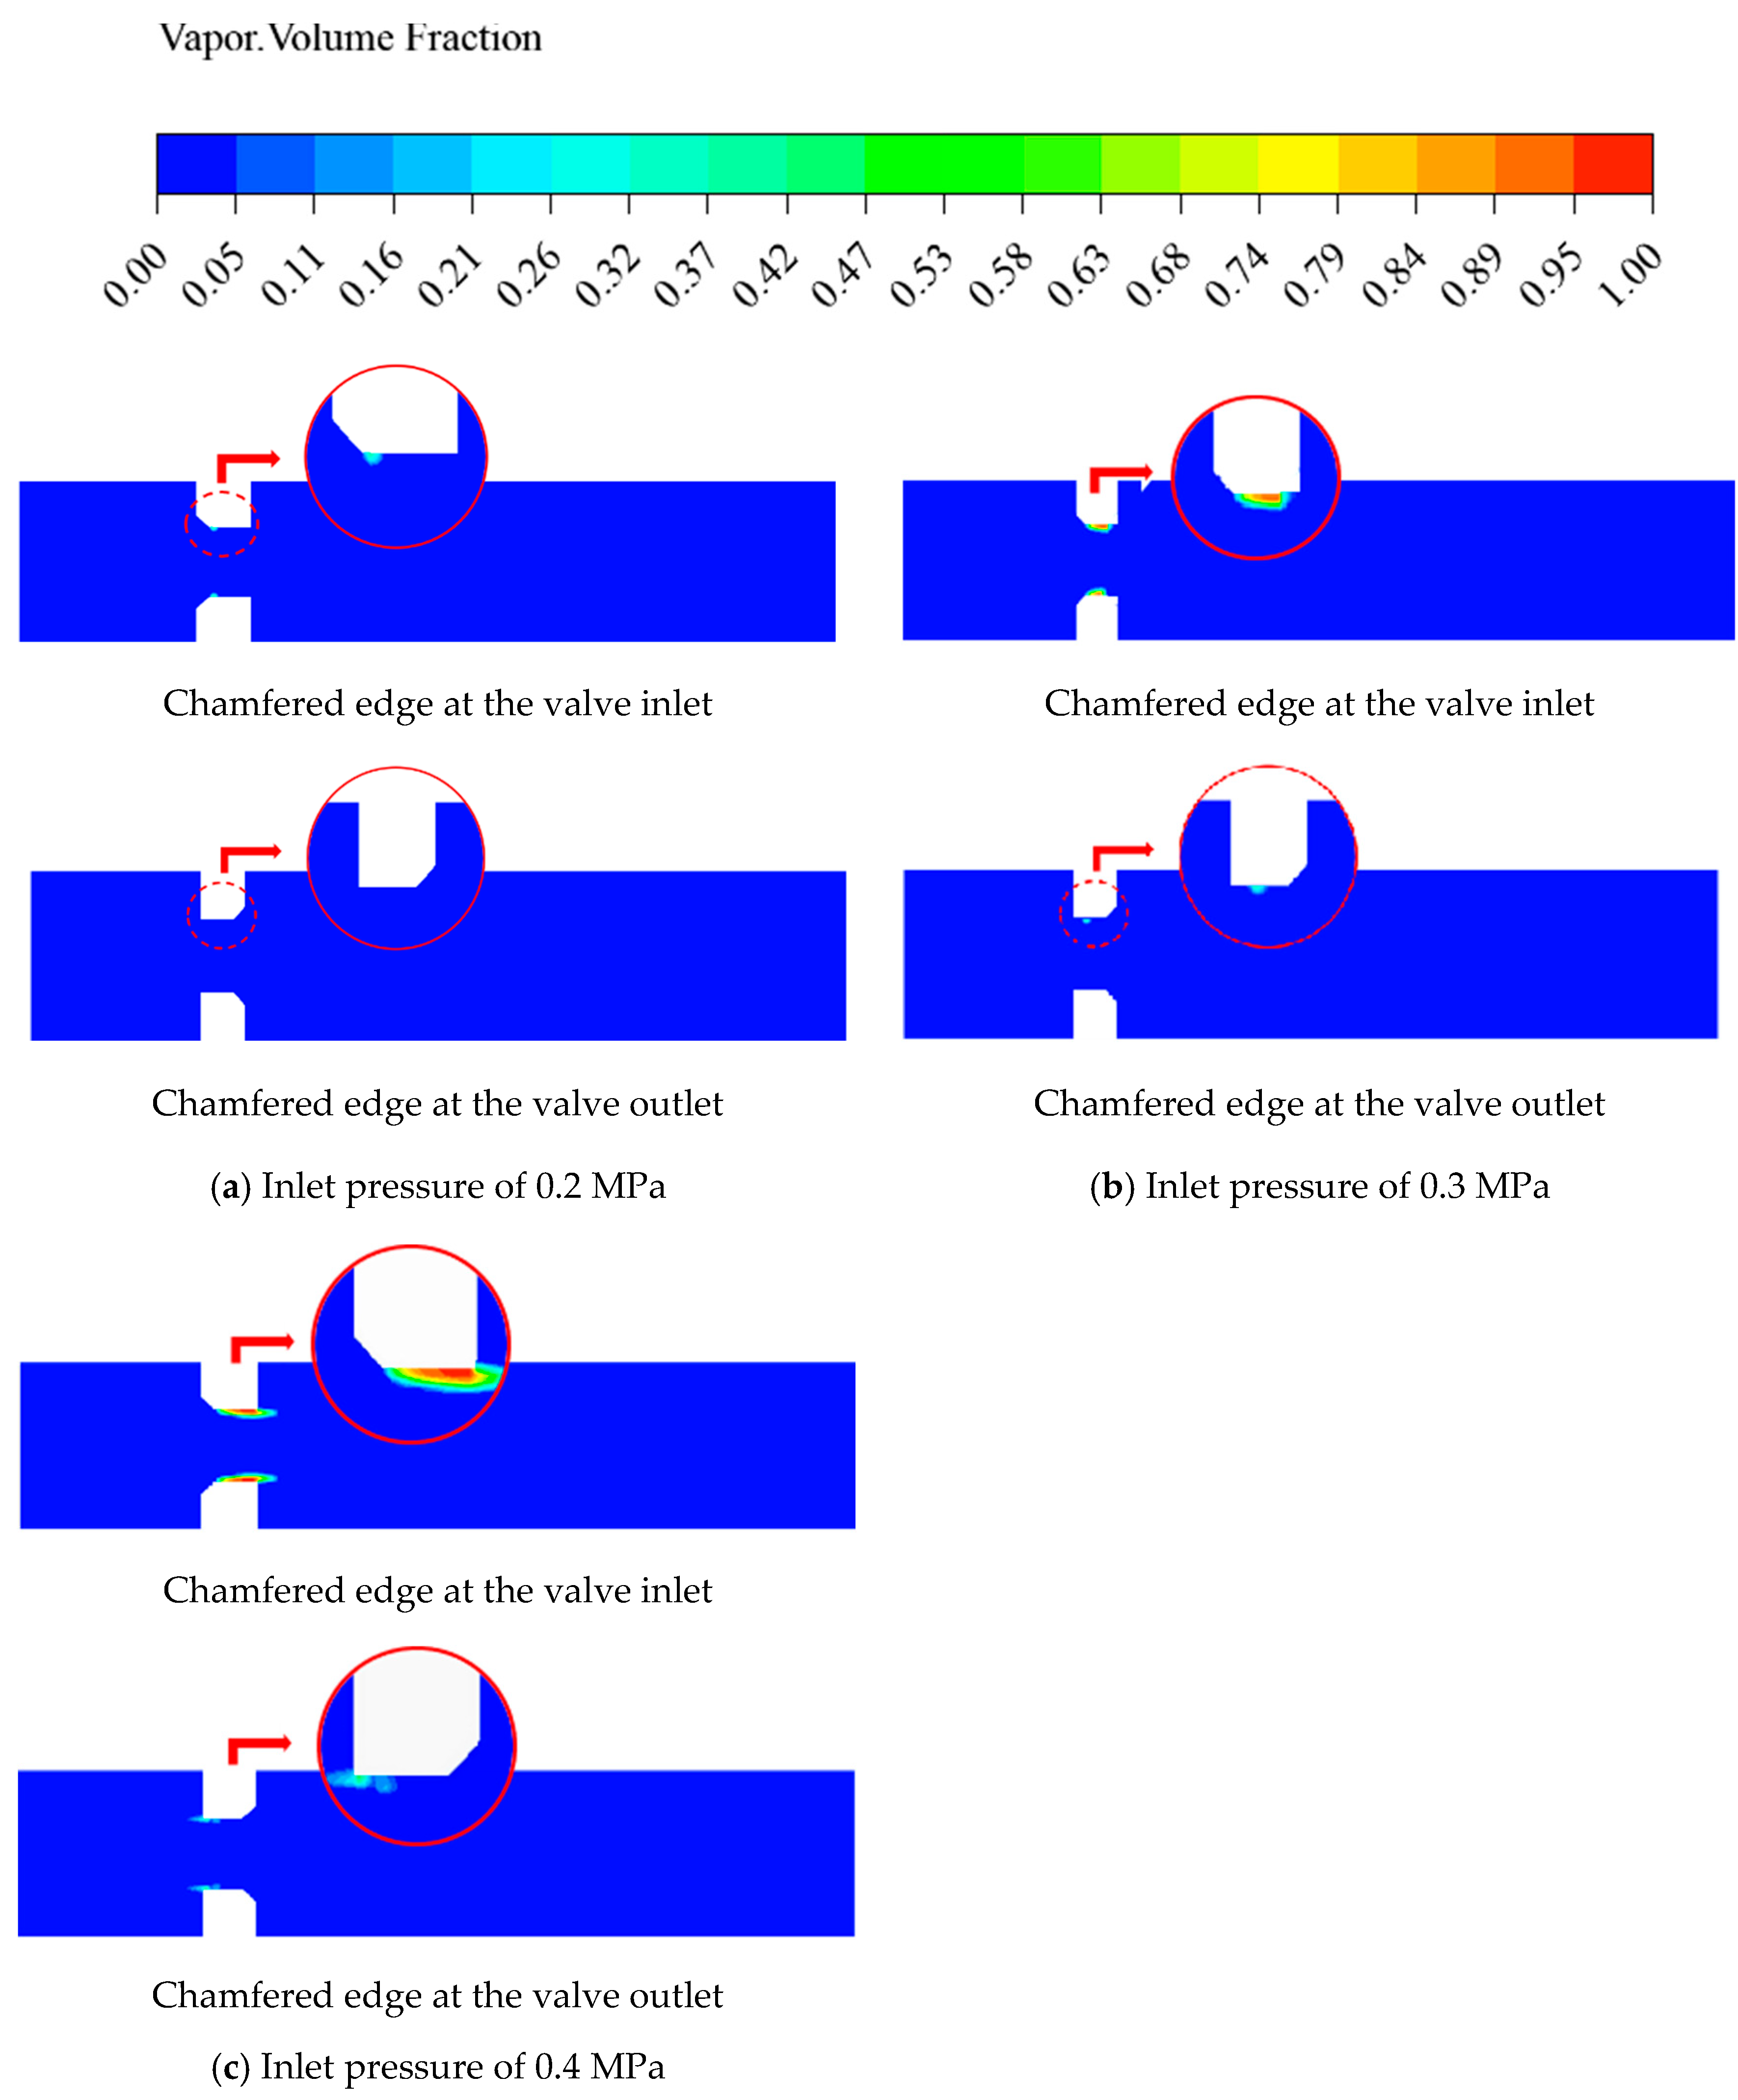
5.3. Influence of Chamfered Structures at Different Positions on Flow Conditions
To investigate the optimization effect of chamfered structures on the stability of the flow domain, further studies on the structures were conducted. Two designs were created: one with a 5 mm chamfer at the inlet only and another with a 5 mm chamfer at the outlet only.
To investigate the individual effects of these two structures on cavitation phenomena within the flow domain, numerical simulations were conducted. The inlet pressures were set at 0.2 MPa and 0.4 MPa, respectively, with an outlet pressure of 0.095 MPa.
Figure 13a shows the gas volume fraction distribution contours on the symmetry plane for a valve with an inlet pressure of 0.2 MPa. Both structures exhibit lower gas volume fractions compared to the previously discussed structure with chamfered edges at both the inlet and outlet. The gas volume fraction for the structure with a chamfered outlet is nearly zero, showing little difference from the initial structure and indicating a suppressive effect on cavitation within the valve. For the two aforementioned structures, the gas volume fraction contour plot for the chamfered inlet structure shows a small amount of bubble formation at the valve, but the bubble content is very low and has no impact on the downstream flow domain. Therefore, both structures improve cavitation suppression compared to the structure with chamfered edges at both the inlet and outlet, with the chamfered outlet structure demonstrating better cavitation resistance than the chamfered inlet structure.
Figure 13b,c present the gas volume fraction distribution contours on the symmetry plane for a valve with an inlet pressure of 0.3 Mpa and 0.4 Mpa. The gas volume fraction for the chamfered inlet structure is not significantly different from the initial structure. Combined with the results at lower inlet pressure, the chamfered inlet structure shows limited improvement in cavitation suppression and insufficient control over flow domain stability, theoretically failing to meet the design requirements. In contrast, the chamfered outlet structure exhibits stronger cavitation suppression compared to both the initial structure and the chamfered inlet structure. The contour plot shows that this structure generates bubbles only in a small region at the front end of the valve, with a very low bubble content, indicating superior cavitation resistance.
6. Conclusions
Valves, as crucial components in fluid systems, play an essential role in regulating flow rates and altering pressure within the flow domain. However, the regulation process often involves abrupt changes in flow area, leading to cavitation at the valve. To mitigate cavitation phenomena in valves, this study conducted the following research:
(1) Design of a new cavitation control valve with a circular flow cross-section.
A new cavitation control valve was designed with a circular flow cross-section. The causes of errors in traditional cavitation control valves during cavitation experiments were analyzed, and the design principles of the new cavitation control valve were introduced. The new valve consists of multiple identical valve flaps, maintaining a consistent and nearly circular flow cross-section. This design allows the fluid to pass through the valve more smoothly, reducing energy loss and achieving a more uniform velocity distribution; this reduces the impact of the valve on the experiment when conducting vapor corrosion experiments.
(2) Investigation of the impact of valve flap quantity on flow conditions.
The influence of the number of valve flaps on flow conditions was explored. When the inlet–outlet pressure differential is small, increasing the number of valve flaps significantly reduces the range of bubble formation and the area of cavitation within the valve. As the pressure differential increases, the suppression effect on cavitation within the valve flow domain is not as pronounced as at lower-pressure differentials, but the influence on cavitation suppression remains. Increasing the number of valve flaps makes the valve flow cross-section closer to circular, enhancing the valve’s cavitation resistance, although the practical upper limit of the flap number should be considered.
(3) Investigation of the impact of valve inlet and outlet shapes on flow conditions.
Both rounded and beveled shapes at the inlet and outlet prematurely generate extensive low-pressure areas, with an enlargement of the low-pressure zone at the valve itself, adversely affecting cavitation resistance. Compared to the beveled structure at the inlet, the beveled structure at the outlet, when combined with beveled structures at both the inlet and outlet, enhances the suppression of vaporization. Notably, the beveled outlet structure, with increasing inlet pressure, results in a lower bubble content, more stable flow field, and stronger cavitation resistance.
Author Contributions
Software, Y.L.; validation, Y.L.; formal analysis, Z.W. and P.Q.; investigation, Z.L.; resources, J.M.; data curation, Z.W. and L.C.; writing—original draft, Y.L.; writing—review and editing, Y.L.; visualization, Z.L.; project administration, J.M. All authors have read and agreed to the published version of the manuscript.
Funding
This research was funded by the National Natural Science Foundation of China grant number 52479090 And The APC was funded by Jiegang Mou.
Data Availability Statement
The datasets presented in this article are not readily available because the data are part of an ongoing study. Requests to access the datasets should be directed to mjg@cjlu.edu.cn.
Conflicts of Interest
The authors declare that they have no known competing financial interests or personal relationships that could have appeared to influence the work reported in this paper.
References
- Lu, P.W. Beginner and Proficient in Valve Design; China Machine Press: Beijing, China, 2009. [Google Scholar]
- Li, S.X.; Zheng, M.X.; Wang, Y.X.; Yang, L.X.; Zhang, B.H.; Zhang, J.Z. Research on transient heat transfer of ball valves in high-pressure liquid hydrogen receiving stations. Results Eng. 2023, 19, 101285. [Google Scholar] [CrossRef]
- Zhao, L.; Wu, J.Y.; Jin, Z.J.; Qian, J.Y. Cavitation effect on flow resistance of sleeve regulating valve. Flow Meas. Instrum. 2022, 88, 102259. [Google Scholar] [CrossRef]
- Amirante, R.; Distaso, E.; Tamburrano, P. Experimental and numerical analysis of cavitation in hydraulic proportional directional valves. Energy Convers. Manag. 2014, 87, 208–219. [Google Scholar] [CrossRef]
- Liu, B.; Zhao, J.G.; Qian, J.H. Numerical analysis of cavitation erosion and particle erosion in butterfly valve. Eng. Fail. Anal. 2017, 80, 312–324. [Google Scholar] [CrossRef]
- Gu, Y.Q.; Zhang, J.J.; Yu, S.W.; Mou, C.Q.; Li, Z.; He, C.D.; Wu, D.H.; Mou, J.G.; Ren, Y. Unsteady numerical simulation method of hydrofoil surface cavitation. Int. J. Mech. Sci. 2022, 228, 107490. [Google Scholar] [CrossRef]
- Qu, W.S.; Tan, L.; Cao, S.L.; Xu, Y.; Huang, J.; Xu, Q.H. Experiment and numerical simulation of cavitation performance on a pressure-regulating valve with different openings. IOP Conf. Ser. Mater. Sci. Eng. 2015, 72, 042035. [Google Scholar] [CrossRef]
- Couzinet, A.; Gros, L.; Pinho, J.; Chabane, S.; Pierrat, D. Numerical modeling of turbulent cavitation flows in safety relief valves. In Proceedings of the Pressure Vessels and Piping Conference, Anaheim, CA, USA, 20–24 July 2014; American Society of Mechanical Engineers: New York, NY, USA, 2014. [Google Scholar]
- Trivedi, V.; Farah, A.; Harvel, G. Effects of cavitation damage on the hydraulic characteristics of a gate valve. In Proceedings of the ASME Power Conference, Boston, MA, USA, 29 July–1 August 2013; American Society of Mechanical Engineers: New York, NY, USA, 2013. [Google Scholar]
- Sun, X.; Kim, H.S.; Yang, S.D.; Kim, C.K.; Yoon, J.Y. Numerical investigation of the effect of surface roughness on the flow coefficient of an eccentric butterfly valve. J. Mech. Sci. Technol. 2017, 31, 2839–2848. [Google Scholar] [CrossRef]
- Gu, Y.Q.; Yu, L.Z.; Mou, J.G.; Shi, Z.Z.; Yan, M.H.; Wu, D.H. Influence of circular non-smooth structure on cavitation damage characteristics of centrifugal pump. J. Braz. Soc. Mech. Sci. Eng. 2022, 44, 155. [Google Scholar] [CrossRef]
- Gholami, H.; Yaghoubi, H.; Alizadeh, M. Numerical analysis of cavitation phenomenon in a vaned ring-type needle valve. J. Energy Eng. 2015, 141, 04014053. [Google Scholar] [CrossRef]
- Kapranova, A.B.; Lebedev, A.E.; Gudanov, I.S.; Meltzer, A.M.; Makarenkov, D.A. Experimental Study of Sizewise Cavitation Bubbles Distribution in Flow Channel of Control Valve with a Butterfly Gate. Chem. Pet. Eng. 2022, 58, 630–636. [Google Scholar] [CrossRef]
- Lee, M.G.; Lim, C.S.; Han, S.H. Shape design of the bottom plug used in a 3-way reversing valve to minimize the cavitation effect. Int. J. Precis. Eng. Manuf. 2016, 17, 401–406. [Google Scholar] [CrossRef]
- Liu, Y.H.; Ji, X.W. Simulation of cavitation in rotary valve of hydraulic power steering gear. Sci. China Ser. E Technol. Sci. 2009, 52, 3142–3148. [Google Scholar] [CrossRef]
- Wang, C.; Li, G.X.; Sun, Z.Y.; Wang, L.; Sun, S.P.; Gu, J.J.; Wu, X.J. Effects of structure parameters on flow and cavitation characteristics within control valve of fuel injector for modern diesel engine. Energy Convers. Manag. 2016, 124, 104–115. [Google Scholar] [CrossRef]
- Aung, N.Z.; Li, S.J. A numerical study of cavitation phenomenon in a flapper-nozzle pilot stage of an electrohydraulic servo-valve with an innovative flapper shape. Energy Convers. Manag. 2014, 77, 31–39. [Google Scholar] [CrossRef]
- Yang, Q.J.; Aung, N.Z.; Li, S.J. Confirmation on the effectiveness of rectangle-shaped flapper in reducing cavitation in flapper–nozzle pilot valve. Energy Convers. Manag. 2015, 98, 184–198. [Google Scholar] [CrossRef]
- Liu, Y.S.; Huang, Y.; Li, Z.Y. Experimental investigation of flow and cavitation characteristics of a two-step throttle in water hydraulic valves. Proc. Inst. Mech. Eng. Part A J. Power Energy 2002, 216, 105–111. [Google Scholar] [CrossRef]
- Wu, T.X.; Wu, D.H.; Gao, S.Y.; Song, Y.; Ren, Y.; Mou, J.G. Multi-objective optimization and loss analysis of multistage centrifugal pumps. Energy 2023, 284, 128638. [Google Scholar] [CrossRef]
- Shi, W.J.; Cao, S.P.; Luo, X.H.; Zhang, Z.T.; Zhu, Y.Q. Experimental research on the cavitation suppression in the water hydraulic throttle valve. J. Press. Vessel Technol. 2017, 139, 051302. [Google Scholar]
- An, W.; Ren, L.; Bai, Y.Y.; Bao, G. Numerical simulation of the temperature rise and cavitation flow in a hydraulic slide valve. Flow Meas. Instrum. 2024, 96, 102553. [Google Scholar] [CrossRef]
- Han, M.X.; Liu, Y.S.; Wu, D.F.; Zhao, X.F.; Tan, H.J. A numerical investigation in characteristics of flow force under cavitation state inside the water hydraulic poppet valves. Int. J. Heat Mass Transf. 2017, 111, 1–16. [Google Scholar] [CrossRef]
- Zheng, Z.J.; Ou, G.F.; Ye, H.J.; Jin, H.Z. Numerical analysis on cavitation erosion of a high pressure differential control valve. In Proceedings of the Pressure Vessels and Piping Conference, Vancouver, BC, Canada, 17–21 July 2016; American Society of Mechanical Engineers: New York, NY, USA, 2016. [Google Scholar]
- Ou, G.F.; Xu, J.; Li, W.Z.; Chen, B. Investigation on cavitation flow in pressure relief valve with high pressure differentials for coal liquefaction. Procedia Eng. 2015, 130, 125–134. [Google Scholar] [CrossRef]
- Gao, H.; Lin, W.; Tsukiji, T. Investigation of cavitation near the orifice of hydraulic valves. Proc. Inst. Mech. Eng. Part G J. Aerosp. Eng. 2006, 220, 253–265. [Google Scholar] [CrossRef]
- Qian, J.Y.; Liu, B.Z.; Jin, Z.J.; Wang, J.K.; Zhang, H.; Lu, A.L. Numerical analysis of flow and cavitation characteristics in a pilot-control globe valve with different valve core displacements. J. Zhejiang Univ.-Sci. A 2016, 17, 54–64. [Google Scholar] [CrossRef]
- Adamkowski, A.; Lewandowski, M. Cavitation characteristics of shutoff valves in numerical modeling of transients in pipelines with column separation. J. Hydraul. Eng. 2015, 141, 04014077. [Google Scholar] [CrossRef]
- Wang, G.; Deng, J.F.; Kou, L.Y.; Wang, W.H.; Gao, Q.F.; Zhu, J. Study on the influence of structural parameters on the flow and cavitation characteristics of tandem multi-stage pressure-reducing valves. Flow Meas. Instrum. 2022, 87, 102230. [Google Scholar]
| Disclaimer/Publisher’s Note: The statements, opinions and data contained in all publications are solely those of the individual author(s) and contributor(s) and not of MDPI and/or the editor(s). MDPI and/or the editor(s) disclaim responsibility for any injury to people or property resulting from any ideas, methods, instructions or products referred to in the content. |
© 2025 by the authors. Licensee MDPI, Basel, Switzerland. This article is an open access article distributed under the terms and conditions of the Creative Commons Attribution (CC BY) license (https://creativecommons.org/licenses/by/4.0/).


