Article

Soil Physical–Hydraulic Properties in Different Rotational Silvopastoral Systems: A Short-Term Study

by
Osvaldo Viu Serrano Junior
1,2,
Zigomar Menezes de Souza
1,
Diego Alexander Aguilera Esteban
1,*,
Leila Pires Bezerra
1,
Euriana Maria Guimarães
1,
Renato Paiva de Lima
1,
Cácio Luiz Boechat
3 and
Reginaldo Barboza da Silva
4
1
School of Agricultural Engineering, Universidade Estadual de Campinas (UNICAMP), Av. Cândido Rondon, 508, Campinas 13083-875, São Paulo, Brazil
2
Rizoma Agro, Rua Natingui, 442, 107/108, São Paulo 05443-000, São Paulo, Brazil
3
Agronomy Collegiate, Federal University of Piauí (UFPI), Campus Professora Cinobelina Elva, Rodovia Bom Jesus–Viana, Km 01, S/N, Planalto Horizonte, Bom Jesus 64900-000, Piauí, Brazil
4
Faculty of Agricultural Sciences of Vale do Ribeira, State University of São Paulo (UNESP), Campus Registro, Registro 11900-000, São Paulo, Brazil
*
Author to whom correspondence should be addressed.
Water 2025, 17(10), 1486; https://doi.org/10.3390/w17101486
Submission received: 31 March 2025 / Revised: 9 May 2025 / Accepted: 13 May 2025 / Published: 15 May 2025
(This article belongs to the Section Soil and Water)

Abstract

:
Livestock production systems can negatively affect soil structure, resulting in negative changes in physical–hydraulic properties, compromising soil functioning and productivity. This research aimed to evaluate the effects of rotational silvopastoral systems on soil physical–hydraulic functioning in their second year of implementation. The study was performed under Oxisol soil with a loamy sand texture in Southeast Brazil. We considered four grazing systems: an intensive silvopastoral system with Panicum maximum in consortium with Leucaena leucocephala (ISPS + L), an intensive silvopastoral system with Panicum maximum in consortium with Tithonia diversifolia (ISPS + T), an silvopastoral system with Panicum maximum (SPS) with tree row (TRs), and open pasture under a rotational grazing system with Panicum maximum (OP). The treatments ISPS + L, ISPS + T, and SPS had tree rows (TRs) every 20 m composed of Khaya ivorenses, Leucaena leucocephala, Eucalyptus urograndis, Acacia mangium, and Gliricidia sepium. Nine physical–hydraulic indicators were evaluated in the first 0.40 m of depth: bulk density (Bd), total porosity (TP), macroporosity (MaP), microporosity (MiP), field capacity (FC), permanent wilting point (PWP), available water content (AWC), total soil aeration capacity (ACt), and S-index. The soil physical–hydraulic properties were sensitive to the effects of the livestock systems. The use of silvopastoral systems in consortium with grass (ISPS + L and ISPS + T) allowed for better soil water retention, resulting in higher FC and AWC than the OP, SPS, and TR. The indicators Bd, ACt, MaP, FC, MiP, and S-index presented the greatest variance; however, FC, ACt, MaP, and MiP enabled the greatest differentiation among systems. Therefore, these properties are important in studies on soil physical quality since they provide information about the soil porous status and its ability to retain water and exchange soil air and gases. Therefore, enhancing the physical–hydraulic attributes of the soil in silvopastoral systems with shrub species is crucial for ensuring long-term productive sustainability and strengthening environmental resilience against future climate challenges.

1. Introduction

The beef agro-industrial sector generated US $179.20 billion in 2023, accounting for 8.2% of the Brazilian Gross Domestic Product (GDP) [1]. Brazil possesses the largest commercial cattle herd globally, at 197.20 million head, and is the world’s leading beef exporter, with 10.60 million tons of carcass-equivalent meat exported [1]. However, Brazil’s prominent role in global beef production contrasts sharply with the widespread degradation of its pasturelands. Pasture degradation is a critical factor compromising both the sustainability of livestock production [2] and environmental integrity [3], leading to soil and water degradation [4,5]. Brazilian pastures cover approximately 177 million hectares, of which 41% have moderate vegetative vigor and signs of degradation, while 21% are classified as severely degraded, characterized by low vegetative vigor [6].
The main cause of pasture degradation in Brazil is inadequate grazing management, which results in animal stocking rates higher than the pasture carrying capacity and insufficient nutrient replenishment [2,7]. According to [8], trampling density increases at a rate of 0.47 m2 ha−1 for each 1 cm reduction in pasture height. Pasture degradation begins with a decline in forage vigor and availability, leading to reduced stocking capacity and animal weight gain. In more advanced stages, or occurring simultaneously with these phenomena, this can lead to infestations of invasive plants, the occurrence of pests, and soil degradation [2,9]. The advanced stages of pasture degradation, in irreversible cases, can cause the disruption of natural resources, manifesting ing soil degradation with changes in its structure as a result of compaction, which affects its physical and hydraulic quality, thus leading to erosion and the siltation of water sources [2,10].
For exposed soils, compaction and surface sealing compromise their physical quality [11], reduce water infiltration, and increase erosion, promoting soil degradation and fertility decreases [12,13,14]. In addition, grass monocultures subject to conventional grazing display greater compaction, higher soil bulk density, and lower total porosity and infiltration than soils in forests and agroforestry systems [15,16]. Most of the compactions caused by cattle hooves occur in the first 5–10 cm depth [17].
Given this scenario, alternatives in the management of livestock production are needed to reduce the degradation of pastures and the soil physical quality. An alternative is the rotational system (RS), which involves dividing the pasture area into plots, respecting the occupation and rest period of the pasture, and allowing the recovery of forage between grazing periods, thus offering quality forage at the right time and greater animal carrying capacity. Nevertheless, a major problem with the RS is the great seasonality of the carrying capacity, with high forage production and stocking in summer (6.0 UA ha−1), and low production in the winter period (1.0 UA ha−1 year−1) [18]. Moreover, this system provides only a few improvements in the quality of soil physical–hydraulic properties of degraded pastures [3].
Integrated crop–livestock systems have contributed to reducing the problems of the seasonality of forage supply and overgrazing [8]. The silvopastoral system (SPS) integrates silvicultural production (forest production) and pasturing (livestock production). These two components can be implemented simultaneously or the forest component can be introduced in already established pastures [16,19]. Furthermore, in intensive silvopastoral systems (ISPs), in addition to having the tree component in rows every 13 to 20 m, there are forage shrubs in consortium with the pasture between the rows [20] and in which grazing is rotated.
Silvopastoral and mixed grass–legume systems are a promising alternative for restoring soil ecological functions [21]. These systems support production through agroecological processes with the high biological fixation of atmospheric nitrogen; the cycling of nutrients, especially phosphorus; high soil protection against erosion; and the provision of habitats for natural enemies of grass pests, cattle ectoparasites, and several other functional groups of biodiversity such as birds, small mammals, ants, beetles, and earthworms, among others [22,23]. However, despite these recognized benefits, there is limited knowledge regarding their impact on soil physical–hydraulic properties.
High-quality soil functions as a medium for plant growth, regulates the distribution of water in the environment, and acts as a buffer for the attenuation and degradation of pollutants. Soil quality depends on intrinsic characteristics, interactions with the ecosystem, and management, socio-economic and political priorities [24]. Therefore, proper management helps to ensure the maintenance of the potential to provide environmental services and the productive capacity of soils [25]. Thus, the use of soil physical quality indicators linked to water and gas functions may enable us to assess the impact of agricultural practices [26]. Positive results were observed in the assessment of soil physical properties in agroforestry systems, where the presence of the tree component enhanced water infiltration rates and improved soil quality, such as soil porosity and water holding capacity [27,28,29].
Several indicators of soil physical quality can be derived from the soil water retention curve, including macroporosity, microporosity, field capacity, permanent wilting point, and available water content [26]. Moreover, the parameters obtained from the van Genuchten model [30] for the soil water retention curve allow for the determination of the S-index [31,32]. The S-index represents the slope at the inflection point of the retention curve and serves as a sensitive indicator of soil structural quality. This index is highly sensitive to different management systems and is strongly correlated with key soil properties such as bulk density, total porosity, macroporosity, and organic matter [33,34,35].
Considering this, extensive field studies are crucial to establishing the most sustainable management practices that enhance soil water retention, plant-available water, and soil porosity, thereby optimizing landscape management [36,37]. In this context, and considering the potential of silvopastoral systems to improve soil quality, this study aimed to assess the effects of rotational silvopastoral systems in their second year of implementation on soil physical quality through analyses of soil physical–hydraulic properties.

2. Materials and Methods

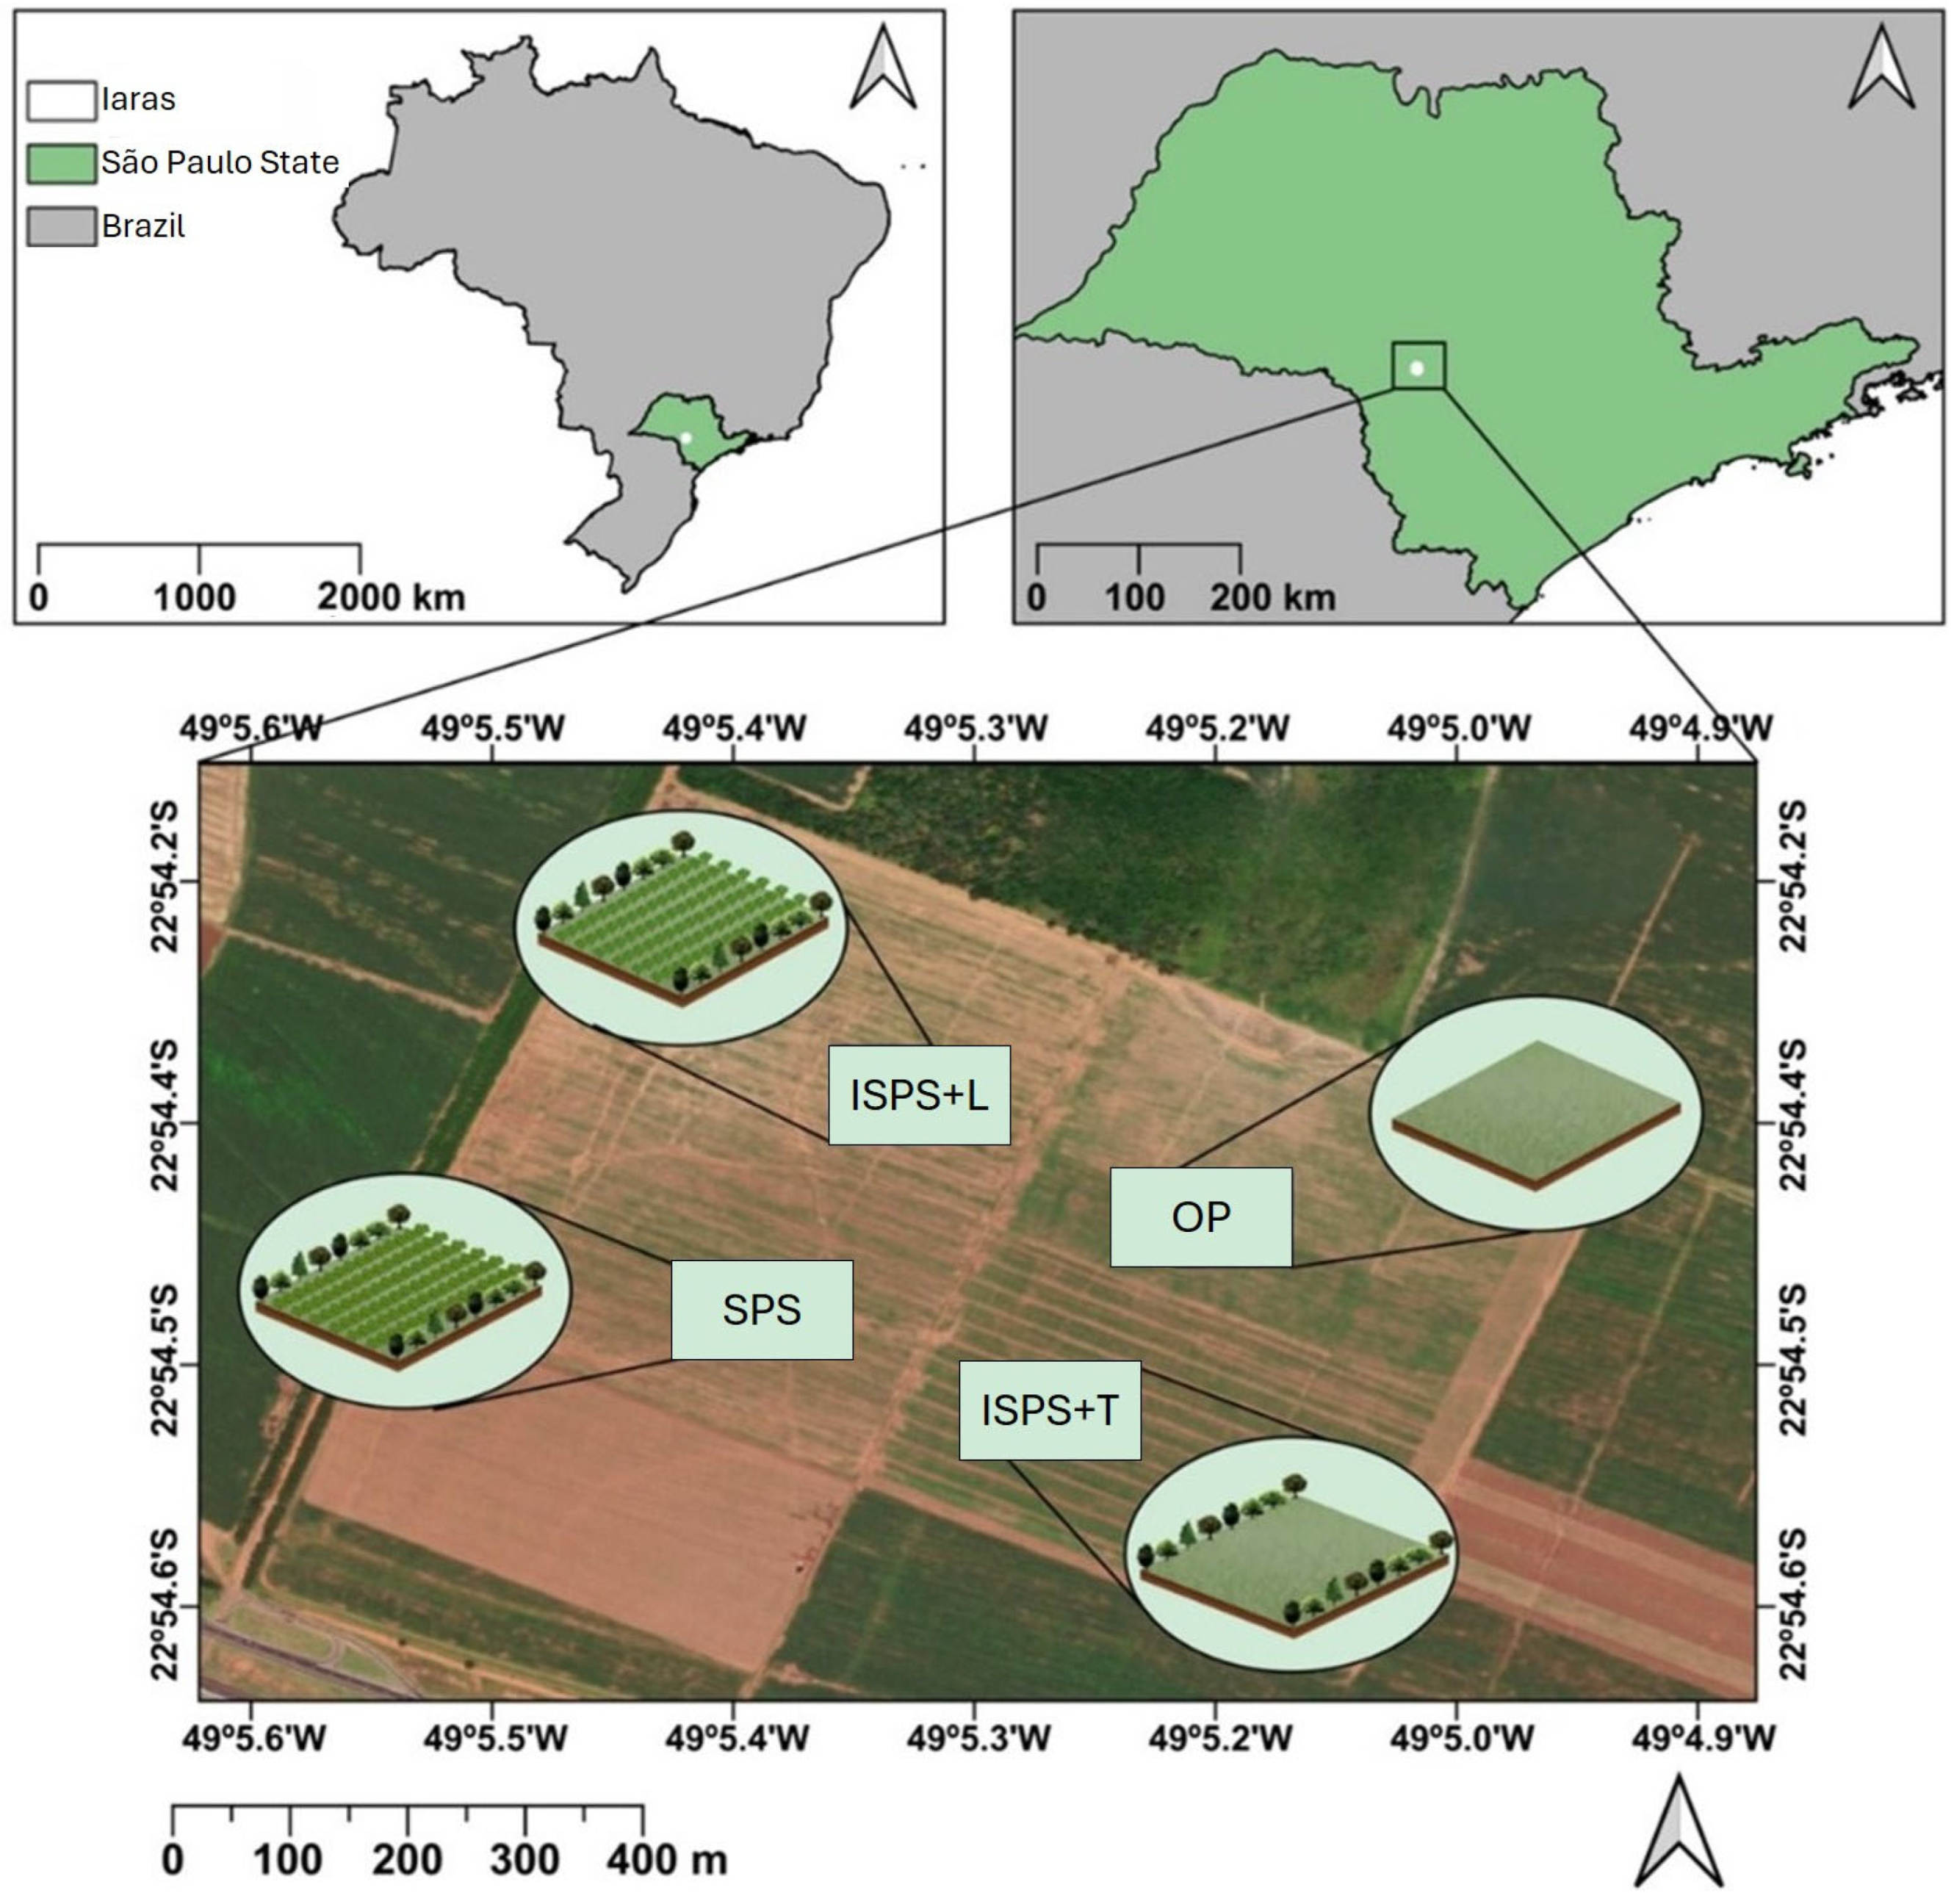
2.1. Location and Description of the Study Area

This study was conducted under field conditions at Takaoka Farm (22°52′ S, 49°09′ W at 641 m a.s.l.) in the municipality of Iaras, state of São Paulo, Southeast Brazil (Figure 1). According to Köppen’s classification, the climate at this site is subtropical (Cfa) [38], with cold and dry winters and hot and rainy summers, with an average annual rainfall of 1237 mm and an average temperature of 20.3 °C.
The soil was classified as an Oxisol [39] with a loamy sand texture (Table 1). Before the establishment of the experiment, the area was occupied by pasture for over 20 years until 2014, when it was occupied with sugarcane (Saccharum officinarum) under conventional management with mechanized harvesting. In 2016, the land use transitioned to an organic production system, which was eradicated in June 2018.

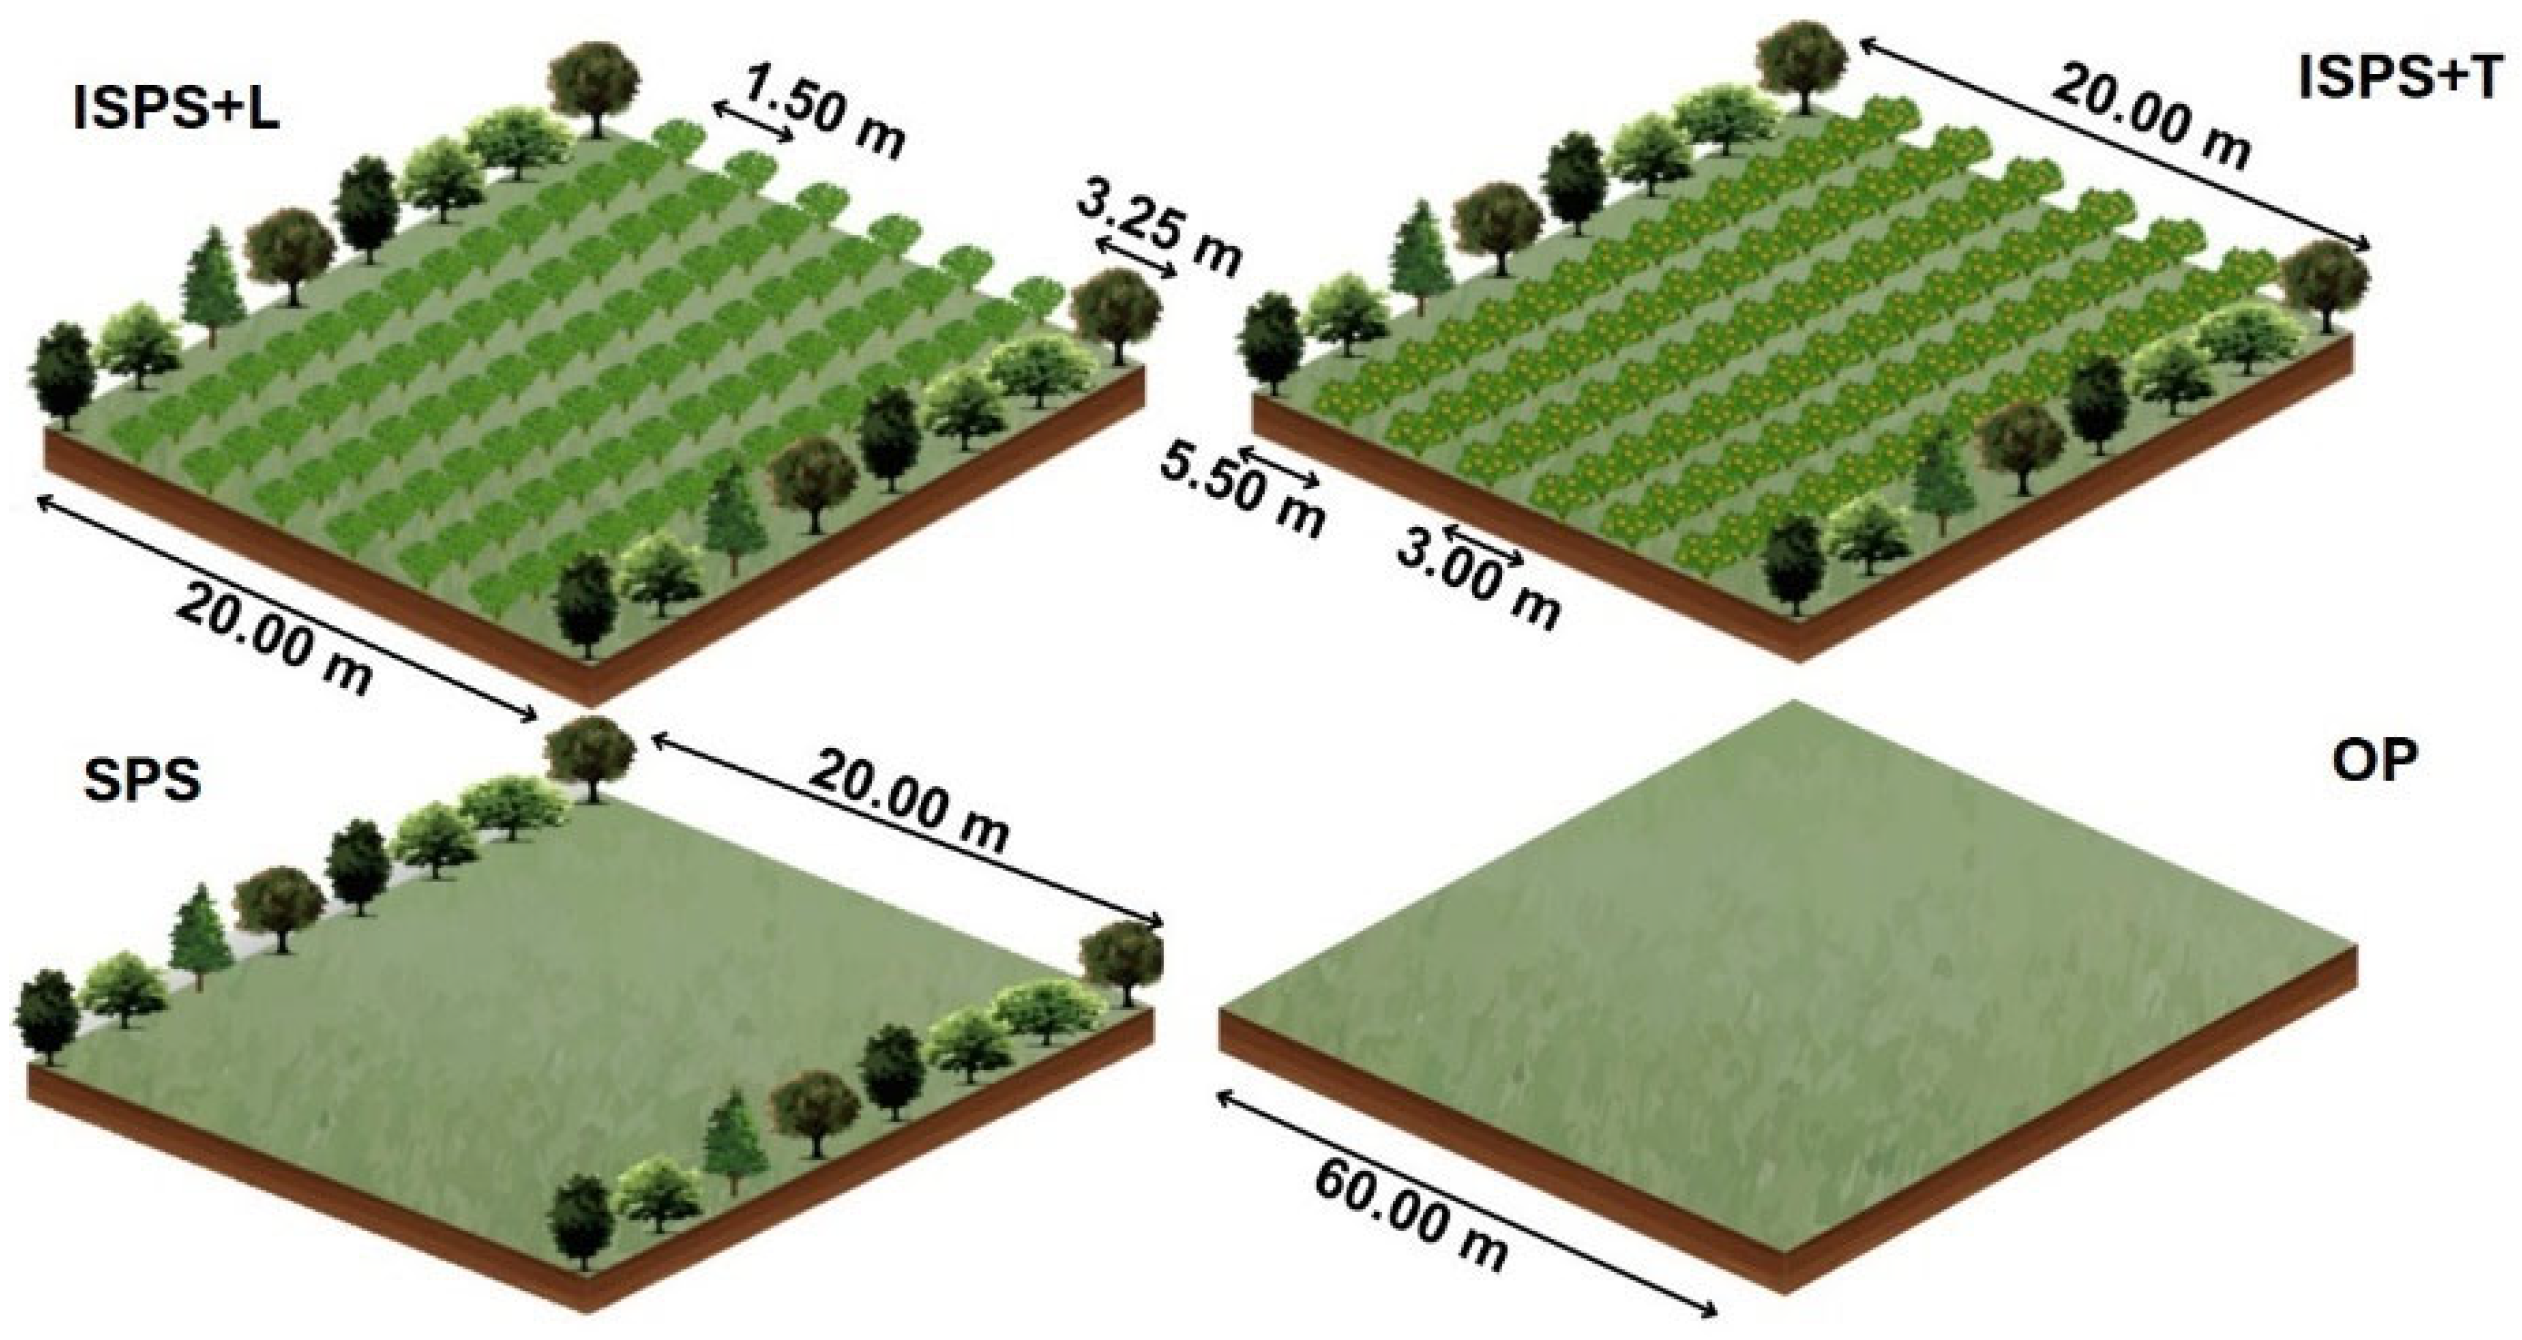
2.2. Design and Conduction of the Experiment

The experimental design used was completely randomized, with four livestock production systems and four replications (Figure 2). The evaluated systems were as follows: ISPS + L—intensive silvopastoral system with grass Panicum maximum (cv. BRS Zuri), in consortium with Leucaena leucocephala (cv. Cunningham) and rows of tree species every 20 m; ISPS + T—an intensive silvopastoral system with the grass Panicum maximum (cv. BRS Zuri), in consortium with Tithonia diversifolia and rows of tree species every 20 m; SPS—a silvopastoral system with grass Panicum maximum (cv. BRS Zuri) and rows of tree species every 20 m; and OP—a system of open pasture under rotational, with the grass Panicum maximum (cv. BRS Zuri). The rows of tree species (TR) in systems ISPS + L, ISPS + T, and SPS were composed of the following forest species: Khaya ivorenses, Leucaena leucocephala (cv. Cunningham), Eucalyptus urograndis, Acacia mangium, and Gliricidia sepium. Each system has an extension of 11 ha, divided into 16 plots of 0.66 ha, thus resulting in a total area of 44 ha.
In November 2018, the soil was plowed for livestock establishment (Tatu brand ATCR 32) by destroying the sugarcane ratoons. For systems ISPS + L, ISPS + T, and SPS, in the rows of tree species, which occur every 20 m, before planting, 15 kg ha−1 of Crotalaria juncea and 10 kg ha−1 of millet Pennisetum glaucum cv. ADR300 were sown. Subsequently, the fully bloomed crotalaria was incorporated with an intermediate plowing grid, immediately before livestock system implementation.
In the ISPS + L system, Leucaena leucocephala (cv. Cunningham) was sown using a Kuhn continuous-flow seeder, ensuring a row spacing of 1.53 m and a seeding depth of 0.025 m. The consortium of Leucena and Panicum maximum (cv. BRS Zuri) was established between tree rows spaced 20 m apart (Figure 2). The spontaneous plants were controlled with a mechanical cultivator and manual weeding during the first 45 to 50 days, until the Leucena plants reached 0.60 m in height. Subsequently, Panicum Maximum (cv. BRS Zuri) was sown at a rate of 12 kg ha−1, accompanied by the application of 300 kg ha−1 of Gafsa reactive natural phosphate. In the ISPS + T system, Tithonia diversifolia was established through stem cutting, with grooves opened at a depth of 0.20 m and spaced 3 m apart. The consortium of Leucena and Zuri grass was also implemented between tree rows spaced 20 m apart. SPS and OP were sown with grass Panicum Maximum (cv. BRS Zuri) using a continuous-flow seeder with 29 rows, spaced 0.17 m apart (Kuhn brand). The seeding rate was 12 kg ha−1, and 300 kg ha−1 of Gafsa reactive natural phosphate was applied in the rows.
In systems ISPS + L, ISPS + T, and SPS, the following tree species were planted to establish the tree rows (TRs): Mahogany (Khaya ivorenses), Leucena (Leucaena leucocephala), Eucalyptus (Eucalyptus urograndis), Acacia (Acacia mangium), and Glyricidia (Gliricidia sepium). These species were arranged in rows spaced 20 m apart (Figure 2), with a planting density of one tree per linear meter. All systems were managed in a rotational grazing system with Bos indicus (Nellore breed) cattle. Grazing began in May 2019, following a system where animals occupied each paddock for a maximum of three days, with a minimum pasture recovery period of 45 days before re-entry.

2.3. Soil Sampling

Soil sampling was carried out in May 2020, 18 months after the establishment of the experiment. Undisturbed soil samples were collected for the determination of physical properties and soil water retention in stainless steel rings of 5 cm in height and diameter. Samples were taken in the center of the 0.00–0.05, 0.05–0.10, 0.10–0.20, and 0.20–0.40 m soil depths. In systems ISPS + L and ISPS + T, samples were taken from the Leucaena and Tithonia rows and the interrow regions occupied by grasses. In systems SPS and OP, sampling was conducted in the grass-covered areas, while in the tree rows, samples were collected exclusively from the tree row itself.

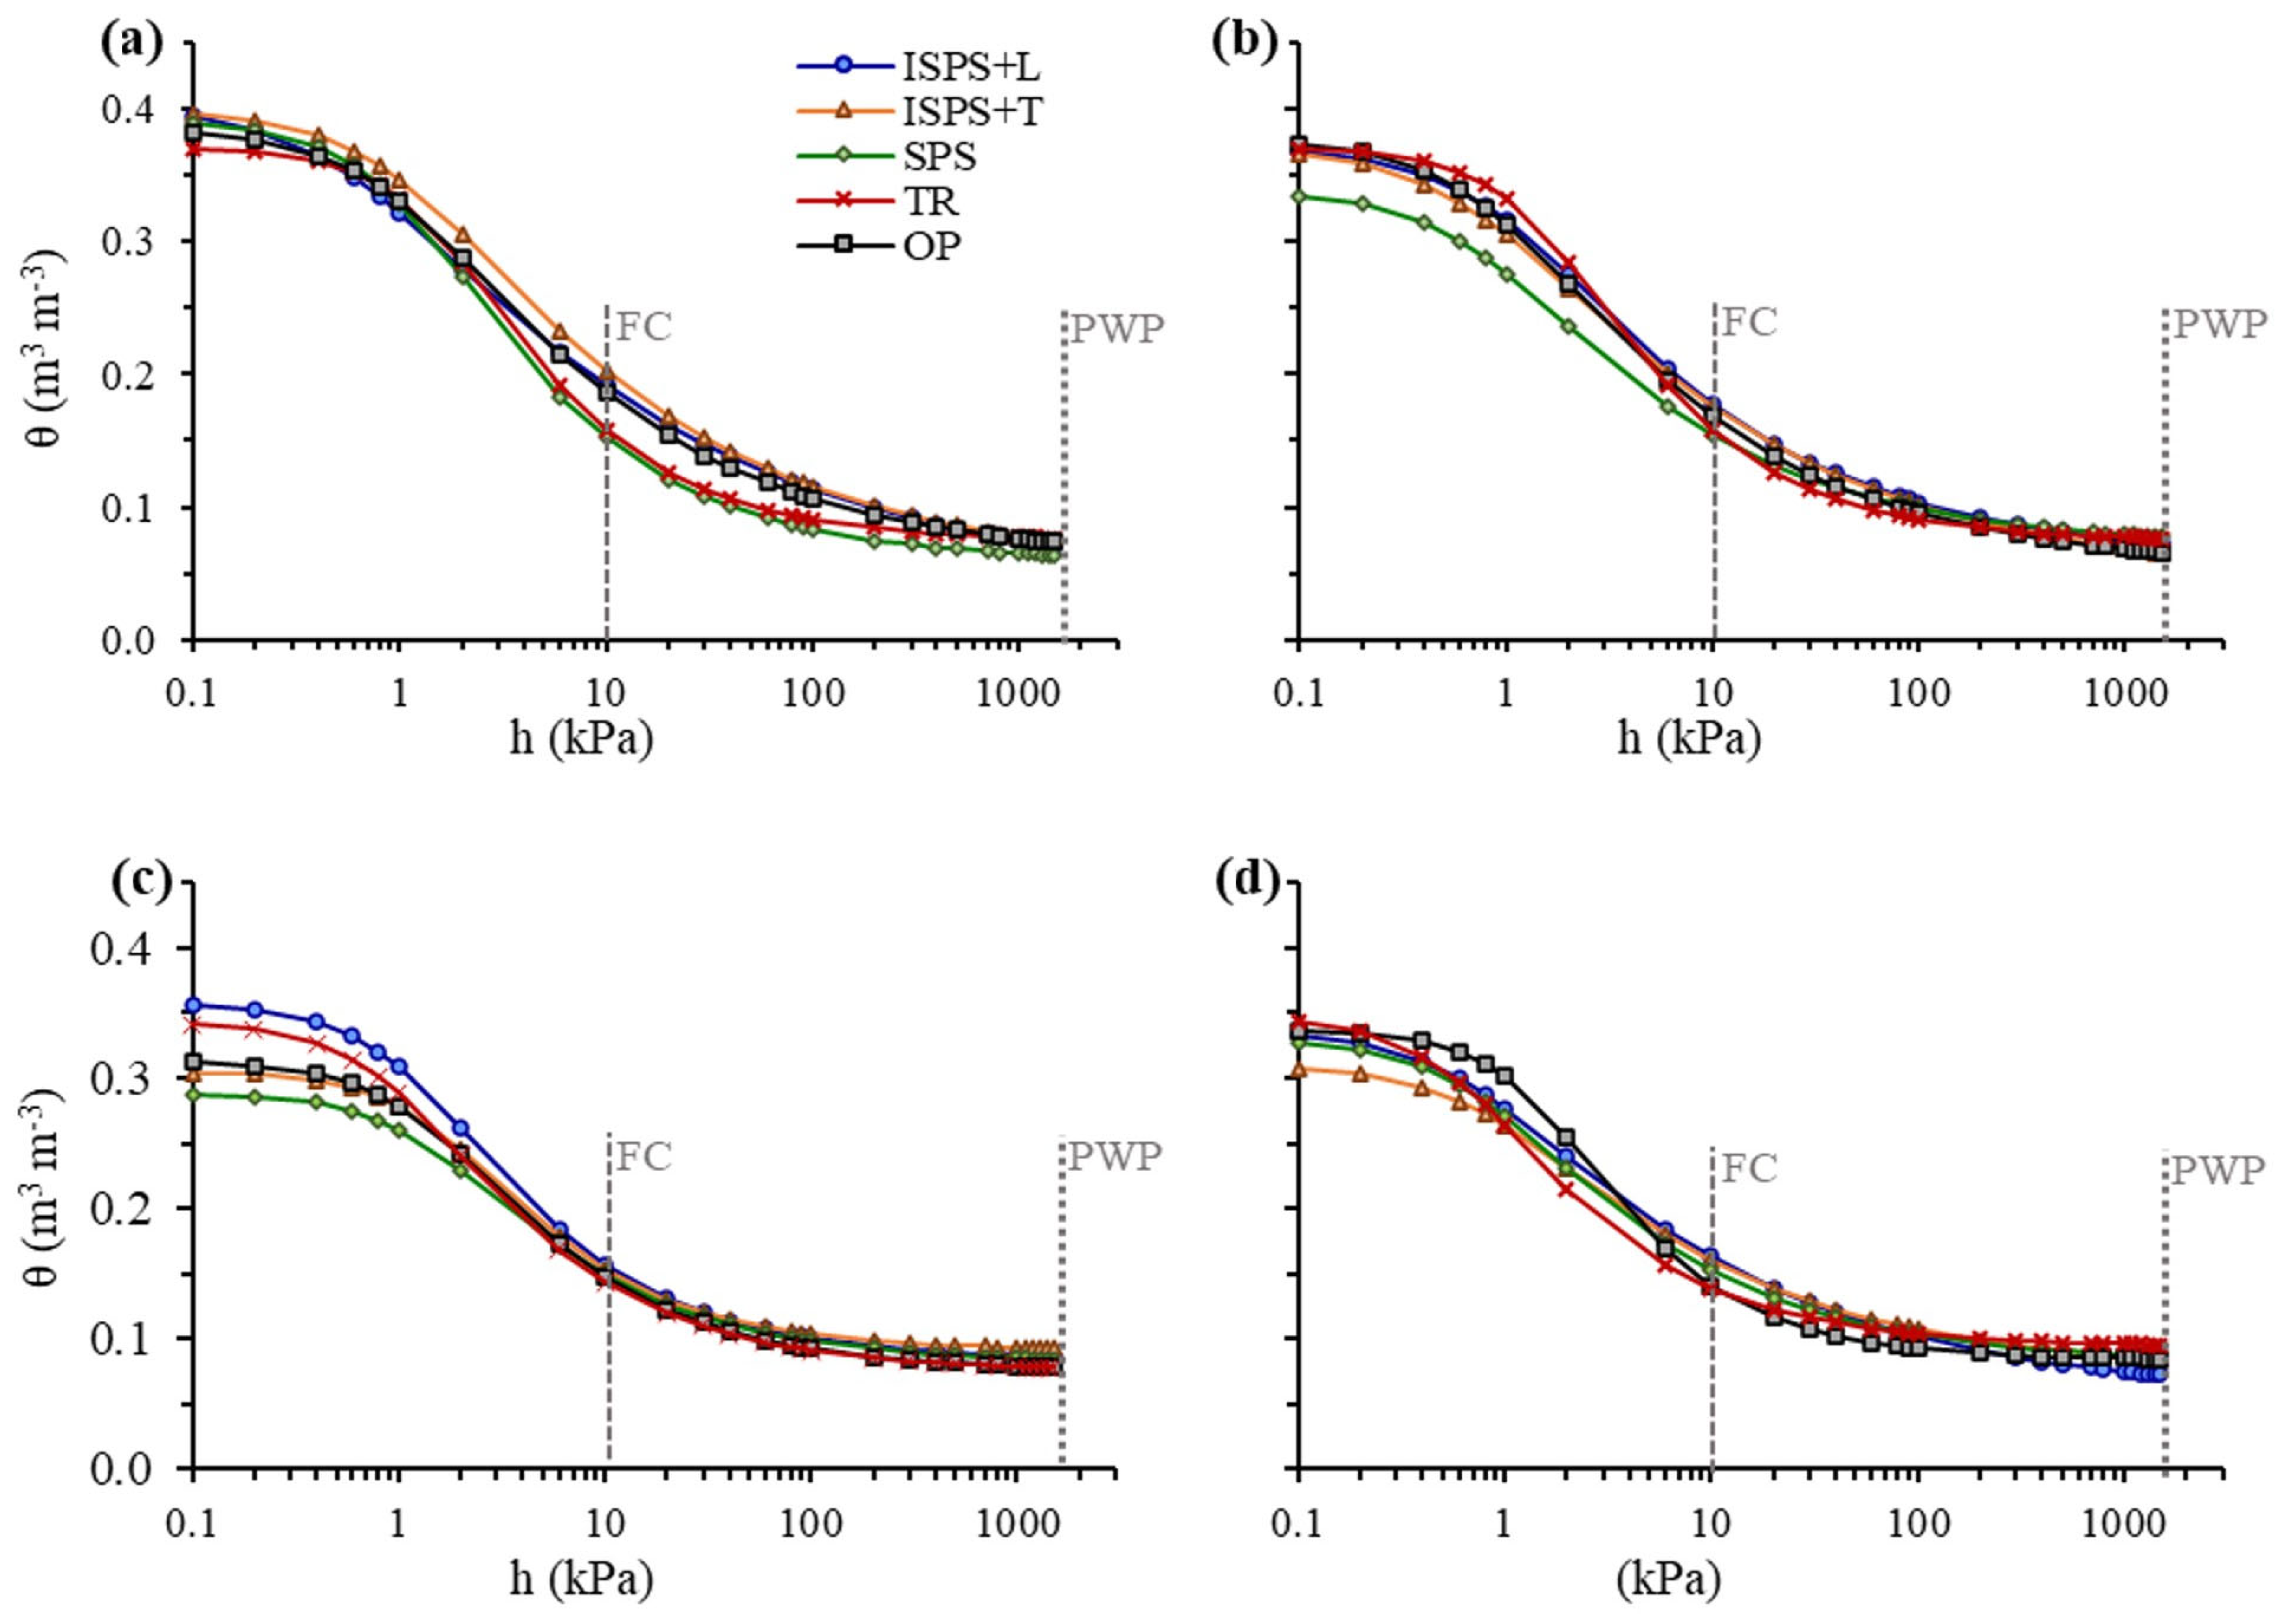
2.4. Determination of Soil Water Retention Curve and Physical–Hydraulic Properties

Undisturbed soil samples were initially saturated by capillary rises and subsequently subjected to different matric potentials (Ψ). The matric potential was described in terms of water tension (h), defined as its absolute value (h = |Ψ|). Thus, the samples were subjected to water tensions of 2 and 6 kPa on the tension table and at 10, 33, 100, 300, 500, and 1500 kPa in Richard pressure chambers with porous plates. Afterward, the samples were dried in an oven at 105 °C to determine the dry mass. Bulk density (Bd) was calculated using the ratio between the dry soil mass (Mds) and the sample volume (Vs). Total porosity (TP) was calculated as the volumetric water content at saturation, microporosity (MiP, pores < 50 µm) was calculated as the volumetric water content retained at h = 6 kPa, and macroporosity (MaP, pores ≥ 50 µm) was calculated using the difference between total porosity and microporosity (MaP = TP − MiP); all methodologies were pefromed according to [40].
The soil water retention curves were determined by fitting the volumetric water content ( θ ) obtained in the different water tensions (h) to the van Genuchten model [30] (Equation (1)). The parameter estimation was performed using the least squares method with the Soil Water Retention Curve software (version 3.00) [41].
θ = θ r + θ s θ r 1 + α × h n m
where θ = soil water content (m3 m−3); θ r = residual water content (m3 m−3); θ s = water content at saturation (m3 m−3); h = soil water tension (kPa); and α (kPa−1), n and m = model parameters, being m = 1 − 1/n, according to [42].
The soil water retention curves were used to determine key hydraulic properties. Field capacity (FC) and permanent wilting point (PWP) were used as the volumetric water content at the tension of 10 end 1500 kPa. Available water capacity (AWC) was calculated as the difference between FC and PWP. Total soil aeration capacity (ACt) was determined as the difference between θ s and θ 10kPa, according to [26]. Additionally, S-index was determined as the slope of the water retention curve at its inflection point, as described by [31] (Equation (2)).
S = n θ s θ r D s 1 + 1 m 1 + m
where m and n = van Genuchten model [30] parameters; θ r = residual water content (m3 m−3); θ s = water content at saturation (m3 m−3); amd Bd = bulk density (Mg m−3). Considering that the S-index is always negative, the module was used in the results, as suggested by [31,32].

2.5. Statistical Analysis
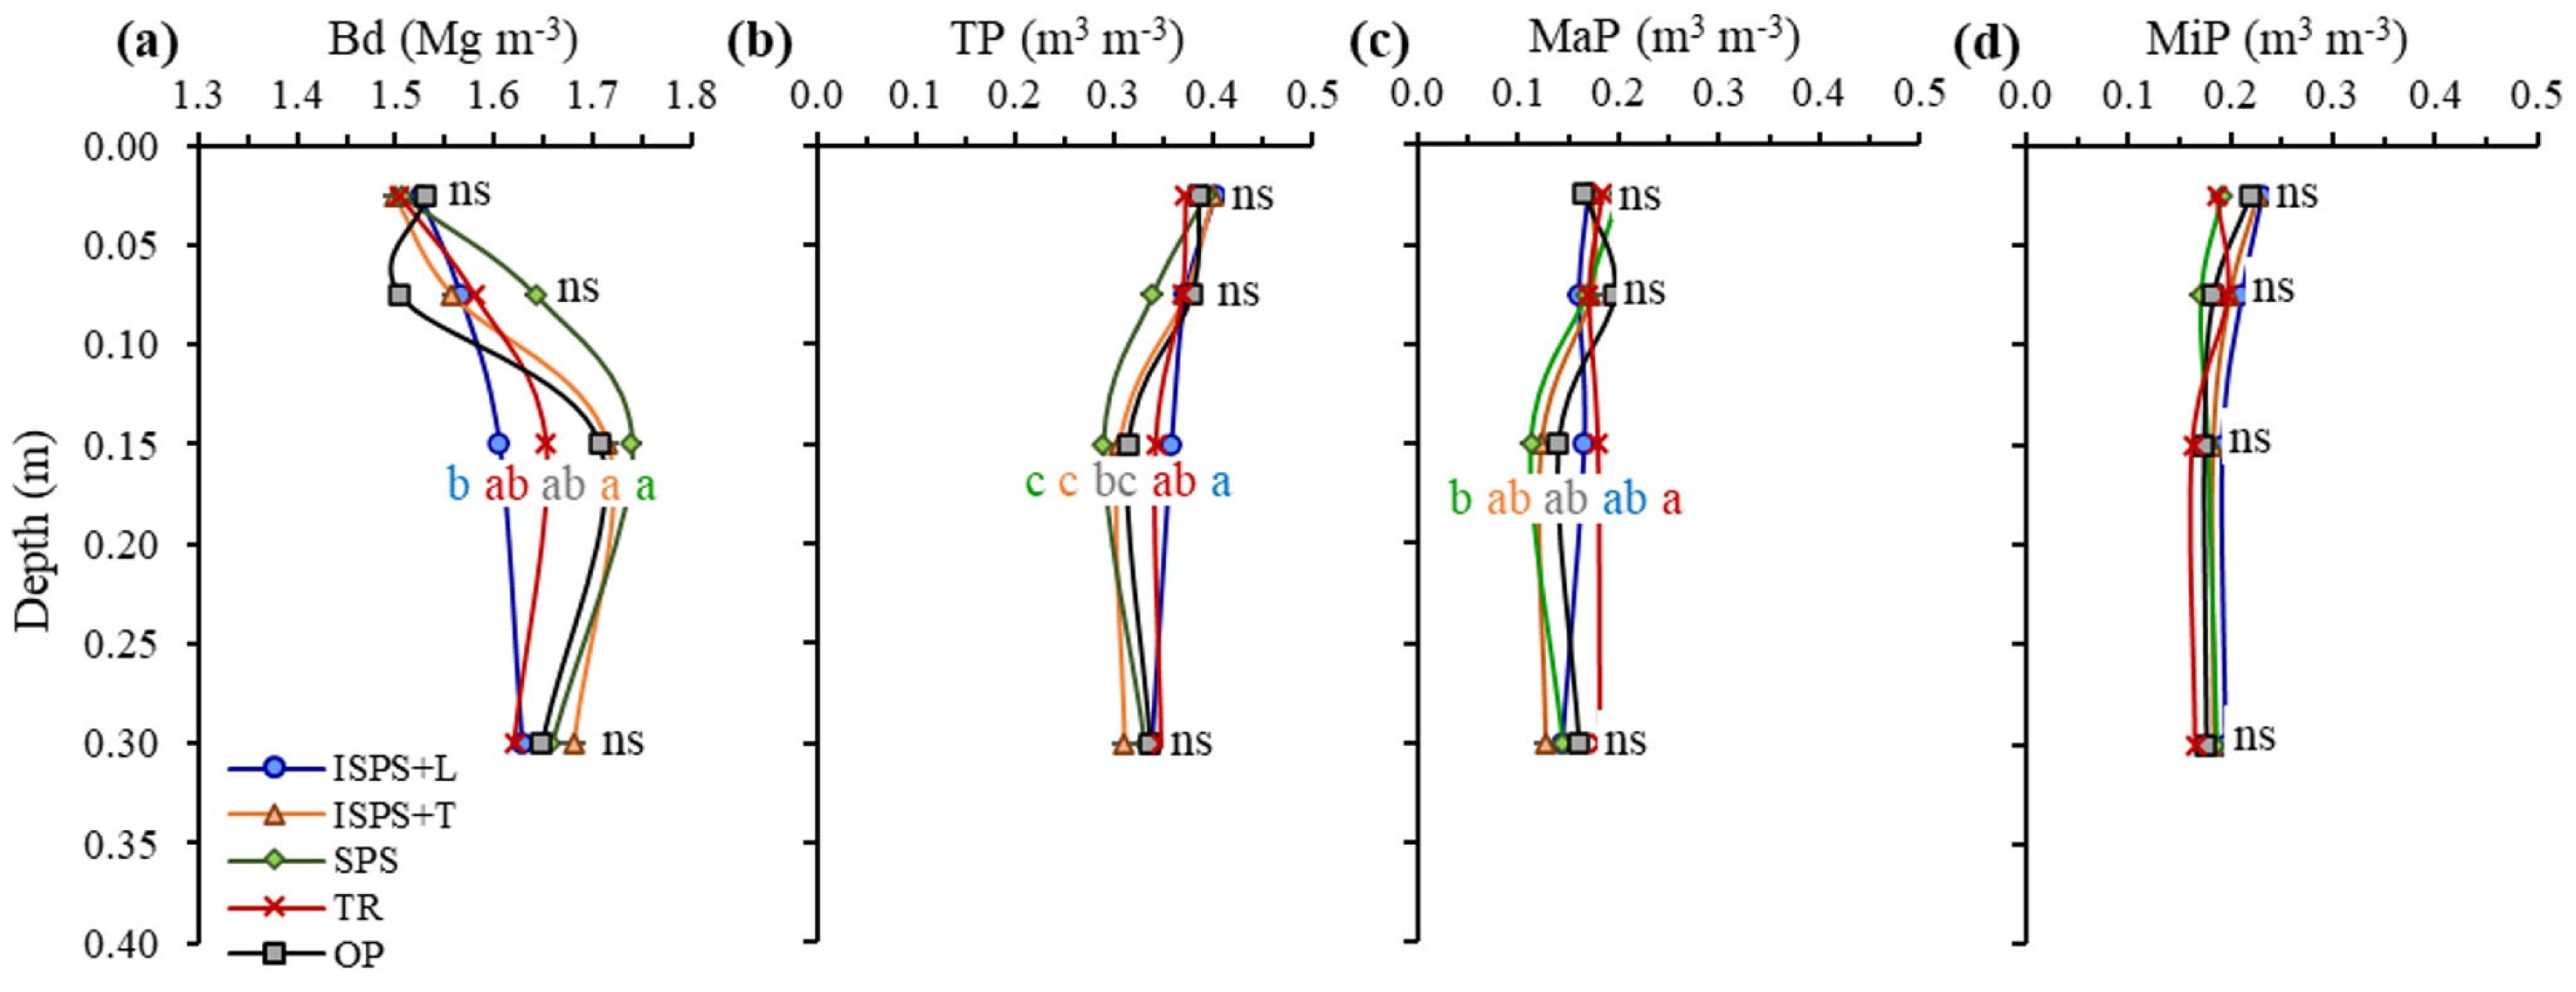
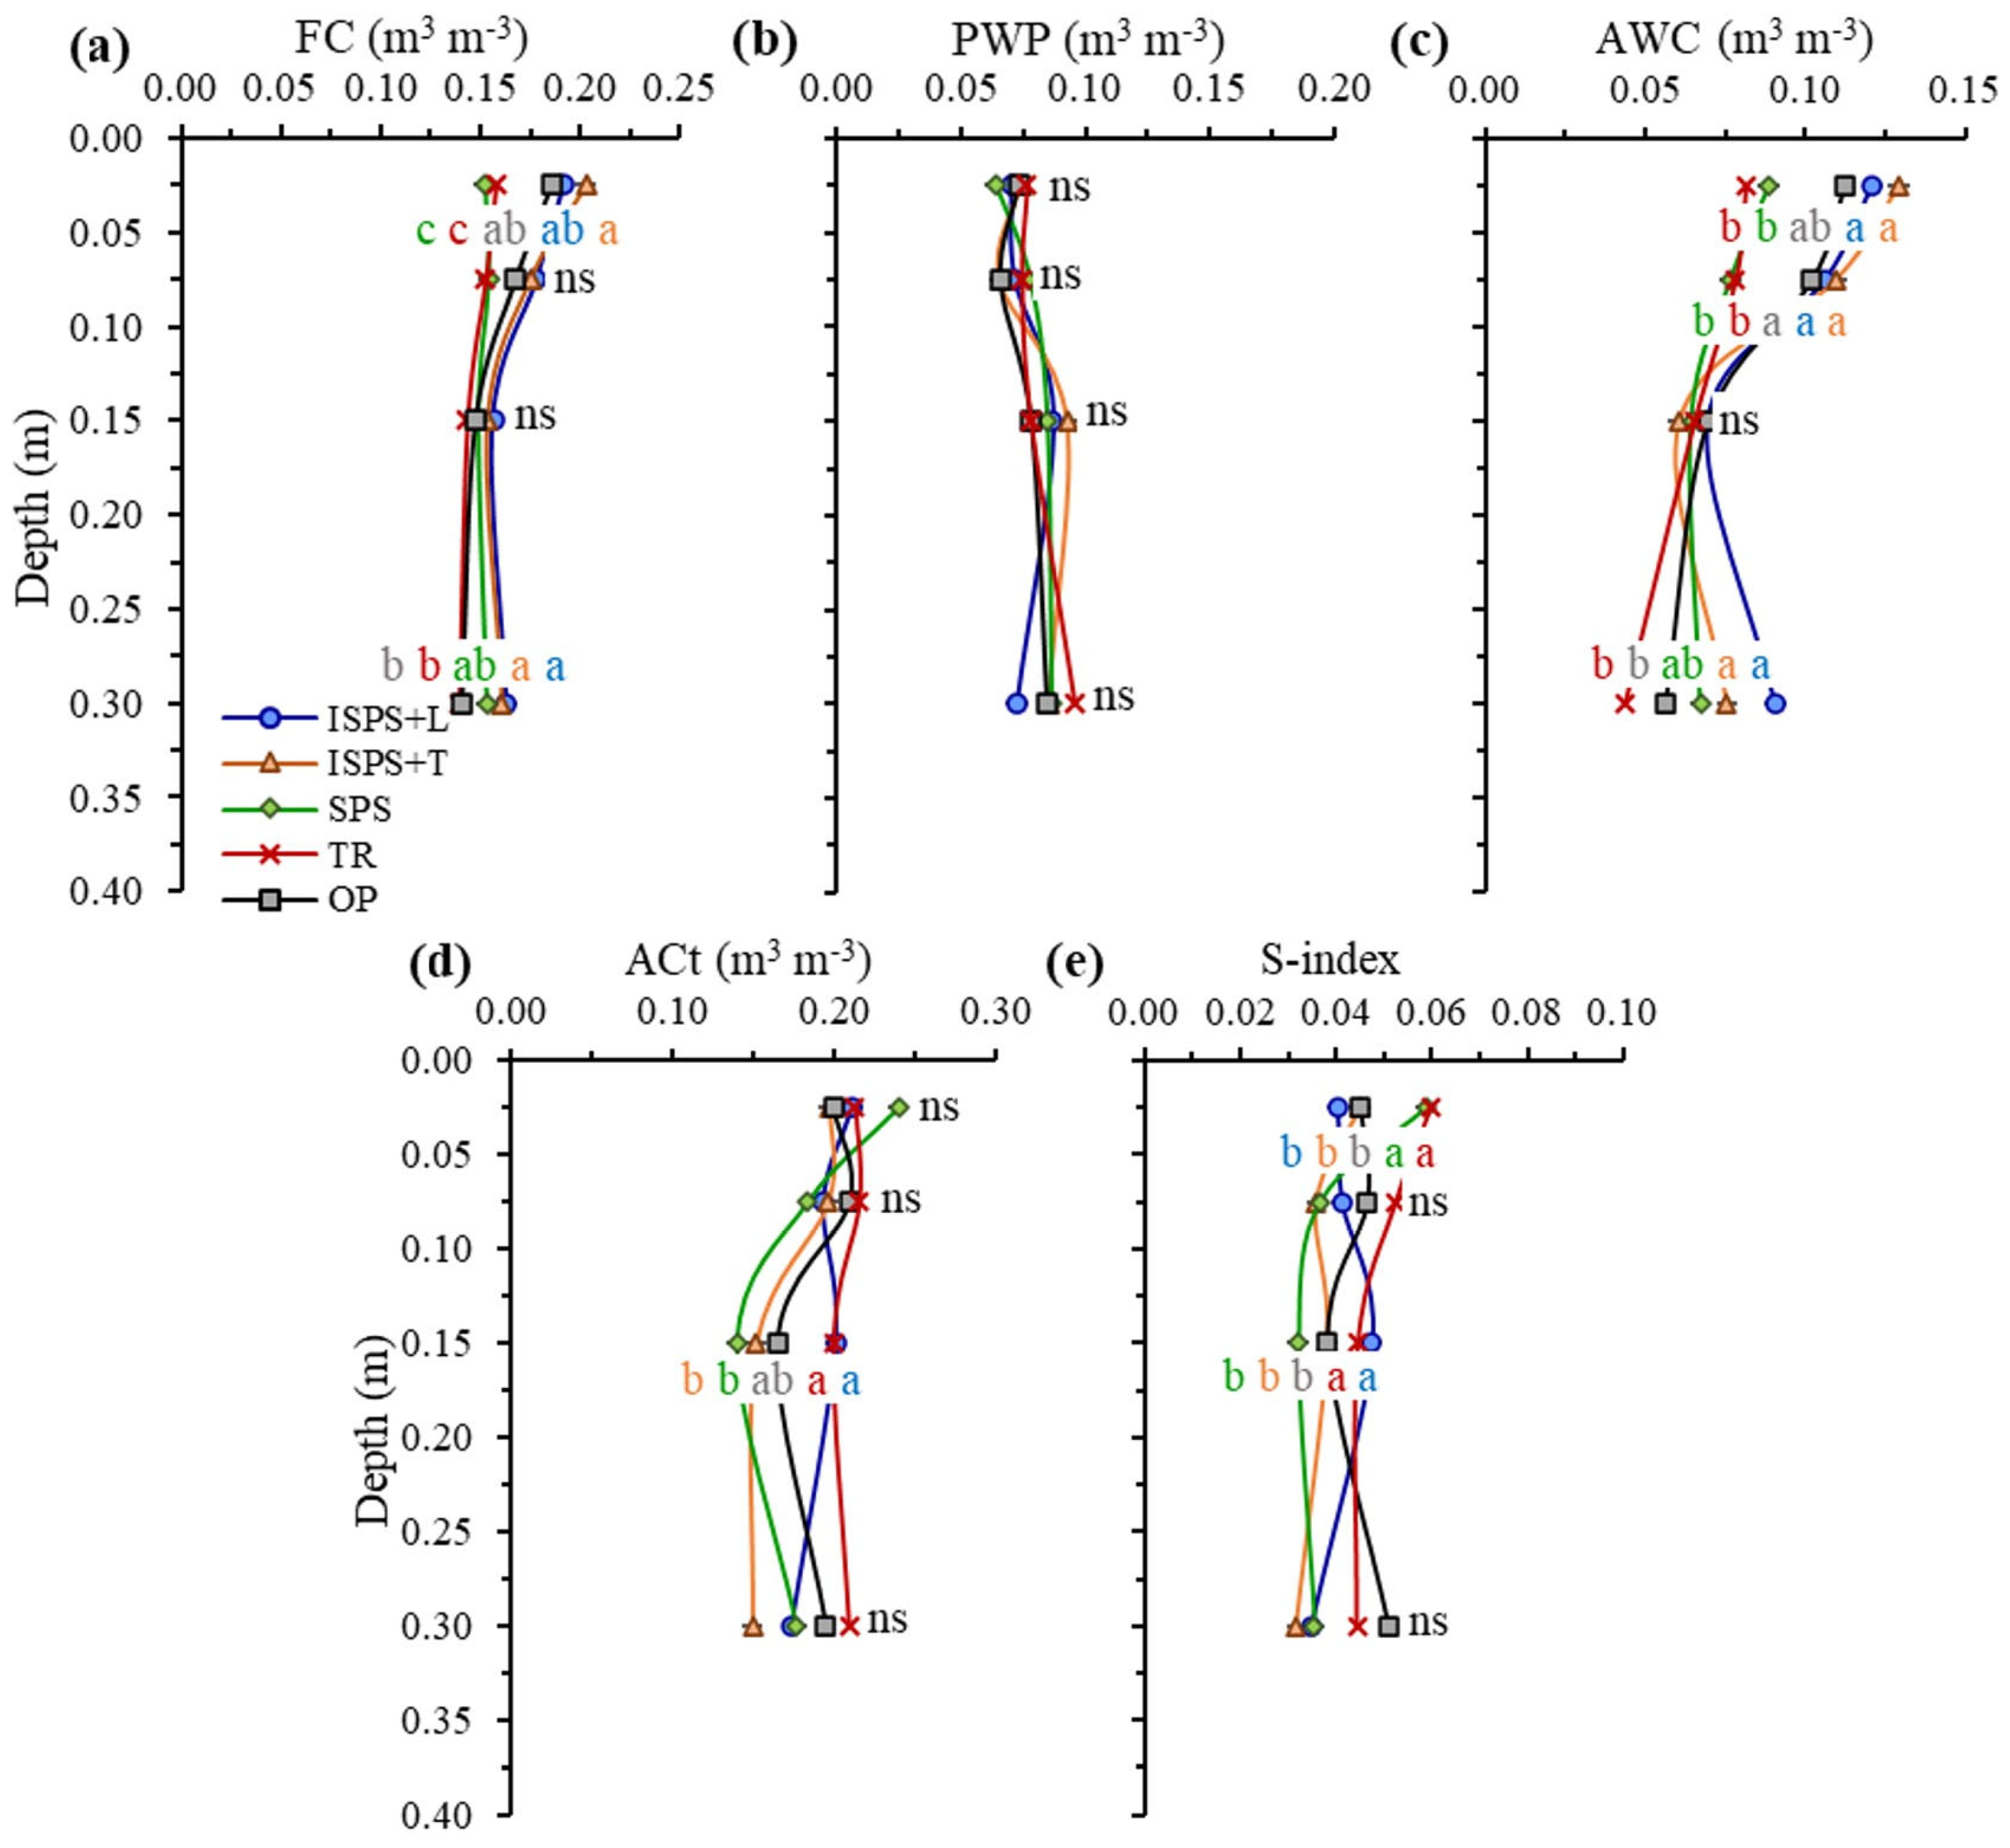
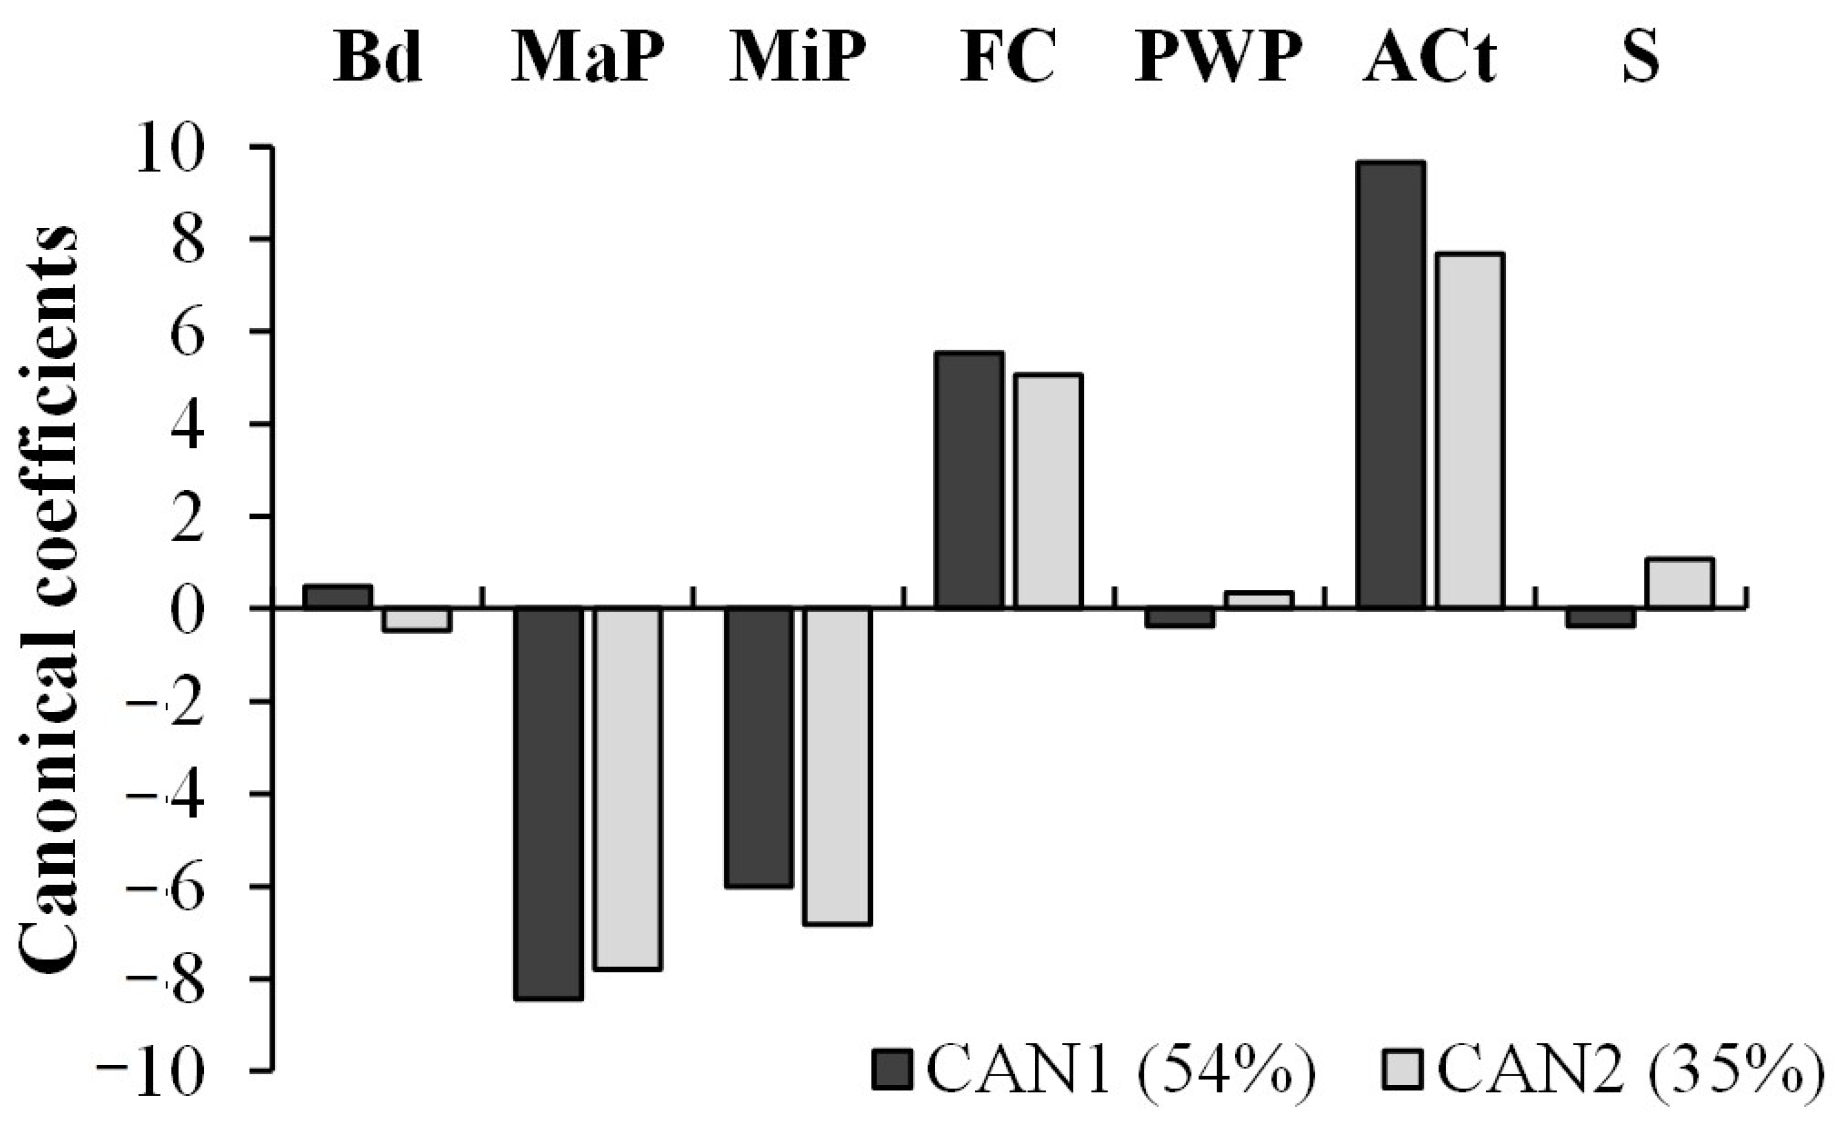
Soil physical–hydraulic indicators (Bd, TP, MaP, MiP, FC, PWP, AWC, ACt, S-index) were compared for each soil layer and submitted to analysis of variance (ANOVA) to assess the effects of different management systems on the evaluated properties. When the F-test was significant, the means were compared by Tukey’s test at a 5% probability level. Subsequently, a multivariate approach was used, including principal component analysis and canonical discriminant analysis. Moreover, canonical discriminant analysis was performed to group and reduce the original variables into canonical variables and examine the relationships between the variables and the differences in the treatments in a multivariate approach. The mean values of the canonical variables for each treatment were compared using confidence ellipses for the mean vectors at 95%. All statistical analyses were performed using the free version of SAS 3.8 software. Principal component analysis and canonical discriminant analysis were conducted using the PRINCOMP and CANDISC procedures of SAS following the methodology described by [43].

3. Results

Regardless of the livestock production system, bulk density (Bd) showed higher values in the 0.10–0.20 m soil layer, with significant differences between treatments only observed in this layer (Figure 3a). The highest Bd values were obtained in SPS and ISPS + T (1.74 and 1.72 Mg m−3, respectively), while ISPS + L presented the lowest value (1.61 Mg m−3). Differences in Bd in these soil layer influenced total porosity (TP, Figure 3b) and macroporosity (MaP, Figure 3c). However, microporosity (MiP) remained unaffected by the treatments, as no significant differences were observed (Figure 3d). High Bd values in SPS and ISPS + T resulted in low TP (0.29 and 0.30 m3 m−3) and MaP values (0.11 and 0.12 m3 m−3), whereas the low Bd values in ISPS + L resulted in higher TP (0.36 m3 m−3) and MaP values (0.17 m3 m−3). MiP had a uniform behavior in all soil layers, ranging from 0.16 to 0.23 m3 m−3. Except for OP, all treatments exhibited a lower Bd value in the surface layer (0.00–0.05 m).
The soil water retention curves for the different treatments across soil layers are presented in Figure 4, while the van Genuchten model fitting parameters [30] are listed in Table 2. All retention curves showed a high coefficient of determination (R2 > 0.92), indicating good data fitting to the model. The surface layer (0.00–0.05 m) had the highest θ s values (water content at saturation), with the greatest values observed in treatments ISPS + L and ISPS + T, respectively.
In the 0.00–0.05 m soil layer, ISPS + T had higher water retention among all tensions studied (Figure 4a). The greatest differences between the treatments were observed within the 1–100 kPa tension range, which resulted in differences between the treatments, where ISPS + T showed significantly higher field capacity (FC = 0.203 m3 m−3) compared to SPS (0.152 m3 m−3) and TR (0.158 m3 m−3) (Figure 4a and Figure 5a).
In the 0.05–0.10, 0.10–0.20, and 0.20–0.40 m soil layers, the greatest differences in water retention were obtained in the low-tension range (Figure 4b–d). These differences influenced the MaP (Figure 3c), FC (Figure 5a), available water content (AWC, Figure 5c), and total soil aeration capacity (ACt, Figure 5d). In all soil layers, the treatments showed very close water retention values in the high-tension region of the retention curves (above 500 kPa) (Figure 4b–d); therefore, no significant differences were found between the treatments for the permanent wilting point (PWP, Figure 5b). In the 0.20–0.40 m layer, FC was higher in ISPS + L and ISPS + T (0.163 and 0.161 m3 m−3) and lower in TR and OP (0.139 and 0.141 m3 m−3) (Figure 5a). AWC showed significant differences between the treatments in all layers except for the 0.10–0.20 m layer, with reduction in the sequence 0.00–0.05 m > 0.05–0.10 m > 0.20–0.40 m (Figure 5c). In the 0.00–0.05 m layer, the highest AWC values were obtained for ISPS + T and ISPS + L (0.129 and 0.121 m3 m−3), whereas the lowest values corresponded to TR and SPS (0.081 and 0.089 m3 m−3). This behavior persisted at the 0.05–0.10 m layer, with OP also exhibiting high AWC values (0.102 m3 m−3).
Higher ACt values were observed in the 0.00–0.05 m layer; however, significant differences between treatments were only found in the 0.10–0.20 m layer, where ISPS + L and TR had higher values (0.201 and 0.200 m3 m−3), while SPS and ISPS + T presented the lowest values (0.140 and 0.152 m3 m−3) (Figure 5d). These values for SPS and ISPS + T were the lowest obtained throughout the entire assessed depth.
The S-index, derived from the soil water retention curve, was sensitive to changes in soil structure in the 0.00–0.05 and 0.10–0.20 m layers, caused by the livestock production management systems (Figure 5e). However, different effects were found in these two layers: ISPS + L enhanced the S-index in both the 0.00–0.05 m (0.040) and 0.10–0.20 m (0.047) layers, whereas SPS reduced the S-index from 0.059 in the 0.00–0.05 m layer to 0.032 in the 0.10–0.20 m layer.
Significant positive correlations (p < 0.05) were observed among the evaluated soil physical–hydraulic attributes, particularly between TP and MaP and ACt, MaP and ACt, FC and AWC, and ACt and the S-index (Table 3). Conversely, significant negative correlations were found between Bd and TP and ACt, as well as between FC and ACt. To eliminate redundancy and enhance the distinction between unique and overlapping information, the indicators TP and AWC, identified as the properties most strongly correlated with other attributes, were excluded from the dataset before we applied multivariate techniques. This step was necessary to prevent variable redundancy and improve data interpretation.
In the principal component analysis, the selection of principal components (PCs) followed the Kaiser criterion (Kaiser, 1958), which considers eigenvalues greater than one. Based on this criterion, the first two principal components, PC1 and PC2, were retained. PC1 accounted for 59.12% of the total variance, while PC2 explained an additional 28.13%, cumulatively capturing 87.25% of the total variability in the original dataset (Figure 6 and Table 4). The discriminatory power of each variable within each PC was assessed by the linear correlation coefficients between each variable and the respective principal component (Table 4). Among the seven properties selected for the analysis, all were retained in PC1; however, the ones that contributed the most, in order of relevance, were Bd, ACt, and MaP (Table 4). In PC2, three properties were retained: FC, MiP, and S-index.
From the biplot graph, the dispersion of the treatments in the different soil layers is observed by the two-dimensional representation according to the score of the first two components (Figure 6). The results obtained from PC1 indicated an inverse relationship between Bd and PWP on the one hand, and MaP, ACt, and S-index on the other. Specifically, higher Bd and PWP values were observed in the subsurface layers of ISPS + T (0.10–0.20 and 0.20–0.40 m) and in the 0.10–0.20 m layer of SPS, resulting in lower ACt, MaP, and S-index values, while lower Bd and PWP values were obtained in the superficial layer (0.00–0.05 m) in all treatments and in the 0.05–0.10 m layer of OP, reflecting higher values of ACt, MaP, and S-index. PC2 revealed the existence of an inverse relationship between the S-index and FC and MiP. Higher values of FC and MiP were observed in the surface layers (0.00–0.05 m) of ISPS + L, ISPS + T, and OP, indicating lower values of S-index, and higher values of S-index were obtained in TR (0.20–0.40 and 0.10–0.20 m), SPS (0.00–0.05 m), and OP (0.20–0.40 m), indicating that there were lower FC and MiP values in these treatments. A high degree of correlation was established between the MaP, ACt, and S-index, and between FC and MiP.
Figure 7 shows the contribution of the original variables (physical–hydraulic attributes) to the formation of the first two new canonical variables (CAN1 and CAN2) obtained from the canonical discriminant analysis, in which it was possible to retain 89% of the experimental variability, with 54% retained in CAN1 and 35% retained in CAN2. Thus, the seven original variables (Bd, MaP, MiP, FC, PWP, ACt, and S-index) were reduced to only two (CAN1 and CAN2). It was verified that, among the two canonical variables, the original variables MaP, MiP, FC, and ACt were important sources of variation, demonstrating that these variables were important to both discriminate and to classify the treatments, although the variables CAN1 and CAN2 are not correlated (Figure 8). Furthermore, the MaP and MiP variables were contrasted with the FC and ACt variables.
Figure 8 shows the 95% confidence intervals (ellipses) for the mean vectors of the treatments in the new canonical variables, CAN1 and CAN2. In CAN1, the highest values of the middle classes were obtained for ISPS + T and ISPS + L (0.929 and 0.605, respectively). In contrast, the lowest values were found in TR, OP, and SPS (−0.675, −0.469, and −0.469, respectively). The dispersion of the coefficients for the original variables, which relate the changes in CAN1 and CAN2 to the treatments, indicates that higher values of FC and ACt were associated with ISPS + T and ISPS + L, while TR, OP, and SPS expressed higher MaP and MiP values.

4. Discussion

Livestock production management systems significantly influence soil physical and hydraulic properties. Bd was important in the characterization of treatments (Figure 6). Higher Bd values were obtained in the 0.10–0.20 and 0.20–0.40 m layers in all treatments and in the 0.05–0.10 m layer in SPS (Figure 3 and Figure 6). In these cases, Bd exceeded the critical value of 1.60 Mg m−3 for a sandy soil according to [22]. However, the main alterations in soil physical properties (Bd and MaP) occurred in the 0.10–0.20 m layer, where Bd reached its highest values, with significant differences seen among treatments. The integration of Leucena with grasses in ISPS + L promoted the lowest Bd value in this layer, leading to the highest TP and MaP values. In contrast, ISPS + T and SPS exhibited the highest Bd values, consequently leading to low MaP. Intensive silvopastoral systems incorporating shrubs in consortium with grasses prevent animals from transiting across large areas, maintaining low bulk density and enhancing soil water infiltration [22,23].
The changes observed in the soil physical–hydraulic attributes, such as the reduction in soil bulk density, the increase in macroporosity, and the enhancement of water retention capacity in intensive silvopastoral systems with shrub consortia, indicate significant improvements in soil health [22,44]. Lower soil compaction and greater water availability promote root development, creating a more favorable environment for nutrient uptake and plant growth [45,46]. These improved physical conditions may increase the productivity of forage grasses, the carrying capacity of livestock systems, and the resilience of pastures to drought periods, thereby contributing to the sustainability of production systems in tropical regions [22,47].
Although the results demonstrated better soil physical–hydraulic performance in the system intercropped with Leucaena leucocephala (ISPS + L) compared to the system with Tithonia diversifolia (ISPS + T), explanations for these differences remain limited. Studies suggest that Leucaena has a deeper and more aggressive root system, capable of exploring subsurface soil layers and contributing to the formation of biopores, thereby enhancing water infiltration and soil aeration [48,49]. Moreover, the high biological nitrogen fixation capacity of Leucaena may improve soil organic matter quality and stimulate microbial activity, both of which positively influence soil physical structure [50].
In contrast, Tithonia diversifolia presents a predominantly shallow root system and a more ephemeral aboveground biomass production, which may limit its ability to promote long-lasting structural changes in the soil [51]. Thus, although both shrub species are useful in integrated systems, the more consistent positive effects observed in systems intercropped with Leucaena may be related to the greater depth and persistence of its root impacts, as well as to the superior physical protection of the soil provided by its canopy architecture. Nevertheless, long-term studies are required to fully elucidate the mechanisms involved and to better understand the interactions between these shrub species and soil physical–hydraulic properties.
Bd is a key indicator of soil physical quality. For the same soil class, higher Bd values are directly associated with structural degradation, leading to a reduction in MaP [44]. Similarly, ref. [52] reported higher Bd values in degraded pastures compared to integrated crop–livestock systems. Although high Bd values were obtained in the 0.10–0.20 m layer and despite the differences in MaP between treatments, MaP was not compromised. In all treatments, MaP exceeded 0.10 m3 m−3 (Figure 3c), which is indicated as the critical threshold for adequate soil aeration and gas exchange necessary for root system development [53,54]. Nevertheless, the SPS, ISPS + T, and OP, which presented MaP values between 0.11 and 0.14 m3 m−3, show potential susceptibility to structural degradation.
Proper soil aeration is fundamental for root development; therefore, properties such as MaP and ACt are crucial for assessing this condition [22]. Although this study focused on the initial phase of the establishment of the different livestock systems, the importance of these properties was corroborated in the results, which showed these important properties in both the characterization (PC1) and in the discrimination (CAN1 and CAN2) of treatments (Figure 6 and Figure 7). Similar findings were reported by [55] in long-term experiments in Italy, where different soil tillage strategies and crop residue management practices were evaluated to identify the most effective indicators for detecting changes in soil physical quality. ACt is also strongly related with oxygen supply to plant roots [22], with minimum values for adequate aeration ranging between 0.10 and 0.15 m3 m−3 [56]. Therefore, regardless of treatment, this indicator was not compromised, although values close to critical were obtained in the 0.10–0.20 m layer in ISPS + T, SPS, and OP (Figure 5d), indicating a high risk of functional impairment in the soil. Studies have shown that soil management practices produce the largest spatial changes in MaP, but have limited effects in MiP at depth [45,46], agreeing with the results of this study.
Despite microporosity (MiP) not showing significant differences among the management systems evaluated in the univariate analysis, its prominent role in the multivariate analysis highlights its ecological and functional relevance. MiP is crucial for soil water retention, especially at tensions associated with plant-available water [22]. Micropores store water that remains accessible to roots between field capacity and the permanent wilting point, directly contributing to plant survival during periods of water deficits [44]. Furthermore, the stability of MiP across treatments suggests a degree of resilience in the soil’s ability to maintain essential water storage functions, an aspect that is fundamental for the sustainability of pasture systems under variable climatic conditions.
Although changes in Bd, TP, MaP, and ACt, caused by the treatments, occurred in the 0.10–0.20 m layer, the properties associated with soil water retention such as FC and AWC were not changed in this layer and in the remaining depths (0.00–0.05 and 0.20–0.40 m and 0.00–0.05, 0.05–0.10, and 0.20–0.40 m). FC was also important in the characterization by principal component analysis (PC2) and in the differentiation of treatments by canonical discriminant analysis (CAN 1 and CAN 2). FC is important in establishing the initial conditions for hydrological and agronomic applications and in determining the water available in the soil for plants [57].
AWC was not considered in the multivariate analysis due to its linear effect with FC (AWC = FC − PWP), as demonstrated by the high Pearson linear correlation (0.819); however, in the univariate approach, AWC reflected the effects of the treatments on FC, since PWP did not present differences between treatments in all soil layers due to the similar behavior of retention curves at high tensions (Figure 5). According to [58], the variation range between the water retention curves decreased (Figure 1), which is attributed to the fact that, at a high water content, the characteristic curve depends on the arrangement and dimensions of the pores, becoming a function of soil density and porosity. In contrast, at low water content, the matric potential is more strongly influenced by soil texture and mineralogy. In addition, sandy soil has larger pores, and thus it loses water more easily under low tensions, resulting in less water being retained at low potentials, factors which are responsible for the presence of water in the soil due to capillary forces [59].
AWC is important for root growth, chemical reactions, movement, and nutrient uptake by plants [59]. Thus, higher AWC values in ISPS + L and ISPS + T, except for the 0.10–0.20 m layer, indicate better water availability for the plants when compared to SPS and OP, as well as to TR (Figure 5c). Notably, in the 0.10–0.20 m layer, there were no differences in AWC between the treatments, possibly because it is the most compacted layer of the soil and due to the absence of differences in the retention curve (Figure 4c); thus, FC and PWP also did not present differences between the systems (Figure 5a,b).
By using the S-index in the evaluation of soil physical quality, high correlations were observed with PC1 and PC2, and it made a large contribution to the variance explained in PC2, although this indicator did not make a significant contribution to the formation of canonical discriminant functions. The index was sensitive to the effects of soil management, allowing us to confirm the changes in water dynamics by management systems, since significant differences were obtained in the 0.00–0.05 and 0.10–0.20 m layers. As the S-index represents the slope of the retention curve at the inflection point, it is sensitive to the change in the shape of the soil water retention curves [60].
For soils of the Brazilian Cerrado, ref. [61] suggested using an S-index threshold of 0.045 to differentiate soils with good structural quality from those prone to degradation, with values below 0.025 indicating severe physical degradation. Based on this criterion, all treatments presented at least one layer with a tendency to degrade (0.025 < S-index < 0.045). Notably, ISPS + L, ISPS + T, and SPS had three out of four layers with S-index values below 0.045. Thus, higher S-index values in OP and TR may be attributed to the strong positive correlation between this index and ACt. That is, it may be associated with the larger pores that contribute to aeration and water movement in the soil. The S-index is mainly associated with structural porosity (such as microcracks, cracks, biopores, and structures formed by tillage), and it is therefore a key indicator of soil physical quality. Soils with only textural porosity tend to have poor physical quality, being difficult to manage and showing low water infiltration rates. Thus, structural pores and high S-index values are essential for good soil quality [31,61]. Ref. [34] found, in pasture areas, the lowest S-index value (0.066 and 0.063) in the 0.00–0.10 and 0.20–0.30 m layers, indicating a decrease in soil physical quality due to the disproportionate distribution of pore size.
The canonical discriminant analysis showed that, considering all the properties analyzed in all soil layers, there was a distinction between the ISPS + L and ISPS + T treatments and the SPS, OP, and TR treatments. ISPS + L and ISPS + T present better soil physical quality, and share similar characteristics such as the use of grass + shrub consortium; in turn, SPS and OP are characterized by the absence of consortium; thus, grazing occurs only in the grassy area. These results agree with the findings of [52], who found better physical soil quality in eucalyptus silvopastoral systems with three to four years of implementation in 3 m rows and crop–livestock integration when compared to degraded pasture.
Although there were some differences in the properties evaluated in this study between the treatments, these were not as significant as expected; this may be due to the rotational grazing in the different treatments, which, according to [62], reduces changes in physical properties and does not cause any damage to the pasture or subsequent crops when the animal load is managed properly. However, it is expected that as the years increase and the systems are established more, the forest component and the consortia of the silvopastoral systems may further present advantages in improving the physical–hydraulic quality of the soil.
The results obtained in this study corroborate observations from previous research conducted in silvopastoral and agroforestry systems in tropical regions. Refs. [22,23] reported that the integration of trees and shrubs into animal production systems reduces the impact of grazing on soil structure, favoring water infiltration and the preservation of functional porosity. Similarly, studies conducted in the Cerrado biome, such as that by [63], demonstrated that silvopastoral systems promote lower soil bulk density values and higher levels of available water when compared to conventional pastures, results that align with the effects observed for the ISPS + L and ISPS + T management systems in this study.
Moreover, meta-analyses such as the one conducted by [47] reinforce the evidence that tree-based agroforestry systems improve soil physical quality, with significant enhancements in macroporosity, water retention capacity, and structural stability, especially under tropical and subtropical climate conditions. According to these authors, the integration of trees can enhance soil aggregate stability and water infiltration, factors that are essential for environmental resilience in productive systems.
The physical–hydraulic improvements observed in silvopastoral systems with shrub consortia have important practical and ecological implications. Increased soil water retention and improved soil structure contribute to enhancing pasture resilience under climatic variability [46,47]. The presence of shrubs such as Leucaena leucocephala also favors carbon sequestration and promotes biodiversity [16,22], reinforcing the sustainability of production systems. Thus, intensive silvopastoral systems represent an efficient strategy for sustainable livestock production and environmental conservation in tropical regions.
The findings of this study have important practical implications for land use management in tropical regions. The adoption of intensive silvopastoral systems, particularly those involving grass and shrub consortia, has demonstrated potential to improve soil physical–hydraulic quality by promoting greater water retention, enhanced aeration, and reduced compaction. These improvements are essential for sustaining pasture productivity and increasing the resilience of production systems in the face of climatic variability. Therefore, land use decisions that prioritize the implementation of shrub–grass consortia in livestock systems may contribute to mitigating soil degradation, conserving water resources, and maintaining long-term productive capacity. Encouraging the adoption of integrated practices, such as the use of species like Leucaena leucocephala, may represent an efficient strategy to promote more sustainable production systems adapted to climate change.

5. Conclusions

This study showed, in a short-term evaluation, that the soil physical–hydraulic properties were sensitive to the effects of livestock management systems. The use of intensive silvopastoral systems with grasses in consortium with shrub species of Leucena and Tithonia presented a higher field capacity and available water content than the non-consortium systems of grasses (i.e., silvopastoral system and open pasture). Nevertheless, a long-term evaluation should be carried out to assess the effects of these systems on soil physical–hydraulic quality. The indicators examined, namely bulk density, soil aeration capacity, macroporosity, field capacity, microporosity, and S-index, showed the greatest variation between the evaluated systems; however, field capacity, soil aeration capacity, macroporosity, and microporosity allowed for the greatest differentiation between the treatments. Therefore, these properties are important in studies of soil physical quality, since they bring information about the porous state of the soil and its ability to retain water and exchange air and gases in the soil.
Despite the positive results observed, it is important to recognize that factors such as soil type, climatic conditions, topography, and seasonal variation may have influenced the physical–hydraulic attributes independently of the evaluated management systems. Although the study was conducted under controlled field conditions, these variables represent inherent sources of variability. Additionally, the short evaluation period and methodological limitations, such as the number of soil samples and variability in soil structure measurements, should be considered when interpreting the results.
The findings provide consistent evidence that silvopastoral systems with shrub consortia can improve the physical–hydraulic quality of the soil and contribute to sustainable land management strategies in tropical regions. Long-term studies, encompassing different environmental and seasonal conditions, are recommended to validate and expand the conclusions of this work.

Author Contributions

Conceptualization, O.V.S.J. and Z.M.d.S.; Methodology, O.V.S.J., Z.M.d.S., D.A.A.E., L.P.B., R.P.d.L., C.L.B. and R.B.d.S.; Software, D.A.A.E.; Validation, O.V.S.J., D.A.A.E. and C.L.B.; Formal analysis, O.V.S.J., D.A.A.E., E.M.G., R.P.d.L., C.L.B. and R.B.d.S.; Investigation, O.V.S.J., D.A.A.E., L.P.B., E.M.G., R.P.d.L. and R.B.d.S.; Resources, O.V.S.J. and Z.M.d.S.; Data curation, O.V.S.J. and D.A.A.E.; Writing—original draft, O.V.S.J., D.A.A.E., L.P.B. and E.M.G.; Writing—review & editing, O.V.S.J., Z.M.d.S., D.A.A.E., L.P.B., E.M.G., R.P.d.L., C.L.B. and R.B.d.S.; Visualization, O.V.S.J., D.A.A.E. and E.M.G.; Supervision, O.V.S.J. and Z.M.d.S.; Project administration, O.V.S.J. and Z.M.d.S.; Funding acquisition, O.V.S.J. and Z.M.d.S. All authors have read and agreed to the published version of the manuscript.

Funding

This research was funded by the National Council for Scientific and Technological Development, grant number 130605/2020-4.

Data Availability Statement

The original contributions presented in this study are included in the article. Further inquiries can be directed to the corresponding author.

Acknowledgments

The authors thank “Rizoma Agro” for the experimental area’s availability and logistical support (equipment, crop management, and technical and field staff).

Conflicts of Interest

The authors declare no conflicts of interest.

References

  1. ABIEC; Brazilian Beef Exporters Association. Beef Report 2023—Perfil da Pecuária no Brasil; ABIEC: Brasília, Brazil, 2024; 106p. [Google Scholar]
  2. Macedo, M.C.M.; Zimmer, A.H.; Kichel, A.N.; Giolo, R.A.; Araujo, A.A.R. Degradação de Pastagens, Alternativas de Recuperação e Renovação e Formas de Mitigação; Embrapa Gado de Corte: Campo Grande, Brazil, 2013; 42p. [Google Scholar]
  3. Silva, R.O.; Barioni, L.G.; Hall, J.A.J.; Moretti, A.C.; Veloso, R.F.; Alexander, P.; Crespolini, M.; Moran, D. Sustainable intensification of Brazilian livestock production through optimized pasture restoration. Agric. Syst. 2017, 153, 201–211. [Google Scholar] [CrossRef]
  4. Moraes, A.; de Faccio Carvalho, P.C.; Anghinoni, I.; Lustosa, S.B.C.; de Andrade Costa, S.E.V.G.; Kunrath, T.R. Integrated crop-livestock systems in the Brazilian subtropics. Eur. J. Agron. 2014, 57, 4–9. [Google Scholar] [CrossRef]
  5. Feltran-Barbieri, R.; Féres, J.G. Degraded pastures in Brazil: Improving livestock production and forest restoration. R. Soc. Open Sci. 2021, 8, 201854. [Google Scholar] [CrossRef]
  6. LAPIG. Laboratório de Processamento de Imagens e Geoprocessamento—Universidade Federal de Goiás (UFG) Atlas das Pastagens. 2022. Available online: https://atlasdaspastagens.ufg.br/map (accessed on 10 February 2024).
  7. Zhou, W.; Li, J.; Yue, T. Remote Sensing Monitoring and Evaluation of Degraded Grassland in China; Springer Geography: Singapore, 2020; pp. 125–138. [Google Scholar]
  8. Carvalho, W.T.V.; Minighin, D.C.; Gonçalves, L.C.; Villanova, D.F.Q.; Mauricio, R.M.; Pereira, R.V.G. Pastagens degradadas e técnicas de recuperação: Revisão. PUBVET 2017, 11, 1036–1045. [Google Scholar]
  9. Vásquez, H.V.; Puscán, M.M.H.; Bobadilla, L.G.; Zagaceta, H.; Valqui, L.; Maicelo, J.L.; Silva-López, J.O. Evaluation of pasture degradation through vegetation indices of the main livestock micro-watersheds in the Amazon region (NW Peru). Environ. Sustain. Ind. 2023, 20, 100315. [Google Scholar] [CrossRef]
  10. Simões, V.J.L.P.; de Souza, E.S.; Leite, M.L.M.; Souza, R.; Silva, J.R.I.; Sales, A.T.; Tabosa, J.N.; Lima, J.R.S.; Antonino, A.C.D. Physical-hydric attributes and soil CO2 efflux in pastoral systems in a Brazilian semi-arid environment. Agrofor. Syst. 2023, 97, 1421–1433. [Google Scholar] [CrossRef]
  11. Dexter, A.R. Advances in characterization of soil structure. Soil Tillage Res. 1988, 11, 199–238. [Google Scholar] [CrossRef]
  12. Li, X.; Hou, X.; Liu, Z.; Guo, F.; Din, Y.; Duan, J. Long-term overgrazing-induced changes in topsoil water-retaining capacity in a typical steppe. Rangel. Ecol. Manag. 2017, 70, 324–330. [Google Scholar] [CrossRef]
  13. Nascimento, D.M.; Cavalieri-Polizeli, K.M.V.; Silva, A.H.; Favaretto, N.; Parron, L.M. Soil physical quality under long-term integrated agricultural production systems. Soil Tillage Res. 2019, 110, 292–299. [Google Scholar] [CrossRef]
  14. Benevenute, P.A.N.; Morais, E.G.; Souza, A.; Vasques, I.C.F.; Cardoso, D.P.; Severiano, E.C.; Homem, B.G.C.; Casagrande, D.R.; Silva, B.M. Penetration resistance: An effective indicator for monitoring soil compaction in pastures. Ecol. Indic. 2020, 117, 106647. [Google Scholar] [CrossRef]
  15. Cherubin, M.R.; Chavarro-Bermeo, J.P.; Silva-Olaya, A.M. Agroforestry systems improve soil physical quality in northwestern Colombian Amazon. Agrofor. Syst. 2019, 93, 1741–1753. [Google Scholar] [CrossRef]
  16. Chará, J.; Jose, S. Silvopastoral Systems of Meso America and Northern South America; Springer International Publishing: Cham, Switzerland, 2023; 347p. [Google Scholar]
  17. Greenwood, K.L.; McKenzie, B.M. Grazing effects on soil physical properties and the consequences for pastures: A review. Aust. J. Exp. Agric. 2001, 41, 1231–1250. [Google Scholar] [CrossRef]
  18. Martha, G.B., Jr.; Alves, E.; Contini, E. Land-Saving approaches and beef production growth in Brazil. Agric. Syst. 2012, 110, 173–177. [Google Scholar] [CrossRef]
  19. Martinkoski, L.; Vogel, G.F.; Jadoski, S.O.; Watzlawick, L.F. Qualidade física do solo sob manejo silvipastoril e floresta secundária. Floresta Ambient. 2017, 24, e20160282. [Google Scholar] [CrossRef]
  20. Montagnini, F.; Somarriba, E.; Murgueitio, E.; Fassola, H.; Eibl, B. Sistemas Agroflorestales, Funciones Productivas, Socioeconomicas y Ambientales; Serie Técnica; Informe Técnico 402; CATIE, Turrialba, Costa Rica; Editorial CIPAV: Cali, Colombia, 2015; p. 454. [Google Scholar]
  21. Urruth, L.M.; Bassi, J.B.; Chemello, D. Policies to encourage agroforestry in the Southern Atlantic Forest. Land Use Policy 2022, 112, 105802. [Google Scholar] [CrossRef]
  22. Murgueitio, E.; Calle, Z.; Uribe, F.; Calle, A.; Solorio, B. Native trees and shrubs for the productive rehabilitation of tropical cattle ranching lands. For. Ecol. Manag. 2011, 261, 1654–1663. [Google Scholar] [CrossRef]
  23. Rivera, L.; Armbrecht, I.; Calle, Z. Silvopastoral systems and ant diversity conservation in a cattle-dominated landscape of the Colombian Andes. Agric. Ecosyst. Environ. 2013, 81, 188–194. [Google Scholar] [CrossRef]
  24. Lal, R.; Pierce, F.J. The vanishing resource. In Soil Management for Sustainability; Lal, R., Pierce, F.J., Eds.; Soil Water Conservation Society: Ankeny, IA, USA, 1991; pp. 1–5. [Google Scholar]
  25. Rachwal, M.F.G.; Dedecek, R.A.; Maia, C.M.B.F.; Parron, L.M. Uso e Manejo da terra e aspectos pedológicos na avaliação de serviços ambientais. In Serviços Ambientais em Sistemas Agrícolas e Florestais do Bioma Mata Atlântica; Parron, L.M., Garcia, J.R., Oliveira, E.B., Brown, G.G., Prado, R.B., Eds.; Embrapa: Brasília, Brasil, 2015; pp. 57–70. [Google Scholar]
  26. Reynolds, W.D.; Bowman, B.T.; Drury, C.F.; Tan, C.S.; Lu, X. Indicators of good soil physical quality: Density and storage parameters. Geoderma 2002, 110, 131–146. [Google Scholar] [CrossRef]
  27. Noordwijk, M.V.; Farida, S.P.; Agus, F.; Hairiah, K.; Suprayogo, D.; Verbist, B. Watershed functions in productive agricultural landscapes with trees. In World Agroforestry into the Future; Garrity, D., Okono, A., Grayson, M., Parrott, S., Eds.; World Agroforesty Centre: Nairobi, Kenya, 2006; pp. 103–112. [Google Scholar]
  28. Bargués Tobella, A.; Reese, H.; Almaw, A.; Bayala, J.; Malmer, A.; Laudon, H.; Ilstedt, U. The effect of trees on preferential flow and soil infiltrability in an agroforestry parkland in semiarid Burkina Faso. Water Resour. Res. 2014, 50, 2108–2123. [Google Scholar] [CrossRef]
  29. Peri, P.L.; Chará, J.; Viñoles, C.; Bussoni, A.; Cubbage, F. Current trends in silvopastoral systems. Agrofor. Syst. 2024, 98, 1945–1953. [Google Scholar] [CrossRef]
  30. Van Genuchten, M.T. A closed-form equation for predicting the hydraulic conductivity of unsaturated soils. Soil Sci. Soc. Am. J. 1980, 44, 892–898. [Google Scholar] [CrossRef]
  31. Dexter, A.R. Soil physical quality: Part I. Theory, Effects of soil texture, density, and organic matter, and effects on root growth. Geoderma 2004, 120, 201–214. [Google Scholar] [CrossRef]
  32. Dexter, A.R. Soil physical quality: Part III. Unsaturated hydraulic conductivity and general conclusions about S-theory. Geoderma 2004, 120, 227–239. [Google Scholar] [CrossRef]
  33. Aratani, R.G.; Freddi, O.S.; Centurion, J.F.; Andrioli, I. Physical quality of an Anionic Acrustox under different management systems. Rev. Bras. Ciênc. Solo 2009, 33, 677–687. [Google Scholar] [CrossRef]
  34. Carvalho Filho, A.; Carvalho, L.C.C.; Centurion, J.F.; Beutler, A.N.; Cortez, J.W.; Ribon, A.A. Qualidade física de um Latossolo Vermelho férrico sob sistemas de uso e manejo. Biosci. J. 2009, 25, 43–51. [Google Scholar]
  35. Al-Kayssi, A.W. Use of water retention data and soil physical quality index S to quantify hard-setting and degree of soil compactness indices of gypsiferous soils. Soil Tillage Res. 2021, 206, 104805. [Google Scholar] [CrossRef]
  36. Dlapa, P.; Hrinik, D.; Hrabovsky, A.; Simkovic, I.; Zarnovicano, H.; Sekucia, F.; Kollar, J. The impact of land-use on the hierarchical pore size loamy soils. Water 2020, 12, 339. [Google Scholar] [CrossRef]
  37. Luz, F.B.; Carvalho, M.L.; Borba, D.A.; Schiebelbein, B.E.; Lima, P.V.; Cherubin, M.R. Linking soil water changes to soil physical quality in sugarcane expansion areas in Brazil. Water 2020, 12, 3156. [Google Scholar] [CrossRef]
  38. Alvares, C.A.; Stape, J.L.; Sentelhas, P.C.; Gonçalves, J.L.M.; Sparovek, G. Köppen’s climate classification map for Brazil. Meteorol. Z. 2013, 22, 711–728. [Google Scholar] [CrossRef]
  39. Soil Survey Staff. Keys to Soil Taxonomy, 12th ed.; United States Department of Agriculture, Natural Resources Conservation Service: Washington, DC, USA, 2014; 372p.
  40. Teixeira, P.C.; Donagemma, G.K.; Fontana, A.; Teixeira, W.G. Manual de Métodos de Análise de Solos, 3rd ed.; Embrapa: Brasília, Brazil, 2017; 573p. [Google Scholar]
  41. Dourado-Neto, D.; Nielsen, D.R.; Hopmans, J.W.; Reichardt, K.; Bafchi, O. Programa para confecção da curva de retenção de água no solo, modelo Van Genuchten. Eng. Rural. 2001, 1, 92–102. [Google Scholar]
  42. Mualem, Y. A new model for predicting the hydraulic conductivity of unsaturated porous media. Water Resour. Res. 1976, 12, 513–522. [Google Scholar] [CrossRef]
  43. Khattree, R.; Naik, D.N. Multivariate Data Reduction and Discrimination with SAS Software; SAS Institute: Cary, NC, USA, 2000; 553p. [Google Scholar]
  44. Reichardt, K.; Dourado-Neto, D.; Timm, L.C.; Basanta, M.V.; Cavalcante, L.F.; Teruel, D.A.; Bafchi, O.O.S.; Tominaga, T.T.; Cerri, C.C.; Trivelin, P.C.O. The fate of organic matter in a sugarcane system in Brazil. In Management of Crop Residues for Sustainable Crop Production; IAEA-TECDOC–1354; IAEA: Vienna, Austria, 2003; pp. 149–169. [Google Scholar]
  45. Giarola, N.F.B.; Tormena, C.A.; Dutra, A.C. Physical degradation of a Red Latosol used for intensive forage production. Rev. Bras. Ciênc. Solo 2007, 31, 863–873. [Google Scholar] [CrossRef]
  46. Vasconcelos, R.F.B.; Souza, E.R.; Cantalice, J.R.B.; Silva, L.S. Qualidade física de Latossolo Amarelo de tabuleiros costeiros em diferentes sistemas de manejo da cana-de-açúcar. Rev. Bras. Eng. Agríc. Ambient. 2014, 18, 381–386. [Google Scholar] [CrossRef]
  47. Cardinael, R.; Chevallier, T.; Barthès, B.G.; Saby, N.P.; Parent, T.; Dupraz, C.; Bernoux, M.; Chenu, C. Impact of alley cropping agroforestry on stocks, forms and spatial distribution of soil organic carbon: A meta-analysis. Agric. Ecosyst. Environ. 2017, 240, 280–295. [Google Scholar]
  48. Pezzopane, J.R.M.; Martins, S.V.; Pezzopane, C.G.; Cecon, P.R.; Ferreira, D.F. Rooting depth and water extraction patterns of Leucaena leucocephala in silvopastoral systems. Agrofor. Syst. 2015, 89, 265–273. [Google Scholar]
  49. Fisher, R.F.; Jones, R.J.; Hughes, R.M. Tree Legumes for Improved Farming Systems in the Humid Tropics; CAB International: Wallingford, CT, USA, 1994. [Google Scholar]
  50. Shelton, H.M.; Franzel, S.; Peters, M. Legume shrubs and trees for forage in the tropics: Their management and development. Trop. Grassl. 2005, 39, 1–14. [Google Scholar]
  51. Jama, B.; Swinkels, R.A.; Hess, C.E. Tithonia diversifolia as a green manure for soil fertility improvement in western Kenya: A review. East Afr. Agric. For. J. 2000, 65, 97–107. [Google Scholar]
  52. Assis, P.C.R.; Stone, L.F.; Medeiros, J.C.; Oliveira, J.M.; Wruck, F.J.; Madari, B.E.; Heinemann, A.B. Atributos físicos, químicos e biológicos do solo em sistemas de integração lavoura-pecuária-floresta. Agrarian 2019, 12, 57–70. [Google Scholar] [CrossRef]
  53. Kopi, A.J.; Douglas, J.T. A rapid, inexpensive and quantitative procedure for assessing soil structure with respect to cropping. Soil Use Manag. 1991, 7, 52–56. [Google Scholar] [CrossRef]
  54. Baver, L.D.; Gardner, W.H.; Gardner, W.R. Soil Physics; John Wiley & Sons: New York, NY, USA, 1972; 498p. [Google Scholar]
  55. Castellini, M.; Stellafci, A.M.; Barca, E.; Iovino, M. Application of multivariate analysis techniques for selecting soil physical quality indicators: A case study in long-term field experiments in Apulia (Southern Italy). Soil Sci. Soc. Am. J. 2019, 83, 707–720. [Google Scholar] [CrossRef]
  56. Topp, G.C.; Reynolds, W.D.; Cook, F.J.; Kirby, J.M.; Carter, M.R. Physical attributes of soil quality. In Soil Quality for Crop Production and Ecosystem Health. Developments in Soil Science; Gregorich, E.G., Carter, M.R., Eds.; Elsevier: New York, NY, USA, 1997; pp. 21–58. [Google Scholar]
  57. Assouline, S.; Or, D. The concept of field capacity revisited: Defining intrinsic static and dynamic criteria for soil internal drainage dynamics. Water Resour. Res. 2014, 50, 4787–4802. [Google Scholar] [CrossRef]
  58. Suzuki, L.E.A.S.; Lima, C.L.R.; Reinert, D.J.; Reichert, J.M.; Pillon, C.M. Estrutura e armazenamento de água em um Argissolo sob pastagem cultivada, floresta nativa e povoamento de eucalipto no Rio Grande do Sul. Rev. Bras. Ciênc. Solo 2014, 38, 94–106. [Google Scholar] [CrossRef]
  59. Reichardt, K. A Água em Sistemas Agrícolas; Editora Manole Ltda: São Paulo, Brazil, 1990. [Google Scholar]
  60. Streck, C.A.; Reinert, D.J.; Reichert, J.M.; Horn, R. Relações do parâmetro S para algumas propriedades físicas de solos do sul do Brasil. Rev. Bras. Ciênc. Solo 2008, 32, 2603–2612. [Google Scholar] [CrossRef]
  61. Andrade, R.S.; Stone, L.F. S index as an indicator of physical quality of Brazilian ‘Cerrado’ soils. Rev. Bras. Eng. Agríc. Ambient. 2009, 13, 382–388. [Google Scholar] [CrossRef]
  62. Albuquerque, J.A.; Sangoi, L.; Ender, M. Efeito da integração lavoura-pecuária nas propriedades físicas do solo e características da cultura do milho. Rev. Bras. Ciênc. Solo 2001, 25, 717–723. [Google Scholar] [CrossRef]
  63. Barros, F.S.M.; Klutsch, J.G.; Moreira, F.M.S.; Franco, A.L.C.; Macedo, M.C.M.; Boddey, R.M. Soil physical quality and carbon stocks under integrated crop-livestock-forest systems in the Brazilian Cerrado. Agric. Ecosyst. Environ. 2019, 278, 21–29. [Google Scholar]
Figure 1. Location of experimental area in Iaras, São Paulo, Brazil. ISPS + L = intensive silvopastoral system in consortium with Leucena; ISPS + T = intensive silvopastoral system in consortium with Tithonia; SPS = silvopastoral system; OP = open pasture.
Water 17 01486 g001
Figure 2. Design of crop–livestock systems evaluated in experimental area in municipality of Iaras, state of São Paulo, Brazil. ISPS + L = intensive silvopastoral system in consortium with Leucena; ISPS + T = intensive silvopastoral system in consortium with Tithonia; SPS = silvopastoral system; OP = open pasture under rotational grazing system.
Water 17 01486 g002
Figure 3. Bulk density and porosity in different layers for Oxisol with a loamy sandy texture under different livestock production systems: (a) bulk density−Bd; (b) total porosity−TP; (c) macroporosity−MaP; (d) microporosity−MiP; ISSP + L = intensive silvopastoral system with Leucena; ISSP + T = intensive silvopastoral system with Tithonia; SPS = silvopastoral system; OP = open pasture; TR = tree row. Different letters indicate significant differences among treatments in the same soil layer as determined using Tukey’s test at a 5% significance level; ns = treatments in the same soil layer are not statistically different, as determined using Tukey’s test.
Water 17 01486 g003
Figure 4. Soil water retention curves in different layers for Oxisol with a loamy sandy texture under different livestock production systems at the 0.00–0.05 (a), 0.05–0.10 (b), 0.10–0.20 (c), and 0.20–0.40 m (d) soil layers. ISSP + L = intensive silvopastoral system with Leucena; ISSP + T = intensive silvopastoral system with Tithonia; SPS = silvopastoral system; TR = tree row; OP = open pasture; θ = volumetric soil water content (m3 m−3); h = soil water tension (kPa); FC = field capacity; PWP = permanent wilting point.
Water 17 01486 g004
Figure 5. Soil physical–hydraulic properties and S-index in different layers for Oxisol with loamy sandy texture under different livestock production systems. (a) Field capacity—FC; (b) permanent wilting point—PWP; (c) available water content—AWC; (d) total aeration capacity—ACt; (e) S-index; ISSP + L = intensive silvopastoral system with Leucena; ISSP + T = intensive silvopastoral system with Tithonia; SPS = silvopastoral system; TR = tree row; OP = open pasture. Different letters indicate significant differences among treatments in the same soil layer as determined by Tukey’s test at 5% significance level; ns = treatments in the same soil layer are not statistically different using Tukey’s test.
Water 17 01486 g005
Figure 6. Biplot chart (PC1 and PC2) of soil properties and livestock production management systems. ISPS + L = intensive silvopastoral system with Leucena; ISPS + T = intensive silvopastoral system with Tithonia; SPS = silvopastoral system; OP = open pasture; TR = tree row; Bd = bulk density; TP = total porosity; MaP = macroporosity; MiP = microporosity; FC = field capacity; PWP = permanent wilting point; AWC = available water content; ACt = total aeration capacity; S = S-index.
Water 17 01486 g006
Figure 7. Coefficients of the canonical variables (CAN1 and CAN2) associated with the soil properties of the different livestock production systems. Bd = bulk density; MaP = macroporosity; MiP = microporosity; FC = field capacity; PWP = permanent wilting point; ACt = total aeration capacity; S = S-index.
Water 17 01486 g007
Figure 8. The 95% confidence intervals for the mean vectors of the canonical variables (CAN1 and CAN2) associated with the soil properties of the different livestock production systems. ISPS + L = intensive silvopastoral system with Leucena; ISPS + T = intensive silvopastoral system with Tithonia; SPS = silvopastoral system; OP = open pasture; TR = tree row. Numerical values followed by + and * indicate the means of the treatments in the canonical variables CAN1 and CAN2, respectively.
Water 17 01486 g008
Table 1. Granulometric distribution of soil in experimental area in municipality of Iaras, São Paulo State, Brazil.
Layers (m)Sand (53–2000 µm)Silt (2–53 µm)Clay (<2 µm)Texture
g kg−1
0.00–0.05824.545.9129.6Loamy Sand
0.05–0.10820.649.1130.3Loamy Sand
0.10–0.20825.643.9130.6Loamy Sand
0.20–0.30820.946.8132.2Loamy Sand
0.30–0.70821.045.9133.1Loamy Sand
Table 2. Adjustment parameters of soil water retention curve by van Genuchten model [30] [ θ = θ r + ( θ s θ r )/[1 + (α × h)n]m] for Oxisol with loamy sand texture under different livestock production systems.
Soil Depth (m)TreatmentAdjustment ParametersR2
θ r (m3 m−3) θ s (m3 m−3)α (kPa−1)mn
0.00–0.05ISPS + L0.0370.4021.6290.2351.3070.966
ISPS + T0.0500.4000.8860.2721.3730.946
SPS0.0590.3920.8340.3731.5940.955
OP0.0580.3850.8840.2991.4250.971
TR0.0740.3710.5840.4131.7050.919
0.05–0.10ISPS + L0.0570.3710.9340.2971.4220.960
ISPS + T0.0440.3711.2280.2661.3620.944
SPS0.0690.3381.1940.3151.4610.947
OP0.0530.3771.0300.3061.4400.958
TR0.0710.3680.7430.3891.6370.926
0.10–0.20ISPS + L0.0840.3570.7590.3931.6480.932
ISPS + T0.0910.3050.5590.4141.7060.931
SPS0.0810.2890.6270.3751.6010.958
OP0.0750.3130.6560.3831.6200.965
TR0.0750.3430.8750.3851.6250.960
0.20–0.40ISPS + L0.0560.3371.2870.2721.3740.970
ISPS + T0.0750.3101.0570.2971.4230.949
SPS0.0800.3301.1610.3321.4970.955
OP0.0840.3360.5950.4511.8230.971
TR0.0940.3481.4160.3941.6510.942
Notes: ISSP + L = intensive silvopastoral system with Leucena; ISSP + T = intensive silvopastoral system with Tithonia; SPS = silvopastoral system; TR = tree row; OP = open pasture; θ r = residual water content; θ s = saturation water content; R2 = coefficient of determination; α, m, and n = model parameters.
Table 3. Pearson’s correlation matrix of soil physical–hydraulic indicators.
BdTPMaPMiPFCPWPAWCACtS
Bd ***ns*ns**
TP−0.826 **ns*ns**
MaP−0.5170.723 ******
MiP−0.3180.254−0.484 *ns*ns*
FC0.126−0.110−0.4030.426 ****
PWP0.428−0.250−0.2490.0340.485 ns**
AWC−0.1420.040−0.2950.4620.819−0.103 **
ACt−0.7620.9050.7940.034−0.522−0.419−0.319 *
S−0.5480.4850.2450.272−0.434−0.255−0.3210.601
Notes: Values below the diagonal represent Pearson’s linear correlation coefficients. Bd = bulk density; TP = total porosity; MaP = macroporosity; MiP = microporosity; FC = field capacity; PWP = permanent wilting point; AWC = available water content; ACt = total soil aeration capacity; S = S-index; * = significant at 5% significance level; ns = not significant.
Table 4. Eigenvalues, explained variance, eigenvectors, and correlation coefficients between soil properties of different livestock production systems and first two principal components (PC1 and PC2).
PC1PC2
Eigenvalues4.1381.969
Explained variance (%)59.1228.13
Eigenvectors
Bd−0.4800.049
MaP0.4190.316
MiP0.296−0.517
FC0.277−0.569
PWP−0.3640.189
ACt0.4330.296
Index S0.3320.429
Correlation of the original variables with the principal components PC1 and PC2
Bd−0.98 *0.07
MaP0.85 *0.44
MiP0.60 *−0.73 *
FC0.56 *−0.80 *
PWP−0.74 *0.27
ACt0.88 *0.42
Index S0.68 *0.60 *
Note: * Pearson correlation coefficients at 5% significance level.
Disclaimer/Publisher’s Note: The statements, opinions and data contained in all publications are solely those of the individual author(s) and contributor(s) and not of MDPI and/or the editor(s). MDPI and/or the editor(s) disclaim responsibility for any injury to people or property resulting from any ideas, methods, instructions or products referred to in the content.

