Article

The Fate and Clogging Mechanisms of Suspended Particles in Natural Biofilm-Coated Porous Media

1
College of Environmental Science and Engineering, Guilin University of Technology, Guilin 541000, China
2
Guangxi Key Laboratory of Environmental Pollution Control Theory and Technology, Guilin University of Technology, Guilin 541006, China
3
University Engineering Research Center of Watershed Protection and Green Development, Guangxi, Guilin University of Technology, Guilin 541006, China
4
Collaborative Innovation Center for Water Pollution Control and Water Safety in Karst Area, Guilin University of Technology, Guilin 541000, China
*
Authors to whom correspondence should be addressed.
Water 2025, 17(10), 1480; https://doi.org/10.3390/w17101480
Submission received: 11 April 2025 / Revised: 9 May 2025 / Accepted: 12 May 2025 / Published: 14 May 2025
(This article belongs to the Section Hydrogeology)

Abstract

:
Managed aquifer recharge (MAR) is widely used globally. However, clogging events remain a major obstacle to long-term operations. This study investigated the effects of natural biofilms on the migration and deposition of suspended particles (SPs) at varying concentrations using column experiments and multiple analytical methods. At 74 h, the K′ in the high-concentration group (HT) with biofilm coating decreased by 77.3%, while, in the high-concentration group (HTCK) without biofilm coating, the K′ decreased by 68.5%. Within the same recharge time, the K′ in the medium-concentration group without biofilm coating decreased by 59.9%. The results show that the biofilm covering the porous medium promotes the clogging of suspended particles. Compared with the high-concentration group, the development of porous medium blockage was slower in the low-concentration suspended particle group. SEM and CT analyses revealed that the biofilms altered the surface roughness of the porous media, thereby promoting SP deposition. The study also confirmed that the interactions between SPs and biofilms in recharge water, including electrostatic interactions, hydrophobic interactions, and extracellular polymer flocculation, collectively exacerbated the clogging process in MAR. XDLVO analysis indicated that the biofilm-coated porous media reduced the electrostatic interaction potential energy and energy barrier between SPs and quartz sand, thereby facilitating kaolin deposition in saturated porous media. Correlation and significance analyses identified hydrophobic interactions as the primary mechanism driving SP–biofilm combined with clogging. Moreover, the reduced SP concentrations in the recharge water increased the SP migration distance in porous media, slowing the clogging progression in low-SP groups. These findings offer valuable insights into the prevention and management of MAR clogging caused by the coexistence of biofilms and SPs.

1. Introduction

Managed aquifer recharge (MAR) enhances the sustainable utilization of groundwater by facilitating the transfer of surface water to aquifers and has been widely implemented globally [1,2]. It has been applied across various fields, including water resource management [3], ecological protection [4], water quality improvement [5,6], and geothermal resource utilization [7,8,9]. However, clogging during the recharge process remains a significant challenge for the long-term effectiveness of MAR.
Clogging can be classified into three types: physical, chemical, and biological [2]. Among them, physical clogging caused by the accumulation of suspended particles (SPs) and biological clogging from microbial growth are the most common, accounting for approximately 70% and 15% of the cases, respectively [10,11].
SPs are commonly present in recharge water and are the primary cause of particle clogging in porous media [12,13,14,15]. The migration and deposition of SPs are influenced by factors such as particle size, concentration, pore structure, and flow velocity [2,16,17]. When the SPs in the recharge water exceed the pore diameter of the medium, particles can collide with the pore walls and are filtered out [18,19,20]. Smaller SPs (<0.1 μm) can pass through pore throats but may accumulate on pore walls or within pores owing to gravity, leading to physical sedimentation [21,22]. The risk of clogging increases with higher SP concentrations in the recharge water [16]. When the concentration of suspended particles in the recharge water exceeds 25 mg/L or the turbidity level exceeds three nephelometric turbidity units (NTUs), there is a significant risk of clogging [23,24]. Another study recommended maintaining SP concentrations below 10 mg/L to ensure continuous and effective recharge system operation [25]. In addition, the injection rate of the recharge water affects the clogging behavior. At lower flow rates, particles tend to accumulate near the inlet, whereas higher flow rates facilitate the deeper migration of particles into the porous medium [26].
Biological clogging is a common issue in recharge systems and significantly reduces the permeability of porous media [27,28]. Studies have shown that biological clogging primarily occurs in the surface layer of porous media, potentially decreasing permeability by two to three orders of magnitude [29,30]. This process is largely driven by extracellular polymeric substances (EPSs) secreted by microorganisms, which accumulate in pore channels or adhere to medium particles to form biofilms, eventually filling pore spaces and reducing water conductivity [31]. EPSs, which constitute approximately 80% of the dry weight of biofilms, are critical for forming three-dimensional biofilm structures [32,33]. Factors such as the nutrient concentration, temperature, pH, and oxygen content in recharge water directly influence microbial growth and EPS production, thereby affecting biological clogging [34,35]. As early as the 1950s, researchers identified that EPSs restrict water flow through porous media [36], with clogging severity increasing with increasing EPS content [35,37,38,39].
Microorganisms and SPs commonly coexist in natural environments [2,19,27,40]. Biofilms play a critical role in influencing particle migration and deposition [41,42]. Biofilms have been shown to affect the deposition of nanoparticles (NPs) such as fullerene C60 [43,44], Ag NPs [45,46], ZnO NPs [47], and graphene oxide NPs [48]. However, most studies have focused on the interactions between monospecies biofilms and NPs in porous media [44,46,49,50]. Crampon et al. [51] later observed that natural biofilms inhibited NP migration in porous media. In the context of MAR, Ernissee et al. [52] identified interactions between colloidal particles and microorganisms in recharged water as early as 1975. These interactions can significantly affect the permeability and clogging processes within porous media [2,53,54,55]. Denkhaus et al. [56] demonstrated that van der Waals forces are key to bacterial adhesion to SPs before tight adsorption occurs, whereas Flemming and Wingender [57] highlighted the role of electrostatic forces in facilitating EPS adsorption onto solid surfaces. When both bacteria and SPs are present in recharge water, SPs can inhibit the migration and deposition of Pseudomonas aeruginosa within porous media [53]. Additionally, Wang et al. [58] discovered that biofilms formed by different microbial types alter the surface properties of porous media, thereby affecting SP deposition. However, in the actual MAR process, the effects of natural biofilms formed by diverse microbial communities and varying SP concentrations on the permeability of porous media remain unclear.
Few studies have examined the impact of varying concentrations of SPs in recharge water on the clogging mechanisms of naturally biofilm-coated porous media. How can biofilm coatings formed by indigenous groundwater microorganisms alter the surface properties of porous media? The influence of natural biofilms on SP concentrations in recharge water and their associated clogging mechanisms require further investigation. This study used microbial communities from underground aquifers in the Dagu River Basin, Qingdao, Shandong Province, China, as test strains. Through column experiments, we investigated the evolution of SP clogging at different concentrations under the influence of natural biofilms in porous media. The objectives of this study were to (1) examine the changes in the surface properties of porous media coated with biofilms formed by groundwater microorganisms, (2) reveal the response mechanisms of SP concentration in porous media covered by biofilms, and (3) explore the interactions between and combined clogging mechanisms of groundwater microbial consortium biofilms and SPs.

2. Materials and Methods

2.1. Experimental Materials

2.1.1. Preparation of Porous Medium and Suspended Particles

Standard quartz sand with a particle size of 0.5–1 mm (pure α-quartz phase, SiO2 > 96%; ISO Standard Sand Co., Ltd., Xiamen, China) was adopted as the porous medium. The test sand was rinsed 2–3 times with deionized water and pretreated with 0.25 mol/L HCl (see Table S1 for reagent purity) for 24 h to remove metal impurities. It was then rinsed with ultrapure (UP) water until the pH stabilized at 7.0–7.2. After drying, the sand was burned in a muffle furnace (SRJX-4-13A, Shangyu District Huyue Instrument and Equipment Factory, Shaoxing, China) at 550 °C for 2 h to eliminate organic materials. Finally, the sand was sterilized using ultraviolet light before application.
SPs in the recharge water were simulated using kaolin (dominant kaolinite phase, particle size <5 μm, Aladdin Biochemical Technology Co., Ltd., Shanghai, China). Artificial recharge water was prepared by weighing an appropriate amount of kaolin, mixing it thoroughly with ultrapure water, and allowing it to stand for 12 h. The supernatant was then siphoned off and its absorbance was measured at 680 nm using an ultraviolet–visible spectrophotometer. Based on the turbidity standard curve, kaolin solutions with turbidities of 100, 50, and 10 NTU were prepared for subsequent analyses.

2.1.2. Microbial Cultivation

In this study, a microbial consortium from an aquifer in the Dagu River Basin, Qingdao City, Shandong Province, China, was selected as the test microorganism. The consortium was cultured in enrichment medium containing peptone, yeast extract, and NaCl to evaluate its growth cycle. To minimize the risk of microbial variation caused by multiple passages, the test strains were limited to five generations.

2.2. Experimental Setup

The test apparatus consisted of an inlet tank (with a stirrer), a Plexiglas column, a water head control device, a peristaltic pump, and a manometric plate. A schematic of the seepage test device is shown in Figure S1. The column had a height of 20 cm and inner diameter of 4 cm. One side of the column was connected at depths of 0, 1, 4, 7, 10, and 13 cm from the sand surface to a pressure plate using PVC hoses for hydraulic conductivity assessment. All components were sterilized using ultraviolet light for 24 h prior to use.
The pretreated quartz sand was packed into the sand column using a wet method, with a stainless-steel screen placed at the bottom to prevent sand loss due to water flow. Deionized water was continuously injected from the bottom to the top of the column for 24 h to remove the residual gas from the porous media. The coating of porous media by biofilms referred to the method of Wang et al. [58] and was modified specifically as follows: After filling the column, 10 mL of the bacterial solution in the stable growth phase was diluted with 90 mL of LB liquid medium. The diluted bacterial solution was pumped into the column from top to bottom at a constant head (ΔH = 5 cm) for 4 h and was followed by an injection in the opposite direction for another 4 h. The porous medium was then immersed in the bacterial solution, and the injection was stopped to allow saturation for 4 h. This process was repeated twice to ensure even biofilm coating on the porous media surface. After biofilm formation, the loosely adherent biofilm was eluted using 10 mM NaCl, and the configured recharge water was injected from the top of the column at a constant head (ΔH = 5 cm).

2.3. Experimental Design

To investigate the combined clogging mechanism resulting from the interaction between SPs and biofilm at varying concentrations in recharge water, recharge water was injected into the sand column from top to bottom at a constant head (ΔH = 5 cm) after the porous media were uniformly coated with biofilm. The experimental groups (Table 1) included a control group consisting of porous media that were not coated with biofilm.

2.4. Analysis Method

2.4.1. Saturated Hydraulic Conductivity

The saturated hydraulic conductivity K of the sand column was calculated using Darcy’s law:
K = 4 Q · x π d 2 · h
where Q is the flow rate (m3/d), Δx is the distance between the two manometric tubes (m), Δh is the hydraulic head difference at a distance of Δx (m), and d is the inner diameter of the sand column (m).
The relative hydraulic conductivity (K′) at different recharge times was used to assess the degree of clogging in the column:
K = K t K 0
where K0 is the initial hydraulic conductivity of the porous media (m/d), and Kt is the hydraulic conductivity at any time (m/d).

2.4.2. Zeta Potential and Contact Angle

The zeta potential of the sand was measured by Zetasizer Nano ZS 90 (Malvern, Worcestershire, UK). First, we crushed and ground the sample in a mortar, then mixed it with UP water to prepare a suspension of 100 NTU as the solution to be tested and conducted the determination under the condition of pH 7.0. The contact angle was determined using a contact angle meter (SDC-100, Dayte Intelligent Technology Co., Ltd., Dongguan, China). We employed two polar liquids (ultrapure water and glycerol) and one non-polar liquid (diiodomethane) as detection solutions. To mitigate the influence of surface roughness on measurement outcomes, the samples were polished prior to measurement to achieve a smooth mirror-like surface. For powder samples such as kaolin, after grinding, they were pressed into thin sheets, followed by direct contact angle measurements utilizing a contact angle measuring instrument. All measurements were conducted under natural pH conditions.

2.4.3. Biomass and Suspended Particle Deposition in Each Layer of Sand Column

At the end of the recharge experiment, sand samples from different seepage sections were analyzed using the loss-on-ignition method to quantify the biomass in the porous media [59]. The surface deposition of SPs in the porous media was determined by calculating the mass difference of the sand before and after recharge [55].

2.4.4. Extraction and Determination of EPSs

EPSs in porous media were extracted using the formaldehyde–NaOH method [35]. The polysaccharide content (μg/g sand) in the EPSs was quantified using the phenol–sulfuric acid method, whereas the protein content (μg/g sand) was determined using the Coomassie blue staining method.

2.4.5. Computed Tomography (CT) Imaging

To visually observe the spatial distribution of SPs within the sand column, the experiment was replicated using scaled-down organic glass columns (4 cm in diameter and 5 cm in height) and analyzed using X-ray computed tomography (X-CT). An industrial CT scanner with a scan voltage of 80 kV, a current of 100 µA, and an image resolution of 28 µm (X-EYE PCT-G3, Seoul, Republic of Korea) was used.

2.4.6. Microtopography of Sand Grain Surface

At the end of the recharge experiment, sand samples were collected for micromorphological analysis using a field-emission scanning electron microscope (S-3400N, Hitachi Limited, Tokyo, Japan). The micromorphology of the sand particles was examined before and after biofilm coating and in the presence of SPs. The sand samples were first fixed in 4% glutaraldehyde at 4 °C for 24 h, dehydrated with ethanol, and dried using a vacuum freeze dryer. The pretreated sample surfaces were coated with a platinum film to enhance electrical conductivity before their observation under a scanning electron microscope.

2.4.7. High-Throughput Sequencing

After sampling from different seepage sections of the sand column, the samples were mixed thoroughly, and DNA was extracted. DNA quality was assessed using 1% agarose gel electrophoresis, and a NanoDrop spectrophotometer was used to determine DNA concentration and quality. Qualified DNA samples (30 µg) were subjected to PCR amplification using a TransGen AP221-02 kit. Each sample was tested in triplicate, and PCR products from the same sample were pooled and analyzed using 2% agarose gel electrophoresis. The DNA inserts were then sequenced by target region amplification on an Illumina MiSeq sequencer.

2.4.8. XDLVO Theory

This experiment employed the extended Derjaguin–Landau–Verwey–Overbeek (XDLVO) theory to quantify the interaction energy between microorganisms, kaolin, and quartz sand [60,61]. Following Wu et al.’s [62] method, microorganisms, quartz sand, and kaolin were modeled as ball–plate geometric systems. The potential energies of the van der Waals forces (LW), electrostatic forces (EL), and Lewis acid–base forces (AB) were calculated using Equations (3), (4), and (5), respectively. The total interaction energy was determined as the sum of three potential energies.
G L W = A 132 r 6 h 1 + 14 h λ 1
G E L = π r ε ε 0 2 ξ p ξ s ln 1 + e x p k h 1 e x p k h + ξ p 2 + ξ s 2 ln 1 e x p 2 k h
G A B = 2 π r λ A B G h 0 A B e x p h 0 h λ A B
In Equations (3)–(5), h represents the distance between particles (nm); r is the particle radius (m); λ is the characteristic wavelength (100 nm); ε0 is the vacuum permittivity (8.854 × 10⁻¹² CV−1 m−1); ε is the permittivity of water (78.5); ξp and ξs denote the zeta potentials of the SPs/bacteria and quartz sand, respectively; λAB is the attenuation length of water (1 nm); and h0 is the minimum particle distance (0.158 nm).
The calculation of parameters A132, ΔGABh0, and k involved the following steps: The measured contact angle was substituted into Equation (6) to determine γLW, γ, and γ+ (Table 2). These values were then substituted into Equation (7) to calculate ΔGABh0. Parameter A132 was obtained by substituting γLW into Equations (8) and (9), where “1” represents the kaolin or microorganisms, “2” represents the water, and “3” represents the quartz sand. Finally, Equation (10) was used to calculate k.
γ i L 1 + cos θ = 2 γ i L W γ L W + 2 γ i + γ + 2 γ i γ +
G h 0 A B = 2 γ W + γ B + γ S γ W + γ W γ B + + γ S + γ W + γ B γ S + γ S γ B +
A 132 = 24 π h 0 2 r i L W
A 132 = A 11 A 33 A 22 A 33
k = e 2 η j 0 Z j 2 ε ε 0 K T
The parameters for Equations (6)–(10) are as follows: diiodomethane (γLd = γLWd = 50.8 mJ/m2, and γ+d = γd mJ/m2), Glycerol (γLg = 64.0, γLWg = 34.0, γ+g = 3.92, and γg = 57.4 mJ/m2), water (γLW = 72.8, γLWW = 21.8, and γ+W = γW = 25.5 mJ/m2), and quartz sand (γ+s = 1.4 mJ/m−2, and γs = 47.8 mJ/m−2). The Hamaker constants for water and quartz sand were A3 = 3.70 × 10⁻²⁰ J/m2 and A2 = 8.80 × 10⁻²⁰ J/m2, respectively. Additional constants included e = 1.602 × 10⁻¹⁹ C, ηj0 as the ion concentration of the solution, Zj as the ion valence, T = 298 K (thermodynamic temperature), and K as the Boltzmann constant (1.380649 × 10⁻²³ J/K).

2.4.9. Data Analysis

Pearson correlation analysis and significance testing were conducted to evaluate the actual contribution of each experimental variable to the combined clogging of the porous media.

3. Results and Discussion

3.1. Spatiotemporal Variation in the Relative Hydraulic Conductivity of Porous Media

3.1.1. Effect of Biofilm-Coated Porous Media on the Relative Hydraulic Conductivity

Figure 1 illustrates the variation in the relative hydraulic conductivity (K′) of the sand column. In the control check group (CK), K′ remained essentially unchanged, indicating that, after saturation, the seepage process had a minimal impact on the permeability of the porous media. At the end of the recharge, K′ in MCCK was only slightly lower than that in CK, maintaining a value of approximately 0.900, suggesting that the biofilm formed by the groundwater microbial consortium on the porous media surface was relatively stable. By 74 h, K′ in HT and HTCK had decreased to 0.227 and 0.315, respectively, whereas K′ in MT and MTCK had decreased to 0.345 and 0.401, respectively. At 98 h, K′ further declined to 0.233 for MT and to 0.275 for MTCK. A similar declining trend was observed in LT and LTCK within the first 48 h. Between 48 and 170 h, the rate of K′ decline slowed in LTCK, whereas K′ in LT continued to decline rapidly, indicating that the biofilm in LT inhibited SP migration within the sand column, thereby reducing the permeability of the porous media. By 170 h, K′ in LT and LTCK had decreased to 0.323 and 0.497, respectively. Even with prolonged recharge, K′ in LTCK without biofilm was significantly higher than that in the biofilm-coated LT. However, K′ in biofilm-coated LT maintained a relatively rapid rate of decline. These findings demonstrated that the presence of biofilms under recharge water with varying turbidity levels enhances SP-induced clogging in porous media, reducing aquifer permeability. This effect was particularly pronounced in the low-concentration groups, in which the biofilm played a significant role in accelerating the decline in permeability.

3.1.2. Effect of Suspended Particle Concentration in Recharge Water on Relative Hydraulic Conductivity

As shown in Figure 1, the K′ of the porous media in LT and LTCK decreased the slowest over time, whereas K′ in HT and HTCK exhibited the most rapid decline. After 74 h of recharge, K′ in HT, MT, and LT decreased to 0.227, 0.345, and 0.676, respectively, whereas those in HTCK, MTCK, and LTCK decreased to 0.315, 0.401, and 0.763, respectively. The K′ values followed the descending order LTCK > LT > MTCK > MT > HTCK > HT. At the same recharge time, clogging was more severe in the high-SP-concentration groups (HT and HTCK), regardless of the presence or absence of biofilms [16,63]. Although clogging also occurred in the low-SP-concentration group, recharge water with lower SP concentrations slowed the progression of clogging compared to the high-SP-concentration conditions.

3.1.3. Relative Hydraulic Conductivity of Different Layers of the Sand Column

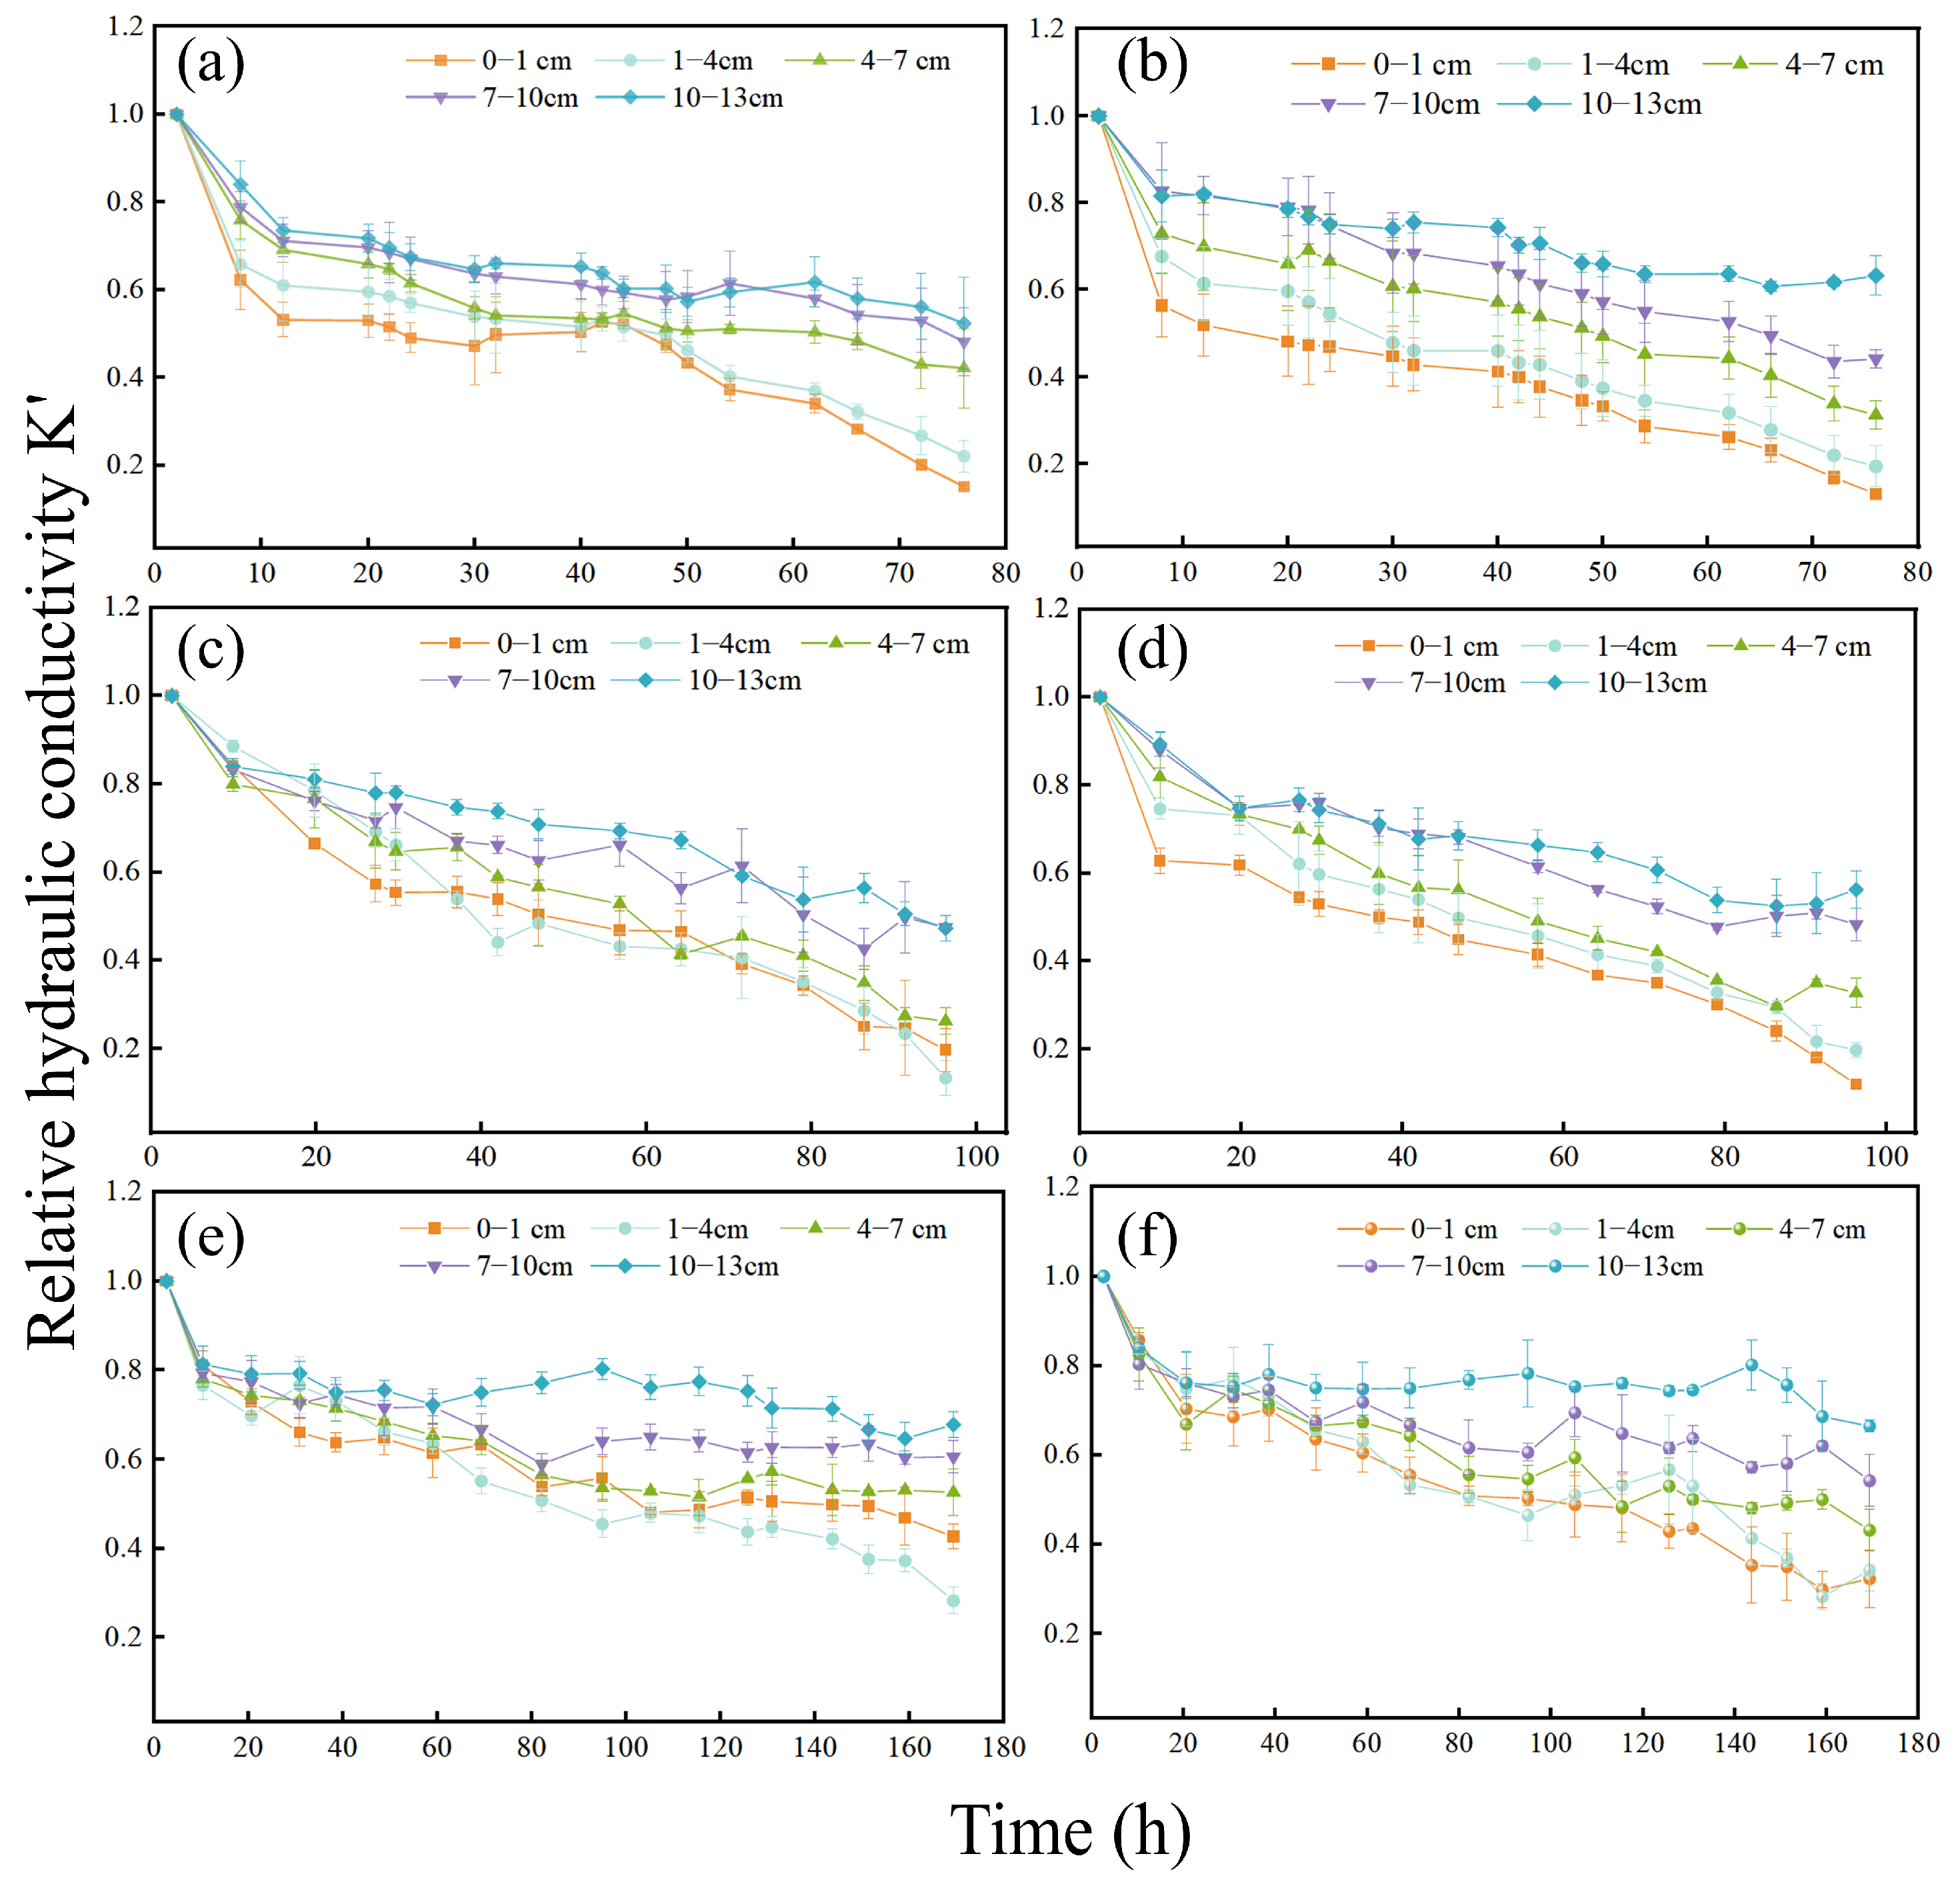
Figure 2 shows the variation in the K′ of porous media in different layers over time. In HTCK, K′ in the surface layer (0–1 cm) and the second layer (1–4 cm) declined the fastest (Figure 2a,b), whereas the decline rate in other layers was relatively slower. From 0 to 12 h, K′ in all layers of HTCK decreased rapidly. Between 12 and 44 h, the surface layer (0–1 cm) exhibited no significant decline, whereas K′ in the other layers continued to decrease. From 44 to 74 h, K′ in the top two layers (0–1 and 1–4 cm) declined rapidly, whereas the decrease in deeper layers slowed. In HT (Figure 2b), K′ in all layers decreased over time, with the clogging severity diminishing as the seepage distance increased. Compared with HTCK, the biofilm-coated porous media in HT experienced more severe clogging in both the surface and interior layers. In HTCK (without biofilm coating), SPs initially penetrated the porous media along with the recharge water, causing clogging of the aquifer interior. In later stages, SPs accumulated on the surface owing to internal clogging, intensifying surface clogging. By the end of the recharge period, K′ in the surface (0–1 cm) and second (1–4 cm) layers decreased below 0.2 in both HT and HTCK, with the rate of K′ decline being greater in HT than in HTCK.
The internal clogging (1–7 cm) in MTCK was more severe than that in HTCK (Figure 2c), indicating that SPs migrated more readily into the porous media at lower SP concentrations in the recharge water. As shown in Figure 2d, the K′ decline pattern in each layer of MT was similar to that of HT, with the most severe clogging occurring near the sand column entrance. Compared with non-biofilm-coated MTCK cells, the presence of biofilm in MT enhanced SP deposition in porous media, exacerbating clogging. In LTCK (Figure 2e), the K′ decline trends for all layers, except for the bottom layer (10–13 cm), were similar. Notably, after 58 h of recharge, K′ in the second layer (1–4 cm) of LTCK was significantly lower than that in the surface layer (0–1 cm), and K′ in the third layer (4–7 cm) was close to that in the surface layer, indicating that internal clogging was more pronounced than surface clogging. Conversely, in LT (Figure 2f), the K′ of the surface layer (0–1 cm) was slightly lower than that of the second (1–4 cm) and third (4–7 cm) layers, suggesting that surface clogging in biofilm-coated LT was more severe.
These results indicated that SPs in recharge water with low turbidity are more likely to migrate deeper into the sand column. In non-biofilm-coated sand columns, recharge water with low SP concentrations could cause internal clogging that is comparable to or even exceeds clogging in the surface layer. However, in biofilm-coated sand columns, the likelihood of SPs being trapped in the surface layer increases. The underlying reasons for this are analyzed in detail in Section 3.3.1, focusing on the surface properties. Figure 2 illustrates that the surface layer of the biofilm-coated sand columns experienced the most severe clogging under various turbidity conditions. The presence of biofilms promoted SP deposition, significantly reducing the K′ value of the porous medium. Furthermore, the clogging process accelerated with increasing SP concentrations in the recharge water, which is consistent with findings from previous studies [19,63].

3.2. Analysis of Distribution Difference in Biomass and Suspended Particle Deposition in Porous Media

3.2.1. Distribution of Biomass in the Porous Media

Figure 3 illustrates the biomass distribution across different layers from the entrance to the exit of the sand column. The small differences in biomass within each group indicated that the biofilm coating process in this study was consistent and reliable. The descending order of biomass among groups was LT > MCCK > HT > MT. The biomass in MCCK was equivalent to the initial biomass in the HT, MT, and LT treatments. By the end of the recharge period, the biomass in MCCK (1.57–2.01 mg/g sand) was significantly higher than in HT (1.38–1.46 mg/g sand) and MT (0.97–1.04 mg/g sand). The reduction in biomass in HT and MT may have resulted from partial biofilm shedding caused by SP collisions with the biofilm-coated porous media. LT exhibited the highest biomass (2.12–2.78 mg/g sand) among all groups, likely because of the lower SP concentrations and higher oxygen availability in the recharge water, creating favorable conditions for microbial growth. Additionally, LT’s longer recharge duration (170 h) contributed to increased biomass. This biomass accumulation likely caused a significant reduction in the hydraulic conductivity observed during the later recharge period (118–170 h) in LT. Previous studies have shown that even low SP concentrations can exacerbate clogging in porous media when the biomass levels are high [24,55].

3.2.2. Spatial Distribution of Suspended Particles in the Porous Media

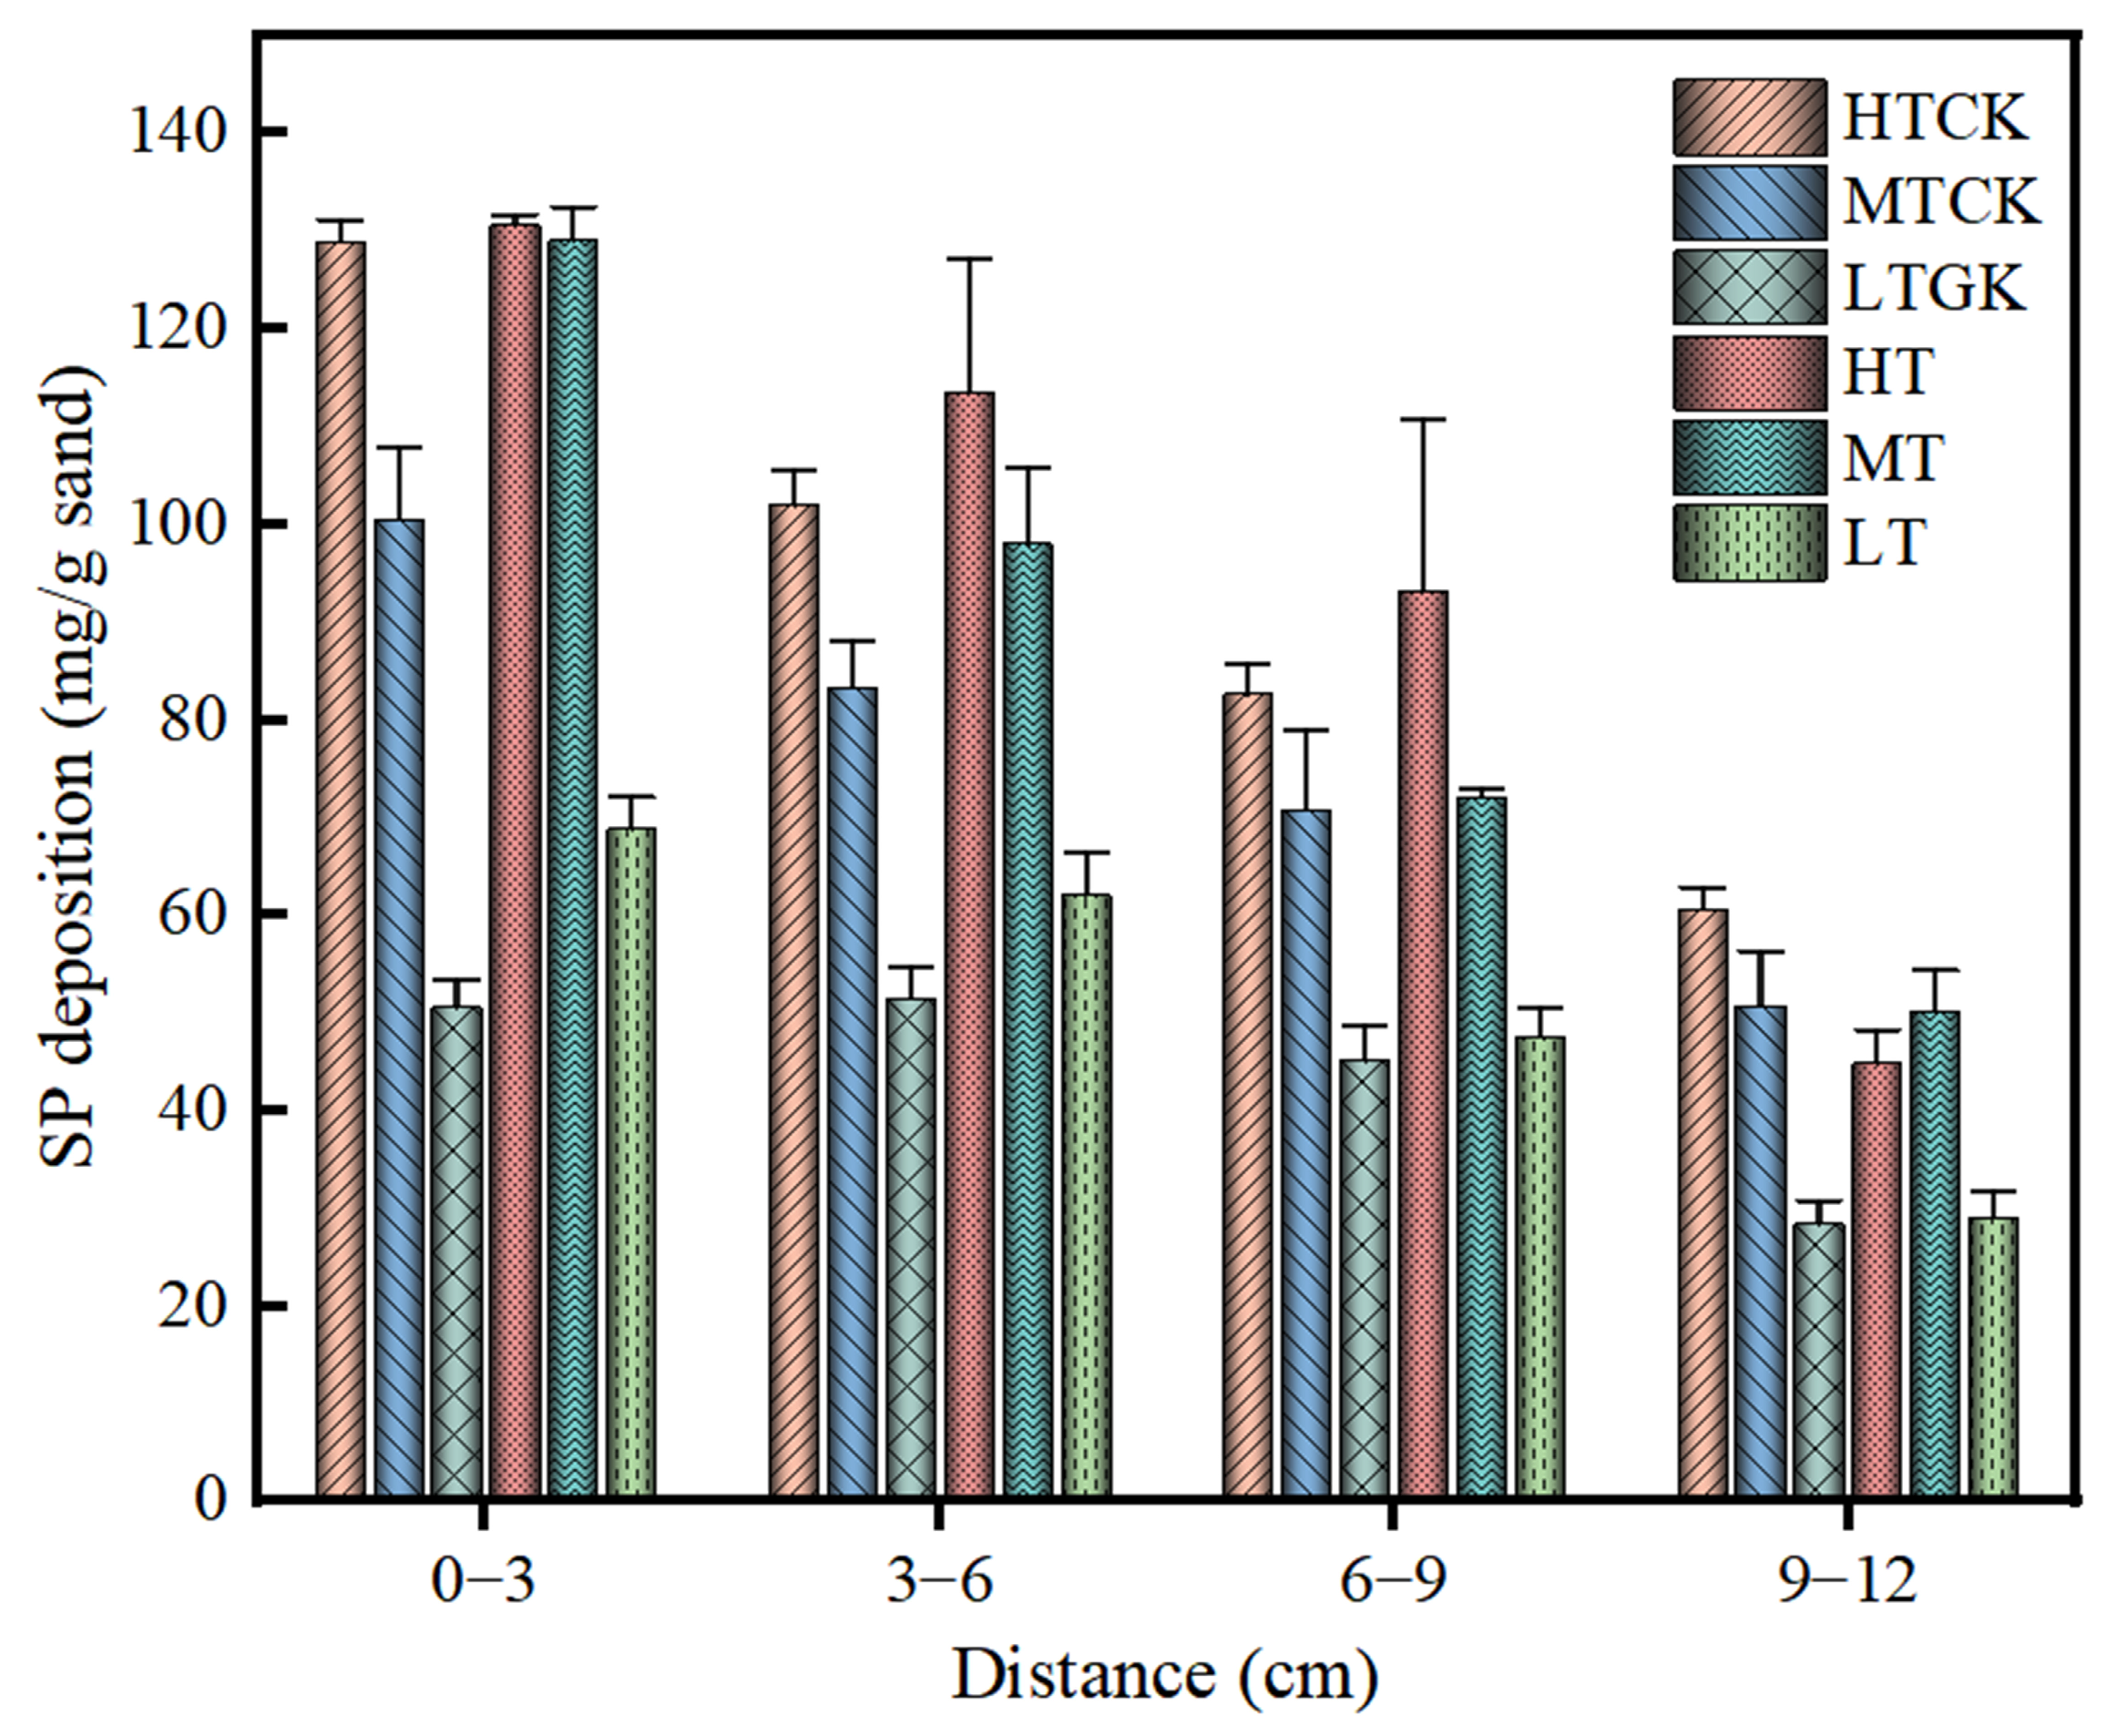
Figure 4 illustrates the distribution of SPs across different layers of the sand column. The results indicated that SPs trapped in the surface layer increased with SP concentration in the recharge water, explaining the faster decrease in K′ in the surface layer (0–1 cm) observed in Figure 2. Except for LTCK, the SP deposition in the other groups decreased from the column inlet to the outlet, albeit at varying rates. In the bottom layer (9–12 cm), SP deposition in HTCK and HT decreased by 53.01% and 65.66%, respectively, compared to that in the surface layer (0–3 cm). Similarly, SP deposition in the MTCK and MT bottom layers decreased by 49.54% and 61.14%, respectively, and in LTCK and LT by 43.83% and 57.65%, respectively. These results indicated that the biofilms inhibited SP migration into deeper layers while promoting SP deposition in the surface layer.
In the control experiment, SP deposition in HTCK decreased rapidly with increasing sand column seepage depth, whereas SP deposition in MTCK decreased more gradually, and SP deposition in LTCK fluctuated significantly across layers. These results indicated that lower SP concentrations facilitated deeper migration and a more uniform distribution of SPs within the porous medium. SP deposition in the surface layers of HT, MT, and LT was 130.6, 129.05, and 68.86 mg/g sand, respectively. The SP deposition in HT and MT decreased rapidly from the top of the sand column, whereas the deposition across the layers in LT was relatively uniform. The similar SP deposition amounts in the surface layers (0–3 cm) of MT and HT were attributed to differences in recharge times. SP deposition in the bottom layer (9–12 cm) of MT was greater than that in HT, while the bottom layer of MTCK exhibited less SP deposition than HTCK. This was because SPs in the medium-turbidity groups (MT and MTCK) migrated more easily through porous media than in the high-turbidity groups (HT and HTCK). The biofilm coating on the MT surfaces hindered SPs from exiting the sand column, while there is no biofilm present at the bottom of MTCK, making it easier for SPs to be flowed out by water flow. The more even SP distribution in LT across all layers compared to HT and MT was attributed to the lower SP concentration in the recharge water, which promoted the deeper migration within the sand column.
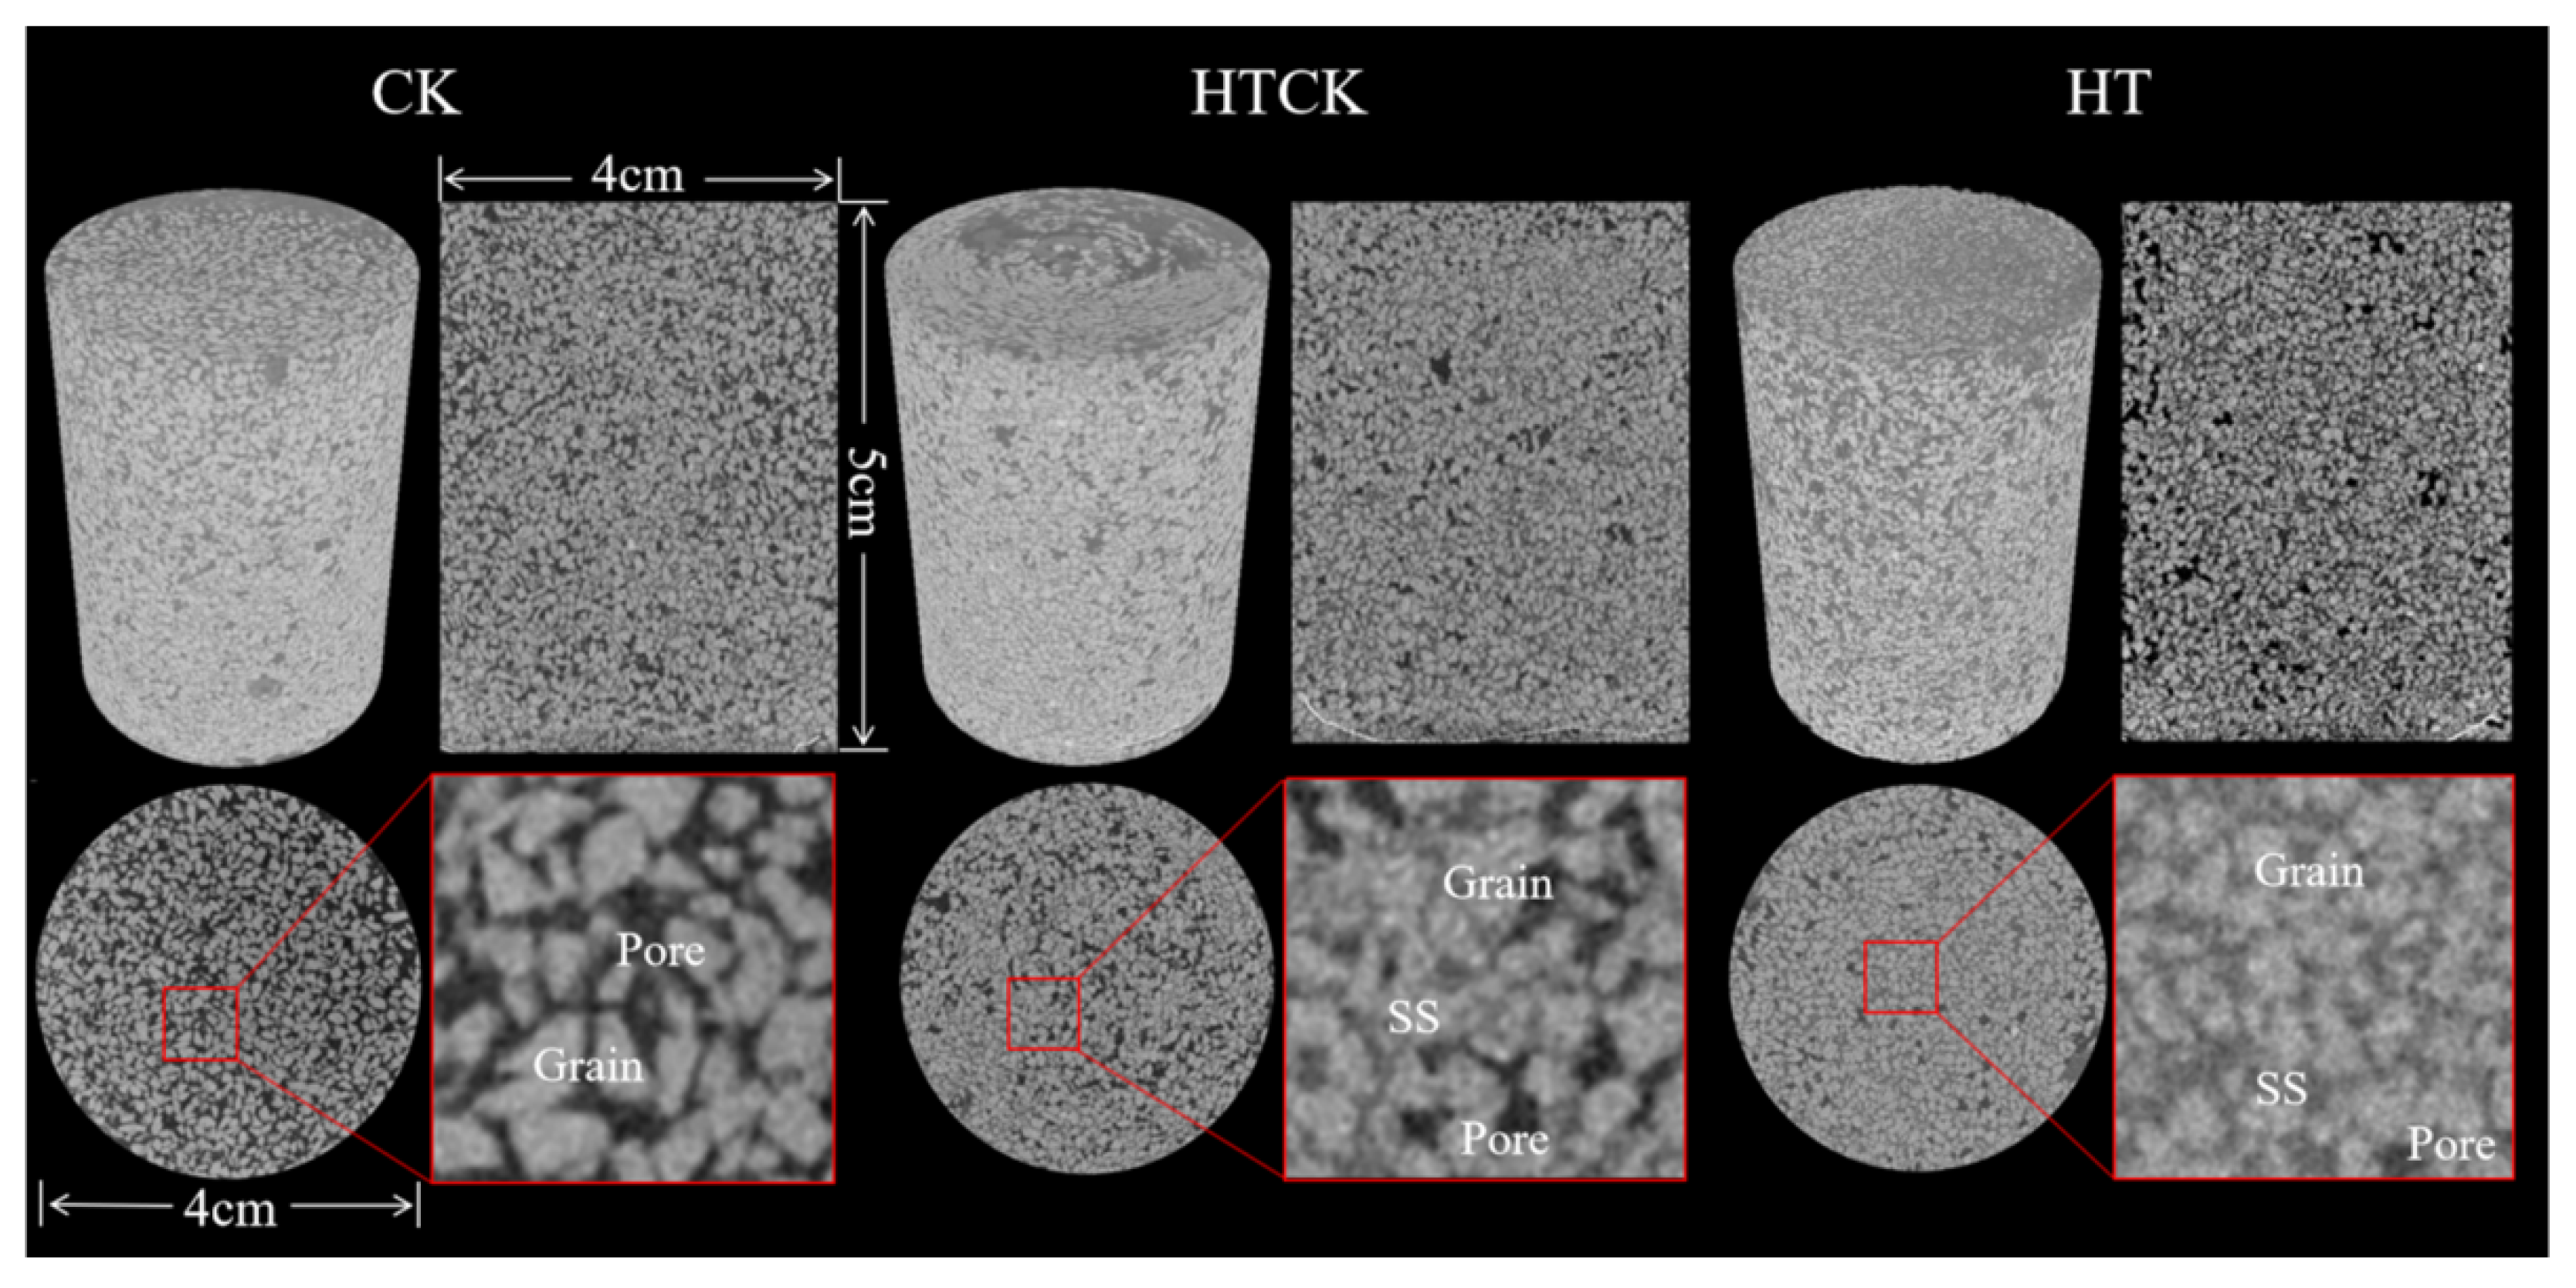
Figure 5 presents the three-dimensional reconstructed X-ray CT images of the CK, HTCK, and HT samples, including the longitudinal section (right) and horizontal section (bottom) with an enlarged cross-section at the bottom of the figure. The X-ray attenuation coefficient of the porous medium was determined by the relative density of the material, where the high-density materials (porous medium) were white, low-density materials (pores) were black, and SPs were gray. In the CK cross-section, the sand grains are visible as densely arranged white areas, whereas the black areas represent pores, indicating that no clogging material accumulated in the porous medium. In HTCK, SPs were observed to fill part of the pore space, and the magnified images revealed the SP binding to adjacent particles, potentially retaining subsequent SPs and exacerbating clogging in the porous media. In HT, SPs filled almost all pore spaces, significantly reducing the pore volume compared with HTCK. This finding aligns with the SP deposition measurements shown in Figure 4, confirming that the presence of biofilm promotes SP deposition in porous media. The highest SP deposition observed in HT further supports this conclusion.

3.3. Surface Property Analysis of Porous Media

3.3.1. Surface Morphology of Porous Media

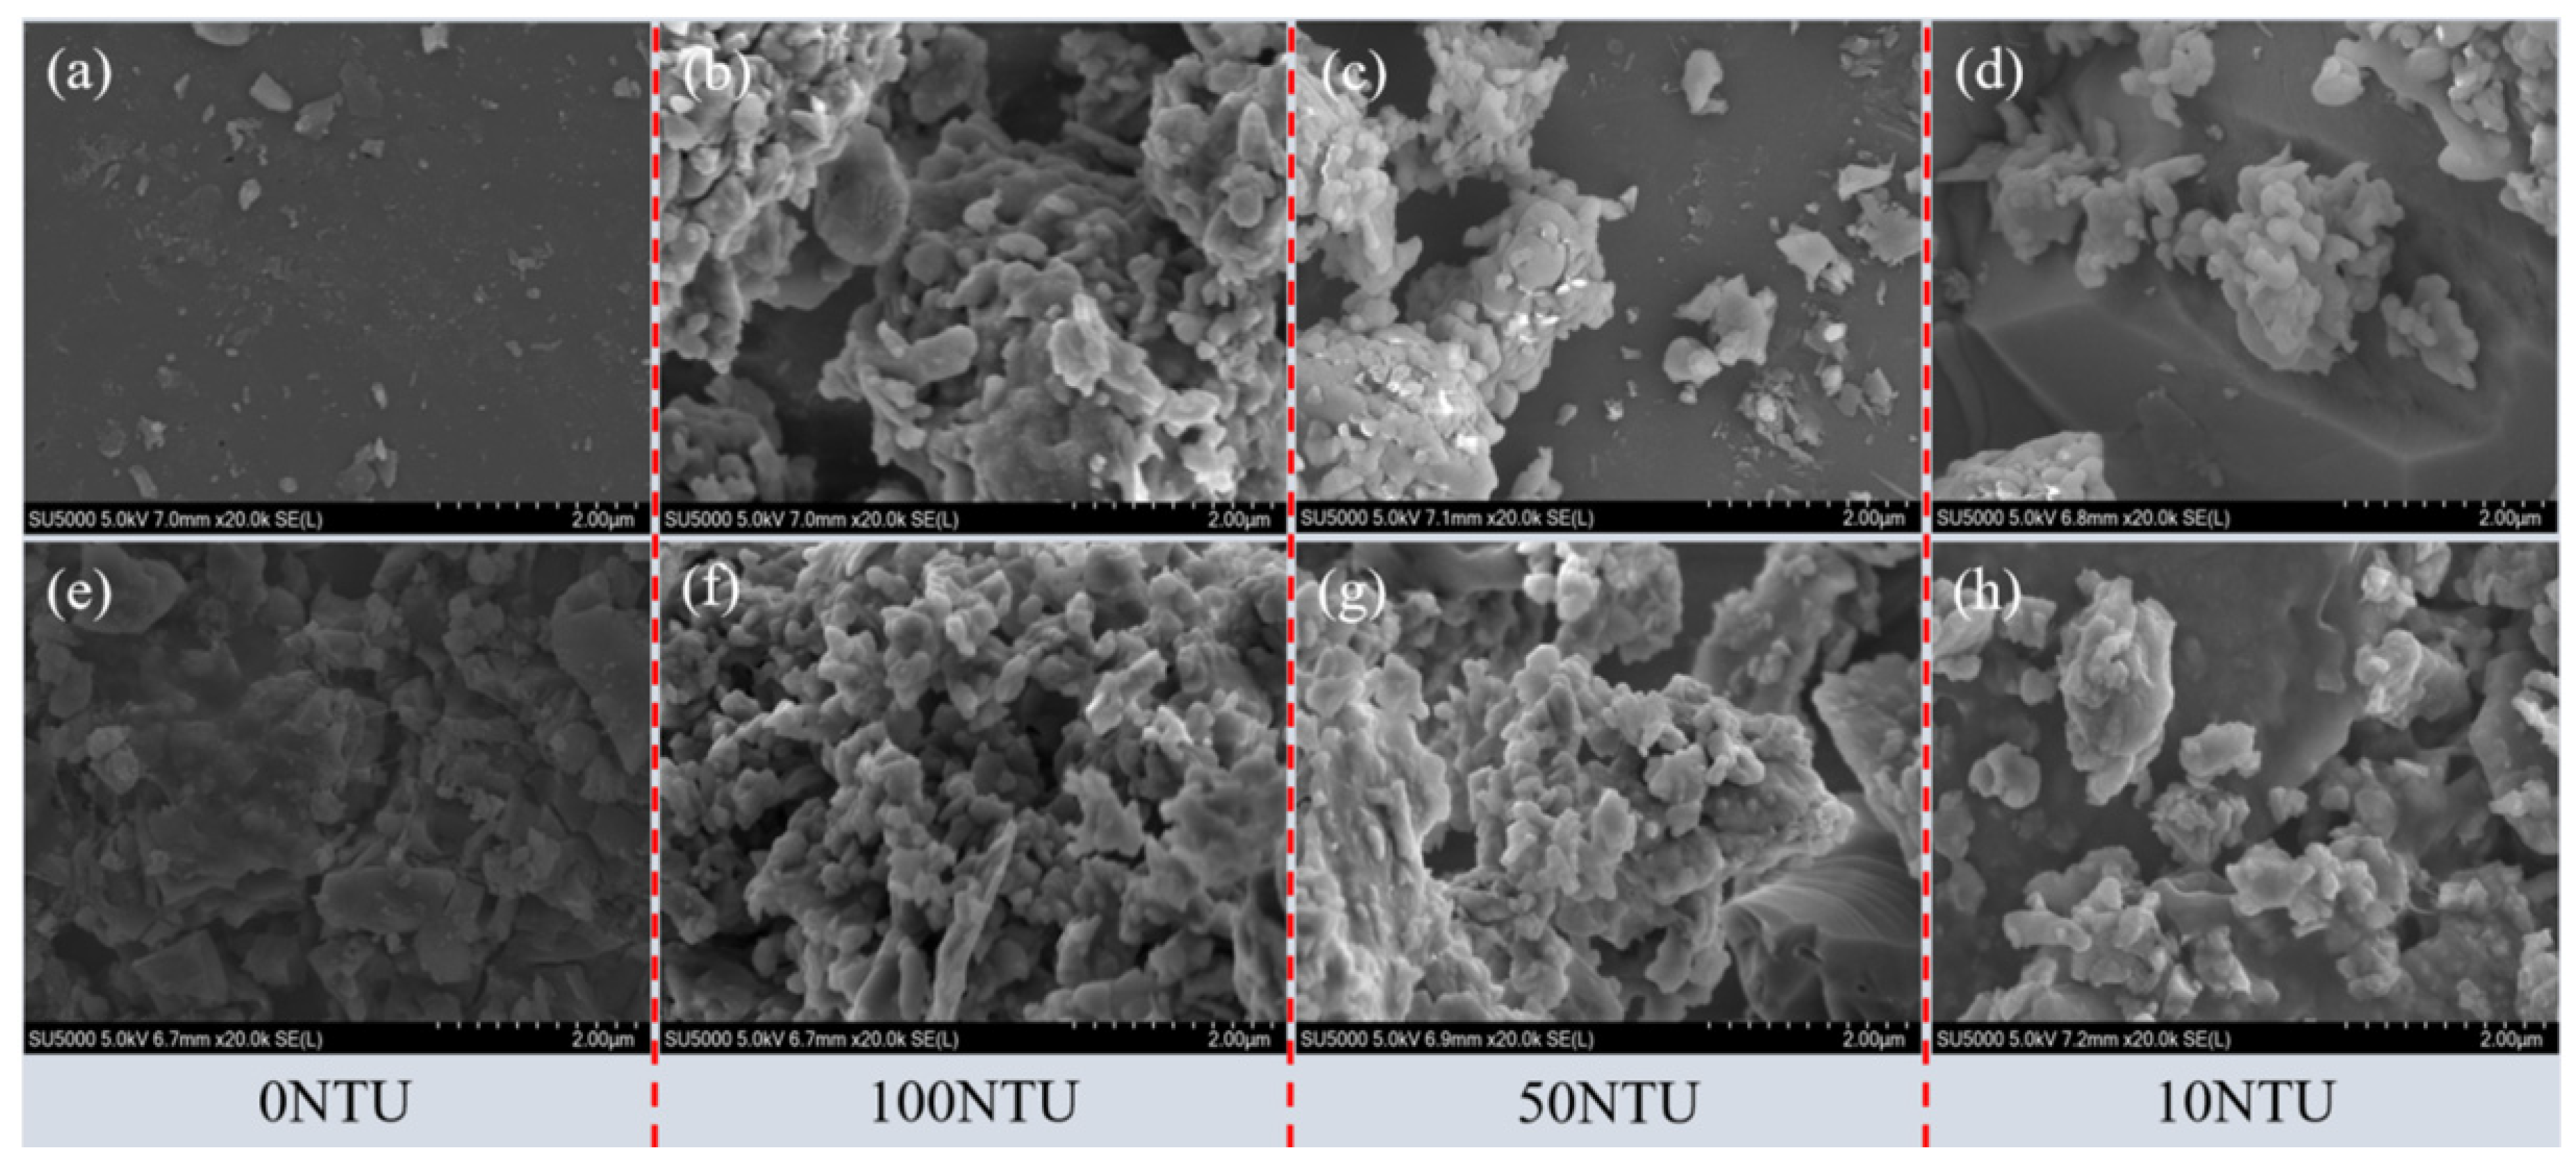
The attachment of microbes and the behavior of SPs can be influenced by the surface properties of the porous media. Figure 6 illustrates the surface micromorphology of the porous media in different groups after recharge. Before biofilm coating, the sand surface appeared relatively flat with some smaller irregular particles (Figure 6a). In contrast, the surface of the porous media in MCCK coated with a groundwater microbial consortium biofilm was noticeably coarser (Figure 6e). The biofilm on the MCCK sand surface was relatively complete but displayed defects such as “cracks” and “pores”, likely caused by water erosion. In HTCK (non-biofilm coated) soil, loose aggregates of varying-sized kaolin grains were observed on the sand surface. In HT (biofilm coated), the aggregates on the sand surface were more compact (Figure 6f), which was attributed to the ability of EPSs in the biofilm to promote SP flocculation and deposition. As the SP concentration in the recharge water decreased, the exposed sand surface area increased in MTCK (Figure 6c) and LTCK (Figure 6d). Similarly, the density of aggregates on MT (Figure 6g) and LT (Figure 6h) samples was significantly lower than that on HT (Figure 6d). These results indicated that the thickness and density of the aggregates on the sand surface increased with higher SP concentrations in the recharge water. Notably, the aggregates accumulated more on the biofilm-coated sand surfaces than on the non-coated surfaces, a phenomenon that was particularly pronounced under 50 NTU and 10 NTU recharge conditions. This effect was due to biofilm-induced changes in sand surface roughness, which enhanced SP retention, as confirmed by previous studies [58].

3.3.2. Effect of Biofilm Coating on Zeta and Contact Angle of Porous Medium Surface

Compared with CK, the surface zeta potential of MCCK coated with biofilm decreased significantly from −3.95 ± 0.75 to −22.87 ± 1.70 mV (Table 3). This indicated that the biofilms substantially increased the negative charge of the sand surface, thereby influencing the electrostatic interactions between the porous medium and SPs [58]. The electrostatic repulsion between the porous medium and SPs followed the order of LT > MT > HT > HTCK. Notably, HT exhibited greater electrostatic repulsion than the non-biofilm-coated HTCK. The biofilm-coated sand enhanced the stability of SPs within the porous medium and inhibited its deposition. The reduced repulsion in HT compared to MT and LT suggested that SPs in HT were more likely to be deposited in porous media, consistent with the highest SP deposition observed in HT. The maximum electrostatic repulsion in LT was likely due to the low SP concentration in the recharge water.
To investigate the interaction mechanisms between the SPs and porous media, the surface contact angle of the porous media was measured after recharge (Table 3). All groups had contact angles below 90°, indicating hydrophilicity. The contact angles of clean quartz sand (CK) were 8.55° ± 1.19°, while those of MCCK and HTCK were 10.67° ± 1.98° and 22.90° ± 2.39°, respectively. These results demonstrated that biofilms and SP adsorption reduced the hydrophilicity of quartz sand surfaces. The contact angle in HT was higher than that in HTCK, indicating that HT had poorer hydrophilicity, that is, it had stronger hydrophobicity. For the biofilm-coated groups with recharge water of varying turbidity, hydrophobicity followed the order LT > MT > HT, consistent with the decreasing trend in the relative hydraulic conductivity of the sand column. SP concentration was positively correlated with the hydrophobicity of the porous media. The biofilm coating reduced the hydrophilicity of the quartz sand surface, thereby promoting SP adsorption. As SPs were adsorbed onto the surface, hydrophobicity further increased, enhancing SP retention in the porous media and leading to greater SP deposition in the sand column.

3.3.3. EPS Component and Content

Extracellular proteins and polysaccharides, which are key components of EPSs, play crucial roles in the clogging of porous media. Owing to the consistent biofilm coating methods, the EPS content across different layers within each group was relatively uniform. Therefore, this study only compared the main EPS components in the surface layer of the sand column between groups (Figure S2). SP concentrations were found to influence the protein and polysaccharide content within the sand column. Previous studies have reported that extracellular proteins can exhibit a higher affinity for kaolin [64]. However, Ghashoghchi et al. [65] suggested that polysaccharides can effectively flocculate kaolin, and proteins influence quartz agglomeration. In this study, polysaccharide content was positively correlated with the degree of clogging, whereas no clear relationship was observed between protein content and clogging. These results suggest that polysaccharides play a more significant role than proteins in clogging porous media, which is consistent with the previous findings [65]. Additionally, other studies confirmed that extracellular polysaccharides contained negatively charged groups (e.g., COO, OH, and PO43−) that interacted with aluminosilicate minerals, such as kaolin, to form stable complexes [66,67,68]. Notably, the protein content in LT was slightly higher than that in MT, likely due to the differences in recharge time.

3.4. Microbial Community Analysis

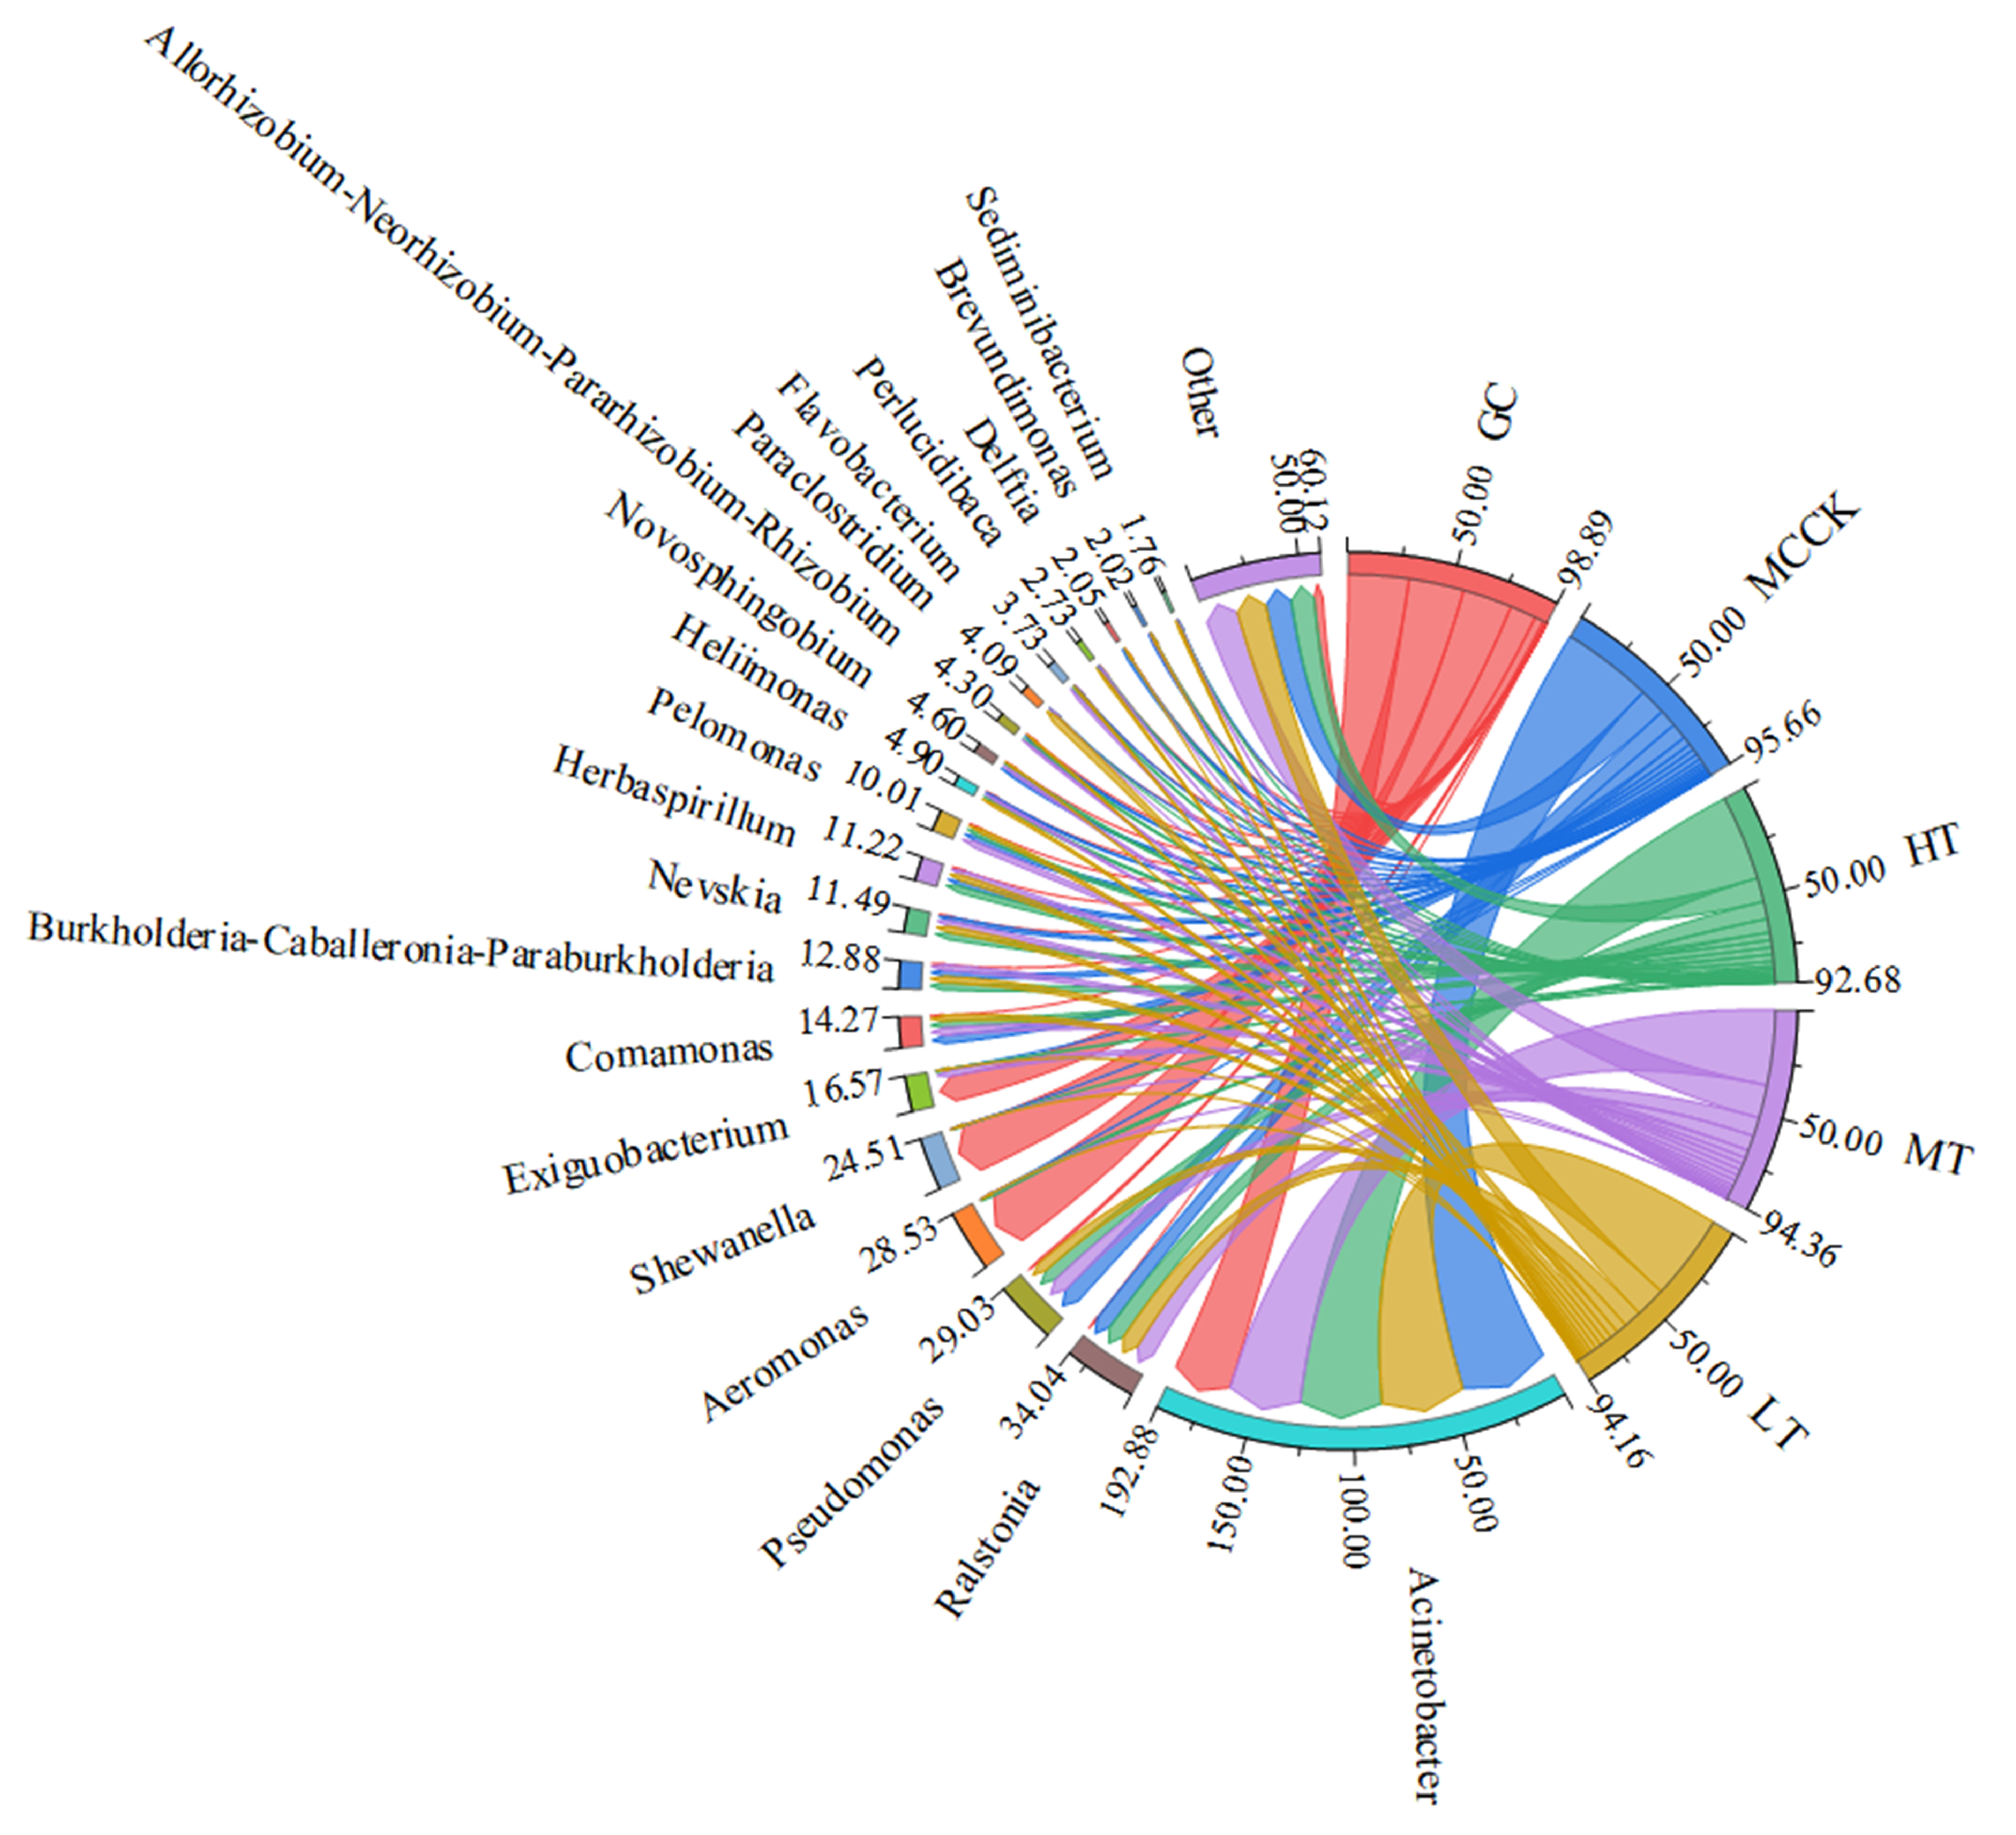
To investigate the effect of SP concentration on the microbial community, the microbial community structure at the genus level is presented in Figure 7. The right semicircle represents the species abundance composition in each group, whereas the left semicircle represents the proportion of species across different groups. The colored bands in the circle connect the samples (right semicircle) to the species (left semicircle). The width of the band at the sample end indicates the species’ abundance within the group, whereas the width at the species end reflects the group’s proportion in that species. Values outside the circles represent the abundance of each species. As shown in Figure 7, the top ten dominant microbial genera (GC) collected from groundwater included Acinetobacter, Aeromonas, Shewanella, Exiguobacterium, Pseudomonas, Allorhizobium-Neorhizobium-Pararhizobium-Rhizobium, Novosphingobium, Paraclostridium, Ralstonia, and Brevundimonas. After inoculating the cultured microbial community into a porous medium and completing the recharge process, some of the dominant strains changed. In MCCK, the top ten dominant genera shifted to Acinetobacter, Ralstonia, Pseudomonas, Aeromonas, Exiguobacterium, Comamonas, Burkholderia-Caballeronia-Paraburkholderia, Nevskia, Herbaspirillum, and Pelomonas. Although no significant changes in the dominant species were observed among the groups with different SP concentrations, their relative proportions varied. These shifts in the dominant genera across groups may be attributed to the limitations of laboratory experiments. Future studies should focus on improving experimental procedures and optimizing microbial enrichment culture methods.
The richness and diversity of microbial communities are listed in Table 4. MCCK represents the initial state in HT, MT, and LT. The Chao index for MCCK was 895.92, which was significantly lower than that for HT, MT, and LT, indicating that the addition of kaolin to recharge water promoted microbial growth and metabolism. The highest Chao index in LT may be attributed to differences in recharge time, which also explained the highest biomass content observed in LT. The low Chao index in MCCK likely resulted from starvation during recharge, which causes microorganisms to be more easily washed out of the column with water flow [69]. The Shannon and Simpson indices, commonly used to evaluate microbial diversity, showed significantly greater diversity in the combined clogging groups (HT, MT, and LT) than in the biofilm-coated group (MCCK). Additionally, the Shannon index for LT was significantly higher than those for HT and MT. This difference could be due to the extended recharge time in the LT, which allowed the sand column to be influenced by foreign microbial colonies, leading to a notable increase in microbial community diversity.

3.5. Analysis of the Clogging Mechanism of the Porous Medium

3.5.1. Interaction Between the Suspended Particulate and the Biofilm

According to the XDLVO theory, the interactions among SPs, biofilm, and quartz sand can be described by van der Waals interaction energy, electrostatic interaction energy, and Lewis acid–base interaction energy. As shown in Figure 8a, the total potential energy decreased when SPs were present in recharged water. The total energy barriers for HTCK, MCCK, and HT were −335.13 × 10⁻¹³, −9.94 × 10⁻¹³, and −369.37 × 10⁻¹³ J, respectively. These results indicated that the biofilm coating reduced the energy barrier between SPs and quartz sand, facilitating SP adsorption onto the quartz sand surface. This aligned with the hydrophobicity results (Section 3.3.3) and the changes in the relative hydraulic conductivity of the porous medium (Section 3.3.1). The van der Waals energy barriers for HTCK, MCCK, and HT were −385.98 × 10⁻²⁰, −160.64 × 10⁻²⁰, and −375.14 × 10⁻²⁰ J, respectively (Figure 8b). Although the biofilm enhanced the van der Waals forces between SPs and quartz sand, these forces were seven orders of magnitude smaller than the total potential energy, making them insignificant in comparison. Thus, van der Waals forces were not the primary interactions between the SPs and biofilm-coated quartz sand. Figure 8c shows that the biofilm coating reduced the electrostatic interaction potential energy between the SPs and quartz sand, enhancing electrostatic attraction. The energy barrier for electrostatic forces was nearly identical to the total potential energy, indicating that, in the case of only considering the XDLVO theory, electrostatic interactions dominated during combined clogging. As shown in Figure 8d, the Lewis acid–base interaction energy for MCCK and HT approached zero when the interparticle distance exceeded 5 nm. However, as the distance decreased, the Lewis acid–base force increased significantly, suggesting a stronger influence at shorter interfacial distances. In summary, biofilm coating on porous media reduced the electrostatic interaction potential energy between SPs and quartz sand, promoting kaolin deposition in saturated porous media. Additionally, the dominance of gravitational forces in the total potential energy and particle collisions may further contribute to the SP aggregation in the porous medium [70,71].
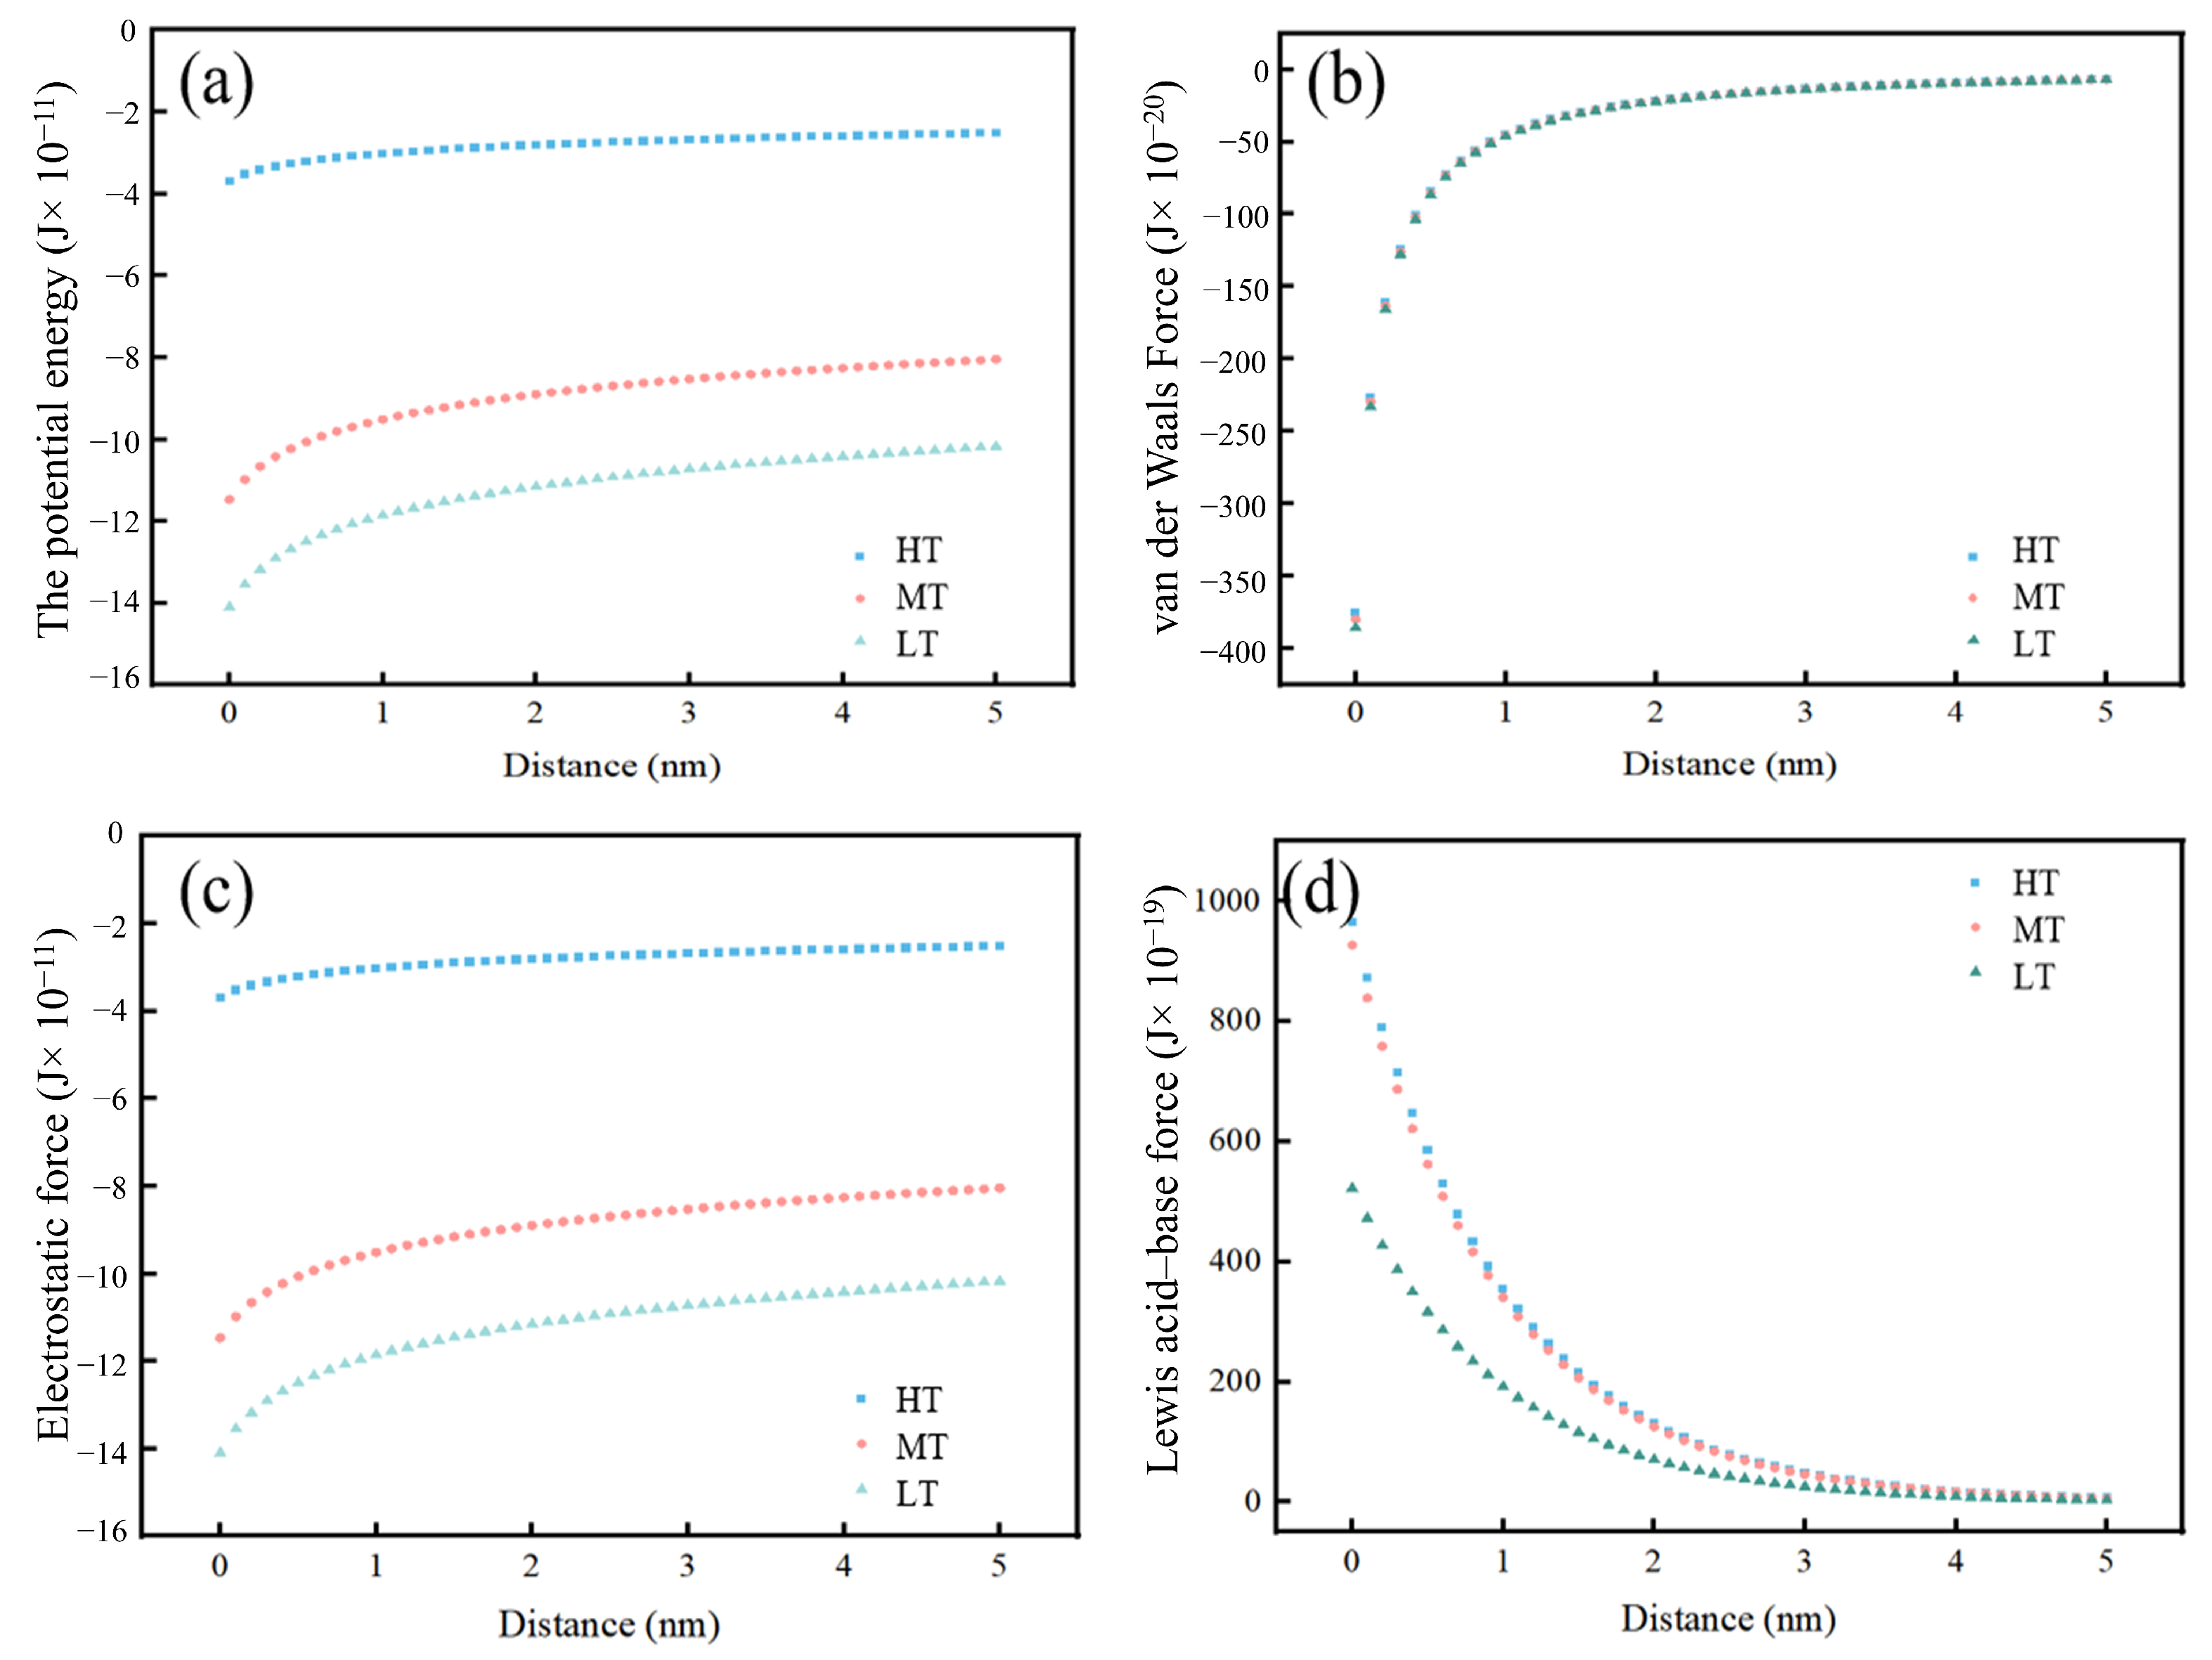
To confirm the microscopic interactions between SPs and the biofilm-coated porous media, the van der Waals force, electrostatic force, Lewis acid–base force, and total potential energy were quantified using the XDLVO theory (Figure 9). As shown in Figure 9a, the total potential energies for HT, MT, and LT were −3.69 × 10⁻¹¹, −11.46 × 10⁻¹¹, and −14.10 × 10⁻¹¹ J, respectively. With increasing SP concentration, the energy barrier between SPs and quartz sand increased. Figure 9b indicates no significant difference in van der Waals forces across SP concentrations as this force depends primarily on the particle and interparticle geometric factors. The Lewis acid–base force between SPs and quartz sand is shown in Figure 9d, with energy barriers of 964.47 × 10⁻¹⁹, 927.08 × 10⁻¹⁹, and 522.13 × 10⁻¹⁹ J for HT, MT, and LT, respectively. The electrostatic force (Figure 9c) made the largest contribution to the total potential energy, indicating that, in the XDLVO theory, the deposition of SPs in porous media was primarily driven by electrostatic interactions at the microscopic level. The lowest total potential energy barrier was observed for LT, indicating that SPs were deposited more easily on sand surfaces under these conditions. As the SP concentration in the recharge water increased, the electrostatic attraction between SPs and the biofilm-coated sand surface weakened, reducing SP deposition in the porous media. However, other forces also influenced the SP deposition. As discussed in Section 3.3.2, SP deposition enhanced the hydrophobicity of the porous medium, thereby increasing its adsorption capacity. Additionally, SP agglomeration reduced the pore space, further promoting pore clogging in quartz sand. The dominant mechanisms of SPs and biofilm-coated quartz sand interactions are analyzed in detail in Section 3.5.2.

3.5.2. Main Mechanism of Combined Clogging of Porous Media

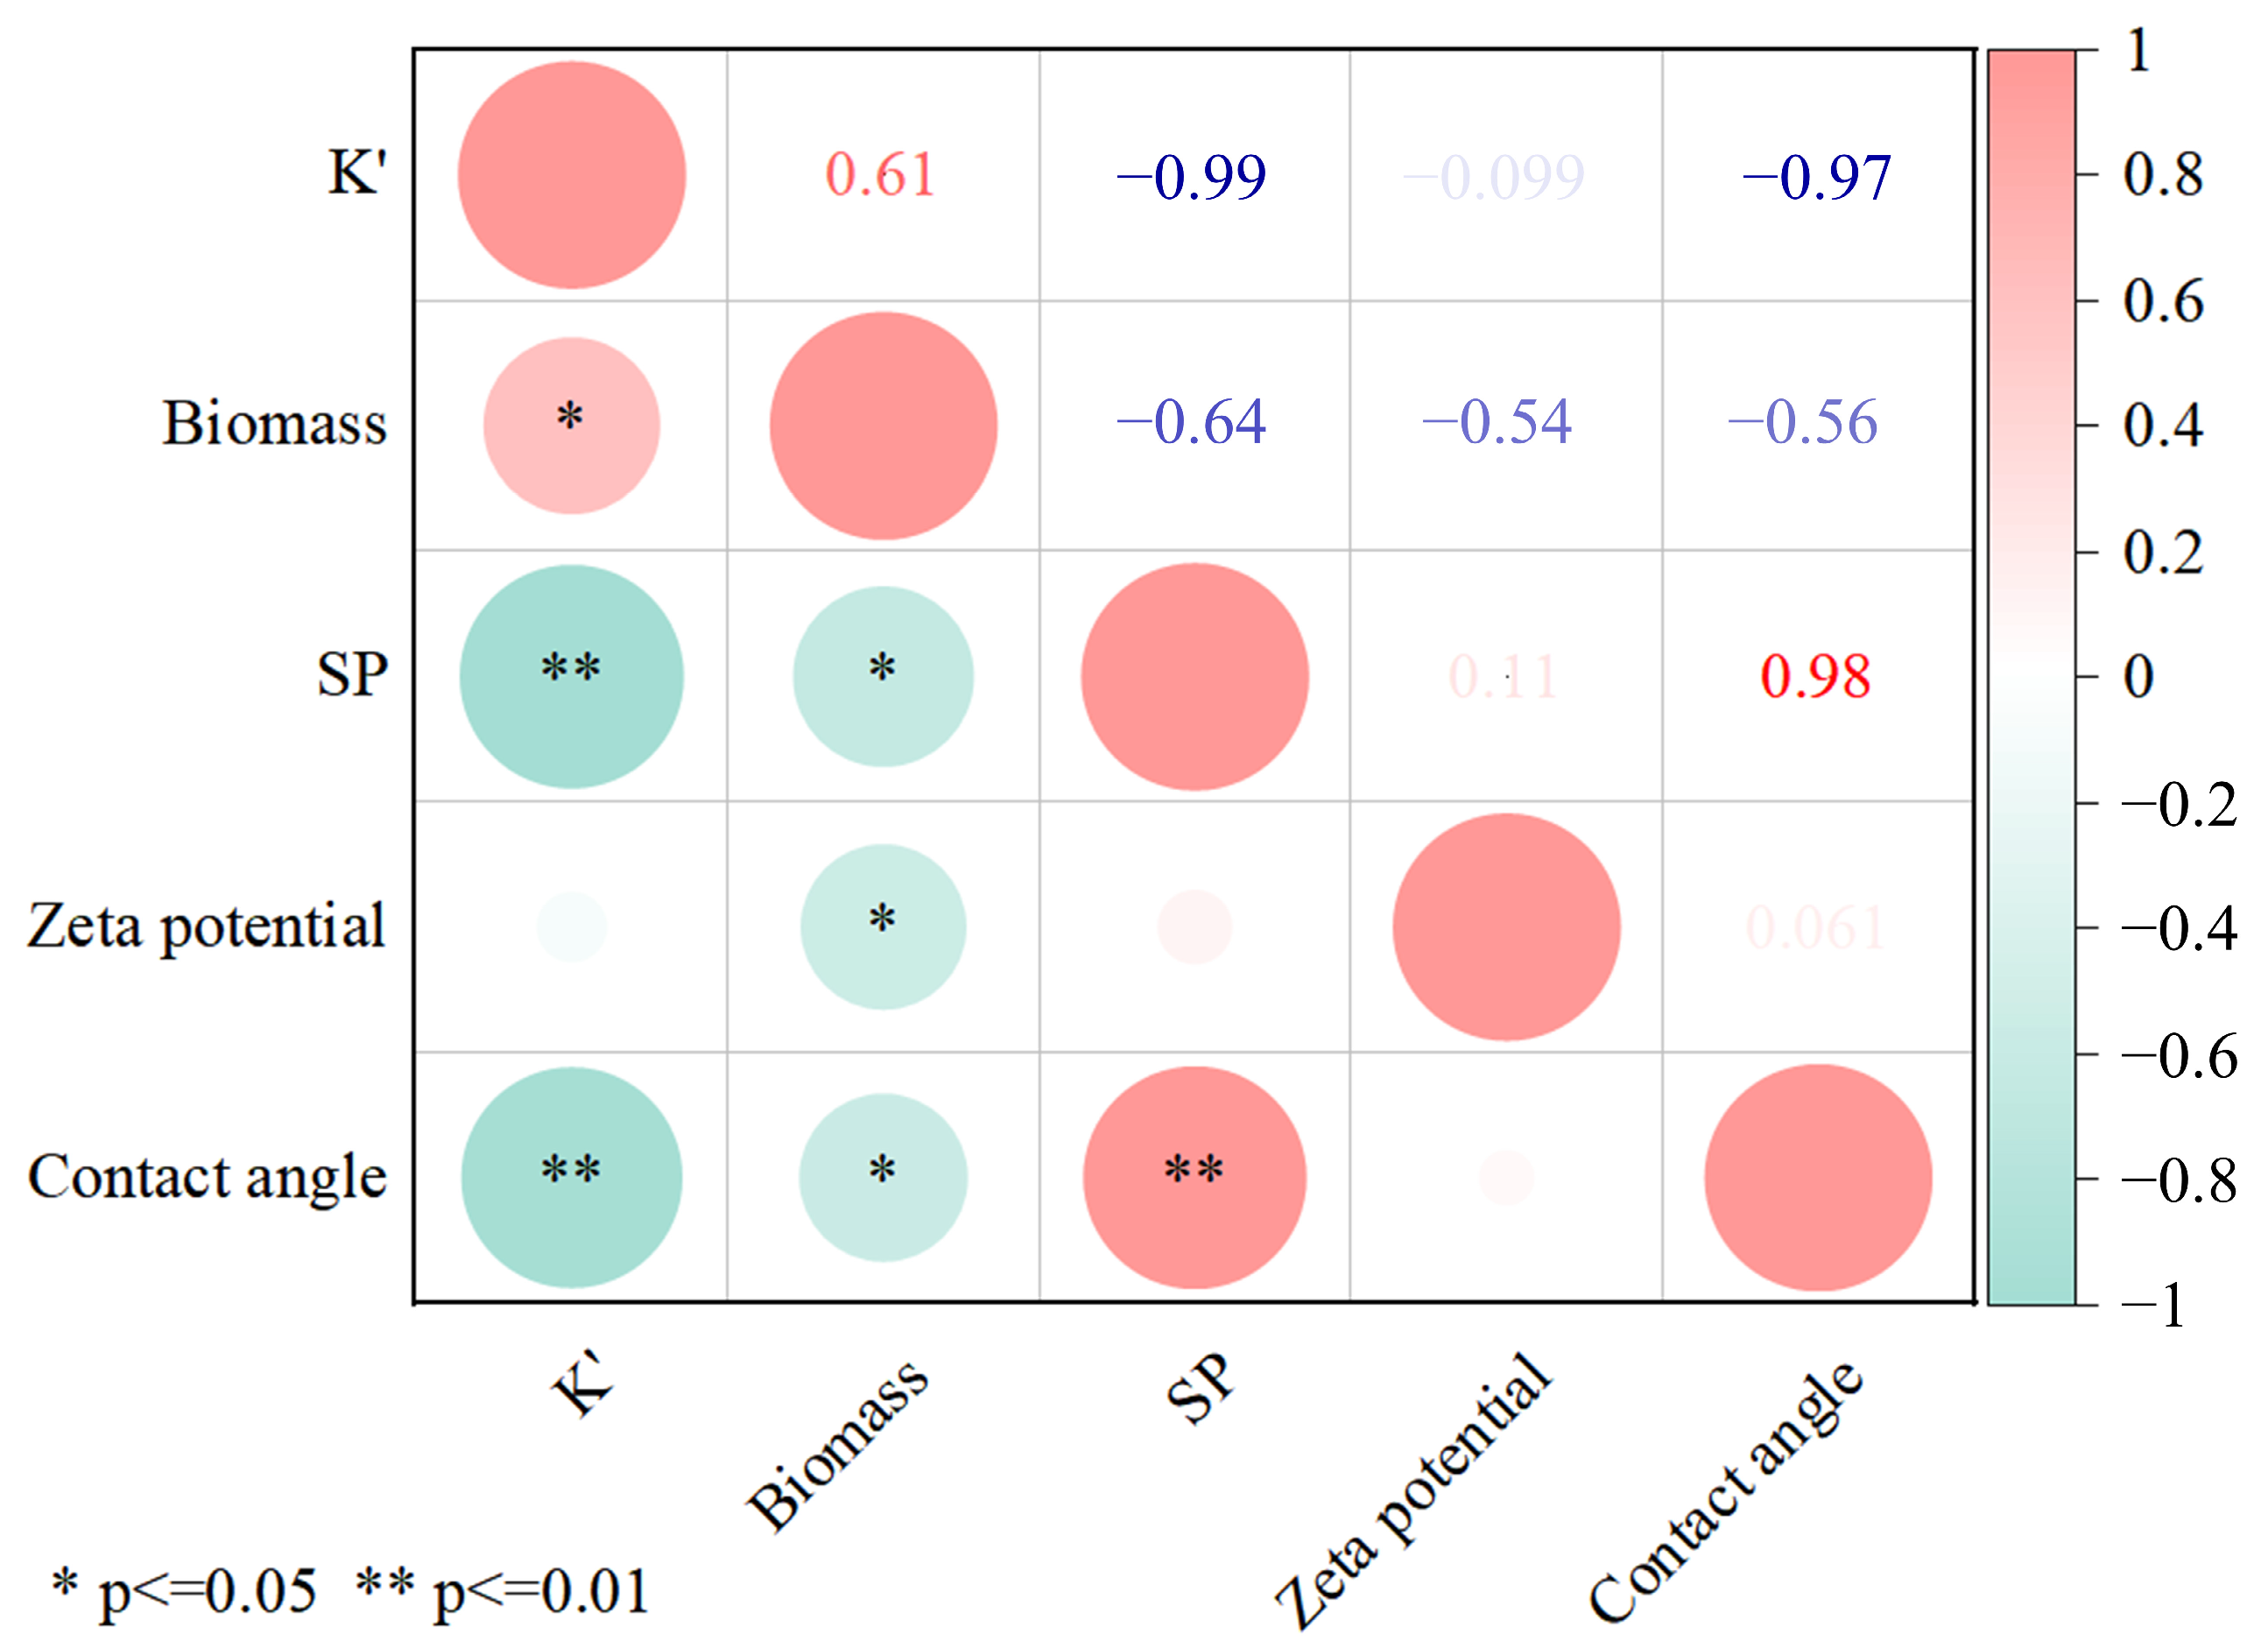
The analysis indicated that the fate of SPs in biofilm-coated porous media was influenced by the surface properties of the media (e.g., roughness and surface charge), as well as by electrostatic interactions, hydrophobic interactions, Lewis acid–base forces, and van der Waals forces. To quantify the contribution of each force to the reduction in hydraulic conductivity of the porous media, correlation and significance analyses were performed (Figure 10). The biomass of the porous medium particles showed a significant positive correlation with K′, which was attributed to microbial starvation after biofilm formation. Nutrient deficiencies slow biomass accumulation and may even cause biofilm shedding owing to SP collisions with biofilm-coated sand. This explains the significantly lower biomass in HT and MT compared with that in the initial MCCK state (Figure 3). The XDLVO theory results suggested that the biofilms enhanced the electrostatic attraction between SPs and quartz sand by reducing the electrostatic interaction potential energy, thereby promoting SP deposition. However, as the SP concentration in the recharge water increased, the electrostatic attraction between SPs and the biofilm-coated sand decreased, weakening SP deposition in the porous media. As shown in Figure 10, K′ had no linear correlation with the zeta potential, indicating that electrostatic interactions contributed minimally to clogging. Conversely, K′ exhibited a significant negative correlation with SP concentration and contact angle, whereas the contact angle was significantly positively correlated with SPs. These results demonstrated that hydrophobic interactions were the primary factor driving SP–biofilm interactions during combined clogging. During the recharge process, the biofilms increased SP agglomeration by altering the surface hydrophobicity of the porous media, thereby enhancing SP adsorption on the media surface. This led to a substantial reduction in the hydraulic conductivity of the porous media.

4. Conclusions

This study examined the combined clogging mechanisms involving the migration and deposition of different SP concentrations in biofilm-coated porous media using sand column experiments. The results revealed that SPs in the low-turbidity groups (LT and LTCK) migrated more easily within the porous media, and clogging progression slowed as the turbidity of the recharge water decreased. The degree of clogging among the experimental groups followed the order of HT > HTCK > MT > MTCK > LT > LTCK. Biofilms played a critical role in SP migration and deposition. SEM and CT analyses showed that the biofilms enhanced SP deposition by increasing the surface roughness of sand grains. SPs accumulated in biofilms to form compact and homogeneous “aggregates”, which occupied the pore space. As the SP concentration in the recharge water increased, these aggregates became thicker and denser, further contributing to clogging.

Supplementary Materials

The following supporting information can be downloaded at https://www.mdpi.com/article/10.3390/w17101480/s1: Figure S1: Schematic diagram of the percolation experiments: (a) experimental device; (b) experimental design; Figure S2: The main EPS components in the surface layer of the sand column between group; Table S1: Main chemicals for experiment.

Author Contributions

H.W.: investigation, conceptualization, methodology, writing—review and editing. J.W.: writing—original draft, validation, visualization, supervision, formal analysis. D.Y.: investigation, software, methodology, formal analysis. Y.C.: conceptualization, writing—review and editing, supervision. Y.X.: visualization, supervision. All authors have read and agreed to the published version of the manuscript.

Funding

This study was supported by the National Natural Science Foundation of China (42207064), the National Natural Science Foundation of Guangxi Province, China (2022GXNSFBA035577), the research funds of The Guangxi Key Laboratory of Theory and Technology for Environmental Pollution Control (Guikeneng2401Z003), the Guangxi Science and Technology Program (Guike AD25069074), and the Guilin University of Technology Program (GLUTQD 2020113).

Data Availability Statement

Data generated during the current study are available from the corresponding author on reasonable request.

Conflicts of Interest

The authors declare that they have no known competing financial interests or personal relationships that could have appeared to influence the work reported in this paper.

References

  1. Pyne, R.D.G. Groundwater Recharge and Wells: A Guide to Aquifer Storage Recovery; Lewis Publishers: Boca Raton, FL, USA, 1995. [Google Scholar]
  2. Rinck-Pfeiffer, S. Interrelationships between biological, chemical, and physical processes as an analog to clogging in aquifer storage and recovery (ASR) wells. Water Res. 2000, 34, 2110–2118. [Google Scholar] [CrossRef]
  3. Sprenger, C.; Hartog, N.; Hernández, M.; Vilanova, E.; Grützmacher, G.; Scheibler, F.; Hannappel, S. Inventory of managed aquifer recharge sites in Europe: Historical development, current situation and perspectives. Hydrogeol. J. 2017, 25, 1909–1922. [Google Scholar] [CrossRef]
  4. Wang, W.; Zhou, Y.; Sun, X. Development of managed aquifer recharge in China. Bol. Geol. Min. 2014, 125, 227–233. [Google Scholar]
  5. Betancourt, W.Q.; Kitajima, M.; Wing, A.D.; Regnery, J.; Drewes, J.E.; Pepper, I.L.; Gerba, C.P. Assessment of virus removal by managed aquifer recharge at three full-scale operations. J. Environ. Sci. Health Part A 2014, 49, 1685–1692. [Google Scholar] [CrossRef]
  6. Sharma, S.K.; Kennedy, M.D. Soil aquifer treatment for wastewater treatment and reuse. Int. Biodeterior. Biodegrad. 2017, 119, 671–677. [Google Scholar] [CrossRef]
  7. Lu, Y.; Liu, G.L.; Lee, L.P. High-Density Silver Nanoparticle Film with Temperature-Controllable Interparticle Spacing for a Tunable Surface Enhanced Raman Scattering Substrate. Nano Lett. 2005, 5, 5–9. [Google Scholar] [CrossRef]
  8. Zhang, X. Research situation and prospect of artificial supplement to groundwater. Coal Geol. Explor. 2006, 34, 41–44. [Google Scholar]
  9. Ni, L.; Dong, J.; Yao, Y.; Shen, C.; Qv, D.; Zhang, X. A review of heat pump systems for heating and cooling of buildings in China in the last decade. Renew. Energy 2015, 84, 30–45. [Google Scholar] [CrossRef]
  10. Dillon, P.J.; Hickinbotham, M.R.; Pavelic, P. Review of International Experience in Injecting Water into Aquifers for Storage and Reuse. In Water Down Under 94: Groundwater Papers; Preprints of Papers; Institution of Engineers: Barton, Australia, 1994; pp. 13–14, 16–19. [Google Scholar]
  11. Zaidi, M.; Ahfir, N.-D.; Alem, A.; El Mansouri, B.; Wang, H.; Taibi, S.; Duchemin, B.; Merzouk, A. Assessment of clogging of managed aquifer recharge in a semi-arid region. Sci. Total Environ. 2020, 730, 139107. [Google Scholar] [CrossRef]
  12. Wang, Z.; Du, X.; Yang, Y.; Ye, X. Surface clogging process modeling of suspended solids during urban stormwater aquifer recharge. J. Environ. Sci. 2012, 24, 1418–1424. [Google Scholar] [CrossRef]
  13. Pedescoll, A.; Passos, F.; Alba, E.; García, J.; Puigagut, J. Mechanical resistance properties of gravel used in subsurface flow constructed wetlands: Implications for clogging. Water Sci. Technol. 2011, 63, 1801–1807. [Google Scholar] [CrossRef] [PubMed]
  14. Yong, C.F.; McCarthy, D.T.; Deletic, A. Predicting physical clogging of porous and permeable pavements. J. Hydrol. 2013, 481, 48–55. [Google Scholar] [CrossRef]
  15. Yang, M.; Lu, M.; Bian, H.; Sheng, L.; He, C. Effects of physical clogging on the performance of a lab-scale vertical subsurface flow constructed wetland system and simulation research. Ecol. Indic. 2018, 92, 11–17. [Google Scholar] [CrossRef]
  16. Fetzer, J.; Holzner, M.; Plötze, M.; Furrer, G. Clogging of an Alpine streambed by silt-sized particles—Insights from laboratory and field experiments. Water Res. 2017, 126, 60–69. [Google Scholar] [CrossRef]
  17. Herzig, J.P.; Leclerc, D.M.; Goff, P.L. Flow of Suspensions through Porous Media—Application to Deep Filtration. Ind. Eng. Chem. 1970, 62, 8–35. [Google Scholar] [CrossRef]
  18. Baveye, P.; Vandevivere, P.; Hoyle, B.L.; DeLeo, P.C.; De Lozada, D.S. Environmental Impact and Mechanisms of the Biological Clogging of Saturated Soils and Aquifer Materials. Crit. Rev. Environ. Sci. Technol. 1998, 28, 123–191. [Google Scholar] [CrossRef]
  19. Du, X.; Ye, X.; Zhang, X. Clogging of saturated porous media by silt-sized suspended solids under varying physical conditions during managed aquifer recharge. Hydrol. Process. 2018, 32, 2254–2262. [Google Scholar] [CrossRef]
  20. Siriwardene, N.R.; Deletic, A.; Fletcher, T.D. Clogging of stormwater gravel infiltration systems and filters: Insights from a laboratory study. Water Res. 2007, 41, 1433–1440. [Google Scholar] [CrossRef]
  21. Akhtar, M.S.; Nakashima, Y.; Nishigaki, M. Clogging mechanisms and preventive measures in artificial recharge systems. J. Groundw. Sci. Eng. 2021, 9, 181–201. [Google Scholar] [CrossRef]
  22. Zhang, H.; Xu, Y.; Kanyerere, T. A review of the managed aquifer recharge: Historical development, current situation and perspectives. Phys. Chem. Earth Parts A/B/C 2020, 118–119, 102887. [Google Scholar] [CrossRef]
  23. Pavelic, P.; Dillon, P.J.; Barry, K.E.; Vanderzalm, J.L.; Correll, R.L.; Rinck-Pfeiffer, S.M. Water quality effects on clogging rates during reclaimed water ASR in a carbonate aquifer. J. Hydrol. 2007, 334, 1–16. [Google Scholar] [CrossRef]
  24. Pavelic, P.; Dillon, P.J.; Mucha, M.; Nakai, T.; Barry, K.E.; Bestland, E. Laboratory assessment of factors affecting soil clogging of soil aquifer treatment systems. Water Res. 2011, 45, 3153–3163. [Google Scholar] [CrossRef] [PubMed]
  25. Rice, R.C. Soil Clogging during Infiltration of Secondary Effluent. J. (Water Pollut. Control Fed.) 1974, 46, 708–716. [Google Scholar]
  26. Ahfir, N.-D.; Hammadi, A.; Alem, A.; Wang, H.; Le Bras, G.; Ouahbi, T. Porous media grain size distribution and hydrodynamic forces effects on transport and deposition of suspended particles. J. Environ. Sci. 2017, 53, 161–172. [Google Scholar] [CrossRef] [PubMed]
  27. Cui, X.; Chen, C.; Sun, S.; Zhou, D.; Ndayisenga, F.; Huo, M.; Zhu, S.; Zhang, L.; Crittenden, J.C. Acceleration of saturated porous media clogging and silicon dissolution due to low concentrations of Al(III) in the recharge of reclaimed water. Water Res. 2018, 143, 136–145. [Google Scholar] [CrossRef]
  28. Vandevivere, P.; Baveye, P. Effect of bacterial extracellular polymers on the saturated hydraulic conductivity of sand columns. Appl. Environ. Microbiol. 1992, 58, 1690–1698. [Google Scholar] [CrossRef]
  29. Taylor, S.W.; Jaffé, P.R. Biofilm growth and the related changes in the physical properties of a porous medium: 1. Experimental investigation. Water Resour. Res. 1990, 26, 2153–2159. [Google Scholar] [CrossRef]
  30. Newcomer, M.E.; Hubbard, S.S.; Fleckenstein, J.H.; Maier, U.; Schmidt, C.; Thullner, M.; Ulrich, C.; Flipo, N.; Rubin, Y. Simulating bioclogging effects on dynamic riverbed permeability and infiltration. Water Resour. Res. 2016, 52, 2883–2900. [Google Scholar] [CrossRef]
  31. Schwager, A.; Boller, M. Transport phenomena in intermittent filters. Water Sci. Technol. Small Wastewater Treat. Plants III 1997, 35, 13–20. [Google Scholar] [CrossRef]
  32. Frølund, B.; Palmgren, R.; Keiding, K.; Nielsen, P.H. Extraction of extracellular polymers from activated sludge using a cation exchange resin. Water Res. 1996, 30, 1749–1758. [Google Scholar] [CrossRef]
  33. Chenu, C. Clay- or sand-polysaccharide associations as models for the interface between micro-organisms and soil: Water related properties and microstructure. Geoderma Int. Workshop Methods Res. Soil Struct./Soil Biota Interrelat. 1993, 56, 143–156. [Google Scholar] [CrossRef]
  34. Roche, K.R.; Drummond, J.D.; Boano, F.; Packman, A.I.; Battin, T.J.; Hunter, W.R. Benthic biofilm controls on fine particle dynamics in streams. Water Resour. Res. 2017, 53, 222–236. [Google Scholar] [CrossRef]
  35. Xia, L.; Zheng, X.; Shao, H.; Xin, J.; Peng, T. Influences of environmental factors on bacterial extracellular polymeric substances production in porous media. J. Hydrol. 2014, 519, 3153–3162. [Google Scholar] [CrossRef]
  36. McCalla, T.M. Studies on the Effect of Microorganisms on Rate of Percolation of Water Through Soils. Soil. Sci. Soc. Am. J. 1951, 15, 182–186. [Google Scholar] [CrossRef]
  37. Martin, R. Clogging Issues Associated with Managed Aquifer Recharge Methods; IAH Commission on Managing Aquifer Recharge: Perth, Australia, 2013; 213p. [Google Scholar]
  38. Zhou, Y.; Luo, S.; Yu, B.; Zhang, T.; Li, J.; Zhang, Y. A comparative analysis for the development and recovery processes of different types of clogging in lab-scale vertical flow constructed wetlands. Environ. Sci. Pollut. Res. 2018, 25, 24073–24083. [Google Scholar] [CrossRef]
  39. Ye, X.; Du, X.; Zhang, H.; Cui, R. Effects of solution ionic strength and flow velocity on colloid clogging in saturated porous media during artificial recharge. CIESC J. 2017, 68, 4793. [Google Scholar] [CrossRef]
  40. Fernández Escalante, E. Practical Management to Minimize the Effects of Clogging in Managed Aquifer Recharge Wells at Two Sites in the Guadiana Basin, Spain. J. Hydrol. Eng. 2015, 20, B5014002. [Google Scholar] [CrossRef]
  41. Huangfu, X.; Xu, Y.; Liu, C.; He, Q.; Ma, J.; Ma, C.; Huang, R. A review on the interactions between engineered nanoparticles with extracellular and intracellular polymeric substances from wastewater treatment aggregates. Chemosphere 2019, 219, 766–783. [Google Scholar] [CrossRef]
  42. He, L.; Rong, H.; Wu, D.; Li, M.; Wang, C.; Tong, M. Influence of biofilm on the transport and deposition behaviors of nano- and micro-plastic particles in quartz sand. Water Res. 2020, 178, 115808. [Google Scholar] [CrossRef]
  43. Tong, M.; Ding, J.; Shen, Y.; Zhu, P. Influence of biofilm on the transport of fullerene (C60) nanoparticles in porous media. Water Res. 2010, 44, 1094–1103. [Google Scholar] [CrossRef]
  44. Xiao, Y.; Wiesner, M.R. Transport and Retention of Selected Engineered Nanoparticles by Porous Media in the Presence of a Biofilm. Environ. Sci. Technol. 2013, 47, 2246–2253. [Google Scholar] [CrossRef] [PubMed]
  45. Peulen, T.-O.; Wilkinson, K.J. Diffusion of Nanoparticles in a Biofilm. Environ. Sci. Technol. 2011, 45, 3367–3373. [Google Scholar] [CrossRef] [PubMed]
  46. Mitzel, M.R.; Tufenkji, N. Transport of Industrial PVP-Stabilized Silver Nanoparticles in Saturated Quartz Sand Coated with Pseudomonas aeruginosa PAO1 Biofilm of Variable Age. Environ. Sci. Technol. 2014, 48, 2715–2723. [Google Scholar] [CrossRef]
  47. Kurlanda-Witek, H.; Ngwenya, B.T.; Butler, I.B. The influence of biofilms on the mobility of bare and capped zinc oxide nanoparticles in saturated sand and glass beads. J. Contam. Hydrol. 2015, 179, 160–170. [Google Scholar] [CrossRef]
  48. Jian-Zhou, H.; Cheng-Cheng, L.; Deng-Jun, W.; Zhou, D.-M. Biofilms and extracellular polymeric substances mediate the transport of graphene oxide nanoparticles in saturated porous media. J. Hazard. Mater. 2015, 300, 467–474. [Google Scholar] [CrossRef]
  49. Fabrega, J.; Renshaw, J.C.; Lead, J.R. Interactions of silver nanoparticles with Pseudomonas putida biofilms. Environ. Sci. Technol. 2009, 43, 9004–9009. [Google Scholar] [CrossRef]
  50. Lerner, R.N.; Lu, Q.; Zeng, H.; Liu, Y. The effects of biofilm on the transport of stabilized zerovalent iron nanoparticles in saturated porous media. Water Res. 2012, 46, 975–985. [Google Scholar] [CrossRef]
  51. Crampon, M.; Hellal, J.; Mouvet, C.; Wille, G.; Michel, C.; Wiener, A.; Braun, J.; Ollivier, P. Do natural biofilm impact nZVI mobility and interactions with porous media? A column study. Sci. Total Environ. 2018, 610–611, 709–719. [Google Scholar] [CrossRef]
  52. Ernissee, J.; Abbott, W. Binding of mineral grains by a species of Thalassiosira. Nova Hedwig. Beih. 1975, 53, 241–252. [Google Scholar]
  53. Cui, R.; Ye, X.; Du, X. Coupled effects of bacteria and suspended solids on clogging during managed aquifer recharge. J. Hydrol. 2021, 600, 126543. [Google Scholar] [CrossRef]
  54. Ramazanpour Esfahani, A.; Batelaan, O.; Hutson, J.L.; Fallowfield, H.J. Combined physical, chemical and biological clogging of managed aquifer recharge and the effect of biofilm on virus transport behavior: A column study. J. Water Process Eng. 2020, 33, 101115. [Google Scholar] [CrossRef]
  55. Wang, H.; Xin, J.; Zheng, X.; Li, M.; Fang, Y.; Zheng, T. Clogging evolution in porous media under the coexistence of suspended particles and bacteria: Insights into the mechanisms and implications for groundwater recharge. J. Hydrol. 2020, 582, 124554. [Google Scholar] [CrossRef]
  56. Denkhaus, E.; Meisen, S.; Telgheder, U.; Wingender, J. Chemical and physical methods for characterisation of biofilms. Microchim. Acta 2007, 158, 1–27. [Google Scholar] [CrossRef]
  57. Flemming, H.-C.; Wingender, J. Relevance of microbial extracellular polymeric substances (EPSs)—Part I: Structural and ecological aspects. Water Sci. Technol. 2001, 43, 1–8. [Google Scholar] [CrossRef] [PubMed]
  58. Wang, H.; Xin, J.; Zheng, X.; Fang, Y.; Zhao, M.; Zheng, T. Effect of biofilms on the clogging mechanisms of suspended particles in porous media during artificial recharge. J. Hydrol. 2023, 619, 129342. [Google Scholar] [CrossRef]
  59. Tripathi, S.; Champagne, D.; Tufenkji, N. Transport behavior of selected nanoparticles with different surface coatings in granular porous media coated with Pseudomonas aeruginosa biofilm. Environ. Sci. Technol. 2012, 46, 6942–6949. [Google Scholar] [CrossRef]
  60. Van Oss, C.J.; Chaudhury, M.K.; Good, R.J. Interfacial Lifshitz-van der Waals and polar interactions in macroscopic systems. Chem. Rev. 1988, 88, 927–941. [Google Scholar] [CrossRef]
  61. Grasso, D.; Subramaniam, K.; Butkus, M.; Strevett, K.; Bergendahl, J. A review of non-DLVO interactions in environmental colloidal systems. Rev. Environ. Sci. Biotechnol. 2002, 1, 17–38. [Google Scholar] [CrossRef]
  62. Wu, D.; He, L.; Ge, Z.; Tong, M.; Kim, H. Different electrically charged proteins result in diverse bacterial transport behaviors in porous media. Water Res. 2018, 143, 425–435. [Google Scholar] [CrossRef]
  63. Chu, T.; Yang, Y.; Lu, Y.; Du, X.; Ye, X. Clogging process by suspended solids during groundwater artificial recharge: Evidence from lab simulations and numerical modelling. Hydrol. Process. 2019, 33, 3226–3235. [Google Scholar] [CrossRef]
  64. Poorni, S.; Natarajan, K.A. Microbially induced selective flocculation of hematite from kaolinite. Int. J. Miner. Process. 2013, 125, 92–100. [Google Scholar] [CrossRef]
  65. Ghashoghchi, R.A.; Hosseini, M.R.; Ahmadi, A. Effects of microbial cells and their associated extracellular polymeric substances on the bio-flocculation of kaolin and quartz. Appl. Clay Sci. 2017, 138, 81–88. [Google Scholar] [CrossRef]
  66. Bezawada, J.; Hoang, N.V.; More, T.T.; Yan, S.; Tyagi, N.; Tyagi, R.D.; Surampalli, R.Y. Production of extracellular polymeric substances (EPS) by Serratia sp.1 using wastewater sludge as raw material and flocculation activity of the EPS produced. J. Environ. Manag. 2013, 128, 83–91. [Google Scholar] [CrossRef] [PubMed]
  67. More, T.T.; Yadav, J.S.S.; Yan, S.; Tyagi, R.D.; Surampalli, R.Y. Extracellular polymeric substances of bacteria and their potential environmental applications. J. Environ. Manag. 2014, 144, 1–25. [Google Scholar] [CrossRef]
  68. Aljuboori, A.H.R.; Idris, A.; Al-joubory, H.H.R.; Uemura, Y.; Ibn Abubakar, B.S.U. Flocculation behavior and mechanism of bioflocculant produced by Aspergillus flavus. J. Environ. Manag. 2015, 150, 466–471. [Google Scholar] [CrossRef]
  69. Qin, J.; He, L.; Su, X.; Wang, S.; Tong, M. Starvation Process Would Induce Different Bacterial Mobilities and Attachment Performances in Porous Media without and with Nutrients on Surfaces. Environ. Sci. Technol. 2024, 58, 13879–13889. [Google Scholar] [CrossRef]
  70. Ermak, D.L.; McCammon, J.A. Brownian dynamics with hydrodynamic interactions. J. Chem. Phys. 1978, 69, 1352–1360. [Google Scholar] [CrossRef]
  71. Bradford, S.A.; Bettahar, M. Concentration dependent transport of colloids in saturated porous media. J. Contam. Hydrol. 2006, 82, 99–117. [Google Scholar] [CrossRef]
Figure 1. The overall relative hydraulic conductivity of the sand column: (1) high-turbidity group (HT), (2) medium-turbidity group (MT), (3) low-turbidity group (LT), (4) high-turbidity control check group (HTCK), (5) medium-turbidity control check group (MTCK), (6) low-turbidity control check group (LTCK), (7) microbial consortium control check group (MCCK), (8) control check group (CK).
Water 17 01480 g001
Figure 2. Relative hydraulic conductivity of different layers of sand column: (a) high-turbidity control check group (HTCK); (b) high-turbidity group (HT); (c) medium-turbidity control check group (MTCK); (d) medium-turbidity group (MT); (e) low-turbidity control check group (LTCK); (f) low-turbidity group (LT).
Water 17 01480 g002
Figure 3. Biomass of different layers from sand column inlet to outlet: (1) microbial consortium control check group (MCCK), (2) high-turbidity group (HT), (3) medium-turbidity group (MT), (4) low-turbidity group (LT).
Water 17 01480 g003
Figure 4. Suspended particle deposition in different layers from the inlet to the outlet of the sand column: (1) high-turbidity control check group (HTCK), (2) medium-turbidity control check group (MTCK), (3) low-turbidity control check group (LTCK), (4) high-turbidity group (HT), (5) medium-turbidity group (MT), (6) low-turbidity group (LT).
Water 17 01480 g004
Figure 5. Three-dimensional reconstructed images of samples from CK, HTCK, and HT. Both vertical (right) and horizontal (bottom) sections of images are shown for each column (left). The cropped and enlarged snapshots of horizontal section highlight the spatial distribution of pores and SPs.
Water 17 01480 g005
Figure 6. The micromorphology of sand sample on the surface layer (0–1 cm) of the sand column after the recharge experiment: (a) control check group (CK), (b) high-turbidity control check group (HTCK), (c) medium-turbidity control check group (MTCK), (d) low-turbidity control check group (LTCK), (e) microbial consortium control check group (MCCK), (f) high-turbidity group (HT), (g) medium-turbidity group (MT), (h) low-turbidity group (LT).
Water 17 01480 g006
Figure 7. Collinearity relationship plot.
Water 17 01480 g007
Figure 8. Interaction energy between biofilm and quartz sand: (a) total potential energy, (b) van der Waals interaction energy, (c) electrostatic interaction energy, (d) Lewis acid–base interaction energy.
Water 17 01480 g008
Figure 9. Interaction energy between SPs and biofilm-coated quartz sand in different turbidity recharge water: (a) total potential energy, (b) van der Waals interaction energy, (c) electrostatic interaction energy, (d) Lewis acid–base interaction energy.
Water 17 01480 g009
Figure 10. Correlation analysis as well as the significance analysis.
Water 17 01480 g010
Table 1. Experimental group design.
Experimental GroupPorous Media with or Without Biofilm CoatingThe Turbidity of Recharge Water
High-turbidity group (HT)with biofilm coating100 NTU
High-turbidity control check group (HTCK)without biofilm coating100 NTU
Medium-turbidity group (MT)with biofilm coating50 NTU
Medium-turbidity control check group (MTCK)without biofilm coating50 NTU
Low-turbidity group (LT)with biofilm coating10 NTU
Low-turbidity control check group (LTCK)without biofilm coating10 NTU
Microbial consortium control check group (MCCK)with biofilm coating0 NTU
Control check group (CK)without biofilm coating0 NTU
Table 2. Contact angle and thermodynamic parameters.
ParametersUnitsMCSPsMC + SPs
(100 NTU)
MC + SPs
(50 NTU)
MC + SPs
(10 NTU)
θDii(°)23.6530.1735.1532.8630.43
θG(°)36.8516.1838.0135.5240.18
θW(°)18.319.6023.7023.0818.15
γLW(mJ/m−2)46.8243.9442.0743.0043.94
γ(mJ/m−2)53.3146.5350.9849.1528.41
γ+(mJ/m−2)0.181.940.490.590.88
A132(J/m−2)7.787.487.277.377.48
Note: θDii represents diiodomethane as the contact angle reagent; θG represents glycerol as the contact angle reagent; θW represents water as the contact angle reagent.
Table 3. The zeta potential and contact angle on the surface of the porous media.
GroupZeta Potential (mV)Contact Angle (°)
Kaolinite29.03 ± 0.679.60 ± 2.55
CK−3.95 ± 0.758.55 ± 1.19
MCCK−22.87 ± 1.7010.67 ± 1.98
HTCK−20.70 ± 1.0022.90 ± 2.39
HT−21.50 ± 2.4023.70 ± 1.56
MT−33.93 ± 0.4723.08 ± 0.94
LT−36.07 ± 0.6318.15 ± 0.86
Table 4. Richness and diversity indices.
GroupsRichness IndexDiversity IndexCoverage
ChaoAceShannonSimpson
MCCK895.92949.803.100.160.998
HT913.48960.093.220.120.998
MT988.831038.153.250.140.998
LT1018.051065.003.370.120.999
Disclaimer/Publisher’s Note: The statements, opinions and data contained in all publications are solely those of the individual author(s) and contributor(s) and not of MDPI and/or the editor(s). MDPI and/or the editor(s) disclaim responsibility for any injury to people or property resulting from any ideas, methods, instructions or products referred to in the content.