Article

Hydrochemical Characteristics and Association of Hot Springs on Small-Scale Faults in Southern Yunnan–Tibet Geothermal Zone

1
School of Water Resources and Environment, China University of Geosciences (Beijing), Beijing 100083, China
2
Guangxi Karst Resources and Environment Research Center of Engineering Technology, International Research Centre on Karst Under the Auspices of UNESCO, Institute of Karst Geology, Chinese Academy of Geological Sciences, Guilin 541004, China
3
Pingguo Guangxi, Karst Ecosystem, National Observation and Research Station, Pingguo 531406, China
*
Authors to whom correspondence should be addressed.
These authors contributed equally to this work.
Water 2025, 17(10), 1481; https://doi.org/10.3390/w17101481
Submission received: 26 March 2025 / Revised: 28 April 2025 / Accepted: 12 May 2025 / Published: 14 May 2025
(This article belongs to the Section Hydrogeology)

Abstract

:
Hydrogeochemical characteristics and temperature variations in fault-controlled, deep-circulation thermal springs elucidate water–rock interaction dynamics and hydrothermal circulation depths, providing critical insights into fault permeability and stress accumulation. To investigate the coexistence of high-temperature and medium-low-temperature thermal springs on small-scale faults and their distinct circulation mechanisms, hydrochemical and isotopic analyses were conducted on 13 water samples (9 proximal on the Xiangbaihe Fault) in western Yunnan. The hot springs along the Xiangbaihe Fault are predominantly classified as the Na-HCO3 type, derived from carbonate and aluminosilicate hydrolysis. δ2H and δ18O confirmed a meteoric origin, with recharge elevations spanning 2465–3286 m (Gaoligong Mountain). Inverse hydrochemical modeling demonstrated progressive mineral transfer and water–rock interactions along the fault’s east–west axis. Conservative elements (Cl, Li) suggested a shared geothermal fluid source or reservoir affiliation. BLZ reservoir temperatures (194–221 °C) were classified as a high-temperature system, whereas others (58–150 °C) represented medium-low-temperature systems. Although each thermal spring represents a distinct geothermal system, reservoir interconnectivity is inferred. Notably, despite uniform lithology, variations in spring temperature and elemental composition are attributed to a subsurface magma chamber beneath BLZ, heterogeneous fault geometries, differential reservoir temperatures, and variable cold-water mixing ratios. This study establishes a framework for understanding groundwater circulation in small-scale fault-associated geothermal systems, with implications for tectonic activity monitoring and geothermal resource assessment.

1. Introduction

Fault systems serve as critical conduits for geothermal fluid dynamics, facilitating heat transfer and hydrothermal circulation [1]. Investigations of Yellowstone’s geyser system have demonstrated that fault permeability governs the depth of high-temperature fluid circulation, while eruption period and fluid chemistry reflect deep-seated fault activity [2]. Fault-related hot springs are important targets for geothermal energy development, tourism, and mineral extraction, but their sustainable utilization requires an assessment of recharge rates and structural stability [3]. Medium-small fault zones are recognized as critical regulators of local geothermal field distribution, offering insights into the mechanisms underlying geothermal anomalies [4]. Furthermore, comparative analyses of the hydrochemical and isotopic characteristics across springs, surface waters, and bedrock have enabled the identification of evaporite minerals on the chemical compositions of hot or salty springs and aquifer delineation [5,6].
The study of fault-controlled geothermal systems originated from the seminal low-temperature convective geothermal model proposed by White, which posits that atmospheric precipitation is heated through deep circulation within fault zones and subsequently discharged as thermal springs via structural weak points [7]. Recent investigations have focused on micro-scale fault properties (e.g., permeability, porosity) and their influence on hydrochemical signatures [1,6], fluid migration dynamics [8,9], and geothermal circulation patterns [5,10]. Wu and Zhou [1] demonstrated that circulation depth, total dissolved solids (TDS), reservoir temperatures, and hydrochemical diversity in Red River fault springs are governed by regional fracture zone distributions. Conversely, research on medium-small fault systems remains limited, despite their prevalence in tectonically complex regions. Such systems are often characterized by multi-reservoir superposition and hydraulic connectivity within fault zones [11,12]. While traditional studies have prioritized large-scale faults, the thermal regulation model of medium-small faults complements the understanding of geothermal system diversity and refines existing classifications. The current demand for geothermal resource exploitation underscores the necessity of developing reservoir models that integrate fault zone microstructure analyses with macro-scale geothermal field simulations. This approach elucidates the multi-scale thermal regulation effects of medium-small faults, which hold significant implications for resource potential assessment, sustainable development, and geological hazard mitigation in such systems.
The western Yunnan region is situated within the Yunnan–Tibet Geothermal Zone (the segment of the Mediterranean–Himalayan Geothermal Zone in China). Geothermal resources and features are abundant and thermal waters are accessible at depths of ~1000 m with temperatures exceeding 40 °C [13]. Near Longling, medium-low- and high-temperature hot springs coexist on the Xiangbaihe Fault. Hydrothermal manifestations, including boiling springs, fumaroles, and geysers, dominate this area. While the high-temperature Banglazhang (BLZ) geothermal field (0.2 km2) in Longling has been extensively characterized for its fumaroles and hydrothermal alteration [10], the genesis and circulation patterns of medium-low-temperature springs along the Xiangbaihe Fault remain poorly constrained. Knowledge of the hydrochemistry and geothermometry of these coexisting systems is of significant importance in the comprehension of the transfer of substances in subsurface circulation and the evolutionary processes of groundwater. The coexistence of high- and medium-low-temperature thermal springs within small fault zones provides a critical framework for elucidating geothermal anomaly mechanisms.
This study employs integrated hydrochemical, isotopic, and geothermal analyses of thermal springs to (1) identify the sources of hydrochemical compositions; (2) elucidate water–rock interaction mechanisms during groundwater circulation; (3) determine hydrological connections among hot springs on the Xiangbaihe Fault; and (4) summarize the genesis patterns of coexisting high- and medium-low-temperature springs, thereby evaluating the roles of water source, flow paths, hydrologic mixing, and the influence of the Xiangbaihe Fault. The results may provide some insights into substance migration in hot spring systems and the geothermal resource potential in analogous regions.

2. Materials and Methods

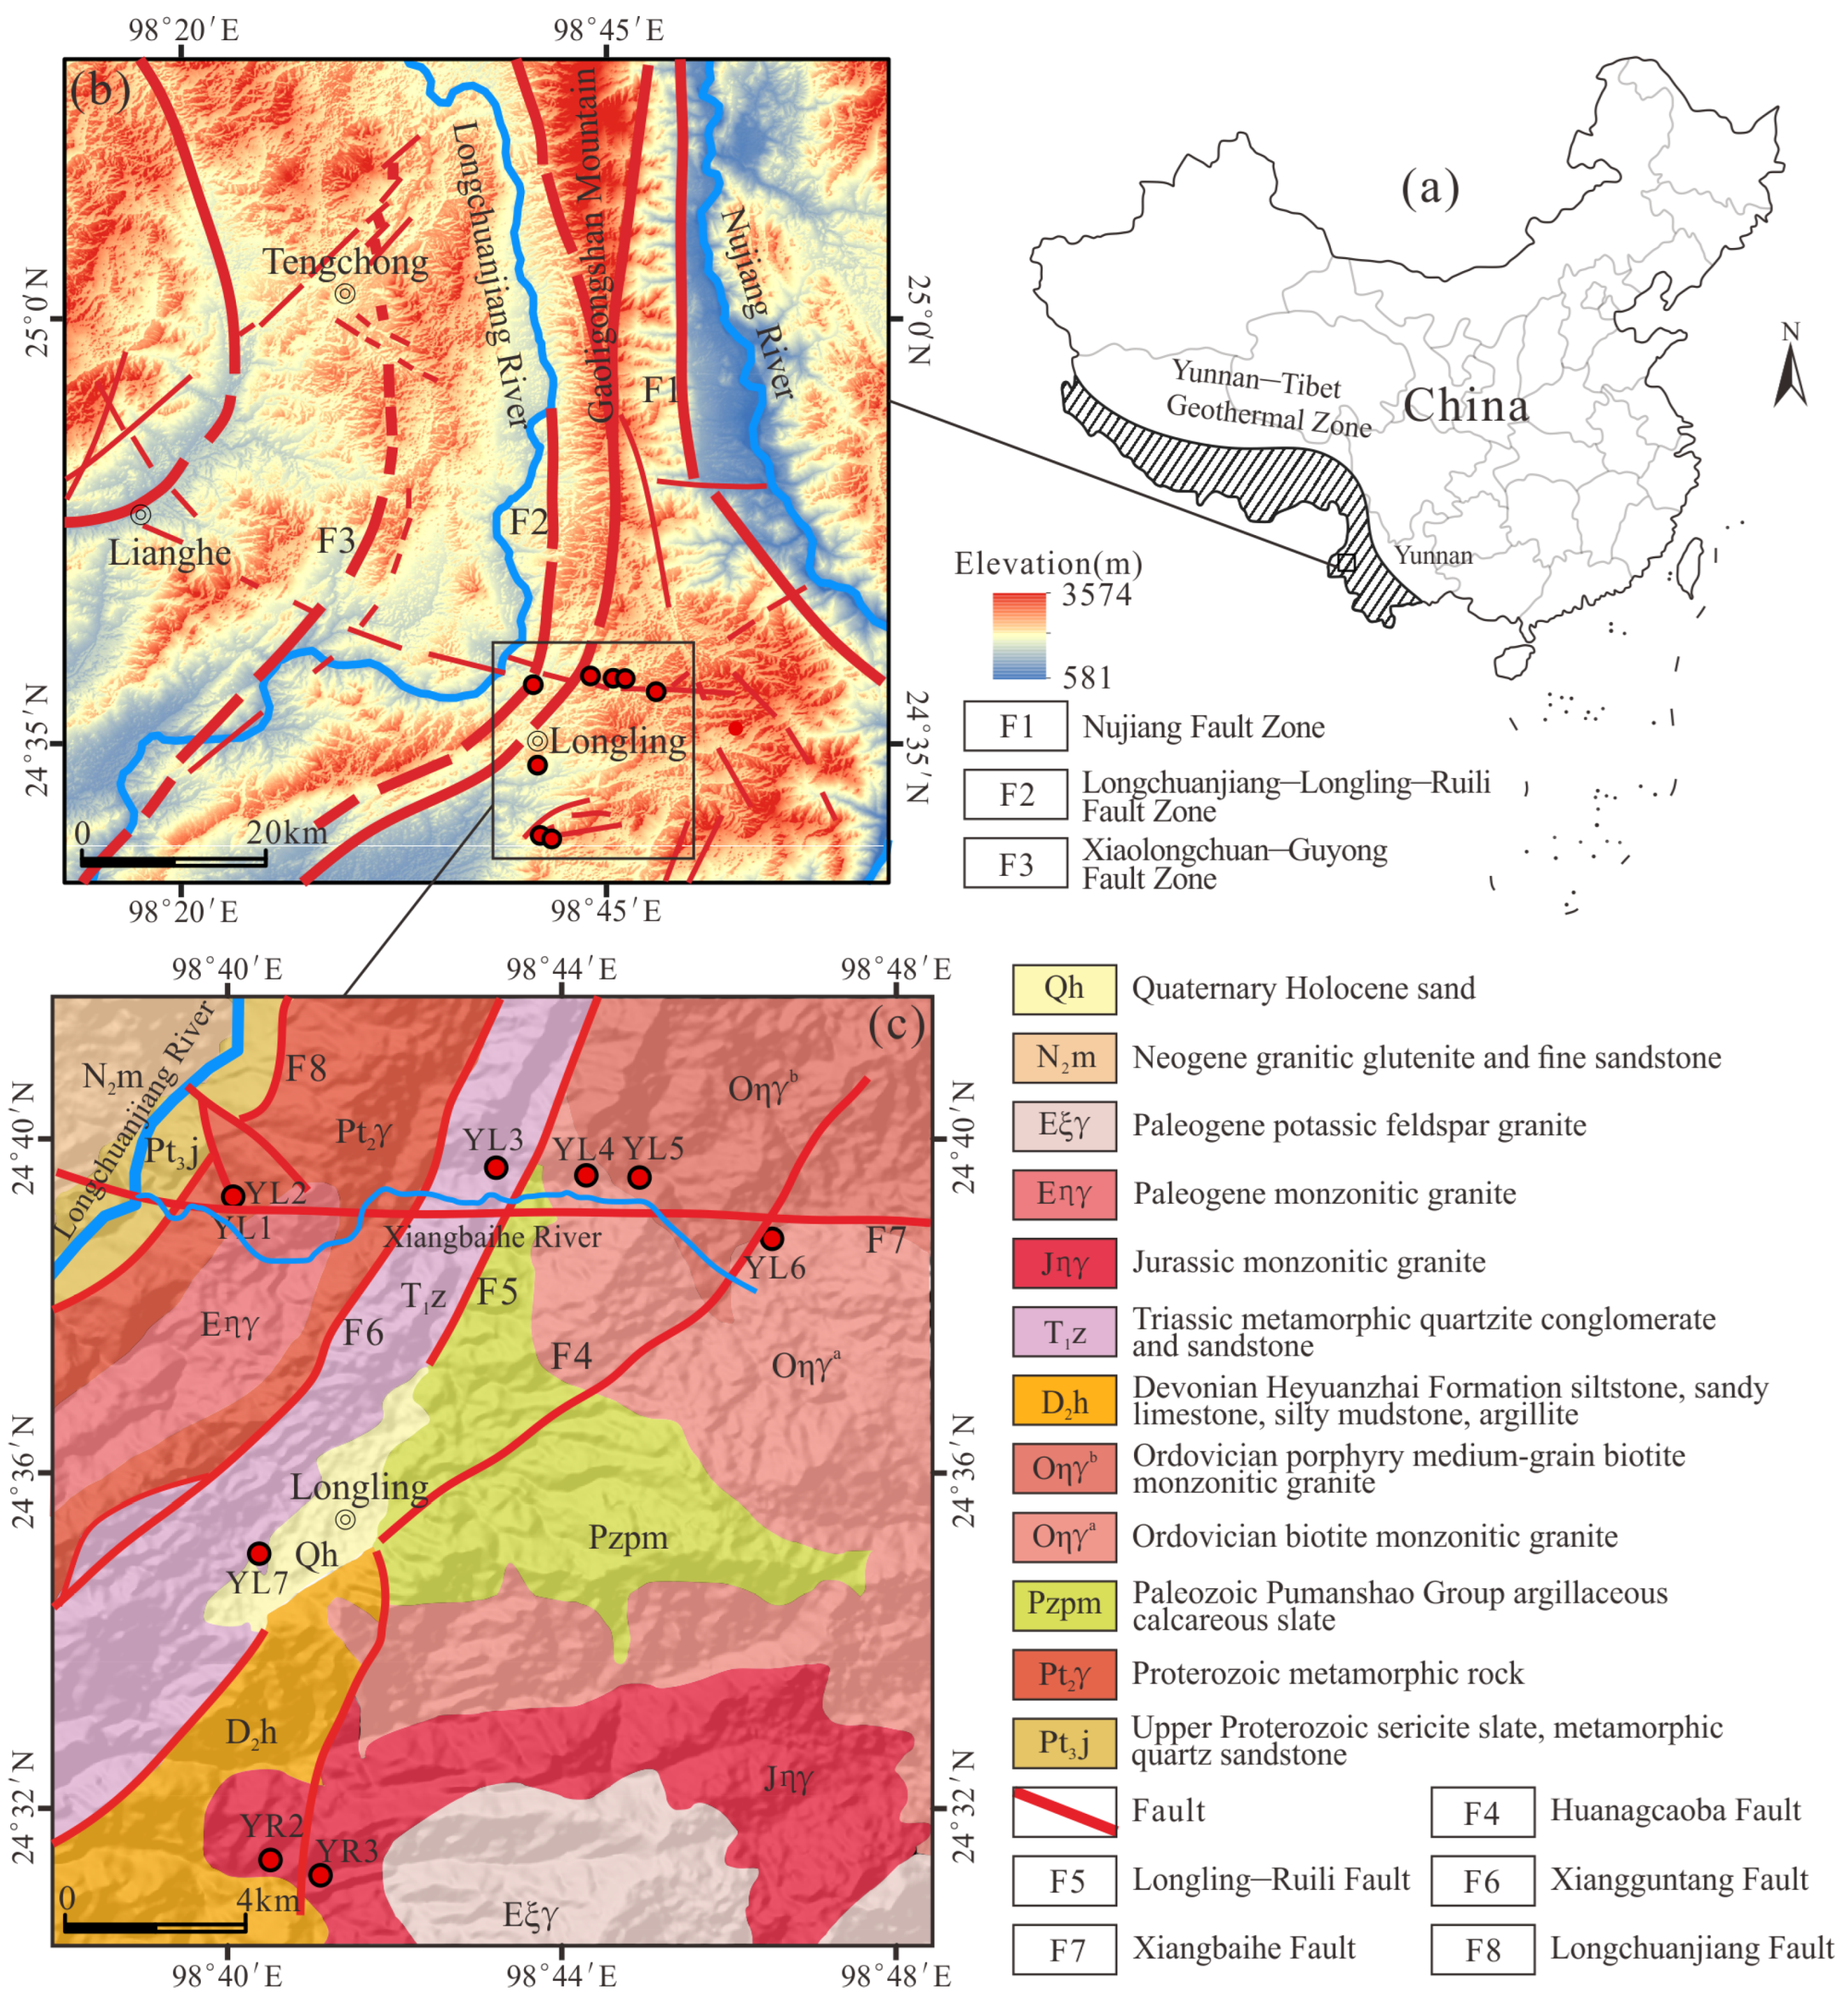
2.1. Geological Setting

The study area is situated near Longling in western Yunnan, southwestern China (Figure 1a), within the southern Gaoligong Mountain Range. The Longling study area, which is characterized by a central highland (elevation: 1254–4274 m) flanked by peripheral lowlands, is traversed by the Xiangbaihe River, which flows east to west into the Longchuanjiang River (Figure 1c). Climatically, the region exhibits a subtropical montane monsoon regime with small seasonal temperature variation (mean annual temperature: 17 °C) and pronounced dry–wet seasonality. Annual precipitation averages 2100 mm, with 89% concentrated from May to October [14].
Geologically, the study area is situated within the Eurasian–Indian Plate collision zone, forming a segment of the Yunnan–Tibet Geothermal Belt [15]. Three major fault zones (F1, F2, F3) traverse the region (Figure 1b), with Longling situated at the F1–F2 junction. F2 was formed in the Caledonian period and played a significant role in controlling the deposition of Paleozoic and Mesozoic rocks, and developed a deep-seated high-temperature mantle layer and intersecting secondary fractures, thereby establishing hydrothermal convection pathways that facilitated multi-level geothermal anomalies [13]. The Xiangbaihe Fault is a secondary small fault generated on F2 which formed a thermal convection channel for hot springs, ultimately developing into a multi-level geothermal anomaly zone [13]. The YL1–YL6 cluster is near the Xiangbaihe Fault, intersected by NE and NNE trending subsidiary faults (Figure 1c).
Elevated heat flux values (~85 mW/m2) are observed in Longling, significantly exceeding the global average (61.6 mW/m2) [16], while the subsurface thermal gradient is recorded at 5.59 °C/100 m [15]. Paleogene–Neogene magmatic activity is prominent in the Gaoligong moderate-high-temperature geothermal zone adjacent to the Tengchong high-temperature geothermal zone [17]. Geophysical surveys by Guo et al. [18] posited that the BLZ geothermal system overlies a shallow magma chamber (~10 km2 lateral extent) with boundary temperatures of 500–700 °C. This interpretation is supported by anomalously low resistivity (5 Ω·m) in the BLZ field. Notably, the BLZ geothermal system diverges from typical magma-influenced systems such as Yangbajing (Tibet), Rehai (Tengchong), and Vonarskard (Iceland), as magmatic fluid input is absent despite underlying chambers [19,20]. Other medium-low-temperature hot springs in Longling are also almost unaffected by magma chambers.
Figure 1. (a) Map of China, (b) structural geology map and location of hot springs in Longling (modified from [13]), (c) geologic map and location of the water samples in the study area (modified from the 1:250,000 geological map (G47C003002) of GeoCloud [21]).
Water 17 01481 g001
Aquifers in the study area are classified into two principal categories: unconsolidated sediment aquifers and fissured bedrock aquifers. Geothermal fluids are predominantly stored within fissured bedrock systems, where well-developed granite fracture networks facilitate efficient groundwater recharge and runoff. The thermal reservoir of the BLZ geothermal field is hosted within Proterozoic metamorphic rocks. The study area is characterized by deep gullies and valleys, with tectonic, weathering, and fault-induced fractures enhancing precipitation infiltration. Consequently, groundwater recharge is derived primarily from precipitation, supplemented locally by surface water inputs. Groundwater transport and enrichment are governed by lithological constraints, superimposed on structural controls (fault) and topographic gradients. Notably, hydrothermal discharge occurs as thermal springs along fault zones or lithological contacts, driven by deep-circulation processes [22,23]. Springs YL1 and YL2 (BLZ vents) discharge through lower Paleozoic metamorphic rocks, while YL3–YL6 emerge from Caledonian granite. YR2 and YR3 are exposed in Yanshanian granite. Cold spring YL7 originates from Triassic sandstone. A rainwater sample (YLYS) was collected at Mucheng, about 30 km from Longling (Figure 1c).

2.2. Sampling and Analytical Methods

A total of 13 water samples from 9 hydrothermal springs were collected during two campaigns: YL1-A, YL2-A, and YL6-A in March 2019, and the remaining samples in March 2018. YL1-A, YL2-A, and YL6-A were collected from the same spring vents as YL1, YL2, and YL6, respectively. All the equipments and materials used in the field were provided by Yunnan Gold & Mining Group Co., Ltd. (Kunming, China). Before sampling, all water samples were filtered through 0.2 μm membranes. Sampling protocols were rigorously standardized as follows: low-density polyethylene containers were triple-rinsed with sample water before use, labeled, and sealed with transparent tape. To stabilize cations for analysis, concentrated hydrochloric acid was added to adjust pH values to <2, whereas anion samples remained unacidified. To inhibit SiO2 precipitation, aliquots designated for SiO2 quantification were diluted fivefold with deionized water. Field parameters (temperature, pH) were measured using a MIK-TP101 probe-type digital thermometer (accuracy: ±0.2 °C) and a MIK-CT 6821 portable pH/ORP meter (pH accuracy: ±0.1). CO2 concentrations were determined through on-site titration with 2% NaOH solution.
Chemical analyses were conducted at the Analysis Center of the Beijing Research Institute of Uranium Geology (Beijing, China) within one week of collection. Major ions (Na, K, Mg) were quantified via ICS-1100 ion chromatography, while Ca and HCO3 were analyzed using an AT-510 automatic titration analyzer. F, Cl, NO3, and SO4 concentrations were determined via 883 Basic IC Plus ion chromatography (detection limit: 0.08 mg/L). Trace elements (Li, Sr, Si) were determined by the NexION300D plasma mass spectrometer and 5300DV plasma emission spectrometer (detection limit: 0.002 μg/L). Stable isotopes (δ2H, δ18O) were analyzed with a MAT-253 gas isotope mass spectrometer, employing zinc reduction and CO2–water equilibrium methods (analytical accuracy: ±0.5‰ for δ2H; ±0.1‰ for δ18O). Isotopic compositions are reported in δ notation (‰) relative to the Vienna Standard Mean Ocean Water (V-SMOW). Hydrochemical data reliability was validated via charge balance calculations, with errors ≤ 2.82% (Table 1).
Deuterium excess (d-excess) serves as a robust tracer for identifying mixing and/or switching of groundwater sources with different water–rock interaction [10,24]:
d e x c e s s = δ 2 H 8 × δ 18 O
Recharge elevations were estimated using Equations (2) and (3) [25]
H = δ R δ P K + h
where H is the recharge elevation (m); h is the elevation of the hot spring (m); δR is the δ2H or δ18O value of the sampling water; δP is the δ2H or δ18O value of precipitation; and K is the elevation gradient of δ2H or δ18O of precipitation (δ/100 m).
The altitude effect for δ2H in Chinese precipitation was as follows [26]:
δ 2 H = 0.02 H 27
Chloro-alkaline indices (CAI) were employed to assess the degree of cation exchange during water–rock interaction [27]:
C A I = C l N a + K C l
C A I = C l N a + K S O 4 + H C O 3 + C O 3 + N O 3
Inverse hydrochemical modeling was conducted using PHREEQC 3.0 software developed by the U.S. Geological Survey (USGS) [28,29]. The reliability of the model is contingent upon the following assumptions: 1. Mass Conservation: elemental mass is conserved between initial and terminal aqueous samples during hydrochemical evolution. 2. Simplified Reaction Pathways: only user-defined reactions (e.g., mineral dissolution/precipitation, gas exchange, ion exchange) are considered, while minor processes (e.g., microbial activity, colloid adsorption) are neglected. 3. Water–rock interactions are assumed to attain localized thermodynamic equilibrium. 4. Steady-State Homogeneity: hydrological conditions along flow paths are stable, with constant flow rates and homogeneous media. Key input parameters for the simulation include the following: 1. pH, major ions (Ca, Mg, Na, K, SO4, Cl, HCO3), SiO2, and trace elements for both initial and terminal samples. 2. Mineral phases potentially involved in dissolution/precipitation (e.g., calcite, gypsum, kaolinite). The constraints were as follows: conservative elements (e.g., Cl) and data uncertainty ranges (±5% error tolerance). Model boundary conditions were defined as follows: initial and terminal water flow paths were explicitly delineated, while redox and mixed boundary conditions were disregarded.
To address aluminum quantification limitations, reservoir temperatures were derived via the SOLVEQ-XPT program using the FixAl method, which enforces mineral–fluid equilibrium [30,31]. CO2 degassing during geothermal fluid ascent [32] was corrected by introducing equimolar H⁺ and HCO3 to reconstruct deep reservoir compositions [30]. The FixAl framework is grounded in multicomponent heterogeneous equilibrium theory, wherein aluminosilicate mineral equilibria are interdependent. Under unknown Al concentrations, hydrated Al activity was fixed by assuming saturation with an aluminum-bearing mineral (e.g., microcline) across temperature gradients [30]. Model initialization required the following: 1. Geochemical Inputs: pH, temperature (°C), major ion concentrations, and initial aluminum concentration (default: 0.05 mg/L). 2. Fixed Mineral Phase (e.g., Gibbsite). 3. Selection of the appropriate thermodynamic database (e.g., phreeqc.dat or minteq.v4.dat). Boundary conditions were stipulated as follows: 1. Saturation constraints were imposed on the fixed mineral phase. 2. Open System Dynamics: aluminum dissolution from minerals or external input was permitted.
A quartz geothermometer with no steam separation or mixing and a chalcedony geothermometer with no steam loss (0–250 °C) estimated the reservoir temperature as follows [33]:
T = 1309 5.19 lg S i O 2 273.15
T = 1032 4.69 lg S i O 2 273.15
where T is reservoir temperature (°C) and the unit of SiO2 concentration is in mg/L.
Silica–enthalpy mixing models [34] were applied to estimate reservoir temperatures and cold-water mixing ratios:
H c   X 1 + H h 1 X 1 = H s
S i O 2 c   X 2 + S i O 2 h 1 X 2 = S i O 2 s
where Hc is the enthalpy of cold water; Hh is the enthalpy of hot water before mixing; Hs is the enthalpy of spring water; SiO2c is the SiO2 concentration in cold water; SiO2h is the SiO2 concentration in the hot water before mixing; SiO2s is the SiO2 concentration in spring water; and X is the mixing ratio of cold water.
The thermal circulation depth of groundwater represents a critical parameter in geothermal resource characterization, particularly for elucidating geothermal fluid genesis [35]:
M = q t H t B + m
where M denotes the circulation depth (m), q is the regional geothermal gradient (17.89 m/°C), tH corresponds to the reservoir temperature (°C), tB represents the local average annual temperature (17 °C) in the recharge area, and m signifies the thickness of the constant temperature zone (30 m) [15].

3. Results

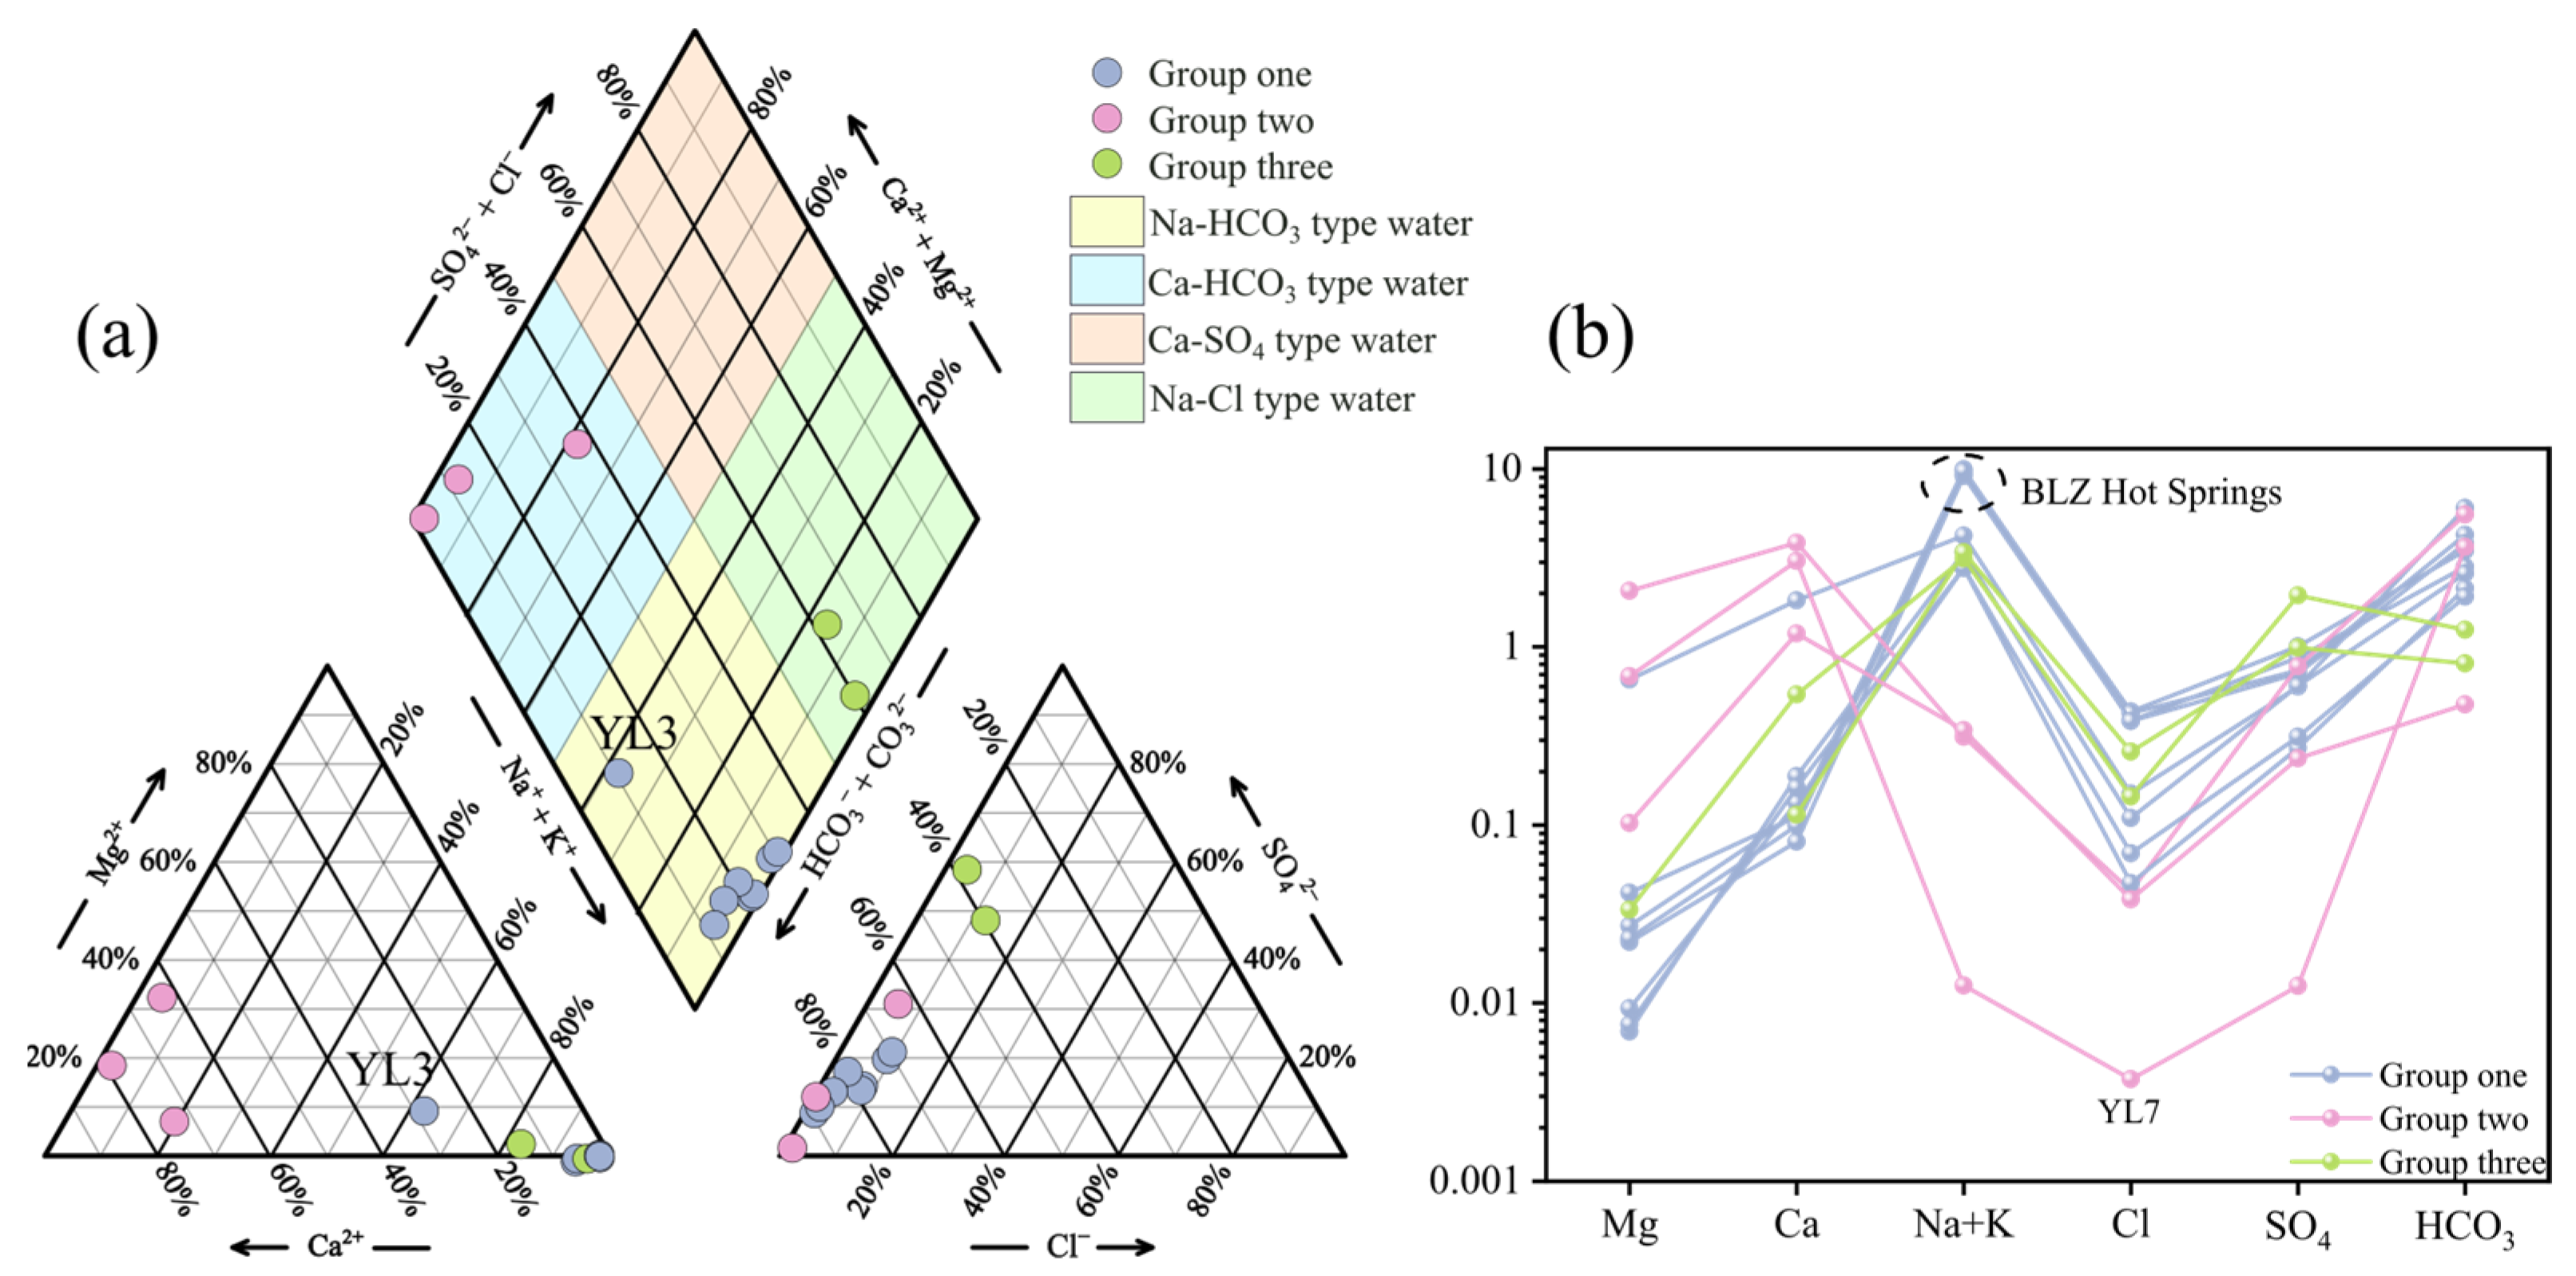
3.1. Physical and Chemical Properties of Hot Springs

Eleven geothermal springs in Longling exhibited temperatures (47.1–88.2 °C) significantly exceeding the local annual average (14.9 °C; Table 1). Notably, the BLZ springs (77.7–88.2 °C) represented the highest-temperature cluster, while springs along the Xiangbaihe River (YL3–YL6) displayed narrower thermal ranges (47.1–56.7 °C; average 52.9 °C). All geothermal springs exhibited neutral to alkaline pH (7.0–9.4) with elevated pH values observed in BLZ (YL1: 9.0; YL2: 8.7) and YL6 (8.7). TDS ranged from 161 to 552 mg/L (freshwater), whereas cold springs and rainwater exhibited lower TDS (89–183 mg/L) and similar pH ranges (7.5–9.8).
The major cation in BLZ Hot Springs (YL1; YL2), YL3, YL4, YL6, YR2 and YR3 was Na (63.0–216.0 mg/L), accounting for 60–95% of the total cations (Table 1). Conversely, Ca dominated in YL5, YL7, and YLYS (23.0–76.0 mg/L; 62–81% of cations). Anions were primarily HCO3, CO3, and SO4. Except for YR2 and YR3, which exhibited elevated SO4, the remaining 11 samples were enriched in HCO3 and CO3.
Hydrochemical types were categorized as follows by main ions (Table 1): ① Group one: Na-HCO3 type (YL1, YL2, YL3, YLY4, YL6); ② Group two: Ca-HCO3 type (YL5, YL7, YLYS); ③ Group three: Na-SO4·HCO3 type (YR2, YR3). Piper diagram analysis (Figure 2a) corroborated this classification, with samples clustering in Na-HCO3, Ca-HCO3, and Na-Cl domains. Hot springs YL1–YL6 are spatially aligned with the Xiangbaihe Fault, sharing consistent hydrochemical signatures except YL5. YL3 also contains a significant amount of Ca in Group one. Schoeller diagram analysis (Figure 2b) further validated three distinct groups. The Longling study area is characterized by the spatial coexistence of high-temperature (BLZ), medium-low-temperature (remaining thermal springs), and cold springs (YL7), with no significant spatial or temporal variations in pH or TDS. Based on hydrochemical classifications, the thermal springs were categorized into three distinct groups from north to south. Group one: BLZ exhibited the highest Na and Cl concentrations, contrasting sharply with cold spring YL7, which displayed minimal ion content. The remaining hot springs did not show significant divergence in major element concentrations along the east–west Xiangbaihe Fault. Group two: the ionic distribution of YL5 mirrored that of rainwater, indicating a significant atmospheric influence. Notably, despite shared granitic host lithology, Group three (YR2, YR3) was distinguished by elevated SO4 and reduced HCO3 levels, reflecting fault-dominated hydrogeochemical controls.

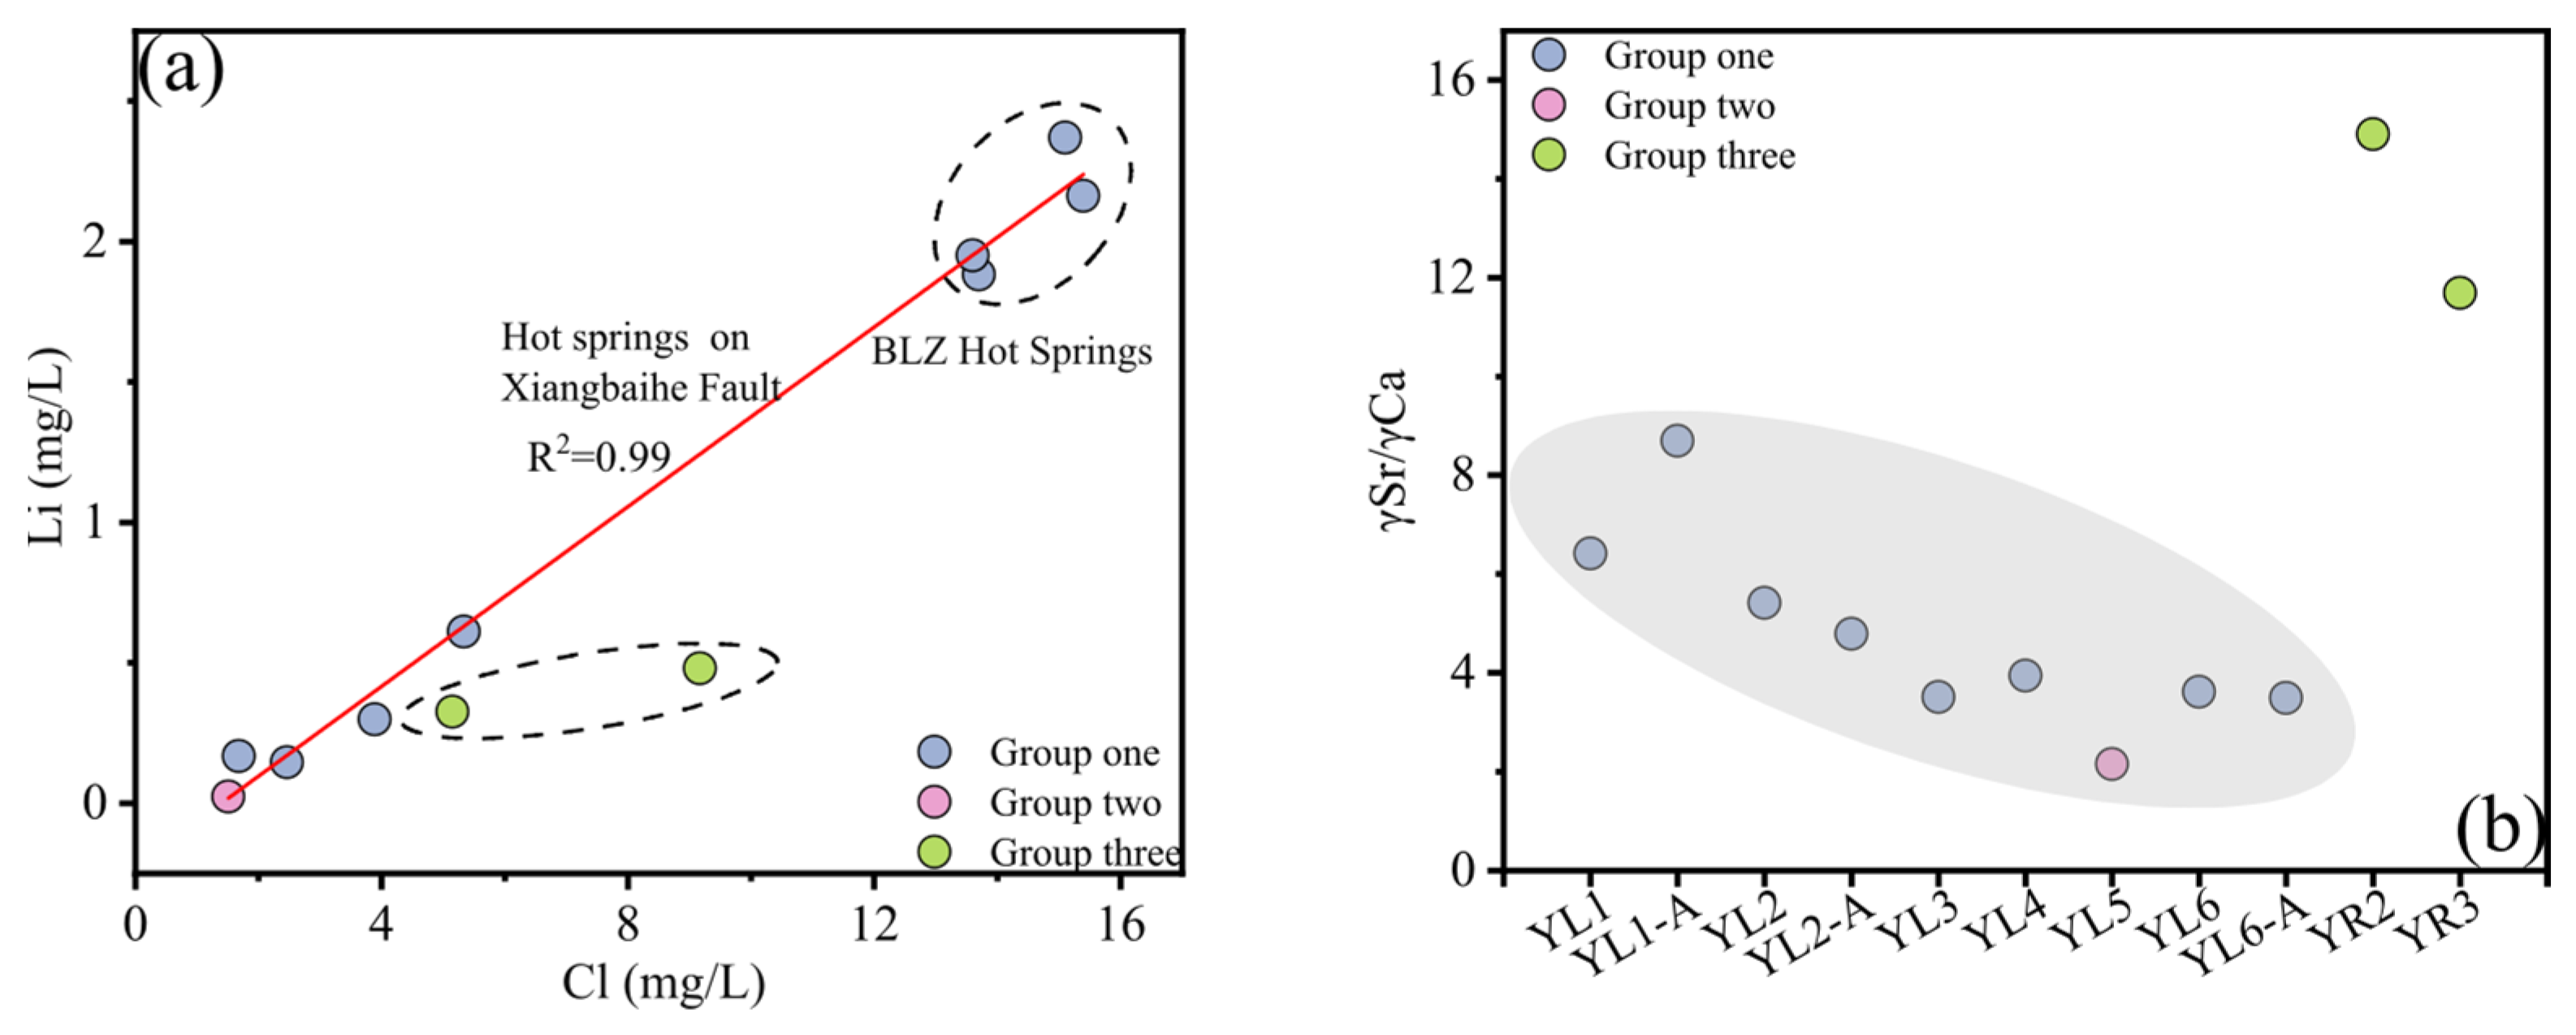
3.2. Trace Element Characteristics of Spring Water

Consistent Cl and Li enrichment patterns were observed across Longling thermal springs, with maximal concentrations recorded in high-temperature springs YL1 and YL2 (averaging 14.5 mg/L and 2091.0 μg/L, respectively). Conversely, YL5 exhibited anomalously low Cl (1.5 mg/L) and Li (22.7 μg/L). Intermediate concentrations (Cl: 1.7–9.2 mg/L; Li: 146.0–611.0 μg/L) were observed in the remaining five hot springs. Strontium (Sr) concentrations were elevated in YL3, YL5, and YR2 (281.0–363.0 μg/L), whereas other springs and ambient waters (cold springs, rainwater) all ranged from 20.9 to 58.7 μg/L.
Conservative elements (Cl and Li), which remain immobile during steam separation and secondary mineral interactions [36,37], were analyzed to assess fluid provenance. The presence of biotite in Proterozoic metamorphic rock and granite (Figure 1c) contributes to elevated Li concentrations in thermal springs, which exhibit a strong positive correlation with Cl in Group one (Figure 3a). Conversely, YR2 and YR3 deviate significantly from this trend. It is inferred that Li in thermal springs along the Xiangbaihe Fault remains conserved during geothermal fluid ascent from deep reservoirs, unaffected by secondary mineral alteration (e.g., chlorite, quartz) [37,38]. These findings further suggest that springs along the Xiangbaihe Fault share a common geothermal fluid source or reservoir, distinct from YR2 and YR3.
The γSr/γCa ratio, a proxy for water–rock interaction intensity [39], increases westward along the Xiangbaihe Fault (Figure 3b), reflecting enhanced interaction and slower groundwater circulation. Springs YR2 and YR3 exhibit the highest ratios, indicative of prolonged fluid–rock contact.

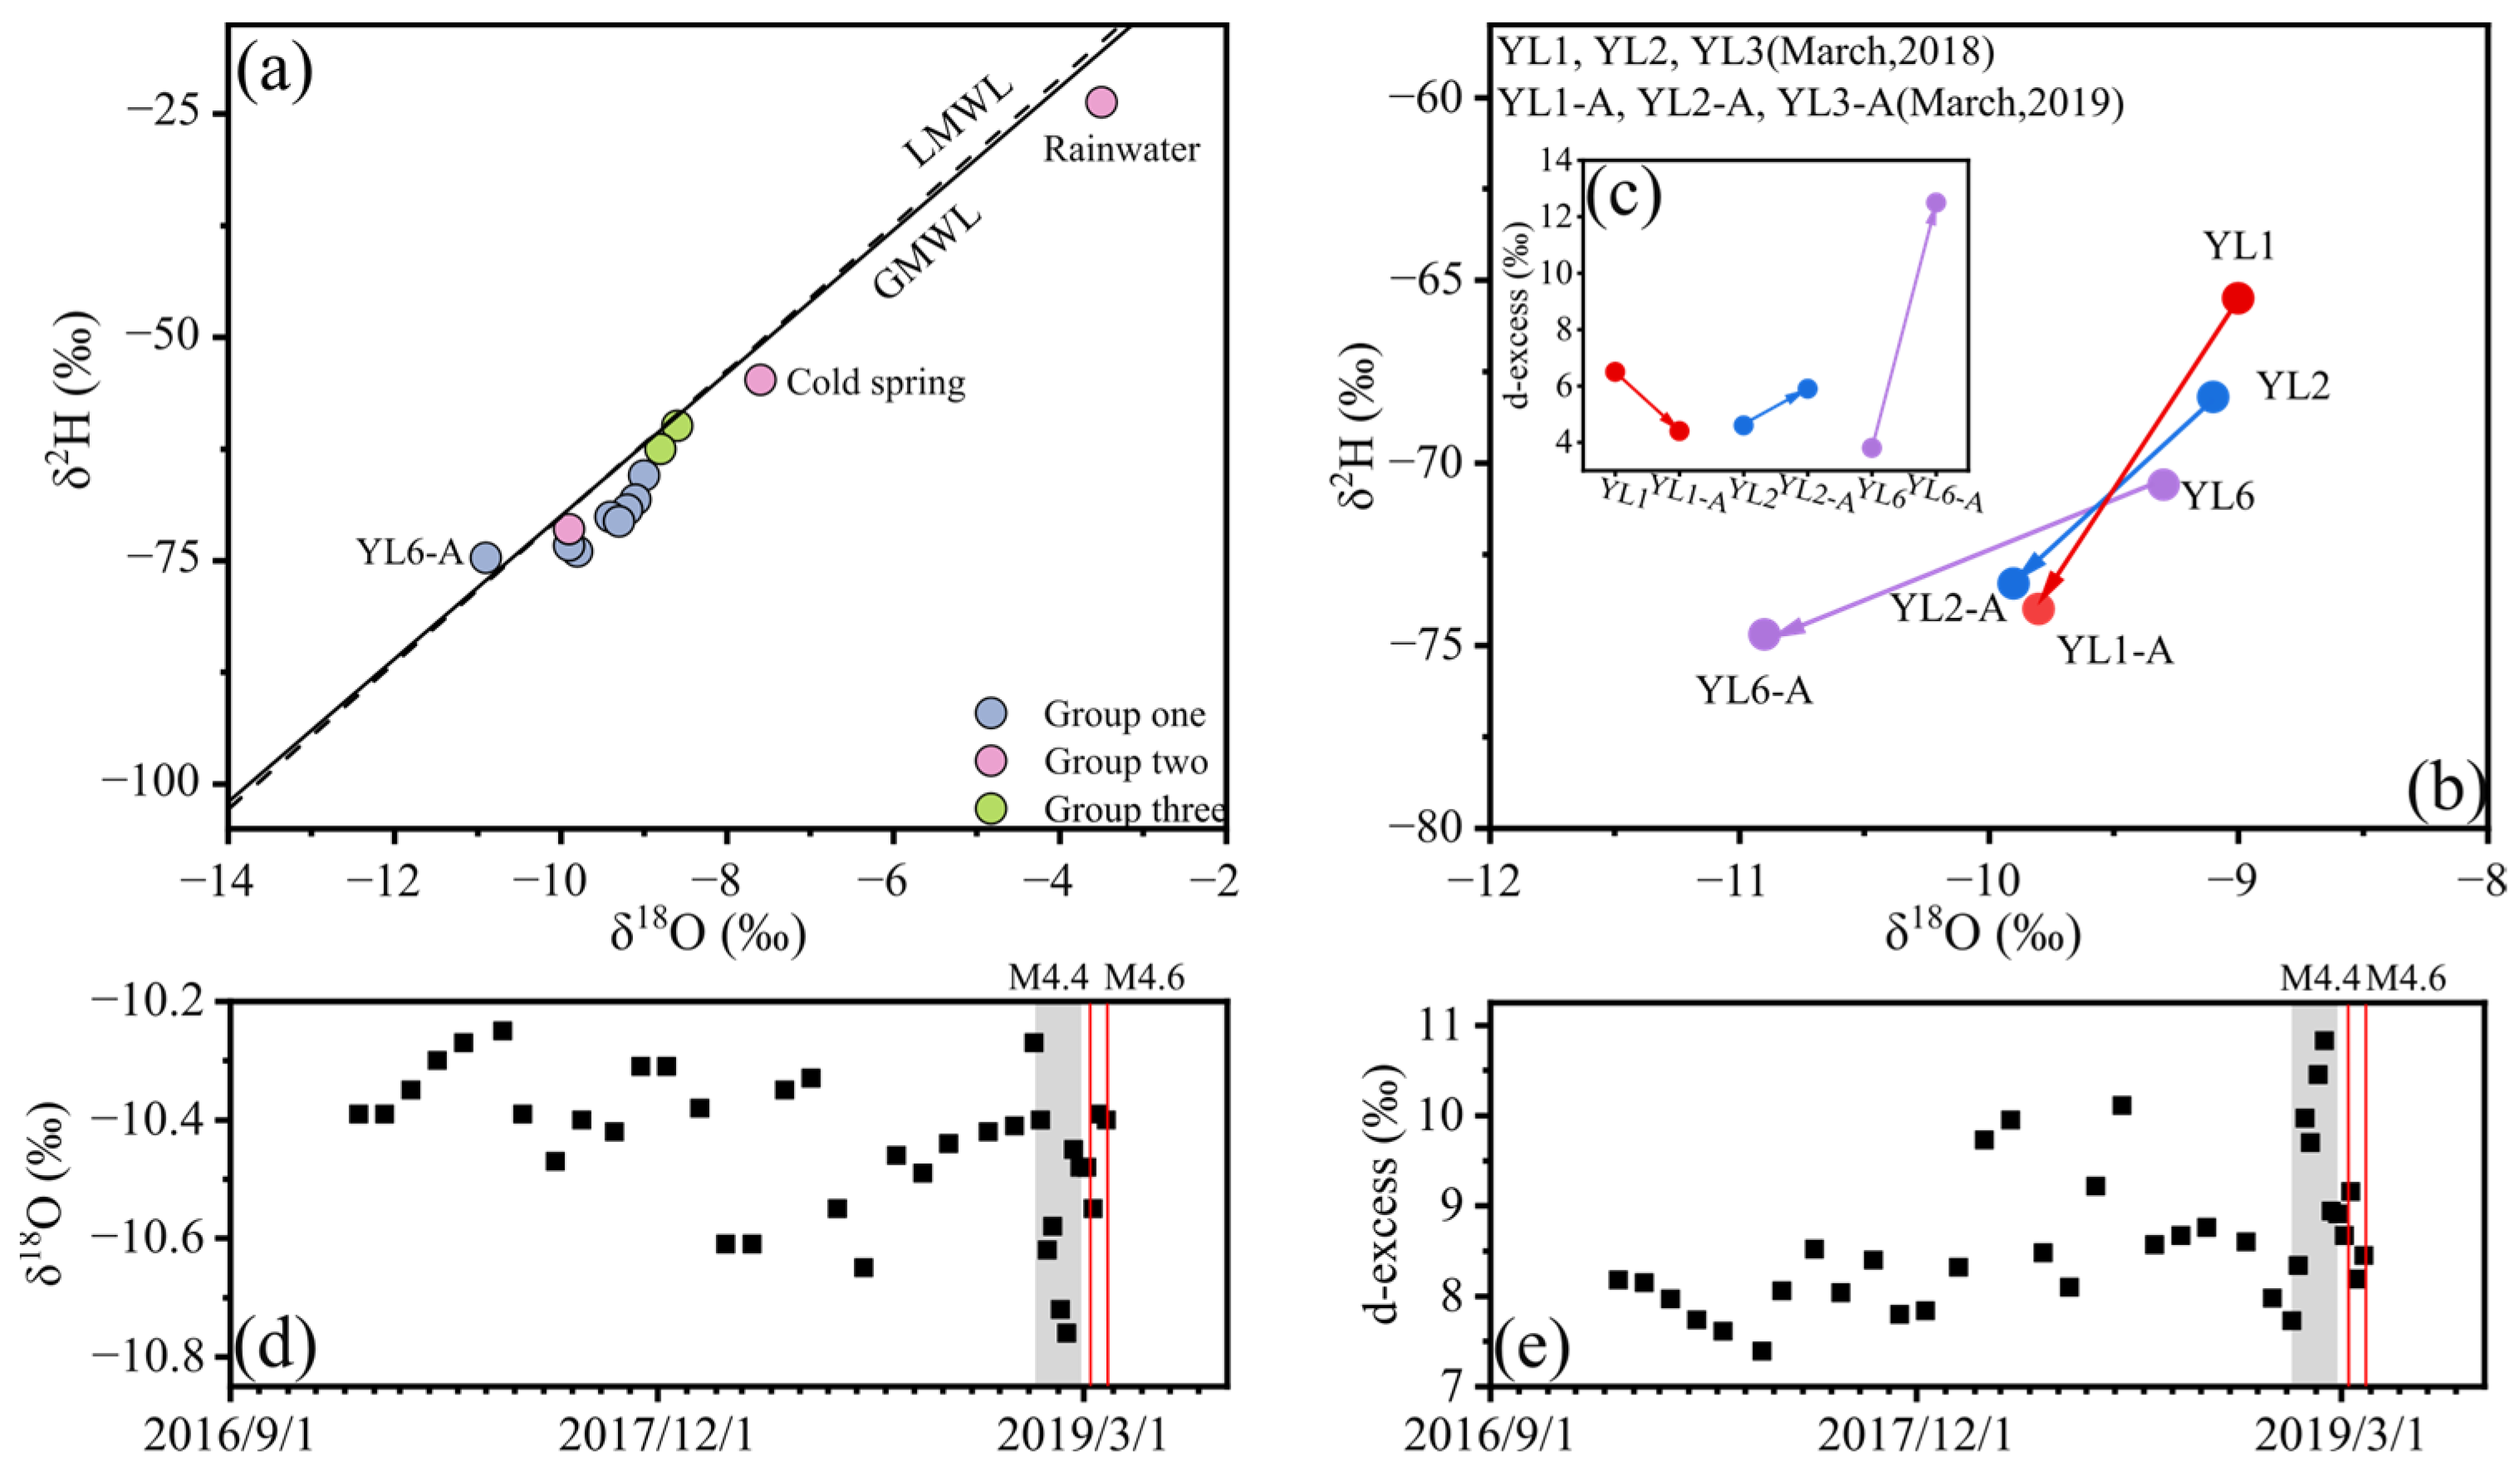
3.3. Stable Hydrogen and Oxygen Isotopes

Stable isotopic compositions of geothermal waters ranged from δ2H = −74.7‰ to −59.9‰ (mean −69.1‰) and δ18O = −10.9‰ to −8.6‰ (mean −9.4‰). Conversely, cold springs and rainwater exhibited lighter isotopic signatures: δ2H = −54.8‰ to −23.7‰ and δ18O = −7.6‰ to −3.5‰. The d-excess of the hot springs calculated by Equation (1) ranged from 3.8‰ to 12.5‰.

4. Discussion

4.1. Origin of Hot Springs

All water samples were plotted near the GMWL and LMWL [40], confirming their meteoric origins (Figure 4a). The minimal δ18O drift suggests limited water–rock interaction, likely attributable to rapid groundwater circulation and short residence times.
Skelton et al. [41] postulated that temporal variations in d-excess observed in groundwater prior to seismic events reflect the mixing or switching of groundwater sources driven by distinct water–rock interactions. In BLZ (YL1, YL2, YL6), significant interannual variability was documented in δ2H and δ18O, with a pronounced decline (Figure 4b), while d-excess exhibited a gradual increase in 2019 (Figure 4c). Notably, these isotopic shifts align with observations by Zhang et al. [10] in BLZ#1 springs, where stable isotope ratios fluctuated markedly within three months preceding earthquakes proximal to the study area (106–141 km epicentral distances; Figure 4d,e). This phenomenon is attributed to reduced aquifer permeability induced by pre-seismic stress–strain accumulation, which diminishes deep hydrothermal recharge and enhances atmospheric groundwater mixing. These findings demonstrate that continuous monitoring of stable hydrogen and oxygen isotopes not only elucidates groundwater recharge mechanisms but also provides precursory signals of regional stress–strain evolution, offering critical insights for earthquake precursor analysis.
Rainwater (YLYS) served as the reference, with a δ2H value of −23.70‰, a δ18O value of −3.50‰, and an elevation of 1240 m. Recharge elevations for Longling geothermal springs were derived by integrating the δ18O altitude gradient (−0.26‰/100 m) [42] and δ2H gradient (−2.50‰/100 m) [26] into Equation (2). The average with Equations (2) and (3) is used as the recharge elevation in Longling (geothermal springs: 2465–3286 m; YL7: 2951 m). These calculations identify Gaoligong Mountain as the primary recharge area (Figure 1b).

4.2. Water–Rock Interactions

4.2.1. Water–Rock Interaction Indicators

Mineral weathering and dissolution represent critical mechanisms in water–rock interaction, governing the hydrochemical evolution of groundwater. All geothermal waters in Longling exhibit γNa/γCl ratios > 1 (6–57; Table 1), indicative of substantial host rock dissolution [43,44]. Granite prevalence in the region facilitates H2SiO3 enrichment in thermal springs [45], with concentrations positively correlated to temperature (Figure 5a). Notably, elevated H2SiO3 levels in BLZ springs are attributed to high-temperature magma chamber influences. Silicate mineral interactions with groundwater and CO2 under moderate-high thermal conditions are posited to generate Na and HCO3, forming Na-HCO3 type waters:
N a 2 A l 2 S i 3 O 8 2 + 3 H 2 O + 2 C O 2 2 N a + + 2 H C O 3 + A l 2 S i 2 O 5 O H 4 + 4 S i O 2
This reaction produces OH, contributing to the alkaline nature of Longling Springs. A strong linear correlation between H2SiO3 and Na (slope = 1.709, R2 = 0.935; Figure 5b) suggests additional Na sources, as Reaction (11) predicts a 1:2 Na: SiO2 ratio.
Ionic correlations (Table 2) reveal a robust Ca-Mg association (r = 0.986, p < 0.01), implying a shared origin. HCO3 exhibits moderate correlations with Ca (r = 0.661, p < 0.05) and Mg (r = 0.651, p < 0.05), consistent with carbonate weathering. However, Ca and Mg concentrations are significantly lower than HCO3 (Figure 5c), indicating supplementary HCO3 sources (e.g., feldspar dissolution via Reaction (11)). Cl demonstrates a high correlation with Na + K (r = 0.947, p < 0.01), yet its concentration is markedly lower, implying partial Na derivation from non-halite sources. All springs plot above the halite dissolution line (Figure 5d), suggesting Cl originates from halite/sylvite dissolution, while Na is supplemented by silicate weathering and chloro-alkaline exchange. Furthermore, cation exchange is shown to negligibly influence Na concentrations, while albite dissolution is at equilibrium.
Notably, YL5 aligns with dolomite and halite dissolution trends, indicating that Ca, Mg, Na, HCO3, and Cl derive from carbonate and evaporite dissolution. This implies limited deep circulation and the absence of high-temperature conditions, suppressing feldspar alteration.
The (SO4 + HCO3 − Ca − Mg)/(Na + K − Cl) ratios were employed to evaluate cation exchange activity. Samples plotting near the 1:1 line indicate active cation exchange with clay minerals [46], a process facilitated by clay-rich lithologies in the Longling fault system. Notably, BLZ Hot Springs deviate significantly from the 1:1 line (Figure 5e), suggesting negligible cation exchange influence. Conversely, YR3 exhibits slight deviation, while other springs cluster near the line, implying Na, K, Ca, and Mg participation in exchange reactions during circulation.
Schoeller [47] proposed the “Index of Base Exchange” (IBE) describing the ion exchange reactions occurring in groundwater. Equations (4) and (5) show that the chloro-alkaline indexes of all hot springs in Longling are negative (Table 3), consistent with an indirect base exchange, where Ca or Mg substitutes Na/K in aquifer materials [48]. YL5, with the highest CAI-I and near-zero CAI-II, demonstrates the slightest cation exchange reaction and elevated Ca concentrations relative to other springs.

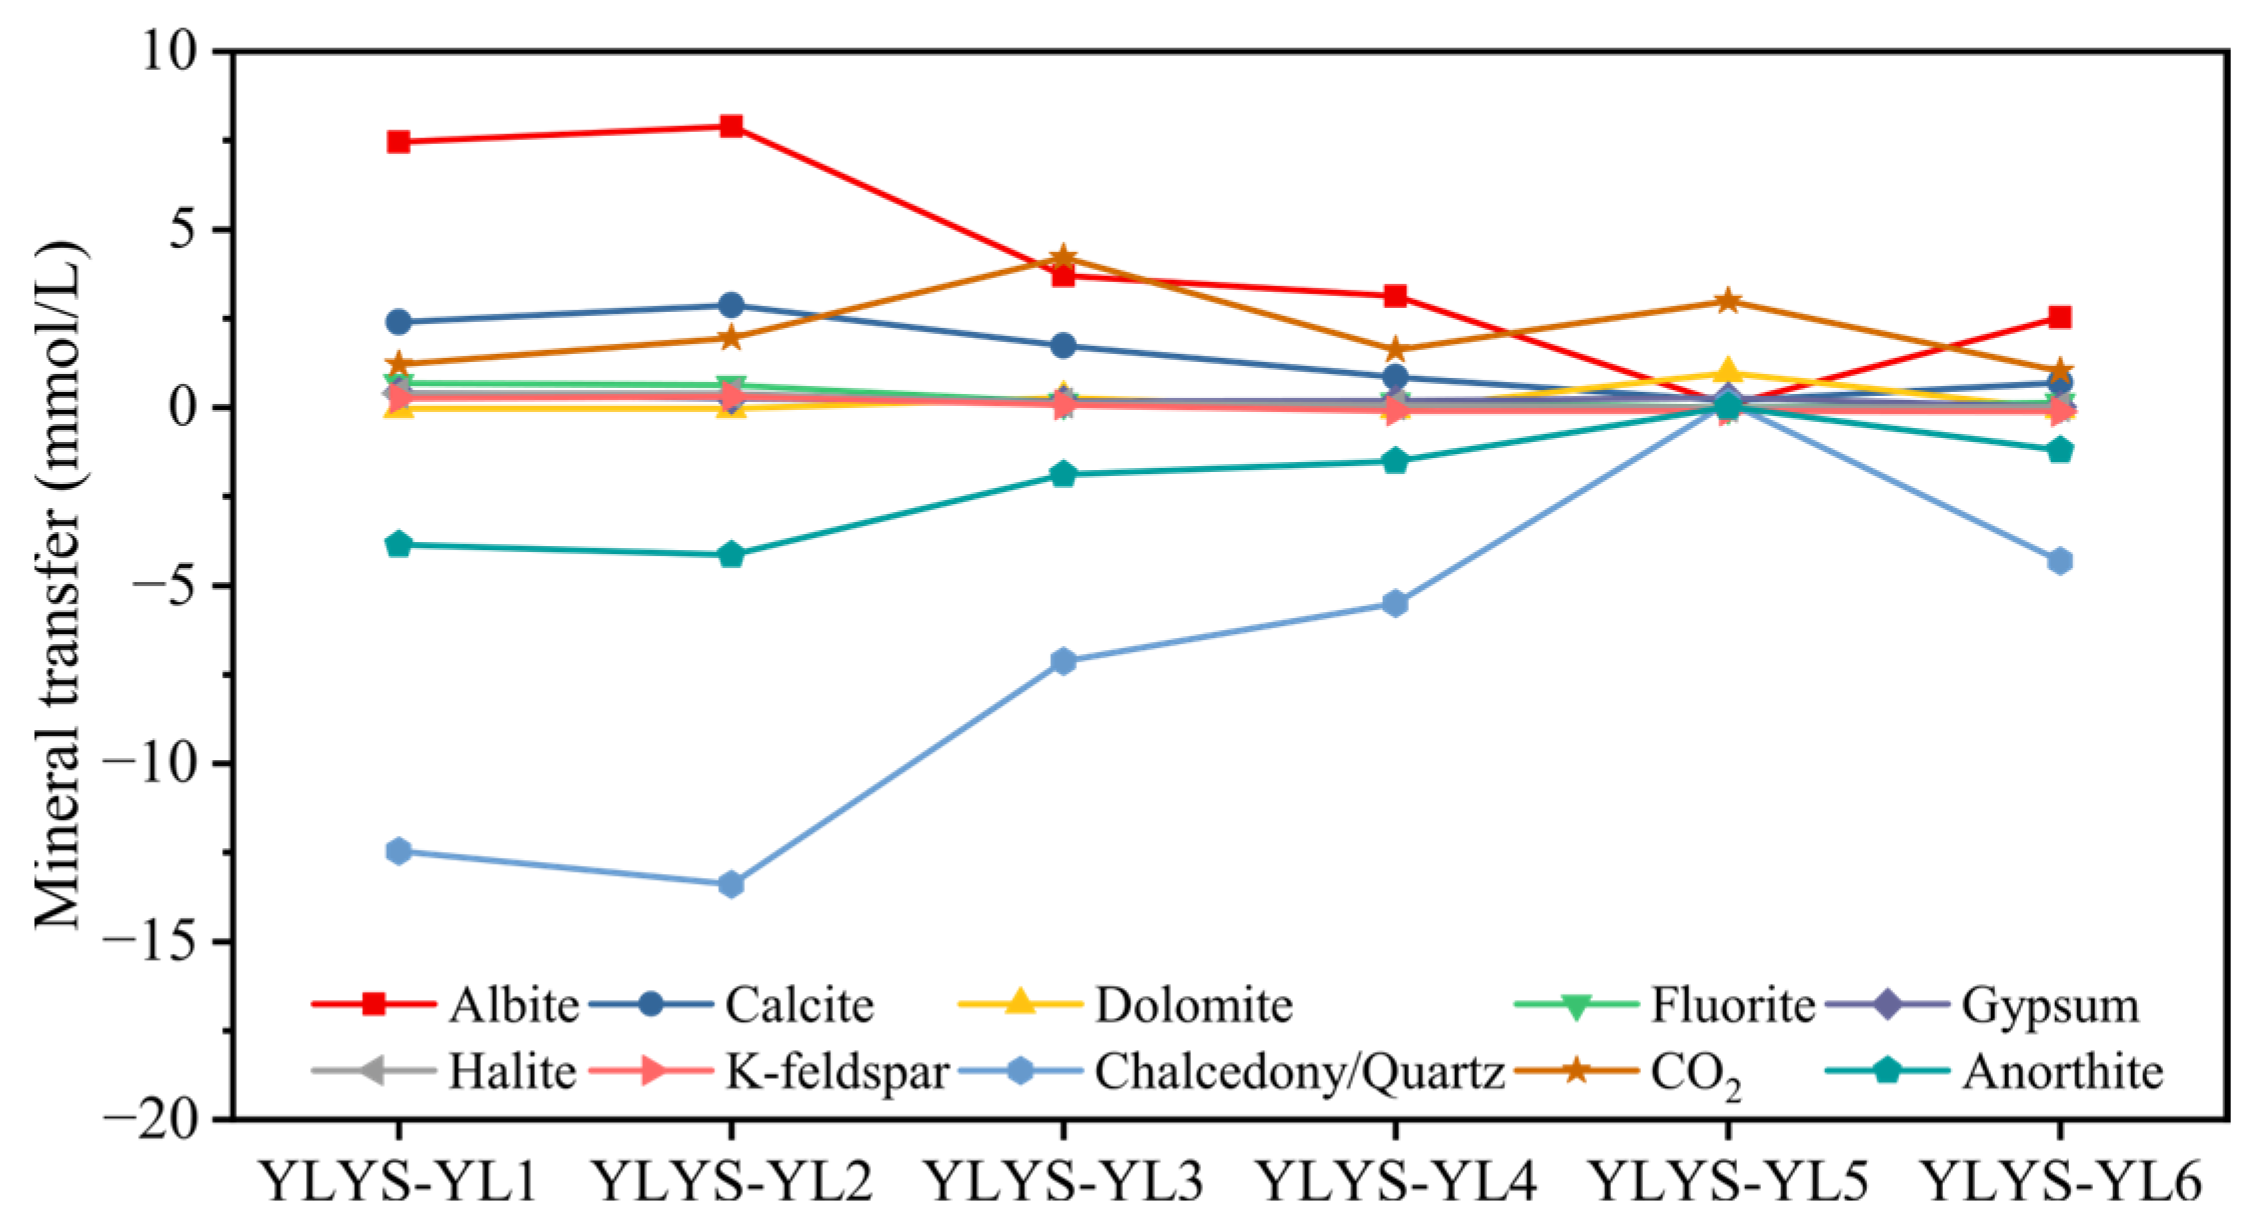
4.2.2. Inverse Hydrochemical Modeling and Mineral Equilibria

Rainwater (YLYS) served as the initial solution for PHREEQC-based inverse modeling of eight groundwater flow paths terminating at springs YL1–YL6, YR2, and YR3. The local lithology comprises metamorphic rocks, Caledonian granite, Triassic sandstone, and Yanshanian granite. Inverse hydrochemical modeling, incorporating mineral reactions (e.g., albite, calcite, quartz, chalcedony, dolomite, gypsum, fluorite, halite, CO2, and anorthite dissolution/precipitation; Table 4), revealed consistent reaction pathways across groundwater circulation systems (Figure 6). Cl is classified as a conservative element, with input water sample uncertainties constrained to 0.02–0.05. BLZ springs exhibited the highest mineral transfer rates, attributable to high-temperature conditions. All springs demonstrated albite, calcite, fluorite, gypsum, halite, and CO2 dissolution. Chalcedony/quartz and anorthite precipitation occurred in seven springs (excluding YL5), while K-feldspar precipitated in all but YL1–YL3. Dolomite precipitation was absent in YL3 and YL5, consistent with their elevated Ca concentrations. Na predominantly originated from albite dissolution and CO2 interaction, with minor contributions from halite dissolution. Mineral transfer intensity increased westward (Figure 6), aligning with inferred east-to-west groundwater flow and progressive water–rock interaction.
YLYS–YL5 displayed anomalous modeling results, likely due to its shallow circulation depth and absence of major NS-trending faults (Figure 1c and Figure 5) This aligns with limited feldspar dissolution, subdued cation exchange, and minimal water–rock interaction, suggesting short residence times for YL5. Collectively, mineral transfer dynamics are governed by reservoir temperature, fault-controlled permeability, and geothermal fluid circulation.

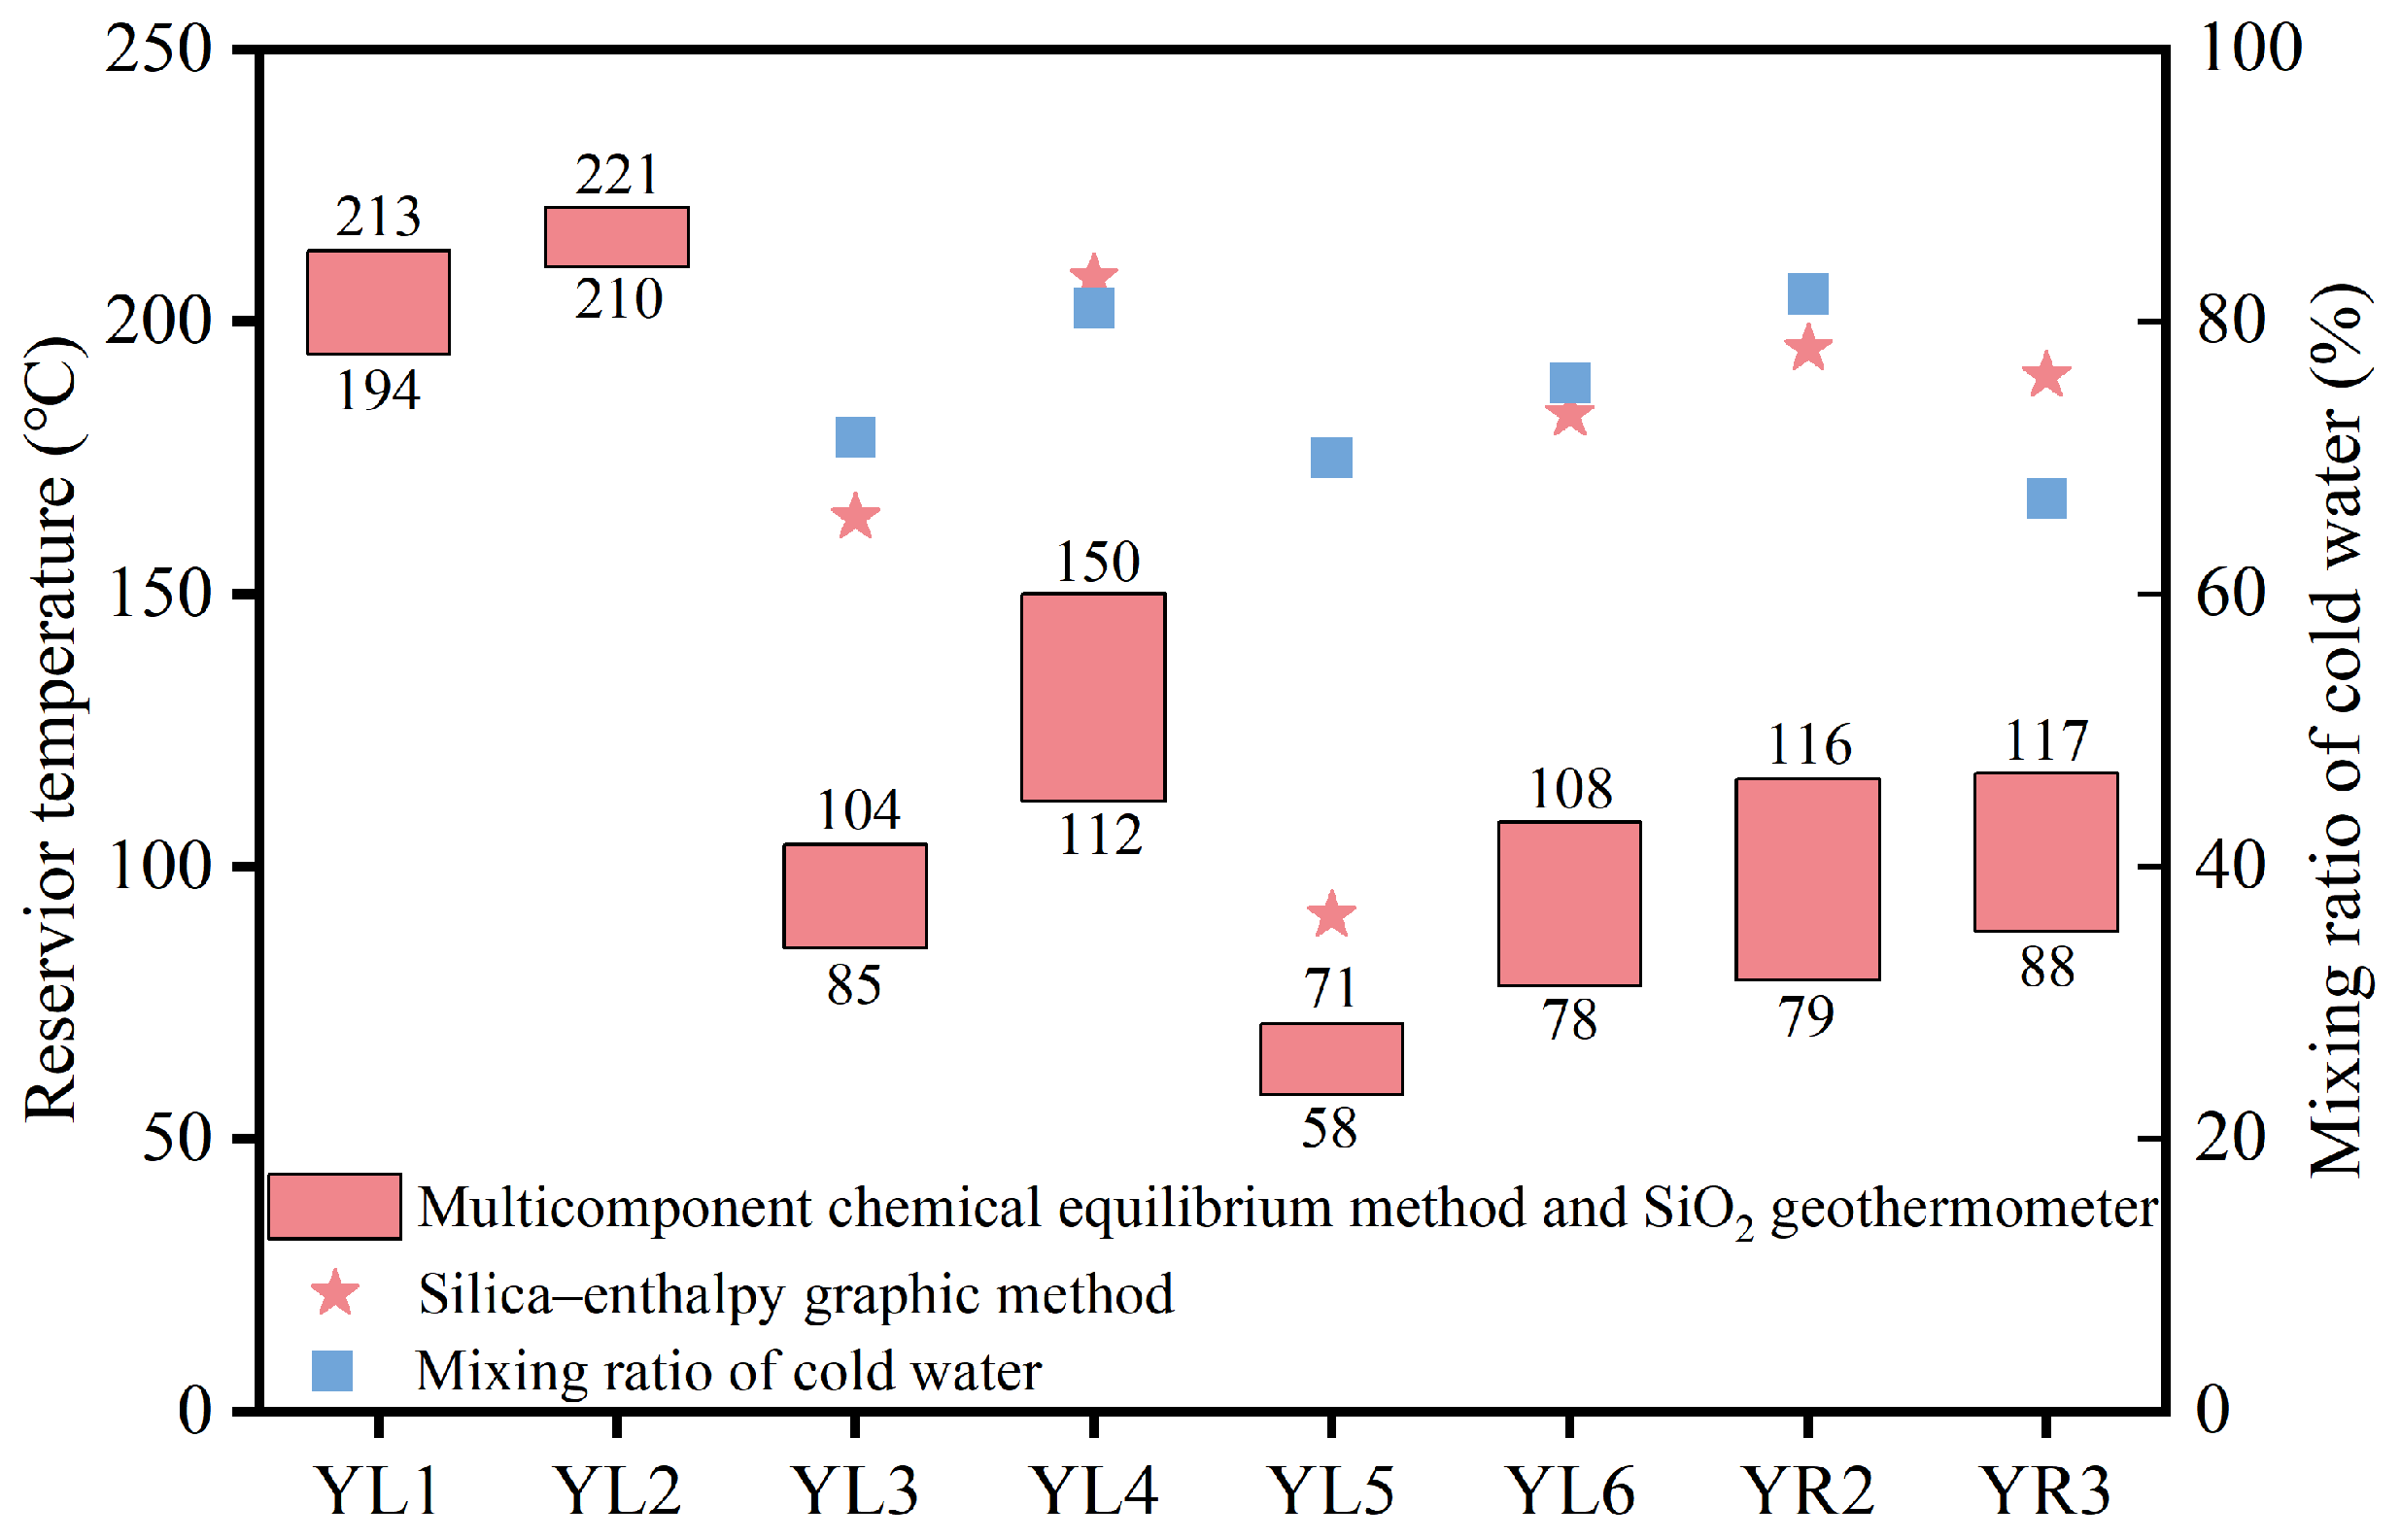
4.3. Reservoir Temperature

The following three methods were used to calculate the reservoir temperature and mixing ratio of cold water in Longling.

4.3.1. Multicomponent Chemical Equilibrium Method

Mineral selection for equilibrium modeling (SOLVEQ-XPT program, minteq.v4.dat) was guided by hydrochemistry, aquifer lithology, and hydrothermal alteration products [32,49]. High-temperature and moderate-alkalinity BLZ springs utilized albite for FixAl to enforce equilibrium, while medium-temperature springs (YL3, YL4, YL6, YR2, YR3) employed kaolinite. YL5, characterized by elevated Ca and Mg, incorporated dolomite for FixMg (Figure 7).
Degassing corrections using 0.01 and 0.03 mol/L H⁺ and HCO3 yielded mineral equilibrium temperatures of 194–213 °C (YL1) and 210–221 °C (YL2), demonstrating alkalinity (pH > 8.3) in deep geothermal fluids following CO2 exsolution. Conversely, a 0.005 mol/L correction for YL4 resulted in equilibrium at 133–150 °C. Notably, YL3, YL5, YL6, YR2, and YR3 achieved kaolinite equilibrium without CO2 correction (Figure 7), confirming that field-measured pH values reflect deep-system conditions. Reservoir temperatures for these springs were determined as follows: 85–104 °C (YL3), 58–71 °C (YL5), 78–108 °C (YL6), 79–116 °C (YR2), and 88–117 °C (YR3).

4.3.2. SiO2 Geothermometer

Reservoir temperatures were calculated using Equations (6) and (7). It is proposed by Liu [15] that SiO2 concentrations in geothermal fluids are governed by quartz above 180 °C, chalcedony below 110 °C, and both minerals in the 110–180 °C range. Notably, Wang et al. [21] reported chalcedony-derived reservoir temperatures lower than measured spring temperatures at BLZ, consistent with findings by Guo et al. [19] and Liu [15], which identify quartz as the dominant SiO2 control in BLZ springs. Quartz geothermometer yielded reservoir temperatures of 194–208 °C (YL1) and 176–192 °C (YL2). For YL4, the multicomponent chemical equilibrium method estimation method (Figure 7) revealed that chalcedony exhibited a small deviation, validating quartz as the primary control and reaching quartz equilibrium at 112 °C. The quartz and chalcedony equilibrium curves of YL3, YL5, YL6, and YR2 are all located at the equilibrium center (Figure 7), indicating quartz and chalcedony jointly control SiO2 in the geothermal fluid. Mean reservoir temperatures (derived from Equations (6) and (7)) were calculated as 86 °C (YL3), 54 °C (YL5), 98 °C (YL6), and 89 °C (YR2). YR3, with chalcedony-centered equilibrium and quartz deviation (Figure 7), yielded a temperature of 94 °C via chalcedony geothermometer. These results align closely with multicomponent equilibrium method estimates, and the equilibrium of silicate minerals curves (quartz and chalcedony) also supports the feasibility of the SiO2 geothermometer (Figure 7).

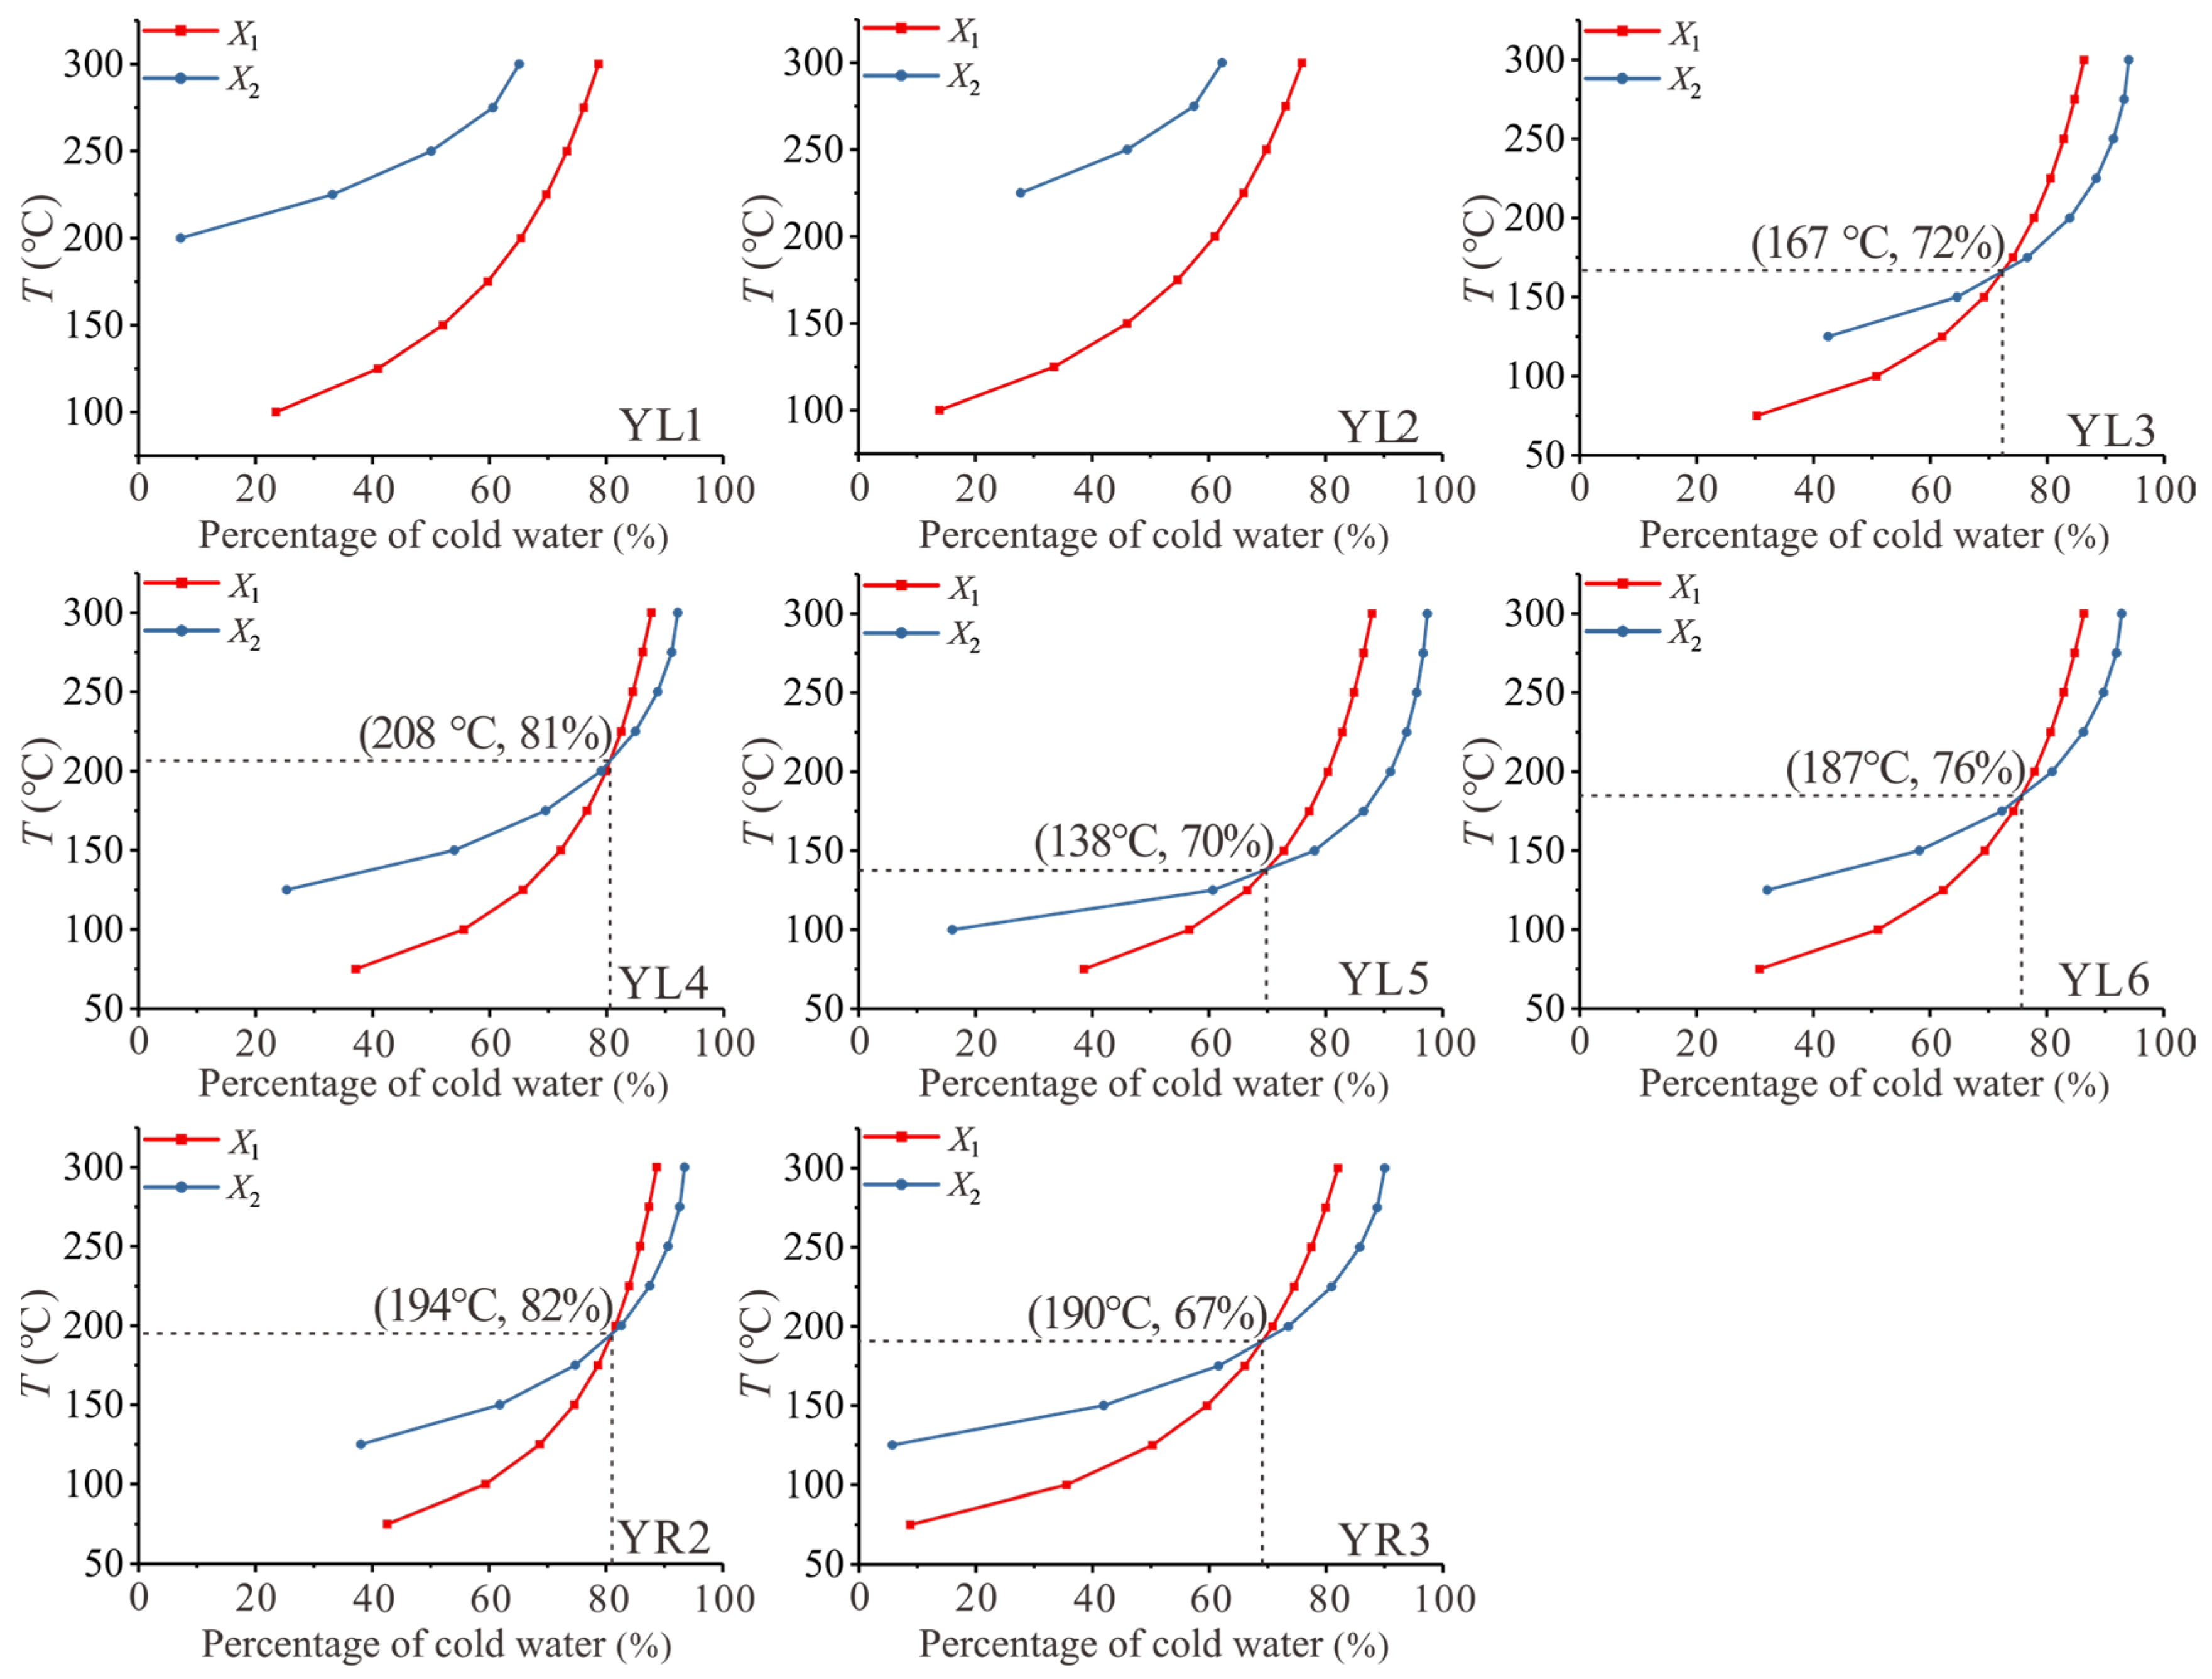
4.3.3. Silica–Enthalpy Mixing Equation Method

Reservoir temperatures and cold-water mixing ratios were determined using silica–enthalpy mixing models (Figure 8) [34,50]. However, this method was deemed unsuitable for high-temperature BLZ springs (YL1, YL2), where SiO2 concentrations (240–296 mg/L) exceed the 90 mg/L applicability threshold [31], resulting in non-intersecting enthalpy curves. Nevertheless, cold water mixing cannot be excluded in the BLZ hydrothermal system. Similar to other Longling thermal springs, permeable pathways along the Longchuanjiang Fault (F8) facilitate cold water mixing. For other springs, cold-water mixing ratios were estimated as 72% (YL3), 81% (YL4), 70% (YL5), 76% (YL6), 82% (YR2), and 67% (YR3), with corresponding reservoir temperatures of 167 °C, 208 °C, 138 °C, 187 °C, 194 °C, and 190 °C from Equations (8) and (9). These values exceed those derived from the multicomponent equilibrium method and SiO2 geothermometer, likely due to the model’s assumption of quartz-dominated SiO2 solubility [51]. Given the prevalence of mixed quartz–chalcedony control in Longling geothermal systems, silica–enthalpy results may overestimate actual reservoir temperatures.
Generally speaking, reservoir temperatures for YL1–YL6, YR2, and YR3 in Longling were determined as 194–213 °C, 210–221 °C, 85–104 °C, 112–150 °C, 58–71 °C, 78–108 °C, 79–116 °C, and 88–117 °C, respectively, based on multicomponent equilibrium method and SiO2 geothermometer (Figure 9).

4.4. Genesis Mode of the Hot Springs

The geothermal system comprises four key components: a heat source, reservoir, caprock, and fluid circulation [52]. A magma chamber beneath the BLZ thermal spring area serves as the primary heat source [15]. Notably, thermal springs along the Xiangbaihe Fault do not belong to a unified geothermal system, as evidenced by variations in reservoir temperatures (Figure 9), caprock structures (Figure 1), and heat sources. However, the fault acts as a conduit connecting surface exposures to deep reservoirs, enabling fluid circulation and heat transfer [52].
Six springs (YL1–YL6) along the Xiangbaihe Fault are recharged by meteoric water infiltrating through Gaoligong Mountain, which migrates along permeable faults, undergoes deep-circulation heating, and ascends via hydraulically conductive fractures (Figure 10). Circulation depths calculated using Equation (10) range from 763 to 3680 m across the studied springs (Table 1). These systems are classified as fault-controlled, deep-circulation geothermal reservoirs. Variations in fault permeability, water–rock interaction intensity, cold-water mixing ratios, reservoir temperatures, pH, and elemental composition distinguish individual springs. Critically, water–rock interaction escalates westward along the fault. BLZ springs, characterized by deeper circulation and enhanced heat supply from magma, represent a high-temperature system. Conversely, YL3, YL4, YL5, and YL6, influenced by deep circulation, constitute medium-low-temperature systems. YL5, lacking major fault pathways, exhibits the shallowest circulation depth and minimal thermal input.

5. Conclusions

The hydrochemical composition of Longling thermal springs is primarily governed by aluminosilicate mineral weathering and dissolution, with secondary contributions from dolomite and halite. Meanwhile, limited cation exchange influence is observed during groundwater circulation. Notably, the Xiangbaihe Fault facilitates hydraulic connectivity among thermal springs. The coexistence of medium-low- and high-temperature thermal springs on the Xiangbaihe Fault is attributed to a magma chamber beneath BLZ, establishing distinct yet interconnected geothermal systems. Overall, all springs exhibit a meteoric recharge–deep fracture circulation–exposure along fractures genetic model. Despite shared meteoric origins, aquifer lithology, and deep-circulation processes—resulting in predominant Na-HCO3 hydrochemical types—variations in fault permeability, water–rock interaction (e.g., cation exchange, mineral dissolution), reservoir temperatures (194–221 °C for BLZ vs. 58–150 °C elsewhere), and cold-water mixing ratios (67–82%) drive elemental heterogeneity.
Critically, water–rock interaction escalates westward along the fault, reflecting progressive fluid evolution within a thermally stratified system. Methodologically, reservoir temperature estimation requires tailored approaches based on mineral equilibrium status and SiO2-controlling phases. A unified protocol is inadequate for Longling’s heterogeneous systems, necessitating case-specific validation of silicate mineral equilibria.
This investigation is primarily focused on hydrogeochemical circulation models, while the geometric characteristics and permeability of moderate-small-scale fault systems controls on geothermal systems remain unaddressed. To advance the understanding of fault-regulated hydrothermal systems, subsequent research should integrate hydrochemical signatures—particularly rare earth element patterns—with fault tectonic architectures. Such multidisciplinary synthesis is posited to refine predictive models of geothermal fluid circulation in moderate-small-scale fault systems.

Author Contributions

Conceptualization, L.Z. and X.Z.; data curation, L.Z., Y.W. (Yanqiu Wu), G.T., Y.W. (Yixuan Wang) and J.M.; formal analysis, L.Z.; funding acquisition, X.Z., C.Z. and R.C.; investigation, L.Z., Y.W. (Yanqiu Wu), G.T., Y.W. (Yixuan Wang) and J.M.; methodology, L.Z. and X.Z.; project administration, X.Z.; resources, L.Z. and C.Z.; software, L.Z.; validation, L.Z.; visualization, L.Z.; writing—original draft, L.Z.; writing—review and editing, L.Z. All authors have read and agreed to the published version of the manuscript.

Funding

This work was supported by China Geological Survey Project (DD20251205) and the National Natural Science Foundation of China (42172269).

Data Availability Statement

The data used to support the findings of this study are included within the article.

Conflicts of Interest

The authors declare that they have no competing interests which affect the work reported in this paper.

References

  1. Wu, Y.; Zhou, X. Structural control effects on hot springs’ hydrochemistry in the northern Red River Fault Zone: Implications for geothermal systems in fault zones. J. Hydrol. 2023, 623, 129836. [Google Scholar] [CrossRef]
  2. Jaworowski, C.; Lynne, B.Y.; Heasler, H.; Foley, D.; Smith, I.J.; Smith, G.J. Detecting natural fractures with ground penetrating radar and airborne night-thermal infrared imagery around Old Faithful Geyser, Yellowstone National Park, USA. Geothermics 2020, 85, 101775. [Google Scholar] [CrossRef]
  3. Furukawa, T.; Ueda, A. Tamagawa hyper-acidic hot spring and phreatic eruptions at Mt. Akita-Yakeyama: Part 1. The isotopic and chemical characteristics of the hot spring water. J. Volcanol. Geotherm. Res. 2021, 412, 107179. [Google Scholar] [CrossRef]
  4. Guillou-Frottier, L.; Guillou-Frottier, L.; Duwiquet, H.; Duwiquet, H.; Duwiquet, H.; Launay, G.; Taillefer, A.; Roche, V.; Link, G. On the morphology and amplitude of 2D and 3D thermal anomalies induced by buoyancy-driven flow within and around fault zones. Solid Earth 2020, 11, 1571–1595. [Google Scholar] [CrossRef]
  5. Qi, J.; Li, X.; Xu, M.; Yi, L.; Zhang, Q.; Qin, L.; Li, K. Origin of saline springs in Yanjing, Tibet: Hydrochemical and isotopic characteristics. Appl. Geochem. 2018, 96, 164–176. [Google Scholar] [CrossRef]
  6. Benmarce, K.; Hadji, R.; Zahri, F.; Khanchoul, K.; Chouabi, A.; Zighmi, K.; Hamed, Y. Hydrochemical and geothermometry characterization for a geothermal system in semiarid dry climate: The case study of Hamma spring (Northeast Algeria). J. Afr. Earth Sci. 2021, 182, 104285. [Google Scholar] [CrossRef]
  7. White, D.E. Geothermal Energy Reservoirs. AAPG Bull. 1968, 52, 568. [Google Scholar] [CrossRef]
  8. Panza, E.; Sessa, E.; Agosta, F.; Giorgioni, M. Discrete Fracture Network modelling of a hydrocarbon-bearing, oblique-slip fault zone: Inferences on fault-controlled fluid storage and migration properties of carbonate fault damage zones. Mar. Pet. Geol. 2018, 89, 263–279. [Google Scholar] [CrossRef]
  9. Cappa, F.; Guglielmi, Y.; Nussbaum, C.; De Barros, L.; Birkholzer, J. Fluid migration in low-permeability faults driven by decoupling of fault slip and opening. Nat. Geosci. 2022, 15, 747–751. [Google Scholar] [CrossRef]
  10. Zhang, L.; Guo, L.; Wang, Y.; Liu, D.; Liu, Y.; Li, J. Continuous monitoring of hydrogen and oxygen stable isotopes in a hot spring: Significance for distant earthquakes. Appl. Geochem. 2020, 112, 104488. [Google Scholar] [CrossRef]
  11. Grand, R.V. Controls, Characterization and Small Scale Chemical Variations of a Karst System: A Geochemical Assessment of Tuscarora Creek Watershed, West Virginia. Master’s Thesis, West Virginia University, Morgantown, WV, USA, 2005. [Google Scholar]
  12. Meng, B.; Zhou, S.; Li, J.; Sun, Z. Mantle-Derived Helium Distribution and Tectonic Implications in the Sichuan-Yunnan Block, China. ACS Omega 2021, 6, 30674–30685. [Google Scholar] [CrossRef]
  13. Yang, B. Study on hydrochemical and isotopic characteristics of from Ruili Hot field. Coal Geol. China 1999, 11, 47–50. (In Chinese) [Google Scholar]
  14. Song, Y. The Characteristics and Origin of Longling Hot Spring in Yunnan. Master’s Thesis, Kunming University of Science and Technology, Kunming, China, 2021. [Google Scholar]
  15. Liu, Y. A Study of Hydrochemistry and Geyser of Thermal Groundwater in the Banglazhang Geothermal Field in Longling, Yunnan. Master’s Thesis, China University of Geosciences, Beijing, China, 2009. [Google Scholar]
  16. Zhou, C.; Wu, Z. The characteristics of geothermal field along the Dali-Ruili railway in western Yunnan Province and their implications for geo-engineering. Geol. Bull. China 2012, 31, 326–336. [Google Scholar]
  17. Bai, D.; Meju, M.A. Deep structure of the Longling-Ruili fault underneath Ruili basin near the eastern Himalayan syntaxis: Insights from magnetotelluric imaging. Tectonophysics 2003, 364, 135–146. [Google Scholar] [CrossRef]
  18. Guo, Q.; Liu, M.; Li, J.; Zhang, X.; Guo, W.; Wang, Y. Fluid geochemical constraints on the heat source and reservoir temperature of the Banglazhang hydrothermal system, Yunnan-Tibet Geothermal Province, China. J. Geochem. Explor. 2017, 172, 109–119. [Google Scholar] [CrossRef]
  19. Stefánsson, A.; Keller, N.S.; Robin, J.; Kaasalainen, H.; Björnsdóttir, S.; Pétursdóttir, S.; Jóhannesson, H.; Hreggvidsson, Ó.G. Quantifying mixing, boiling, degassing, oxidation and reactivity of thermal waters at Vonarskard, Iceland. J. Volcanol. Geotherm. Res. 2016, 309, 53–62. [Google Scholar] [CrossRef]
  20. Wang, M.; Zhang, H.; Liang, L.; Zhu, Z.; Zhang, A. Constraining the properties of the heat sources of high-temperature hydrogeothermal systems: Evidence from the lithium concentrations of geothermal waters. J. Hydrol. 2024, 640, 131696. [Google Scholar] [CrossRef]
  21. National Geological Archives. Available online: https://geocloud.cgs.gov.cn/geological/database?type=dzsjk&code=%E5%9F%BA%E7%A1%80%E5%9C%B0%E8%B4%A8 (accessed on 10 April 2023).
  22. Guo, T. Research on the Characteristics and Formation of the Rehai Geothermal Field in Tengchong. Ph.D. Thesis, Kunming University of Science and Technology, Kunming, China, 2012. [Google Scholar]
  23. Li, B.; Wang, G.; Liu, F.; Shi, Z.; Kong, Q.; Zhang, S.; Yan, X.; Liao, F.; Guo, L.; Liu, C. Hydrochemical characteristics and evolution of geothermal waters in western Yunnan, China based on self-organizing map and hydrogeochemical simulation. Appl. Geochem. 2025, 181, 106291. [Google Scholar] [CrossRef]
  24. Dansgaard, W. Stable isotopes in precipitation. Tellus 1964, 16, 436–468. [Google Scholar] [CrossRef]
  25. Clark, I.D.; Fritz, P. Environmental Isotopes in Hydrogeology; CRC Press: Boca Raton, FL, USA, 1997; pp. 102–147. [Google Scholar]
  26. Wang, J.; Xiong, L.; Pang, Z. Medium and Low Temperature Convection Type Geothermal System; Science Press: Beijing, China, 1993; pp. 23–56. [Google Scholar]
  27. Schoeller, H. Geochemistry of groundwaters. In Groundwater Studies: An International Guide for Research and Practice; The Unesco Press: Paris, France, 1977; pp. 89–100. [Google Scholar]
  28. Parkhurst, D.L.; Appelo, C.A.J. Inverse_modeling. In User’s Guide to PHREEQC (Version 2)—A Computer Program for Speciation, Reaction-Path, One-Dimensional Transport, and Inverse Geothermics Geochemical Calculations; U.S. Geological Survey: Denver, CO, USA, 1999; pp. 98–105. [Google Scholar]
  29. Rafighdoust, Y.; Eckstein, Y.; Harami, R.M.; Gharaie, M.H.M.; Mahboubi, A. Using inverse modeling and hierarchical cluster analysis for hydrochemical characterization of springs and Talkhab River in Tang-Bijar oilfield, Iran. Arab. J. Geosci. 2016, 9, 241. [Google Scholar] [CrossRef]
  30. Pang, Z.; Reed, M. Theoretical chemical thermometry on geothermal waters: Problems and methods. Geochim. Cosmochim. Acta 1998, 62, 1083–1091. [Google Scholar] [CrossRef]
  31. Huang, J.; Zhang, Y.; Deng, C.; Li, X.; Zhao, X.; Feng, T.; Wang, Y.; Wang, Y. Identifying the genesis of hydrothermal activities in the Xiangcheng fault belt, southwestern China: Evidence from hydrochemistry and stable isotopes. Ore Geol. Rev. 2024, 173, 106221. [Google Scholar] [CrossRef]
  32. Zhou, X.; Zhuo, L.; Wu, Y.; Tao, G.; Ma, J.; Jiang, Z.; Sui, L.; Wang, Y.; Wang, C.; Cui, J. Origin of some hot springs as conceptual geothermal models. J. Hydrol. 2023, 624, 129927. [Google Scholar] [CrossRef]
  33. Fournier, R.O. Chemical geothermometers and mixing models for geothermal systems. Geothermics 1977, 5, 41–50. [Google Scholar] [CrossRef]
  34. Truesdell, A.H.; Fournier, R.O. Geochemical indicators of subsurface temperature-Part 2, Estimation of temperature and fraction of hot water mixed with cold water. J. Res. U.S. Geol. Surv. 1974, 2, 263–270. [Google Scholar] [CrossRef]
  35. Li, X.; Sun, X.; Wang, Y. Distribution and origin of warmsprings in Shandong Peninsula. J. Ocean Univ. Qingdao 1997, 27, 389–396. [Google Scholar]
  36. Truesdell, A.H.; Nathenson, M.; Rye, R.O. The effects of subsurface boiling and dilution on the isotopic compositions of Yellowstone thermal waters. J. Geophys. Res. 1977, 82, 3694–3704. [Google Scholar] [CrossRef]
  37. Nicholson, K. Geothermal Fluids: Chemistry and Exploration Techniques; Springer: Berlin/Heidelberg, Germany, 1993; pp. 134–150. [Google Scholar]
  38. Li, J.; Sagoe, G.; Wang, X.; Yang, Z. Assessing the suitability of lithium-related geothermometers for estimating the temperature of felsic rock reservoirs. Geothermics 2021, 89, 101950. [Google Scholar] [CrossRef]
  39. Li, G.; Zhang, X.; Zhang, X.; Wu, H.; Sun, G.; Huang, Y. Stable hydrogen and oxygen isotopes characteristics of atmospheric precipitation from Tengchong, Yunnan. Resour. Environ. Yangtza Basin 2013, 22, 1458–1465. [Google Scholar]
  40. Craig, H. Isotopic variations in meteoric waters. Science 1961, 133, 1702–1703. [Google Scholar] [CrossRef] [PubMed]
  41. Skelton, A.; Liljedahl-Claesson, L.; Wästeby, N.; Andrén, M.; Stockmann, G.; Sturkell, E.; Mörth, C.-M.; Stefansson, A.; Tollefsen, E.; Siegmund, H.; et al. Hydrochemical Changes Before and After Earthquakes Based on Long-Term Measurements of Multiple Parameters at Two Sites in Northern Icelan—A Review. J. Geophys. Res. Solid Earth 2019, 124, 2702–2720. [Google Scholar] [CrossRef]
  42. Yu, J.; Zhang, H.; Yu, F.; Liu, D. Oxygen and hydrogen isotopic compositions of meteoric waters in the eastern part of Xizang. Geochemistry 1984, 3, 93–101. [Google Scholar] [CrossRef]
  43. Boschetti, T.; Venturelli, G.; Toscani, L.; Barbieri, M.; Mucchino, C. The Bagni di Lucca thermal waters (Tuscany, Italy): An example of Ca-SO4 waters with high Na/Cl and low Ca/SO4 ratios. J. Hydrol. 2005, 307, 270–293. [Google Scholar] [CrossRef]
  44. Sasaki, K.; Morita, J.; Iwaki, C.; Ueda, A. Geochemical evaluation of geothermal resources in Toyama Prefecture, Japan, based on the chemical and isotopic characteristics of hot spring waters. Geothermics 2021, 93, 102071. [Google Scholar] [CrossRef]
  45. Kenoyer, G.J.; Bowser, C.J. Groundwater chemical evolution in a sandy silicate aquifer in northern Wisconsin. I. Patterns and rates of change. Water Resour. Res. 1992, 28, 579–589. [Google Scholar] [CrossRef]
  46. Rajmohan, N.; Elango, L. Identification and evolution of hydrogeochemical processes in the groundwater environment in an area of the Palar and Cheyyar River Basins, Southern India. Environ. Geol. 2004, 46, 47–61. [Google Scholar] [CrossRef]
  47. Schoeller, H. Qualitative Evaluation of Groundwater Resources. In Methods and Techniques of Groundwater Investigations and Development; UNESCO: Paris, France, 1965; pp. 21–46. [Google Scholar]
  48. Chidambaram, S.; Anandhan, P.; Prasanna, M.V.; Srinivasamoorthy, K.; Vasanthavigar, M. Major ion chemistry and identification of hydrogeochemical processes controlling groundwater in and around Neyveli Lignite Mines, Tamil Nadu, South India. Arab. J. Geosci. 2013, 6, 3451–3467. [Google Scholar] [CrossRef]
  49. Hou, Z.; Duan, L.; Lu, Y.; Zheng, Y.; Zhu, D.; Yang, Z.; Yang, Z.; Wang, B.; Pei, Y.; Zhao, Z.; et al. Lithospheric Architecture of the Lhasa Terrane and Its Control on Ore Deposits in the Himalayan-Tibetan Orogen. Econ. Geol. 2015, 110, 1541–1575. [Google Scholar] [CrossRef]
  50. Gupta, H.K.; Roy, S. Geothermal Energy: An Alternative Resource for the 21st Century; Elsevier Science: Amsterdam, The Netherlands, 2006; pp. 73–77. [Google Scholar]
  51. Ferguson, G.; Grasby, S.E.; Hindle, S.R. What do aqueous geothermometers really tell us? Geofluids 2009, 9, 39–48. [Google Scholar] [CrossRef]
  52. Zhou, X.; Hu, F.; He, J.; Wang, X.; Fang, B. Introduction to Groundwater Science, 2nd ed.; Geological Publishing House: Beijing, China, 2014; pp. 187–196. [Google Scholar]
Figure 2. (a) Piper diagram of the water samples, (b) Schoeller diagram of the water samples near Longling.
Water 17 01481 g002
Figure 3. Plot of (a) relationship between Li and Cl, (b) γSr/γCa in Longling thermal springs.
Water 17 01481 g003
Figure 4. Plot of isotopic variability in BLZ thermal springs (2018, 2019): (a) δ2H and δ18O (LMWL: δ2H = 8.18 × δ18O + 11.72 [39]; GMWL: δ2H = 8 × δ18O + 10 [40]), (b) δ2H and δ18O trends and (c) Corresponding d-excess variations. Temporal variations in (d) δ18O and (e) d-excess at the BLZ#1 hot spring from 15 September 2016 to 15 March 2019 (The vertical red line indicates the time of the earthquake) [10].
Water 17 01481 g004
Figure 5. Plot of (a) relationship between H2SiO3 and temperature (T), (b) relationship between H2SiO3 and Na, (c) HCO3 vs. (Ca + Mg) g, (d) Cl vs. Na, (e) γ(SO4 + HCO3 − Ca − Mg) vs. γ(Na + K − Cl) in BLZ thermal springs.
Water 17 01481 g005
Figure 6. Diagram of mineral transfer in the hot springs along the Xiangbaihe Fault.
Water 17 01481 g006
Figure 7. Saturated index of minerals at different temperatures (T) in geothermal springs.
Water 17 01481 g007
Figure 8. Mixing ratio and reservoir temperature in hot springs.
Water 17 01481 g008
Figure 9. Diagram of reservoir temperature and mixing ratio of cold water in Longling hot springs.
Water 17 01481 g009
Figure 10. Schematic profile showing the genetic mode of the hot springs along the Xiangbaihe Fault.
Water 17 01481 g010
Table 1. Hydrochemical constituents of the water samples in Longling. The symbol * means that the data are meaningless.
Sample IDYL1YL1-AYL2YL2-AYL3YL4YL5YL6YL6-AYL7YR2YR3YLYS
Temperature (°C)80.077.788.288.256.752.651.756.447.114.649.369.718.4
pH (in field)8.69.48.39.17.07.17.68.39.07.58.08.49.8
Vent elevation (m)1280128012901290161015901630176017601540117012601240
TDS (mg/L)520501553531369201321162161183269228104
Hydrochemical typeNa-HCO3·
CO3
Na-CO3·
HCO3
Na-HCO3·
CO3
Na-CO3·
HCO3
Na·Ca-HCO3Na-HCO3Ca·Mg-HCO3Na-HCO3Na-HCO3Ca-HCO3Na-SO4·HCO3Na-SO4·CO3·
HCO3
Na-CO3·
HCO3
H2SiO3 (mg/L)320.4367.7345.4384.464.180.230.673.888.310.168.398.623.7
SiO2 (mg/L)246.4282.9265.7295.749.361.723.656.867.97.752.575.918.2
Na (mg/L)205.0203.0216.0214.091.977.16.163.063.70.271.076.84.3
K (mg/L)15.711.321.516.18.72.21.91.41.00.12.22.26.0
Ca (mg/L)2.31.62.22.036.53.876.92. 73.360.710.82.323.8
Mg (mg/L)0.330.260.500.287.880.0824.800.110.098.220.400.001.23
HCO3 (mg/L)212.0172.0260.0232.0369.0158.0339.0130.0117.0223.076.049.329.0
CO3 (mg/L)104.0123.0110.0115.00.00.00.09.810.30.03.927.926.3
SO4 (mg/L)48.341.935.534.228.829.037.413.015.00.693.747.611.4
Cl (mg/L)15.413.715.113.65.33.91.51.72.50.15.29.21.4
Li (μg/L)2162.01883.02370.01950.0611.0299.022.7168.0146.01.7325.0480.04.4
Sr (μg/L)32.530.726.620.9281.032.6363.021.224.919.8353.058.745.5
γNa/γCl20.5522.8722.0824.2926.5630.596.2657.8839.97*21.2812.93*
γ(Ca + Mg − SO4 − HCO3)
/γ(Na − Cl)
0.490.410.510.471.020.911.570.830.76*0.880.54*
Recharge
elevation (m)
274431022838309431173153328632693093295124652628*
Circulation
depth (m)
3197–3536 3483–3680 1247–15861730–2409763–9961121–1657 1139–18011300–1819
Table 2. Pearson correlation coefficients (r) among various ions in the water samples.
CaMgNa + KHCO3ClSO4
Ca1
Mg0.986 **1
Na + K−0.522−0.4751
HCO30.661 *0.651 *0.1511
Cl−0.461−0.4070.947 **0.0741
SO40.000−0.0550.052−0.2800.2171
Notes: * p < 0.05; ** p < 0.01.
Table 3. Chloro-alkaline indices of geothermal water in the Longling area.
Sample IDYL1YL1-AYL2YL2-AYL3YL4
CAI-I−20−23−22−24−27−30
CAI-II−1−1−1−1−1−1
Sample IDYL5YL6YL6-AYR2YR3
CAI-I−6−58−39−21−12
CAI-II0−1−1−1−1
Table 4. Mineral transfer in the springs near Longling calculated with PHREEQC (mmol/L).
ReactantMolecular FormulaMineral Transfer
YLYS–YL1YLYS–YL2YLYS–YL3YLYS–YL4YLYS–YL5YLYS–YL6YLYS–YR2YLYS–YR3
AlbiteNaAlSi3O87.447 7.887 3.699 3.123 0.074 2.523 2.794 2.623
CalciteCaCO32.393 2.867 1.731 0.842 0.186 0.691 0.176 0.190
DolomiteCaMg(CO3)2−0.037 −0.030 0.274 −0.047 0.970 −0.046 −0.034 −0.051
FluoriteCaF20.671 0.631 0.139 0.159 0.005 0.137 0.148 0.333
GypsumCaSO4·2H2O0.403 0.255 0.178 0.180 0.267 0.013 0.853 0.373
HaliteNaCl0.396 0.388 0.112 0.071 0.004 0.009 0.107 0.220
K-feldsparKAlSi3O80.248 0.307 0.070 −0.096 −0.106 −0.117 −0.098 −0.097
Chalcedony/QuartzSiO2−12.470 −13.400 −7.139 −5.496 0.133 −4.319 −4.954 −4.314
CO2(g)CO21.212 1.954 4.209 1.616 2.987 1.012 0.596 0.414
AnorthiteCaAl2Si2O8−3.848 −4.142 −1.884 −1.513 0.016 −1.203 −1.348 −1.263
Note: Positive values represent mineral dissolution, negative values represent mineral precipitation.
Disclaimer/Publisher’s Note: The statements, opinions and data contained in all publications are solely those of the individual author(s) and contributor(s) and not of MDPI and/or the editor(s). MDPI and/or the editor(s) disclaim responsibility for any injury to people or property resulting from any ideas, methods, instructions or products referred to in the content.

