Article

Research on Data-Driven Prediction of Inrush Probability in Coal Mines Under the Mechanism of Feature Reconstruction in Information Interconnectivity

School of Economics and Management, Beijing University of Posts and Telecommunications, Beijing 100876, China
*
Author to whom correspondence should be addressed.
These authors contributed equally to this work.
Water 2025, 17(6), 843; https://doi.org/10.3390/w17060843
Submission received: 11 February 2025 / Revised: 5 March 2025 / Accepted: 13 March 2025 / Published: 14 March 2025
(This article belongs to the Special Issue Engineering Hydrogeology Research Related to Mining Activities)

Abstract

:
As coal mining extends deeper, the complexities of groundwater systems and the instability of geological formations exacerbate the challenges of accurately investigating and preventing water inrush incidents in mines. To tackle the issues stemming from the multifaceted causes of such difficulties associated with data acquisition—coupled with a limited sample size leading to prediction inaccuracies—this study introduces a bicubic interpolation data augmentation algorithm and presents a data-driven CNN-ResNet-RF model designed for effective data expansion. The bicubic interpolation technique adeptly extracts correlational information from the evidence chain related to water inrush events, thereby enriching the training dataset. The CNN facilitates the extraction of preliminary features from the augmented input variables through convolution and pooling, which are subsequently concatenated with raw features derived from ResNet. The enriched correlational information and reconstructed features are then inputted into a Random Forest model to predict the probability of water inrush in mining operations. Empirical validation reveals that the data augmentation coupled with the CNN-ResNet-RF model significantly enhances the extraction of information from sample data, outperforming conventional predictive models. The model’s efficacy is evidenced by a RMSE of 0.5946, a MAE of 0.4666, a MAPE of 0.38%, and a R2 of 0.9072. This method provides an accurate representation of the nonlinear dynamics of mine water inrushing—a process governed by numerous factors and characterized by a small dataset with a complex formation mechanism. Ultimately, it enables precise assessments of high-risk water inrush areas, offering theoretical and decision-making support for the proactive implementation of targeted mitigation strategies.

1. Introduction

Mine water hazards pose significant risks in China’s coal mining industry due to their concealed nature, unpredictable dynamics, and rapid propagation mechanisms, with catastrophic inrushes exacerbated by complex hydrogeological conditions. While global mining systems additionally face environmental degradation from acid mine drainage (AMD) in sulfide-rich formations, the Chinese context remains dominated by neutral/basic water hazards linked to carbonate aquifers, where abrupt structural connectivity rather than geochemical reactivity drives disaster mechanisms. Particularly in North China-type coalfields, these hazards have been identified as one of the leading causes of catastrophic mining accidents resulting in substantial casualties [1,2]. In North China-type coalfields, where Paleozoic carbonate aquifers underlie coal measures, the exhaustion of shallow deposits forces operations to approach confined paleo-aquifers within Ordovician limestone formations [3]. This intensification complicates hydrogeological conditions and amplifies the variability of disaster mechanisms, leading to a marked rise in water inrush incidents within mining operations [4]. Consequently, it has become imperative to optimize the use of limited exploration data for assessing inrush risks, while also innovating predictive models and algorithms to enable precise risk forecasting—an endeavor that remains a critical research area for Chinese mining engineering.
Recent advancements in big data technologies, artificial intelligence, and machine learning algorithms have facilitated the emergence of data-driven predictive methodologies within the realm of coal mine water inrush risk evaluation [5,6]. These methodologies leverage extensive historical data to identify latent correlations and construct robust predictive models that allow for quantitative assessments and early warning systems regarding flooding risks. Various strategies have yielded promising results, for instance, the integration of algorithms such as Support Vector Machines (SVM) and XGBoost with Geographic Information Systems (GIS) has enabled quantitative expressions of drainage fracture zones and water inrush risk delineations [7,8,9]. Furthermore, the integration of traditional Piper diagram analysis with deep learning techniques has facilitated the identification of multi-ionic water sources based on isotopic variations in aquifers, thus enhancing early estimations of potential inrush volumes and associated disaster probabilities [10,11]. Additionally, by addressing the temporal dynamics of inrush relative to water usage, hidden Markov models have been employed to construct threshold prediction models for water inrush coefficients, achieving short-term projections of floor water inrush based on unit water inflow [12,13,14].
Despite these advancements, challenges persist within the data landscape, characterized by a high degree of horizontal dimensionality and a scarcity of vertical drilling data, which consequently limits sample information. The complex interrelations among horizontal dimensions increase the intricacy of model development, while the limited availability of vertical drilling data constrains the depth and scope of model training [15]. Even with the application of suitable optimization algorithms and judicious cross-validation techniques, issues related to local optimality and overfitting may arise, ultimately impeding the generalizability and broader applicability of the predictive models [16,17,18].
The extensive body of research focused on predicting water inrush risks has primarily employed a “one-size-fits-all” approach, which often fails to capture the complexities inherent in real-world scenarios. This limitation highlights the ongoing challenge of effectively extracting and characterizing risk factors, a crucial step for enhancing model validity [19,20]. Various statistical methods, including Analytic Hierarchy Process (AHP), Principal Component Analysis (PCA), and Grey Relational Analysis, have been utilized to streamline indicators influencing water inrushing risk and reduce horizontal dimensionality [21,22,23,24]. However, these methodologies frequently overlook the subjective and ambiguous nature of weight determination. While models based on combined weights and improved gray relational theories have been proposed for risk identification, inrush events typically result from nonlinear dynamic couplings of multiple sources and contexts. As such, the inherent fuzziness, randomness, and uncertainty surrounding risk factors often complicate assessments, further compounded by non-controlling factors that may exhibit high thresholds for abrupt changes, potentially precipitating disasters. Consequently, refining the feature extraction process for risk factor data is essential for improving model efficacy.
To address these challenges, the present study introduces an innovative, data-driven method for the intelligent prediction of coal mine water inrush risks, grounded in associative information mining. This approach integrates heterogeneous data from diverse sources, preserving essential characteristics such as mean, variance, and extreme values. It enables the automatic identification and extraction of critical factors and their interrelationships that influence coal mine water inrushing while also expanding the dataset’s capacity for training. By employing a dual-input structure that incorporates Convolutional Neural Networks (CNN) and Residual Networks (ResNet), the methodology facilitates effective feature extraction and multidimensional response variable fusion, enhancing network depth and mitigating degradation issues. A hybrid Random Forest model based on data-driven principles is subsequently constructed. Empirical evidence substantiates the effectiveness of this method in improving the accuracy of coal mine flooding risk predictions, thus providing new theoretical frameworks and practical applications for mine water hazard mitigation and robust decision support for coal mine safety management.

2. Data Processing for Research

Mine water inrush events arise from a multifaceted interplay of factors, including inadequate aquitard thickness, the influence of water-conducting structures on groundwater pathways, and the uneven distribution of internal stresses within the mine. Analysis of domestic inrush incident reports has led to the classification of mine water inrush risk factors into five primary categories, comprising a total of 24 specific elements. These categories encompass: aquifer influence factors, aquitard influence factors, geological structure influence factors, working face mining conditions, mining pressure influence factors. Notably, aquitard influence factors are of paramount significance, as the aquitard’s capacity to impede groundwater flux is a primary determinant of water inrush propensity. These factors include the thickness and effective thickness of the aquitard, alongside its lithological composition, specifically the relative proportions of sandstone, mudstone, and limestone. In contrast, aquifer factors are directly related to the mine’s hydrogeological attributes. The principal determinants of aquitard thickness in coal mines involve a multi-dimensional interaction of sedimentary, tectonic, and diagenetic processes. The sedimentary environment establishes the initial lithofacies architecture, while tectonic activity, via fault and fracture networks, modulates the spatial configuration of aquitards, with compressional and extensional regimes inducing ductile thickening or brittle thinning, respectively. During diagenesis, cementation processes enhance rock mass consolidation, whereas dissolution creates preferential flow conduits, reducing aquitard effectiveness. In contrast to aquifer thickness, which is primarily governed by the spatial continuity of highly porous lithologies, effective aquitard thickness underscores rock mass permeability and structural stability. This divergence arises from the hydro-mechanical coupling intrinsic to aquitards, wherein their hydraulic resistance is fundamentally a function of the dynamic equilibrium between rock mechanical strength and permeability, while aquifer water storage capacity primarily reflects static reservoir characteristics.
The geological structure category encompasses six sub-factors: the extent of development of water-conducting structures, characteristics of fracture permeability, structural water retention, collapse columns, faults, and fault displacements, which together determine the stability of the mine’s geological fabric and the complexity of hydrogeological conditions. Working face mining conditions include six influencing factors: mining depth, dip angle of the coal seam, coal seam thickness, inclined length of the working face, strike length, and mining height, all of which bear directly on the geological conditions and stability of the working face during extraction operations. Finally, pressure dynamics involve the monthly advancement rate of the working face, the presence of fracture zones, and the depth of floor or roof damage, highlighting the internal stress state and potential damage within the mining environment, with implications for elevated water inrush risk.
The assessment of risk indicators associated with coal seam flooding events involves quantifying relevant parameters, as depicted in Table 1, which outlines the data types, units, and evaluation criteria. Based on this framework, predictions regarding the maximum inflows for each working face are formulated. This study systematically collected engineering reports and borehole data from coal mines with water inrush risks in hydrogeological settings analogous to the North China-type coalfields, focusing on mines characterized by buried Ordovician karst aquifers overlain by Permo-Carboniferous coal measures. The dataset includes stratigraphic profiles from 60 exploration boreholes, hydrogeological test results, and engineering geological reports from 18 mining districts, selected based on comparable hydrogeological parameters and documented histories of water inrush events (minimum three recorded incidents). The analysis utilizes standardized data from 60 sets of coal mine working faces, with the first 40 sets allocated as a training dataset and the remaining 20 sets designated for validation purposes.
The Bicubic interpolation method was employed to expand the 40 training sets into a total of 160 samples of water inrush training data, as illustrated in Table 2. A comparison of Table 3 and Figure 1 demonstrates that the extended data obtained through bilinear interpolation exhibit high similarity to the original data, thereby possessing substantial training value.

3. Model Principles

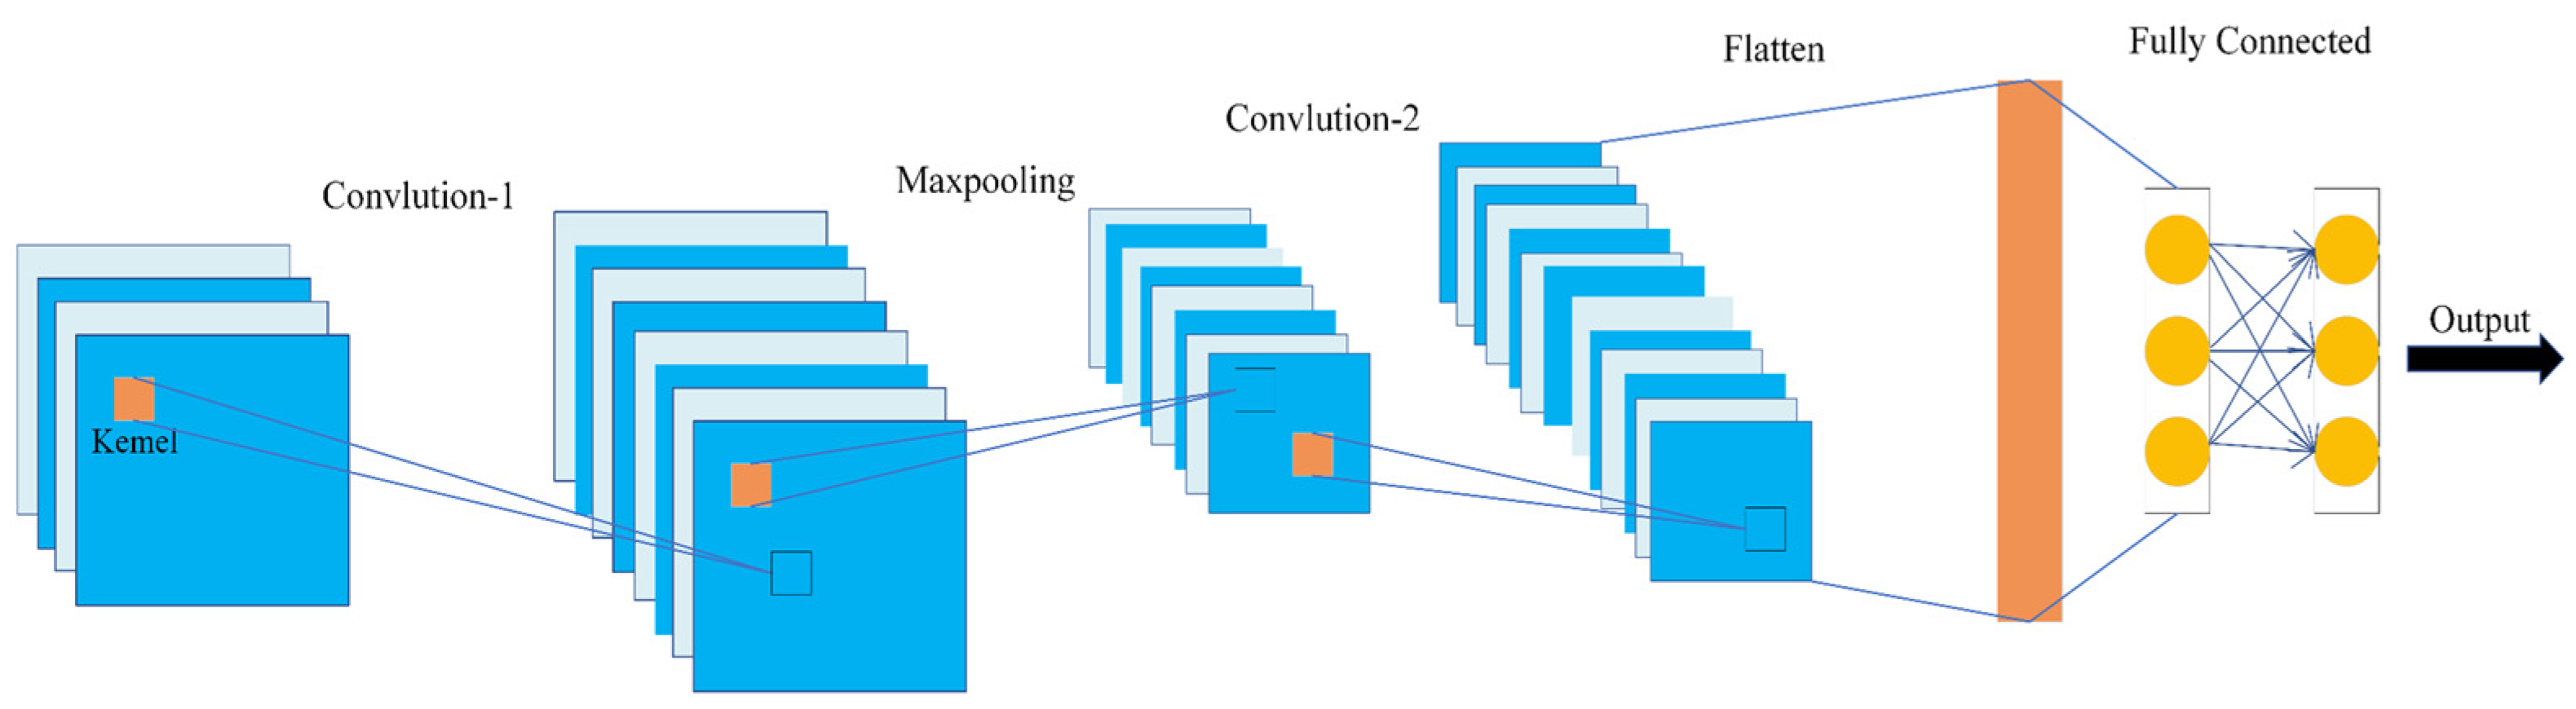
3.1. Principles of CNN

Convolutional Neural Networks (CNNs) are a widely used network architecture for processing image data, holding a pivotal position in the realm of computer vision. The fundamental structure of a CNN consists of an input layer, convolutional layers, pooling layers, fully connected layers, and an output layer, as shown in Figure 2. Due to the characteristics of sparse connections, weight sharing, and pooling operations, CNNs exhibit a remarkable capacity for representation with comparatively fewer layers [25]. The introduction of convolutional kernels reduces parameter connections and mitigates the risk of overfitting while allowing for parameter sharing. The pooling operation serves as a secondary mechanism for feature extraction, thereby decreasing computational demands. This paper utilizes CNNs to extract features from the water inrush data of underlying strata.
The size of the feature map is determined by the input matrix of the previous layer, the number and size of the convolution kernel, the moving strides, and the padding method. The parameters of each convolution unit are optimized through the backpropagation algorithm. Each neuron in the same feature map shares weights and is only connected to local neurons in the previous layer. The shared-weight architecture and local connectivity significantly simplify the networks and reduce the risk of overfitting. After the convolution operation, an activation function is introduced to transform the linear convolved feature to non-linearity in the decision function. The basic formula of convolution calculation is as follows [26]:
z j l = i M x i l 1 k i j l + b j l
x j l = f z j l
where i and j represent the i-th input neuron and the j-th output neuron, respectively; Zjl represents the j-th output of the convolution operation; l is the l-th convolutional layer; xil−1 denotes the input to the l-th convolutional layer; M is the number of input feature maps or the number of image channels (if it is the first convolutional layer); kijl is the convolution kernel; bjl is the bias value for the j-th neuron in layer l; xjl is the output of neuron j; f represents the activation function. f can be the “Sigmod”, “tanh”, or “ReLU” function (Rectified Linear Unit, or linear rectification function). The “ReLU” function is commonly used in deep neural networks due to its faster calculation and good generalization ability. The definition of the “ReLU” function is shown below:
f ( z j l ) = m a x ( 0 , z j l )
After feature extraction from the convolutional layer, the obtained feature maps are usually downsampled by a pooling layer (downsampling layer) to reduce computation. Downsampling does not change the number of feature maps but can reduce the size and prevent overfitting. Downsampling methods include average sampling, maximum sampling, overlap sampling, normalized sampling, random sampling, etc. The formula for pooling calculation is as follows:
o j l + 1 = d o w n x j l
where Ojl+1 is the output of the (l + 1)-th layer after pooling operation; down is the pooling function. A fully connected layer is located at the end of CNN. In this layer, the feature map loses its spatial structure. The features extracted from the previous layers are flattened into a one-dimensional feature vector and nonlinearly combined to obtain input for the next layer.
y k = w k × x k 1 + b k
where yk denotes the output of the k-th fully connected layer; xk−1 is the input of the k-th fully connected layer; wk and bk are the weight and bias, respectively.

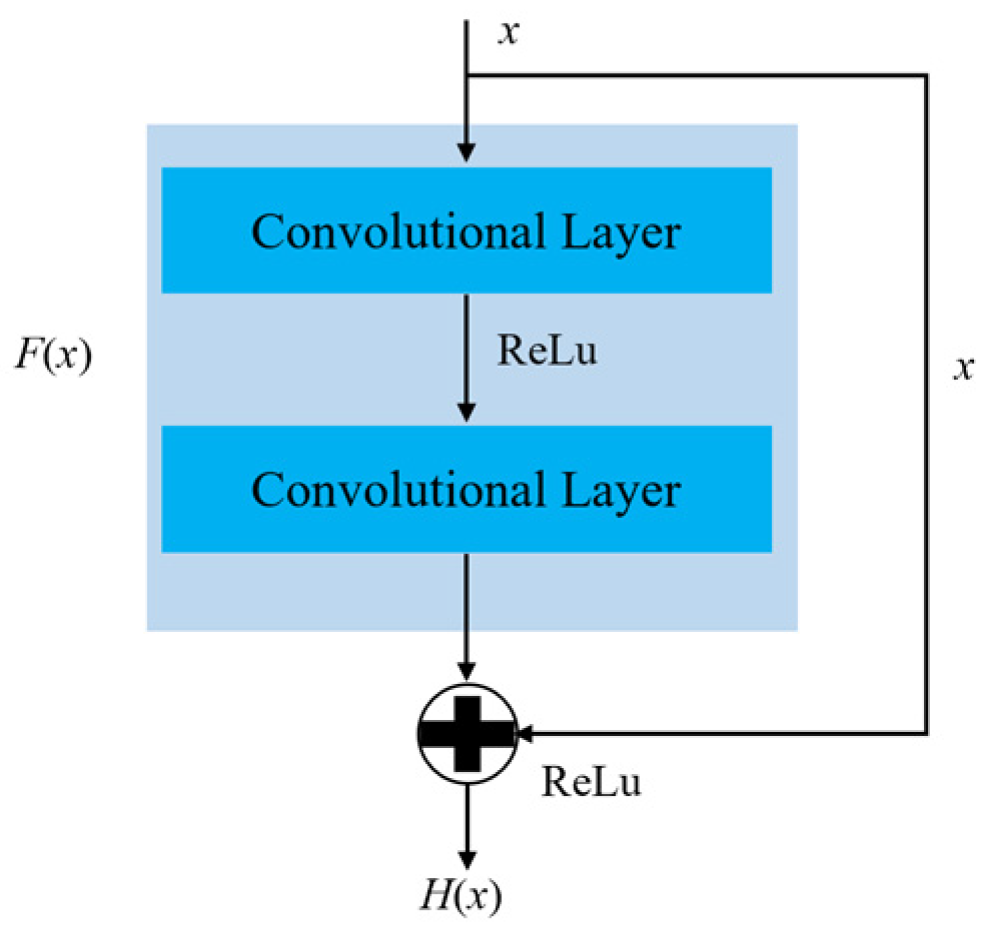
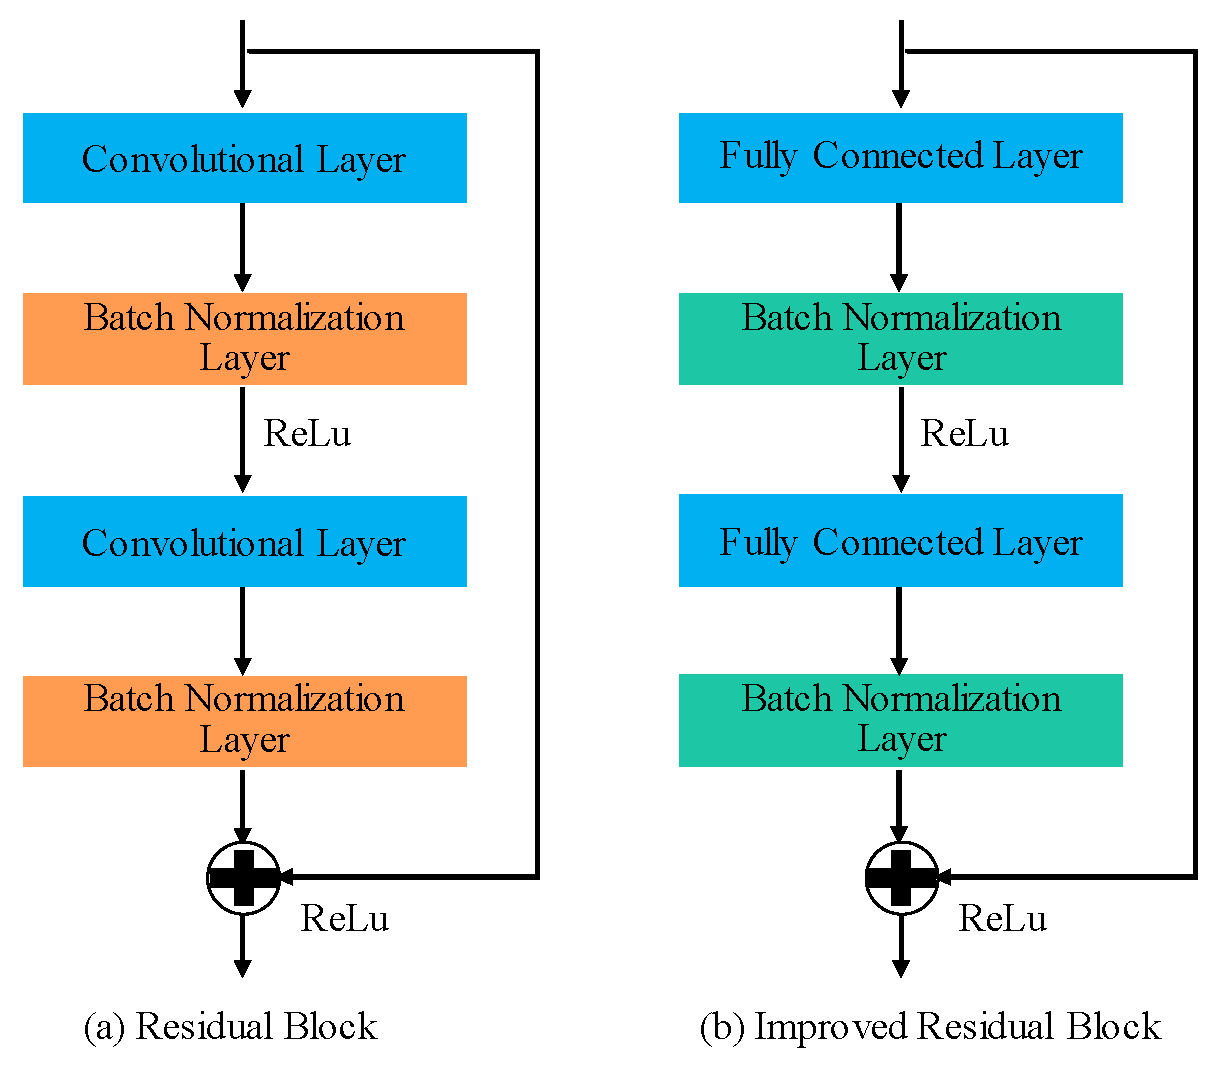
3.2. Principles of ResNet (Residual Networks)

ResNet enhances traditional deep neural networks by introducing residual blocks, thereby simplifying network complexity and addressing the problem of network degradation. The use of residual blocks enables the training of highly effective deep networks, allowing inputs to propagate more swiftly through the identity mappings within the blocks [27]. The structure of a residual block is depicted in Figure 3, where x represents the input and H(x) denotes the output. The residual F(x) indicates the error between H(x) and x as F ( x ) = H ( x ) x , with the direct pathway from input to output referred to as the shortcut connection [28].
In the absence of a shortcut path, the residual block functions as a simple two-layer weighted network, wherein the network learns the mapping from x to H(x). However, when a shortcut path is present, H(x) is defined as:
H ( x ) = F ( x ) + x
Given the x is known, the network’s task of learning the mapping from x to H(x) is equivalent to learning the mapping from x to F(x). As indicated by the structural diagram of the residual block, the expression for F(x) is represented as shown in Equation (7):
F ( x ) = W 2 σ ( W 1 x )
In Equation (7), W1 and W2 denote the weights associated with the first and second layers of the residual block, respectively, while σ signifies the ReLU activation function.
The convolutional kernel’s ability to share weights, in conjunction with the inherently deep architecture of ResNet, has facilitated its successful application across various tasks in image classification and recognition. The incorporation of residual blocks, particularly their direct connection paths, not only mitigates network complexity but also markedly enhances the model’s expressive capacity. Nevertheless, despite ResNet’s exemplary performance in image processing domains, it proves less effective for nonlinear regression problems. This limitation arises as convolutional kernels operate over localized segments of the data, failing to exert influence on the global data sequence. Consequently, these kernels serve merely as local feature extractors and are unable to capture the overarching characteristics of the data, thus conflicting with the foundational concepts of regression analysis [29].
To address the challenges associated with mine water inrush forecasting, we propose several modifications to the residual structure of ResNet: specifically, substituting the convolutional and pooling layers within the residual blocks with fully connected layers. This alteration is anticipated to enhance the extraction of features pertinent to time series data. Figure 4a illustrates the conventional residual block in the ResNet architecture, while the enhanced structure of the residual block is depicted in Figure 4b. The inclusion of batch normalization layers within the residual framework serves a dual purpose: it acts as a pooling mechanism and simplifies the network’s architecture, thereby enabling the application of higher learning rates during training, ultimately reducing computational requirements.

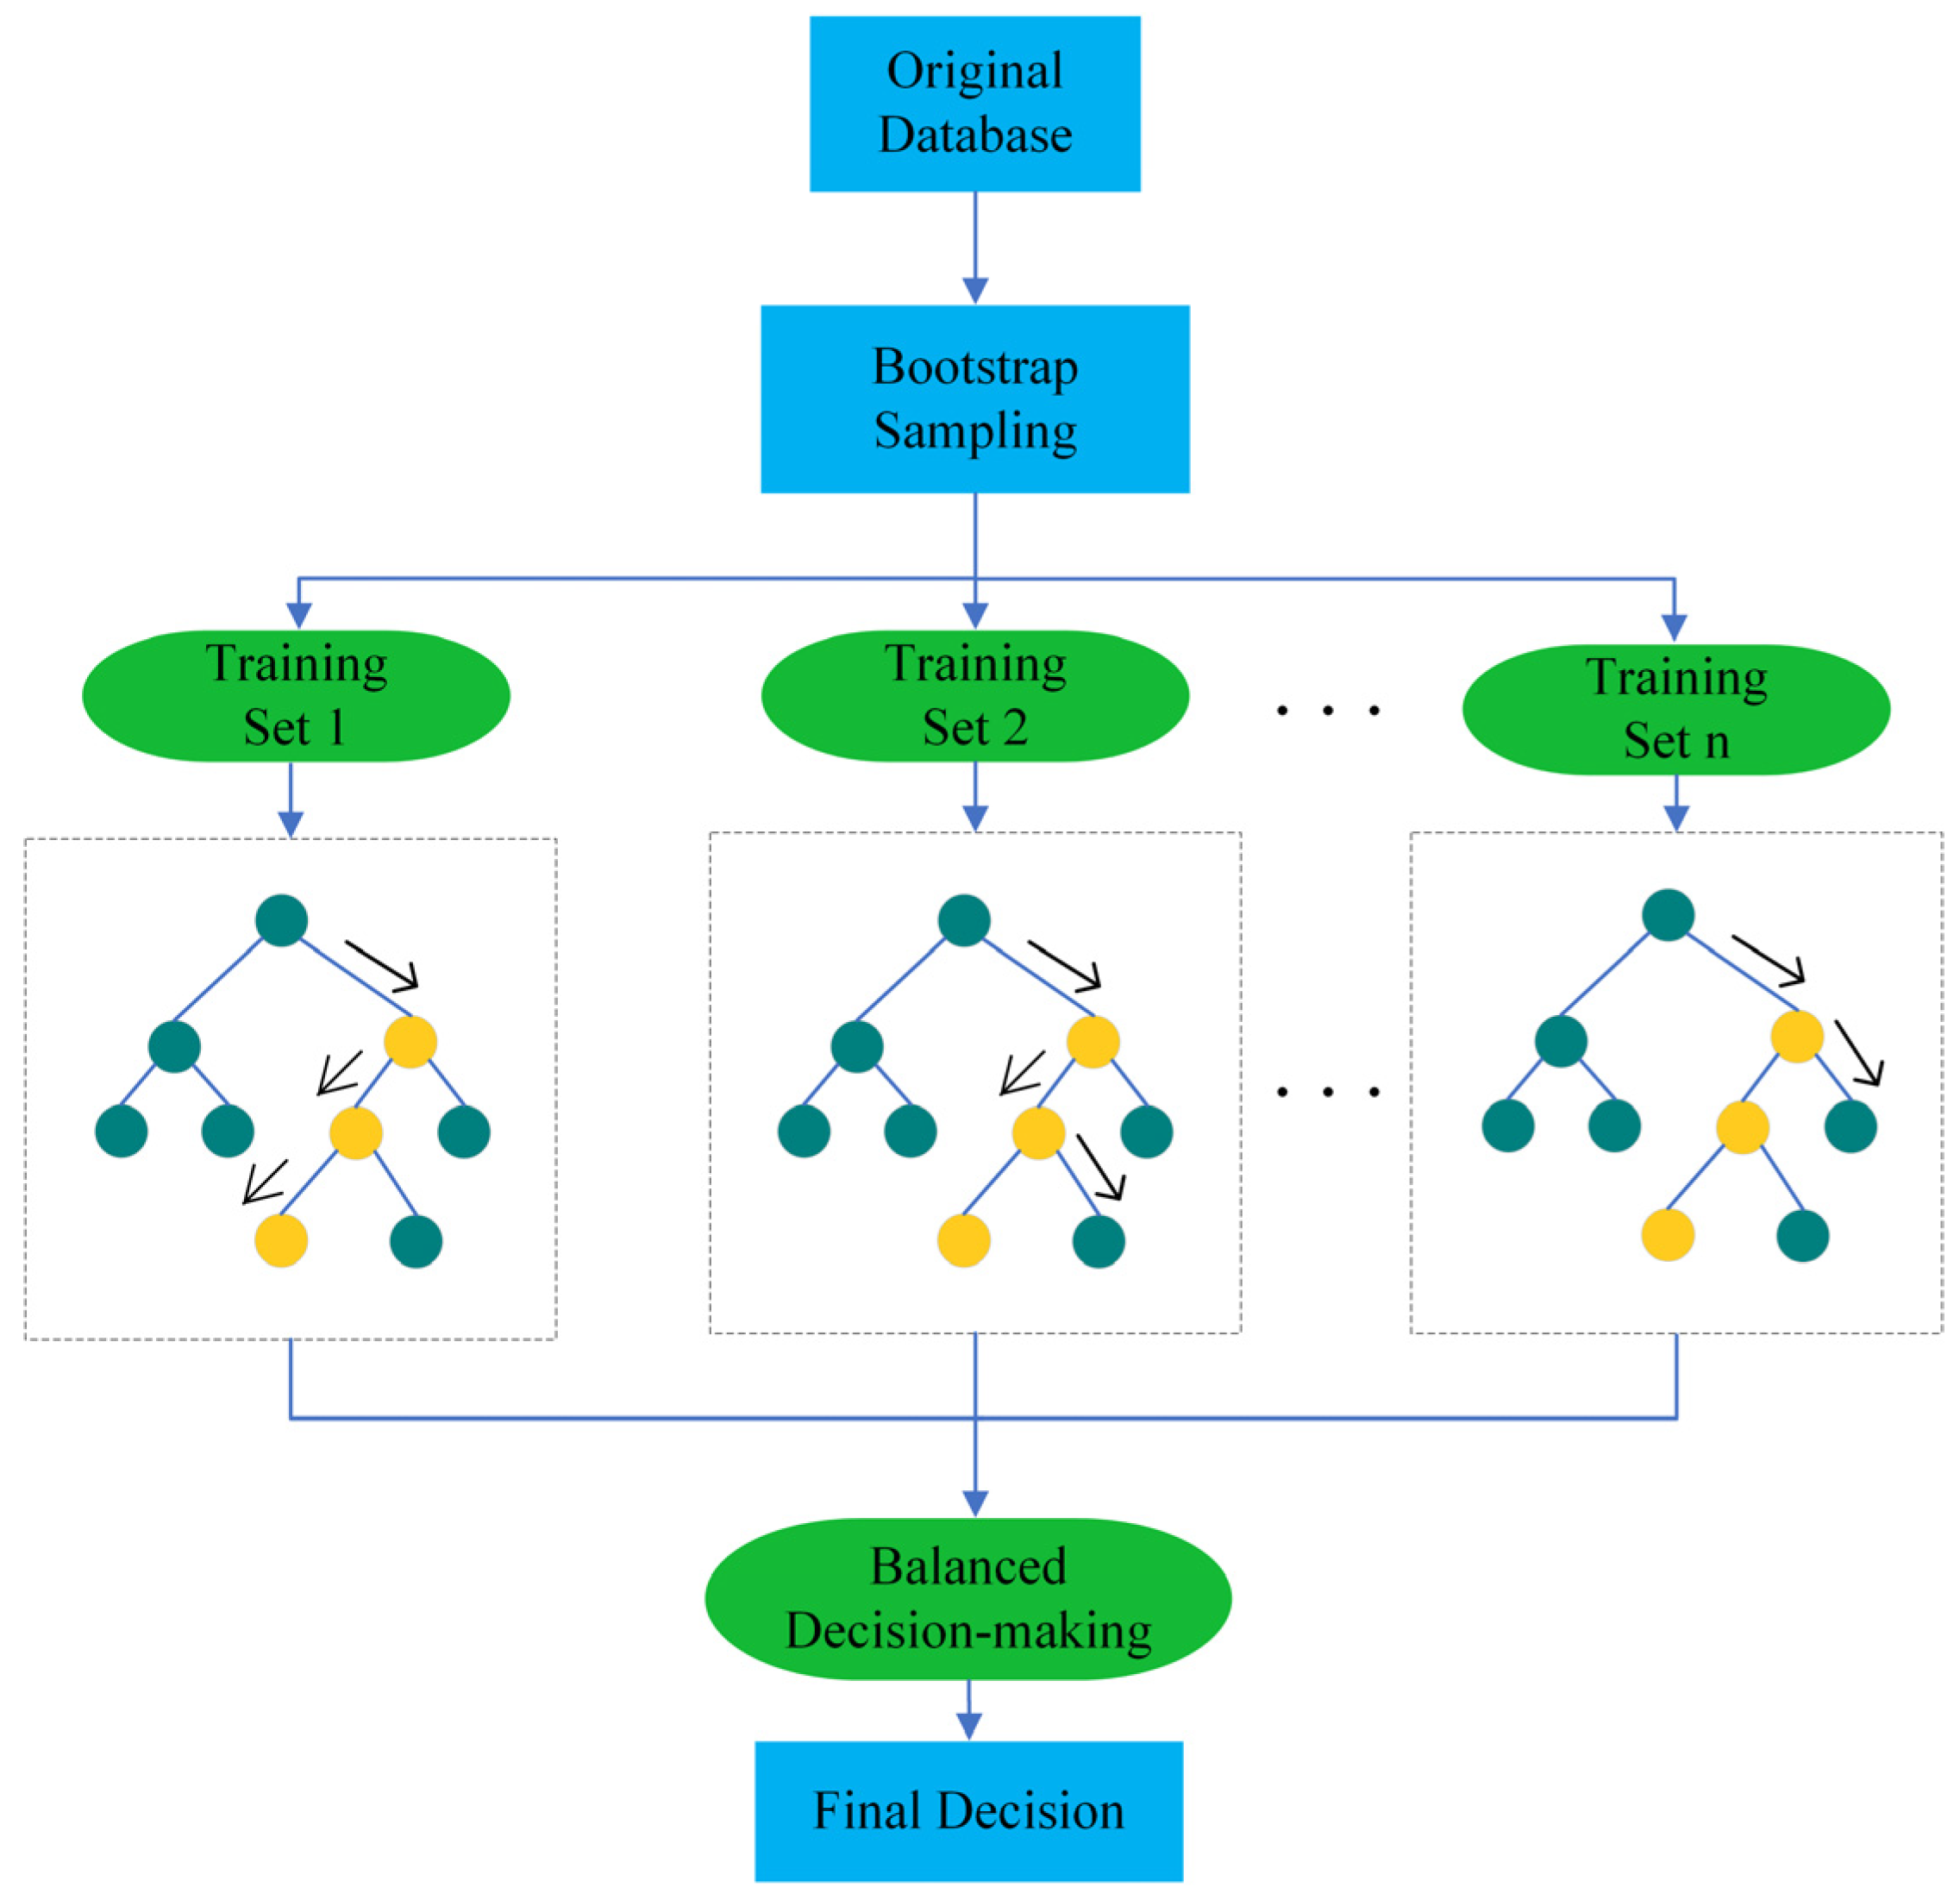
3.3. Principles of Random Forest (RF)

Random Forest (RF) represents an ensemble learning algorithm that leverages decision trees as fundamental classifiers. Its workflow entails three crucial steps: bootstrap resampling, construction of decision tree base classifiers, and voting, as visually depicted in Figure 5. The “random” element within the RF algorithm manifests through the amalgamation of two key concepts: bootstrap sampling and random subspace [30]. Initially, the bootstrap method is employed to stochastically extract samples with replacement from the original dataset, thereby composing a sub-training set of equivalent capacity. Subsequently, a specified number of feature subsets are randomly selected from the entire pool of feature attributes, with the optimal split attribute being chosen to establish a decision tree node. This “random” process is iteratively performed N times, resulting in the creation of N decision trees that are seamlessly interconnected to form a forest. Ultimately, when presented with a test sample set, each decision tree within the forest participates in a voting scheme, wherein the decision receiving the highest number of votes is deemed the definitive outcome, as articulated in Equation (8) [31].
Y x = * a r g m a x z n = 1 N λ y n x = Z
In this equation, N represents the number of decision trees, y n ( x ) denotes the classification model of the nth decision tree, Z represents the target variable for classification, and λ ( · ) represents the indicator function.

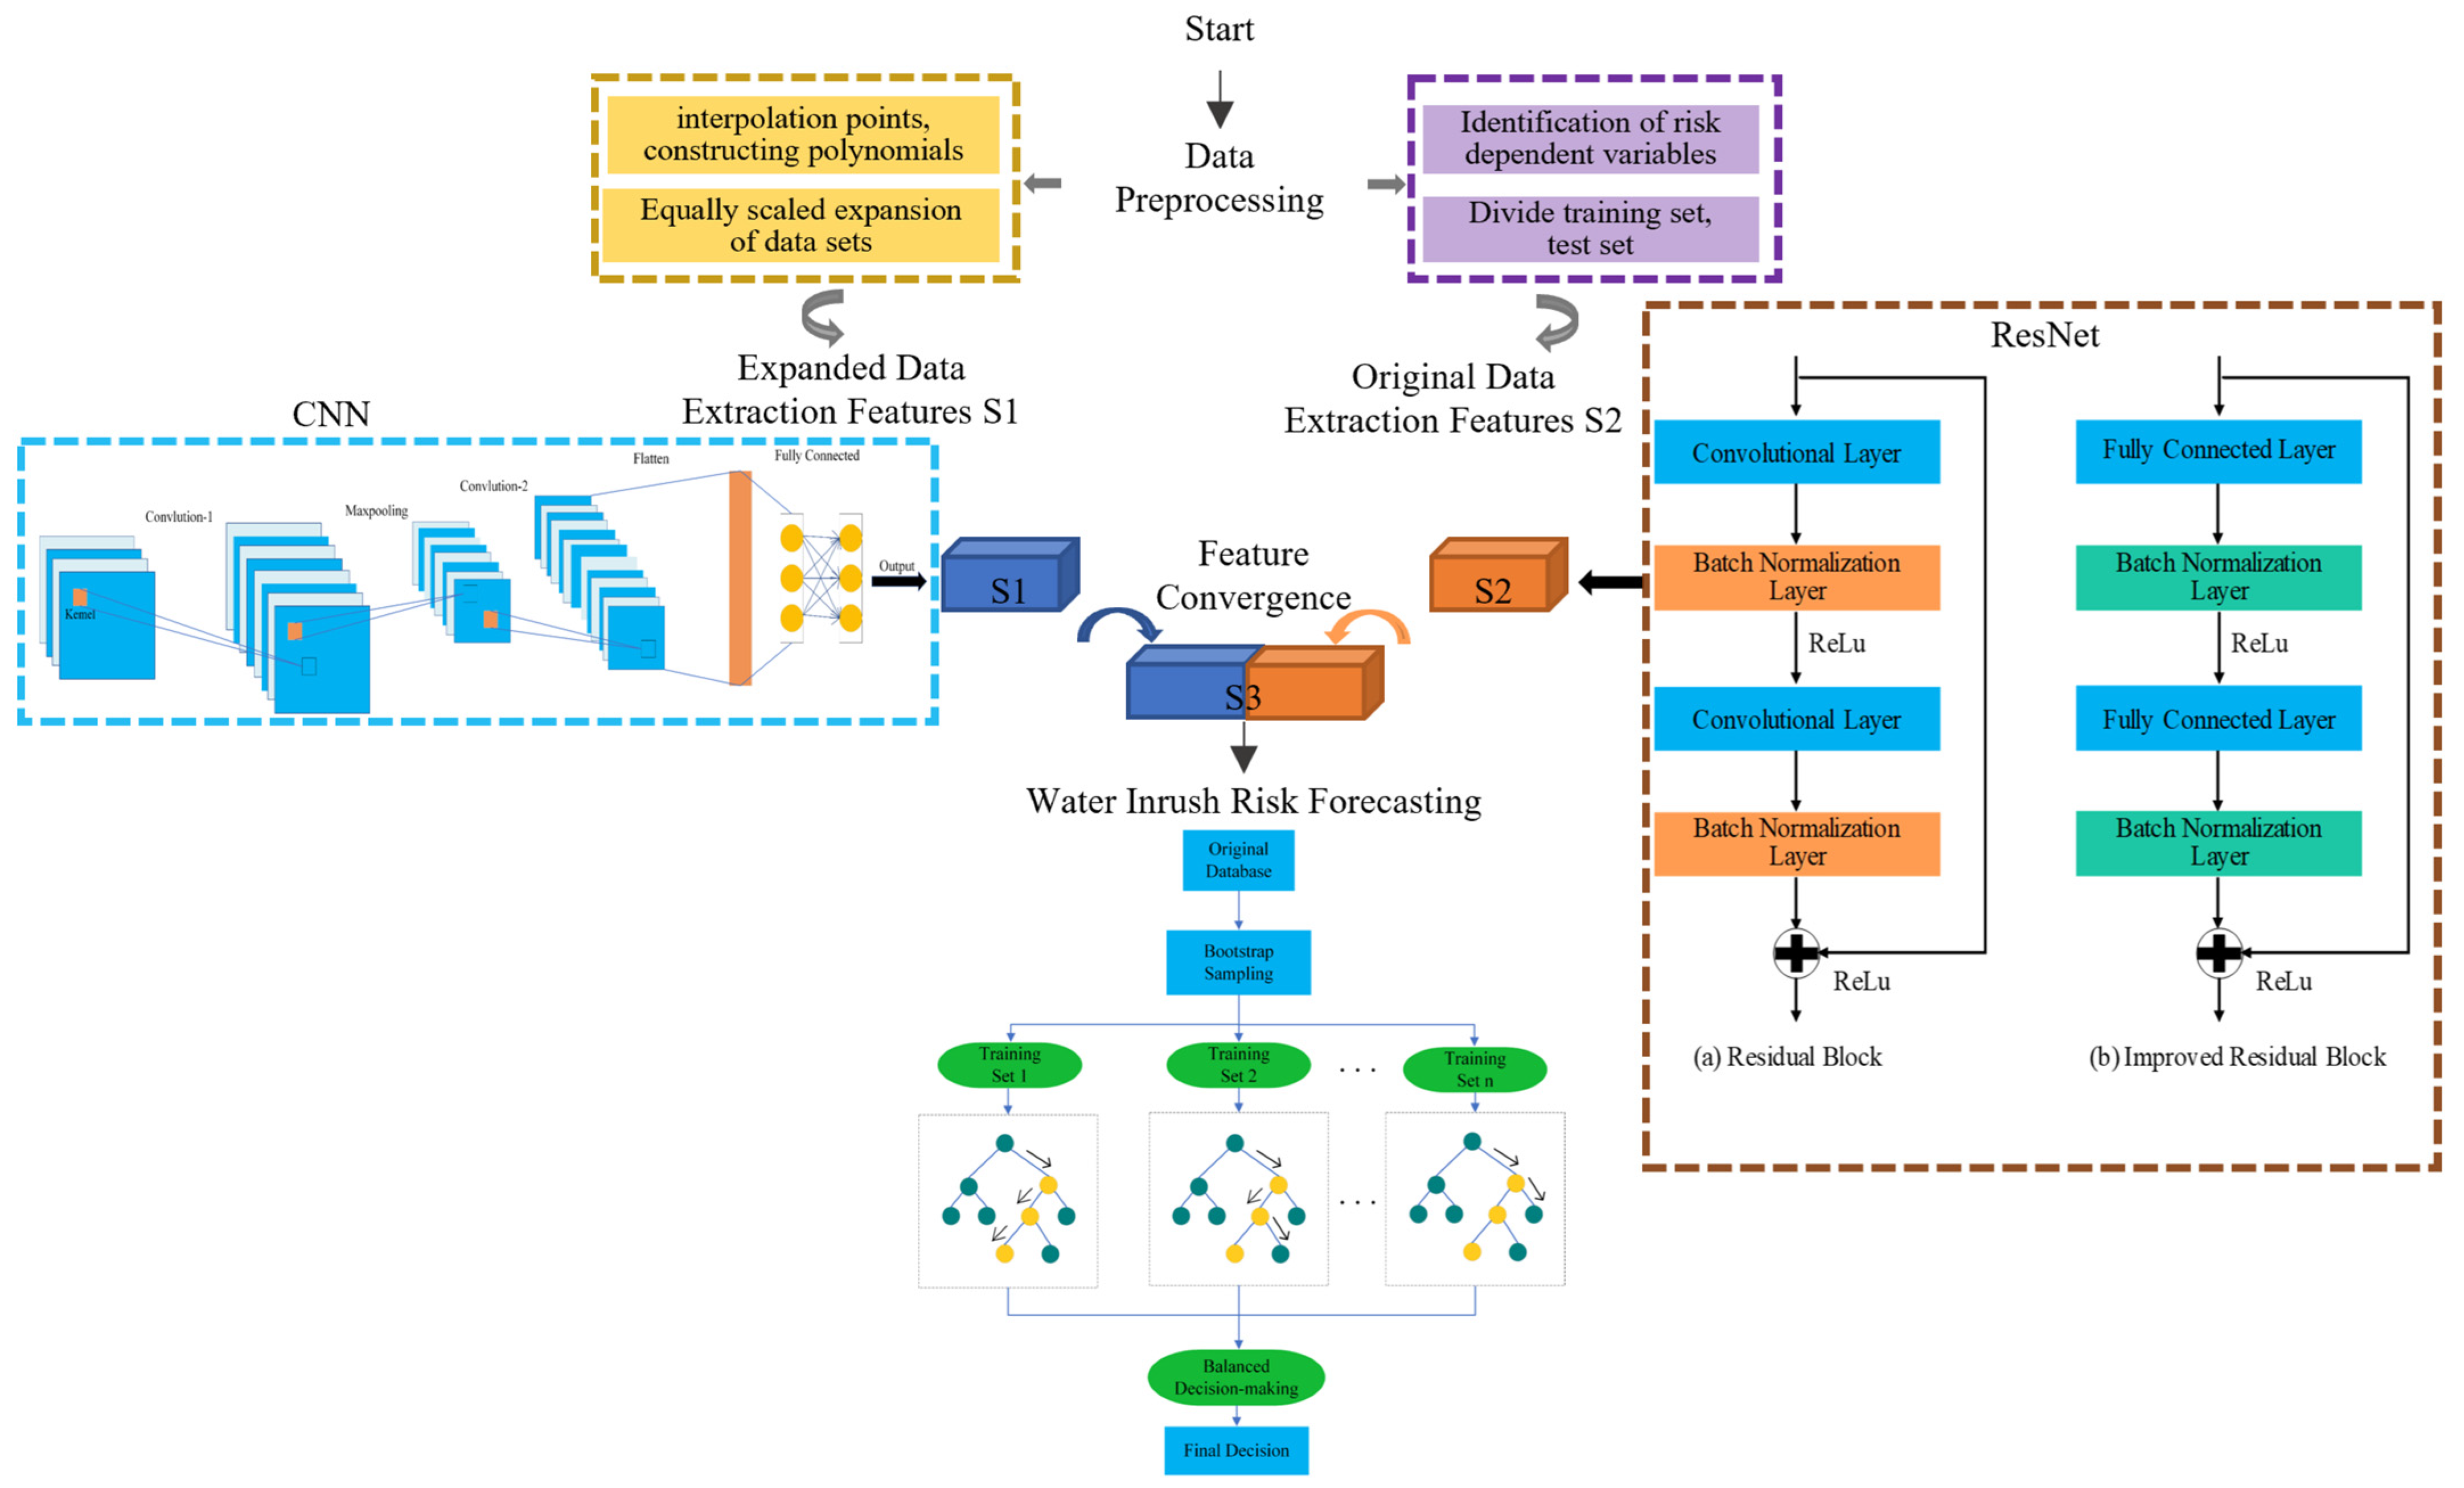
3.4. Model Construction

In this study, we have developed a data-driven predictive model for assessing water inrush risks by integrating bicubic interpolation with a CNN-ResNet framework. The model construction involves several key steps, as shown in Figure 6:
Step 1: A comprehensive analysis of related case studies, coupled with empirical measurements, has led to the identification of 24 input factors, including the degree of development of water-conducting structures, fault water conduction characteristics, water quality, and water pressure. The probability of water inrush is designated as the output variable, with the dataset divided into 80% for training and 20% for testing.
Step 2: To enhance the original training dataset, bicubic interpolation is implemented, facilitating a deeper exploration of the interrelationships among the identified risk factors.
Step 3: Feature extraction is performed on the expanded dataset using a CNN (S1), while an improved ResNet architecture is utilized to extract features from the original dataset (S2). Following the flattening process, the features are integrated into a fully connected layer, thus enabling the reconstruction of data features pertinent to the causes of potential accidents (S3).
Step 4: The final predictive outcomes are obtained by applying a Random Forest (RF) model in conjunction with the outputs generated from the aforementioned CNN-ResNet framework. The performance of the formulated model is rigorously assessed through the calculation of the Mean Absolute Error (MAE), Root Mean Square Error (RMSE), Mean Absolute Percentage Error (MAPE), and the Coefficient of Determination (R2).

4. Case Study

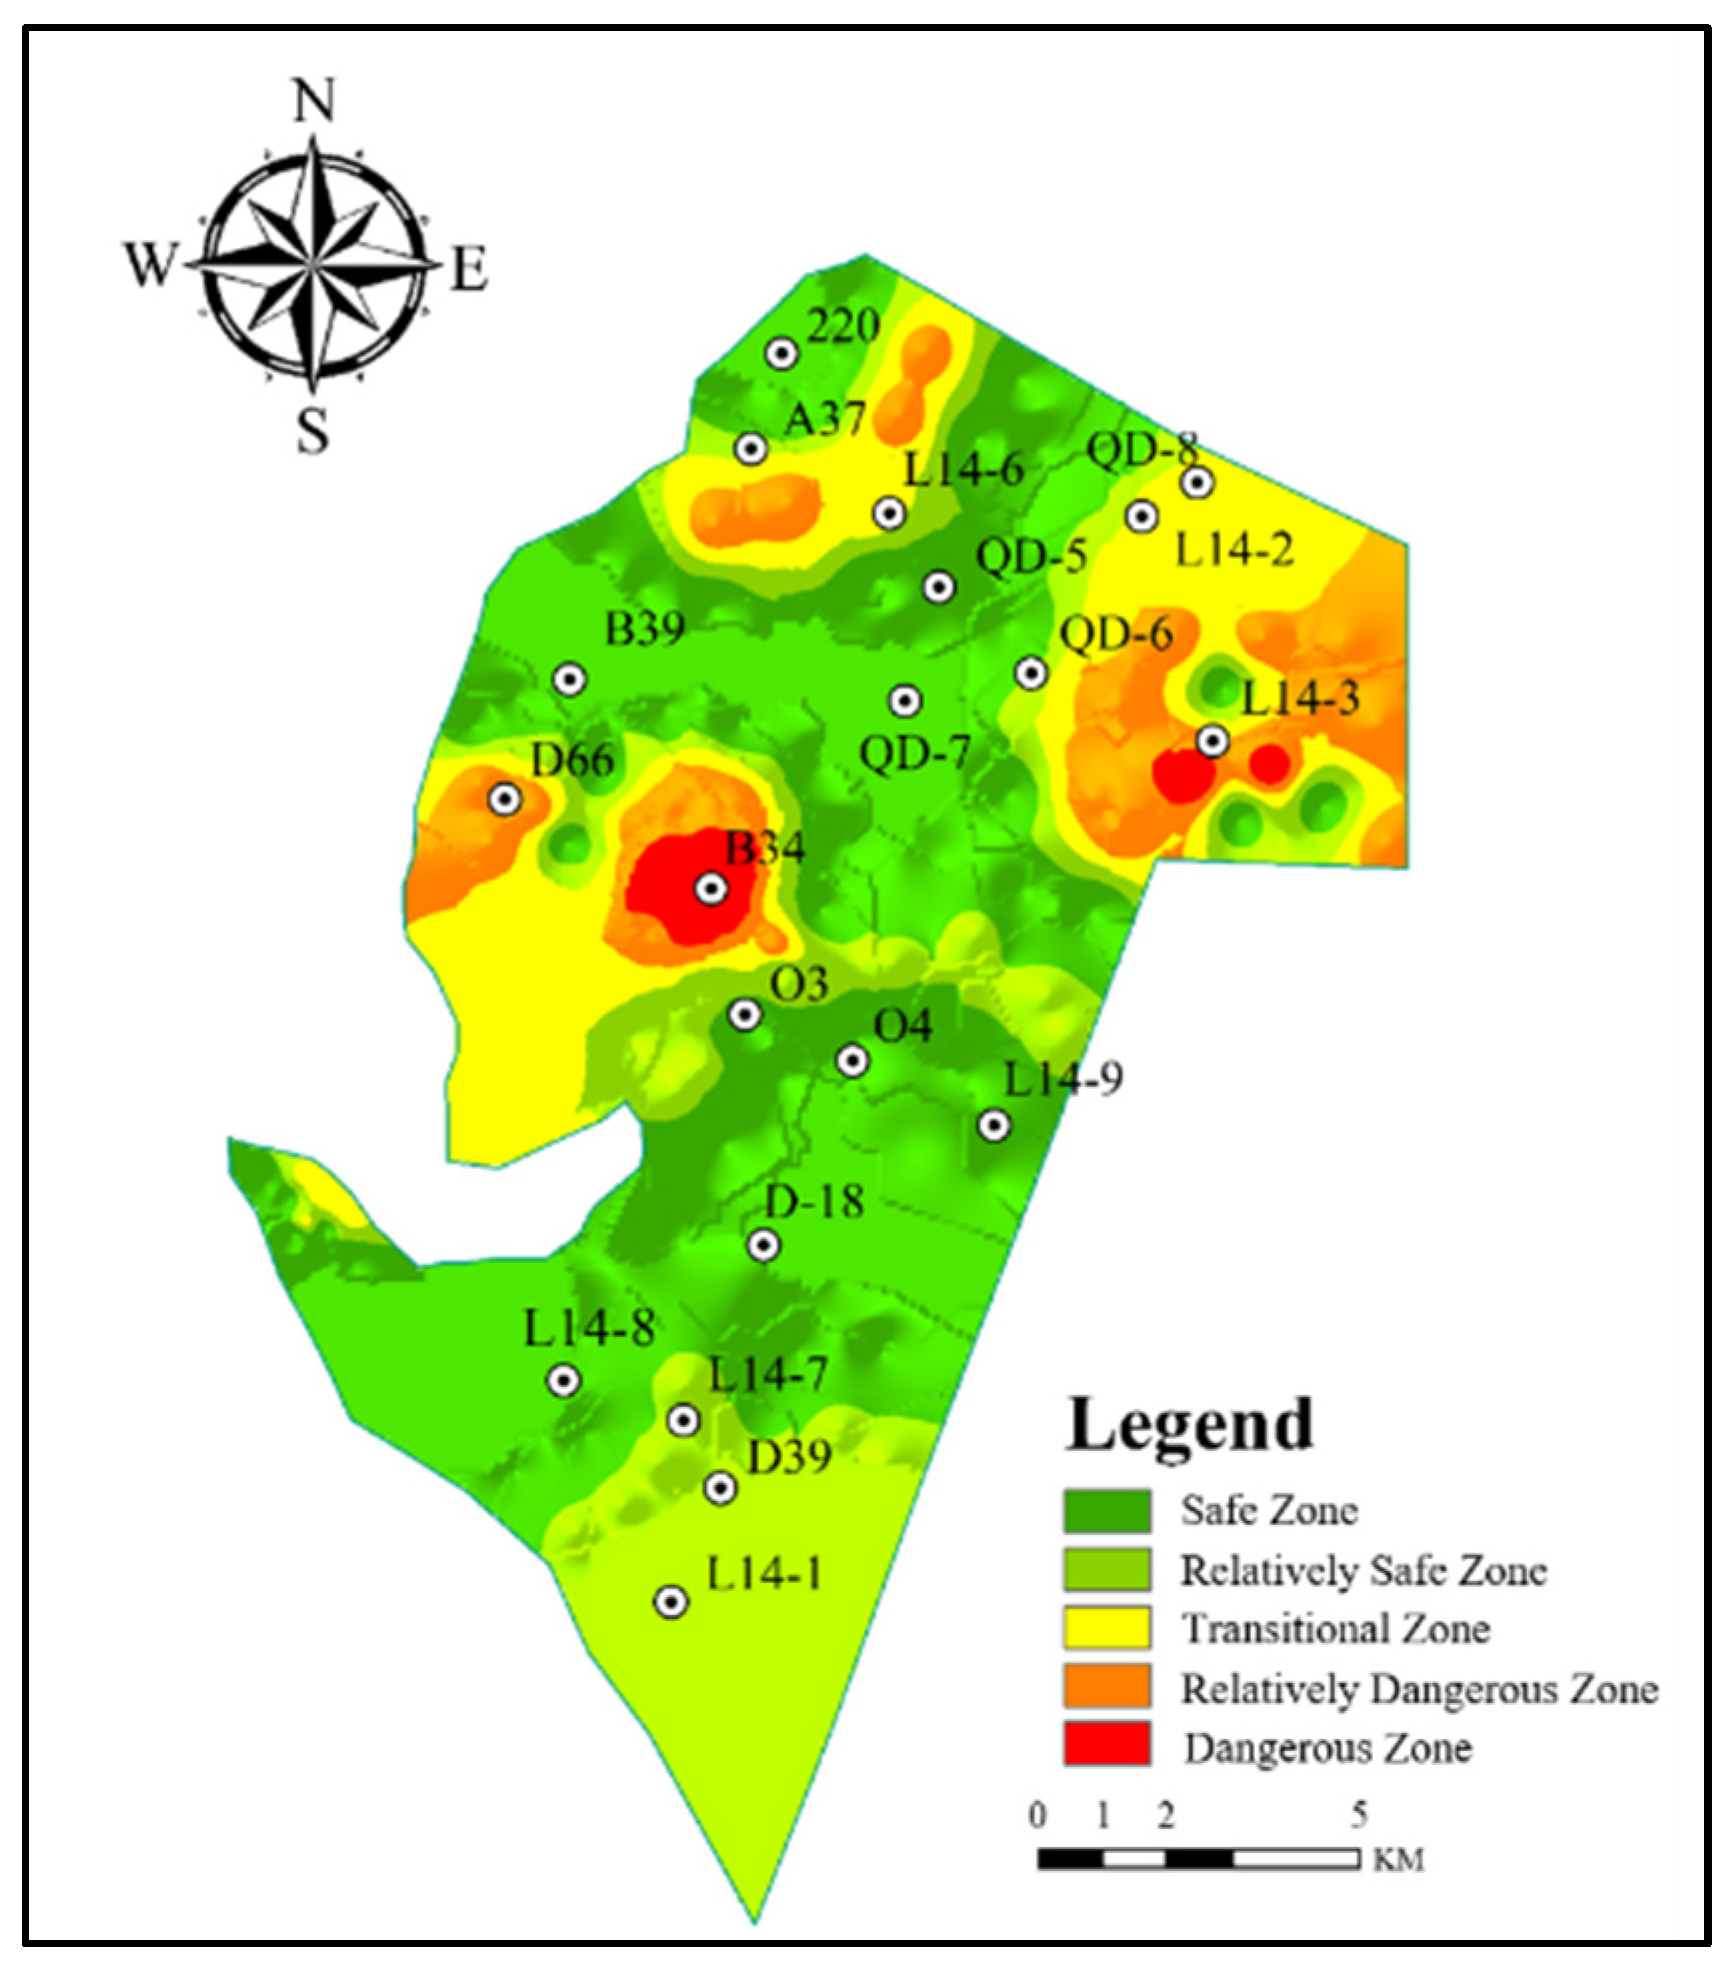
4.1. Research Background

This study employs the Yangcun Coal Mine as a case to assess the predictive strength of a model concerning water inrush probability. Situated in Wangyin Town within the Jining High-Tech Zone of Shandong Province, the Yangcun Coal Mine is positioned on the northwestern fringe of the Yanzhou Coalfield, bordered by the Yangzhuang Coal Mine to the north, the Xinglongzhuang Coal Mine to the east, the Baodian Coal Mine to the southeast, and the Tianzhuang and Henghe Coal Mines to the south, while the western boundary is delineated by coal strata outcrops. The geological structure predominantly exhibits a gently eastward-dipping syncline, characterized by an axial orientation extending from northeast to southwest, encompassing shallow dips and primarily northeast-oriented folds, alongside northwest, northeast, and nearly north–south trending faults. The principal aquifers within the mining area consist of several types: a confined aquifer represented by the lower Pleistocene conglomerate layer; a porous fissured aquifer located at the base of the Jurassic sandstone; and a confined aquifer located within the fissured sandstone of the upper Shanxi Group’s 3rd coal seam, along with the confined aquifers associated with the Taiyuan Group’s 3rd and 10th gray layers and the Benxi Group’s 14th limestone, in addition to the Ordovician limestone’s confined aquifer.
Within the Yangcun mining area, small-scale fault structures and secondary folds are prominent, with the 10th and 14th gray layers exhibiting low-to-moderate water retention capabilities. The hydrogeological dynamics of the Ordovician gray layer, which is characterized by substantial thickness, plentiful water resources, and elevated hydraulic head pressures, pose a significant threat, particularly in conjunction with the close proximity of the 14th gray layer. The intricate interconnection of faults and fractures complicates the geological landscape, facilitating hydraulic interactions that critically impact coal mining operations. The Yangcun Coal Mine employs retreat longwall mining technology within the Carboniferous-Permian coal-bearing strata, representative of the North China-type coal depositional system. Since its inception, the mine has recorded an average annual inflow rate of 272.78 m3/h, with a maximum annual inflow reaching 406.64 m3/h. Data derived from 20 distinct sets of 8-dimensional borehole measurements from the mine’s working face will serve as the validation dataset for this model.

4.2. Model Configuration and Evaluation Metrics

4.2.1. Model Parameters

The proposed dual-input feature reconstruction model initializes the network’s weight parameters, treating the expanded dataset as a two-dimensional image with a width of one, which serves as input for the Convolutional Neural Network (CNN). This model incorporates 24 dimensions of data across five categories derived from the influence of aquifers, aquicludes, geological structure, mining conditions, and mining pressure. The entirety of this input serves as data for the ResNet architecture, enabling feature extraction via the network’s forward propagation. The parameter configurations are detailed in Table 4 and Table 5.

4.2.2. Evaluation Metrics

To objectively evaluate the prediction results of different models, this study selects the following evaluation metrics: MAE, RMSE, MAPE, and R2. MAE, RMSE, and MAPE primarily measure the deviation between predicted values and actual values; the smaller these values are, the higher the accuracy of the model’s predictions. R2 reflects the relationship between independent and dependent variables, taking values from 0 to 1, with values closer to 1 indicating better fit of the regression curve in the model. The specific formulas are presented in Equations (9)–(12) [30].
X MAE = 1 n i = 1 n | y p y r |
X MAPE = 1 n t = 1 n y P y r y r
X RMSE = 1 n i = 1 n y p y r 2
R 2 = 1 i = 1 n y p y r 2 i = 1 n y r 1 n i = 1 n y r 2
In the equations, yp represents the predicted values, yr denotes the actual values of the data, n indicates the number of prediction points.

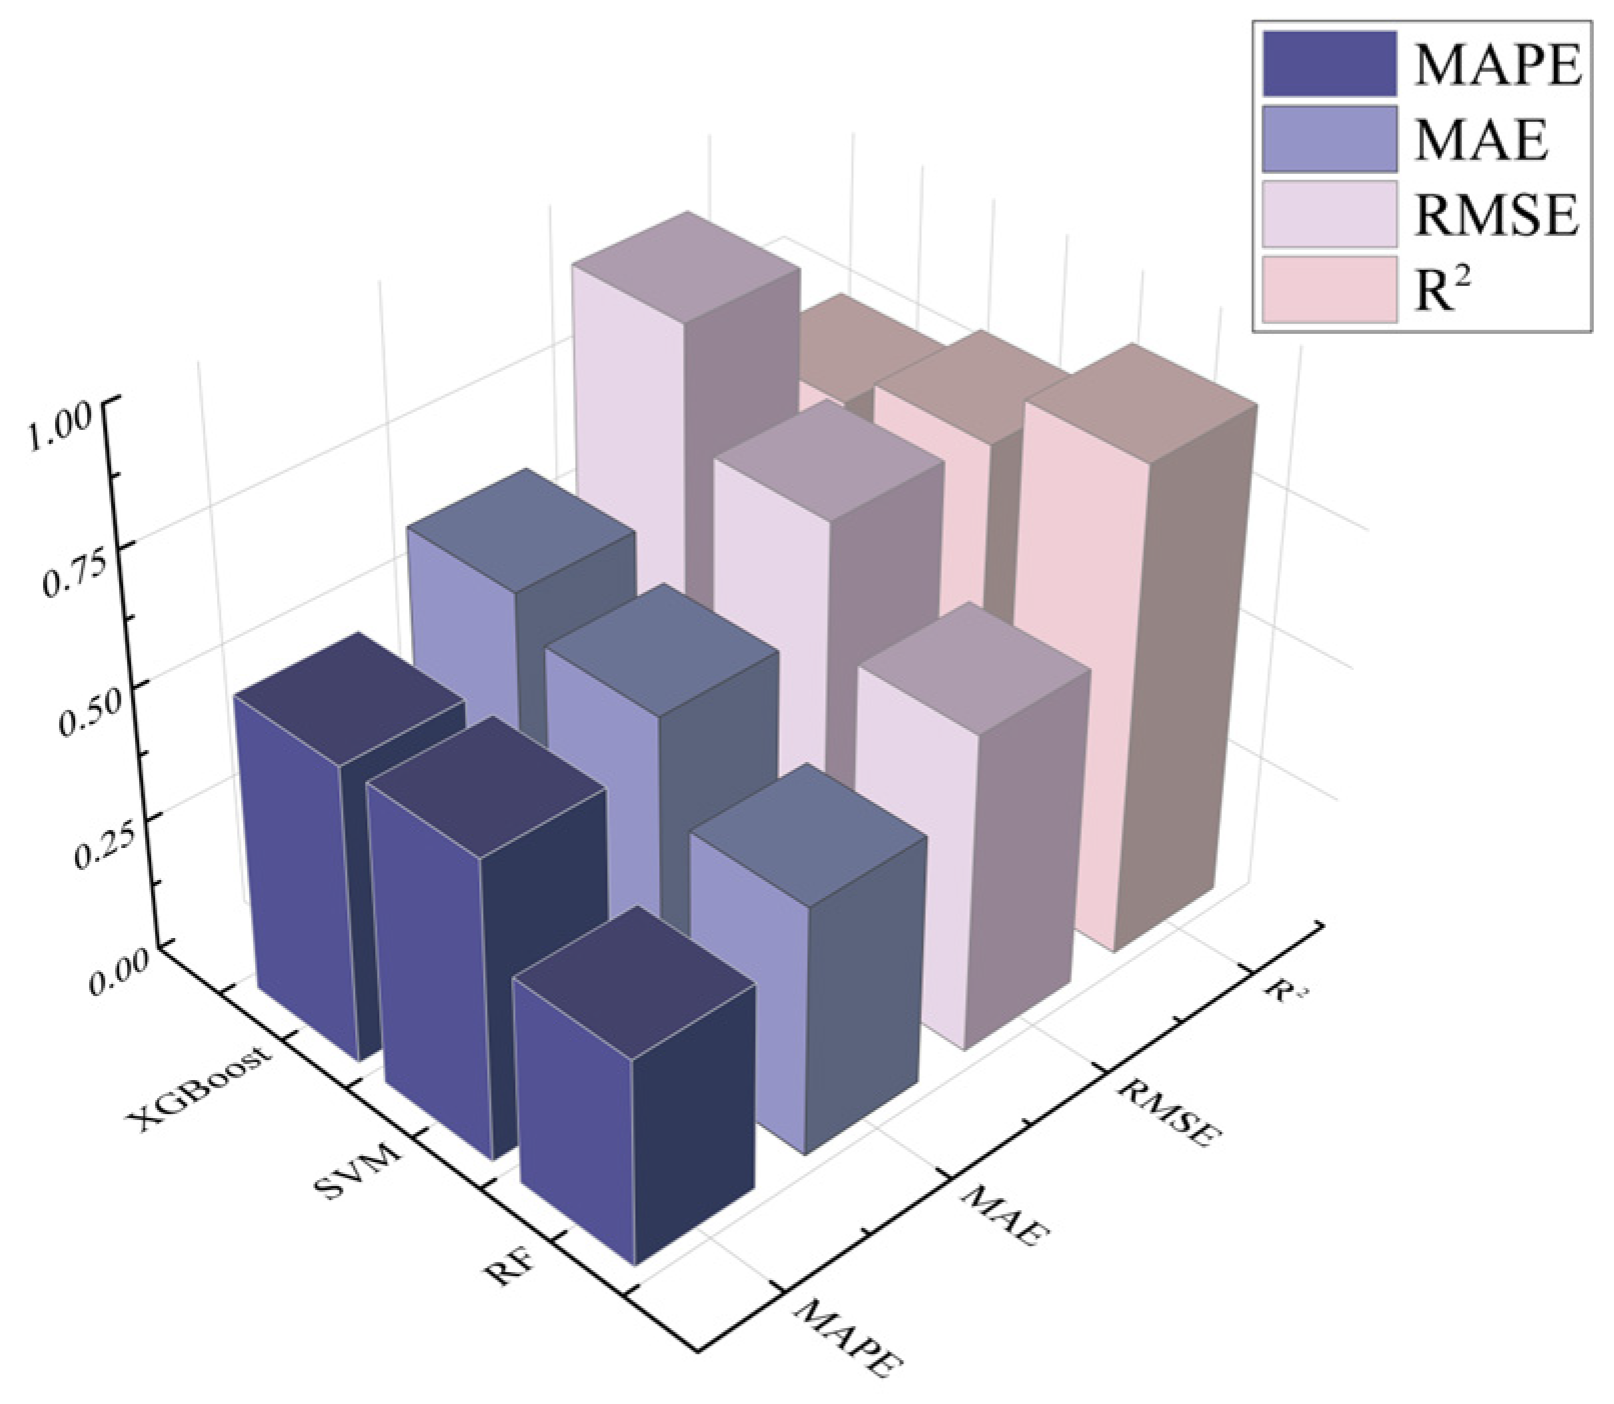
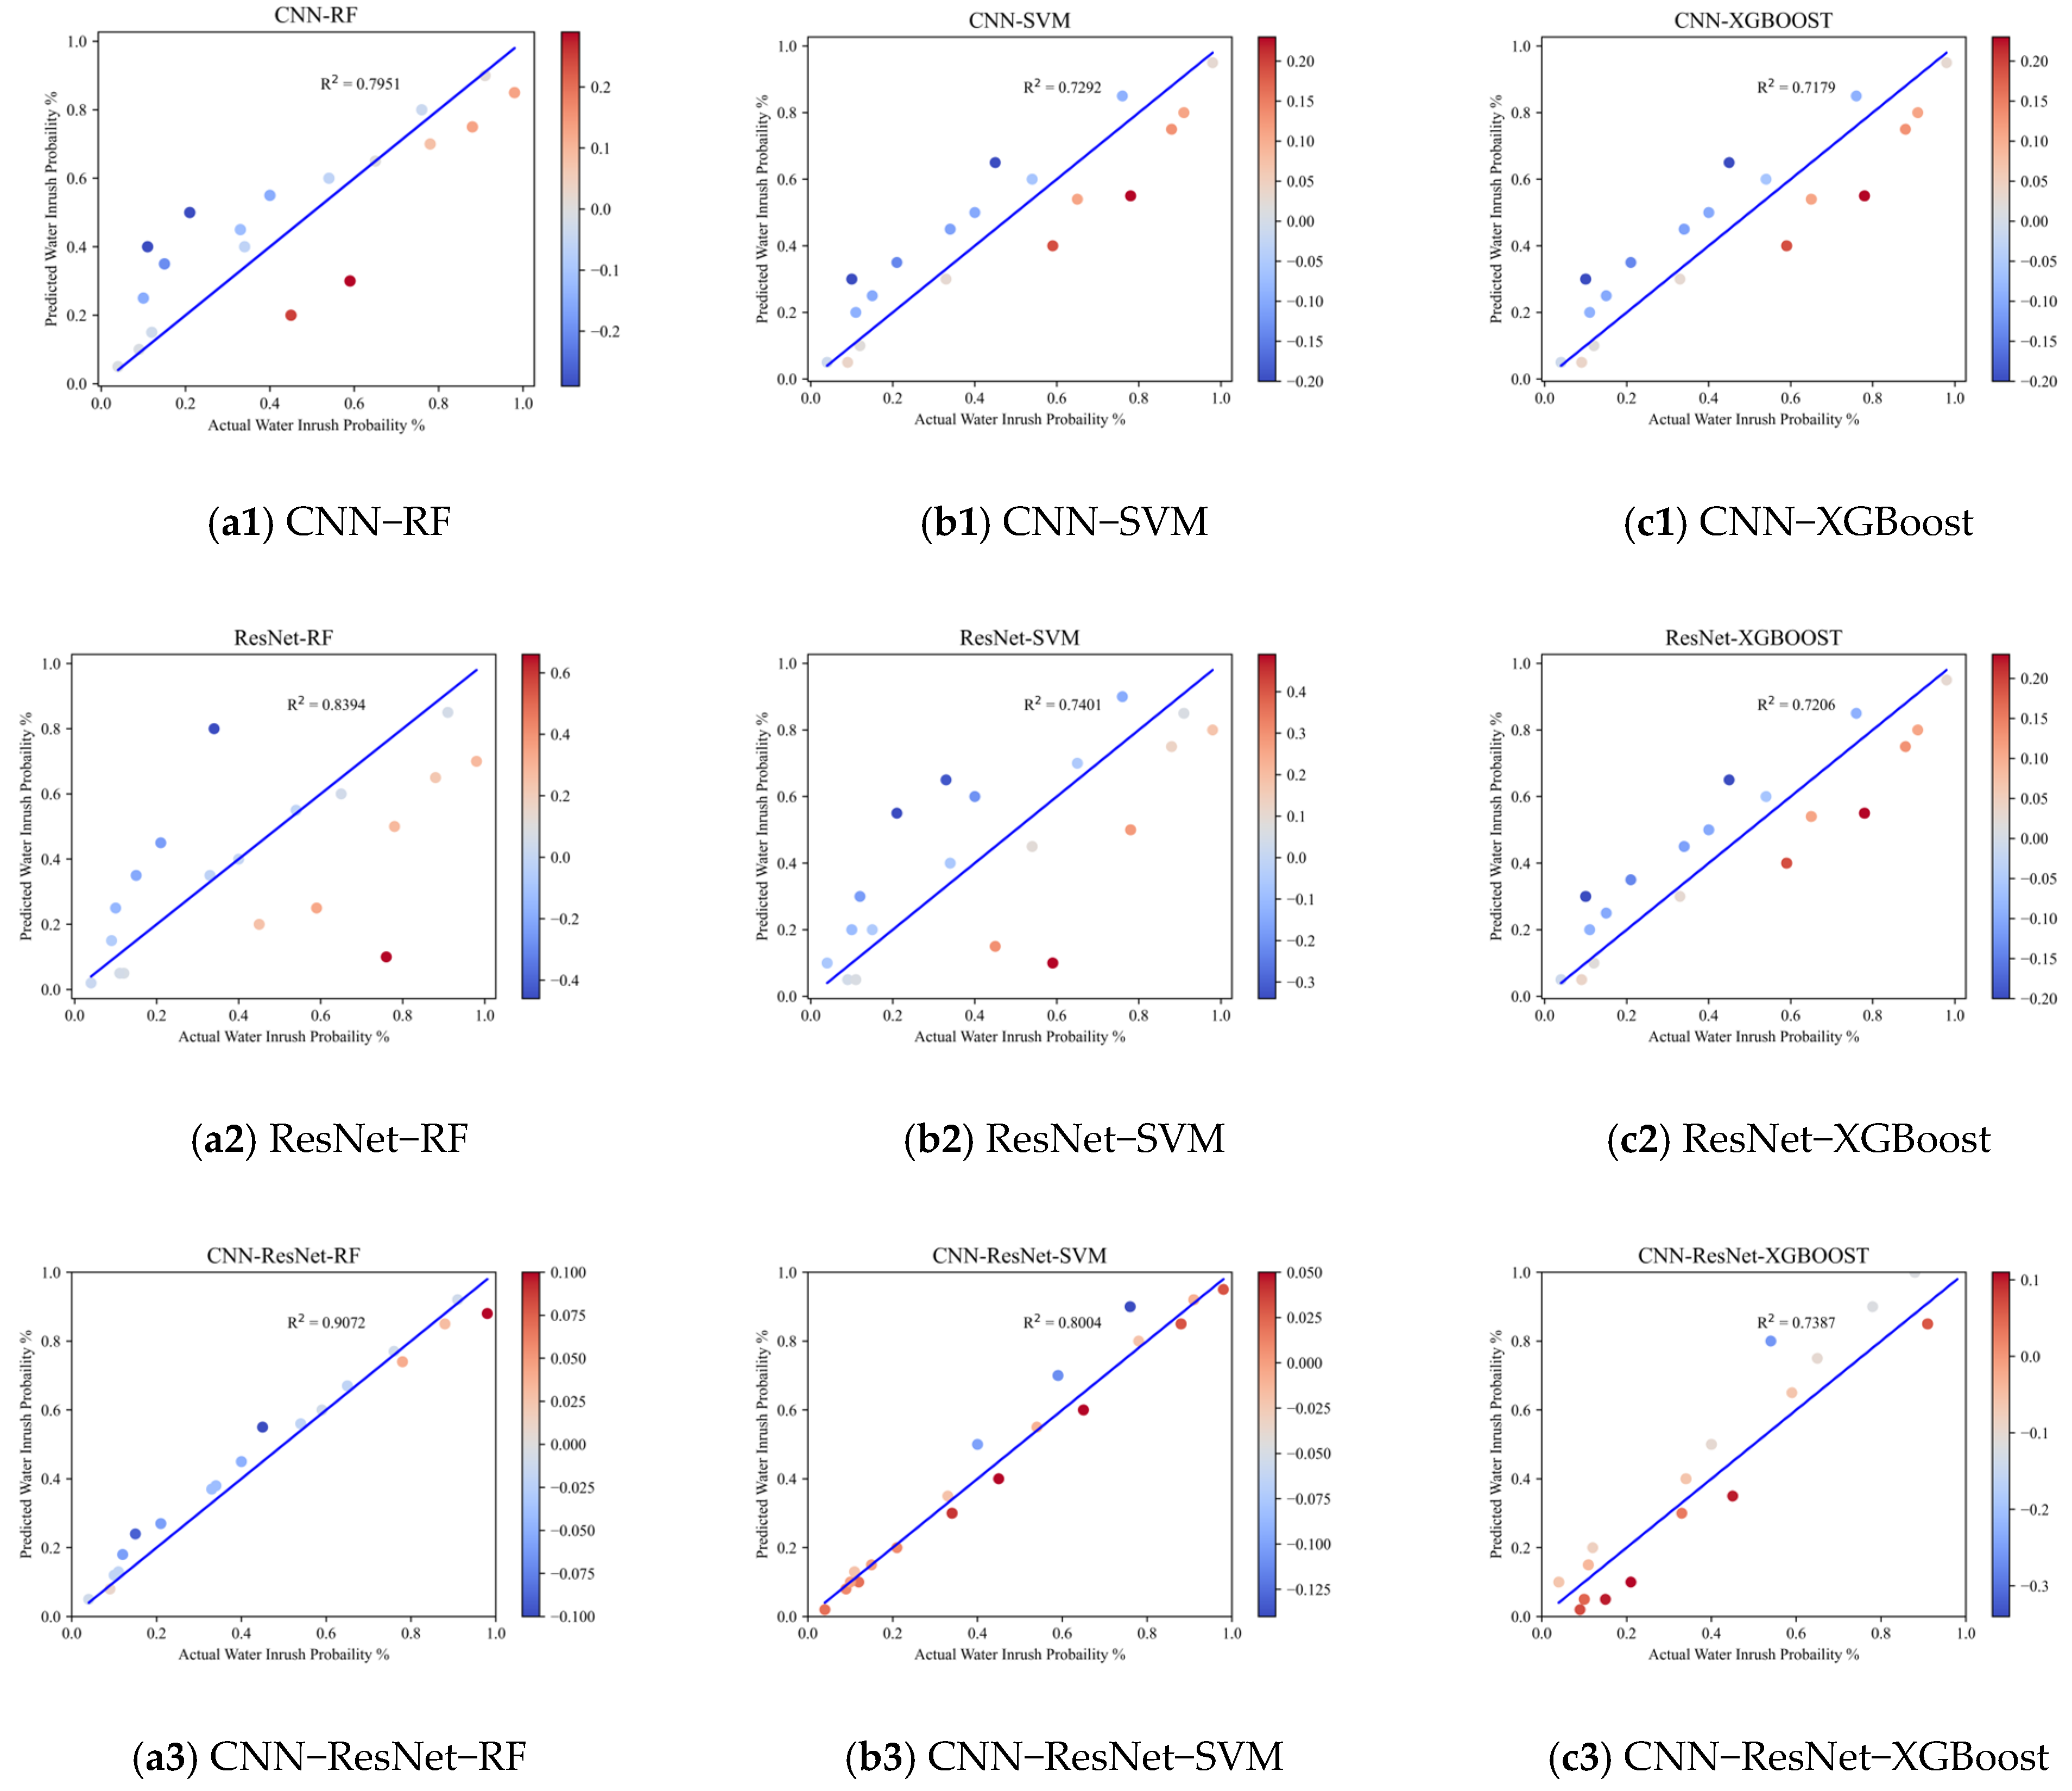
4.3. Comparative Analysis

In this study, three feature combinations (S1, S2, S3) are established based on the three scenarios proposed in Chapter 3, as shown in Table 1. The three combinations are defined as follows: S1 contains features obtained from the expanded data through CNN convolution and flattening; S2 consists of features extracted from the raw data via ResNet; and S3 represents the fused and reconstructed features.
After determining the feature combinations for the prediction model, this paper employs several commonly used artificial intelligence algorithms to analyze the reasonableness of each feature combination. The analysis is conducted using four evaluation metrics, MAE, MAPE, RMSE, and R2, to assess the model’s ability to predict pitting depth under different feature combinations. The performance metrics of the models are presented in Table 6. Among the common artificial intelligence algorithms, the predictive capability ranking for the three feature combinations is S3 > S1 > S2. Specifically, the MAE, MAPE, and RMSE of the S1 feature combination are reduced compared to S2 by 9.7%, 6.6%, and 13.2%, respectively, while R2 increases by 5.1%. In contrast, the MAE, MAPE, and RMSE of the S3 feature combination are reduced compared to S1 by 15%, 14.5%, and 17.7%, respectively, with R2 increasing by 8.4%.
From the gradient comparison of the evaluation metrics, it is evident that the CNN-ResNet feature concatenation demonstrates a significant advantage in feature extraction over the singular use of either CNN or ResNet. Feature concatenation effectively integrates the strengths of both methods: CNN excels at handling local features, while ResNet better captures deep features through residual connections. The combination leads to a richer feature representation. This fusion not only enhances the model’s expressiveness and generalization ability but also alleviates the vanishing gradient problem, thereby improving the stability of the model in deep learning contexts. Furthermore, by integrating features of varying depths and scales, the concatenation approach allows for a more comprehensive understanding of the complexity of the input data, providing the model with additional information that enhances its robustness and accuracy.
Utilizing the optimally performing S3 reconstructed features as the input set, we employed bicubic interpolation for data augmentation to extensively extract valuable information, thereby testing the predictive performance of the proposed model. The RF model served as the primary model, while XGBoost and SVM were included for comparison. Through the visualization of the models’ performance across various predictive metrics, we provided a clear comparison of model efficacy. The CNN-ResNet-RF model demonstrated superior performance across all metrics, particularly noted by its R2 value approaching 1, indicating a strong capability in explaining the variability within the data. Furthermore, it exhibited relatively low values for MAE, MAPE, and RMSE, signifying minimal prediction error. This model clearly outperformed the others in terms of predictive accuracy, showcasing an enhanced ability to fit the observed data’s changing trends and reflecting exceptional predictive capability and stability. Figure 7 illustrates the performance metrics of each model, revealing that the CNN-ResNet-RF model, augmented by data expansion, reduced MAE compared to SVM and XGBoost by 36.54% and 50.11%, respectively; it also lowered MAPE by 45.49% and 44.18%, and RMSE by 37.10% and 71.24%. These results underscore that the incorporation of data augmentation through composite models not only facilitates the self-mining of associative information within the data but also significantly improves sample distribution and diversity. Consequently, this methodological enhancement contributes to the accuracy and effectiveness of water inrush risk predictions.
The analysis of model fit is depicted in Figure 8, where each point represents a predicted probability of inrush occurrence, with the x-axis corresponding to the actual values and the y-axis reflecting the predicted values. Ideally, a well-fitting model would display points closely clustered around the 45-degree line, indicating equality between predicted and actual values. The data reveals that alternative models exhibit considerable error, with substantial fluctuations around this reference line. In contrast, the prediction points of the CNN-ResNet-RF model are situated near the 45-degree line, suggesting its excellent performance in the predictive task and affirming its status as the model with the best fit.
In terms of the effectiveness of the three feature extraction methodologies, the performance hierarchy is S3 > S1 > S2, highlighting the superior outcomes associated with feature fusion. This approach effectively taps into the varied scales of both original and augmented data to extract informative features. Following this, the feature extraction method utilizing a CNN on the augmented data also shows strong performance. The findings suggest that the application of bicubic interpolation not only enhances the data scale vertically but also facilitates interconnectivity among features within the augmented dataset. This interconnectedness maximizes the extraction of relevant data characteristics, thereby optimizing predictive accuracy.

4.4. Case Validation

The drilling data from the Yangcun Coal Mine, consisting of 20 sets of measurements across eight dimensions, was utilized as a validation dataset for the trained CNN-ResNet-RF model. This model predicted the probability of water inrush, which was subsequently integrated into a GIS. Using the Kriging interpolation method, we derived a comprehensive probability distribution of water inrush across the entire mining area. The water inrush risk levels were categorized into five safety classifications—safe zone, relatively safe zone, transitional zone, relatively dangerous zone, and dangerous zone—using the natural breaks method, with the assessments visually represented through color variation. Figure 9 indicates that the dangerous zone includes drilling points L14-3 and B34, whereas the moderately dangerous zone comprises the D66 drilling point. The transitional zone encompasses drilling points L14-2, L14-6, QD-6, and QD-8. The northern section of the mining area consists of transitional, moderately dangerous, and dangerous zones, in contrast to the southern section, which is primarily made up of relatively safe and safe zones. The most critical risk areas are predominantly located in the northeastern part of the mining area, reflecting a consistent trend of increasing danger from south to north.
The model’s predictions exhibit a high degree of concordance with actual field observations, as evidenced by the spatial alignment of areas predicted to be at high risk of water inrush with locations where actual inrush events, specifically at drilling points L14-3 and D66, have historically occurred. Furthermore, the model offers a crucial early warning system for drilling points and working faces situated within relatively dangerous zones. This predictive capability facilitates the implementation of preemptive exploratory measures, such as advanced geophysical surveying (e.g., seismic tomography, ground-penetrating radar) to delineate potential conduits for water ingress, including faults, fractures, and karst features. Crucially, it enables the timely implementation of pressure relief strategies, such as controlled drainage of confined aquifers through strategically placed boreholes. These drainage operations, designed to reduce pore water pressure within the aquifer, mitigate the driving force behind potential water inrush events. The efficacy of such drainage systems is predicated on a thorough understanding of the aquifer’s hydraulic properties, including transmissivity and storativity, which inform the optimal borehole spacing and discharge rates. By proactively identifying high-risk areas and enabling the implementation of targeted mitigation strategies, this model contributes to a more robust and proactive approach to water inrush prevention in underground coal mining operations. The integration of predictive modeling with proactive mitigation measures represents a critical step toward ensuring safer and more sustainable coal mining practices.

5. Conclusions

This study presents a novel water inrush risk prediction model grounded in data augmentation through a CNN-ResNet-RF framework. The model’s feasibility and effectiveness have been validated using case data related to water inrush incidents in mines, leading to the following conclusions:
  • A data augmentation method based on bilinear interpolation was introduced, enhancing the training set of the model. By leveraging the augmented dataset, the model effectively harnessed the information contained within the training samples, addressing the issue of insufficient sample size associated with water inrush data. The augmented dataset exhibited characteristics in terms of extrema, mean, and standard deviation that were similar to those of the original samples, ensuring the reliability of data augmentation and establishing a solid foundation for subsequent model training.
  • The features extracted from the augmented data using a CNN were seamlessly integrated with the original data features obtained through ResNet. This fusion capitalizes on the strengths of both architectures: a CNN excels at capturing local features, while ResNet, with its residual connections, effectively captures deep features. The combination produces a richer representation of features, which demonstrates a distinct advantage over employing either a CNN or ResNet in isolation for feature extraction.
  • Compared to XGBoost and SVM predictive algorithms, the proposed model based on data augmentation and CNN-ResNet-RF represents an effective and viable approach for predicting water inrush risks in mines. The R2 value is nearly 1, indicating strong explanatory power regarding data variability. The model achieved reductions in MAE of 36.54% and 50.11% compared to SVM and XGBoost, respectively; reductions in MAPE of 45.49% and 44.18%; and reductions in RMSE of 37.10% and 71.24%. Following optimization and adaptability adjustments, this methodology can also be applied for forecasting other monitoring metrics, such as maximum water inflow and the development height of water-conducting fractures, showcasing its substantial potential for broader application.

Author Contributions

Q.Z. performed the data analyses and wrote the manuscript; S.X. helped perform part of the finite element analysis. Z.P. guided the construction of the research framework. All authors have read and agreed to the published version of the manuscript.

Funding

This research was funded by the BUPT Excellent Ph.D. Students Foundation (CX20242042) and the Beijing Social Science Fund Decision-Making Consultation Key Project (20JCB015).

Data Availability Statement

The related data used to support the fundings of this study are included within the article. All authors reviewed the manuscript.

Conflicts of Interest

The authors declare no known competing financial interests or personal relationships that could have influenced the work reported in this paper.

References

  1. Acharya, B.S.; Kharel, G. Acid mine drainage from coal mining in the United States—An overview. J. Hydrol. 2020, 588, 125061. [Google Scholar] [CrossRef]
  2. Naidu, G.; Ryu, S.; Thiruvenkatachari, R.; Choi, Y.; Jeong, S.; Vigneswaran, S. A critical review on remediation, reuse, and resource recovery from acid mine drainage. Environ. Pollut. 2019, 247, 1110–1124. [Google Scholar] [CrossRef]
  3. Zhang, C.; Bai, Q.; Han, P. A review of water rock interaction in underground coal mining: Problems and analysis. Bull. Eng. Geol. Environ. 2023, 82, 157. [Google Scholar] [CrossRef]
  4. Zhang, C.; Jia, S.; Ren, Z.P.; Bai, Q.S.; Wang, L.; Han, P.H. Strength Evolution Characteristics of Coal with Different Pore Structures and Mineral Inclusions Based on CT Scanning Reconstruction. Nat. Resour. Res. 2024, 33, 2725–2742. [Google Scholar] [CrossRef]
  5. An, P.; Li, M.; Ma, S.; Zhang, J.; Huang, Z. Analysis of the thickness of the outburst prevention layer in karst tunnels under the control of compressive faults. Tunn. Undergr. Space Technol. 2024, 147, 105710. [Google Scholar] [CrossRef]
  6. Zheng, Q.; Wang, C.; Pang, L. Overburden and surface subsidence with slicing paste filling mining in thick coal seams. Front. Earth Sci. 2023, 10, 1027816. [Google Scholar] [CrossRef]
  7. Li, M.; Jiang, Z.; Liu, S.; Tong, X.; Chen, S.; Gao, Z.; Dai, Q. Research and application of response characteristics of mine transient electromagnetic perspective detection technology. J. China Coal Soc. 2024, 49, 1976–1988. [Google Scholar]
  8. Li, N.; Du, W. Enhanced Methods for Evaluating Water-inrush Risk from Underlying Aquifers: Incorporating Dynamic Weight Theory and Uncertainty Analysis Model. Water Resour. Manag. 2024, 38, 4615–4631. [Google Scholar] [CrossRef]
  9. Zheng, Q.; Wang, C.; Liu, W.; Pang, L. Evaluation on Development Height of Water-Conduted Fractures on Overburden Roof Based on Nonlinear Algorithm. Water 2022, 14, 3853. [Google Scholar] [CrossRef]
  10. Kong, H.-Q.; Zhang, N. Risk assessment of water inrush accident during tunnel construction based on FAHP-I-TOPSIS. J. Clean. Prod. 2024, 449, 141744. [Google Scholar] [CrossRef]
  11. Zheng, Q.; Wang, C.; Yang, Y.; Liu, W.; Zhu, Y. Identification of mine water sources using a multi-dimensional ion-causative nonlinear algorithmic model. Sci. Rep. 2024, 14, 3305. [Google Scholar] [CrossRef] [PubMed]
  12. Gai, Q.; He, M.; Gao, Y.; Lu, C. A two-dimensional model test system for floor failure during automatic roadway formation mining without pillars above confined water. Eng. Fail. Anal. 2024, 162, 108369. [Google Scholar] [CrossRef]
  13. Shao, J.; Zhang, Q.; Zhang, W. Evolution of mining-induced water inrush disaster from a hidden fault in coal seam floor based on a coupled stress-seepage-damage model. Geomech. Geophys. Geo-Energy Geo-Resour. 2024, 10, 78. [Google Scholar] [CrossRef]
  14. Wu, Y.; Huang, Z.; Gu, Q.; Lin, Y.; Moyo, D.; Wu, Y.; Zou, C.; Zhao, K. Experimental investigation on the pore structure and Water Inrush Evolution Law of weakly cemented fault fracture zone with different filling gradations. Geomech. Geophys. Geo-Energy Geo-Resour. 2023, 9, 162. [Google Scholar] [CrossRef]
  15. Zhang, J.; Song, Z.; Zhang, L.; Wu, S.; Wang, S.; Zhang, Y.; Dong, X.; Wang, J.; Han, Y.; Kan, B. Mechanical behaviours of bedded sandstone under hydromechanical coupling. J. Rock Mech. Geotech. Eng. 2024, 16, 1245–1261. [Google Scholar] [CrossRef]
  16. Chen, Y.; Chen, L.; Peng, Z.; Zhang, M.; Hu, Y.; Oua, Q.; Zhang, J.; Tian, Y.; Shi, X. An improved model to predict the water-inrush risk under an unconsolidated confined aquifer based on analytic hierarchy process and information value method. Geomat. Nat. Hazards Risk 2023, 14, 2236277. [Google Scholar] [CrossRef]
  17. Gai, Q.; Gao, Y.; Zhang, X.; He, M. A New Method for Evaluating Floor Spatial Failure Characteristics and Water Inrush Risk Based on Microseismic Monitoring. Rock Mech. Rock Eng. 2024, 57, 2847–2875. [Google Scholar] [CrossRef]
  18. Li, W.; Wang, L.; Ye, Z.; Liu, Y.; Wang, Y. A dynamic combination algorithm based scenario construction theory for mine water-inrush accident multi-objective optimization. Expert Syst. Appl. 2024, 238, 121871. [Google Scholar] [CrossRef]
  19. Dong, S.; Fan, M.; Guo, X.; Liu, Y.; Guo, K.; Ji, Z.; Li, C.; Xue, X. Characteristics and prevention and control techniques of typical water hazards in coal mines in Shaanxi Province. J. China Coal Soc. 2024, 49, 902–916. [Google Scholar]
  20. Liu, Y.; Ji, M.; Wang, Y.; Liu, G.; Gu, P.; Wang, Q. Fractal mechanical model of variable mass seepage in karst collapse column of mine. Phys. Fluids 2024, 36, 022031. [Google Scholar] [CrossRef]
  21. Li, B.; Wu, Q.; Yang, Y.; Wu, H.; Li, T. Characteristics of roof rock failure during coal seam mining and prediction techniques for mine water inflow in exposed karst areas. Bull. Eng. Geol. Environ. 2024, 83, 388. [Google Scholar] [CrossRef]
  22. Niu, C.; Tian, Q.; Xiao, L.; Xue, X.; Zhang, R.; Xu, D.; Luo, S. Principal causes of water damage in mining roofs under giant thick topsoil-lilou coal mine. Appl. Water Sci. 2024, 14, 146. [Google Scholar] [CrossRef]
  23. Qu, X.; Qiu, M.; Shi, L.; Han, J. The characteristics of rare earth elements in the main water filling sources of Sunan mining area. J. Clean. Prod. 2023, 428, 139472. [Google Scholar] [CrossRef]
  24. Wu, G.; Yu, W.; Guo, H.; Pan, B.; Liu, X. Investigation on water inrush fracture mechanics model based on fracture mechanics and microseismic monitoring. Ain Shams Eng. J. 2024, 15, 102587. [Google Scholar] [CrossRef]
  25. Amiri, A.F.; Kichou, S.; Oudira, H.; Chouder, A.; Silvestre, S. Fault Detection and Diagnosis of a Photovoltaic System Based on Deep Learning Using the Combination of a Convolutional Neural Network (CNN) and Bidirectional Gated Recurrent Unit (Bi-GRU). Sustainability 2024, 16, 1012. [Google Scholar] [CrossRef]
  26. Guo, Y.; Sun, H.; Liu, H.; Deng, Z. Radar Signal Recognition Based on CNN With a Hybrid Attention Mechanism and Skip Feature Aggregation. IEEE Trans. Instrum. Meas. 2024, 73, 2518913. [Google Scholar] [CrossRef]
  27. Wu, Z.; Shen, C.; van den Hengel, A. Wider or Deeper: Revisiting the ResNet Model for Visual Recognition. Pattern Recognit. 2019, 90, 119–133. [Google Scholar] [CrossRef]
  28. Gia Nhu, N.; Nin Ho Le, V.; Elhoseny, M.; Shankar, K.; Gupta, B.B.; Abd El-Latif, A.A. Secure blockchain enabled Cyber-physical systems in healthcare using deep belief network with ResNet model. J. Parallel Distrib. Comput. 2021, 153, 150–160. [Google Scholar] [CrossRef]
  29. Roy, S.K.; Manna, S.; Song, T.; Bruzzone, L. Attention-Based Adaptive SpectralSpatial Kernel ResNet for Hyperspectral Image Classification. IEEE Trans. Geosci. Remote Sens. 2021, 59, 7831–7843. [Google Scholar] [CrossRef]
  30. Ji, Z.; Zhou, M.; Wang, Q.; Huang, J. Predicting the International Roughness Index of JPCP and CRCP Rigid Pavement: A Random Forest (RF) Model Hybridized with Modified Beetle Antennae Search (MBAS) for Higher Accuracy. Cmes-Comput. Model. Eng. Sci. 2024, 139, 1557–1582. [Google Scholar] [CrossRef]
  31. Khajavi, H.; Rastgoo, A. Predicting the carbon dioxide emission caused by road transport using a Random Forest (RF) model combined by Meta-Heuristic Algorithms. Sustain. Cities Soc. 2023, 93, 104503. [Google Scholar] [CrossRef]
Figure 1. Comparison of indicator characteristics.
Water 17 00843 g001
Figure 2. Schematic diagram of the CNN.
Water 17 00843 g002
Figure 3. Structure diagram of residual block.
Water 17 00843 g003
Figure 4. Improved Structure diagram of residual block.
Water 17 00843 g004
Figure 5. Schematic diagram of RF algorithm.
Water 17 00843 g005
Figure 6. Water inrush risk prediction model based on feature reconstruction in information interconnectivity.
Water 17 00843 g006
Figure 7. Performance indicators of the model.
Water 17 00843 g007
Figure 8. Comparison diagram of the goodness of fit between the proposed model and other models.
Water 17 00843 g008
Figure 9. Probability distribution map of water inrush in the Yangcun Coal Mine.
Water 17 00843 g009
Table 1. Key indicators for predicting water inrush disasters in mines.
No.Key IndicatorData TypeUnitEvaluation Criteria
X1Development degree of Water-Conducting StructuresFloatNoneNot Developed (0.1), Slightly Developed (0.3), Moderately Developed (0.5), Developed (0.8),
Well Developed (1.0)
X2Fracture Permeability CharacteristicsFloatNoneWater-Blocking (0.1), Non-Water (0.3),
Water Storage (0.5), Water-Conducting (0.8),
Water-Rich (1.0)
X3Inclined Length
of Working Face
FloatmActual width of the working face
X4Aquifer Water PressureFloatMPaActual water pressure value
X5Monthly Advancement Distance of Working FaceFloatmActual advancement distance of the working face
X6Aquitard ThicknessFloatmActual thickness of the aquitard
X7Depth of Floor DamageFloatmActual depth of floor damage
X8Effective Thickness of Floor AquitardFloatmActual effective thickness of the aquitard
X9Percentage of Sandstone in the AquitardFloatNoneActual percentage of sandstone in the aquitard
X10Percentage of Mudstone in the AquitardFloatNoneActual percentage of mudstone in the aquitard
X11Percentage of Limestone in the AquitardFloatNoneActual percentage of limestone in the aquitard
X12Mining Height of
Working Face
FloatmActual mining height of the working face
X13Structural Water RetentionFloatNoneLow (0.1), Slightly Low (0.3), Moderate (0.5),
Rich (0.8), Very Rich (1.0)
X14Collapse PillarLogicalNonePresence of collapse pillar (1 if present, 0 if absent)
X15FaultLogicalNonePresence of fault (1 if present, 0 if absent)
X16Fracture ZoneLogicalNonePresence of fracture zone (1 if present, 0 if absent)
X17Fault DisplacementFloatmActual displacement value
X18Mining Depth of
Working Face
FloatmActual coal seam mining depth
X19Water SourceLogicalNoneMain aquifer classified as Ordovician
gray water (1 if yes, 0 if no)
X20Water QualityLogicalNoneChange in water quality (1 if changed, 0 if unchanged)
X21Water TemperatureFloat°CActual water temperature value
X22Strike Length of
Working Face
FloatmActual strike length of the working face
X23Coal Seam Dip AngleFloat°Actual coal seam dip angle
X24Coal Seam ThicknessFloatmActual thickness of the coal seam
Table 2. Expanded training set data.
X1X2X3X4X5X6X7X8X24
11.0000.500142.0001.52050.00028.00016.03011.9700.800
20.9780.505142.8961.52450.80528.84116.06211.8790.785
1580.8640.922115.5813.10190.21543.91013.17230.8082.672
1590.8450.941115.5133.12090.24344.02613.19731.0192.704
1600.8690.940115.5873.10390.20243.93413.18330.9012.653
Table 3. Quality metrics of the extended data.
No.XminXmaxXmeanXstd
X10.110.5520.186
X20.110.5620.162
X328220121.9643.805
X40.85123.2122.260
X525.818063.23640.114
X610.9618146.29334.227
X73.7324.4514.1274.902
X80161.9532.04231.729
X90.050.970.5070.210
X100.010.80.370.175
X1100.670.1230.139
X120.89.82.191.924
X130.310.5220.119
X14010.240.427
X15010.980.14
X161110
X170233.0414.365
X1810.612036.6326.770
X19010.920.271
X20010.180.384
X2118.7155.7226.7778.211
X225029058.661.151
X2333414.87.365
X240.89.82.3142.102
Table 4. CNN channel configuration.
Layer TypeOutputConvolution KernelActivation FunctionInstructions
Input Layer(None, 24, 1, 1)--Input 24-dimensional features, total of 160
Conv2D(None, 24, 1, 32)(1, 3)relu32 filters, padding = ‘same’
Batch Normalization(None, 24, 1, 32)--Normalized output
Max Pooling(None, 12, 1, 32)(1, 2)-Downsampling, selecting every two units
Conv2D(None, 12, 1, 64)(1, 3)relu64 filters, padding = ‘same’
Batch Normalization(None, 12, 1, 64)--Normalized output
Max Pooling(None, 6, 1, 64)(1, 2)-Downsampling, selecting every two units
Flatten(None, 384)--Flattening the output
Dense(None, 64)64reluHidden layer with 64 neurons
Dense(None, 8)8linearOutput layer with 8 neurons
Table 5. ResNet channel configuration.
Layer TypeOutputConvolution KernelActivation FunctionInstructions
Input Layer(None, 24)--Input 24-dimensional features, total of 160 sets
Dense(None, 64)64reluFirst fully connected layer with 64 neurons
Batch Normalization(None, 64)--Normalized output
Dense(None, 64)64reluSecond fully connected layer with 64 neurons
Batch Normalization(None, 64)--Normalized output
Add(None, 64)--Skip connection, summing input with previous layer output
Dense(None, 8)8linearOutput layer with 8 neurons
Table 6. Comparison of predicted effects.
RFSVMXgBoost
S1MAE0.62710.72610.7540
MAPE0.61640.62500.5975
RMSE0.89201.06531.0749
R20.79510.72920.7179
S2MAE0.92380.69170.7684
MAPE0.70920.62670.6394
RMSE1.36141.00111.1979
R20.83940.74010.7206
S3MAE0.46660.63710.7004
MAPE0.38800.56450.5594
RMSE0.59460.81621.0182
R20.90720.80040.7387
Disclaimer/Publisher’s Note: The statements, opinions and data contained in all publications are solely those of the individual author(s) and contributor(s) and not of MDPI and/or the editor(s). MDPI and/or the editor(s) disclaim responsibility for any injury to people or property resulting from any ideas, methods, instructions or products referred to in the content.

