Article

Ionic Speciation of Ecotoxic Lead (2+), Cadmium (2+), and Naturally Occurring Ions with Dissolved Organic Matter in Seawater from the Bay of Bengal by Differential Pulse Anodic Stripping Voltammetry, Continuous Binding Model, and Computational Chemical Equilibria: Effect of Global Warming

1
Inorganic & Analytical Research Laboratory, Department of Chemistry, University of Dhaka, Dhaka 1000, Bangladesh
2
Department of Chemistry and Biochemistry, George Mason University, Fairfax, VA 22030, USA
*
Authors to whom correspondence should be addressed.
Water 2025, 17(10), 1470; https://doi.org/10.3390/w17101470
Submission received: 21 January 2025 / Revised: 2 April 2025 / Accepted: 8 May 2025 / Published: 13 May 2025

Abstract

:
An experimental and computational methodology was developed for ionic speciation of Pb2+ and Cd2+ with dissolved organic matter (DOM) in surface seawater (SSW) from the Bay of Bengal (BoB) in eastern Bangladesh. Differential pulse anodic stripping voltammetry (DPASV) with a thin mercury film glassy carbon electrode (TMFGC) was used to measure free and DOM-bound Pb2+ and Cd2+. A continuous binding model was used to calculate the binding constants for metal ions with experimentally found complex ligands like DOM in the BoB. The ionic speciation and distribution of all major naturally occurring ions and toxic Pb2+, Cd2+, and DOM were calculated using a computational chemical equilibrium model, MINTEQA. We found that the change in pH with increasing dissolved carbon dioxide due to global warming will cause drastic changes in the bioavailability of Pb2+ by the year 2050.

Graphical Abstract

1. Introduction

The chemical speciation of trace metals (TMs), both nutrient (Cu, Co, Fe and Zn) and ecotoxic (As, Cd, Pb and Hg) types, with organic and inorganic ligands in the marine environment has been the subject of continued research interest in many disciplines of science for more than four decades [1,2,3,4]. The speciation information is essential to understand the geochemical cycling processes of TMs and their uptake mechanism by marine organisms [5]. From planktonic research, it is now evident that free metal ions rather than their organic complexed forms are more easily bioavailable, either to support aquatic life or cause toxicity [6,7]. The other factors that determine bioavailability are the pH, oxidation state, nature of complexation, and degree of hydration of the metal ion in the aquatic environment [7].
Most of the early speciation studies performed over the last four decades were focused on the North Atlantic, the Pacific Ocean, and their bays with bioactive TMs such as Cu, Co, Cd, Fe, Pb, and Zn through their complexation with dissolved organic matter (DOM) [7,8]. Recently, studies on Cd and Pb speciation in the China Sea, Cu, Cd, and Zn in Manila Bay, and the vertical distribution of Fe, Mn, Co, Cu, Cd, and Ni in the monsoon-affected East Sea (Japan) have been reported [9,10]. The main objective of these studies was to establish different analytical methodologies to measure very low concentrations (nM–pM) of chemical species in seawater, and they were involved in the analysis of free metal ions (Mn+), total metal concentration (CM), complexation capacity (Lt) with DOM, and the conditional stability constant (K′) of Mn+-DOM ligand complexes under operationally defined conditions. In most of these studies, the effect of the presence of major and minor ions in seawater on the speciation of toxic trace metals was not mentioned. No information on the effect of major ionic species present in the BoB on the speciation of trace metals and DOM was given in these and many other studies.
Most of the recent research reports on trace elements in the Bay of Bengal near Bangladesh are concerned with measuring the total concentration in marine water, their distribution between biotic and abiotic phases, and bioaccumulation in different fish species, like Hilsa, shrimp, prawns, and marine organisms like crustaceans, and zooplankton [11]. These studies showed that trace metal concentrations are in the order of Fe > Ni > Mn > Pb > As > Zn > Cr > V > Se > Cd, while in zooplankton the order is Fe > Mn > Cd > As > Pb > Ni > Cr > Zn > V > Se. Studies have found some ‘hot spots’ of high risk trace metal pollution such as Fe, Mn, As, Cr, Cu, Ni, Cd, Pb, and Zn in the eastern coastal waters and sediments of Bangladesh. In surface sediments from the Karnafuli Estuary and the adjacent coastal area of the BoB, Chattagram, the total concentration of Cd, Cr, Fe, Mn, Ni, and Pb was found to be much above the world average value for sediment quality [12]. No ionic speciation information was available in these papers. Similarly, a most recent study reported the biogeochemistry of dissolved trace metals like dissolved Fe, Mn, Pb, Cd, Cu, and Zn in the Bay of Bengal without any ionic speciation information [13].
In general, enrichment of As, Cr, Mn, Ni, Cd, Pb, and Hg exceeding the acceptable limits in several fish and shrimp species, including Hilsa fish, from the BoB has also been observed [14]. Zinc in dissolved and particulate forms and its seasonal variation have been studied in the surface water of the Rushikulya Estuary of the BoB, India [15]. In a coastal and estuarine sediments study in the central east coast of India (western BoB), the highest concentrations of Cd and Pb were found in the water-soluble fraction of sediments. The total carbon in surface sediments from the Bay of Bengal appears to control the speciation of Pb and Cd, where the source of organic carbon comes from the annual fluvial discharge into the northeast of the BoB, which is ∼10% of the world’s fluvial discharge (sediment load being ∼2 × 10¹² kg/yr.) [16,17,18]. Especially, Bangladesh, being a downstream riverine country, receives industrial effluents through the Bhola Estuary to the BoB from neighboring India through 230 rivers and streams. It is reported that approximately 8542 industries release almost untreated industrial effluents directly into the Bay of Bengal, severely impacting the economic resources of the waterbody, particularly fisheries [19].
Although progress in chemical speciation research pursued during the last decades in the major waterbodies of the world has been very profound, such studies in the Bay of Bengal (BoB) and the Indian Ocean are very limited. In this work, we focused on the speciation of Pb2+ and Cd2+ in a specific area of the Bay of Bengal because of its proximity to a major industrial zone in Bangladesh. The sampling point was located about 12 km away from the coast (22.4° N, 91.6° E, see Supplementary Materials Figure S1). The seawater was titrated with the respective metal ions using differential pulse anodic stripping voltammetry (DPASV) with a static thin mercury film electrode to measure the conditional binding constants of the DOM ligands with the metal ions, free metal ion concentrations, and the complexation capacity. These data along with the chemical composition of the BoB water (major and minor ions, pCO2, and pH) were used in the computational chemical equilibrium model (MINTEQA) to elucidate the speciation and distribution of major, minor, and trace ionic species. The bioavailable fractions of potentially toxic Cd2+ and Pb2+ were calculated from the labile and bound fractions [20]. Finally, the effect of pH changes due to global warming on the bioavailability of free metal ions to sustain water quality was forecasted for the year 2050; the base year is 2000.

2. Continuous Binding Model for Metal Speciation with Dissolved Organic Matter (DOM)

The average number, θ , of ligand L (or DOM) bound to metal ion Mn+ in a very dilute solution, assuming no inter-site interactions, can be written as follows [21]:
θ = [ M L ] t [ L ] t = j F j ( K j M / ( 1 + K j [ M ] ) )
M L t = j [ ( [ L ] j   K j M ) / ( 1 +   K j M ) ]
[ L ] j = [ L ] t [ F ] j   a n d   [ M L ] t = [ M ] t M   a n d   [ L ] t = L + [ M L ] t
where, jF is the fraction of site j, [M] is the free metal ion concentration, [ML]t is the total concentration of the free metal-ligand (DOM in this case) complex, j[L] is the concentration of free ligand of characteristic site j, and jK is the binding constant of the metal with ligand site j. The summation sign, Ʃj, represents the linear combination of j site binding equilibria. The general mass balance for the ligand and metal is shown in Equation (3). The above general equations describe the distribution of species with characteristic site concentration and equilibrium constants. Here, [M] is a measurable quantity from DPASV experiments. If [M]t is the total analytical concentration, [ML]t can be found from Equation (3). Therefore, a plot of [ML]t vs. [M] can be fitted to Equation (2) and j[L]t and jK are found. jK is not an intrinsic thermodynamic constant unless the ligand is simple, which is not the case here. Most importantly, the variation in jF as a function of binding free energy, ∆G= −RT ln(jK), represents the fractional distribution of site j as a function of their affinity for Mn+, known as the ∆G affinity spectrum. The variation in jF as a function of log jK is the distribution of complexing sites as a function of their affinity for M. A simpler linear form of Equation (1) with one site can be derived and found elsewhere [7].

3. Material and Methods

3.1. Methodology and Instrumentation

The differential pulse anodic stripping voltammetric (DPASV) principle with a thin mercury film on glassy carbon (TMFGC) electrode (3 mm diameter) was applied in this study [22]. A computerized electrochemical analyzer (Model HQ-2040, Advanced Analytics, VA, USA) was used to carry out all voltammetric measurements at ambient temperature (26 °C). A three-electrode Pyrex electrochemical cell of 25 mL capacity with a Teflon cap was used to collect all voltammetric data. The TMFGC was used as the working electrode (WE), Pt wire as the counter electrode (CE) and Ag/AgCl, 3 M KCl as the reference electrode (RE). A Ross combination pH electrode (Orion, MA, USA) was used for the pH measurements.

3.2. Electrode Preparation

The GC electrode was carefully polished with fine alumina powder (0.3 µm or lower) using a wet polishing cloth for 5–10 min to obtain a dirt-free shining glassy surface. To minimize background current, the polished GC electrode was conditioned with square pulses between −1000 to +1000 mV in acidic 1 M KNO3 solution. The sensing electrode (TMFGC) was freshly prepared each day by pre-plating the mercury film on GC from a 2 mM HgCl2 solution at −400 mV vs. RE for 200 s in an oxygen free environment, established by purging the solution with pure nitrogen (99.87%) under stirring conditions. After film deposition, a DPASV scan was performed from −400 mV to 0 mV to clean the Hg film by oxidizing the residual metals in this potential window.

3.3. Reagents

All reagents (KNO3, HNO3, HgCl2, etc.) used were of analytical grade (Extrapure quality, BDH/E Merck, Darmstadt, Germany). The glassware, electrodes, electrochemical cells, and high-density polyethylene and polypropylene wares were first cleaned with tap water, then washed with metal-free detergent solution, then soaked in 2 M HNO3 for three days, and then finally washed with distilled deionized water (Ὠ > 17.8 M) and used for reagent preparation and rinsing. Standard solutions of 10 µg L−1 of Pb2+ and Cd2+ were prepared from AAS—CRM standard solutions (1000 µg L−1 in 1 M HNO3) from Aldrich, London, UK.

3.4. Seawater Collection and Storage

The acid-cleaned one-liter polyethylene bottles were rinsed with seawater before collection. The sampling point was located about 12 km away from Kumira Shipghat, on the Shitakunda coast (22.4° N, 91.6° E, see Figure S1). The seawater samples were collected with a grab sampler from a sampling site at a depth of 1 foot from the surface. This location was of interest due to its proximity to steel mills and large ship breaking yards, which are known to be a major source of heavy metal pollutants such as Hg, Pb, and heavy residual oil waste in coastal waters [23]. The samples were filtered within 24 h in the laboratory through 0.45 µm filter paper (Millipore, Darmstadt, Germany) to remove all organic and inorganic particulate matter and stored in a refrigerator at 4 °C until analysis. All experiments were completed within a month. All necessary precautions were taken in the steps of sample collection, transport, processing, storage, and analysis to minimize sample contamination.

3.5. Analytical Procedures

All voltammetric measurements in this work were carried out using 10.0 mL aliquots of the samples in a 25 mL Pyrex glass cell. Dissolved oxygen was removed from the samples by purging with high-purity nitrogen (99.87%) for 10 min. The deposition potential for the thin mercury film on GC was generally −800 mV vs. RE. In a model solution of 0.7 M KNO3 as the supporting electrolyte, the detection limit (3σ) of the method was calculated to be 2 µg L−1 for Cd2+, with a plating time of 150 s and deposition potential of −800 mV vs. SSC. With this technique, Cd2+ in the BoB sample was found to be present below the detection limit. A higher deposition potential (−900 mV vs. SSC) was used for Cd2+, particularly when the peak potential of Cd species was more negative than E0. The deposition periods were 150 s for Cd2+ and 300 s for Pb2+; the quiet period was 30 s after deposition. The current response was found to be linear with the concentrations of metal ions at the selected deposition potential [17]. Other conditions were as follows: pulse height, 5–20 mV; pulse width, 50 ms; delay between pulses, 250 ms; and scan rate, 25 mV/s. A concentration calibration of Pb2+ and Cd2+ in 0.7 M KNO3 (ionic strength, I = 0.7 M) was established to calculate the free concentrations of Pb(aq) and Cd(aq) (Supplementary Materials Table S1). In BoB surface water, Pb2+ in the dissolved state was found to be 22.5 ± 2.5 μg L−1. The salt concentration of the BoB and the natural ionic strength of ca. 0.8 M did not require the addition of electrolytes to perform the electrochemical experiments. To measure the metal complexation capacity, a known amount of metal ion was added to 10 mL of BoB seawater each time to titrate the DOM, and the voltammograms were recorded after the equilibration time. The equilibration time was selected when there was no change in peak current, according to reference [24] (data shown in Supplementary Materials Table S2). The equilibration time for Pb2+ complexation with DOM was relatively longer. So, to ensure complete equilibration, the initial sample was left overnight, after the addition of a known amount of Pb2+ in each titration (5 μg L−1). For the Cd2+ binding capacity, 3 μg L−1 of Cd2+ was added to 10 mL of seawater each time to titrate the DOM, and the voltammograms were recorded after 1200 s of equilibration time.

3.6. Computational Ionic Speciation Calculation by Minimization of Total Equilibrium Activity (MINTEQA) Model

The chemical speciation of major, minor, and trace species of Pb and Cd with inorganic and organic ligands (dissolved organic matter, DOM) present in the BoB was performed using the computational chemical equilibrium program known as Visual MINTEQA 3.1 based on U.S. EPA model MINTEQA2. It was developed in the early 1980’s at Battelle Pacific Northwest Laboratory in cooperation with the U.S. Department of Energy and the U.S. EPA [25]. The open source program and extensive documentation can be found at https://vminteq.com/download/ (accessed on 2 July 2023). Of importance in this model is the inclusion of the database containing equilibrium constants, enthalpies of complexation, etc. for ionic speciation in the presence of dissolved organic matter. Since free energy is a measure of the thermodynamic activity of a substance, the goal of MINTEQA is to minimize the total free energy of the system by computing the equilibrium distribution of species under given conditions.

4. Results and Discussion

4.1. DPASV Analysis of Cd2+ and Pb2+ in BoB Water

The concentrations of dissolved Cd2+ and Pb2+ in BoB water were found to be <2 μg L−1 and 22.5 μg L−1, respectively. The perceptibly high Pb2+ concentration was not due to system contamination because a concentration calibration of Pb2+ in 0.7 M KNO3 yielded a background Pb2+ of 2.5 ± 1.6 μg/L. The characteristic DOM binding to Cd2+ and Pb2+ in BoB water was measured by titrating the DOM with Pb2+ and Cd2+. In the process, the DPASV peak currents were measured. Figure 1A shows an example of the corresponding DPASV signals for Cd2+ during this titration.
Figure 1B shows the perceptible change in peak current after the addition of 9 μg/L. The nonlinear nature of the titration curve showed the binding of Cd2+ with some DOM in seawater. The absence of distinct linear portions in the graph indicated that the binding was not simply 1:1 Cd2+:DOM. A second-degree polynomial was fitted to interpolate the experimental peak currents to use in a four-parameter equation for two binding sites, as mentioned earlier. These values were used to calculate the free metal concentration, [M], from the concentration calibration, and the total bound metal concentration, [ML]t, from the analytical concentration of metal ion added, [M]t, for further data fitting into Equation (2). The binding constant and the concentration of binding sites were extracted using SOLVER, a nonlinear data fitting program readily available from MS Excel. In SOLVER, the sum of the squares of the residuals (SSQR) and the standard deviation, Ʃi ([ML]t,expt − [ML]t,calc)2/n)1/2, are minimized until the values of the two parameters, j[L] jK and jK, are optimized. j[L] and jK are calculated from the optimized parameters. For (two binding sites) j = 1, 2, therefore Equation (2) is expanded into two terms. Hence, the formation of 1:1 (ML1) and 1:2 (ML2) complexes with a single type of site was considered. The fitted data are shown in Figure 2 and the results are summarized in Table 1.
Figure 2B and Table 1 show that Cd2+ with the two-site model fit the data better (R2 = 0.98) than with the one-site model (R2 = 0.92) (Figure 2A). The total ligand concentrations for one site, L1, and for two sites, (L1 + L2), were about the same. Similarly, within experimental error, the K1 and K2 values were about the same for the one- or two-site model. This was indicative of an indifferent site chemistry for Cd2+ binding. Similarly, the two-site model for Pb2+ fit the data much better (R2 = 0.99) than the one-site model (R2 = 0.97) (Figure 2C,D). Thus, we considered that the two-site model was appropriate and realistic for a complex ligand like DOM in the BoB over the one-site model [7,26]. Based on this argument, we considered that the free ligand concentration was the sum of (L1 + L2), i.e., 66.4 ± 4.0 nM for Cd2+ and 449 ± 5 nM for Pb2+. Table 1 shows that, for Pb2+, the weaker DOM sites (lower K value) comprised 70% of the total sites, while for Cd2+, 90% of the sites had the same K value. Table 2 compiles the literature values and that of our measurements. It shows that our K values for both metals were 2–3 orders of magnitude lower and, consequently, the ligand site concentrations were much higher than the literature values. These values were indicative of the characteristic concentrations of sites bound to Pb2+ or Cd2+. They did not reflect the total concentrations of DOM in respective ocean waters. The known DOC (dissolved organic carbon) values (34–80 µmol DOC/kg) in oceans around the world are orders of magnitude higher than the values converted from DOM in Table 2. In the same manner, clearly, the sampled DOM at the specific BoB sites could be very different from that around the world, as listed. The high values of DOM in the BoB may come from the multitude of river tributaries flushing into the BoB, which has both anthropogenic and geogenic DOM.
With a value of 449 nM DOM and assuming 50% C in DOM and MW 1000 Da, the dissolved organic carbon (DOC) value was 17.5 µmol DOC/kg in BoB water or 210 µg DOC/kg. This value was half the lower bound for total DOC in the open sea (500–1200 µg DOC/L) [27]. It was reported that there is 34–80 µmol DOC/ kg in tropical and subtropical ocean systems (40° N to 40° S) with vertical stratification [28]. Our value was far above the value of 5 µg DOC/L obtained from that of surface phytoplankton population-derived organic carbon. It is also known that, compared to the surface DOC concentration of the world’s oceans, BoB surface water generally has a higher DOC concentration (75–100 μM), which is attributable to the high DOC content of the riverine flux [29]. Consequently, the DOM in the BoB comes from fractions containing less than 25% carbon. This is a characteristic value obtained with Pb2+- and Cd2+-bound ligands, the sources of which are unknown but their interactions are specific to the metal ions. Whether it comes from the phytoplankton domain remains to be validated. This was further examined in the MINTEQA calculations. Considering these arguments, we used the calculated DOM values as inputs into the MINTEQA speciation of metals with DOM and other major inorganic ionic species in the BoB.
Table 2. Complexation capacity and conditional stability constants of trace Pb2+ and Cd2+ in different seawaters measured by electrochemical and spectroscopic techniques a.
LocationMetal Ion (M2+)Free Metal Ion
[Mn+]
Metal Binding Capacity (nM)Conditional Stability Constant,
(log K, M−1)
Method
Central North Pacific
[8]
Cd20 fM (surface) 22 pM (600 m)0.1 nM (surface to 175 m)12.0DPASV
North Pacific and Southern Atlantic Ocean
[30]
Cd0.864 pML2: 0.147
L1: ND
L1: 11.5 ± 0.7
L2: 10.2 ± 0.2
AdCSV
Southern Yellow and Bohai Seas, China
[9]
Cd0.8–4.0 pMCdL: 0.38–0.5810.8–12.4ICP-MS
and ASV (HMDE)
Narragansett Bay Estuary, USA
[31]
Pb0.4–1.0 pM0.60–1.09.6–10.4ASV
San Francisco Bay
[32]
Pb0·3 pML1 = 0·89 ± 0·35
L2 = 12·8 ± 2
PbL1: 10.5 ± 3
PbL2: 10.6 ± 4
DPASV (TMF-RGCDE)
Southern Yellow and Bohai Seas, China
[8]
Pb0.2–2 pM0.052–109.6–10.4ICP-MS
DPASV (HMDE)
Eastern
North Pacific
[33]
Pb~0.4 pM0.2 and 0.59.7DPASV
Bay of Bengal, Bangladesh
(This work)
Pb22.5 μg L−1L1 = 130 ± 2
L2 = 319 ± 4
PbL1: 8.7 ± 0.4
PbL2: 7.2
DPASV-
GCTMF
Bay of Bengal, Bangladesh
(This work)
Cd<1 μg L−1L1 = 63 ± 4
L2 = 3.4 ± 0.6
CdL1: 7.3 ± 0.4
CdL2: 7.3
DPASV-
GCTMF
Notes: a Explanation of acronyms: ASV: anodic stripping voltammetry, DPASV: differential pulse anodic stripping voltammetry, TMF: thin mercury film electrode, DPASV-GCTMF: differential pulse anodic stripping voltammetry with a glassy carbon thin mercury film electrode, HMDE: hanging mercury drop electrode, AdCSV: adsorptive cathodic stripping voltammetry, RGCDE: rotating glassy carbon disc electrode, ICP-MS: inductively coupled plasma mass spectrometry.

4.2. Speciation of Metal Ions in BoB Water and Bioavailable Fraction of PTE

Table 2 and Cd2+ in the presence of L, where L is the dissolved organic matter designated as DOM, were used in a computational chemical equilibrium program, MINTEQA. It has the available database for inorganic chemical equilibria, including a repertoire of organic ligands and DOM, as mentioned earlier. In the MINTEQA model, the input concentrations of ions and DOM are critical. The first group of inputs was the major and minor ions in BoB water obtained from the literature [28], the second group was the concentration of Pb2+ present in BoB water and for Cd2+ its quantitation limit, and the third group represented the bulk properties, such as temperature, pH, pCO2, and the ionic strength. Here, the MINTEQA model was used to calculate the bioavailable fraction of labile toxic metal ions as the sum of free metal ions, inorganic, and weak metal complexes, excluding colloidal and particulate species [34]. Finally, MINTEQA was used to understand and forecast the speciation of Cd2+ and Pb2+ based on the change in ocean pH and pCO2 as a function of global temperature rise.

4.3. General Input Parameters for MINTEQA

The input parameters included the composition of the BoB water’s major, minor, and trace constituents and partial pressure of CO2 (g), which were obtained from the literature [35,36]. The composition of BoB seawater is like that of the world oceans’ average, but slightly higher in major species due to its semi-confined location. The temperature and pH were measured during sampling. There are two options for DOM in MINTEQA: D-DOM and DOM1000. D-DOM is the default option, where the charge on DOM is based on a fixed database value, and DOM-1000, with MW 1000 Da and 50% organic carbon, is the option where the charge on DOM is calculated based on speciation. These are primarily fulvic acid models [37]. Although there is very little difference between the two DOMs, as we have shown with an example speciation of Cd2+ (Figure S3), DOM-1000 is a better option with a given percent of organic carbon (50%), molecular weight (1000 Dalton), and the charge assigned based on speciation. The calculated DOM-1000 hereafter is called DOM. The experimentally calculated metal-DOM equilibrium constants for Pb2+ and Cd2+ from the previous section were used for the speciation calculation. The MINTEQA inputs for major inorganic ionic components in BoB water are shown in Table 3.
With these inputs (Table 3), together with pCO2 in the base year 2000, the MINTEQA calculation yielded 72 species, of which 5 were DOM species and 43 were mineral species. The MINTEQA notation, the corresponding chemical formula, and names of water-soluble species are shown in Supplementary Materials Table S3. Four of the mineral species had a solubility product index (SI) > 0, which were aragonite, calcite, and two dolomites (ordered and disordered). These are listed in Supplementary Materials Tables S4 and S5. The calculated ionic strength was 0.6 M, and the charge difference was 0.1–0.5%, which was indicative of balanced anionic and cationic charges that remained constant throughout the calculation. All speciation calculations were performed with Cd2+ and Pb2+ separately in the presence of major inorganic ions and the highest DOM found experimentally with each heavy metal ion.

4.4. Cd2+ Speciation

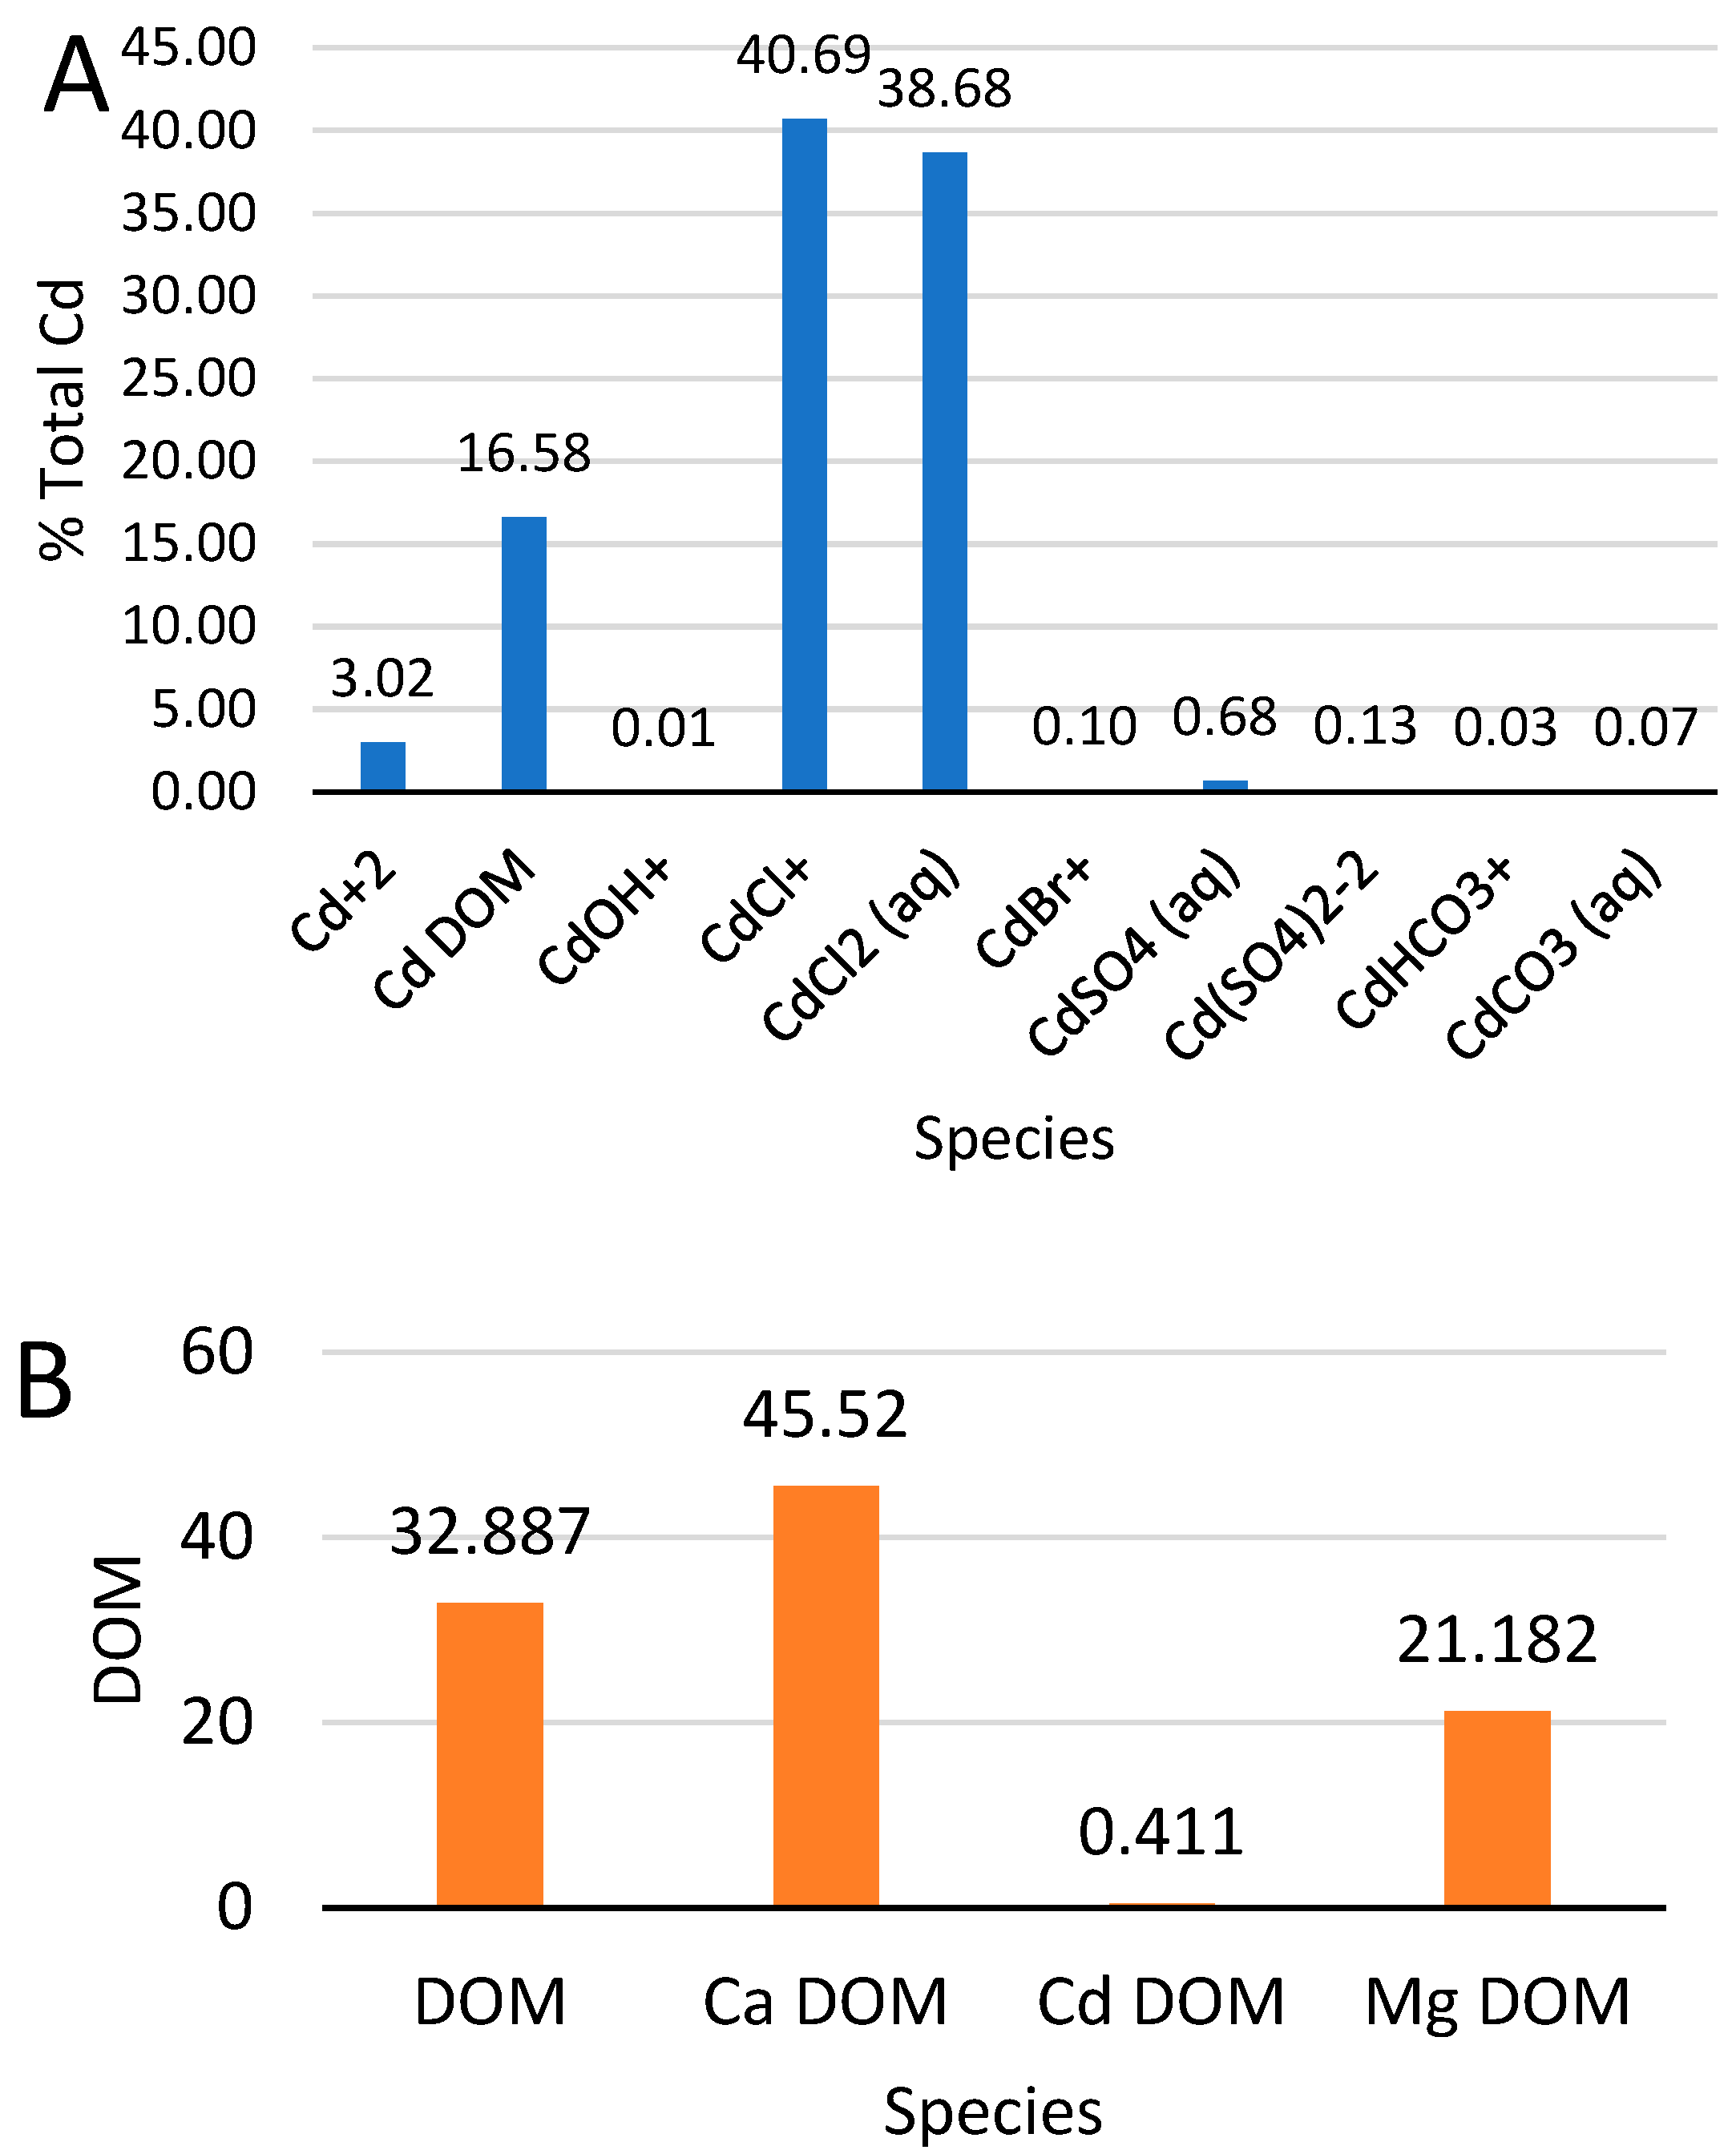
The MINTEQA speciation calculation for Cd2+ was performed with the quantitation limit (9 µg/L) of the metal and the highest DOM found from the experiment in the presence of major and minor ions in the BoB at a fixed pH, pCO2, and temperature. The mass balance for Cd2+ before (80.06 nanomolal or 9 µg/L) and after MINTEQA speciation (i.e., combining all Cd species) (80.07 nanomolal) with an error of 0.01% showed the accuracy of the method. Figure 3A shows the percent distribution of Cd species. It shows that about 16.6% of the total Cd2+ was bound to DOM in the BoB compared to 75 ± 10% in the Yellow and Bohai Seas in China [9]. The later study did not consider Ca2+ and Mg2+ bound to DOM. Assuming the Cd-DOM species were not readily bioavailable due their slow kinetics of transport, the electrochemically labile and bioavailable Cd species comprised 82% of the total in this region, and they comprised 83% in BoB surface water, which was not significantly different.
Figure 3B shows the distribution of DOM species in the presence of Cd2+ and two other major cations (Ca2+ and Mg2+) in seawater. It shows that the major DOM species were Ca-DOM and Mg-DOM. Among DOM species, 0.41% of DOM was bound to Cd2+ and a significant portion (33%) was free ions. The majority of DOM was in the free deprotonated state at BoB pH 8.1. The concentration of DOM species was found to be in the order of Ca-DOM > DOM > Mg-DOM >> Cd-DOM. This order also reflected the order of bioavailability of metal species. The high concentrations of free Ca+2 and Mg+2 dictated the presence of high fractions of DOM species, despite their low thermodynamic binding constants (log K: Ca-DOM 2.4 > Mg-DOM 1.4 compared to Cd-DOM 7.3). The calculated log K = 7.5 of Cd-DOM from MINTEQA was close to the experimental log K = 7.3 ± 0.4.
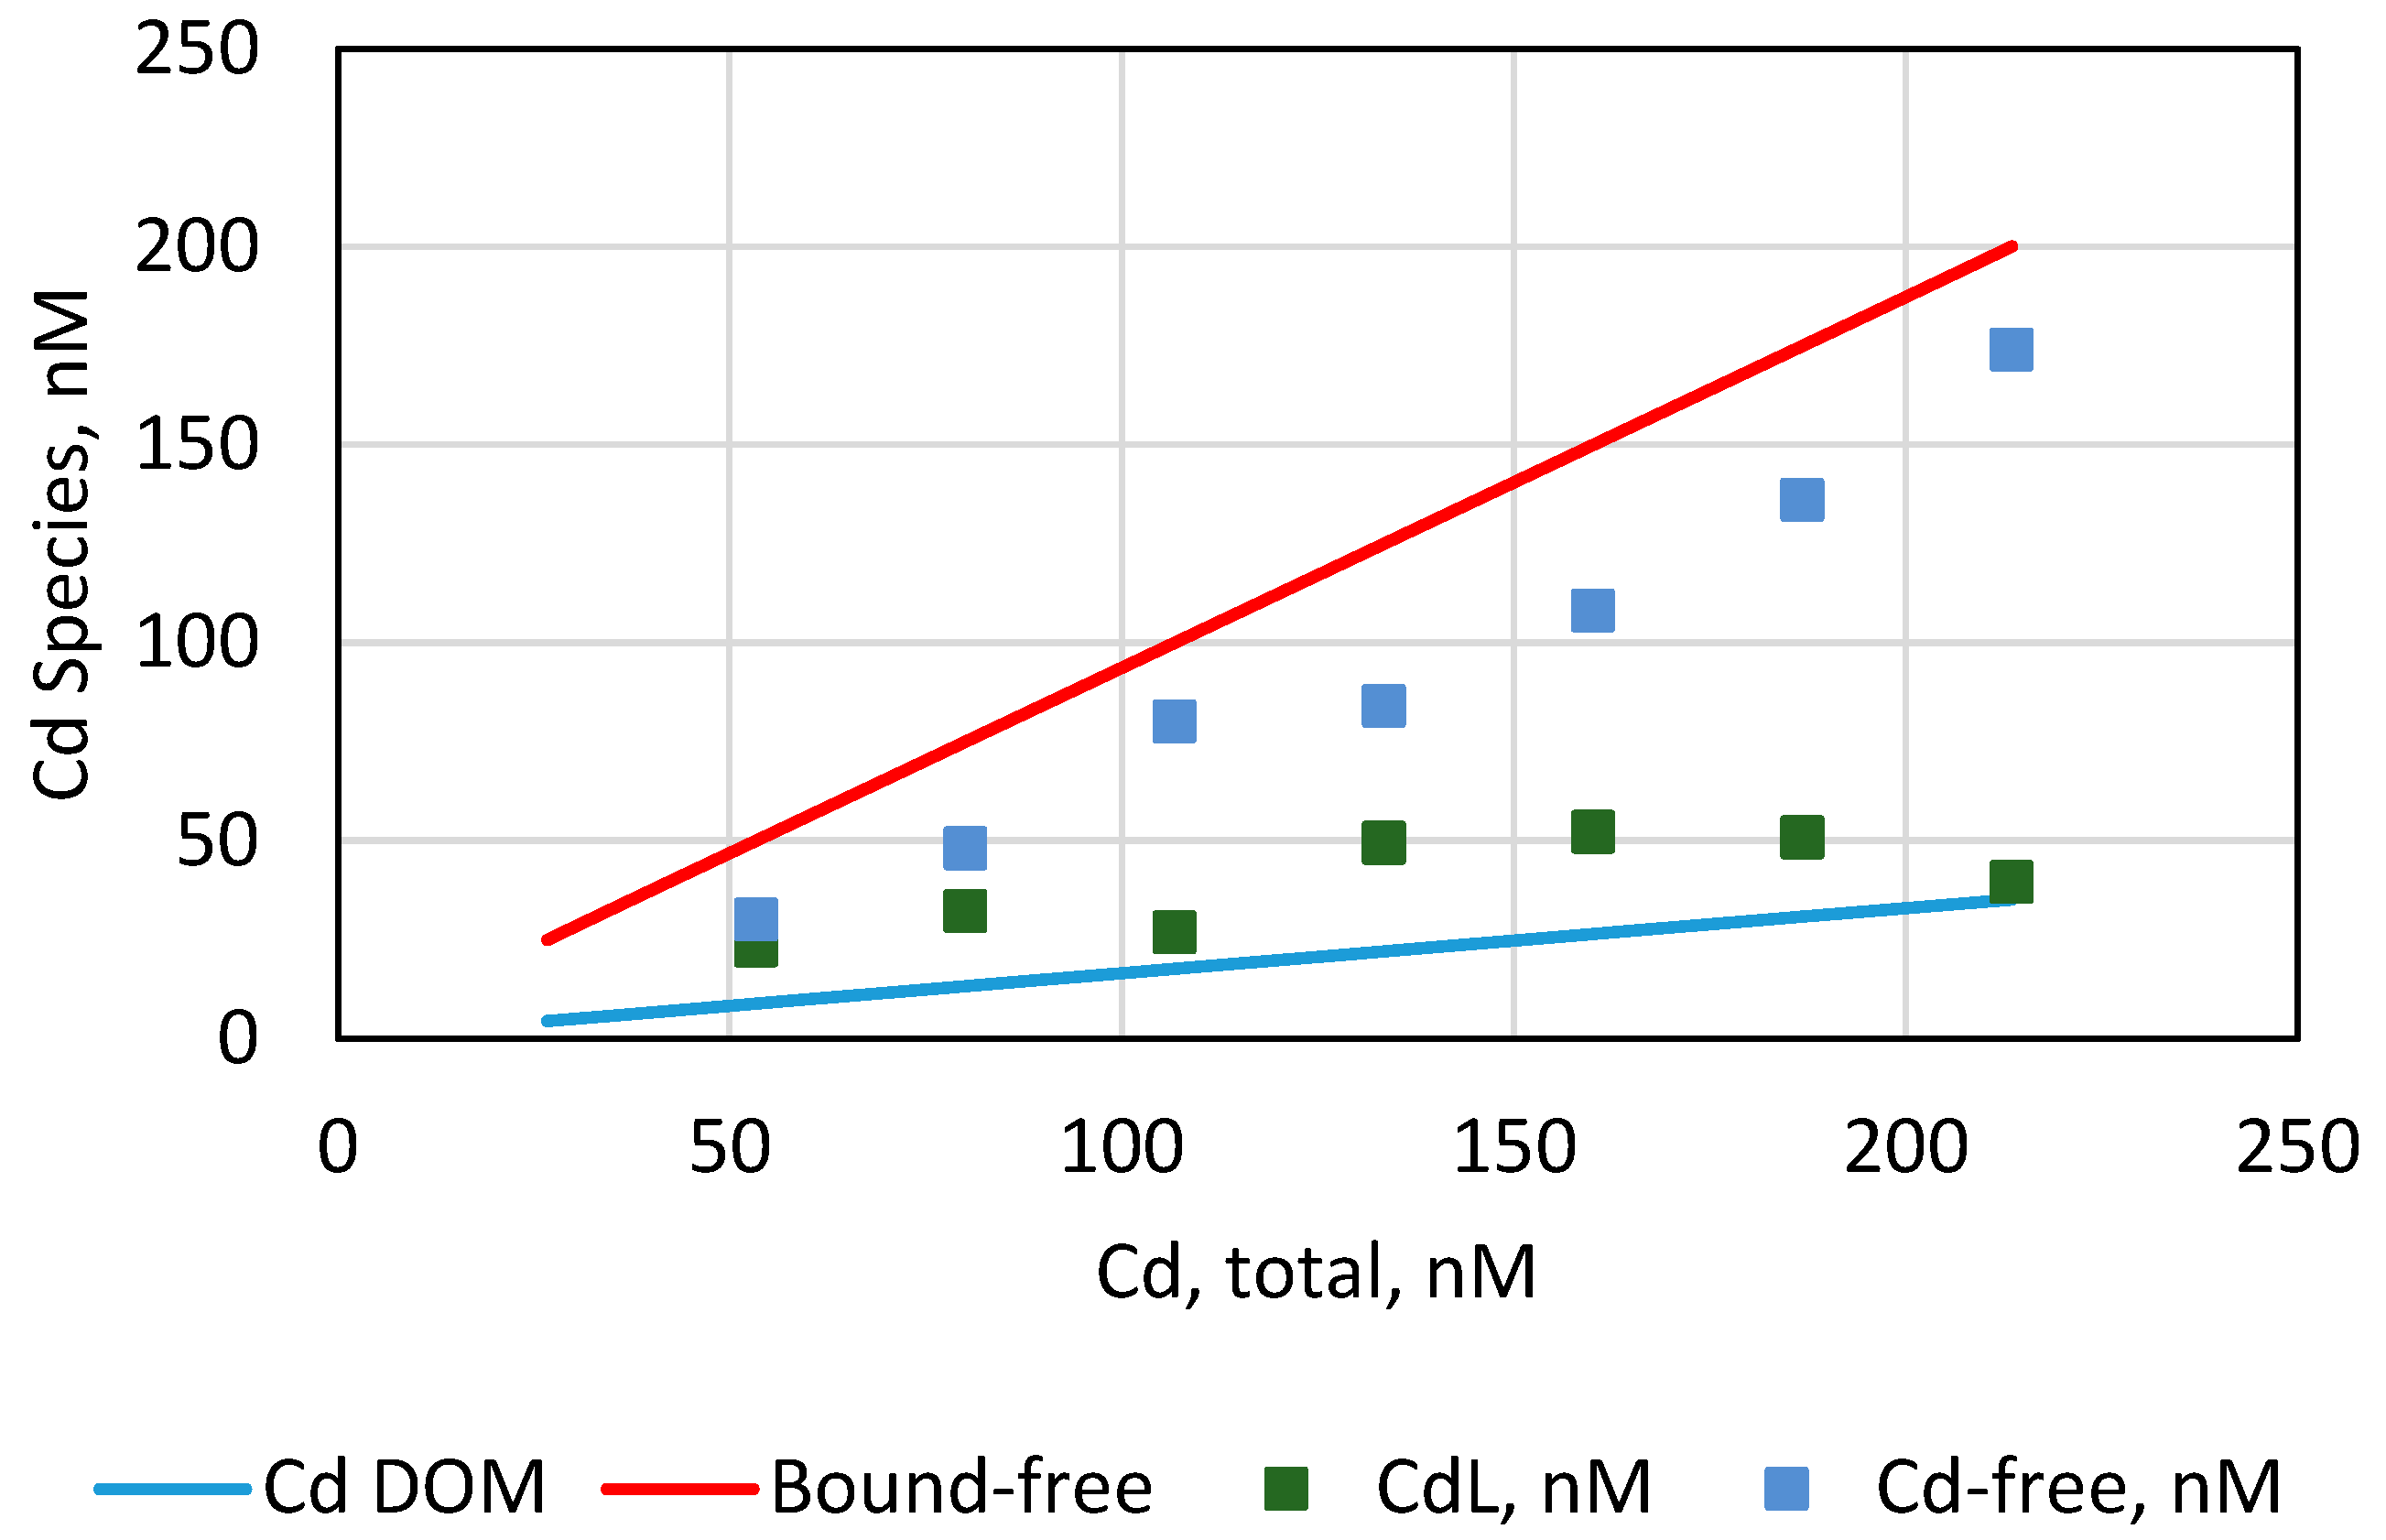
To compare the experimentally found free and bound Cd2+ data with the MINTEQA-calculated values, the program was run with different concentrations of added Cd2+ during titration, like that of the experimental values (27–213 nM Cd2+). The Cd species distribution data are summarized in Table 4. The results are illustrated in Figure 4.
Figure 4 demonstrates that the MINTEQA-calculated Cd-DOM was closer to the experimentally measured Cd-DOM. Here, the MINTEQA-predicted bound Cd species was found to be closer to the experimental Cd-DOM at low total Cd concentrations but deviated further at high total Cd. The experimental data showed that most of the Cd remained free in BoB water. But the MINTEQA calculation found that most of the Cd was bound to labile inorganic ligands like Cl as CdCl+ and CdCl2 (aq) and as such were detected by DPASV titration as free Cd2+. Our conclusions were similar to the published results that Cd2+ measured by ASV (anodic stripping voltammetry) wase non-labile complexes with organic ligands due to Cd2+ d10 but thermodynamically less stable, as shown by its lower K value compared to that of Pb2+ [38].
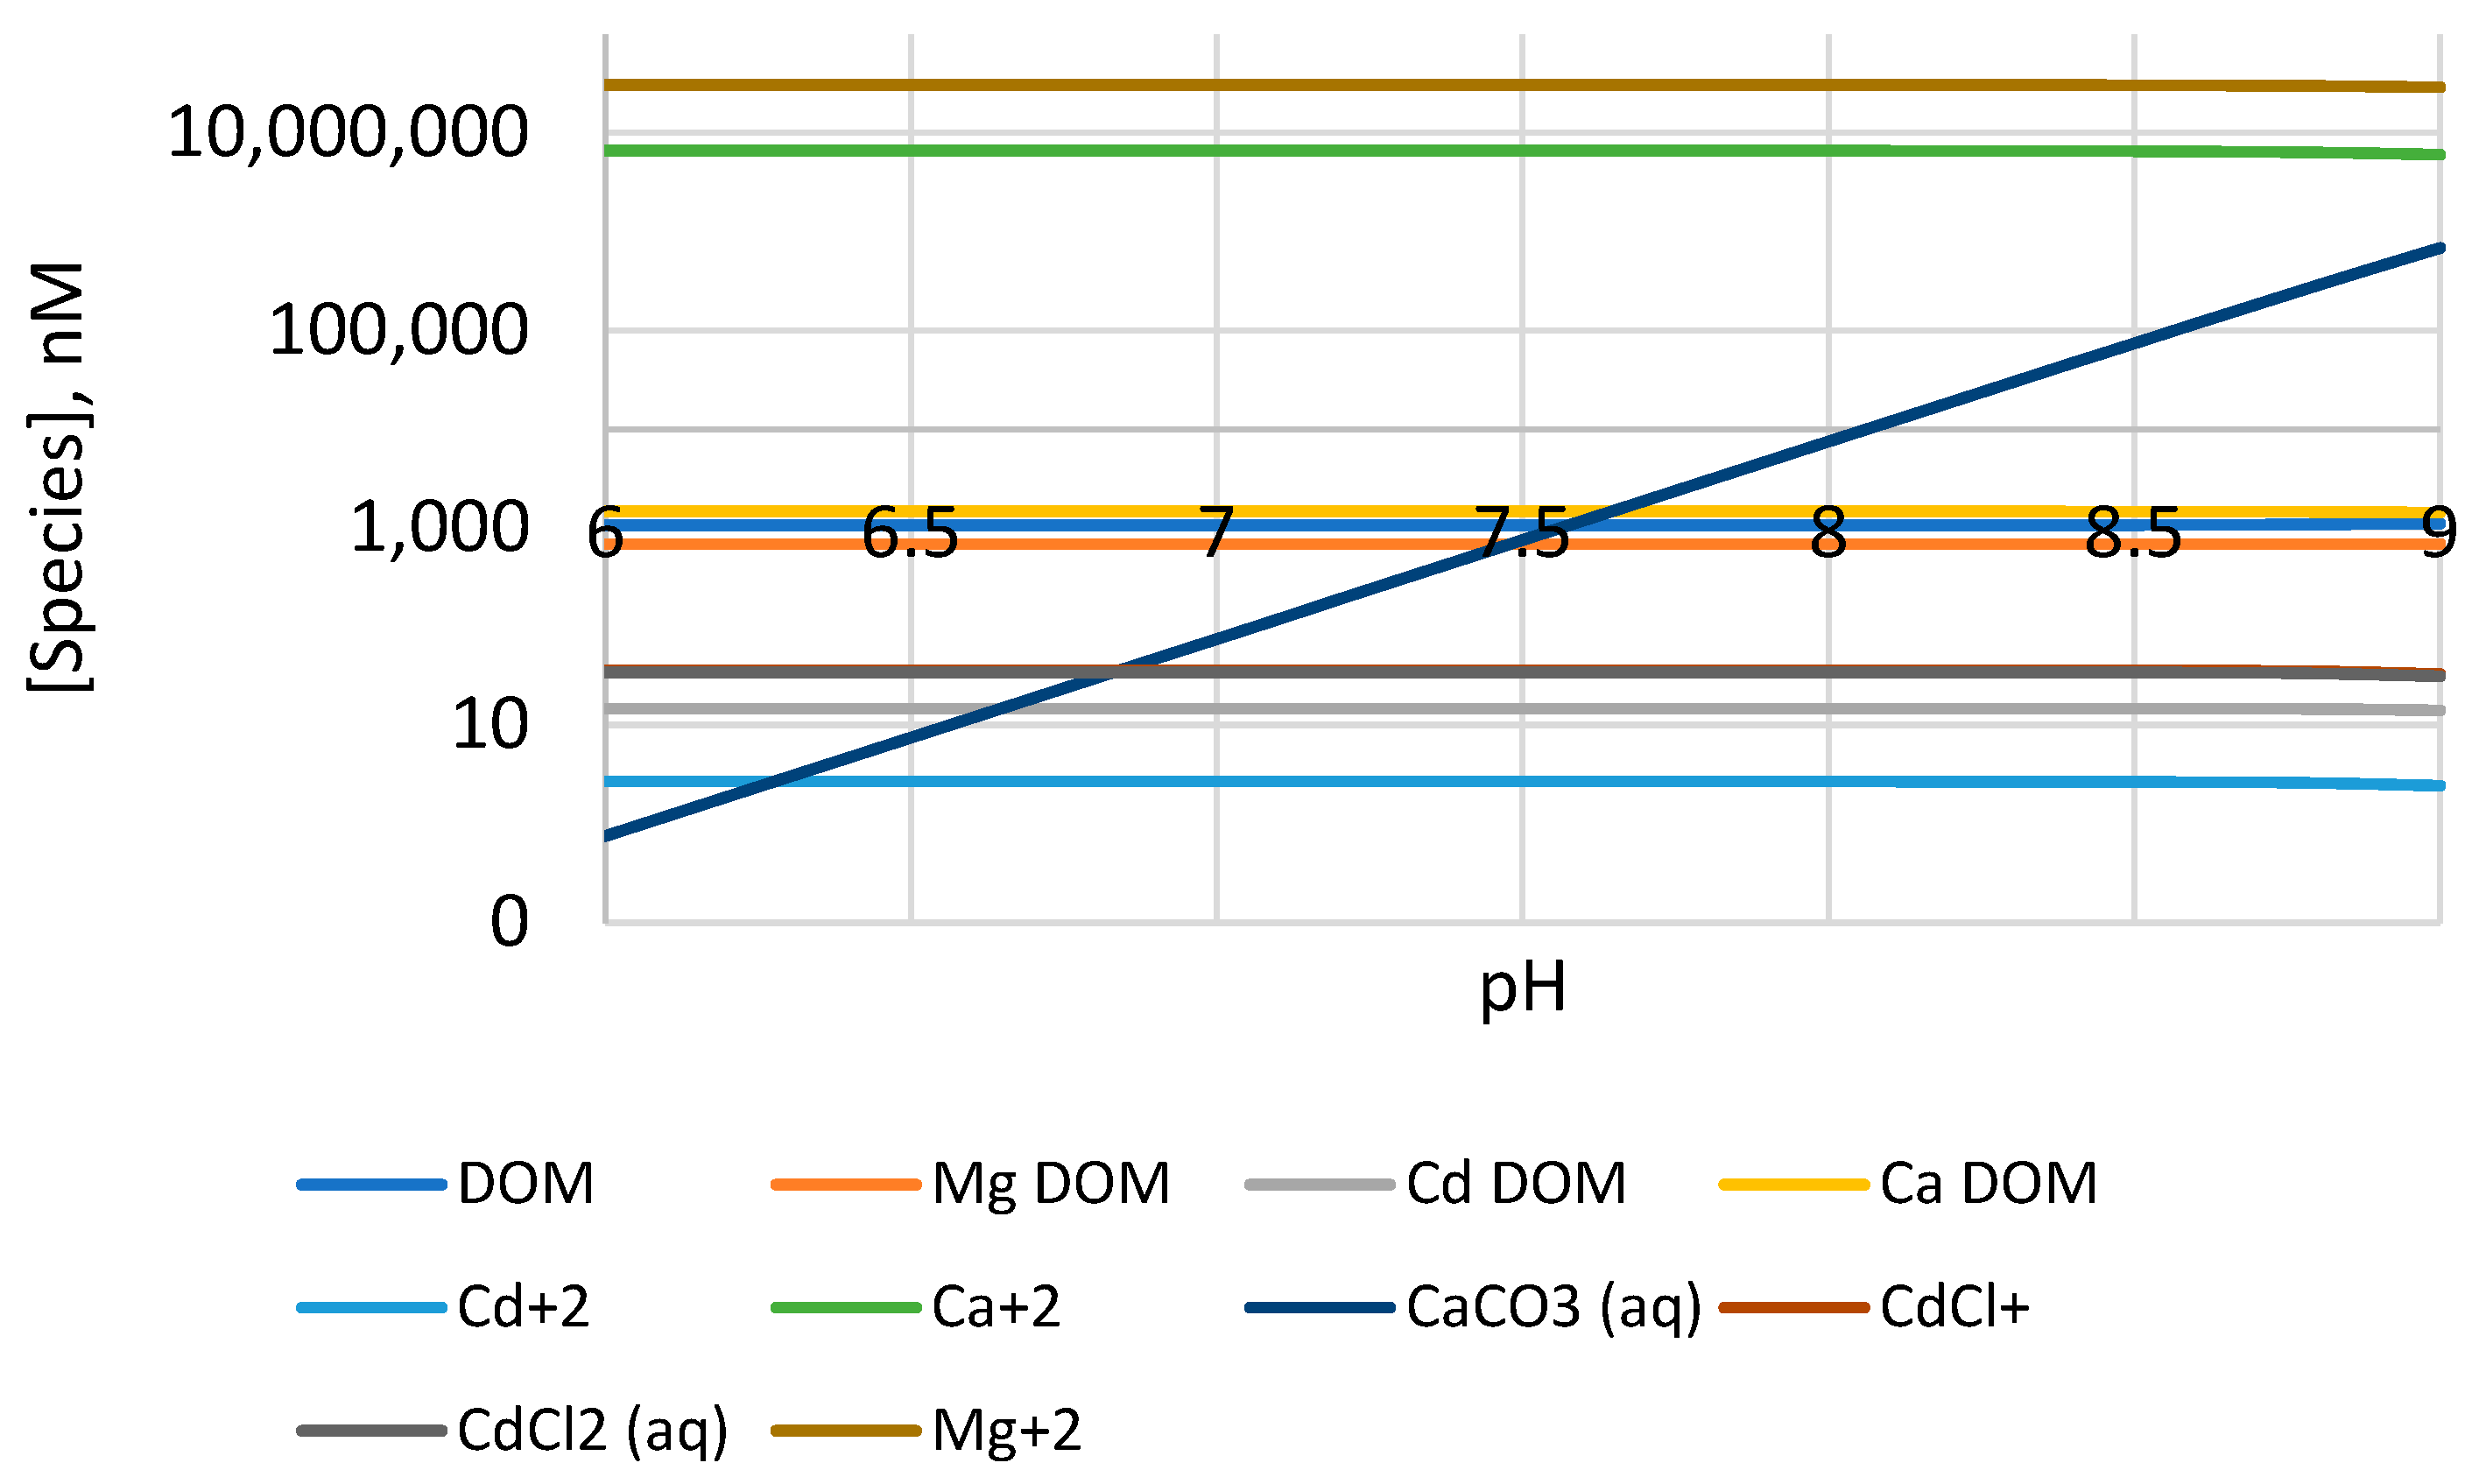
Keeping all of the other parameters unchanged, a pH scan was performed to find the fate of the Cd species, and the results are shown in Figure 5. As observed here, free Cd2+ and Cd-DOM did not change as pH increased. All of the species remained unchanged (<1%) over the pH range of 6–8.5, except for soluble CaCO3 (aq), which linearly changed from 75 nM at pH 7 to 7500 nM at pH 8. Apparently, this pH change had no effect on DOM species. To further illustrate the effect of pH on Cd speciation, the activity of the species is presented at two extremes, pH 2.5 and pH 8.1, in Supplementary Materials Figure S4. It clearly indicates that the most affected species containing -OH and CO32− were increased by several orders of magnitude from pH 2.5 to pH 8. For these computations, the charge balance, i.e., the difference between the sum of the anions and cations, never exceeded 0.2–1%.

4.5. Pb2+ Speciation

The MINTEQA speciation calculation for Pb2+ was performed with 21 µg/L Pb2+ found in BoB water by DPASV and the highest amount of DOM found in the experiment in the presence of major and minor ions in the BoB at a fixed pH, pCO2, and temperature. All 71 species and their percent composition are shown in Supplementary Materials Table S6. The percent distribution of the Pb species is illustrated in Figure 6. Unlike Cd2+, about 89.6% of Pb2+ was bound to DOM. About 10% of Pb2+ was free and bound to the major and minor inorganic components as labile electrochemically reducible Pb species and bioavailable. Of the total Pb measured in the BoB, only 0.7% existed as free ions, Pb2+. In the distribution of DOM species in Figure 6, only 3% DOM was bound to Pb2+, while most of the DOM was bound in the order of Ca > Mg > free DOM. This distribution was very similar to that of Cd2+ speciation except that much of the Pb2+ was bound to DOM due its higher binding constant, implying a higher binding affinity for Pb2+.
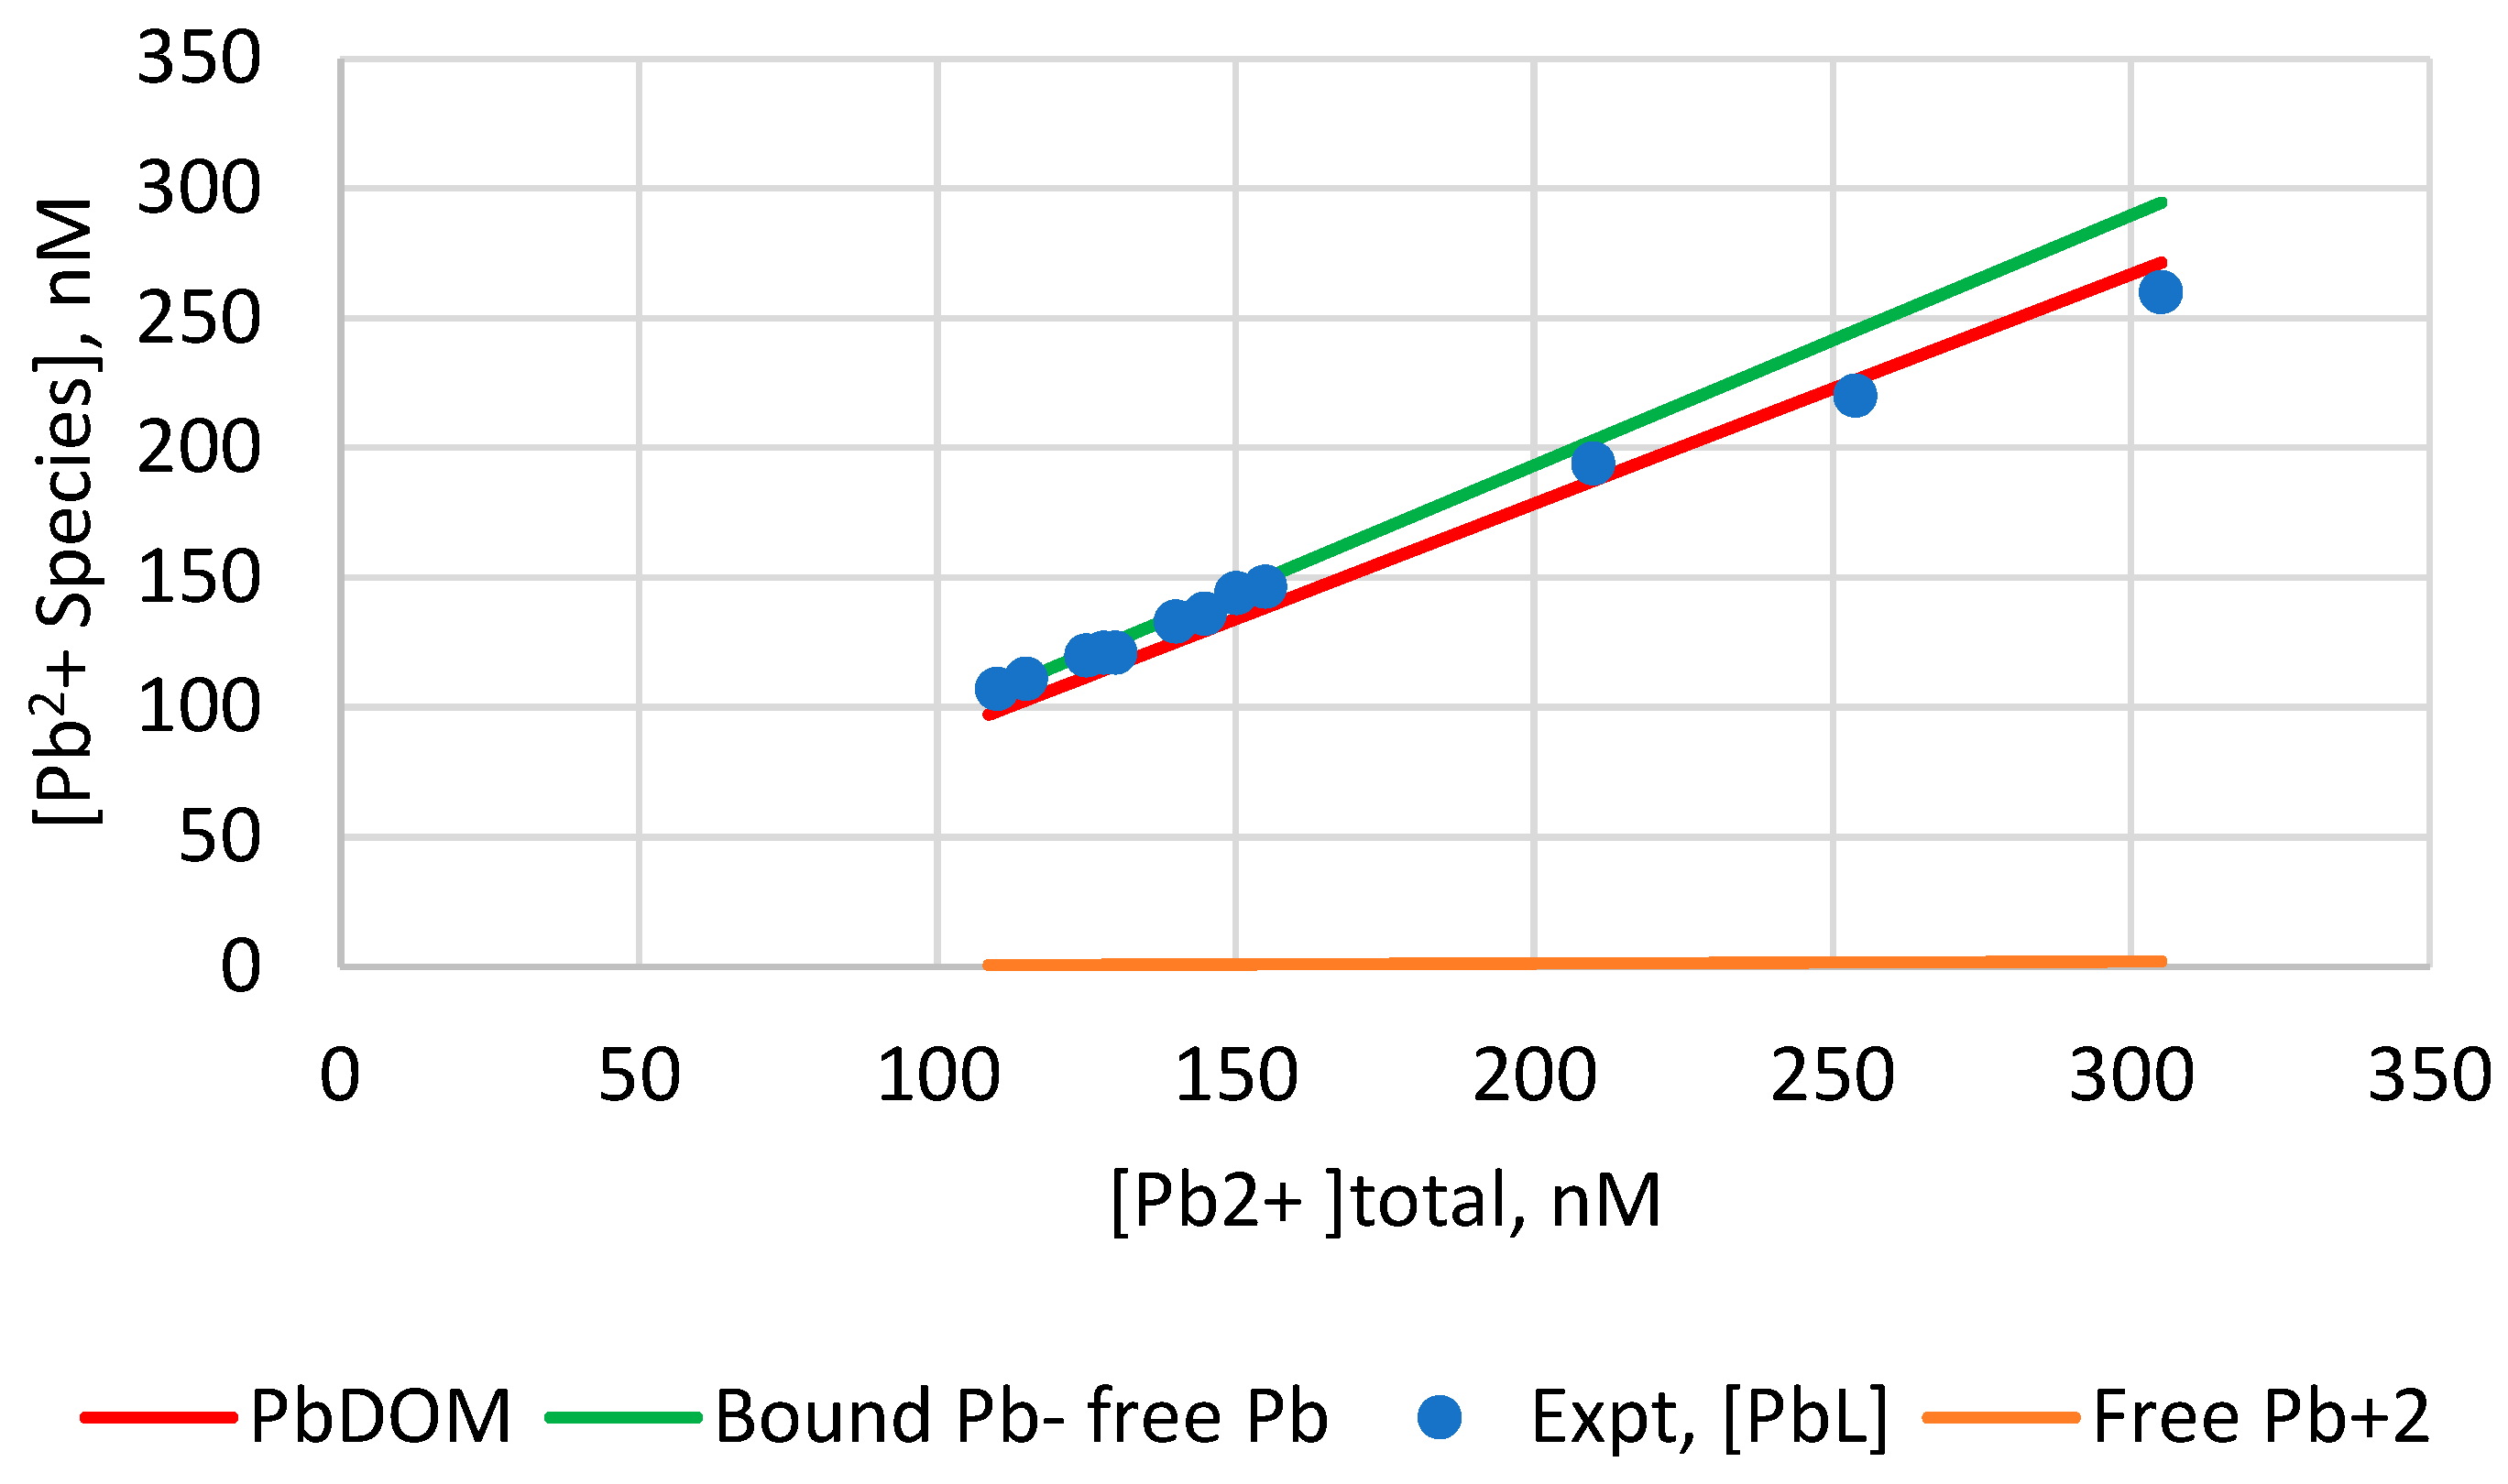
The distribution of total Pb2+ during the DPASV titration experiment among free, bound, and other species in BoB water was calculated and is shown in Supplementary Materials Table S7. The results are summarized in Figure 7.
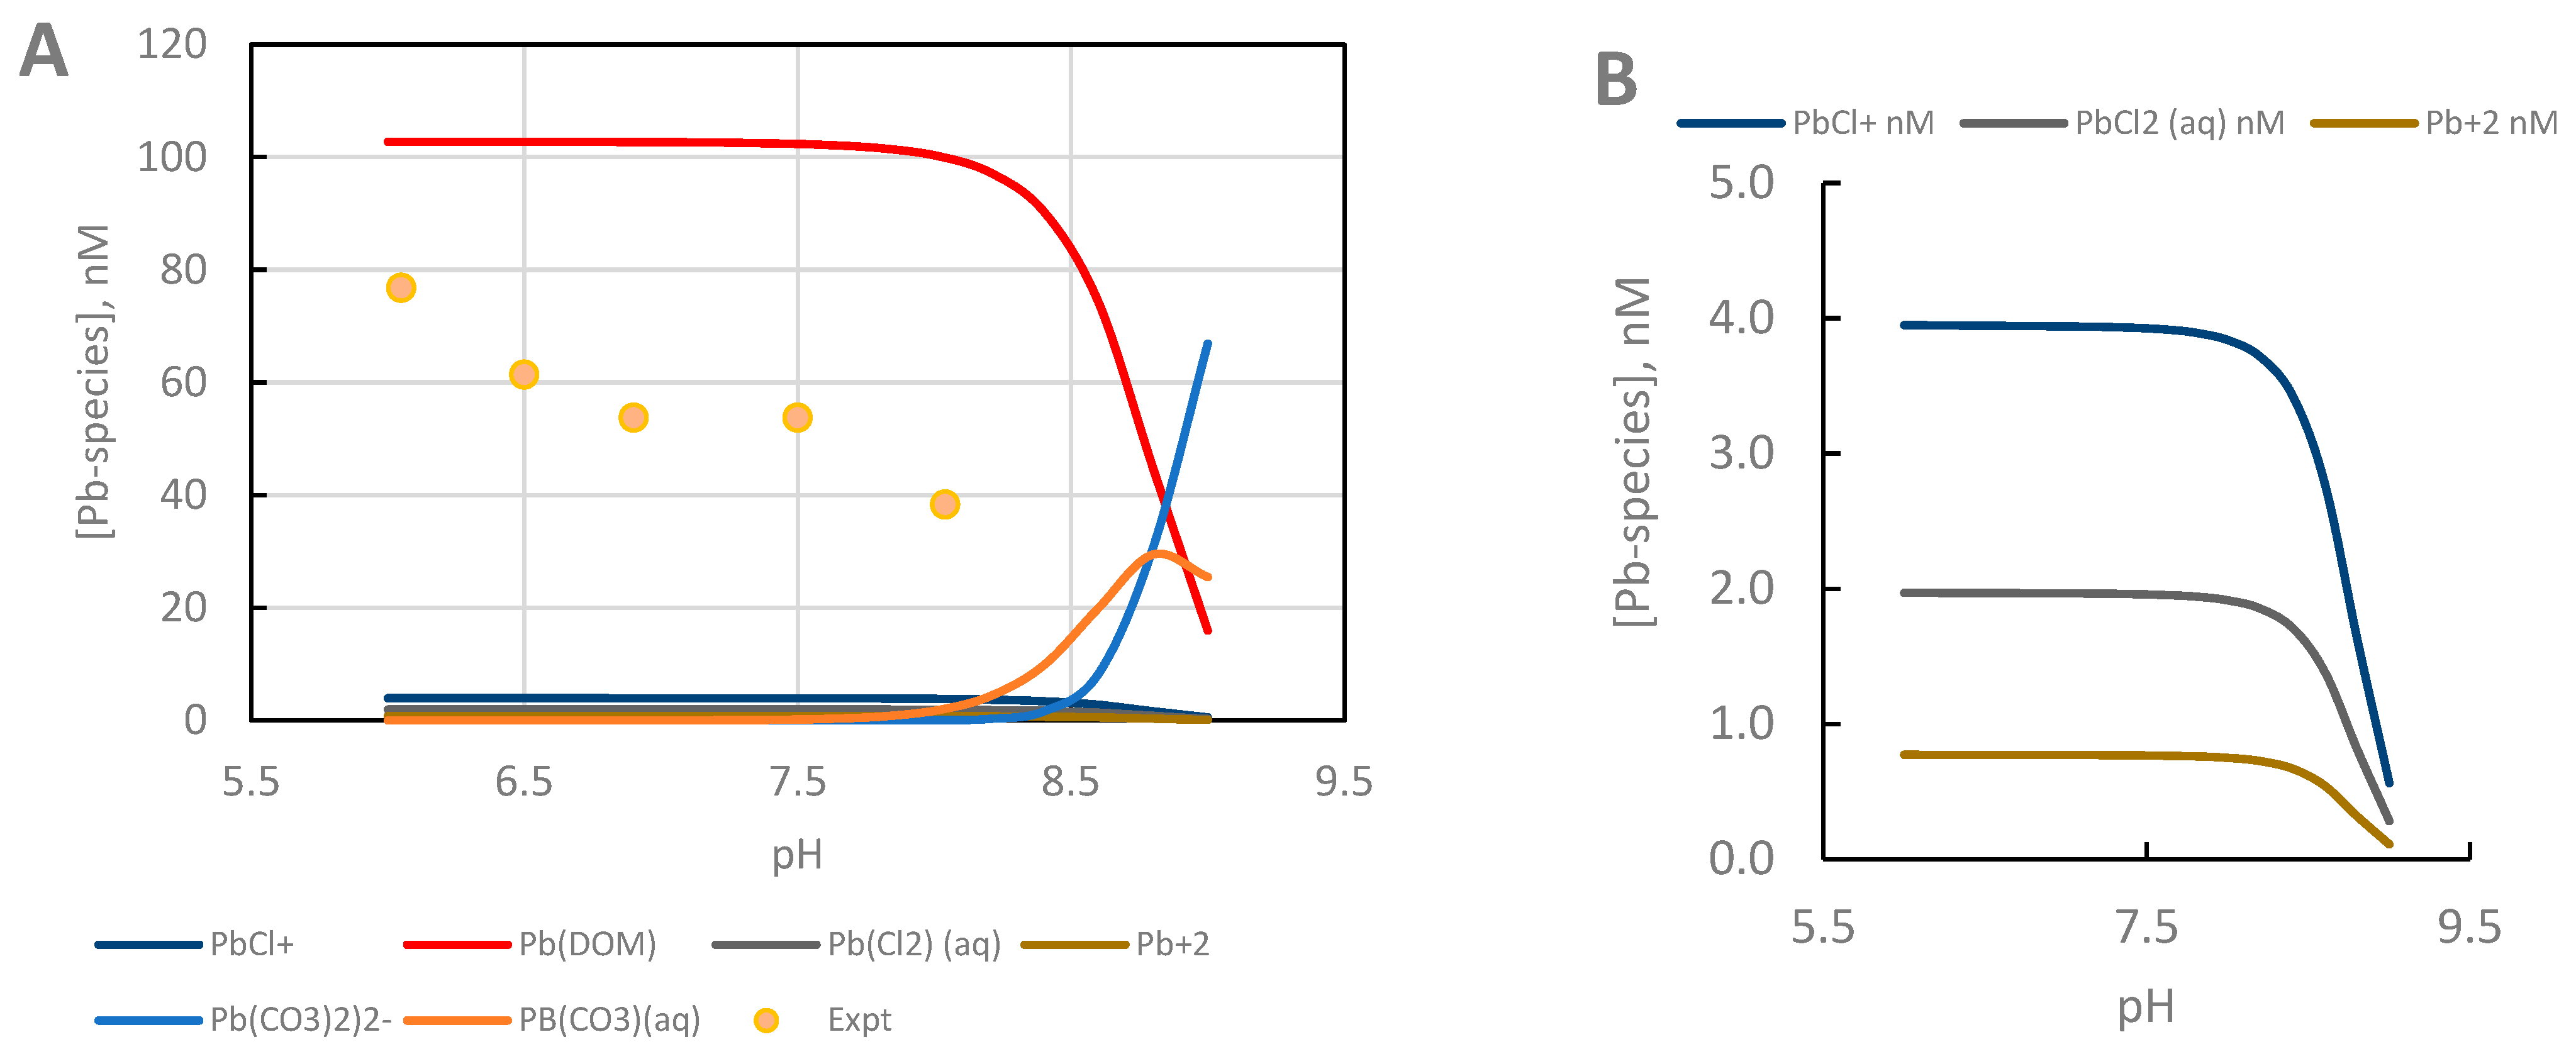
Figure 7 clearly indicates that the MINTEQA-calculated Pb-DOM concentrations were almost the same as those of experimentally found bound Pb2+. Therefore, these findings of the DPASV analysis of Pb2+ in the presence of inorganic ligands Cl, CO32−, HCO3, SO42−, and DOM clearly demonstrated that the Pb-ligand species so formed under the given conditions were not electrochemically labile and did not dissociate to free Pb2+. Experimentally measured free Pb2+ (<50 nM), being an order of magnitude lower (<3 nM) than the calculated one by MINTEQA, affected the overall Pb2+ distribution. This was in sharp contrast with Cd2+ speciation where most of the Cd2+ species were electrochemically labile due to their lower binding constants. Like that on Cd2+ speciation, the effect of pH on Pb2+ speciation was studied with the lowest experimental Pb2+ concentration. The results of the MINTEQA speciation are shown in Figure 8.
The results in Figure 8A show that the Pb-DOM concentration decreased rapidly after pH 8.1. Consequently, the concentrations of Pb(CO3)22− increased rapidly while PbCO3 (aq) increased to a lesser extent. This rapid increase in carbonate species was due to the increase in CO32− in water at higher pH. Consequently, the free and labile Pb2+ species (Pb2+, PbCl+, and PbCl2 (aq)) decreased although their concentrations were less than 4 nM (Figure 8B). The experimentally determined Pb2+ (yellow dots) was within the theoretical high (Pb-DOM, red line) and low (weaker Pb complexes) limits from the MINTEQA predictions. The loss of DOM effectively bound to free Pb2+ and other soluble complexes, which increased the concentrations of toxic Pb species as soluble carbonate complexes in the BoB as the pH increased. The pH effect on speciation was further examined under the effects of increasing atmospheric CO2, temperature, and decrease in ocean pH due to global warming.

4.6. Effect of Global Warming on the Speciation of Pb2+ and Cd2+ in BoB

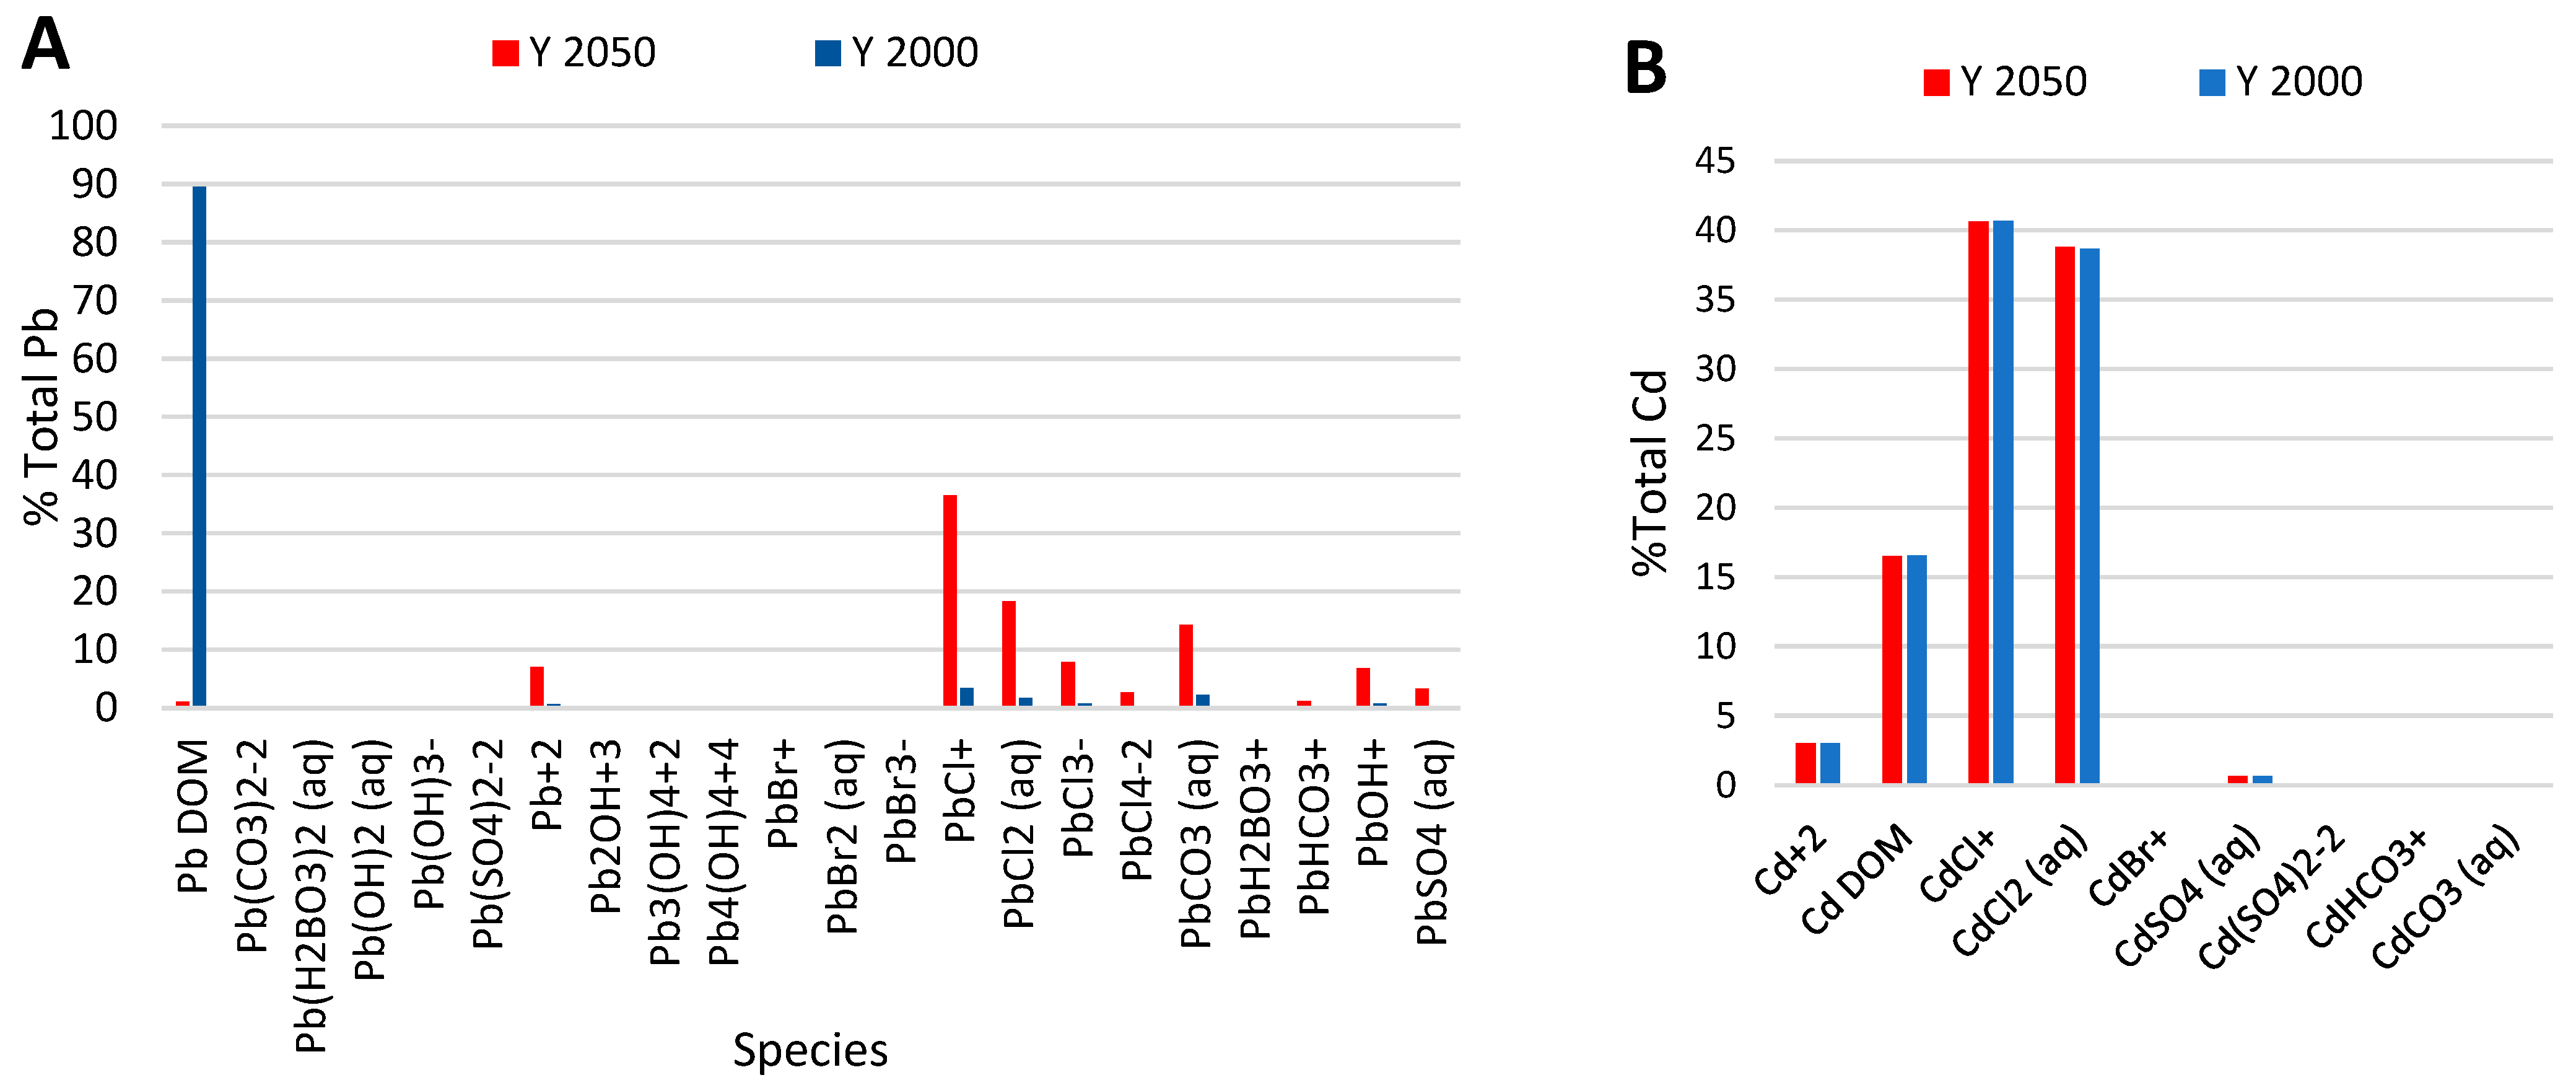
Global warming, known to increase the temperature of the globe, is accompanied by a significant increase in atmospheric CO2 concentration, which in turn decreases the ocean pH due to increased dissolved CO2 (dCO2) in oceans. An increase in pCO2 by 3–5 times and a significant rate of decrease in pH has been observed in the coastal BoB in the last few decades [39]. It is projected that, in the year 2050, the average ocean pH will be 7.97, the partial pressure of carbon dioxide (pCO2) will be 550 µtorr, and the temperature will rise to T = 26.5 C [40]. It is known that prolonged exposure of sea urchins to low pH (7.5) seawater causes the loss of their spines and foraminifera are affected more severely than sea urchins at this pH [41]. Assuming no change in total Pb2+ and initial DOM concentrations (22.5 µg/L Pb2+, 0.45 mg/L DOM), speciation of Pb2+ was performed and compared with that in the year 2000 (baseline data). This comparison is shown in Figure 9. Several critical observations can be made from Figure 9. In 2050, the Pb-DOM concentration will be 3% of the total Pb2+, while it was 90% of the total Pb2+ in 2000 (this work). Consequently, the concentration of free and labile Pb2+ species will increase drastically in 2050. Knowing the toxicity of free Pb2+, the ocean water will be far more toxic than it is at present. By contrast, there will be almost no change in the speciation of Cd2+ in 2050 in the future. This conclusion is in agreement with the general finding from other studies [42]. In addition, the positive trend in temperature increase and negative trend in the productivity of phytoplankton, zooplankton, and chlorophyll can cause a proportionate decrease in the ambient DOM concentration in the BoB [43]. This could further reduce the complexation of Pb2+ and other trace metals and increase the toxicity of Pb2+ by freeing it up. This prediction implies that the bioavailability of ecotoxic heavy metal ions like Pb 2+ would possibly be far greater in the Bay of Bengal in the near future. So, to maintain the quality of the ecological services, like fisheries, that the Bay of Bengal provides to the adjoining huge population, further research is needed to better realize how the ocean pH affects metal–ligand interactions and the bioavailability of ecotoxic heavy metal ions like Pb2+, Cd2+, Hg 2+, etc.

5. Conclusions

Ionic speciation information about toxic trace metals in the Bay of Bengal is almost nonexistent. The speciation of Pb2+ and Cd2+ with dissolved organic matter (DOM, MW 1000 Da) in surface seawater (SSW) from the Bay of Bengal (BoB) in eastern Bangladesh has been studied by using differential pulse anodic stripping voltammetry (DPASV) with a thin mercury film glassy carbon electrode (TMFGC). A much better two-site model for M2+ binding with DOM yielded the free ligand concentrations, measured as the sum of two ligands (L1 + L2), which were found to be 66.4 ± 4.0 nM for Cd2+ and 449 ± 5 nM for Pb2+. For Pb2+ binding, the weaker DOM sites comprised 70% of the total sites, while for Cd2+, it was 90% of the sites. The speciation and distribution of Ca2+, Mg2+, Cd2+, and Pb2+ with DOM were calculated using computational chemical equilibrium model (MINTEQA). The effect of change in pH with increasing dissolved carbon dioxide due to global warming shows drastic changes in the speciation of metal ions, especially Pb2+, by the year 2050. The implications of this prediction on the bioavailability of free metal ions and their impact on aquatic life in the Bay of Bengal is a subject of further concern.

Supplementary Materials

The following supporting information can be downloaded at: https://www.mdpi.com/article/10.3390/w17101470/s1, Figure S1: Sampling location in Bay of Bengal. Samples were collected around the sampling site coordinates: 22.4° N, 91.6° E located on the eastern Bay of Bengal near Chattogram in Bangladesh; Table S1: Calibration of Pb2+ and Cd2+ with DPASV peak currents vs. concentrations (nM) in 0.7 M KNO3: Background subtracted data; Table S2: Effect of equilibration time on DPASV peak current for cadmium and lead in BoB seawater at pH = 8.1; Figure S2: Affinity spectrum (site distribution) of M-DOM complex based on a Gaussian model; Figure S3: Comparison of speciation of Cd-species in presence of two different DOM options in MINTEQA. Figures show activity of Cd2+ species and that of DOM and DOM-1000. pActivity = -log(activity); Table S3: MINTEQA notation, the corresponding chemical formula, and names of water-soluble species present in the seawater of Bay of Bengal; Table S4: Cd-species distribution calculated by MINTEQA using input parameters described in the text. Cd and DOC-species are highlighted; Table S5: Saturation index of mineral species in BoB water and those with Cd2+. Red marked minerals show saturation index less than unity, meaning possible precipitation as solid. Chemical; Figure S4: Effect of two extreme pH values on the speciation of Cd2+; Table S6: Components and species distribution for Pb2+ in presence of DOM; Table S7: MINTEQA distribution of soluble Pb-species as a function of total Pb2+ added during DPASV titrations. The last two columns show experimental values of bound and free Pb2+.

Author Contributions

A.H.K.: Initially proposed the idea and designed the experiments. M.N.: performed the experiments and calculations. A.H.: performed the data analysis and MINTEQA simulation. All authors wrote the manuscript. All authors have read and agreed to the published version of the manuscript.

Funding

This research was partly supported by a financial grant from the Ministry of Science and Information & Communication Technology (MoSci & ICT), Government of Bangladesh.

Data Availability Statement

The original contributions presented in this study are included in the article/Supplementary Materials. Further inquiries can be directed to the corresponding authors.

Acknowledgments

The authors acknowledge the assistance of the technical staff of the Department of Chemistry, University of Dhaka, during this work. A.H.K. is thankful to Sk. Shahriar Bin Rasul of IUB-Plasma Plus Research &Testing Laboratory, for providing the necessary literature support.

Conflicts of Interest

The authors declare no conflicts of interest.

References

  1. Stockdale, A.; Tipping, E.; Lofts, S.; Mortimer, R.J.G. Effect of Ocean Acidification on Organic and Inorganic Speciation of Trace Metals. Environ. Sci. Technol. 2016, 50, 1906–1913. [Google Scholar] [CrossRef] [PubMed]
  2. Batley, G.E.; Apte, S.C.; Stauber, J.L. A Speciation and Bioavailability of Trace Metals in Water: Progress Since 1982. Aust. J. Chem. 2004, 57, 903–919. [Google Scholar] [CrossRef]
  3. Allen, H.E.; Hansen, D.J. The Importance of Trace Metal Speciation to Water Quality Criteria. Environ. Res. 1996, 68, 42–54. [Google Scholar] [CrossRef]
  4. Morel, F.M.M. Trace Metals–Phytoplankton Interactions: An Overview. Oceanogr. Ser. 1986, 43, 177–189. [Google Scholar] [CrossRef]
  5. Mahowald, N.M.; Hamilton, D.S.; Katherine, R.M.; Mackey, J.; Moore, K.; Baker, A.R.; Scanza, R.A.; Zhang, Y. Aerosol trace metal leaching and impacts on marine microorganisms. Nat. Commun. 2018, 9, 2614. [Google Scholar] [CrossRef]
  6. Aiken, G.R.; Hsu-Kim, H.; Ryan, J.N. Influence of Dissolved Organic Matter on the Environmental Fate of Metals, Nanoparticles, and Colloids. Environ. Sci. Technol. 2011, 45, 3196–3201. [Google Scholar] [CrossRef]
  7. Van Den Berg, C.M.G. Determination of The Complexing Capacity and Conditional Stability Constants of Complexes of Copper (II) with Natural Organic Ligands in Seawater by Cathodic Stripping Voltammetry of Copper—Catechol Complex Ions. Mar. Chem. 1984, 15, 1–18. [Google Scholar] [CrossRef]
  8. Bruland, K.W. Complexation of cadmium by natural organic ligands in the central North Pacific. Limnol. Oceanogr. 1992, 37, 1008–1017. [Google Scholar] [CrossRef]
  9. Ren, Y.; Wang, X.; Zhang, C.; Liu, J.; Shi, X.; Li, L. The distribution and speciation of dissolved Cd and Pb in the Bohai Sea and Yellow Sea, China. Mar. Pollut. Bull. 2023, 186, 114437. [Google Scholar] [CrossRef]
  10. Velasquez, I.B.; Jacinto, G.S.; Valera, F.S. The speciation of dissolved copper, cadmium and zinc in Manila Bay, Philippines. Mar. Pollut. Bull. 2002, 45, 210–217. [Google Scholar] [CrossRef]
  11. Srichandan, S.; Panigrahy, R.C.; Baliarsingh, S.K.; Rao, S.B.; Pati, P.; Sahu, B.K.; Sahu, K.C. Distribution of trace metals in surface seawater and zooplankton of the Bay of Bengal, off Rushikulya estuary, East Coast of India. Mar. Pollut. Bull. 2016, 111, 468–475. [Google Scholar] [CrossRef]
  12. Khan, M.Z.H.; Hasan, M.R.; Khan, M.; Aktar, S.; Fatema, K. Distribution of Heavy Metals in Surface Sediments of the Bay of Bengal Coast. J. Toxicol. 2017, 2017, 9235764. [Google Scholar] [CrossRef] [PubMed]
  13. Ikhsani, I.U.; Wong, K.H.; Kim, T.; Mashio, A.; Norisuye, K.; Obata, H. Biogeochemistry of dissolved trace metals in the Bay of Bengal. Mar. Chem. 2024, 262, 104394. [Google Scholar] [CrossRef]
  14. Kibria, G.; Hossain, M.M.M.; Mallick, D.; Lau, T.C.; Wu, R. Trace/Heavy Metal Pollution Monitoring in Estuary and Coastal Area of the Bay of Bengal, Bangladesh and Implicated Impacts. Mar. Pollut. Bull. 2016, 105, 2016. [Google Scholar] [CrossRef] [PubMed]
  15. Dash, D.R.; Dash, S.; Patro, S.K.; Tripathy, K.S.; Sahu, B.K. Speciation of Zinc in Surface Waters of The Rushikulya Estuary (Bay of Bengal). J. Mar. Biol. Ass. India 1997, 39, 33–39. [Google Scholar]
  16. Nabi, M. Interaction of Lead (Pb) and Cadmium (Cd) with Hydroxide and Bicarbonate Anions and Dissolved Organics in Seawater: An Electrochemical Approach. Master’s Dissertation, Department of Chemistry, University of Dhaka, Dhaka, Bangladesh, 2000. [Google Scholar]
  17. Milliman, J.D.; Meade, R.H. World-wide delivery of river sediment to the oceans. J. Geol. 1983, 91, 1–21. [Google Scholar] [CrossRef]
  18. Chakraborty, P.; Babu, P.V.R.; Sarma, V.V. A study of lead and cadmium speciation in some estuarine and coastal sediments. Chem. Geol. 2012, 294, 217–225. [Google Scholar] [CrossRef]
  19. BOBLME: Country Report on Pollution in the BOBLME-Bangladesh. BOBLME Ecology-01, 2011. Available online: http://www.boblme.org/documentRepository/BOBLME-2011-Ecology-01.pdf (accessed on 17 July 2024).
  20. Zhang, H.; Davison, W. Direct in situ measurements of labile inorganic and organically bound metal species in synthetic solutions and natural waters using diffusive gradients in thin films. Anal. Chem. 2000, 72, 4447–4457. [Google Scholar] [CrossRef]
  21. Buffle, J. Complexation Reactions in Aquatic Systems; An Analytical Approach; Ellis Horwood: Chichester, UK, 1988; pp. 203–205, 221. [Google Scholar]
  22. Bard, A.J.; Faulkner, L.R. Electrochemical Methods: Fundamentals and Applications, 2nd ed.; Wiley & Sons: Hoboken, NJ, USA, 2000; pp. 286–458. [Google Scholar]
  23. Chapman, K. The Toxic Tide of Ship Breaking. Chemistry World, 21 February 2022. Available online: https://www.chemistryworld.com/features/the-toxic-tide-of-ship-breaking/4015158.article (accessed on 17 July 2024).
  24. Mota, A.M.; Pinheiro, J.P.; Gonçalves, M.L.S. Electrochemical Methods for Speciation of Trace Elements in Marine Waters: Dynamic Aspects. J. Phys. Chem. A 2012, 116, 6433–6442. [Google Scholar] [CrossRef]
  25. Felmy, A.R.; Girvin, D.C.; Jenne, E.A. MINTEQ—A Computer Program for Calculating Aqueous Geochemical Equilibria, EPA-600/3-84-031; U.S. Environmental Protection Agency: Athens, GA, USA, 1984. [Google Scholar]
  26. Capodaglio, G.; Coale, K.H.; Bruland, K.W. Lead speciation in surface waters of the eastern North Pacific. Mar. Chem. 1990, 29, 221–233. [Google Scholar] [CrossRef]
  27. Stumm, W.; Morgan, J.J. Aquatic Chemistry; Jon Wiley and Sons Inc.: Hoboken, NJ, USA, 1981; p. 508. [Google Scholar]
  28. Hansell, D.A.; Orellana, M.V. Dissolved Organic Matter in the Global Ocean: A Primer. Gels 2021, 7, 128. [Google Scholar] [CrossRef] [PubMed]
  29. Shah, C.; Sudheer, A.K.; Bhushan, R. Distribution of dissolved organic carbon in the Bay of Bengal: Influence of sediment discharge, fresh water flux, and productivity. Mar. Chem. 2018, 203, 91–101. [Google Scholar] [CrossRef]
  30. Carrasco, G.G. Concentrations, Distributions and Chemical Speciation of Zinc and Cadmium in the Equatorial and South Atlantic Ocean. Ph.D. Thesis, Ocean & Earth Sciences, Old Dominion University, Virginia Beach, VA, USA, 2010. [Google Scholar] [CrossRef]
  31. Buckley, P.J.M.; Van Den Berg, C.M.G. Copper Complexation Profiles in The Atlantic Ocean: A comparative study using electrochemical and ion exchange techniques. Mar. Chem. 1986, 19, 281–296. [Google Scholar] [CrossRef]
  32. Kozelka, P.B.; Bruland, K.W. Chemical speciation of dissolved Cu, Zn, Cd, Pb in Narragansett Bay, Rhode Island. Mar. Chem. 1998, 60, 267–282. [Google Scholar] [CrossRef]
  33. Kozelka, P.B.; Sañudo-Wilhelmy, S.; Flegal, A.R.; Bruland, K.W. Physicochemical speciation of lead in South SanFrancisco Bay. Estuar. Coast. Shelf Sci. 2023, 44, 649–658. [Google Scholar] [CrossRef]
  34. Diviš, P.; Dočekalová, H.; Brulík, L.; Pavliš, M.; Hekera, P. Use of the Diffusive Gradients in Thin Films Technique to Evaluate (Bio)available Trace Metal Concentrations in River Water. Anal. Bioanal. Chem. 2007, 387, 2239–2244. [Google Scholar] [CrossRef]
  35. Sasamal, S.K. High saline waters in Bay of Bengal. Proc. Indian Acad. Sci. (Earth Planet. Sci.) 1990, 99, 367–381. [Google Scholar] [CrossRef]
  36. Available online: http://www.seafriends.org.nz/oceano/seawater.htm (accessed on 17 July 2024).
  37. Grimm, D.M.; Azarraga, L.V.; Carreira, L.A.; Susetyo, W. Continuous mltilagand distribution model used to predict the stability constant of copper (II) metal complexation with humic materials from fluorescence quenching data. Environ. Sci. Technol. 1991, 25, 1427–1431. [Google Scholar] [CrossRef]
  38. Tuschall, J.R., Jr.; Brezonik, P.L. Evaluation of the Copper Anodic Stripping Voltammetry Complexometric Titration for Complexing Capacities and Conditional Stability Constants. Anal. Chem. 1981, 53, 1986–1989. [Google Scholar] [CrossRef]
  39. Sarma, V.V.S.S.; Krishna, M.S.; Srinivas, T.N.R.; Kumari, V.R.; Yadav, K.; Kumar, M.D. Elevated acidification rates due to deposition of atmospheric pollutants in the coastal Bay of Bengal. Geophys. Res. Lett. 2021, 48, e2021GL095159. [Google Scholar] [CrossRef]
  40. Stocker, T.F.; Qin, D.; Plattner, G.K.; Tignor, M.; Allen, S.K.; Boschung, J.; Nauels, A.; Xia, Y.; Bex, V.; Midgley, P.M. (Eds.) The Physical Science Basis. Contribution of Working Group I to the Fifth Assessment Report of the Intergovernmental Panel on Climate Change; Cambridge University Press: Cambridge, UK; New York, NY, USA, 2013; Available online: https://www.ipcc.ch/report/ar5/syr/ (accessed on 17 July 2024).
  41. Panchang, N.; Ambokar, M. Ocean acidification in the Northern Indian ocean: A review. J. Asian Earth Sci. 2021, 219, 104904. [Google Scholar] [CrossRef]
  42. Millero, F.J.; Woosley, R.; Ditrolio, B.; Waters, J. Effect of ocean acidification on the speciation of metals in seawater. Oceanography 2009, 22, 72–84. [Google Scholar] [CrossRef]
  43. Sarker, S.; Panassa, E.; Hossain, M.S.; Chowdhury, S.R.; Yadav, A.K.; Sharifuzzaman, S.M. A bio-physicochemical perspective of the Bay of Bengal. J. Mar. Biol. Assoc. UK 2020, 100, 517–528. [Google Scholar] [CrossRef]
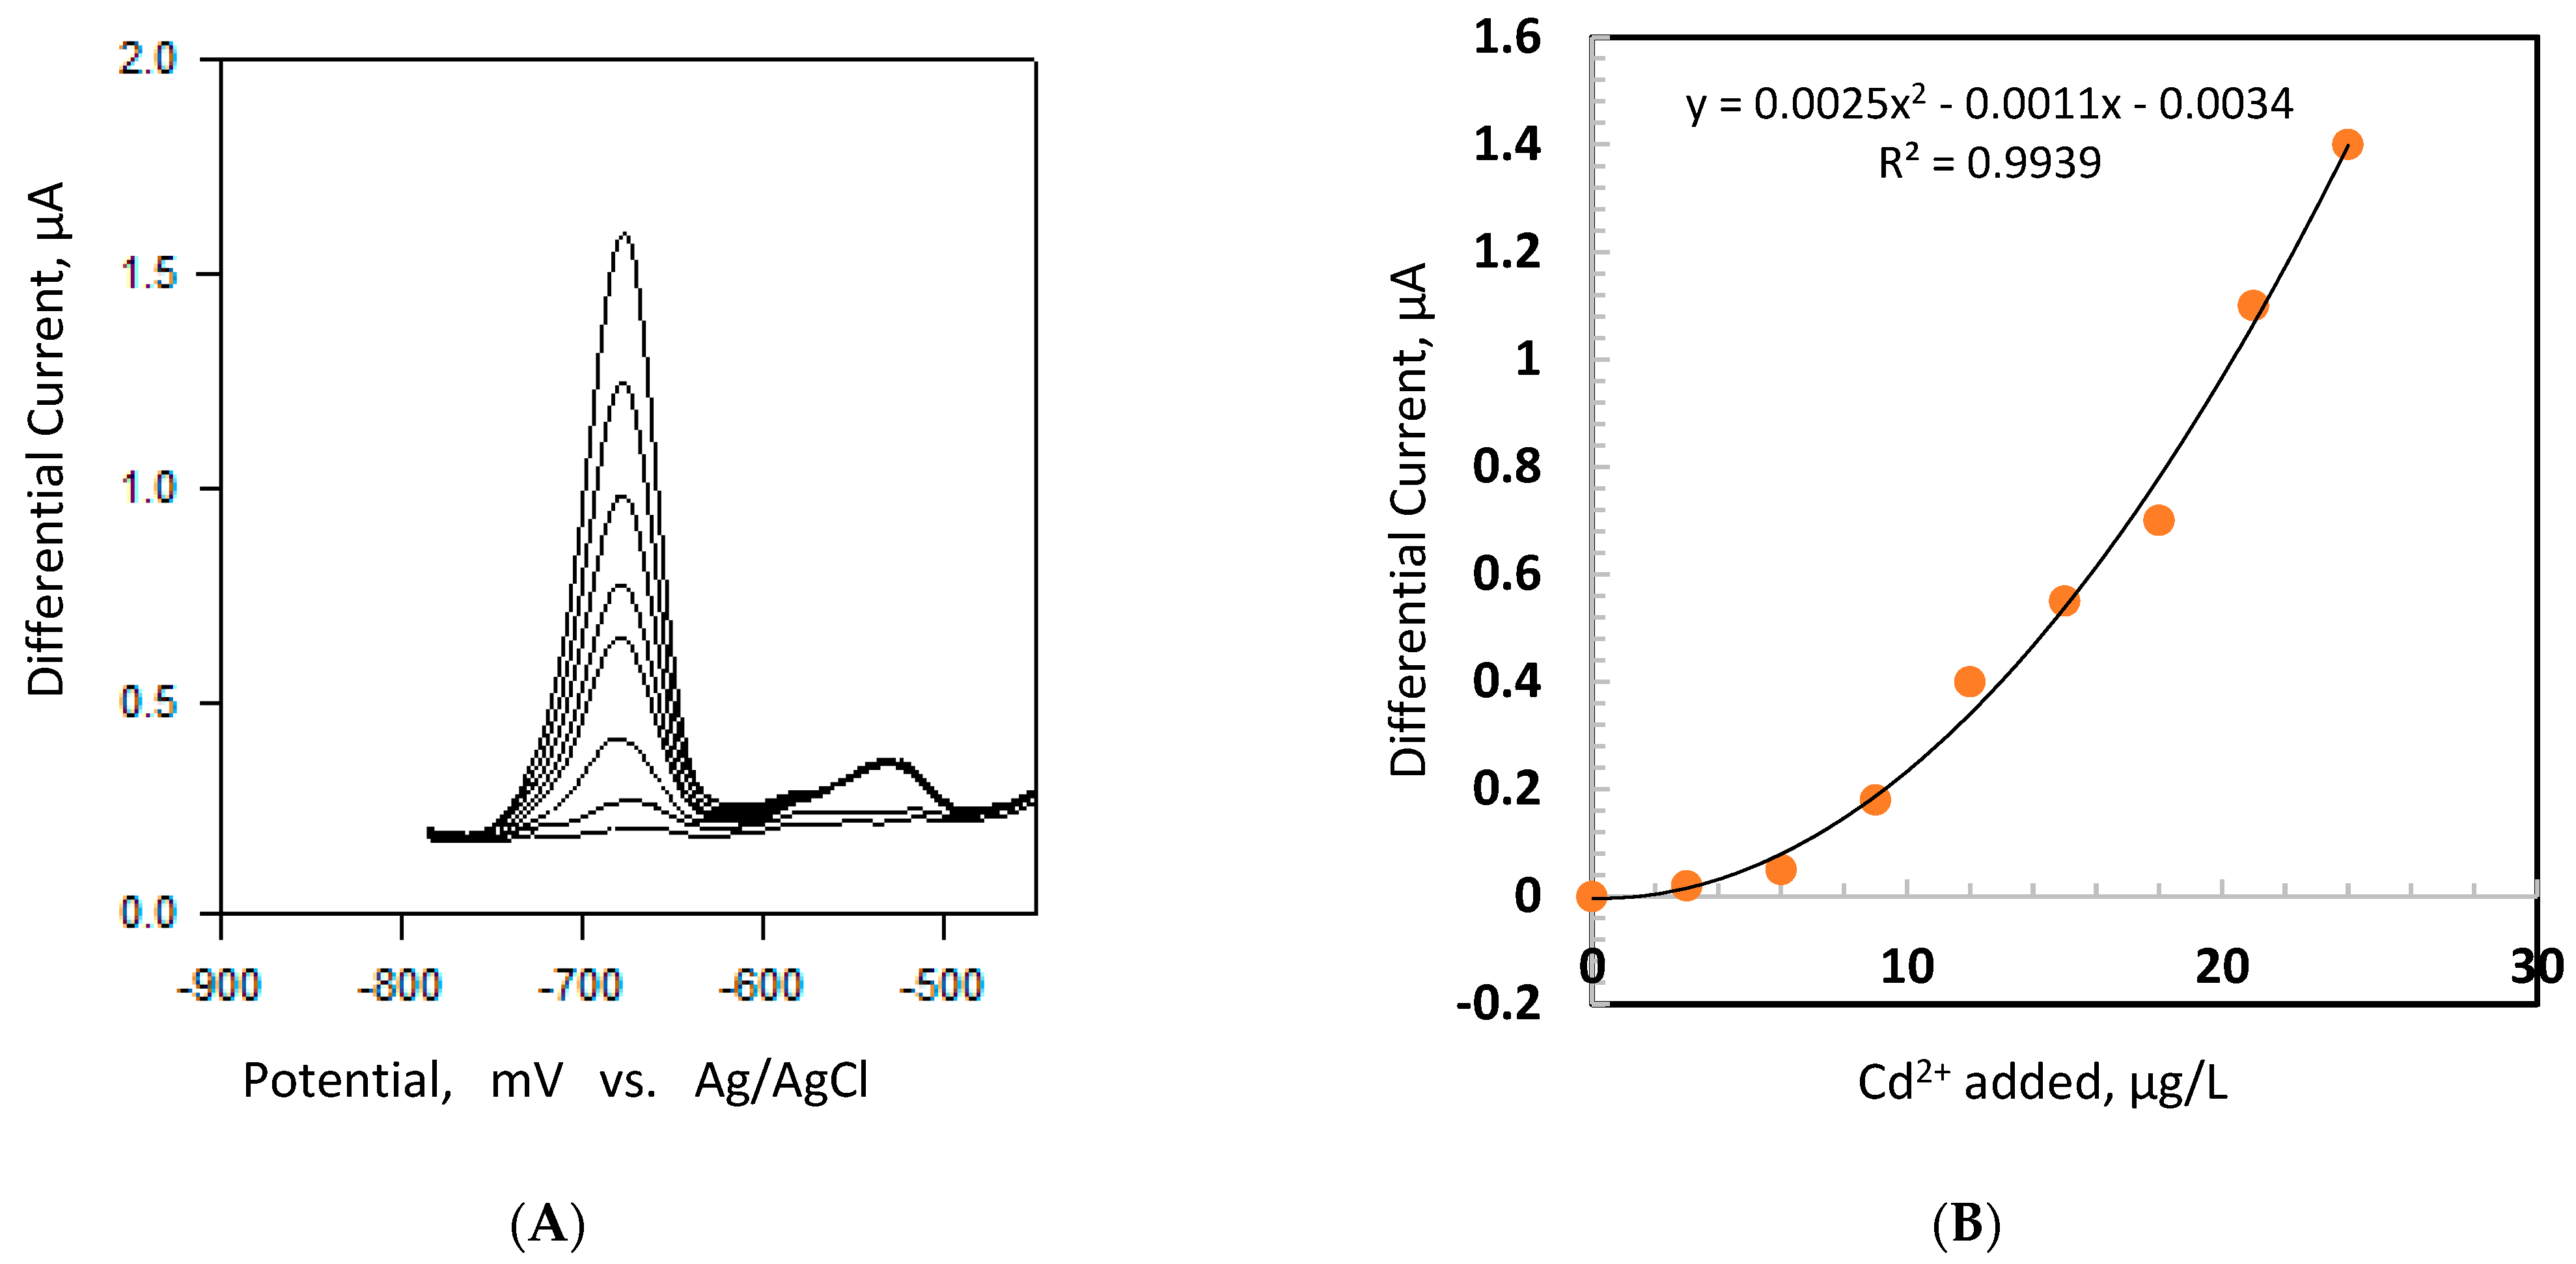
Figure 1. (A) DPASV for the titration of DOM in BoB seawater with Cd2+ at pH 8.03 showing differential current for 3, 6, 9, 12, 15, 18, 21, and 24 μg/L Cd2+ (from low to high peak current) at Epeak = −680 mV vs. SSC. Each addition was followed by a 20 min equilibration time at the open circuit potential. (B) Plot shows the differential peak current vs. Cd2+ added. A second-degree polynomial was fitted to interpolate the experimental data for further processing. Other conditions of analysis are explained in the experimental section.
Water 17 01470 g001
Figure 2. (A) Measurement of equilibrium [Cd2+] vs. added [Cd2+] in BoB water. The fitted second degree polynomial was used to interpolate data points for further calculation. (B) Calculated [CdL] superimposed on the interpolated values with the two-site model. (C) Measurement of equilibrium [Pb2+] vs. added [Pb2+] in BoB water. The fitted second degree polynomial was used to interpolate the free concentration of metal ions for further calculation. (D) Calculated [PbL] from the model superimposed on the interpolated values with the two-site L, DOM model. Results are summarized in Table 1 and discussed in the text.
Water 17 01470 g002
Figure 3. (A) Cd2+ speciation in the presence of BoB major anionic components and 450 nM DOM. (B) Distribution of DOM species in the presence of Cd2+, 450 nM DOM, and naturally occurring Ca2+ and Mg2+ ions in BoB seawater.
Water 17 01470 g003
Figure 4. Red line—MINTEQA-calculated total bound species (CdCl+, CdCl2 (aq), Cd-DOM, CdCO3, CdHCO3+, CdSO4) minus free Cd2+; blue squares—experimental free Cd2+; green squares—experimental Cd-DOM; and blue line—MINTEQA-calculated Cd-DOM.
Water 17 01470 g004
Figure 5. Effect of pH on the major cations in BoB seawater in the presence of Cd2+ and DOM.
Water 17 01470 g005
Figure 6. Distribution of Pb2+ speciation in the presence of major ionic components in the BoB and 450 nM DOM. The inset table in the figure shows the percent distribution of total DOM species, including free DOM.
Water 17 01470 g006
Figure 7. Speciation of Pb2+ in BoB water. Red line: sum of MINTEQA-calculated PbCl+, PbCl2 (aq), PbSO4 (aq), Pb-DOM, PbCO3 (aq), and PbHCO3+; green line: MINTEQA-calculated bound Pb2+ and free Pb2+; blue dots: bound Pb2+ from experiment; brown line: MINTEQA-calculated free Pb2+.
Water 17 01470 g007
Figure 8. (A) Distribution of all major soluble Pb species as a function of pH in BoB water. Yellow dots are DPASV accessible Pb2+ at the indicated solution pH. (B) Distribution of Pb-chloro species and free Pb2+ vs. pH.
Water 17 01470 g008
Figure 9. Comparative percent distributions of Pb2+ (A) and Cd2+ (B) in the years 2000 and 2050. MINTEQA computation is based on data available in 2000 and predicted at pH = 7.97, pCO2 = 550 µtorr, and T = 26.5 °C in 2050 [40]. There is no change in total Pb2+ = 22.5 µg/L, total Cd2+ = 9 µg/L, and DOM = 0.45 mg/L. MINTEQA-calculated ionic strength µ = 0.565 molal and estimated charge difference 0.2% in 2050.
Water 17 01470 g009
Table 1. Binding constants and DOM site concentrations obtained from model data fitting a.
ModelCd2+Pb2+
One site (n = 34)K1 = (1.94 ± 0.2) × 107 M−1
log K1 = 7.28
L1 = 66.4 ± 4.0 nM
R2 = 0.92
K1 = (1.1 ± 0.06) × 108 M−1
log K1 = 8.04
L1 = 293 ± 7 nM
R2 = 0.97
Two sites (n = 33)K1 = (1.94 ± 0.2) × 107 M−1
log K1 = 7.28
L1 = 63.0 ± 4 nM
K2 = (1.95 ± 0.6) × 107 M−1
log K2 = 7.29
L2 = 3.4 ± 0.6 nM
R2 = 0.98
K1 = (4.89 ± 0.1) × 108 M−1
log K1 = 8.69
L1 = 130 ± 2 nM
K2 = (1.56 ± 0.04) × 107 M−1
log K2 = 7.19
L2 = 319 ± 4 nM
R2 = 0.99
Notes: a n = number of interpolated points through quadratic data fitting of the experimental data. Solver options are: Iterations 10,000 (max), Precision 10−6, Tolerance 5%, Convergence 10−7, Tangent estimates, Forward derivative, and Newton search, and non-negative K and L. K value errors are at 95% CI, n = 33, t95, n−1 = 2.03. Average Pb-DOM, log K = 7.94 ± 0.4, and for Cd-DOM, log K = 7.28 ± 0.4. These can be used for the Gaussian distribution of binding free energies (−RTlnK) or pK affinity spectra, as shown in Figure S2 (Supplementary Materials).
Table 3. Major inorganic ionic components in BoB water. The last five entries are experimental values.
Components and Physical ParametersValuesUnits
Cl546mmolal
Na+468mmolal
SO42−28.1mmolal
Mg2+53.3mmolal
Ca2+10.4mmolal
K+10mmolal
Br0.83mmolal
H3BO30.46mmolal
Sr2+0.09mmolal
Pb2+23µg/L
Cd2+9µg/L
pH8.08
Temperature25°C
Density1.033g/cm3
Table 4. MINTEQA distribution of Cd species in nM a. The last two columns show experimental values of DOM-bound and free Cd2+.
Input Cd2+,CdCl+CdCl2 (aq)Cd-DOMCdCO3 (aq)CdHCO3+CdSO4 (aq)Cd2+MINTEQA (Bound-Free)Expt.Expt. Cd2+
Total, nMCd-DOM
26.710.910.34.40.020.010.180.825.0
53.421.720.68.90.040.010.361.650.023.430
80.132.631.013.30.060.020.552.475.032.148
106.843.541.317.70.070.030.733.2100.026.880
133.554.351.722.10.090.030.914.0125.149.484
160.265.262.026.50.110.041.094.8150.152.1108
186.876.172.330.80.130.051.285.7175.150.8136
213.587.082.735.20.150.061.466.5200.139.5174
Notes: a The first column is the initial input values of Cd2+ in MINTEQA. The 9th column is the MINTEQA-calculated values of bound minus free Cd2+. The last two columns show experimental values of bound and free Cd2+.
Disclaimer/Publisher’s Note: The statements, opinions and data contained in all publications are solely those of the individual author(s) and contributor(s) and not of MDPI and/or the editor(s). MDPI and/or the editor(s) disclaim responsibility for any injury to people or property resulting from any ideas, methods, instructions or products referred to in the content.