1. Introduction
Landslides and slope failures are ubiquitous natural phenomena that constitute significant risks to property, infrastructure, and human lives globally. These events are frequently actuated by various factors, such as steep slopes, earthquakes, surface erosion, deforestation, and, most commonly, rainfall infiltration. In tropical regions, rainfall-induced landslides are especially frequent due to extended periods of heavy rainfall and the presence of residual or colluvial soils over bedrock. These soils typically exhibit high matric suction above the groundwater table (GWT), which initially enhances slope stability. However, when rainwater infiltrates the soil, it increases pore water pressure (PWP), reducing matric suction and significantly raising the likelihood of landslides—by as much as 90% in some cases [
1,
2]
Recent studies have accentuated the significant role of rainfall intrusion in slope failures in different regions. Kim et al. (2022) investigated precipitation-incited slope failures in Singapore, focusing on slopes composed mainly of residual soils [
2]. They examined the reciprocity allying soil properties and rainfall conditions through parametric analyses for seven rainfall scenarios and two soil types. The study utilized past precipitation data from 1982 to 2017 to perform transient seepage analyses and evaluate slope stability. The findings demonstrated that slopes with low-permeability soils are principally contrived in 5-day precipitation scenarios, whereas those with high-permeability soils are governed by maximum daily rainfall scenarios. The study did not consider future changes in rainfall patterns due to climate change.
Similarly, Chen et al. (2021) explored the landslide risk for the Dagangshan Reservoir slope, considering effects of precipitation and gauge height fluctuations [
3]. Through uninterrupted site observations, monitoring of GNSS, and computational simulations, the study identified significant deformations due to combined rainfall events and water-level drawdown. Their results emphasized the need for extensive monitoring and deeper slope stability review in response to changing hydrological conditions.
The implications of global warming for the changing climate, as well as the future impact of different climatological variables, are not unknown. There is high confidence that climate change will increase both the ferocity and prevalence of extreme events. Sharma and Ojha (2021) considered the change in future rainfall patterns due to climate change in the Ganga River Basin, India, using Coupled Model Intercomparison Project Phase 5 (CMIP5) to detail and project a significant increase in storm precipitation [
4,
5].
Dhanai et al. (2022) examined the influence of rainfall intrusion on PWP and the stability of slopes across different regions [
5]. Using the SEEP/W, finite element (FE) module of GeoStudio 2024.1 software for transient seepage perusal and the SLOPE/W, limit equilibrium (LE) slope stability module for stability assessment, the study utilized rainfall data from the CMIP5 simulations (2015–2100). The results indicated that increasing rainfall intensity reduces the factor of safety (FOS) by decreasing matric suction, potentially leading to future slope failures. For instance, in Tamil Nadu, the initial FOS of 1.529 decreased progressively over three periods (2015–2050, 2051–2075, and 2076–2100) considering CMIP5 climate projections.
Other studies investigated the details of rainfall-induced landslides. Lee et al. (2014) inspected local rainfall patterns in Hulu Kelang, Malaysia, and established three rainfall thresholds for landslide prediction. Their detections emphasized the need to study rainfall durations of 3–30 days before landslide events [
6]. Similarly, Anderson (1996) introduced a model to evaluate the effectiveness of vegetation in preventing shallow slope failures due to rainfall penetration in tropical regions in view of the hydrological effects of vegetation cover under differing rainstorm frequencies [
7].
Furthermore, research conducted in laboratories has furnished extensive information about slope failures caused by rainfall. Huang et al. (2008) inquired into retrogressive slope collapses on sandy soil slopes through constant-intensity rainfall evaluation. Their results emphasized the importance of soil–bedrock interaction conditions for the stability of slopes and indicated that rainfall intensity and accumulative precipitation have an enormous effect on the transition from minor toe failures to massive retrogressive failures [
8].
The latest modeling approaches have been used to better explain rainfall-induced slope failures. To predict catchment-wide reactions to various rainstorm events, for example, Hennrich and Crozier (2004) applied TOPMODEL integrated with a GIS framework to identify spatial variations in groundwater elevation influenced by seasonal changes in soil moisture and rainfall [
9]. Similarly, Gong et al. (2021) improved the anticipated precision of slope stability models in south China by developing a regional landslip stability analysis method that accounts for vegetation roots [
10].
Rainfall-induced slope failures have been extensively studied using a variety of analytical and modeling approaches. Lee et al. (2009) established a model for preliminary assessment based on rainfall intensity and soil permeability, which was later incorporated into the PERISI model to predict slope stability under extreme rainfall conditions [
11]. Cooper (2010) examined the effects of topography on shallow landslides triggered by rainfall, finding that slope stability increases as the profile curvature transitions from concave to convex [
12].
Pradhan et al. (2022) investigated the combined influence of rainfall and road cutting in triggering landslides in Nepal, using hydro-mechanical analysis and finite element (FE) modeling to assess the reduction in soil suction and its impact on stability of slopes [
13]. Similarly, Chen et al. (2008) developed a rapid response analysis method to predict landslides, focusing on the effects of infiltration time, soil properties, and slip surface depths [
14].
Further studies have focused on early warning systems and the hydrologic factors influencing landslides. Gian et al. (2017) used real-time data from wireless sensor networks with finite element (FE) and limit equilibrium (LE) slope stability analysis to develop a predictive and monitoring system for landslides triggered by rainfall in Vietnam [
15]. Additionally, Wienhöfer et al. (2011) underscored the importance of understanding how the slope stability models are influenced by parameter uncertainty and temporal variation, emphasizing the limitations of simple limit equilibrium analyses driven by pore pressure dynamics [
16].
Overall, these studies demonstrate the adaptability interrelationship between rainfall, soil properties, and stability of slopes. However, we could not find any study discussing the effect of future precipitation based on recently released CMIP6 data [
17]. The research is to explore further the way rainfall intensity influences rock slope stability, with a focus on the Polavaram Irrigation Project’s left bank tunnel portal [
18]. By employing transient seepage analysis using SEEP/W and subsequent stability assessments with the SLOPE/W module, this research aims to provide a deeper understanding of the mechanisms driving rainfall-induced slope collapses and the critical parameters that need to be considered in slope stability assessments.
2. Research Area
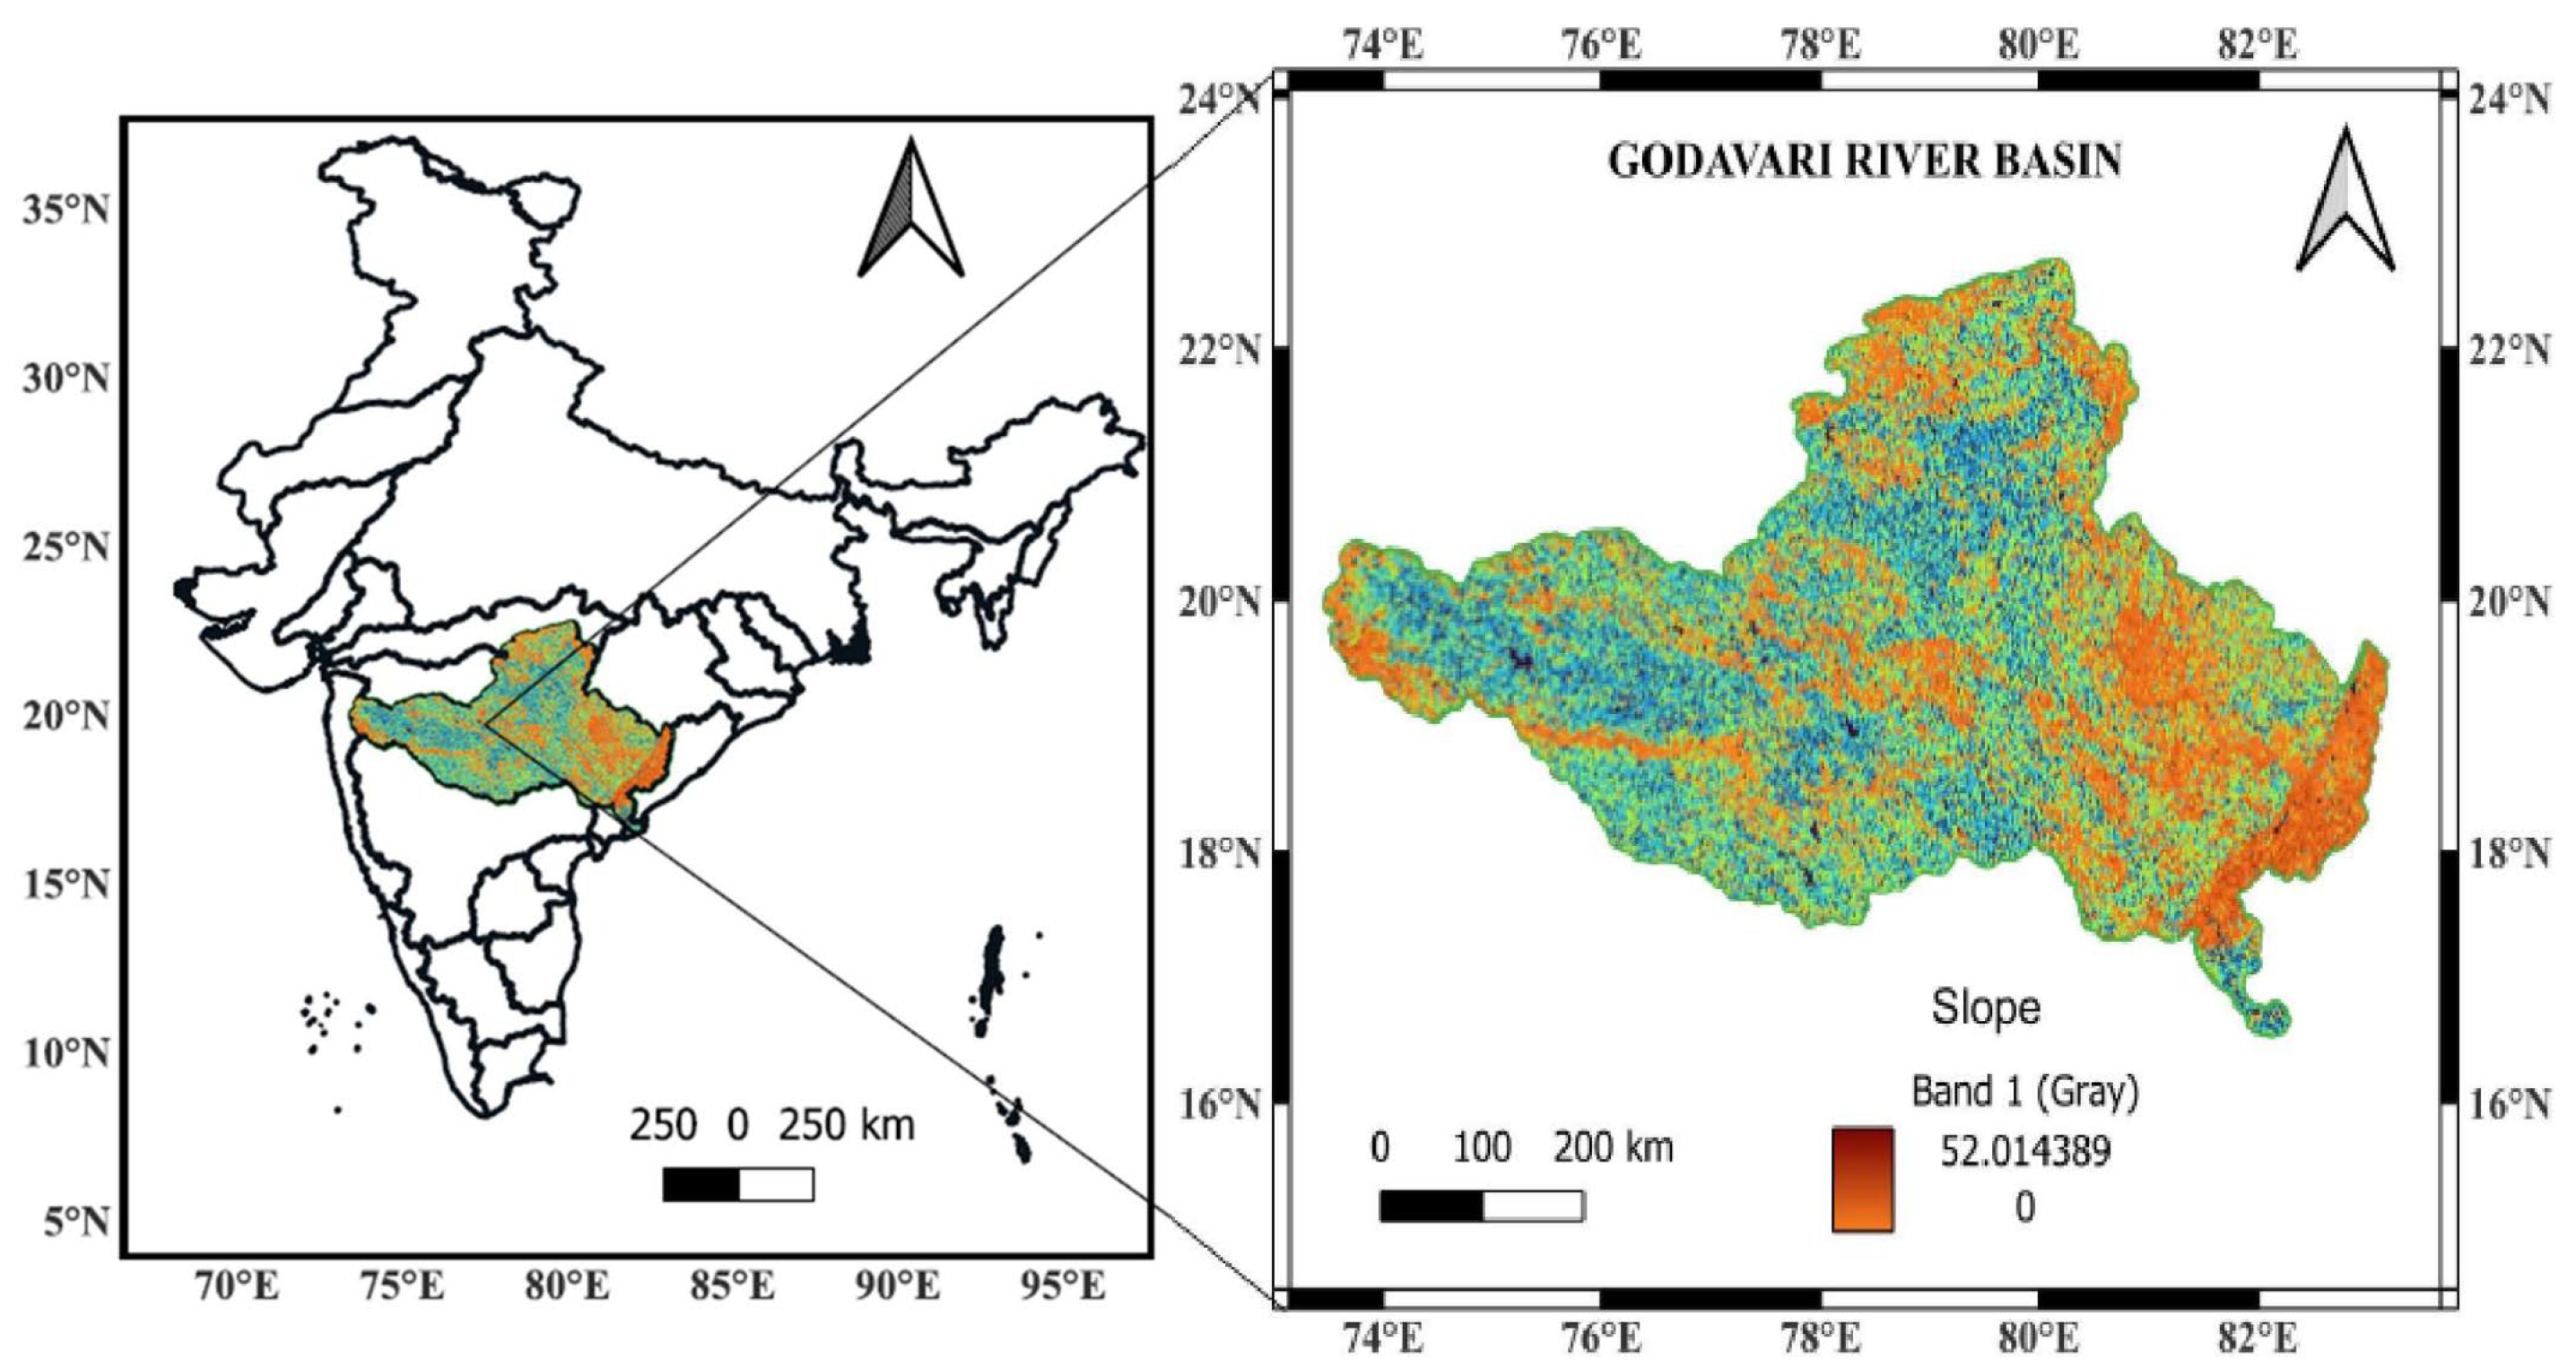
Spanning 1465 km, the Godavari River is the longest in peninsular India and the second longest in the country after the Ganges. Originating near Nashik in Maharashtra, it flows eastward and empties into the Bay of Bengal along India’s eastern coastline. The central and southern regions in India fall within the Godavari River Basin (GRB). With a total drainage area of roughly 312,813 km2, the GRB makes up almost 9.2% of the nation’s total land area. The Lower Godavari Basin (LGB) makes up approximately 28% of the GRB, which is divided into upper, middle, and lower basins.
With the objective to irrigate 2.32 million acres, the Polavaram Project (Indira Sagar Project) is a multipurpose project that principally consists of a large irrigation project requiring the construction of an earth cum rock fill (ECRF) dam, spillway, powerhouse, navigation lock system (NLS), and channel and tunnel systems on both banks. Silt, clay, and laterite build up the heavy soil underlying the approach channel on the left bank. The proposed twin tunnels are 17.70 m in diameter for navigation and irrigation. The hill range along the tunnel alignment has elevations ranging from 60 m to 1,075 m. The Godavari River has a flatbed slope and experiences heavy flooding during the monsoon season (June to September), which increase the risk of slope failure. For this reason, this study focuses on the slopes along the left bank. The Godavari River Basin thematic map of slope is shown in
Figure 1 [
19].
3. Data and Methodology
Data and samples were collected from the site for study, and the attributes of both soil and rock were assessed in detail in the laboratory. These investigations used a variety of geotechnical and material experiments to evaluate essential parameters such as strength, shear parameters, grain size distribution, permeability, and other relevant properties. The results of these laboratory observations are used as a critical input value in the analysis along with additional data provided by the Polavaram Project Authority (PPA). The properties of soil and rocks used in SEEP/W analysis are shown in
Table 1 and
Table 2.
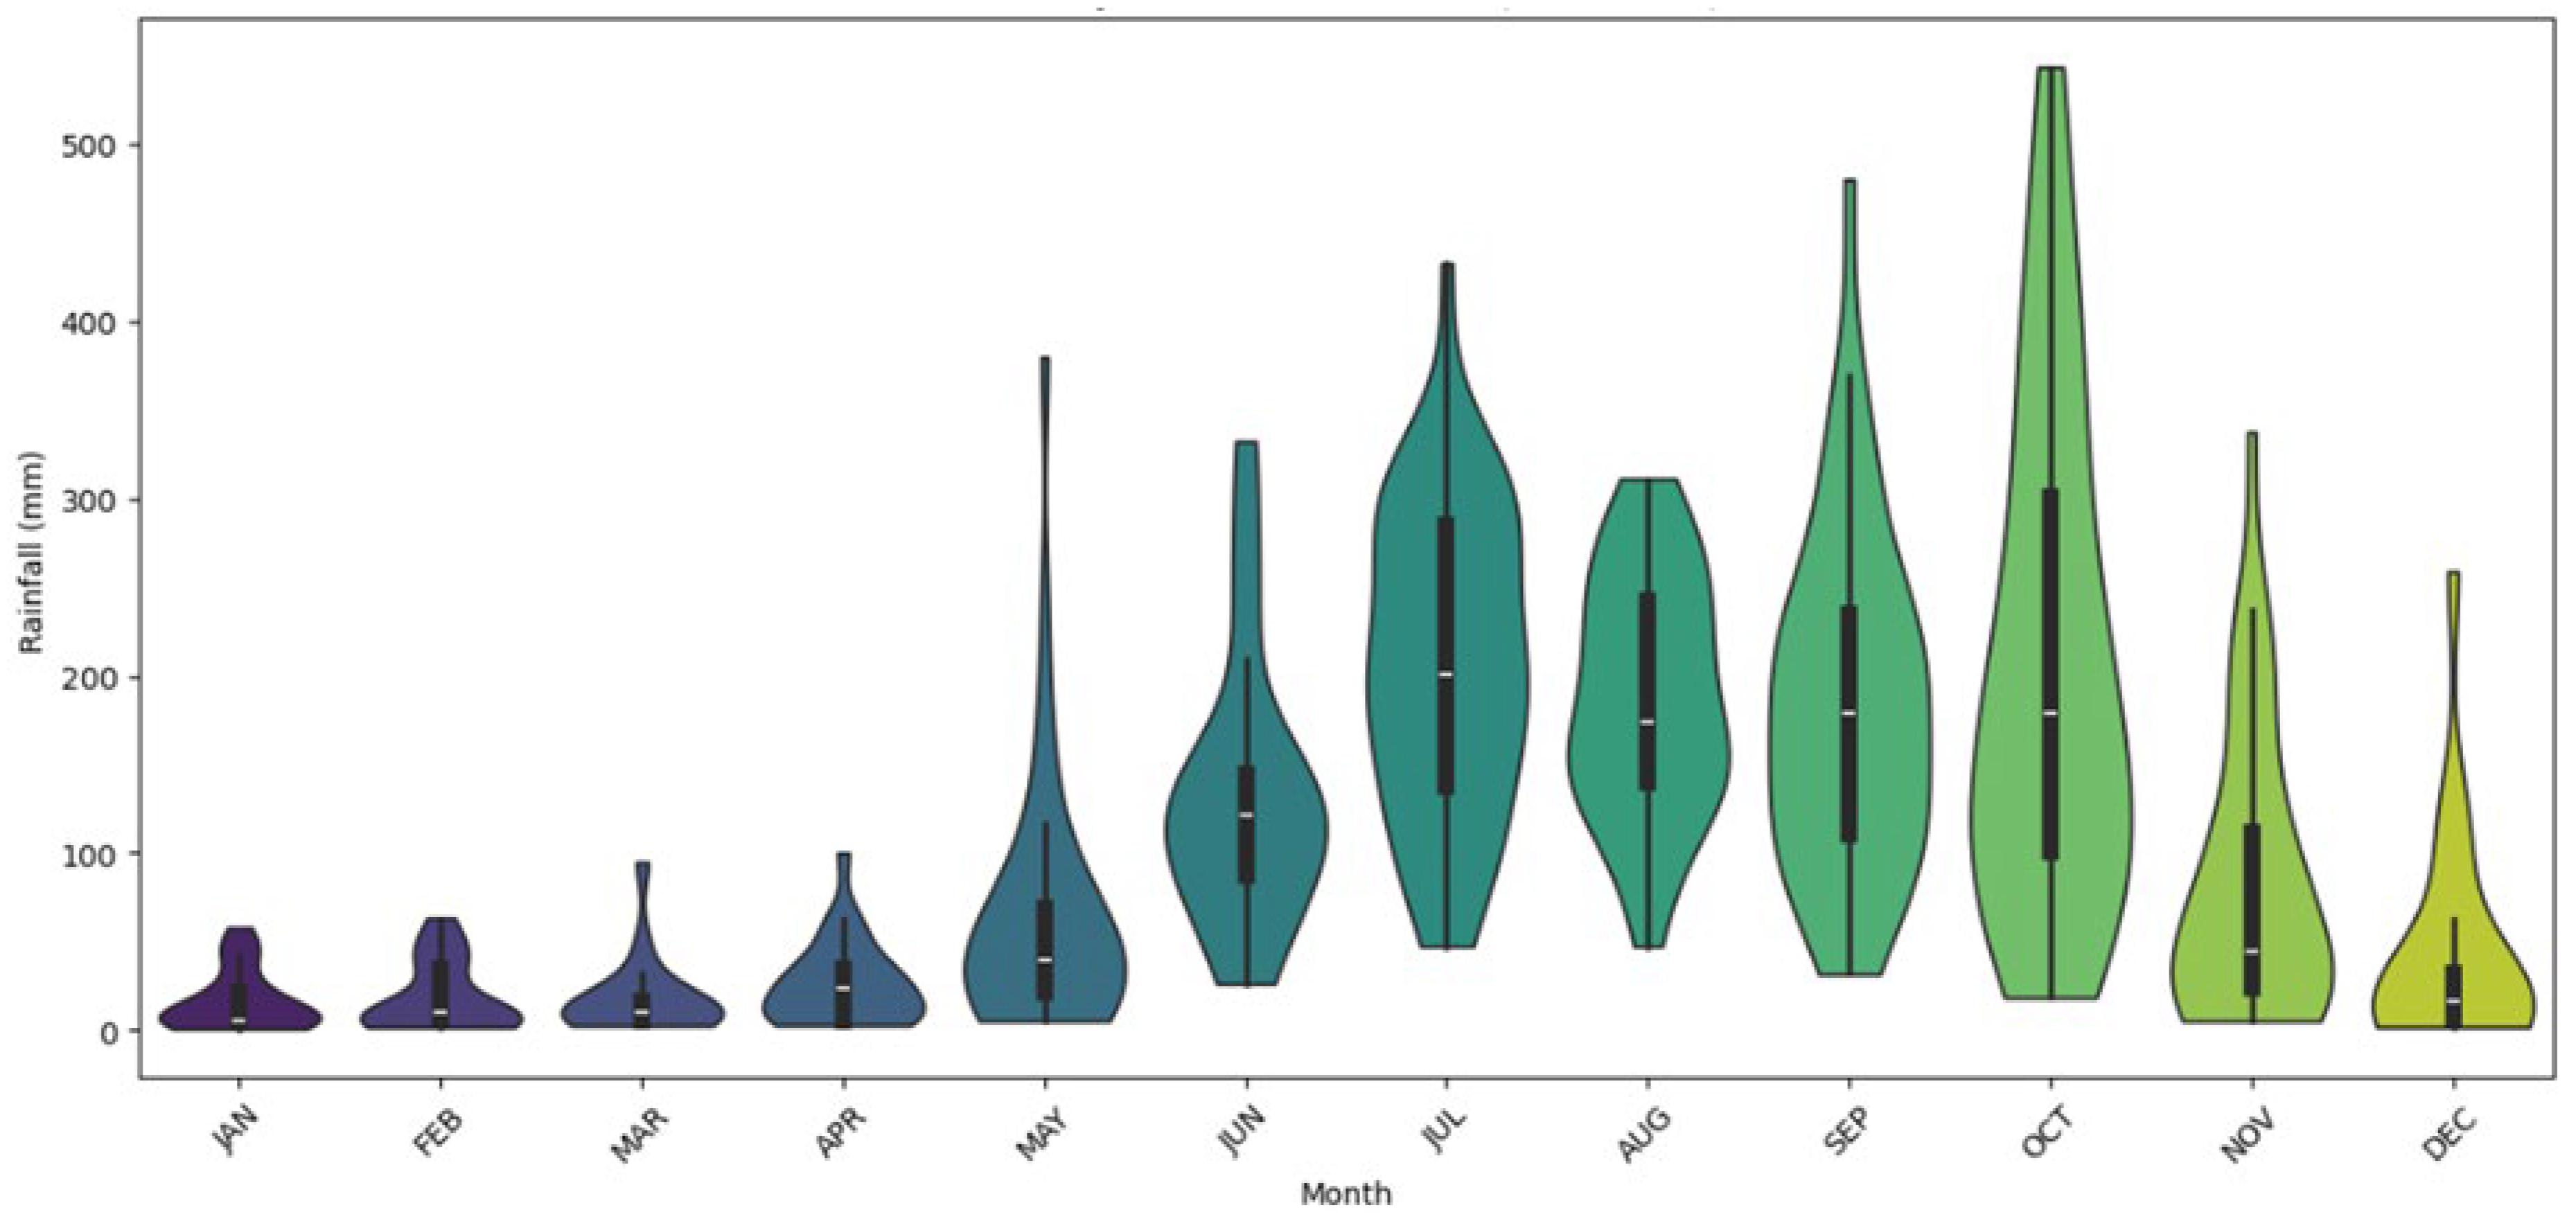
The main objective of the research was to explore the impact of precipitation on slope stability using numerical modeling. The process begins with collecting rainfall data, followed by conducting seepage analysis and slope stability assessment. Rainfall data from 1981 to 2023 were collected from NASA (data available at
https://power.larc.nasa.gov/data-access-viewer/ accessed on 10 September 2024). The monthly distribution of rainfall data is shown in
Figure 2. The monsoon season delivers the most precipitation to the region, whilst November and December convey the least. Monthly maximum data of rainfall are used for the study. Transient finite element stability analysis was conducted using multiple time steps, with a specific time step chosen for the stability evaluation. The maximum monthly rainfall value was used for the transient analysis, which was then divided into several time steps. Slope failure was assessed at a particular time step.
The monthly historical and future precipitation data for medium (SSP245) and severe (SSP585) shared socioeconomic pathways of the CMIP6 project for nine GCMs at the project location were obtained from Earth System Grid Federation (ESGF) (available at
https://esgf-data.dkrz.de/search/cmip6-dkrz/ accessed on 28 August 2024). Historical GCM data were used to find the candidate GCM that best represents the precipitation patterns in the study region. The GCM with the highest correlation with historical observed data was used to extract the precipitation flux for both mid-century (2036–2065) and the end of the century (2070–2099) [
20].
The steady-state flow analysis in SEEP/W, a module of GeoStudio software, was performed for accurate assessment of the seepage characteristics of a slope under various conditions. By modeling the slope’s geometry, material properties, and boundary conditions, SEEP/W simulates water flow through the slope. The analysis yields vital insights into components like pore pressure distribution, flow velocities, and potential seepage trajectory. This is essential to examine the steadiness of design features, such as drainage systems or impermeable barriers, in mitigating seepage hazards and maintaining the stability and integrity of the slope.
GeoStudio is a multifaceted tool used to simulate material behavior, including deformation and pore water pressure (PWP) distribution. It supports numerous types of analysis, covering dynamic, thermal, stability of slope, seepage, and stress–strain perusals [
21]. GeoStudio operates on the limit equilibrium (LE) principle and integrates finite element (FE) methods for examining the deformation and stability of embankment structures. Its complete suite of tools includes: SLOPE/W, SEEP/W, SIGMA/W, QUAKE/W, TEMP/W, CTRAN/W, and VADOSE/W for various loading scenarios on soil. These modules provide a comprehensive approach to geotechnical and environmental engineering challenges.
GeoStudio proficiently addresses both straightforward and complex geotechnical challenges, including geometry, soil strength, PWP, analysis methods, and various loading conditions. It is particularly effective at analyzing steady-state seepage, rapid drawdown scenarios, and transient conditions affecting embankment structures. In GeoStudio’s SEEP/W software, determining the phreatic line involves analyzing groundwater flow to locate the water table’s position. The phreatic line, which marks the boundary joining saturated and unsaturated zones, indicates where groundwater pressure equals atmospheric pressure. By envisaging the phreatic line, one can identify associated potential seepage areas, as water tends to flow along this path due to dissimilarities in hydraulic conductivity and boundary conditions. Understanding the phreatic line’s behavior is essential for assessing seepage hazards and implementing efficient mitigation strategies to ensure the stability and integrity of engineering structures [
3,
21,
22,
23,
24].
4. Seepage Analysis
The Laplace equation given below indicates seepage flow all round homogeneous isotropic medium in unvarying conditions:
A flow net, which reveals a combination of equipotential and flow lines, is a graphical solution to the Laplacian problem. Historically crucial for seepage analysis before computational methods, flow nets remain integral in understanding groundwater flow. Although their manual construction can be challenging, they offer insights into seepage behavior. While modern numerical solutions, like those provided by SEEP/W, have greatly replaced flow nets, they still offer valuable reference points [
25]. SEEP/W generates flow nets by ensuring that flow lines intersect equipotential lines at approximately right angles, facilitating the interpretation of results. In this software, the total hydraulic head is calculated as the sum of the elevation head and pressure head. The contours of the total hydraulic head represent surfaces of equal potential, like equipotential lines found in traditional flow nets. By plotting total head contours, SEEP/W visualizes these equipotential lines, providing insights into groundwater flow patterns and potential seepage paths. These contours allow engineers to associate areas of high and low hydraulic potential, aiding in the interpretation of seepage behavior and the design of efficient mitigation measures. Overall, total head contours were beneficial for understanding groundwater flow and its implications in engineering assessments [
26].
The SEEP/W module applies Darcy’s law, as expressed in Equation (2):
where q = specific discharge; i = hydraulic gradient; k = hydraulic conductivity.
The equation is applicable to both saturated and unsaturated conditions. In unsaturated conditions, however, the hydraulic conductivity (K) depends on the soil’s water content. The governing differential equation for two-dimensional seepage is expressed in Equation (3):
where H is equal to total head, k
x and k
y are hydraulic conductivity in x and y directions, Q is applied boundary flux, θ is volumetric water content (VWC), and t is time.
In transient conditions, pore air pressure (PAP) is assumed to remain constant at atmospheric levels. As a result, changes in volumetric water content are controlled by variations in pore water pressure (u
w). Accordingly, the equation employed in the SEEP/W FE program simplified to Equation (4):
where
mw is the storage curve slope.
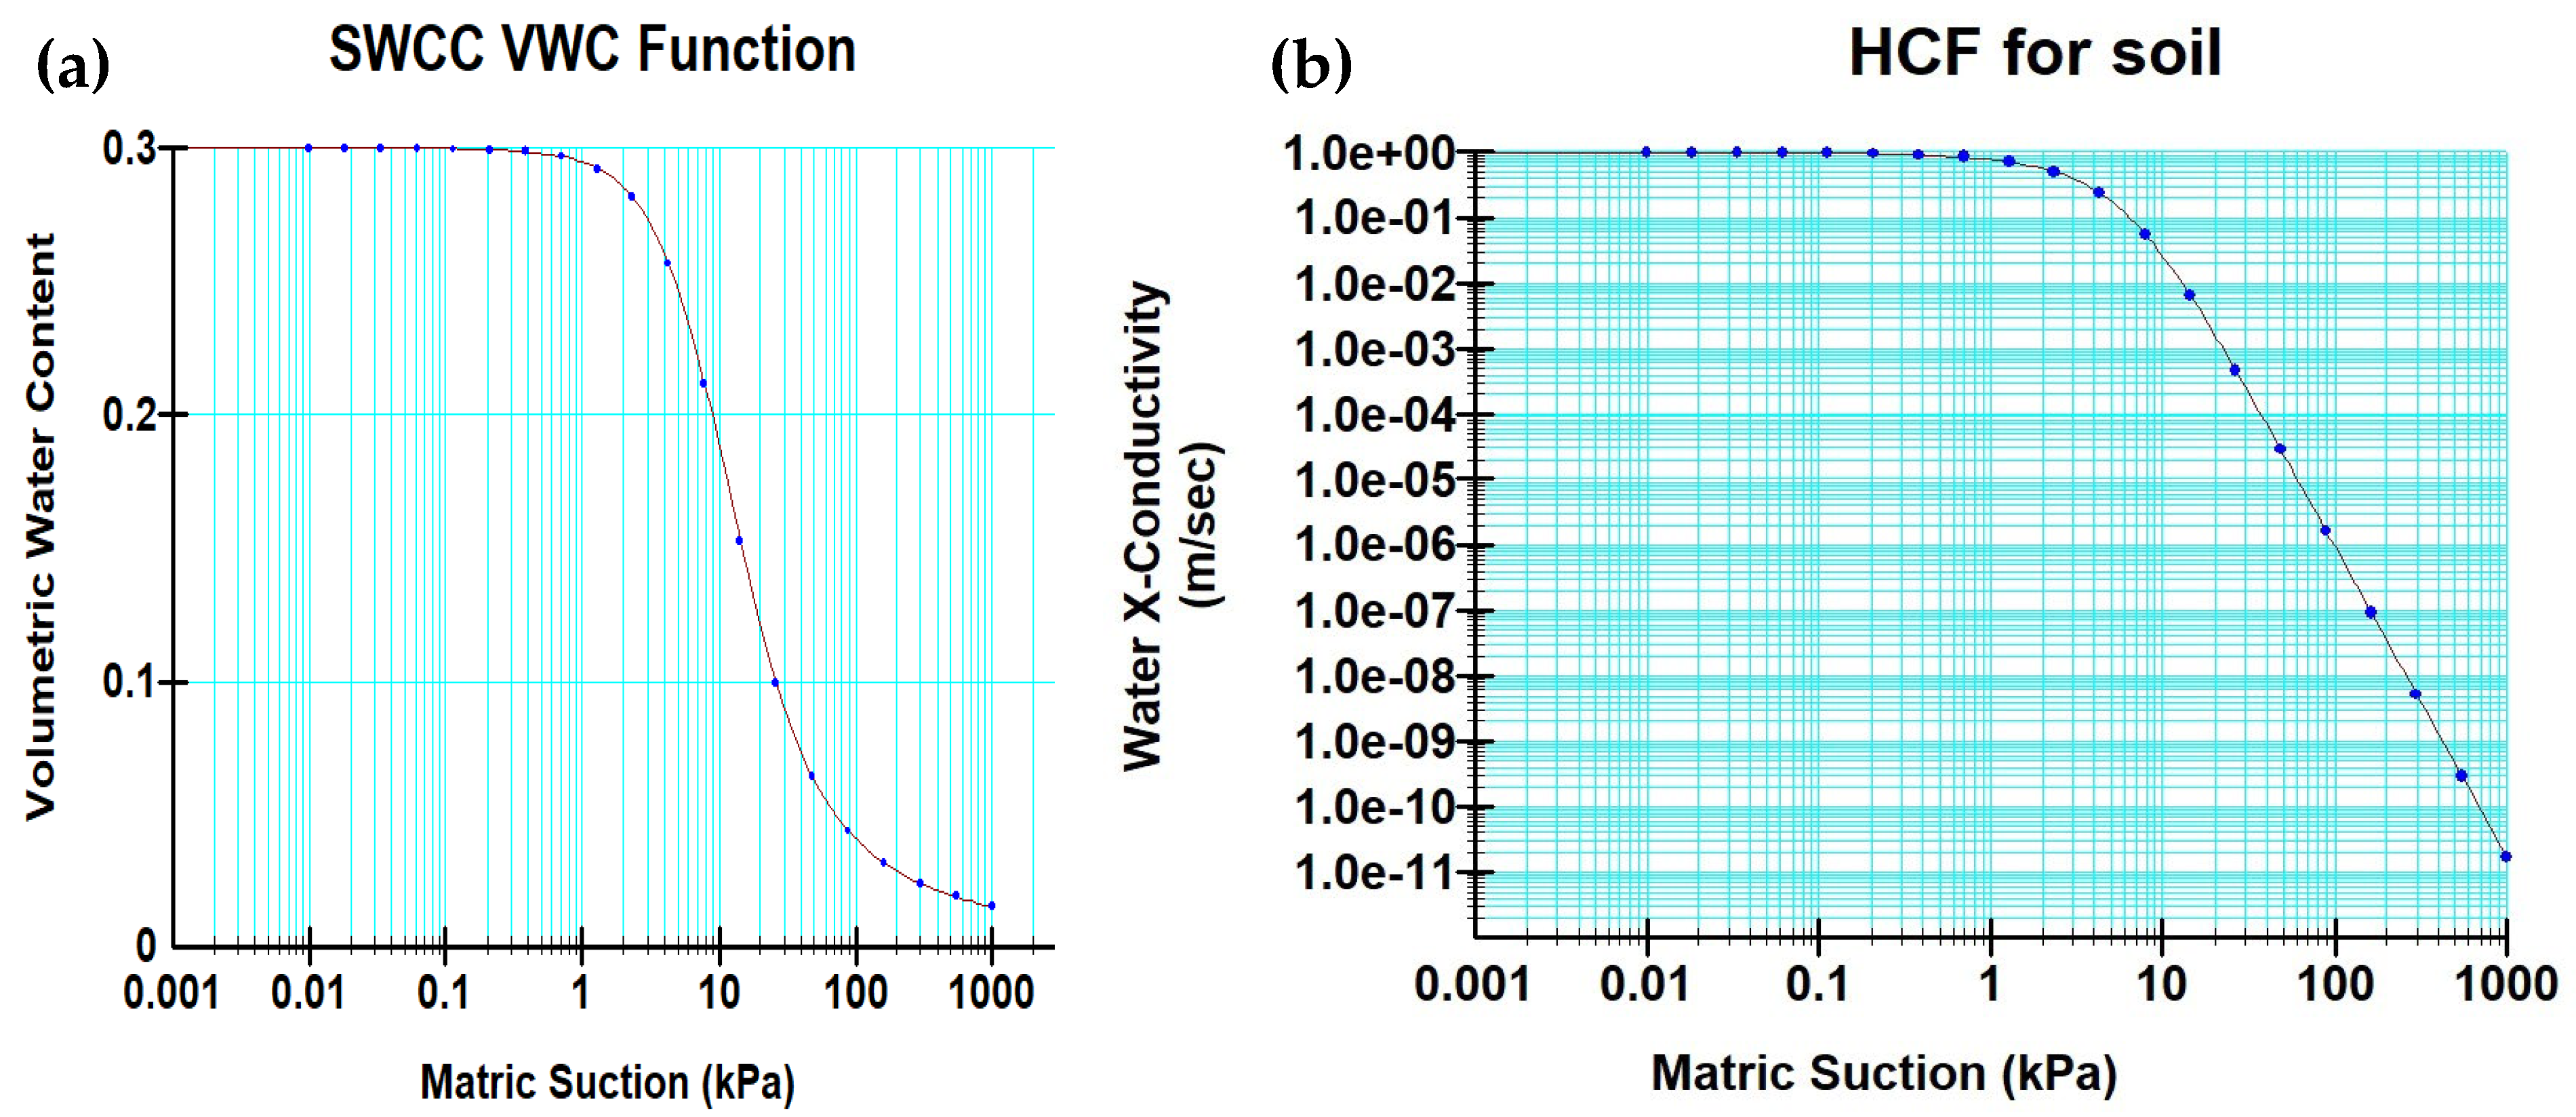
Prior to conducting seepage analysis, it is essential to define the soil or material properties and specify boundary conditions. Soil properties are typically represented using the volumetric water content (VWC) function, commonly referred to as the soil water characteristic curve (SWCC), along with the hydraulic conductivity (K) function within a framework for unsaturated and saturated materials. The VWC function can be derived using one of four built-in options available in GeoStudio software:
Figure 3 presents the VWC data point function, sample functions, Van Genuchten function, or Fredlund–Xing function. The parameters were determined using the least square method. The volumetric water content (VWC) of the soil–water characteristic curve (SWCC) was estimated based on the saturated–unsaturated material model, utilizing an estimation method as a sample function. The saturated volumetric water content was found to be 0.3, as derived from test results provided by the PPA. The collected soil sample was classified as silty sand (SM) through grain size analysis. The data points were estimated using the sample function and best-fit curve for silty sand. The curve was fitted with the root-mean square method. Additionally, the maximum suction value was determined, and the compressibility values were evaluated from the slope of the water content function.
Additionally, Van Genuchten (1980) introduced a closed-form equation for constructing the SWCC, which is expressed in Equation (5) [
27]:
Fredlund (1993) introduced a closed-form solution for constructing the soil water characteristic curve (SWCC) (Equation (6)), designed for negative pore water pressure values between 0 and 1 million kPa. This method relies on three key parameters and is mathematically expressed as [
28]:
where
θw,
θs, and
θr represent the natural volumetric water content, saturated volumetric water content, and residual volumetric water content, respectively, Ψ denotes the negative pore water pressure or matric suction, while a,
n, m are the curve fitting parameters in the Van Genuchten equation,
n = 1/(1 − m).
The parameter a, stated in kPa, is the pivot point around which the parameter n influences the function’s slope.
The curve’s sharpness when it enters the lower plateau is affected by the parameter m. Usually, the SWCC’s inflection point, represented by a (in kPa), is marginally greater than the air entrance value. In particular, the slope of the SWCC is controlled by the parameter n, and the residual water content is controlled by the value m.
SEEP/W offers two models to estimate unsaturated hydraulic conductivity, both of which use soil water characteristic curve (SWCC) as a key input. The SWCC can be obtained using either the Van Genuchten or Fredlund–Xing equation, both of which are available in the software can be applied using as functions of hydraulic data points. Van Genuchten and Mualem’s closed-form equation, commonly used for determining the hydraulic conductivity (K) function, requires the SWCC along with parameters like saturated hydraulic conductivity
(ks), saturated volumetric water content (
θs), and residual volumetric water content (
θr). A saturated–unsaturated material model was used. The volumetric water content function characterizes the volume of water as a function of matric suction (
ψ), which, assuming zero air pressure, is equivalent to negative pore water pressure. Hydraulic conductivity is a function of the volumetric water content and therefore indirectly a function of pore water pressure. Sample volumetric water content functions are available for a variety of soil particle size distributions, ranging from clay to gravel. These sample functions are generated by using characteristic curve-fit parameters in Equation (5). The volumetric water content function can also be estimated using the modified Kovacs model developed by Aubertin et al. (2003) [
29]. The model requires grain size data, specifically the particle diameter corresponding to 10% and 60% passing on the grain size curve (i.e., D
10 and D
60), along with the liquid limit of the soil.
5. Analysis of Slope Stability
Stability of a typical slope cross-section on the left bank of Polavaram is analyzed using the finite element software GeoStudio 2024 [
30,
31]. This software includes seven modules, with SEEP/W and SLOPE/W being employed to evaluate slope behavior. The investigation is conducted using plane strain conditions, and the slope is discretized with triangular elements. Before performing the slope stability analysis, initial PWP conditions are determined through transient analysis using SEEP/W. The slope stability model is subsequently revised with the outcomes of the current study. The negative PWP distribution within the slope is estimated based on a predetermined rainfall amount. To establish hydrostatic conditions within the slope, a steady-state seepage analysis was performed prior to the transient analysis. During the transient analysis, the infiltration rate, applied to the slope surface as a boundary flux, is calculated by dividing the total rainfall depth by the duration of the event [
32].
Unsaturated shear strength is calculated in GeoStudio’s SLOPE/W module using the Mohr–Coulomb (MC) failure model. This model offers two approaches to account for the effect of matric suction on soil shear strength. In this method, the angle
ϕb, which represents the rate of increase in strength with respect to matric suction, is used to determine the mobilized shear force at the base of each slice. SLOPE/W applies the shear strength equation (
τ), as formulated by Fredlund (1993) and Rahardjo et al. (2001), as given in Equation (7) [
33].
In this equation, c′ represents the effective cohesion of the soil, σn is the normal stress, ua is the pore-air pressure, uw is the pore-water pressure, ϕ′ is the effective friction angle of the soil, and ϕb is the angle that defines the increase in strength due to negative PWP. For practical applications, ϕb is often approximated as ϕ′/2.
While
ϕb is treated as a constant in the equation, it varies with the permeation, as observed by Lu et al. (2012) [
1]. In the capillary zone, saturated soil having subatmospheric pore-water pressure,
ϕb, is identical to the effective friction angle
ϕ′. As the soil becomes unsaturated,
ϕb reduces, reflecting reduced influence of negative PWP on the soil. More specifically,
ϕb is influenced by the SWCC.
In the second perspective, the shear strength equation
τ, introduced by Vanapalli et al. (1996), which is based on the SWCC, was utilized (Equation (8)) [
34].
The VWC in this equation is indicated by
θw, maximum water holding capacity as
θs, and the volumetric water content at residual conditions via
θr. When the soil is fully saturated, 100% of the suction contributes to its shear strength (
θw = θs). On the contrary hand, suction has no influence on strength soon after the water content reaches the residual level
(θw = θr). In essence, the suction’s contribution to shear strength is distributed using the water content function. Similar to the one suggested by Lu et al. (2012), this alternative equation (Equation (8)) is used in the current analysis for stress computation [
1].
The safety factor is then evaluated using Equation (9).
Here, Στr represents the sum of the enduring shear stresses calculated using the MC equation and interactive material parameters, while Στm denotes the sum of the applied shear stresses.
Slope stability analysis is carried out using four commonly used limit equilibrium (LE) methods: the Morgenstern–Price method, Janbu’s method, the ordinary method of slices (Fellenius), and Bishop’s simplified method. Each method varies in its approach to handling interslice forces, which are essential for maintaining equilibrium in the analysis. The Morgenstern–Price method establishes a functional relationship between interslice forces, ensuring that both force and moment equilibrium conditions are satisfied. Janbu’s method simplifies the analysis by assuming horizontal interslice forces and satisfies only force equilibrium. The Fellenius method, also known as the ordinary method of slices, neglects interslice forces entirely and satisfies only moment equilibrium. In contrast, Bishop’s simplified method assumes horizontal interslice forces but satisfies only moment equilibrium conditions.
6. Results and Discussion
The observed maximum monthly rainfall from 1980 to 2023 in the study area was 543.6 mm/month. A total of nine GCMs were selected to find the candidate GCM for the study area. The primary criterion of selecting the GCMs was the availability of historical, SSP245, and SSP585 data. Thes selected GCMs were Access-CM2, Access-ESM1-5, CASM-CSM1-0, CESM2, CESM2-WACCM, CIESM, CMCC-CSM-2-HR4, CMCC-CSM-2-SR5, and CMCC-ESM2. The GCM-simulated precipitation was compared with the observed precipitation to identify the candidate GCM. The correlation plot for different GCMs is shown in
Figure S1 Supplementary Materials S2.
It can be observed from
Figure S2 that CMCC_ESM2 GCM has the highest agreement with the observed precipitation. Thus, it was considered as a candidate GCM.
For the mid-century period (2036–2065), maximum monthly rainfall values were obtained from the candidate GCM, CMCC-ESM2 under SSP245 and SSP585 scenarios, with values of 688.56 mm/month and 759.37 mm/month, respectively. For the end-century period (2070–2099), the maximum monthly rainfall values from CMCC-ESM2 were 706.59 mm/month for SSP245 and 787.86 mm/month for SSP585. The corresponding water flux values used for transient analysis were 2.1 × 10⁻⁷ m3/s/m2 for the observed period (2018–2023), and for the end-century period, water flux values were 2.64 × 10⁻⁷ m3/s/m2 for SSP245 and 2.94 × 10⁻⁷ m3/s/m2 for SSP585. These projections provide insights into future rainfall patterns and their potential impacts on stability of slope under different climate change scenarios.
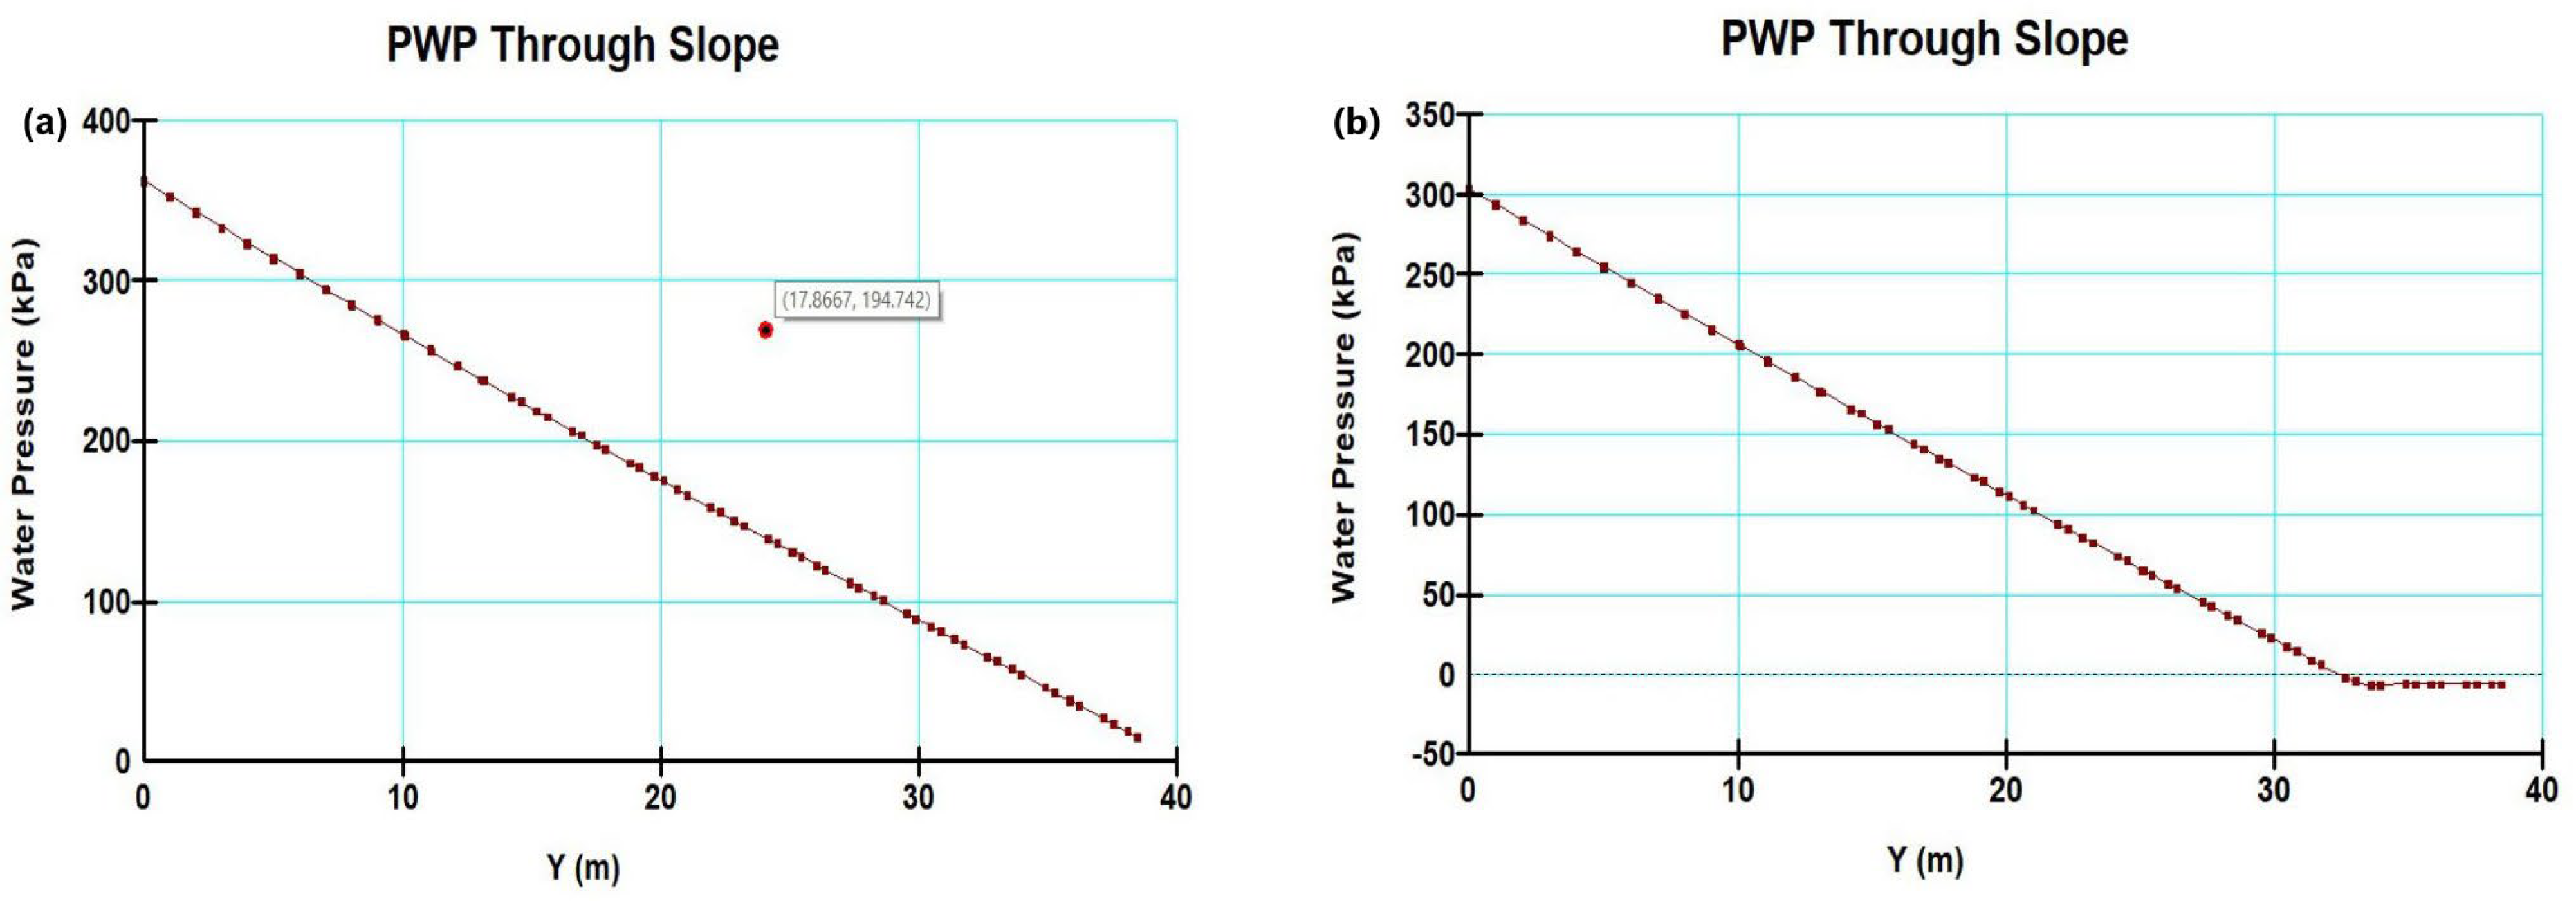
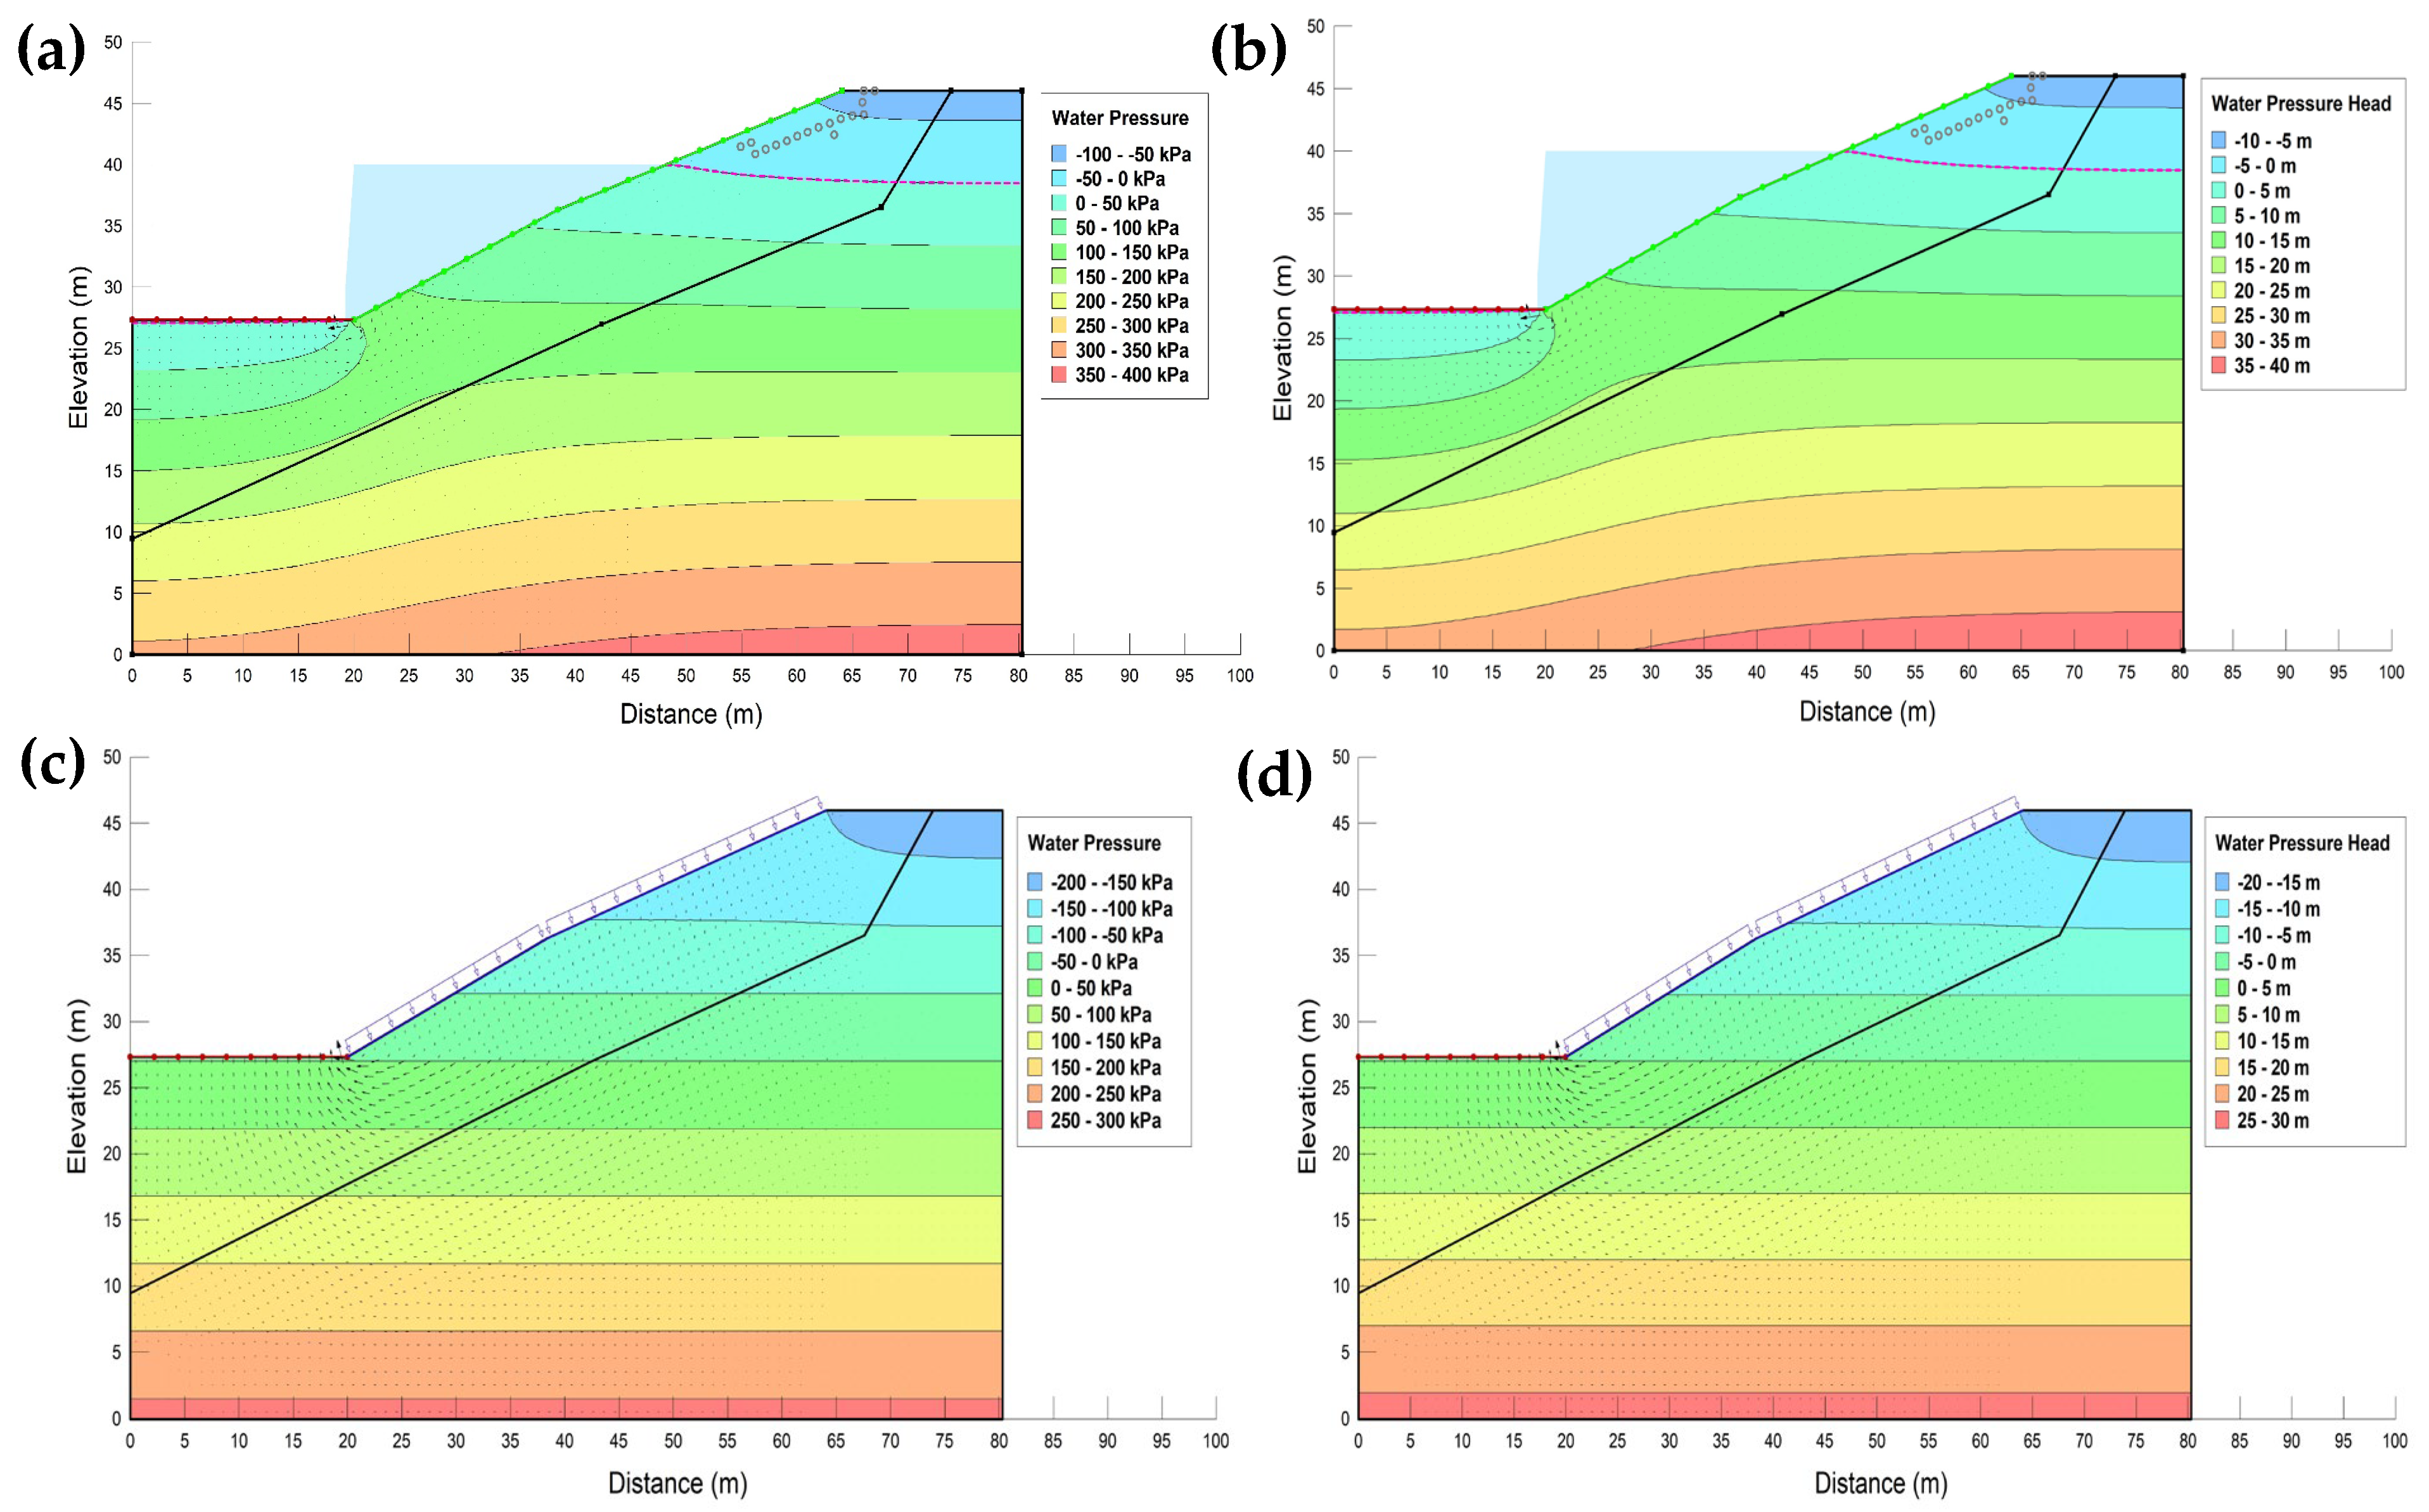
The results from the numerical analyses of seepage and slope stability are used to assess changes in the water table, the reduction in suction within the slope caused by rainfall infiltration, and the corresponding impact on the factor of safety. The distribution of pore water pressure (PWP) across the slope, for both in weathered soil and rock, under steady-state and transient conditions, is illustrated in
Figure 4a,b.
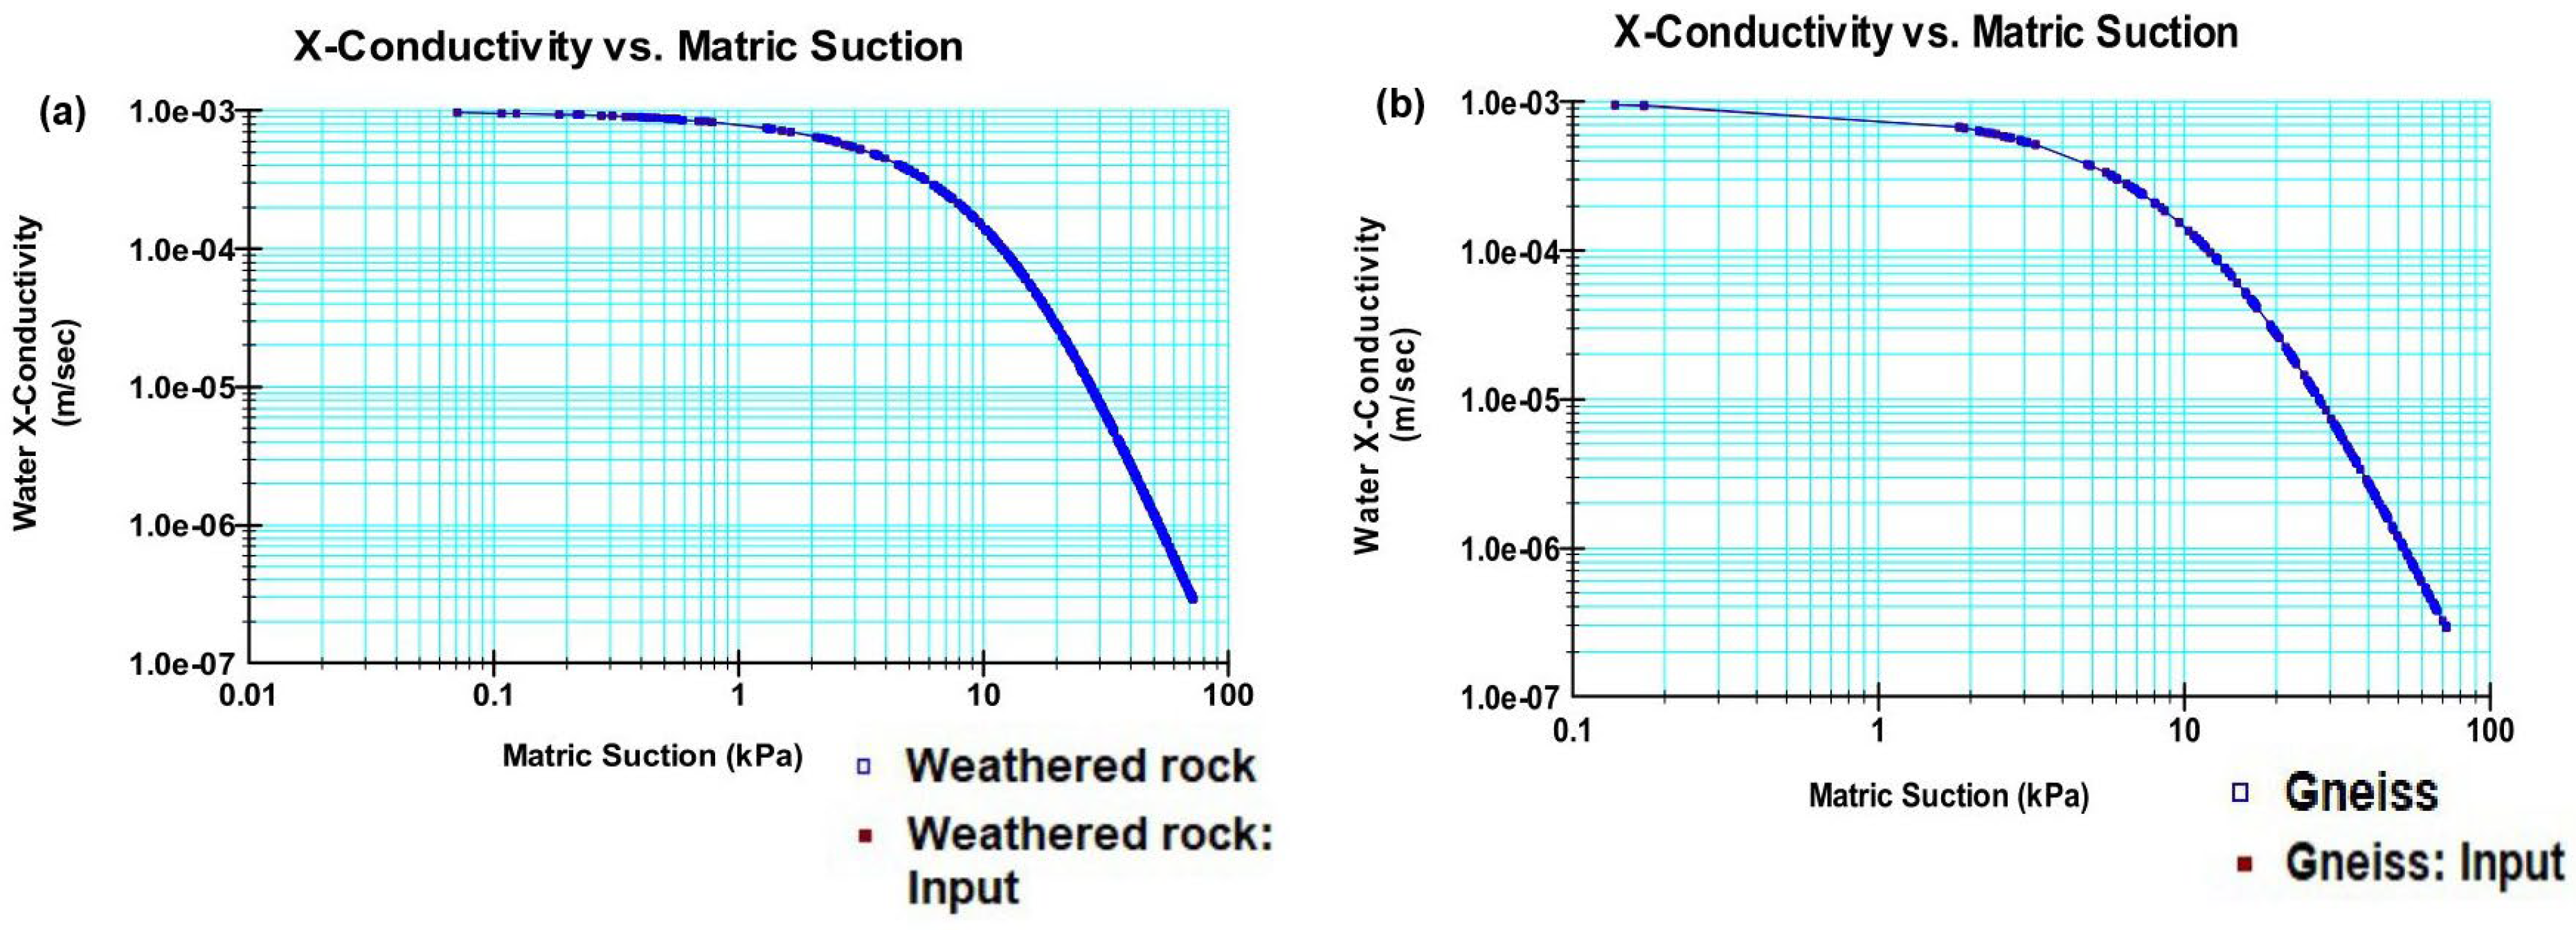
It is evident from the function characterizing the relationship between hydraulic conductivity (K) and matric suction (i.e., negative pore water pressure) that coarse materials have higher conductivity than fine materials at low suction levels near saturation. However, at higher suction levels, coarse materials have lower conductivity, which may seem counterintuitive, as shown in
Figure 5.
Pore water pressure in stability analysis can be determined through steady-state or transient groundwater flow perusal, transient stress–strain consolidation analysis, or dynamic stress–strain analysis with calculations of excess PWP. The variation in PWP for steady-state conditions is illustrated in
Figure 6a, while the corresponding variation in water pressure head is shown in
Figure 6b. For transient analysis, the changes in PWP are presented in
Figure 6c, and the variation in water pressure head is depicted in
Figure 6d.
Under steady-state conditions, rising pore pressure in the soil lowers effective stresses, which can lead to slope failure. In transient analysis, prolonged rainfall with low intensity increases soil moisture and permeability, making the upper layers of soil or weathered rock more vulnerable to infiltration.
7. Strength Degradation and Failure Mechanism
According to the model, water accumulated at the soil–rock interface upon the arrival of the wetting front due to the impermeable surrounding rock layer, and a lateral seepage flow occurred along the contact area. Seepage flow intensifies with increased rainwater infiltration, which causes pore water pressure to build up along the soil–rock connection. Therefore, the reduction in shear strength at the soil–rock interface leads to soil deformation above the interface, possibly triggering slope failure or landslides.
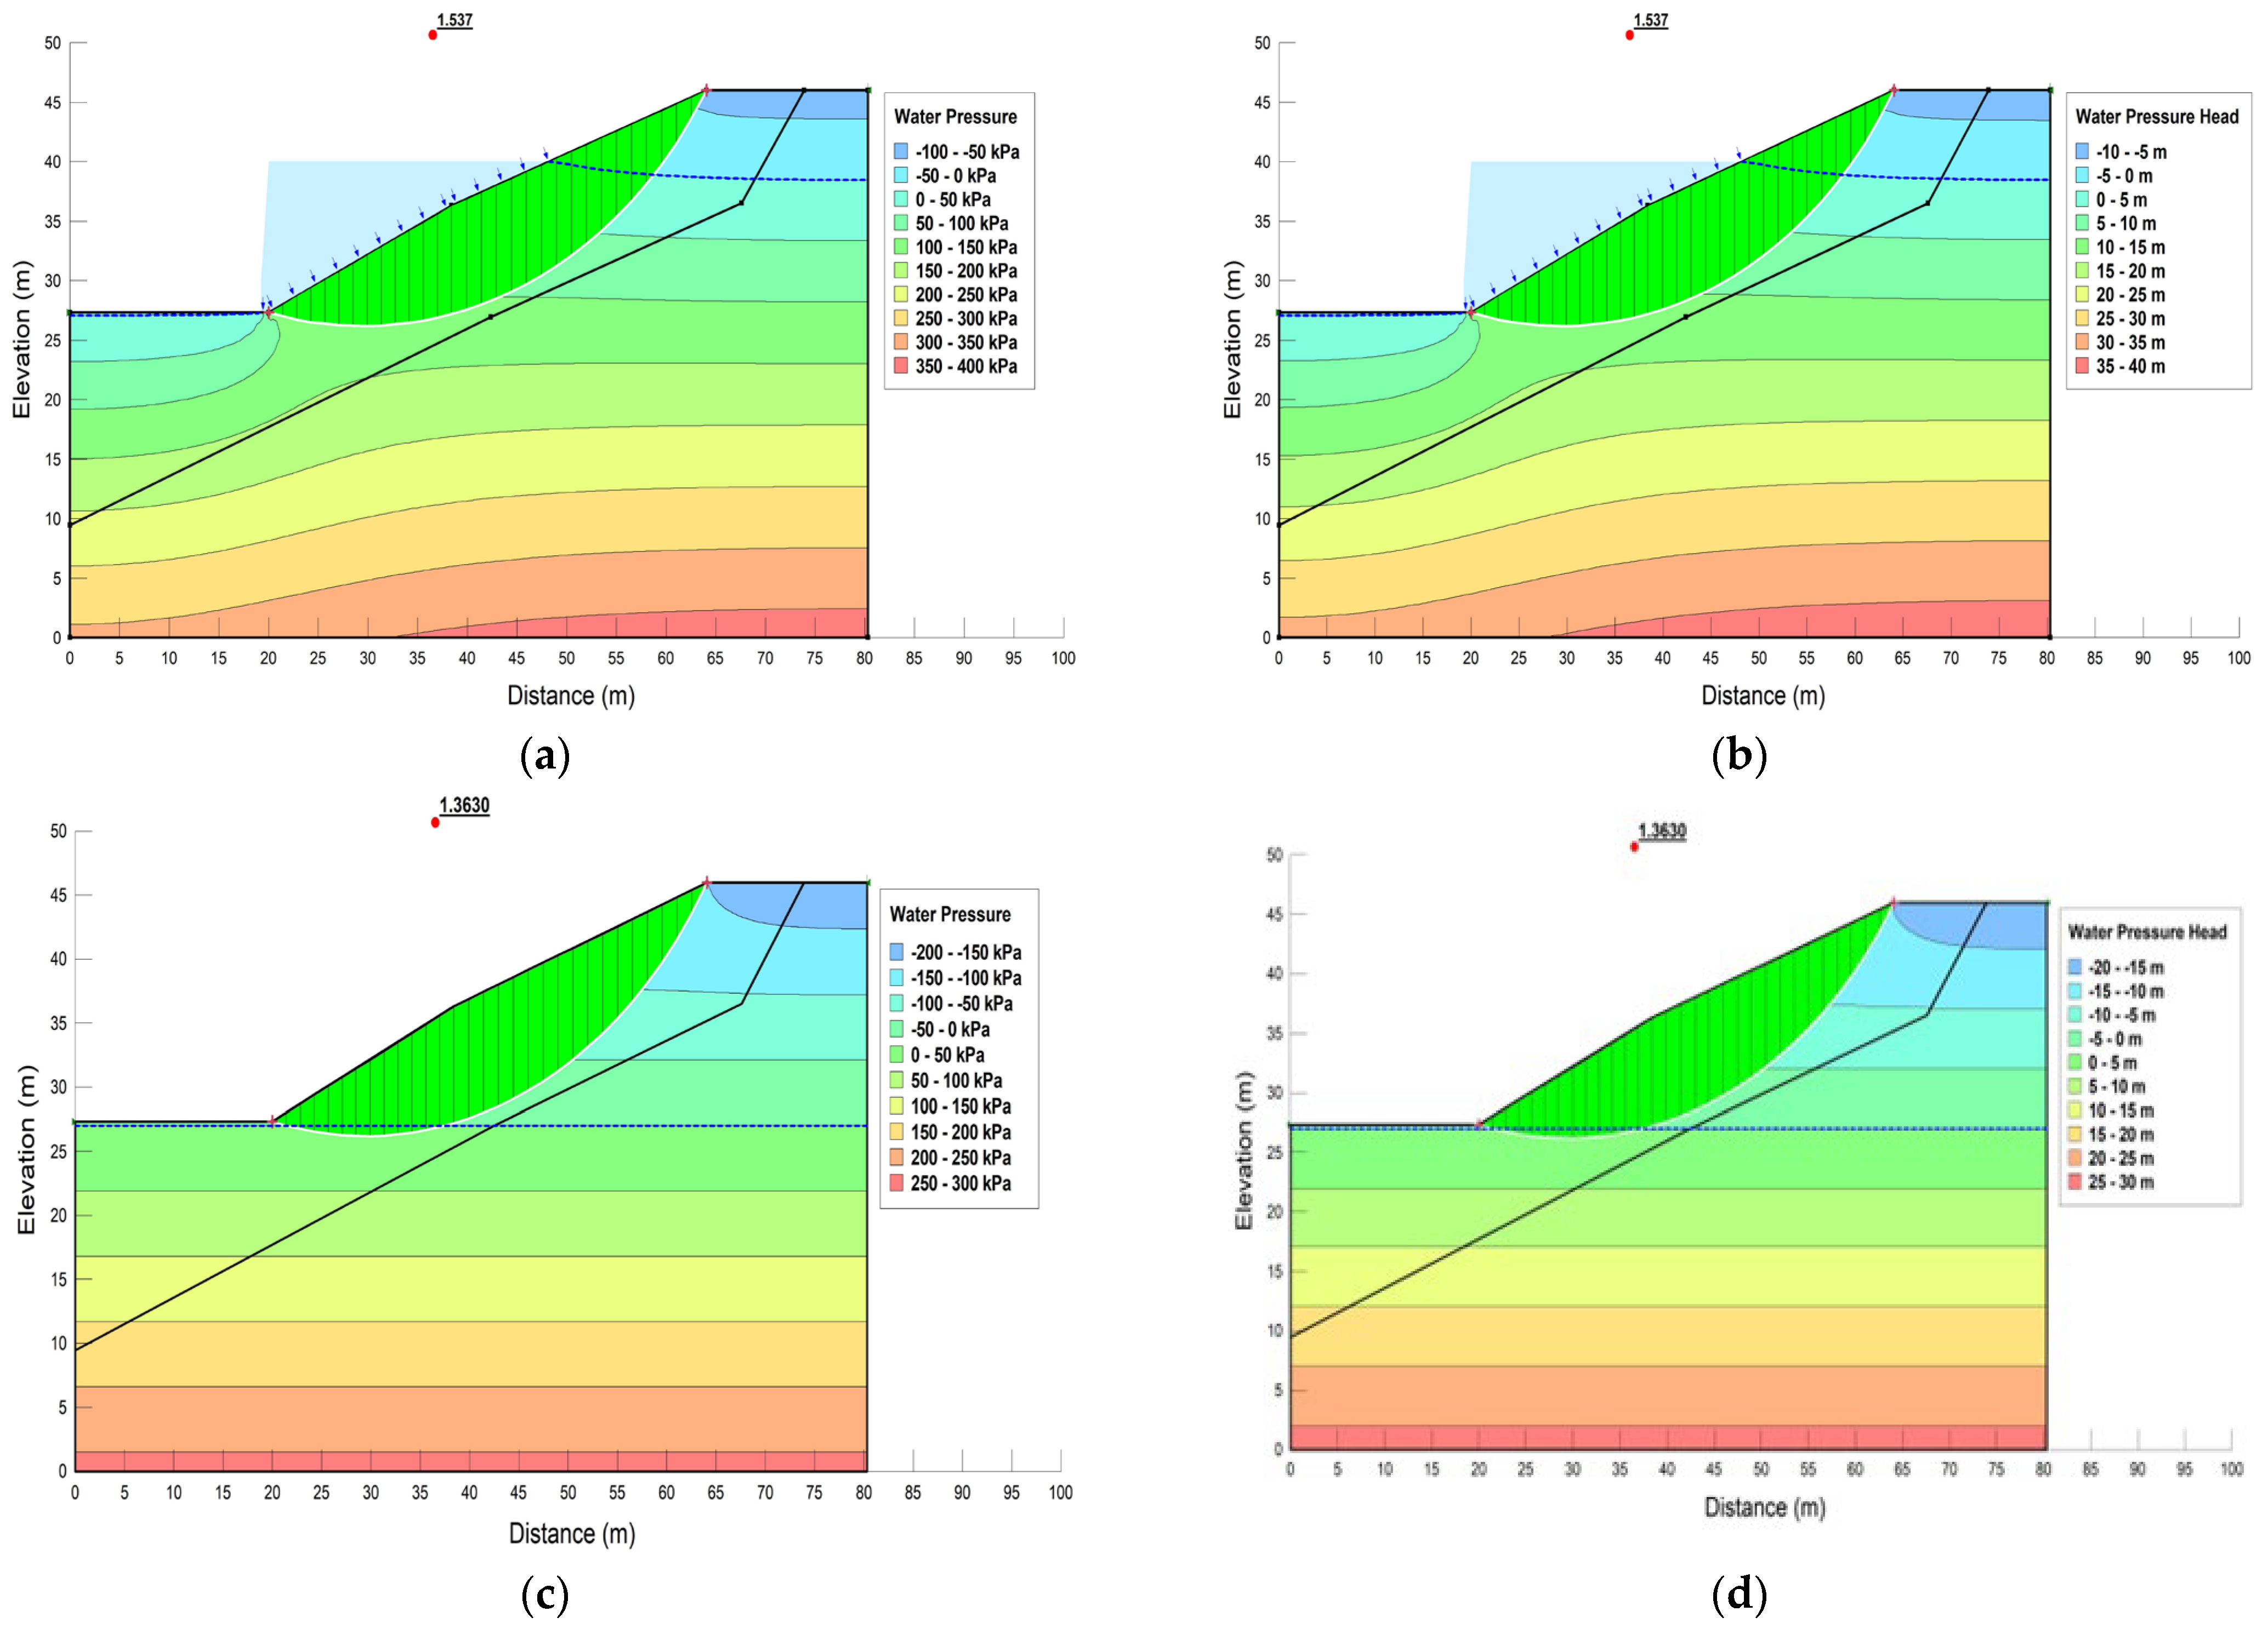
The safety factors of the slope under pressure head and PWP conditions are shown in
Figure 7a,b. PWP is calculated using the finite element based on the centroid of each column-based element. PWP values can exhibit asymmetrical distribution and vary across column-based elements at different time periods when analyzed using the finite element method.
The factors of safety (FoSs) of the slope under pressure head and pore water pressure conditions for time periods ranging from 1980 to 2100 for maximum monthly rainfall under transient analysis, based on water flux, are shown in
Figure 6c,d, respectively. The difference of FoS is negligible due to a small increase in observed water flux values from 2.1 × 10
−7 m
3/s/m
2 to 2.94 × 10
−7 m
3/s/m
2 for maximum projected values for the end of the century considering ssp585. However, the inclusion of rainfall flux reduced the FoS from 1.537 to 1.34, a reduction of approximately ~ 13%. PWPs can have any irregular or non-uniform distribution and pattern, which can be modeled using the finite element method. The FoS of the critical slip surface was evaluated at multiple time steps for the transient analysis. Dhanai et al. (2022) indicated that the FoS for a slope is stable under rainfall intensity for periods from 2015–2050 and later the FoS decreased for periods 2051–2075 and 2075–2100 and Kim et al. (2022) indicate that failure occurs in low-permeability soil with 5-day rainfall and high-permeability soil with maximum daily rainfall.
8. Conclusions
A numerical investigation was conducted to examine the impact of precipitation intensity and infiltration on the stability of rock slopes. The slope model incorporated the average monthly rainfall and infiltration rates for both steady and transient analyses. The following results were obtained from the analysis.
As soil suction diminishes, the stability of the slope gradually weakens. Rainfall infiltration reduces the matric suction within the soil, resulting in a decrease in the effective shear strength of the soil and, consequently, a lower factor of safety.
The transient analysis was conducted over a 30-day period, accounting for multiple rainfall events. The safety factor for slope stability was determined at the critical time for the most critical slip surface.
The safety factor was 1.54 prior to accounting for rainfall. However, after considering the impact of rainfall intensity, the FoS decreased to 1.34 for both observed and projected rainfall up to the end of the century based on CMIP6 GCMs.
Thus, it is evident that precipitation plays a crucial role in the design of rock slopes and sustainability of the slopes. Also, such studies should include climate change projections for the long-term sustainability of projects.
The mechanisms of rainfall-induced slope instability in tropical regions are primarily driven by the infiltration of intense rainfall, which reduces matric suction and increases pore water pressure (PWP), ultimately decreasing shear strength and triggering slope failure. In the present study, the safety factor of the investigated rock slope near the tunnel portal reduced by ~15% after accounting for rainfall infiltration, highlighting the destabilizing impact of transient seepage. Under future climate change scenarios (SSP245 and SSP585), the associated risk is likely to increase due to more frequent and extreme rainfall events. However, the current research does not address the role of dynamic forces, such as seismic activity, which could further influence slope stability. Additionally, future studies should explore the impacts of temperature variations and fluctuations in the groundwater table to develop a more comprehensive understanding of the slope response under evolving climatic conditions. A detailed, site-specific analysis that integrates hydrological, geotechnical, and climatic factors is essential for designing effective mitigation and adaptation strategies. Future research should also focus on improving local-scale climate data, considering multiple temporal scales and other extreme climate-related scenarios, validating models with long-term field monitoring, and addressing modeling uncertainties. Furthermore, combining early warning systems, sustainable land management practices, and engineering solutions will be critical in reducing the vulnerability of tropical regions to rainfall-induced landslides.
Author Contributions
Conceptualization: R.K.P., K.M. and C.S.; Data curation: R.K.P., K.M., C.S. and A.K.S.; Formal analysis: R.K.P. and C.S.; Investigation: R.K.P., K.M. and C.S.; Methodology: R.K.P., K.M., C.S. and A.K.S.; Project administration and supervision: K.M., C.S. and A.K.S.; Software: S.K.S., A.K.S., R.K.P. and C.S.; Resources: R.K.P., K.M., C.S., A.K.S. and S.K.S.; Validation: R.K.P., K.M., C.S. and A.K.S.; Visualization: R.K.P. and C.S.; Writing—original draft: R.K.P. and K.M.; Writing—review and editing: R.K.P., K.M., C.S., A.K.S. and S.K.S. All authors have read and agreed to the published version of the manuscript.
Funding
This research received no specific grant from any funding agency in the public, commercial, or not-for-profit sectors.
Data Availability Statement
The data that support the findings of this study are available from the corresponding author upon reasonable request.
Acknowledgments
The authors extend their gratitude to the Superintending Engineer (SE), Deputy Executive Engineer (DEE), Assistant Executive Engineer (AEE), and Junior Engineer (JE) of the PIPHW Circle in Dowlaiswaram, as well as the Manager at M/s Max Infra (MIL) for granting permission and providing essential field data for this study. Appreciation is also extended to KSRM College of Engineering (A) for laboratory facilities and continuous support throughout the research.
Conflicts of Interest
The authors declare that they have no conflicts of interest.
References
- Lu, N.; Şener-Kaya, B.; Wayllace, A.; Godt, J.W. Analysis of rainfall-induced slope instability using a field of local factor of safety. Water Resour. Res. 2012, 48, W09524. [Google Scholar] [CrossRef]
- Kim, Y.; Rahardjo, H.; Nistor, M.M.; Satyanaga, A.; Leong, E.C.; Sham, A.W.L. Assessment of critical rainfall scenarios for slope stability analyses based on historical rainfall records in Singapore. Environ. Earth Sci. 2022, 81, 39. [Google Scholar] [CrossRef]
- Chen, M.L.; Qi, S.C.; Lv, P.F.; Yang, X.G.; Zhou, J.W. Hydraulic response and stability of a reservoir slope with landslide potential under the combined effect of rainfall and water level fluctuation. Environ. Earth Sci. 2021, 80, 25. [Google Scholar] [CrossRef]
- Sharma, C.; Ojha, C.S.P. Study of Twenty-first Century Precipitation and Temperature Trends Over Ganga River Basin. In The Ganga River Basin: A Hydrometeorological Approach; Springer: Cham, Switzerland, 2021; pp. 273–290. [Google Scholar]
- Dhanai, P.; Singh, V.P.; Soni, P. Rainfall Triggered Slope Instability Analysis with Changing Climate. Indian Geotech. J. 2022, 52, 477–492. [Google Scholar] [CrossRef]
- Lee, M.L.; Ng, K.Y.; Huang, Y.F.; Li, W.C. Rainfall-induced landslides in Hulu Kelang area, Malaysia. Nat. Hazards 2014, 70, 353–375. [Google Scholar] [CrossRef]
- Anderson, M.G. Using a combined slope hydrology/stability model to identify suitable conditions for landslide. Earth Surf. Process. Landf. 1996, 21, 737–747. [Google Scholar]
- Huang, C.C.; Lo, C.L.; Jang, J.S.; Hwu, L.K. Internal soil moisture response to rainfall-induced slope failures and debris discharge. Eng. Geol. 2008, 101, 134–145. [Google Scholar] [CrossRef]
- Hennrich, K.; Crozier, M.J. A hillslope hydrology approach for catchment-scale slope stability analysis. Earth Surf. Process. Landf. 2004, 29, 599–610. [Google Scholar] [CrossRef]
- Gong, Q.; Wang, J.; Zhou, P.; Guo, M. A Regional Landslide Stability Analysis Method under the Combined Impact of Rainfall and Vegetation Roots in South China. Adv. Civ. Eng. 2021, 2021, 5512281. [Google Scholar] [CrossRef]
- Lee, L.M.; Gofar, N.; Rahardjo, H. A simple model for preliminary evaluation of rainfall-induced slope instability. Eng. Geol. 2009, 108, 272–285. [Google Scholar] [CrossRef]
- Cooper, M. Advanced Bash-Scripting Guide An in-depth exploration of the art of shell scripting Table of Contents. Okt 2005, 2274, 2267–2274. [Google Scholar]
- Pradhan, S.; Toll, D.G.; Rosser, N.J.; Brain, M.J. An investigation of the combined effect of rainfall and road cut on landsliding. Eng. Geol. 2022, 307, 106787. [Google Scholar] [CrossRef]
- Chen, X.; Guo, H.; Song, E. Analysis method for slope stability under rainfall action. In Landslides and Engineered Slopes. From the Past to the Future; CRC Press: Boca Raton, FL, USA, 2008; pp. 1507–1515. [Google Scholar] [CrossRef]
- Gian, Q.A.; Tran, D.T.; Nguyen, D.C.; Nhu, V.H.; Tien Bui, D. Design and implementation of site-specific rainfall-induced landslide early warning and monitoring system: A case study at Nam Dan landslide (Vietnam). Geomat. Nat. Hazards Risk 2017, 8, 1978–1996. [Google Scholar] [CrossRef]
- Wienhöfer, J.; Lindenmaier, F.; Zehe, E. Challenges in Understanding the Hydrologic Controls on the Mobility of Slow-Moving Landslides. Vadose Zone J. 2011, 10, 496–511. [Google Scholar] [CrossRef]
- Lee, H.; Calvin, K.; Dasgupta, D.; Krinner, G.; Mukherji, A.; Thorne, P. IPCC Sixth Assessment Report—Synthesis Report; IPCC: Geneva, Switzerland, 2022. [Google Scholar]
- Mohan, R.V.R. The Polavaram Project on Rive Godavari: Major Losses, Minor Gains. In Water Conflicts in India; Routledge: Delhi, India, 2020; pp. 318–324. [Google Scholar]
- Farr, T.G.; Kobrick, M. Shuttle radar topography mission produces a wealth of data. Eos 2000, 81, 583–585. [Google Scholar] [CrossRef]
- Wootten, A.M.; Başağaoğlu, H.; Bertetti, F.P.; Chakraborty, D.; Sharma, C.; Samimi, M.; Mirchi, A. Customized Statistically Downscaled CMIP5 and CMIP6 Projections: Application in the Edwards Aquifer Region in South-Central Texas. Earth’s Future 2024, 12, e2024EF004716. [Google Scholar] [CrossRef]
- Devi, D.D.L.; Anbalagan, R. Study on Slope Stability of Earthen Dams by using GEOSTUDIO Software. Anbalagan R Int. J. Adv. Res. 2017, 3, 408–414. [Google Scholar]
- Deka, A.; Daulagupu, R.; Brahma, H.; Lodger, H.; Dutta, D. Effect of Antecedent Rainfall on Slope Stability—A Case Study of Haflong Hill, North East India. J. Geol. Soc. India 2020, 96, 394–398. [Google Scholar] [CrossRef]
- Kamanbedast, A.; Delvari, A. Analysis of earth dam: Seepage and stability using ansys and geo-studio software. World Appl. Sci. J. 2012, 17, 1087–1094. [Google Scholar]
- Nedawi, N.M.; Al-Hadidi, M.T. Seepage and Slope Stability Analysis for Hemrin Earth Dam in Iraq Using Geo-Studio Software. Solid State Technol. 2020, 63, 3434–3448. [Google Scholar]
- Hadi, A.J.; Mohammed, T.A.; Tayebian, A. A study on seepage data utilized in the safety assessment of Haditha Dam: A simulation by SEEP/W model. Environ. Health Eng. Manag. J. 2024, 11, 285–292. [Google Scholar] [CrossRef]
- Arshad, I. Finite Element Analysis of Seepage and Exit Gradient underneath a Hydraulic Structure (Weir) by Using Geo-Slope (SEEP/W) Software. Int. J. Altern. Fuels Energy 2022, 6, 18–26. [Google Scholar]
- van-Genuchten, V.M. A closed-form equation for predicting the hydraulic conductivity of unsaturated soils. Soil Sci. Soc. Am. J. 1980, 44, 892–898. [Google Scholar] [CrossRef]
- Fredlund, D.G. Soil Mechanics for Unsaturated Soils; John Wiley & Sons Inc.: Hoboken, NJ, USA, 1993; Volume 517. [Google Scholar]
- Aubertin, M.; Mbonimpa, M.; Bussière, B.; Chapuis, R.P. A model to predict the water retention curve from basic geotechnical properties. Can. Geotech. J. 2003, 40, 1104–1122. [Google Scholar] [CrossRef]
- Geo-Slope International Ltd. Seepage Modeling with SEEP/W; Geo-Slope International Ltd.: Calgary, AB, Canada, 2012. [Google Scholar]
- Krahn, J. Seepage Modeling with SEEP/W: An Engineering Methodology; Geo-Slope International Ltd.: Calgary, AB, Canada, 2004. [Google Scholar]
- GeoSlope International Ltd. Slope/W User’s Guide for Slope Stability Analysis; Geo-Slope İnternational Ltd.: Calgary, AB, Canada, 2007. [Google Scholar]
- Rahardjo, H.; Li, X.W.; Toll, D.G.; Leong, E.C. The effect of antecedent rainfall on slope stability. Geotech. Geol. Eng. 2001, 19, 371–399. [Google Scholar] [CrossRef]
- Vanapalli, S.K.; Fredlund, D.G.; Pufahl, D.E.; Clifton, A.W. Model for the prediction of shear strength with respect to soil suction. Can. Geotech. J. 1996, 33, 379–392. [Google Scholar] [CrossRef]
| Disclaimer/Publisher’s Note: The statements, opinions and data contained in all publications are solely those of the individual author(s) and contributor(s) and not of MDPI and/or the editor(s). MDPI and/or the editor(s) disclaim responsibility for any injury to people or property resulting from any ideas, methods, instructions or products referred to in the content. |
© 2025 by the authors. Licensee MDPI, Basel, Switzerland. This article is an open access article distributed under the terms and conditions of the Creative Commons Attribution (CC BY) license (https://creativecommons.org/licenses/by/4.0/).


 ,
, 


