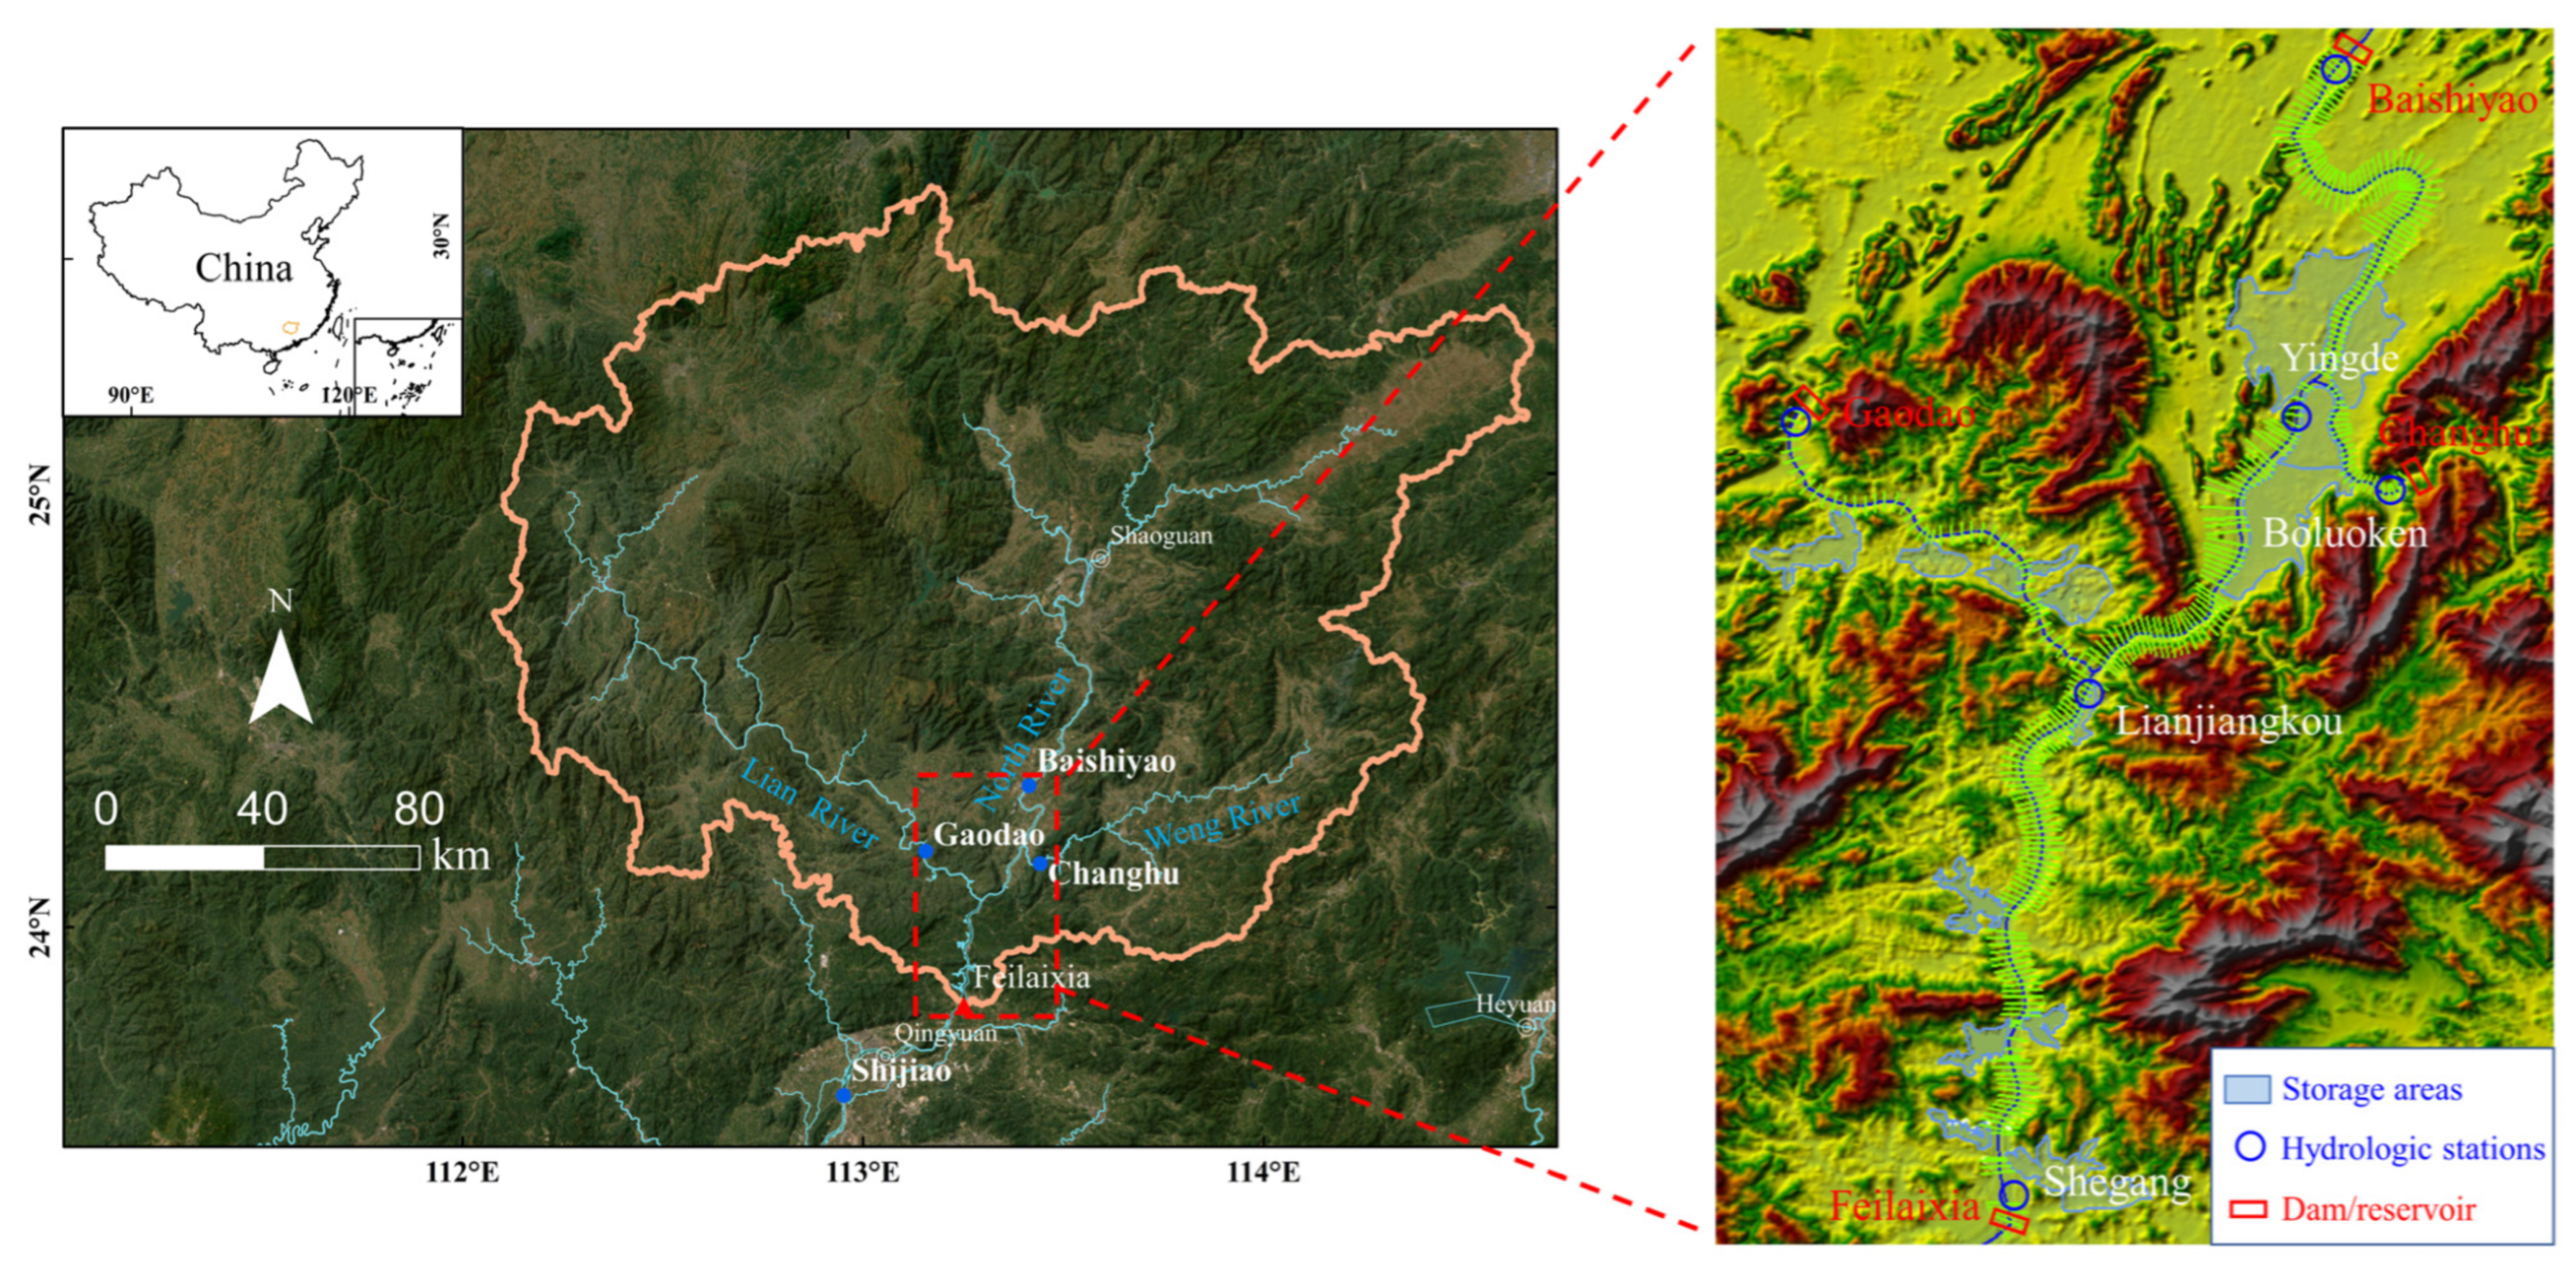
Article

Exceptional Backwater Effects on Wedge Storages and Flood Stages in a Large River-Type Reservoir: HEC-RAS Modeling of Feilaixia Gorge in the North River, South China

1
School of Geography and Planning, Sun Yat-sen University, Guangzhou 510275, China
2
Southern Marine Science and Engineering Guangdong Laboratory (Zhuhai), Zhuhai 519082, China
3
Guangdong Provincial Engineering Research Center for Public Security and Disasters, Guangzhou 510275, China
4
Guangdong Hydrology Bureau Qingyuan Branch, Qingyuan 511599, China
*
Authors to whom correspondence should be addressed.
Water 2025, 17(10), 1447; https://doi.org/10.3390/w17101447 (registering DOI)
Submission received: 5 April 2025 / Revised: 28 April 2025 / Accepted: 8 May 2025 / Published: 11 May 2025
(This article belongs to the Special Issue Flood Risk Assessment on Reservoirs)

Abstract

:
Backwater effects of the Feilaixia Reservoir caused frequent inundations in the reservoir tail and complicated flood regulations in the North River basin. Currently, how backwater effects impact wedge storages and flood stages in the Feilaixia Reservoir remains unknown. This study established the 1D HEC-RAS model to simulate the water level profile and dynamic storage capacity in the Feilaixia Reservoir during two flood events and in 25 regulation scenarios. The results show that the simulated water levels aligned well with the measured data during the flood events in June 2022 and April 2024. The impact of backwater effects on flood stages, i.e., the water level difference between reservoir regulation and natural river, gradually diminished from the dam to the reservoir tail. The larger flood flow and higher water levels in front of the dam triggered greater wedge storages and higher flood stages and inundation risks in the reservoir. The narrow Mangzaixia Gorge produced a secondary backwater effect in the reservoir tail, resulting in distinct water level profile patterns above the Lianjiangkou confluence in the main stream and in the Lian River tributary. The backwater effects on wedge storage and flood stages were exceptionally large, and the ratios of wedge storages to static water storages in the Feilaixia Reservoir were 125% and 147% during both flood events, and even up to 199% as inflow reaches 20,000 m3/s, which should be carefully considered in operational flood regulation and levee height design in the reservoir.

1. Introduction

A large river-type reservoir is a key integrated engineering project constructed in large river basins for flood regulation, power generation, navigation, and water supply [1,2]. While these projects provide safety to downstream areas and economic benefits, they also pose significant flood risks to upstream areas during extreme flood events due to the backwater effect of reservoirs [3,4,5]. The backwater effect refers to the hydrological phenomenon where downstream flow resistance (such as dams or high water levels) slows the movement of river water, causing it to back up and form a raised water level in the upstream channel [6]. This effect is particularly pronounced when the downstream water level is high, potentially extending tens or even hundreds of kilometers upstream, significantly raising water levels and increasing the risk of flooding [7,8]. Additionally, the backwater effect is also influenced by the inflow conditions and river channel topography [9].
Backwater phenomena have occurred in many river confluences, lakes, and reservoirs around the world and severely increased the flood risk. For instance, in the Amazon river, the backwater effect in the upper reaches of the Madeira River raised the water levels by 2–3 m above normal flow conditions, intensifying the inundation time of floodplains and damaging agriculture and residential areas [10,11]. The mutual backwater effects between the main stream channel and lake floods led to regional floods in the middle and lower reaches of the Yangtze River in 2016, 2017, and 2019 [12]. Due to the backwater effect of the Feilaixia Reservoir, most towns had been inundated along the main stream of North River and the Lian River tributary during the North River floods in June 2022 and April 2024 [13]. The backwater effect in dammed river reach or reservoirs was usually assessed by calculating the upstream water level profile or the water level difference between the actual water levels and those under natural flow conditions using hydraulic models like the Hydrologic Engineering Center-River Analysis System (HEC-RAS) model [5,7].
In reservoir flood control operations, the backwater effect not only impacts upstream water levels but also significantly affects the calculation of the reservoir’s actual storage capacity [14]. Reservoir storage capacity includes the static storage below the horizontal plane and the wedge-shaped storage between the actual water surface and the horizontal plane, collectively called dynamic or total storage [15]. There are two main methods for calculating dynamic storage. The first is the instantaneous water level profile method, which derives the instantaneous water level line in the reservoir area based on unsteady flow or calculating it segment by segment using measured water levels. The storage capacity below the instantaneous water level line represents the dynamic storage capacity [16]. The second is the water balance method, which uses the water balance equation and the storage–height relationship in the reservoir area to calculate the difference between inflow and outflow over two time periods. It thereby determines the change in dynamic storage over a specific period [15]. In traditional reservoir flood control design, the impact of dynamic storage and the backwater effect on upstream water level rise is rarely considered. Most reservoirs in China primarily use the static storage–height curve to determine the flood control characteristic water level, flood control storage capacity, and operation plans, which is insufficient for dynamic flood control in large river-type reservoirs [17,18].
The Feilaixia Water Control Project (hereinafter referred to as “Feilaixia Reservoir”), located in the midstream of the North River, is a key control hub in the Pearl River Basin’s flood control system. Together with the downstream Beijiang Levee and the Pajiang Natural Flood Detention Area, it enables Guangzhou City and the Pearl River Delta to withstand floods with a return period of 200 to 300 years [19]. Additionally, the Feilaixia Reservoir has four temporary flood detention areas, one of which had been inundated in June 2022 and April 2024. During flood regulation, the impact of the backwater effect on flood stages in the Feilaixia Reservoir must be considered, and should not inundate Yingde City, where over 30 thousand people reside [20].
The backwater effect in the Feilaixia Reservoir poses significant challenges to flood management in the North River basin. However, how backwater effects impact wedge storages and flood stages in the Feilaixia Reservoir remain unknown. This study will utilize the HEC-RAS model to simulate the water level profile and investigate the impact of backwater effects on wedge storages and flood stages in the Feilaixia Reservoir. The findings can provide scientific and practical guidance for the planning and design of upstream levees, the optimization of flood control plans, and emergency flood regulation for decision-making [21].

2. Study Area and Data

2.1. Study Area

The main stream of the North River spans a total length of 468 km, with a basin area of 46,710 km2 above Sixianjiao [22]. The Feilaixia Reservoir is located in the middle reach of the North River basin, and the dam site controls a basin area of 34,097 km2, accounting for 73% of the total North River basin area (Figure 1). The Feilaixia Reservoir features a narrow and elongated reservoir area. At the normal water storage level of 24 m, the backwater at the reservoir tail can extend to the downstream of the Baishiyao Reservoir dam (approximately 70 km), making it a typical river-type reservoir [18]. The Feilaixia Reservoir has a long-term average inflow of 1100 m3/s and an average annual runoff of 34.7 × 10⁹ m3. The designed peak flood discharge is 22,700 m3/s, with a checked peak flood discharge of 28,700 m3/s. The designed flood level is 31.17 m (p = 0.2%), and the checked flood level is 33.17 m (p = 0.02%), corresponding to a total storage capacity of 1.904 × 10⁹ m3.
The river section analyzed in this study extends from the downstream of the Baishiyao Dam in the north to the upstream of the Feilaixia Dam in the south, to the Gaodao dam in the western Lian River tributary and to the Changhu dam in the eastern Weng River tributary. Baishiyao, Gaodao, and Changhu are hydrological observation stations located on the main stream of the North River, the Lian River tributary, and the Weng River tributary, respectively. The primary temporary inundation areas of the reservoir are Shegang, Lianjiangkou, Boluokeng, and Yingde [23]. The designed flood protection levels for these temporary flood storage and detention zones are as follows: Shegang 30.29 m, Lianjiangkou 33.02 m, Boluokeng 34.29 m, and Yingde 36.75 m.

2.2. Data Description

The data used in this study are summarized in Table 1. Three types of topography data were used in this study, i.e., the digital elevation model (DEM), river bathymetry, and levee height. The DEM was selected from the Copernicus DEM released by the European Space Agency. The majority of the bathymetry data were surveyed by the Pearl River Hydraulic Research Institute of the Pearl River Water Resources Commission in 2020, and part of them were surveyed by the Qingyuan Hydrology Bureau in June 2022 after the flood. Levee data along the river reach were provided by the Qingyuan Hydrology Bureau. All three data were combined to form a 5 m grid, which was used to derive the river cross-sections for establishing the HEC-RAS model.
The water level, discharge, and rainfall data were obtained from the hourly records of hydrological stations in Guangdong Province, including Baishiyao, Gaodao, Changhu, Yingde, Lianjiangkou, and Feilaixia, provided by the Guangdong Provincial Water Resources Department’s flood information release system. The model was calibrated and validated using water level data at Yingde and Lianjiangkou stations in 2022 and 2024.
Based on the inflow rates and water levels in front of the dam in different return periods designed for the Feilaixia Reservoir, the upstream inflow boundary conditions and the downstream water level boundary conditions in front of the dam were set for the scenario simulation [24]. The inflow rates ranged from 11,944 to 20,436 m3/s, and the water levels in front of the dam ranged from 24 to 31.17 m, representing the peak inflow rates and water levels in front of the dam within a return period of 5 to 300 years (Table 2). In this study, all elevations and water levels were converted to the Pearl River Datum in China.

3. Methods

The methodology section consists of four parts: an introduction to one-dimensional steady and unsteady flow in the HEC-RAS model and the calculation of reservoir dynamic storage capacity, model setup, model calibration, and validation using historical events, as well as scenario simulations of reservoir regulation and a natural river.

3.1. HEC-RAS Model

The Hydrologic Engineering Center (HEC) of the U.S. Army Corps of Engineers, has developed the River Analysis System (HEC-RAS) for one-dimensional steady flow and one-dimensional or two-dimensional unsteady flow hydraulic computations [25,26]. It has been widely used in river hydraulics simulation, capable of simulating changes in water level profiles during river flood events, as well as conducting levee breach analysis, inundation analysis, and risk management [5,27,28,29]. The version 6.3 of HEC-RAS was used in this study.

3.1.1. One-Dimensional Steady Flow

In HEC-RAS, steady-flow calculations are based on the one-dimensional energy equation, solved using the standard step method. The energy equation is expressed as Equation (1):
Z 2 + Y 2 + a 2 V 2 2 2 g = Z 1 + Y 1 + a 1 V 1 2 2 g + h e
where Z 1 , Z 2 are the elevation of the main channel inverts, Y 1 , Y 2 are the depth of water at the cross-section, V 1 , V 2 are the average velocity, a 1 , a 2 are the velocity weighting coefficients, g is gravitational acceleration, and h e is the energy head loss.

3.1.2. One-Dimensional Unsteady Flow

For unsteady flow, HEC-RAS solves the one-dimensional Saint-Venant equations [27], which include the continuity equation and the momentum equation, using a Preissmann implicit finite difference scheme. The continuity equation ensures mass conservation in Equation (2):
A t + Q x = q l
where Q and A are the flow and total flow area at the midpoint of the control volume, t is time, x is the distance along the channel, and q l is the lateral inflow per unit.
The momentum equation accounts for inertial, pressure, friction, and gravity forces in Equation (3):
Q t + ( V Q ) X + g A z x + S f = 0
where V is the mean velocity of a cross-section, z is the water level, and S f is the friction slope.

3.1.3. Reservoir Dynamic Storage Capacity

The total storage capacity of a river-type reservoir is composed of the river storage capacity and the capacity of storage areas. The capacity of storage areas is determined based on the water level–storage capacity curve obtained from the terrain data using HEC-RAS, and is calculated according to the water levels in the storage areas.
The river storage capacity is computed based on the cross-sectional geometry and water surface elevation in HEC-RAS. The capacity V of the entire reach is calculated in Equation (4):
V = Σ A i + A i + 1 2 L
where A i , A i + 1 are the wetted areas of the cross-sections, and L is the distance between nearby cross-sections along the river center line.

3.2. Model Setup

The construction of the HEC-RAS model for the Feilaixia Reservoir area includes the setup and generation of elements such as the terrain model, river cross-sections, reservoir bays and flood storage and detention zones, and the computational river network. The terrain model encompasses the bathymetry of the Feilaixia Reservoir area, the digital elevation model (DEM) of the inundation area, and the levees along the river channel. Based on the generated terrain model, appropriate locations are selected, and river cross-sections are generated one by one from the upstream to the downstream on the terrain model (Figure 1). The bays and flood storage and detention zones are simulated using the Storage Area function of the HEC-RAS model, and the water level–storage capacity curves of the bays and flood storage and detention zones are obtained from the terrain model (Figure 2). For computational river network, discrete cross-sections are connected by rivers, junctions are used to connect the confluences of the main and tributary rivers, and lateral structures are used to connect the cross-sections with the bays and flood storage and detention zones. For bays, the elevation values of the left and right banks of the cross-sections are selected as the levee lines, while for flood storage and detention zones, the designed levee heights are defined as the levee lines.
The upstream boundary conditions are set according to the Baishiyao, Gaodao, and Changhu hydrological stations, while the downstream boundary conditions are determined by the hydrological station located at the Feilaixia Dam (Figure 1). Other stations are used for model calibration and validation, such as Lianjiangkou and Yingde.

3.3. Model Calibration and Validation

The HEC-RAS model was calibrated using the measured water level and flow data from 17–24 June 2022. For the upstream boundary conditions, the measured water level data from the Baishiyao Station and the measured flow data at Gaodao and Changhu were selected. The initial water level time for the river cross-sections and storage areas was set at 00:00 on 17 June 2022. The initial Manning’s roughness coefficient was determined according to the values recommended in the user manual, varying from 0.035 to 0.065. The NSE (Nash–Sutcliffe efficiency) coefficient and MAD (mean absolute deviation) between the simulated water levels and the observed water levels at the Lianjiangkou and Yingde Stations were used to optimize the model parameters. The calculation formulas for the NSE coefficient and MAD are in Equations (5) and (6) as follows:
N S E = 1 X o b s X m o d 2 X o b s X ¯ o b s 2
M A D = 1 N i = 1 N X o b s X m o d
where N is the number of sequential water level observations, X o b s is the observed value of water level or flow, X m o d is the simulated value, and X ¯ o b s is the average values of the observed values.
Keeping other parameters constant, only changing the model boundary conditions and the initial water levels of the river cross-sections and storage areas, the measured water levels at the Yingde and Lianjiangkou Stations from 16–25 April 2024, were used to validate the model.

3.4. Scenario Simulations

After calibration and validation, the HEC-RAS model was used to simulate the water level profiles and reservoir storage under 25 steady-flow conditions for both reservoir regulation and natural river scenarios. Additionally, the water level changes during flood events in June 2022 and April 2024 under natural river conditions were analyzed.

3.4.1. Reservoir Regulation Simulations

A total of 20 steady-flow scenarios were conducted with varying inflows and the water levels in front of the dam (Table 3). The discharge assignment of the North River, Weng River, and Lian River in different return periods were based on the measured peak flood flow ratio in June 2022 and April 2024. The upstream inflows from the North River at Baishiyao range from 250 to 10,000 m3/s. They range from 100 to 4000 m3/s from the Weng River at Changhu and 150 to 6000 m3/s from the Lian River tributaries at Gaodao. The downstream boundary condition was set as the water levels in front of the dam at Feilaixia Reservoir, with a 2 m interval ranging from 24 to 30 m.

3.4.2. Natural River Simulations

Compared to the backwater effect caused by dam water level regulation during flood control in reservoirs, the water level profile in natural rivers is mainly influenced by factors such as terrain and inflow rate. Based on the inflow data (Table 3), the changes in the water level profile in 5 steady-flow conditions were simulated for natural rivers. Additionally, to further study the characteristics of natural rivers during flood events, the model was modified to simulate flood events in June 2022 and April 2024. The upstream boundary conditions for Baishiyao, Changhu, and Gaodao were kept unchanged, while the downstream boundary section for the natural river modeling was moved down to the Shijiao Hydrologic station, which is about 50 km away from the Feilaixia Dam (Figure 1). The downstream boundary condition was set to normal depth, determined by the slope of the channel bottom near Shijiao. Since calculating water levels using Manning’s coefficient and friction slope requires uniform flow conditions, which rarely exist in natural rivers, the downstream boundary cross-section was set at Shijiao on the main stream of the North River, far enough from the Feilaixia Reservoir to avoid affecting the study results.

4. Results

This section presents the results for model calibration and validation, unsteady simulations for two flood events in June 2022 and April 2024, and steady simulations for 25 scenarios.

4.1. Model Calibration and Validation

The water levels simulated by the HEC-RAS model at Yingde and Lianjiangkou were well in agreement with in situ observations during 17–25 June 2022 for model calibration, with an NSE of 0.992 and 0.987, and an MAD of 0.280 and 0.348 m, respectively (Figure 3). The relatively large MAD is mainly contributed by the overestimation during the reservoir release at the beginning of the flood before 19 June 2022. The simulated peak water levels and time matched well with the observations.
The calibrated parameters during the flood in June 2022 were applied to simulate the flood in April 2024. The simulated peak water levels and time matched well with the observations, and it did better at Lianjiangkou than that at Yingde, with NSE coefficients of 0.992 and 0.985, and MADs of 0.171 and 0.359 m, respectively (Figure 4). This indicates that the HEC-RAS model can provide reliable simulations for water levels in the Feilaixia Reservoir.

4.2. Flood Event Simulations

This section analyzes the variations in instantaneous water level profiles and dynamic storage capacity under the backwater effect in the Feilaixia Reservoir during the two flood events in June 2022 and April 2024.

4.2.1. Flood Event in June 2022

The heavy rainfall primarily occurred from 19 to 22 June in the North River Basin. Due to the flood regulation of the Changhu Reservoir in the Weng River (such as pre-release and later flood storage), the inflow from Changhu exhibited a different pattern compared to the main stream. The peak water level and inflow at Baishiyao on the upper North River occurred at 10:00 on 22 June 2022, while the peak water level in front of the Feilaixia Dam lagged by approximately 19 h.
Three cases of typical time were selected to illustrate the instantaneous water level profiles along the main stream of the North River and the Lian River tributary in the Feilaixia Reservoir (Figure 5c,d, Table 4 and Table 5). At time T1 (00:00 on 17 June) before the flood, the water level in front of the dam was lowered to 18.49 m to accommodate the incoming flood, while the water levels at Yingde (midstream) and Baishiyao (upstream) were 25.15 m and 28.47 m, respectively, due to the relatively high inflow of 5290 m3/s (Figure 5c). This resulted in a gentle water level slope, with higher water levels by 6.66 m and 9.98 m than that in front of the dam, respectively. At this time, the water level at Gaodao on the Lian River tributary was 24.59 m, which was lower by 0.56 m than that at Yingde. Both Gaodao and Yingde have a similar distance about 50 km to the Feilaixia dam.
At time T2 (10:00 on 22 June), when Yingde reached its peak water level of 35.71 m with a total inflow (outflow) of 21,300 (19,810) m3/s, the water level in front of the dam rose to 24.90 m to reduce the downstream peak flow, while the water level at Baishiyao reached 37.49 m due to the extremely high inflow. The water level profile along the Feilaixia Reservoir was divided into three sections by the Mangzaixia Gorge in the downstream of Yingde. The water level slope in the Mangzaixia Gorge was very steep, with a moderate slope below it and a relatively gentle slope above it (Figure 5c). In contrast, the Gaodao station in the Lian River tributary, unaffected by the narrow channel of the Mangzaixia Gorge, had a water level of only 32.89 m at a similar distance from the Feilaixia Dam as Yingde, resulting in a water level difference of 2.82 m between Yingde and Gaodao (Figure 5d).
At time T3 (05:00 on 23 June), when the peak water level in front of the Feilaixia Dam reached 26.82 m with a total inflow (outflow) of 15,580 (17,860) m3/s, the water levels at Yingde and Baishiyao decreased to 34.09 m and 35.22 m, respectively. The water level profile along the Feilaixia Reservoir still exhibited two distinct patterns above and below the Mangzaixia Gorge. In contrast, the water level at Gaodao was 33.15 m, which was 0.26 m higher than T2 and 0.94 m lower than that at Yingde (Table 4 and Table 5). The water level profile along the Lian River was flatter than that at T2 (Figure 5d). There were similar inflows from the Lian River at T2 and T3. This indicates that the rising water level in front of the Feilaixia Dam had a larger backwater effect on Gaodao in the Lian River tributary than that at Yingde in the main North River, where the backwater effect due to a dam sluice operation was constrained by the Mangzaixia Gorge, which causes a secondary backwater effect at the end of the Feilaixia Reservoir when the inflow from the North River exceeds about 10,000 m3/s (Figure 5c).
Compared to the static storage assumption, which presumes a flat water level along the Feilaixia Reservoir, the dynamic storage revealed the actual total water storage (Figure 5b, Table 4). Between T1 and T2, the simulated water storage change was 7.91 × 10⁸ m3, which was very close to the value (7.76 × 10⁸ m3) calculated by the accumulated difference between inflow and outflow. In contrast, the estimated static storage change was only 4.34 × 10⁸ m3. Between T2 and T3, the simulated water storage change was −0.62 × 10⁸ m3, which closely matched the result calculated from the cumulative difference (−0.67 × 10⁸ m3) between inflow and outflow. Meanwhile, the estimated static storage change was 1.30 × 10⁸ m3.

4.2.2. Flood Event in April 2024

The flood in April 2024 occurred almost simultaneously in the three sub basins, i.e., the upper North River, Weng River, and Lian River tributaries. The maximum inflow to the Feilaixia Reservoir reached 18,800 m3/s (equivalent to a 100-year return period flood), and the peak water levels at Yingde and Feilaixia Dam rose to 33.71 m and 25.87 m (Figure 6a). Before the flood, the Feilaixia Reservoir released water from the normal stage of 24.0 m to 18.19 m in front of the dam from 18 to 20 April, creating larger storage capacity for modulating the peak flow.
Three cases of typical time were also selected to illustrate the instantaneous water surface profiles along the main stream of the North River and the Lian River tributary in the Feilaixia Reservoir (Figure 6c,d, Table 6 and Table 7). At time T1 (00:00 on 16 April), before the flood, the dam was in its normal water storage stage of 23.51 and near steady inflow (outflow) of 450 (410) m3/s. Both water surface profiles along the main stream and the tributary were essentially flat. At time T2 (13:00 on 21 April), when the water level at Yingde reached its peak of 33.71 m with an inflow (outflow) of 16,970 (15,100) m3/s, the water level in front of the dam rose to 22.82 m. The water surface profile along the Feilaixia Reservoir was divided into three sections by the Mangzaixia Gorge in the downstream of Yingde (Figure 6c). Meanwhile, the water level at Gaodao in the Lian River tributary was 30.37 m, being 3.34 m lower than that at Yingde and showing a smooth water surface slope (Figure 6d). At time T3 (12:00 on 22 April), when the water level in front of the dam reached its peak of 25.87 m with an inflow (outflow) of 12,980 (14,670) m3/s, the water level at Yingde decreased from 33.71 m at T2 to 32.89 m, while the water level at Gaodao increased from 30.37 m at T2 to 32.05 m due to the rising flow from the Lian River tributary. Similarly, the instantaneous water surface profile along the main stream of the Feilaixia Reservoir still exhibited distinct patterns above and below the Mangzaixia Gorge. The rising water level in front of the Feilaixia dam had little effect on the water levels at the end of the reservoir above the gorge, such as at Yingde and Baishiyao, but had a larger effect on Gaodao in the Lian River tributary.
The total dynamic water storage calculated from the instantaneous water surface profile was much larger than that by the assumed flat (static) water level, especially during large flood flows (Figure 6b). From T1 to T2, the simulated dynamic water storage change reached 4.85 × 10⁸ m3, which closely matched the value (4.78 × 10⁸ m3) calculated by the accumulated difference between inflow and outflow. In contrast, the estimated static water storage change was −0.47 × 10⁸ m3. From T2 and T3, the simulated dynamic water storage change was −0.22 × 10⁸ m3, which is very close to the value (−0.27 × 10⁸ m3) obtained through the inflow–outflow calculation. Meanwhile, the estimated static water storage was 2.07 × 10⁸ m3. This indicates that the static water storage calculated from the flat water surface is much lower than and even opposite to the actual water storages during flood in a large river-type reservoir.

4.3. Scenario Simulations

A total of 25 steady-flow simulations were conducted to analyze the instant water level profiles along the Feilaixia Reservoir for two reservoir operation scenarios: (1) constant water level and various inflows, and (2) constant inflow and various water levels. Extra inundation volumes were also computed as water levels exceed the design levee height of the temporary flood storage areas along the Feilaixia Reservoir.

4.3.1. Constant Water Levels and Various Inflow

The instant water surface along the Feilaixia Reservoir is quite flat as inflow is low, e.g., 500 m3/s, while water surface slopes increase with larger inflow (Figure 7). When inflow reaches around 10,000 m3/s, the reservoir’s water surface slopes (or height) are divided into three sections by the Mangzaixia Gorge between Liangjiangkou and Boluoken (30–40 km), showing small slopes below the gorge, steep slopes in the gorge, and slight slopes above the gorge. When water levels in front of the dam increase from 24 m to 30 m, the water surface slopes decreased, especially below the gorge. For example, in the case of the largest inflow (20,000 m3/s), the water levels at Lianjiangkou below the gorge, Yingde above the gorge, and Baishiyao at the end of the reservoir increase by 2.75, 1.04, and 0.75 m, respectively, when water levels in front of the dam increase by 6 m from 24 to 30 m. The backwater effect of flood regulation on the end of the reservoir is diminished by the Mangzaixia Gorge, which acts like a sluice and exerts a secondary backwater effect in the reservoir tail.
Assuming a flat water surface in the reservoir as inflow is around 500 m3/s, the static water storages increase from 4.76 × 10⁸ to 8.81 × 10⁸ m3, when the water levels in front of the dam increase from 24 to 28 m (Table 8). In fact, the reservoir’s water surface has a steeper slope with larger inflow, creating a wedge storage, which is only 19% of the static storage at 24 m and 5000 m3/s, while rising to 199% for 20,000 m3/s. Although the ratios of wedge storage to static storage decrease from 19% to 5% and from 199% to 100% at 30 m when inflows increase from 500 m3/s to 20,000 m3/s, the absolute wedge storages increase from 0.48 to 8.84 × 10⁸ m3. In addition, as inflow increases from 15,000 to 20,000 m3/s, the wedge storages double, and are partially contributed by the temporary storage areas when the rising water levels exceed the levee height at Shegang, Lianjiangkou, Boluoken, and Yingde (Figure 8, Table 9). Such large volumes of flood water must be carefully monitored and regulated in reservoir operation.

4.3.2. Constant Inflow and Various Water Levels

Figure 9 illustrate the backwater effect of reservoir operation against natural river under four constant inflows. The rising water levels in front of the dam reduce the water surface slope. The rising water levels in the reservoir against the flood stages in the natural river are defined as one type of backwater effect due to reservoir operation. The backwater effect diminishes from the dam toward the reservoir tail. The rising water levels often exceed the designed levee heights, and this is usually caused by underestimating the backwater effects of reservoir operation with a large flood flow or a lower grade of protection standards in temporary storage areas along the reservoir, especially in the reservoir tail (Figure 9c,d).
With an inflow of 5000 m3/s, water levels at Yingde and Baishiyao are 25.40 and 28.87 m for the natural river. When the water level in front of the dam rises to 24 m, they increase to 27.06 and 29.26 m at Yingde and Baishiyao, resulting in water level escalations by 1.66 and 0.39 m at the end of the reservoir. When it rises to 30 m, they increase to 31.02 and 31.65 m at Yingde and Baishiyao, resulting in water level escalations by 5.62 and 2.78 m (Figure 9a, Table 9). The higher water levels at the front of the dam exert a larger backwater effect in the reservoir tail.
The large flow raises the flood stage for the natural river, reducing the relative magnitude of the reservoir’s backwater effect, but escalating the flood stage to an extremely high value and inundating larger areas. With an inflow of 20,000 m3/s, water levels at Yingde and Baishiyao are 36.87 and 38.65 m for the natural river. When the water level in front of the dam rises to 26 m, they increase to 37.47 and 39.00 m at Yingde and Baishiyao, resulting in water level escalations by 0.60 and 0.35 m at the end of the reservoir. When it rises to 30 m in front of the dam, they increase to 38.29 and 39.60 m at Yingde and Baishiyao, resulting in water level escalations by 1.42 and 0.95 m (Figure 9d, Table 9).

5. Discussions

In this section, we mainly discuss the impact of backwater effects of a large river-type reservoir on flood stages and dynamic water storage, i.e., the flood stage differences between reservoir regulation and natural river, distinct patterns of water level rise between the main stream and Lian River tributary, and the wedge storage characteristics in the Feilaixia Reservoir.

5.1. Flood Stages in Natural River and Reservoir Regulation

Reservoir flood regulation is primarily achieved through sluice operations to control discharge, which typically maintains a higher water level in front of the dam compared to natural rivers. The elevated water levels strengthen the backwater effects, potentially exacerbating flood inundation risks in the reservoir tail (Figure 8 and Figure 9). In contrast, the flood stages in a natural river rely on the flow hydrograph and channel characteristics, or the downstream backwater effect caused by natural flow obstructions such as gorges, sea level rise, and storm surges [29].
Water levels rose faster in the natural river than those in the reservoir, especially near the dam during the early phase of flooding (Figure 10). Before the 2024 flood, water levels at Feilaixia, Lianjiangkou, and Yingde in the natural river were about 22, 19, and 13 m lower than the reservoir-regulated level of 24 m (Figure 10b). Such large differences provide great storage capacity for subsequent flood peak attenuation in natural river channels [30]. With the backwater effect, water levels in reservoir regulations were generally higher than those in the natural river throughout the entire flood process. The peak flood stages at Feilaixia, Lianjiangkou, and Yingde under reservoir regulation were higher by 3.20, 1.14, and 0.22 m in June 2022 and 3.98, 1.12, and 0.01 m in April 2024 than those in the natural river (Table 10), which could be explained by the lower initial water level and faster flow speed in the natural river. The larger flood flow and higher water level in front of the dam triggered greater wedge storage and higher total water levels and inundation risks in the reservoir tail [31]. The backwater effect in reservoir regulation, primarily induced by the design and operation of the dam, impedes upstream flow, consequently elevating inundation risks, especially in the reservoir tail during flood events [6].

5.2. Distinct Backwater Effects on Main Stream and Tributary

The width and curvature of the river channel, as well as the confluence of tributaries, can generate localized impacts on the reservoir’s backwater effect [10]. The narrow Mangzaixia Gorge, located upstream of the Lianjiangkou confluence, significantly impedes upstream flow, resulting in secondary backwater effects in the reservoir tail and producing distinct backwater effect patterns above the Lianjiangkou confluence in the main stream and in the Lian River tributary. The instantaneous water surface profiles along the Feilaixia Reservoir were divided into three sections as the inflow was over 10,000 m3/s, while they were quite smoother and lower in the Lian River tributary (Figure 5, Figure 6 and Figure 11). On 22 June 2022 and 21 April 2024, the peak flood stages at Yingde in the main stream were 2.82 m and 3.34 m higher than Gaodao in the Lian River tributary (Figure 11, Table 4, Table 5, Table 6 and Table 7), although both sites are at similar distances away from the Lianjiangkou confluence. Therefore, in the design and operation of river-type reservoirs, such distinct backwater effects in the main stream and tributary need to be comprehensively considered and carefully regulated in flood modulation.

5.3. Wedge Storage and Inundation

Wedge storage and its variations reflect the actual water storage and interception capabilities of river-type reservoirs during actual operations, with its characteristics closely related to the backwater effect [14]. At the normal storage level of 24 m, when the inflow is less than 15,000 m3/s, the storage capacity of the channel and the reservoir bay constitute the dynamic (total) storage capacity. However, when inflow exceeds 20,000 m3/s, water levels in the reservoir tail above the Manzaixia Gorge rise above the levee top, causing extra inundation in the reservoir tail and double wedge storage (Figure 8 and Figure 9, Table 8). During the flood events in June 2022 and April 2024, the peak flood stages at Yingde reached 35.71 and 33.71 m, while the levee top of Boluoken was 30.14~34.29 m, being inundated twice (Table 9). Meanwhile, the instantaneous wedge storages, i.e., the volume difference between dynamic (total) and static water storage, in the Feilaixia Reservoir were as high as 6.55 × 10⁸ m3 and 5.65 × 10⁸ m3, being 125% and 147% of the static storage in both flood events, respectively.
Wedge storage capacity calculation under different dam water levels and inflows is of great significance to flood control [15]. In the Three Gorges Reservoir, a hydrodynamic model was used to calculate the deviation between the dynamic and static storage capacity of the reservoir, and the ratio of wedge storage to static storage varied between 1.4% and 32.4% in the normal operation stage from 2014 to 2019 [32]. On 24 July 2012, when the inflow and outflow were 66,900 and 41,500 m3/s, the observed wedge storage in the Three Gorges Reservoir was 5.4 × 10⁹ m3, being 24.7% of the static storage volume [16]. The fitted ratios for the Feilaixia Reservoir in this study are consistent with these values as inflow is less than 10,000 m3/s. However, in high-flow conditions, the wedge storage volumes were even higher than the static storage (Table 4, Table 6, and Table 8). In other words, the wedge storage and backwater effect in the Feilaixia Reservoir are exceptionally large, and should be carefully considered in operational flood regulation.
Future research could further integrate the quantitative relationships between the water level in front of the dam, inflows, and dynamic storage capacity. By coupling hydrodynamic models with real-time monitoring data, a threshold early-warning mechanism for dynamic storage capacity could be established to achieve a balance between flood safety and efficient water resource utilization.

6. Conclusions

This study established the 1D HEC-RAS hydrodynamic model to simulate and investigate backwater effects on wedge storages and flood stages during two flood events (unsteady flow) and in 25 regulation scenarios (steady flow) in the Feilaixia Reservoir. The simulated water levels aligned well with the measured data at Lianjiangkou and Yingde during the flood events in June 2022 and April 2024. The main conclusions can be drawn as follows:
(1)
The backwater effects in the Feilaixia Reservoir were primarily influenced by the water levels in front of the dam, inflow rates, and the channel topography. The larger flood flow and higher water levels in front of the dam triggered greater wedge storages and higher flood stages and inundation risks in the reservoir.
(2)
The impact of backwater effects on flood stages, i.e., the water level difference between reservoir regulation and the natural river, gradually diminished from the dam to the reservoir tail.
(3)
The narrow Mangzaixia Gorge produced a secondary backwater effect in the reservoir tail, resulting in distinct water level profile patterns above the Lianjiangkou confluence in the main stream and in the Lian River tributary.
(4)
The backwater effects on wedge storage and flood stages were exceptionally large, and the ratios of wedge storage to static water storage in the Feilaixia Reservoir were 125% and 147% during both flood events, and even up to 199% as inflow reaches 20,000 m3/s, which should be carefully considered in operational flood regulation.
The backwater effect in the Feilaixia Reservoir poses significant challenges to its flood management. This study not only provides a scientific framework for investigating backwater effects on wedge storage and flood stages in the Feilaixia Reservoir, but also offers a reference for addressing similar issues in large river-type reservoirs worldwide. It is worth noting that the 1D HEC-RAS model has been carried out with necessary geometric simplifications for areas such as complex river bends and sudden change sections. While ensuring computational efficiency, it may cause slight deviations in local water level changes. Future work can consider further optimizing the simulation accuracy by increasing the cross-sectional density or adopting 2D or even 3D modeling methods.

Author Contributions

Conceptualization, X.W. and Y.H.; methodology, Z.Z. and X.W.; software, X.W.; validation, X.W., Y.H., H.T. and Z.Z.; formal analysis, X.W. and H.T.; investigation, X.W. and Z.Z.; resources, X.W. and S.C.; data curation, Z.Z. and Y.H.; writing—original draft preparation, Z.Z.; writing—review and editing, X.W.; visualization, Z.Z. and X.W.; supervision, X.W. and S.C.; project administration, X.W. and Y.H.; funding acquisition, X.W. All authors have read and agreed to the published version of the manuscript.

Funding

This research was funded by Innovation Group Project of Southern Marine Science and Engineering Guangdong Laboratory (Zhuhai) (No.311024004) and the State Key Laboratory of Desert and Oasis Ecology, Xinjiang Institute of Ecology and Geography, Chinese Academy of Sciences: G2014-02-06. The APC was funded by the State Key Laboratory of Desert and Oasis Ecology, Xinjiang Institute of Ecology and Geography, Chinese Academy of Sciences (G2014-02-06).

Data Availability Statement

The research data are restricted, and authors do not have permission to share the research data.

Acknowledgments

The bathymetry data were provided by the Pearl River Hydraulic Research Institute. The water level, stream flow, and precipitation data were obtained from the Flood Situation Announcement System of the Guangdong Provincial Water Resources Department. The levee data were supplied by the Qingyuan Hydrology Bureau. Additionally, the HEC-RAS model (version 6.3), developed by the Hydrologic Engineering Center (HEC) of the U.S. Army Corps of Engineers, is widely recognized and highly appreciated for its reliability in hydraulic simulations. We express our gratitude to the editors and three reviewers, whose comments greatly improve this manuscript.

Conflicts of Interest

The authors declare that they have no conflicts of interest.

References

  1. Yang, Y.; Zhang, M.; Zhu, L.; Liu, W.; Han, J.; Yang, Y. Influence of large reservoir operation on water-levels and flows in reaches below dam: Case study of the Three Gorges Reservoir. Sci. Rep. 2017, 7, 15640. [Google Scholar] [CrossRef] [PubMed]
  2. Emamgholizadeh, S.; Bateni, S.M.; Nielson, J.R. Evaluation of different strategies for management of reservoir sedimentation in semi-arid regions: A case study (Dez Reservoir). Lake Reserv. Manag. 2018, 34, 270–282. [Google Scholar] [CrossRef]
  3. Pittock, J. Viewpoint-better management of hydropower in an era of climate change. Water Altern. 2010, 3, 444–452. [Google Scholar]
  4. Shrestha, B.B.; Kawasaki, A. Quantitative assessment of flood risk with evaluation of the effectiveness of dam operation for flood control: A case of the Bago River Basin of Myanmar. Int. J. Disaster Risk Reduct. 2020, 50, 101707. [Google Scholar] [CrossRef]
  5. Amarnath, C.R.; Thatikonda, S. Study on backwater effect due to Polavaram Dam Project under different return periods. Water 2020, 12, 576. [Google Scholar] [CrossRef]
  6. Rui, X.; Jiang, G.; Cheng, H. Study on water stage forecasting considering backwater effects. Adv. Water Sci. 1998, 9, 19–24. (In Chinese) [Google Scholar]
  7. Zhang, X.; Bi, Z.; Sun, X.; Wang, P.; Xu, Z.; Jia, B. Backwater effects in rivers and lakes: Case study of Dongping Lake in China. Water 2023, 15, 3850. [Google Scholar] [CrossRef]
  8. Yang, S.; Xu, G.; Wang, L.; Yang, W.; Xiao, Y.; Li, W.; Hu, J. Field-derived relationships between fish habitat distribution and flow-sediment conditions in fluctuating backwater zone of the Three Gorges Reservoir. Ecol. Inform. 2021, 62, 101273. [Google Scholar] [CrossRef]
  9. Costabile, P.; Macchione, F.; Natale, L.; Petaccia, G. Comparison of scenarios with and without bridges and analysis of backwater effect in 1-D and 2-D river flood modeling. CMES—Comput. Model. Eng. Sci. 2015, 109, 81–103. [Google Scholar] [CrossRef]
  10. Meade, R.H.; Rayol, J.M.; Da Conceicao, S.C.; Natividade, J.R.G. Backwater effects in the Amazon River basin of Brazil. Environ. Geol. Water Sci. 1991, 18, 105–114. [Google Scholar] [CrossRef]
  11. Trigg, M.A.; Wilson, M.D.; Bates, P.D.; Horritt, M.S.; Alsdorf, D.E.; Forsberg, B.R.; Vega, M.C. Amazon flood wave hydraulics. J. Hydrol. 2009, 374, 92–105. [Google Scholar] [CrossRef]
  12. Shang, H.; Hu, C.; Xia, J.; Zhou, M. Influence of Dongting Lake inflow on the degree and range of backwater effect in the Jingjiang reach. Adv. Water Sci. 2023, 34, 431–441. (In Chinese) [Google Scholar]
  13. Wang, J.; Nie, H.; Cai, S. Investigation and analysis of the “22·6” extreme flood event in Beijiang River Basin. J. China Hydrol. 2025, 45, 106–112. (In Chinese) [Google Scholar]
  14. Zhang, S.; Jing, Z.; Yi, Y.; Wu, Y.; Zhao, Y. The dynamic capacity calculation method and the flood control ability of the Three Gorges Reservoir. J. Hydrol. 2017, 555, 361–370. [Google Scholar] [CrossRef]
  15. Zhong, Z.; Li, W.; An, Y. Study on dynamic reservoir capacity and flood control capacity of Three Gorge Reservoir. Water Resour. Power 2010, 28, 36–38. (In Chinese) [Google Scholar]
  16. Wang, X.; Chen, Y.; Song, L.; Chen, X.; Xie, H.; Liu, L. Analysis of lengths, water areas and volumes of the Three Gorges Reservoir at different water levels using Landsat images and SRTM DEM data. Quat. Int. 2013, 304, 115–125. [Google Scholar] [CrossRef]
  17. Tang, H.; Ding, J. Primary study on dynamic capacity of river-type reservoirs. Hydropower Pumped Storage 2009, 33, 75–78. (In Chinese) [Google Scholar]
  18. Xu, Y. Discussion on flood routing calculation methods for Feilaixia Hydropower and Pumped Storage Project. Guangdong Water Resour. Hydropower 2006, 5, 7–9. (In Chinese) [Google Scholar]
  19. Huang, H. Study on joint operation of Beijiang-Pajiang flood storage and detention area with Feilaixia Hydropower and Pumped Storage Reservoir. Guangdong Water Resour. Hydropower 2011, 9, 4–5+31. (In Chinese) [Google Scholar]
  20. Huang, H. Operational characteristics of Feilaixia Hydropower and Pumped Storage Reservoir. Guangdong Water Resour. Hydropower 2001, S3, 44–45. (In Chinese) [Google Scholar]
  21. Li, Y.; Hou, G.; Wu, L.; Lu, J. Review analysis and inspiration on the scheduling of the “2024.4” Beijiang catastrophic flood. China Flood Drought Manag. 2024, 34, 13–17. (In Chinese) [Google Scholar]
  22. Liu, Y.; Kang, A.; Yu, Y.; Xu, S.; Ding, J. Analysis of rainstorm “2022·6·22” in the Beijiang River Basin. J. Water Resour. Water Eng. 2024, 35, 17–25. (In Chinese) [Google Scholar]
  23. Wang, H.; Feng, J.; Fan, Z. Analysis of flood risk in temporary flood storage and detention area of Feilaixia Reservoir Area. China Rural Water Hydropower 2022, 8, 111–116. (In Chinese) [Google Scholar]
  24. Wang, Y.; Liu, Z.; Chen, J. Study on the joint distribution of flood peak volume of Feilaixia Reservoir based on the Copulas function. Guangdong Water Resour. Hydropower 2014, 5, 18–22. (In Chinese) [Google Scholar]
  25. Patel, D.P.; Ramirez, J.A.; Srivastava, P.K.; Bray, M.; Han, D. Assessment of flood inundation mapping of Surat city by coupled 1D/2D hydrodynamic modeling: A case application of the new HEC-RAS 5. Nat. Hazards 2017, 89, 93–130. [Google Scholar] [CrossRef]
  26. Rangari, V.A.; Umamahesh, N.V.; Bhatt, C.M. Assessment of inundation risk in urban floods using HEC RAS 2D. Model. Earth Syst. Environ. 2019, 5, 1839–1851. [Google Scholar] [CrossRef]
  27. Khattak, M.S.; Anwar, F.; Saeed, T.U.; Sharif, M.; Sheraz, K.; Ahmed, A. Floodplain mapping using HEC-RAS and ArcGIS: A case study of Kabul River. Arab. J. Sci. Eng. 2016, 41, 1375–1390. [Google Scholar] [CrossRef]
  28. Bharath, A.; Shivapur, A.V.; Hiremath, C.G.; Maddamsetty, R. Dam break analysis using HEC-RAS and HEC-GeoRAS: A case study of Hidkal dam, Karnataka state, India. Environ. Chall. 2021, 5, 100401. [Google Scholar] [CrossRef]
  29. Wang, X.; Guo, Y.; Ren, J. The coupling effect of flood discharge and storm surge on extreme flood stages: A case study in the Pearl River Delta, South China. Int. J. Disaster Risk Sci. 2021, 12, 1–15. [Google Scholar] [CrossRef]
  30. Asselman, N.; de Jong, J.S.; Kroekenstoel, D.; Folkertsma, S. The importance of peak attenuation for flood risk management, exemplified on the Meuse River, the Netherlands. Water Secur. 2022, 15, 100114. [Google Scholar] [CrossRef]
  31. Li, X.; Liu, B.; Wang, Y.; Yang, Y.; Liang, R.; Peng, F.; Xue, S.; Zhu, Z.; Li, K. Hydrodynamic and environmental characteristics of a tributary bay influenced by backwater jacking and intrusions from a main reservoir. Hydrol. Earth Syst. Sci. 2020, 24, 5057–5076. [Google Scholar] [CrossRef]
  32. Zhu, S.; Liu, H.; Qin, H.; Bi, S.; Ren, P. Refined calculation of dynamic reservoir capacity based on hydrodynamic model and surrogate model. Water Resour. Power 2024, 42, 176–178. (In Chinese) [Google Scholar]
Figure 1. The North River Basin and the cross-section profiles of the Feilaixia Reservoir for setting up the 1D HEC-RAS model.
Water 17 01447 g001
Figure 2. Illustration of the river cross-section profiles (green lines) for setting up the 1D HEC-RAS model and storage areas (SAs, blue lines) near the city of Yingde.
Water 17 01447 g002
Figure 3. The hourly water levels at Yingde (a) and Lianjiangkou (b) during 17–25 June 2022 from model calibration and in situ observations.
Water 17 01447 g003
Figure 4. The hourly water levels at Yingde (a) and Lianjiangkou (b) during 16–25 April 2024 from model validation and in situ observations.
Water 17 01447 g004
Figure 5. (a) Basin daily rainfall, hourly inflow from tributaries of the Weng River (Changhu) and Lian River (Gaodao), and water levels at Baishiyao in the upstream boundary and Feilaixia (in front of the dam) in the downstream boundary. (b) Twice-hourly storage changes, dynamic storage, and static storage. (c) Instantaneous water level profiles along the main stream of Feilaixia Reservoir and (d) along the Lian River tributary at three typical time, T1 6/17 00:00, T2 6/22 10:00, and T3 6/23 05:00, in June 2022.
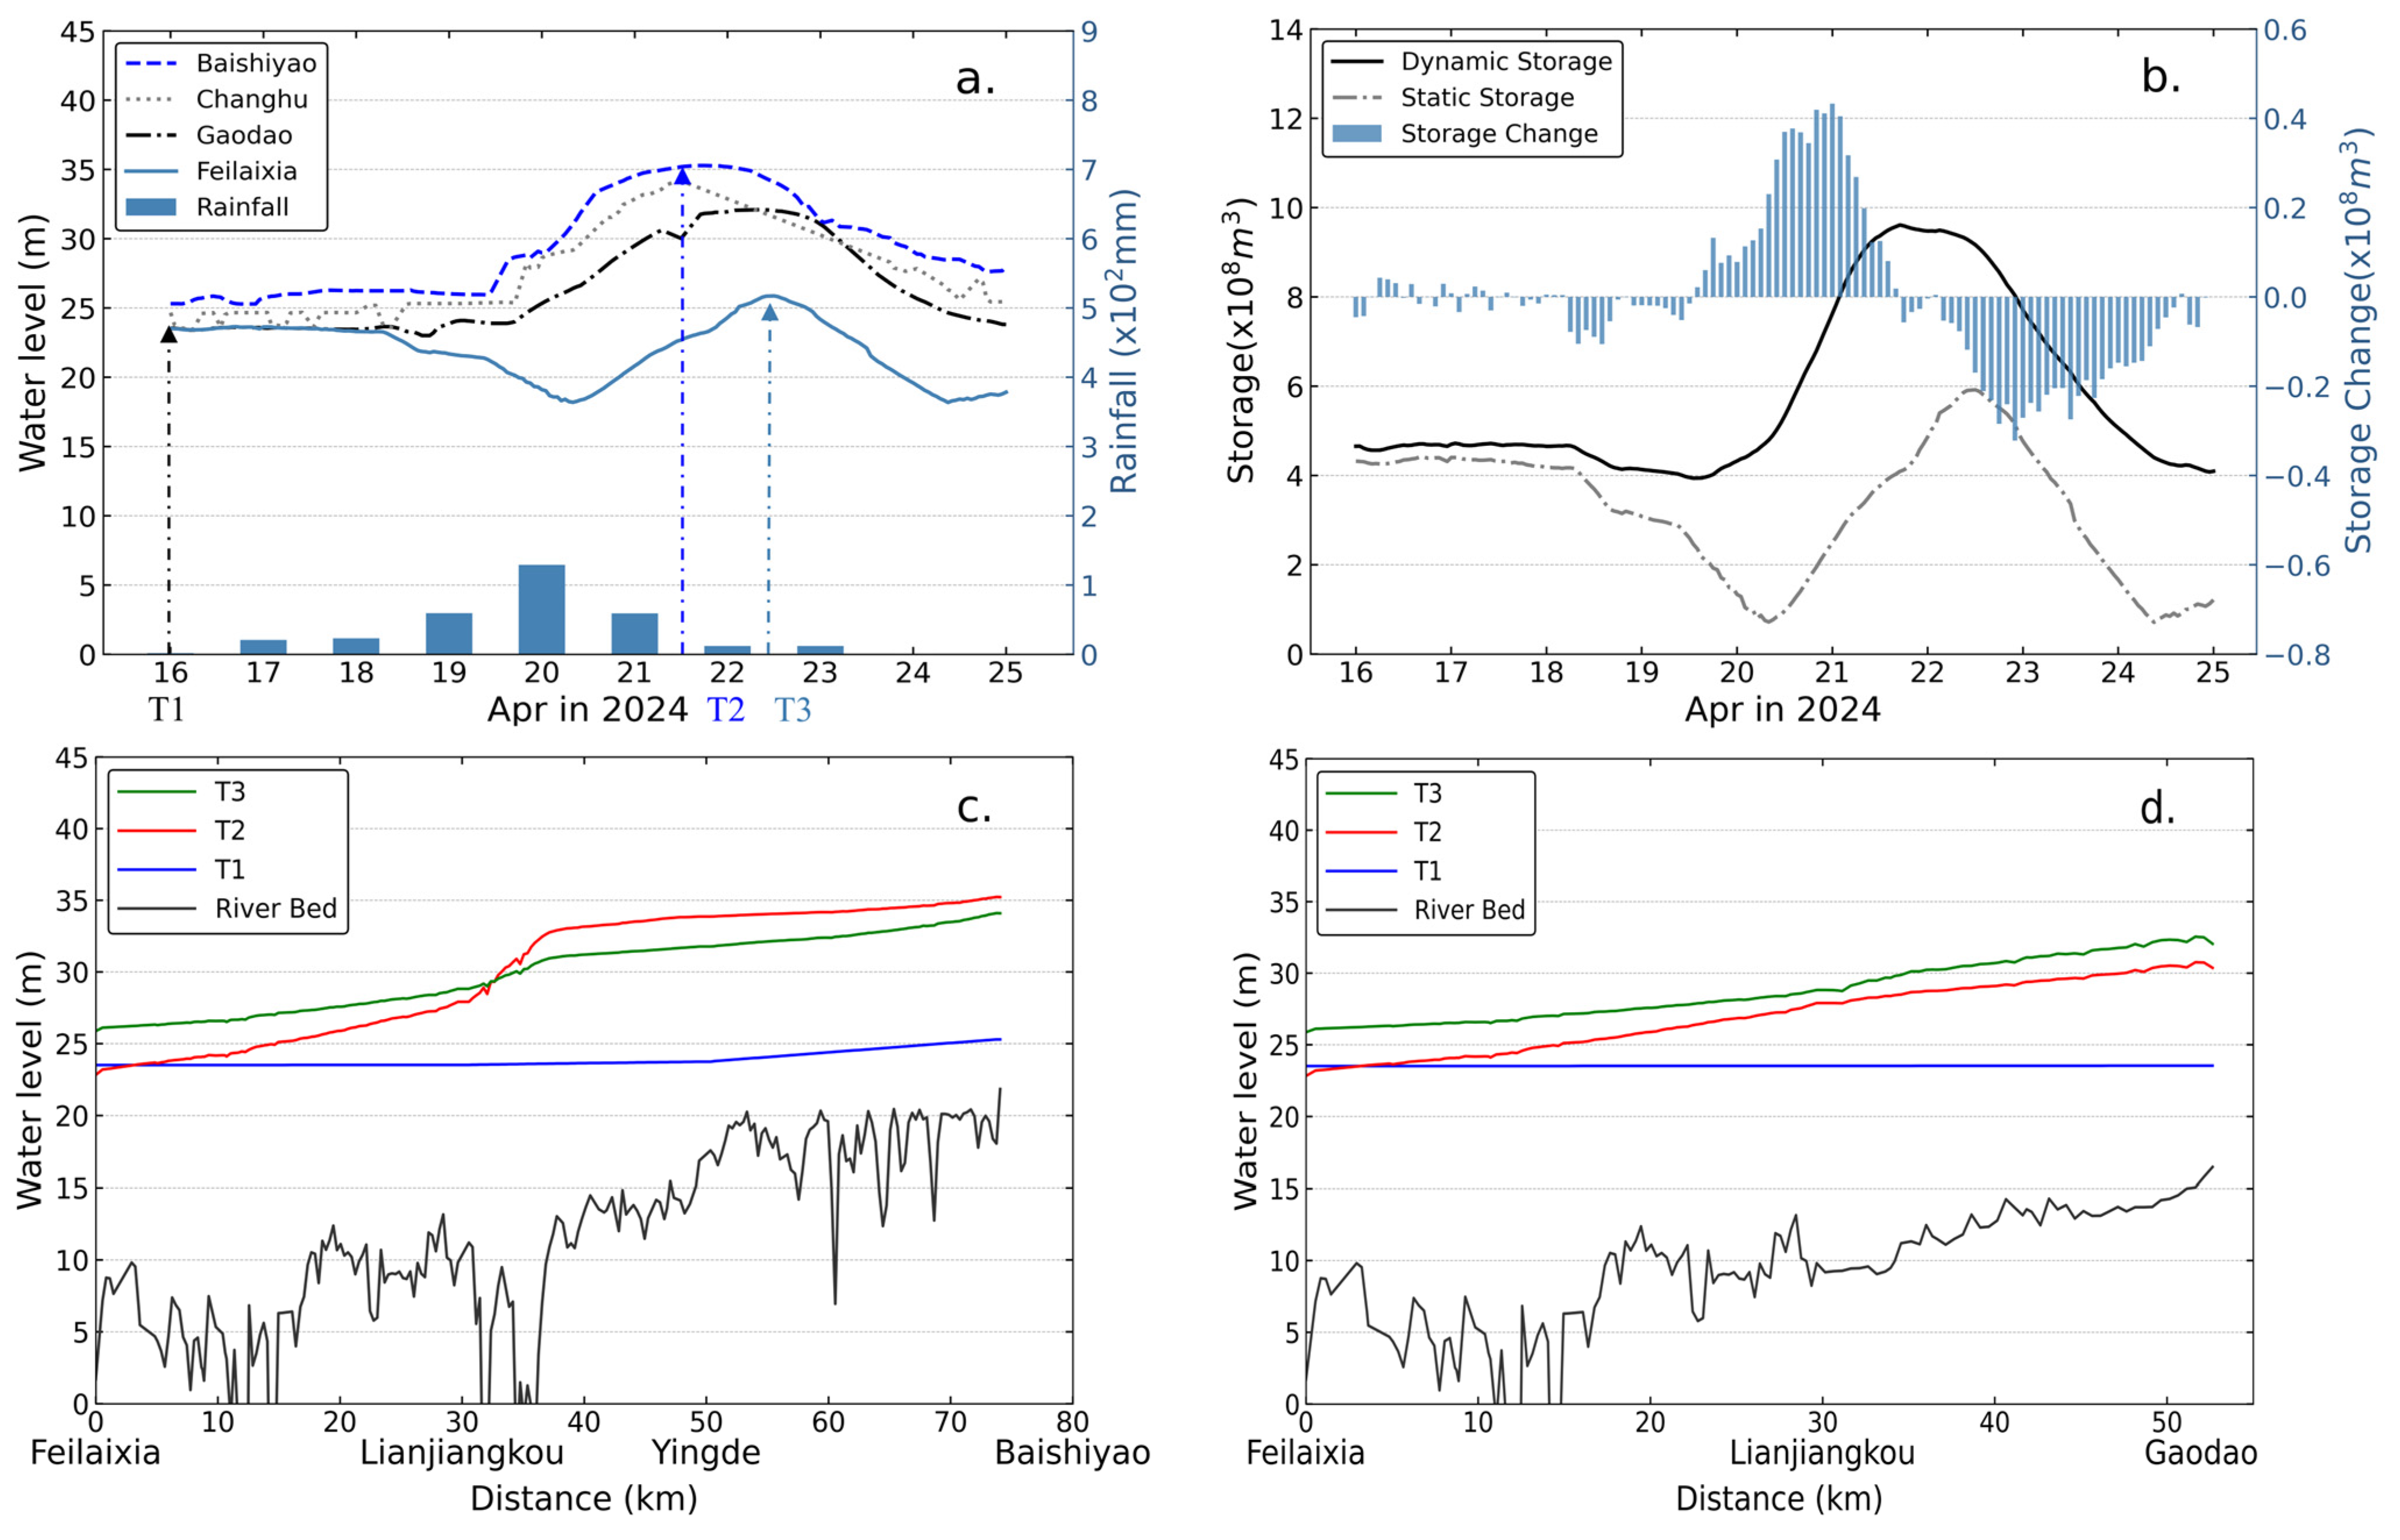
Water 17 01447 g005
Figure 6. (a) Basin daily rainfall and hourly water levels in the upstream boundary at Baishiyao, Changhu, and Gaodao and in the downstream boundary at Feilaixia in front of the dam. (b) Twice-hourly storage changes, dynamic storage, and static storage. (c) Instantaneous water level profiles along the main stream of the Feilaixia Reservoir and (d) along the Lian River tributary at three typical time, T1 4/16 00:00, T2 4/21 13:00, and T3 4/22 12:00, in April 2024.
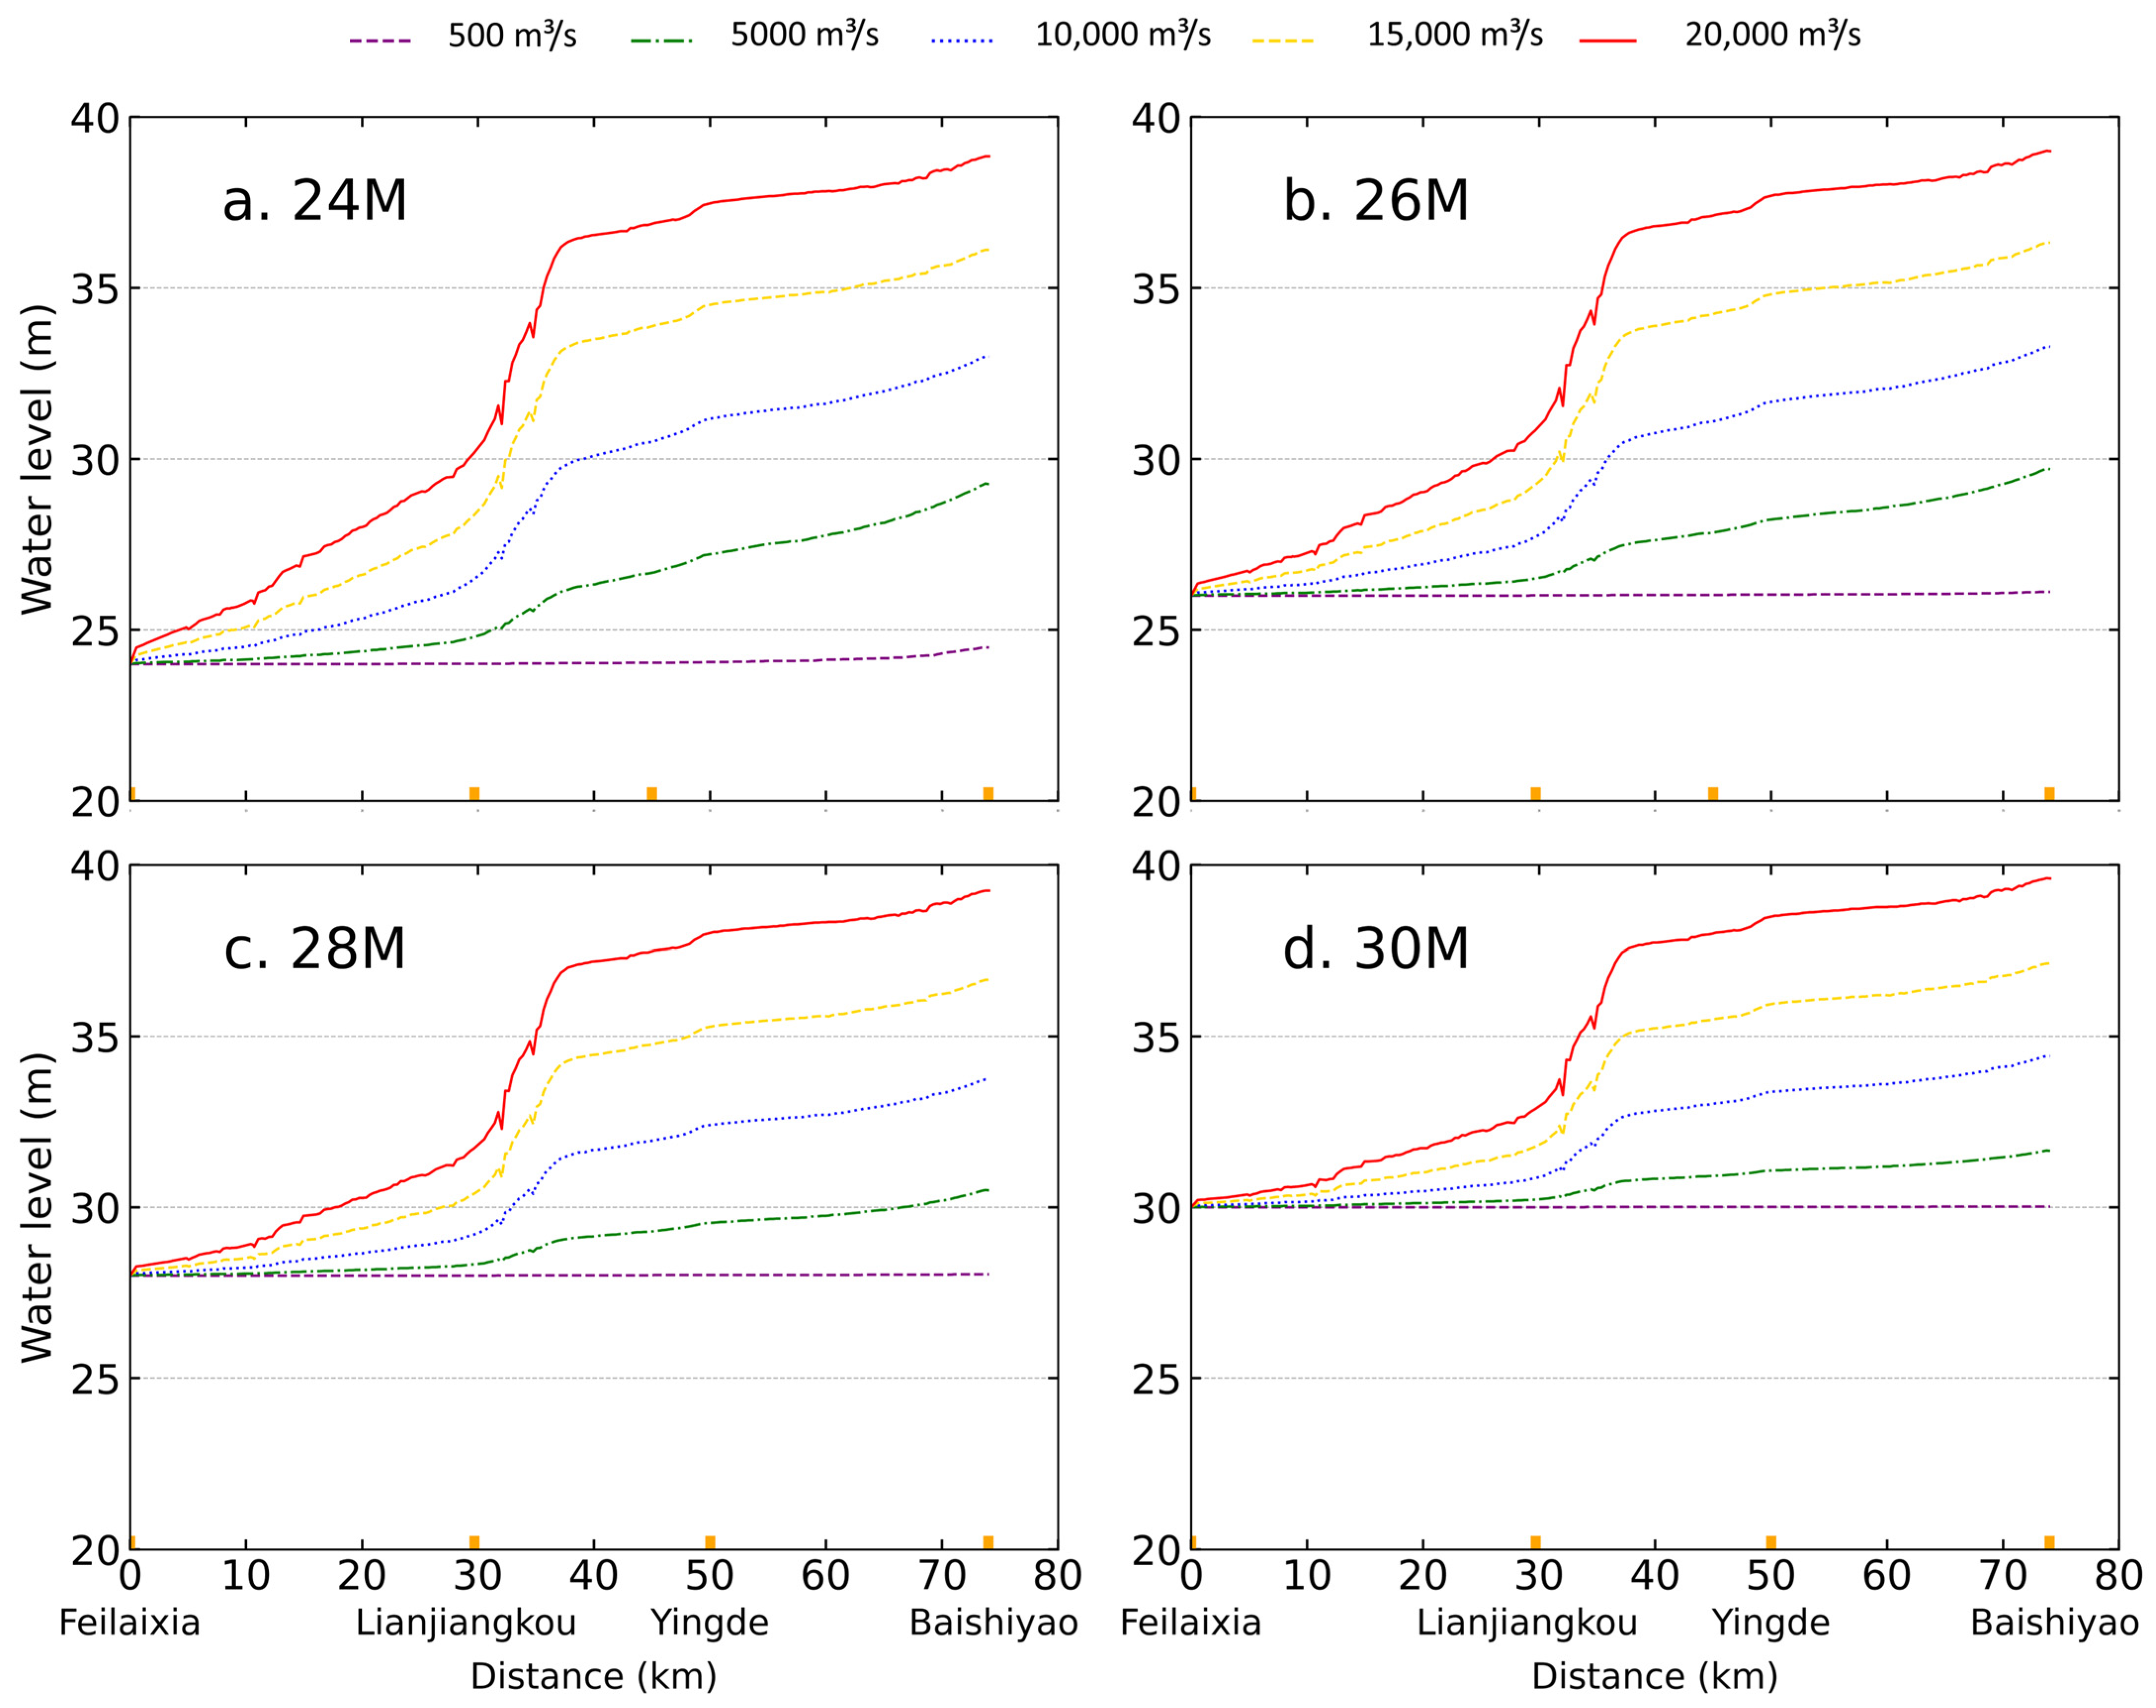
Water 17 01447 g006
Figure 7. Simulated water level profiles along the Feilaixia Reservoir with five steady inflows and four constant water levels in front of the dam: (a) 24 m, (b) 26 m, (c) 28 m, and (d) 30 m.
Water 17 01447 g007
Figure 8. Simulation of the water surface elevation and inundation areas near the city of Yingde at a water level of 30 m in front of the dam and inflows of (a) 15,000 m3/s and (b) 20,000 m3/s.
Water 17 01447 g008
Figure 9. The simulated water level profiles along the Feilaixia Reservoir at four water levels in front of the dam and with four constant steady inflows: (a) 5000 m3/s, (b) 10,000 m3/s, (c) 15,000 m3/s, and (d) 20,000 m3/s. The triangles are the levee heights for the temporary flood storage areas of Shegang, Lianjiangkou, Boluoken, and Yingde.
Water 17 01447 g009
Figure 10. Comparison of simulated water level processes at Yingde (YD), Lianjiangkou (LJK), and Feilaixia (FLX) Dam under reservoir regulation and natural river in (a) June 2022 and (b) April 2024.
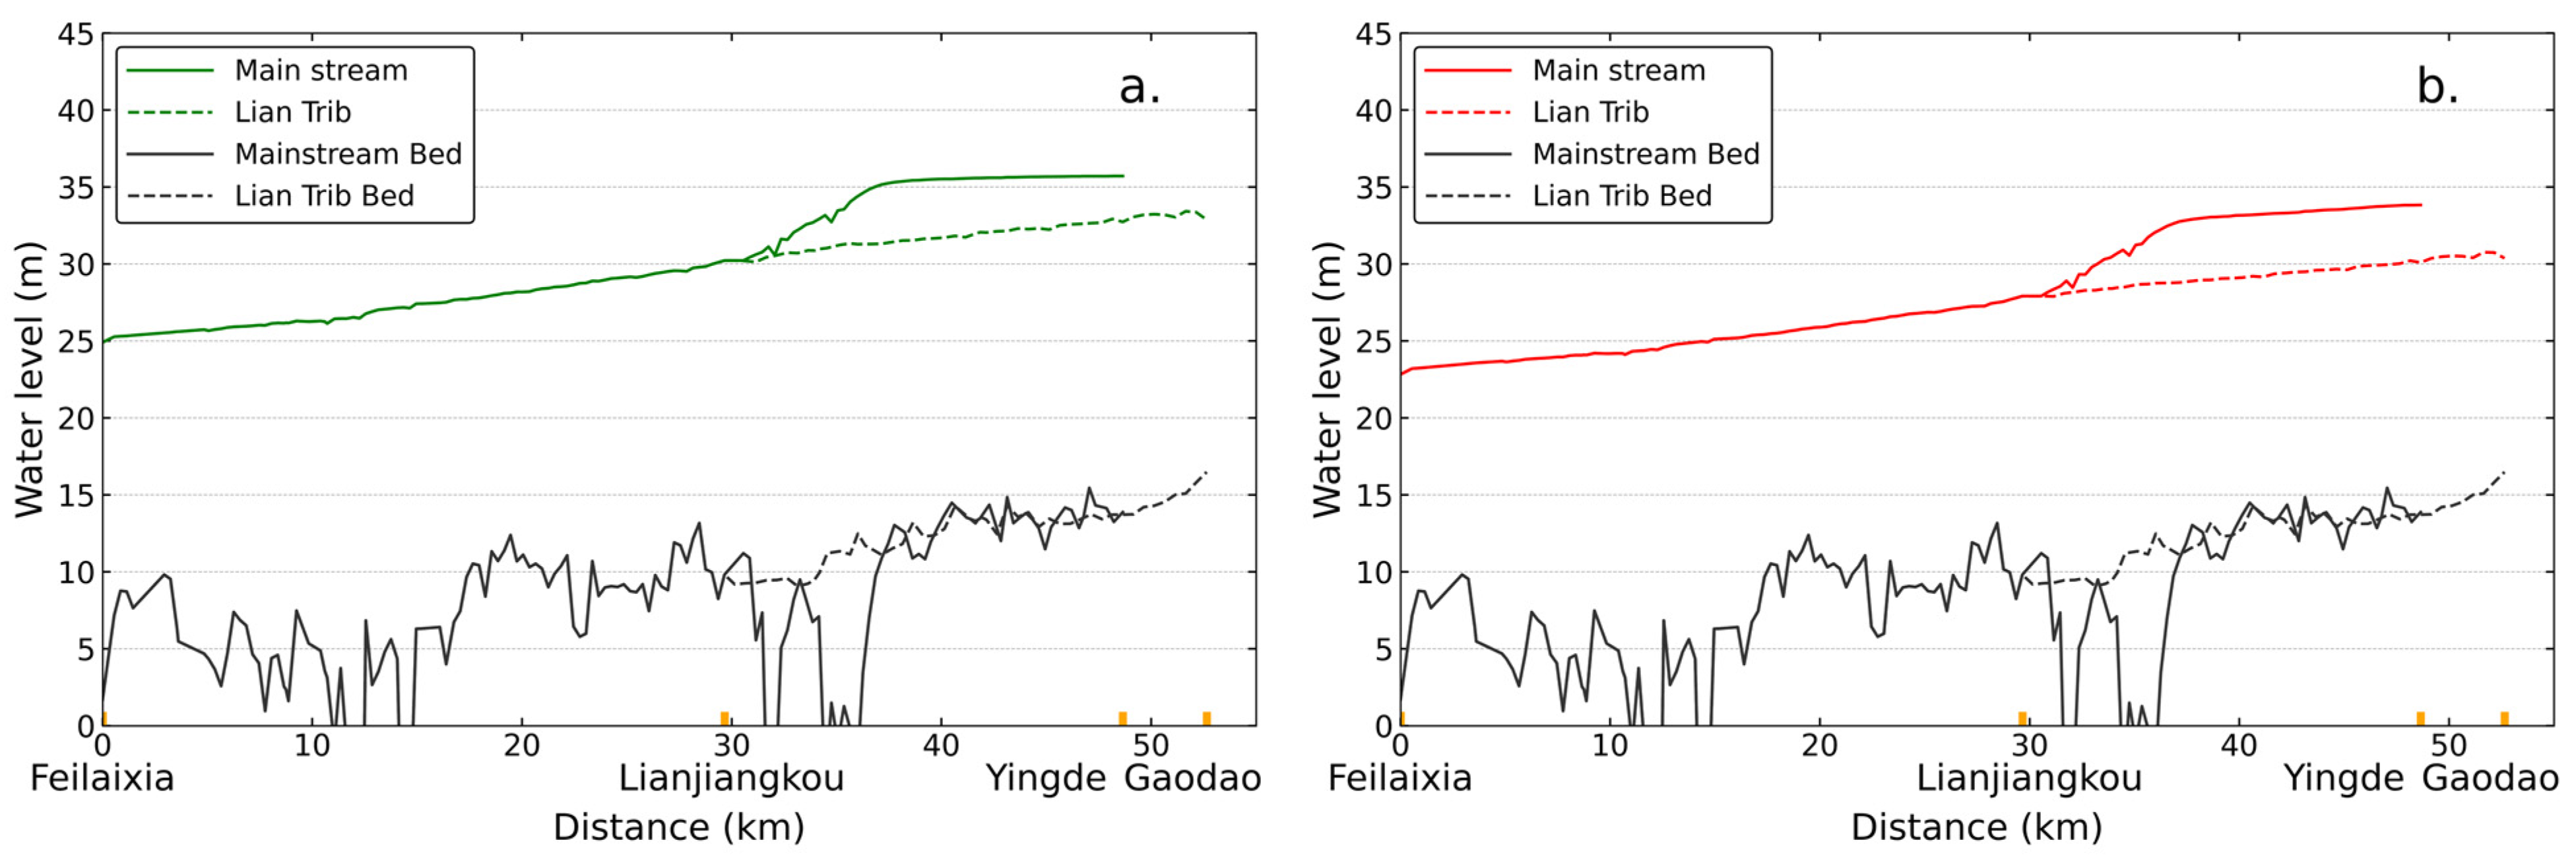
Water 17 01447 g010
Figure 11. (a) Instant water level profiles along the main stream of Feilaixia Reservoir and the Lian River tributary at T2 6/22 10:00 and (b) T2 4/21 13:00. The orange labels are the location of the three water level sites.
Water 17 01447 g011
Table 1. The data sources and descriptions used in this study.
ItemDescriptionSourceNote
DEMResolution: 30 mThe Copernicus Digital Elevation Model (COP-DEM) released by the European Space Agency (ESA)The geoid is EGM2008
LeveePrecision: 0.01 mQingyuan Hydrology Bureau-
BathymetryPrecision: 0.1 m; Grid size: 5 mThe Pearl River Hydraulic Research Institute and Qingyuan Hydrology Bureau Surveyed in 2020 and 2022
Water level and flowHourly observations Precision: 0.01 mFlood situation announcement system of Guangdong Provincial Water Resources Department (https://slt.gd.gov.cn/)During flood events in 2022 and 2024.
PrecipitationHourly observations Precision: 0.1 mmFlood situation announcement system of Guangdong Provincial Water Resources Department (https://slt.gd.gov.cn/)For flood events in 2022 and 2024.
Table 2. Water levels in front of the dam and reservoir inflow for seven return periods.
ParametersReturn Periods (1: n Year)
5102050100200300
Water level (m)24242425.1728.6530.8131.17
Inflow (m3/s)11,94413,69115,24617,11818,43919,70120,436
Table 3. Scenario simulations for assumed reservoir inflow and water levels in front of the dam.
ParametersWater Level (m)/Flow (m3/s)
Water level (m)24262830-
Reservoir inflow500500010,00015,00020,000
North River/Baishiyao25025005000750010,000
Weng River/Changhu1001000200030004000
Lian River/Gaodao1501500300045006000
Table 4. Instant inflow, outflow, simulated dynamic storage (S), static storage (S), and water levels (W.L.) along the main stream of the Feilaixia Reservoir at three typical time in June 2022. T1: before flood, T2: peak water levels at Yingde (YD), and T3: peak water levels at Feilaixia Dam (FLX). BSY: Baishiyao.
Date and TimeW.L. at FLX (m)W.L. at YD (m)W.L. at BSY (m)Inflow (m3/s)Outflow (m3/s)Dynamic S. (108 m3)Static S. (108 m3)
T1 6/17 00:0018.4925.1528.47529059703.900.92
T2 6/22 10:0024.9035.7137.4921,30019,81011.815.26
Accumulated water change during 17–22 June (108 m3)62.9855.227.914.34
T3 6/23 05:0026.8234.0935.2215,58017,86011.196.56
Accumulated water change during 22–23 June (108 m3)12.8513.52−0.621.30
Accumulated water change during 17–25 June (108 m3)92.2190.83//
Table 5. Instant inflow at Gaodao (GD) and water levels (W.L.) along the Lian River tributary of the Feilaixia Reservoir at three typical time in June 2022. T1: before flood, T2: peak water levels at Yingde (YD), and T3: peak water levels at Feilaixia Dam (FLX). LJK: Lianjiangkou.
Date and TimeW.L. at FLX (m)W.L. at LJK (m)W.L. at GD (m)Inflow at GD (m3/s)
T1 6/17 00:0018.4921.1224.591700
T2 6/22 10:0024.9030.1032.898280
Accumulated water change during 17–22 June (108 m3)20.59
T3 6/23 05:0026.8230.1933.158450
Accumulated water change during 22–23 June (108 m3)5.79
Accumulated water change during 17– 25 June (108 m3)35.73
Table 6. Instant inflow, outflow, simulated dynamic storage (S), static storage (S), and water levels (W.L.) along the main stream of the Feilaixia Reservoir at three typical time in April 2024. T1: before flood, T2: peak water levels at Yingde (YD), and T3: peak water levels at Feilaixia Dam (FLX). BSY: Baishiyao.
Date and TimeW.L. at FLX (m)W.L. at YD (m)W.L. at BSY (m)Inflow (m3/s)Outflow (m3/s)Dynamic S. (108 m3)Static S. (108 m3)
T1 4/16 00:0023.5123.7325.314504104.654.32
T2 4/21 13:0022.8233.7135.2216,97015,1009.503.85
Accumulated water change during 17–22 April (108 m3)26.1621.384.85−0.47
T3 4/22 12:0025.8732.8934.0912,98014,6709.285.92
Accumulated water change during 22–23 April (108 m3)12.4812.75−0.222.07
Accumulated water change during 17–25 April (108 m3)53.9754.53//
Table 7. Instant inflow at Gaodao (GD), outflow, and water levels (W.L.) along the Lian River tributary at three typical time in April 2024. T1: before flood, T2: peak water levels at Yingde (YD), and T3: peak water level at Feilaixia dam (FLX). LJK: Lianjiangkou.
Date and TimeW.L. at FLX (m)W.L. at LJK (m)W.L. at GD (m)Inflow at GD (m3/s)
T1 4/16 00:0023.5123.5223.5450
T2 4/21 13:0022.8228.0530.376070
Accumulated water change during 17–22 April (108 m3)7.62
T3 4/22 12:0025.8729.0632.057500
Accumulated water change during 22–23 April (108 m3)6.24
Accumulated water change during 17–25 April (108 m3)21.45
Table 8. Variations in wedge storage and static storage (108 m3) at four constant water levels in front of the dam and four steady inflows.
Water Level (m)Static Storage (108 m3)Wedge Storage (108 m3) Under Four Inflows (m3/s)
500010,00015,00020,000
244.76 0.89 (19%)2.54 (53%)4.58 (96%)9.49 (199%)
265.92 0.67 (11%)2.23 (38%)4.11 (69%)9.03 (152%)
287.26 0.58 (8%)1.94 (27%)4.60 (63%)8.67 (119%)
308.810.48 (5%)1.77 (20%)4.28 (49%)8.84 (100%)
Table 9. Simulated water levels at the flood storage detention zones and the designed levee heights.
Inflow (m3/s)Water level: Dam (m)ShegangLianjiangkouBoluokenYingdeBaishiyao
Levee Height (m)30.2933.0234.2936.75-
5000Natural river16.1420.4823.6925.4028.87
2424.0624.7626.2327.0629.26
2626.0426.4827.5528.1229.70
2828.0328.3229.1029.4730.49
3030.0230.2230.7931.0231.65
10,000Natural river19.4023.9028.6730.0832.55
2424.2526.4129.9330.9932.99
2626.1627.6730.6231.5033.28
2828.1129.1731.5632.2633.74
3030.0830.8332.7333.2634.42
15,000Natural river22.2926.7932.6233.7335.76
2424.5428.2633.3534.2936.11
2626.3529.1733.7534.6236.32
2828.2430.3434.3435.1036.65
3030.1831.7335.1335.7837.13
20,000Natural river24.8529.3335.9636.8738.65
2424.9230.0636.4137.2538.85
2626.6130.7436.6737.4739.00
2828.4331.6537.0637.8139.24
3030.3132.8137.6238.2939.60
Table 10. Comparison of peak flood stages in reservoir regulation and natural river at Feilaixia (FLX), Lianjiangkou (LJK), and Yingde (YD) under reservoir regulation and natural river in June 2022 and April 2024.
DateStationsPeak Flood Stages in Reservoir (m)Peak Flood Stages in Natural River (m)Stage Difference (m)
June 2022Feilaixia26.8223.623.20
Lianjiangkou30.3729.231.14
Yingde35.7135.490.22
April 2024Feilaixia25.8721.893.98
Lianjiangkou28.7827.661.12
Yingde33.7133.700.01
Disclaimer/Publisher’s Note: The statements, opinions and data contained in all publications are solely those of the individual author(s) and contributor(s) and not of MDPI and/or the editor(s). MDPI and/or the editor(s) disclaim responsibility for any injury to people or property resulting from any ideas, methods, instructions or products referred to in the content.

