
Economic Valuation of Ancestral Artificial Aquifer Recharge Systems in High Mountain Environments of Sierra Nevada, Spain


Abstract
:1. Introduction
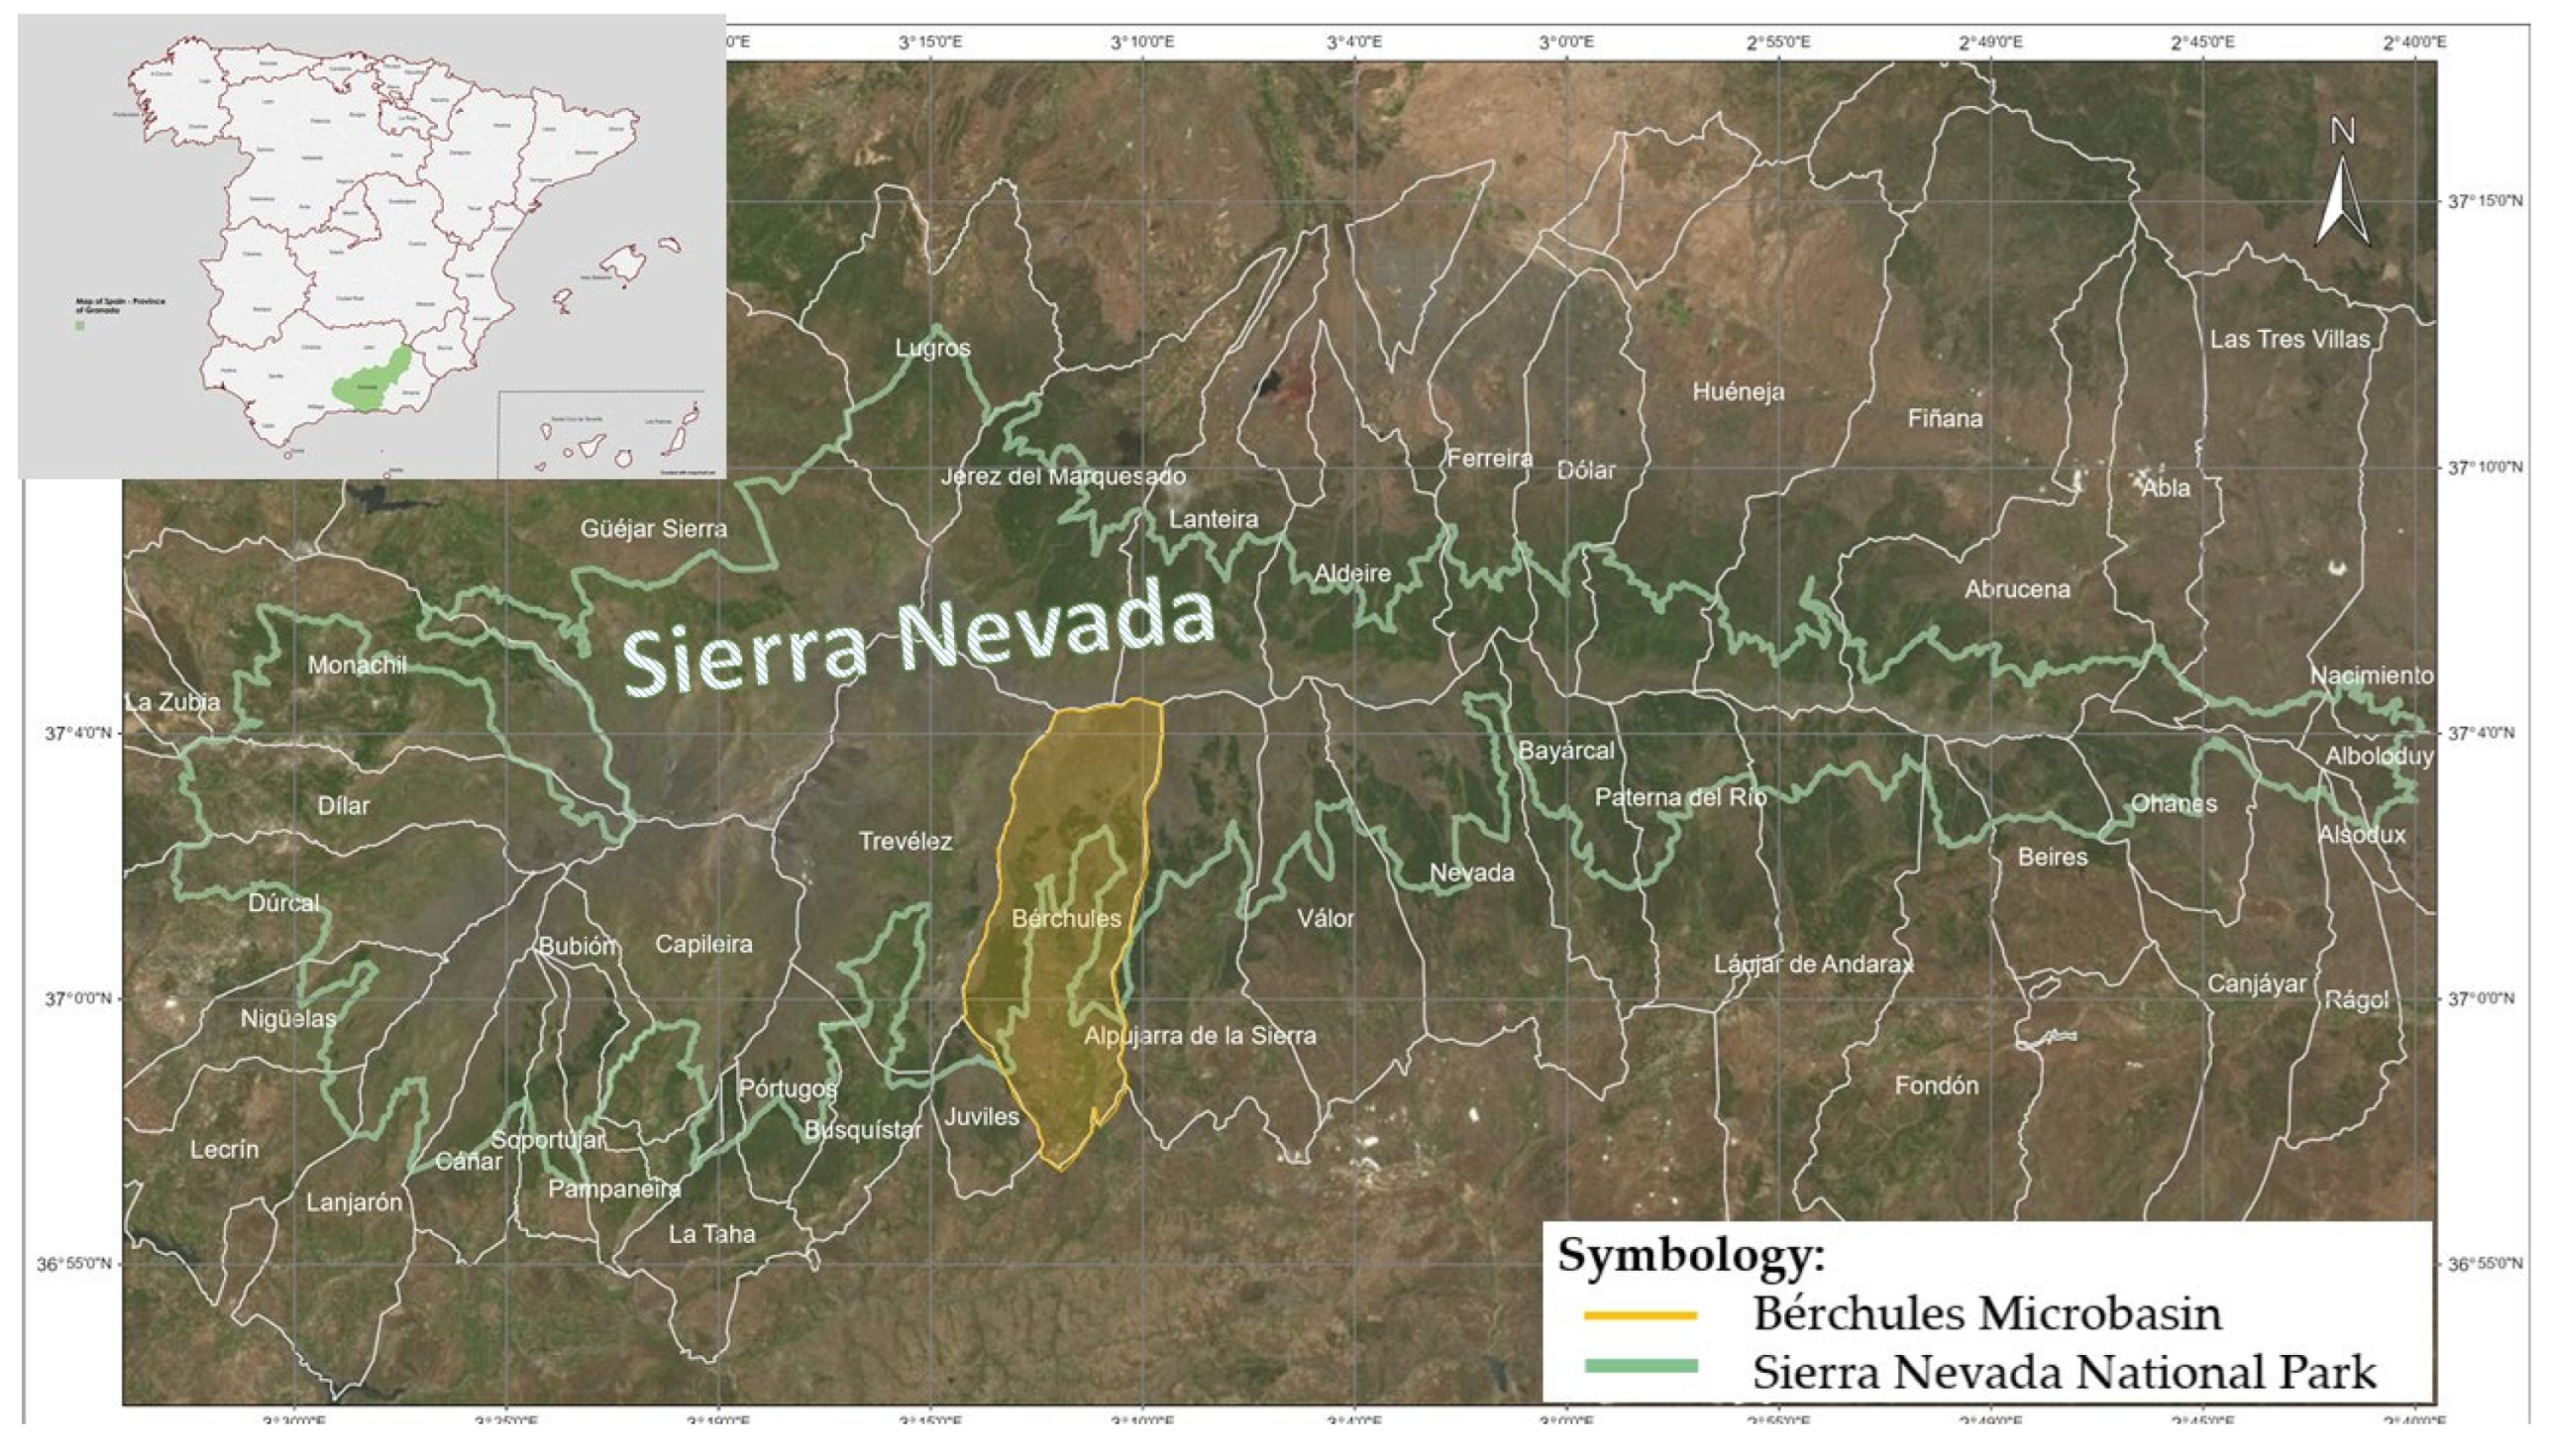
2. Case Study
2.1. Territorial Characteristics
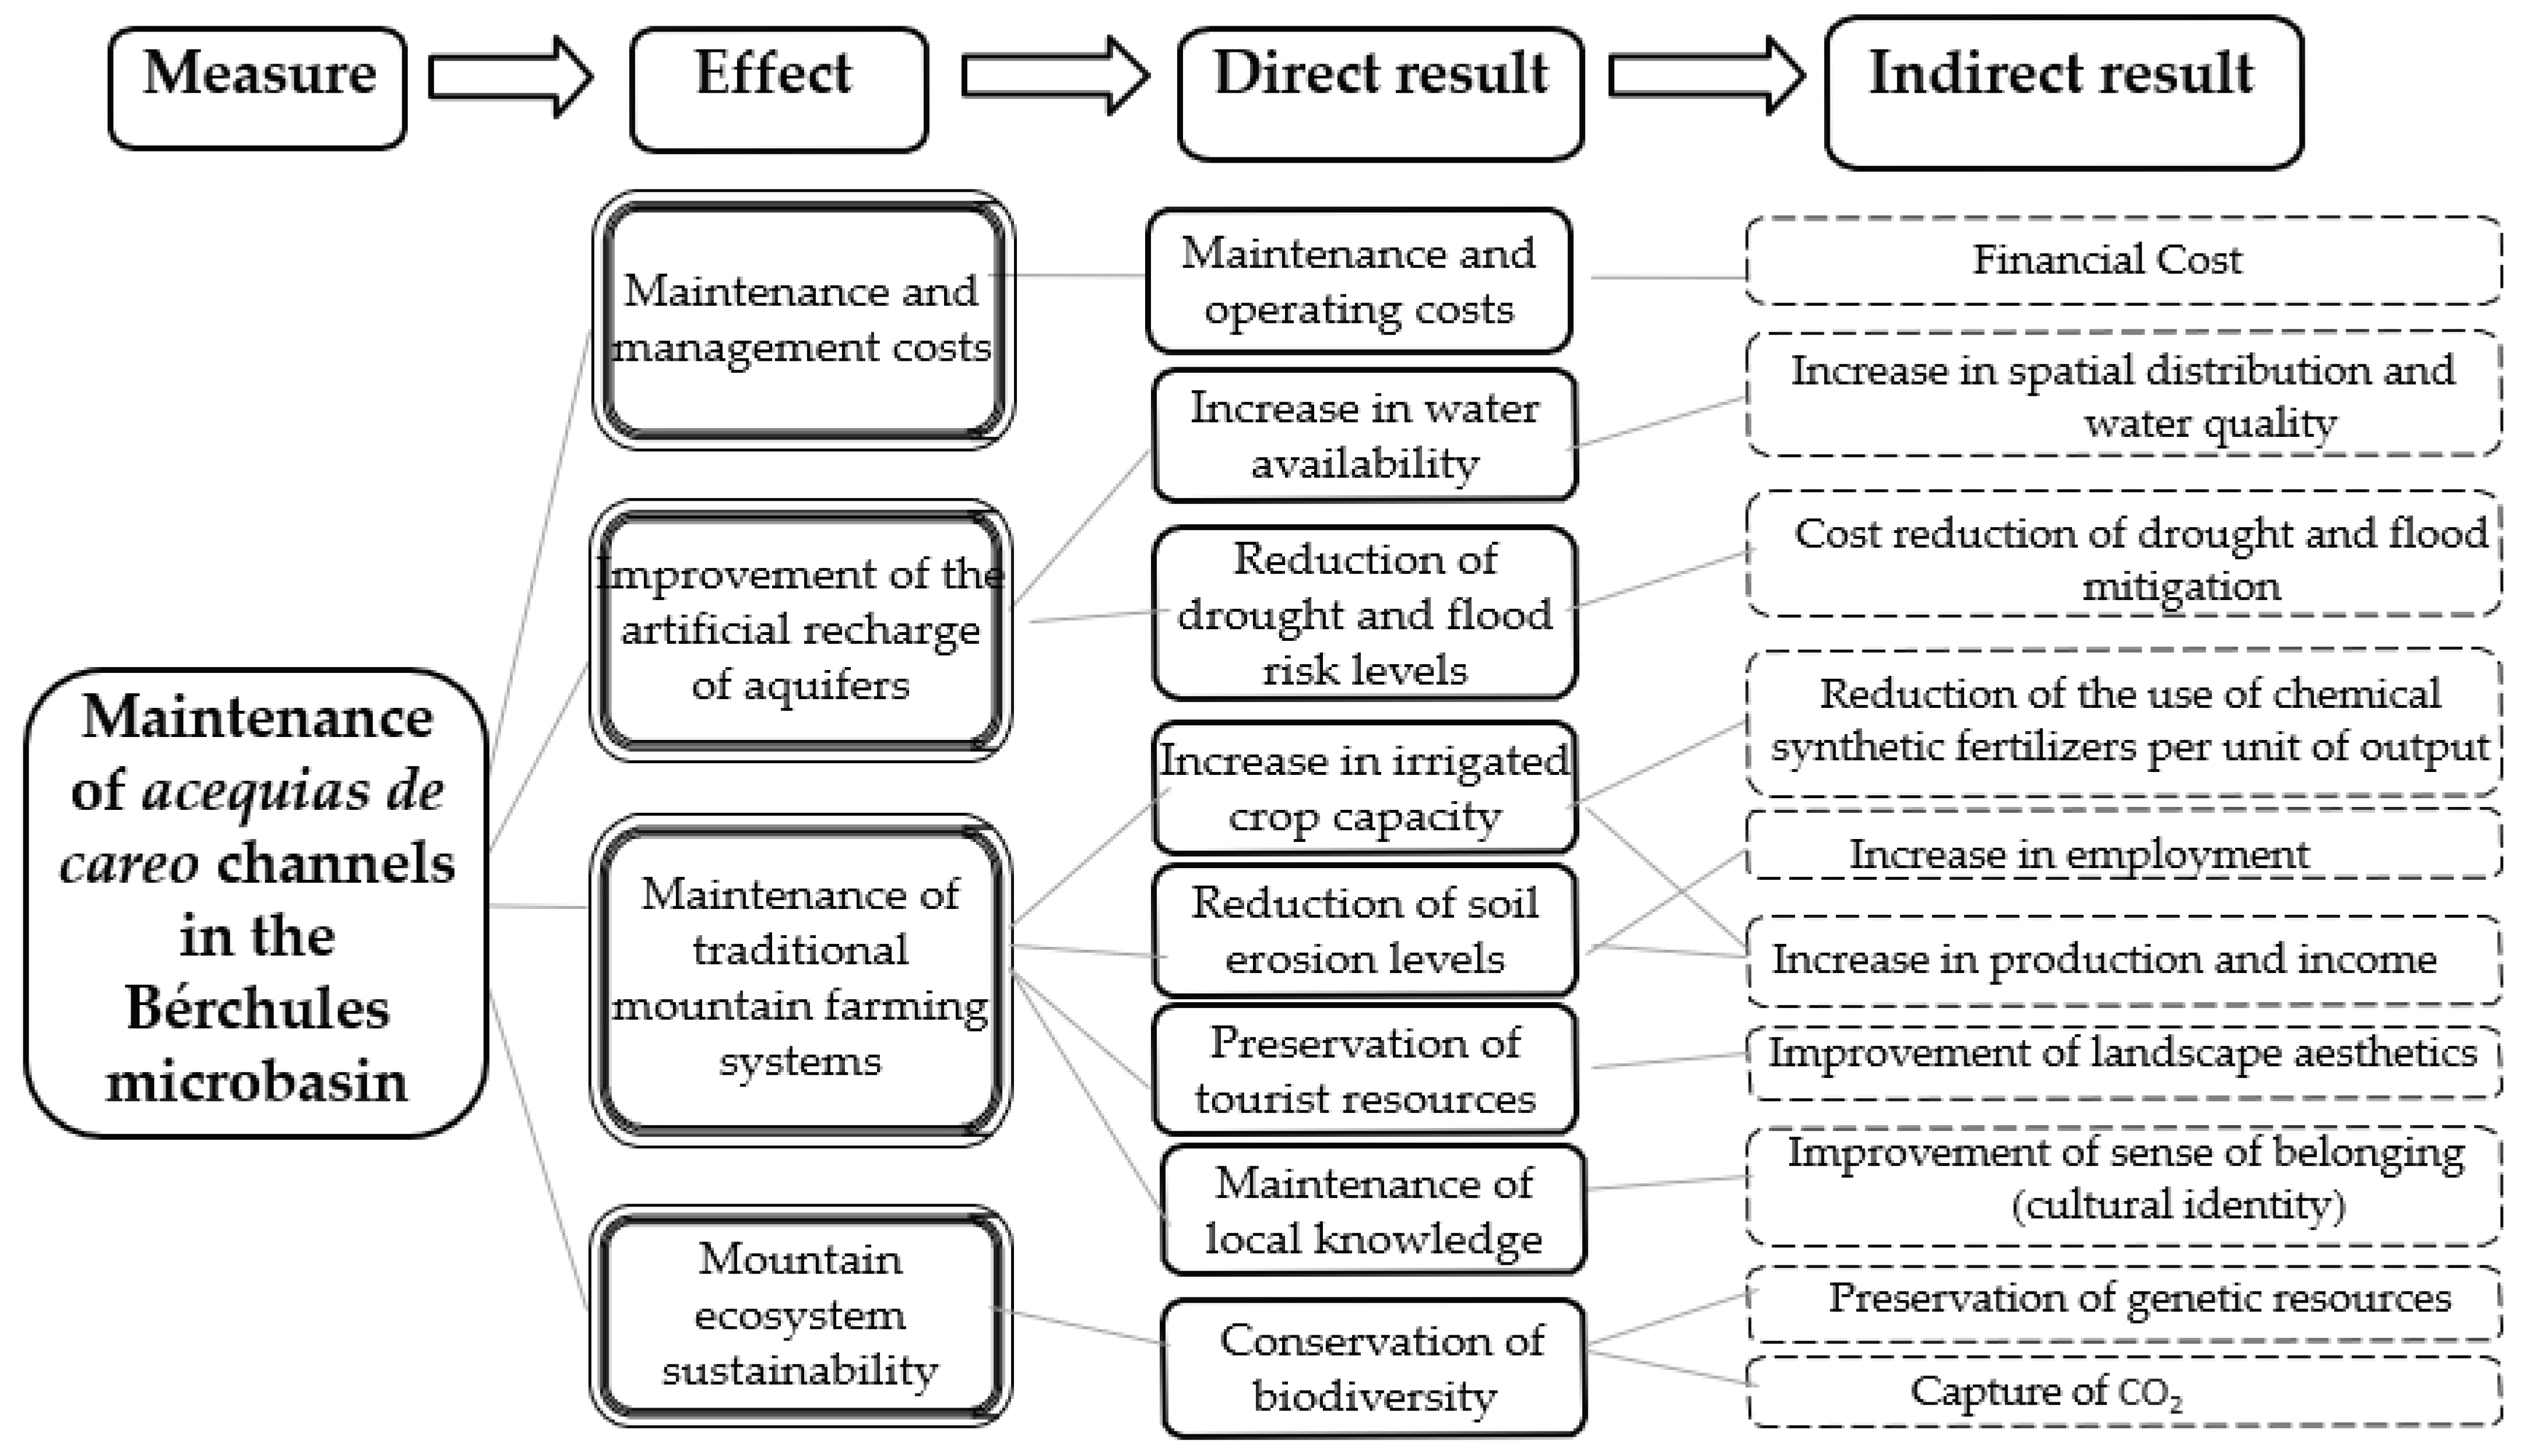
2.2. Description of the ‘Acequias de Careo’ Irrigation System
3. Materials and Methods
3.1. Materials
3.2. Method: Cost–Benefit Analysis (CBA)
3.2.1. Cost Estimation
3.2.2. Benefit Estimation
3.2.3. Estimation of the Benefit/Cost Ratio
3.3. Definition of Scenarios and System Boundaries
3.4. Selection of Indicators
4. Results: Cost–Benefit Analysis of the Careo Channels
4.1. Estimation of Costs
- (a)
- Direct and indirect conservation and operation costs:
- Direct costs: The Bérchules irrigation community hires a person known as the ‘acequiero’, who is responsible for carrying out the cleaning, maintenance, and operation tasks for the irrigation canals. To perform these duties, various resources are required, including a means of transportation (car), fuel, labour tools, and a mobile phone.
- Indirect costs: The irrigation community has a board of directors responsible for planning, organising, and overseeing the operation of the careo channels. To this end, they hold meetings and assemblies to make decisions that ensure the proper functioning of the irrigation system. At the end of each summer, before the wet season begins, the acequiero inspects the canals and identifies defective sections. Subsequently, in coordination with the irrigation community, a group of workers is hired to carry out cleaning and/or rehabilitation tasks. The cleaning process involves removing vegetation, rocks, accumulated sediments, and other elements obstructing the water flow. In certain cases, this may require the use of machinery and specialised personnel, especially when landslides occur along the irrigation canals.
4.2. Estimation of Benefits
- (a)
- Increase in the value generated in agriculture. It was assumed that, on average, 4.8 hm3/year of the careo channel water is allocated to agricultural production under irrigation, and the GVA of the weighted average of the irrigated crops in the area was determined. The results are attached in Appendix A. The main crops include almonds, olives, vineyard grapes, greenhouse produce, wheat/oats, vegetables, and other irrigated herbaceous crops [37].
- (b)
- Increase in Agricultural Employment. In addition to this direct effect of GVA increase in Equation (2), the careo channel system in the Bérchules micro-catchment would have an indirect multiplier effect on generating employment in agricultural activities. To assess this effect, the number of jobs generated by the benefit amount was determined. To calculate the number of jobs created by agricultural activities, we divided the agricultural GVA by the GVA per agricultural job, which amounts to 40,573 EUR/job (INE, 2025). This, therefore, corresponds to 237 jobs.
- (c)
- Increase in water supply guarantee. Water supply companies, in order to ensure water purchase rights in the case of drought, maintain water reserves for emergency events, thereby guaranteeing water supply. To assign the corresponding value, we reviewed the literature and obtained the following indicators:
- (d)
- Increase in tree crop cultivation (CO2 capture). With an average of 4.8 hm3/year of water, 1180 ha of a “typical” crop are irrigated, including tree crops; it is considered that tree crops represent 20% of the total. According to Tocados-Franco et al. in their study of 2024, the CO2 capture is 6 t/ha/year, and, thus, a total of 1416 t of CO2 is captured [49]. The analysis of the carbon rights market in the EU for 2023 determines that the average value of each ton of CO2 is 70 EUR/t. To determine the economic value of the increase in CO2 capture, we multiply 1416 t by 70 EUR/t, which results in 99,120 EUR/year.
- (e)
- Increase in induced tourism. The careo channels are ancient hydraulic systems integrated into a traditional agricultural system, of which the terraces form part. They are also part of a landscape of great biological value, such as the Sierra Nevada National Park, which represents a tourist resource. In this regard, Sayadi et al. report in their study that the average willingness to pay (WTP) for accommodation with scenic views, including an agricultural irrigated component on intermediate slopes with some visible village or traditional houses on the landscape, is 31.60 EUR/day [50]. This is significantly higher than the lower-valued landscape (landscapes of abandoned agricultural land with no villages in sight and steep slopes), which was estimated at 21.48 EUR/day. Therefore, the results of the study are highly relevant because they demonstrate that the terraced irrigation system in the Alpujarra has a societal benefit beyond just its productive value, thereby justifying the value included in the CBA.
- (f)
- Multiplier of GVA in the rest of the economy (non-agricultural sectors). The growth of the agricultural sector produces a multiplier effect in industry (mainly agro-food processors, but also in other complementary industries) and in services (mainly transportation and service providers to farms and food processors). Borrego-Marín and Berbel used the irrigation multiplier for California in 2018, which is estimated at 1.49 (i.e., for every euro generated in agriculture, 0.44 EUR is induced in the rest of the economy) [53]. However, in our case, a local estimate of 1.80 was used, based on input–output tables for Spain [54]. This means that for every euro of added value in the agricultural sector, 0.80 EUR is generated in surrounding industries and services (input production and product processing). To determine the GVA in the remaining non-agricultural sectors, the increase in the agricultural value was multiplied by 0.80.
5. Discussion
6. Conclusions
Author Contributions
Funding
Data Availability Statement
Conflicts of Interest
Appendix A

| Weighted Average | Almonds | Olive Groves | Vineyards | Greenhouses | Wheat/Oats | Horticultural A.L. | Others—Irrigated Herb. | |
|---|---|---|---|---|---|---|---|---|
| Area (ha) according to Hydrological Plan | 1.00 | 1.00 | 1.00 | 1.00 | 1.00 | 1.00 | 1.00 | 1.00 |
| Average production (Kg/ha) | 29,940.89 | 2311.00 | 7900.00 | 15,154.00 | 11,600.00 | 4500.00 | 40,980.80 | 22,740.40 |
| Average price (EUR/Kg) | 0.53 | 1.46 | 0.53 | 0.26 | 0.66 | 0.20 | 0.31 | 0.30 |
| Gross Product (EUR/ha) | ||||||||
| 1-Product revenues | 15,465.92 | 3370.36 | 4207.28 | 3893.56 | 76,560.00 | 918.00 | 12,568.81 | 6743.41 |
| 2-Subsidies | 4.03 | 12.23 | 15.59 | 0.37 | 0.00 | 0.00 | 0.00 | 0.00 |
| 3-Indemnities and others | 3.69 | 0.00 | 0.00 | 19.93 | 0.00 | 3.91 | 0.00 | 1.96 |
| Gross Product (1 + 2 + 3) | 15,473.63 | 3382.59 | 4222.87 | 3913.86 | 76,560.00 | 921.91 | 12,568.81 | 6745.36 |
| Costs (EUR/ha) | ||||||||
| 4-Total direct costs | 3421.59 | 521.79 | 298.31 | 484.49 | 18,600.00 | 362.44 | 2335.26 | 1348.85 |
| 5-Machinery | 723.75 | 319.88 | 141.84 | 237.95 | 3523.00 | 169.34 | 393.05 | 281.19 |
| 6-Paid labour | 3184.95 | 266.13 | 374.06 | 363.67 | 19,432.00 | 0.00 | 1239.18 | 619.59 |
| 7-Total paid indirect costs | 1899.96 | 406.45 | 321.79 | 435.45 | 10,835.00 | 125.63 | 741.72 | 433.67 |
| 8-Depreciation | 644.57 | 279.12 | 207.46 | 171.00 | 3339.00 | 209.99 | 133.61 | 171.80 |
| Subtotal costs (4 + 5 + 6 + 7 + 8) | 9874.81 | 1793.36 | 1343.45 | 1692.55 | 55,729.00 | 867.40 | 4842.81 | 2855.11 |
| 9-Other Indirect Costs | 2011.81 | 713.50 | 600.92 | 693.0 3 | 9970.00 | 268.88 | 1134.61 | 701.75 |
| Family labour | 796.94 | 379.81 | 269.85 | 467.55 | 3223.00 | 130.29 | 695.27 | 412.78 |
| Total production cost | 11,886.62 | 2506.86 | 1944.37 | 2385.58 | 65,699.00 | 1136.28 | 5977.42 | 3556.85 |
| Results (EUR/Ha) | ||||||||
| 10-Gross Product (1 + 2 + 3) | 15,473.63 | 3382.59 | 4222.87 | 3913.86 | 76,560.00 | 921.91 | 12,568.81 | 6745.36 |
| 11-Gross Value Added (GVA) * | 8143.34 | 2274.79 | 3408.46 | 2827.75 | 35,005.00 | 390.13 | 8601.32 | 4495.73 |
References
- Mazzocchi, C.; Sali, G. Tourists’ perception of ecosystem services provided by mountain agriculture. Sustainability 2022, 14, 12171. [Google Scholar] [CrossRef]
- Alavi-Murillo, G.; Diels, J.; Gilles, J.; Willems, P. Soil organic carbon in Andean high-mountain ecosystems: Importance, challenges, and opportunities for carbon sequestration. Reg. Environ. Change 2022, 22, 1–16. [Google Scholar] [CrossRef]
- Canedoli, C.; Rota, N.; Vogiatzakis, I.N.; Zanchi, A.; Drius, M.; Nagendra, H.; Padoa-Schioppa, E. Review of indicators for mountain ecosystem services: Are the most frequently used also the best? Ecol. Indic. 2024, 166, 112310. [Google Scholar] [CrossRef]
- Palomo, I. Climate change impacts on ecosystem services in high mountain areas: A literature review. Res. Dev. 2017, 37, 179–187. [Google Scholar] [CrossRef]
- Grupo Intergubernamental de Expertos sobre el Cambio Climático (IPCC). Fact Sheet—Food and Water. IPCC. 2022. Available online: https://www.ipcc.ch/report/ar6/wg2/downloads/outreach/IPCC_AR6_WGII_FactSheet_FoodAndWater.pdf (accessed on 3 September 2024).
- Straffelini, E.; Luo, J.; Tarolli, P. Climate change is threatening mountain grasslands and their cultural ecosystem services. CATENA 2024, 237, 107802. [Google Scholar] [CrossRef]
- Yu, Z.; Zhang, H.; Sun, P.; Guo, Y. The pattern and local push factors of rural depopulation in less-developed areas: A case study in the mountains of North Hebei Province, China. Int. J. Environ. Res. Public Health 2022, 19, 5909. [Google Scholar] [CrossRef]
- Muñoz-Ulecia, E.; Bernués, A.; Casasús, I.; Olaizola, A.; Lobón, S.; Martín-Collado, D. Drivers of change in mountain agriculture: A thirty-year analysis of trajectories of evolution of cattle farming systems in the Spanish Pyrenees. Agric. Syst. 2021, 186, 102983. [Google Scholar] [CrossRef]
- Moreno-Llorca, R.; Vaz, A.; Herrero, J.; Millares, A.; Bonet-García, F.; Alcaraz-Segura, D. Multi-scale evolution of ecosystem services’ supply in Sierra Nevada (Spain): An assessment over the last half-century. Ecosyst. Serv. 2020, 46, 101204. [Google Scholar] [CrossRef]
- Voulvoulis, N.; Arpon, K.D.; Giakoumis, T. The EU Water Framework Directive: From great expectations to problems with implementation. Sci. Total Environ. 2017, 575, 358–366. [Google Scholar] [CrossRef]
- United Nations. Sustainable Development Goals. 2023. Available online: https://www.un.org/sustainabledevelopment/es/climate-change-2/ (accessed on 3 September 2024).
- United for Life & Livelihoods. ¿Qué son las Soluciones Basadas en la Naturaleza? 2017. Available online: https://www.iucn.org/es/news/am%C3%A9rica-del-sur/201707/%C2%BFqu%C3%A9-son-las-soluciones-basadas-en-la-naturaleza (accessed on 2 September 2024).
- Keesstra, S.; Nunes, J.; Novara, A.; Finger, D.; Avelar, D.; Kalantari, Z.; Cerdà, A. The superior effect of nature based solutions in land management for enhancing ecosystem services. Sci. Total Environ. 2018, 610–611, 997–1009. [Google Scholar] [CrossRef]
- Beltrán, M.A.Q.; Sotomayor, D.A. Soluciones basadas en la Naturaleza: Un análisis bibliométrico de tendencias pasadas, presentes y futuras. Ecol. Apl. 2023, 22, 237–255. [Google Scholar] [CrossRef]
- Herrera, D.; Cunniff, S.; DuPont, C.; Cohen, B.; Gangi, D.; Kar, D.; Snider, N.P.; Rojas, V.; Wyerman, J.; Norriss, J.; et al. Designing an environmental impact bond for wetland restoration in Louisiana. Ecosyst. Serv. 2019, 35, 260–276. [Google Scholar] [CrossRef]
- Jódar, J.; Zakaluk, T.; González-Ramón, A.; Ruiz-Constán, A.; Lechado, C.M.; Martín-Civantos, J.; Custodio, E.; Urrutia, J.; Herrera, C.; Lambán, L.; et al. Artificial recharge by means of careo channels versus natural aquifer recharge in a semi-arid, high-mountain watershed (Sierra Nevada, Spain). Sci. Total Environ. 2022, 825, 153937. [Google Scholar] [CrossRef] [PubMed]
- Zakaluk, T.; Jódar, J.; González-Ramón, A.; Civantos, J.M.; Lambán, L.; Martos-Rosillo, S. Ancestral managed aquifer recharge systems and their impacts on the flow regime of a semi-arid alpine basin (Sierra Nevada, Spain). J. Hydrol. Reg. Stud. 2024, 54, 101870. [Google Scholar] [CrossRef]
- Martos-Rosillo, S.; Ruiz-Constán, A.; González-Ramón, A.; Mediavilla, R.; Martín-Civantos, J.; Martínez-Moreno, F.; Jódar, J.; Marín-Lechado, C.; Medialdea, A.; Galindo-Zaldívar, J.; et al. The oldest managed aquifer recharge system in Europe: New insights from the Espino recharge channel (Sierra Nevada, southern Spain). J. Hydrol. 2019, 578, 124047. [Google Scholar] [CrossRef]
- French, K. Indigenous knowledge, water management, and learning from our collective past. J. Anthropol. Archaeol. 2022, 68, 101466. [Google Scholar] [CrossRef]
- Martos Rosillo, S.; González Ramón, A.; Marín-Lechado, C.; Guardiola Albert, C.; Ruiz Constán, A.; Moral Martos, F.; Navarrete-Mazariegos, E.; Jódar, J.; Pedrera Parias, A.; Durán Valsero, J.J. Las Acequias de Careo de Sierra Nevada (sur de España): Una Herramienta Ancestral para la Adaptación al Cambio Climático. In Congreso Internacional de las Montañas; Universidad de Granada: Granada, Spain, 2018. [Google Scholar]
- Jódar, J.; Martos-Rosillo, S.; Custodio, E.; Mateos, L.; Cabello, J.; Casas, J.; Salinas-Bonillo, M.J.; Martín-Civantos, J.M.; González-Ramón, A.; Zakaluk, T.; et al. The Recharge Channels of the Sierra Nevada Range (Spain) and the Peruvian Andes as Ancient Nature-Based Solutions for the Ecological Transition. Water 2022, 14, 3130. [Google Scholar] [CrossRef]
- Zhang, H.; Xu, Y.; Kanyerere, T. A review of the managed aquifer recharge: Historical development, current situation and perspectives. Phys. Chem. Earth Parts A/B/C 2020, 118–119, 102887. [Google Scholar] [CrossRef]
- Maliva, R.G. Economics of managed aquifer recharge. Water 2014, 6, 1257–1279. [Google Scholar] [CrossRef]
- Bernués, A.; Rodríguez-Ortega, T.; Ripoll-Bosch, R.; Alfnes, F. Socio-cultural and economic valuation of ecosystem services provided by Mediterranean mountain agroecosystems. PLoS ONE 2014, 9, e102479. [Google Scholar] [CrossRef]
- Alcon, F.; Zabala, J.A.; Martínez-García, V.; Albaladejo, J.A.; López-Becerra, E.I.; De-Miguel, M.D.; Martínez-Paz, J.M. The social wellbeing of irrigation water. A demand-side integrated valuation in a Mediterranean agroecosystem. Agric. Water Manag. 2022, 262, 107400. [Google Scholar] [CrossRef]
- Martínez-Paz, J.M.; Banos-González, I.; Martínez-Fernández, J.; Esteve-Selma, M.Á. Assessment of management measures for the conservation of traditional irrigated lands: The case of the Huerta of Murcia (Spain). Land Use Policy 2019, 81, 382–391. [Google Scholar] [CrossRef]
- Rupérez-Moreno, C.; Pérez-Sánchez, J.; Senent-Aparicio, J.; Flores-Asenjo, P.; Paz-Aparicio, C. Cost-benefit analysis of the managed aquifer recharge system for irrigation under climate change conditions in Southern Spain. Water 2017, 9, 343. [Google Scholar] [CrossRef]
- Ruberto, M.; Branca, G.; Troiano, S.; Zucaro, R. The economic value of ecosystem services of irrigation: A choice experiment for the monetary evaluation of irrigation canals and fontanili in Lombardy. Rev. Agric. Econ. (REA) 2022, 77, 27–39. [Google Scholar] [CrossRef]
- Halytsia, O.; Vrachioli, M.; Janik, K.; Sitek, S.; Wojtal, G.; Imig, A.; Rein, A.; Sauer, J. Assessing economic feasibility of managed aquifer recharge schemes: Evidence from cost-benefit analysis in Poland. Water Resour. Manag. 2022, 36, 5241–5258. [Google Scholar] [CrossRef]
- Redrado, C. Cost-Benefit Analysis of Careo Channels and the Traditional Irrigational System of Sierra Nevada, Granada and Almería (Spain). Master’s Thesis, University of Copenhagen, Copenhagen, Denmark, 2023. [Google Scholar]
- Instituto Geológico y Minero de España. Investigación hidrogeológica de acuíferos de alta montaña sometidos a uso intensivo del agua subterránea. cabecera del Río Bérchules (Sierra Nevada, Granada) Informe final Diciembre de 2015. 2015. [Google Scholar]
- Peñas, J.L.J.; Biología de la Conservación de Plantas en Sierra Nevada. Principios y Retos Para su Preservación; Univesidad de Granada: Granada, Spain, 2019. [Google Scholar]
- Ruiz, J.F.; Martín, J.M. La Gestión Comunitaria del Agua en la Cara Norte de Sierra Nevada: Acción Colectiva y Saberes Etnoecológicos en los Sistemas de Riego de Origen Andalusí; Universidad de Granada, Departamento de Historia del Arte, Observatorio del Patrimonio Histórico Español, Proyecto de Investigación de Excelencia HUM 620; Editorial Universidad de Granada: Granada, Spain, 2017. [Google Scholar]
- Jódar, J.; Cabrera, J.A.; Martos-Rosillo, S.; Ruiz-Constán, A.; González-Ramón, A.; Lambán, L.J.; Herrera, C.; Custodio, E. Groundwater discharge in high-mountain watersheds: A valuable resource for downstream semi-arid zones. The case of the Bérchules River in Sierra Nevada (Southern Spain). Sci. Total Environ. 2017, 593–594, 760–772. [Google Scholar] [CrossRef]
- González-Ramón, A.; Martos, F.M.; Marín, C. Factores geomorfológicos condicionantes de la hidrogeología de la cuenca alta del Río Bérchules (Sierra Nevada, Granada), in SIAGA 2015. Málaga 2015, 4, 283–294. [Google Scholar]
- Barberá, J.; Jódar, J.; Custodio, E.; González-Ramón, A.; Jiménez-Gavilán, P.; Vadillo, I.; Pedrera, A.; Martos-Rosillo, S. Groundwater dynamics in a hydrologically-modified alpine watershed from an ancient managed recharge system (Sierra Nevada National Park, Southern Spain): Insights from hydrogeochemical and isotopic information. Sci. Total Environ. 2018, 640–641, 874–893. [Google Scholar] [CrossRef]
- Andalusian Institute of Statistics and Cartography [IECA]. Andalucía Pueblo a Pueblo—Fichas Municipales. 2025. Available online: https://www.juntadeandalucia.es/institutodeestadisticaycartografia/sima/ficha.htm?mun=18030 (accessed on 20 September 2024).
- Pulido-Bosch, A.; Ben Sbih, Y. Centuries of artificial recharge on the southern edge of the Sierra Nevada (Granada, Spain). Environ. Geol. 1995, 26, 57–63. [Google Scholar] [CrossRef]
- Burnett, K.; Wada, C.; Balderston, A. Benefit-cost analysis of watershed conservation on Hawai’i Island. Ecol. Econ. 2017, 131, 262–274. [Google Scholar] [CrossRef]
- Birol, E.; Koundouri, P.; Kountouris, Y. Assessing the economic viability of alternative water resources in water-scarce regions: Combining economic valuation, cost-benefit analysis and discounting. Ecol. Econ. 2010, 69, 839–847. [Google Scholar] [CrossRef]
- Hurtado, A.R.; Berbel, J. A cost–benefit analysis of reclaimed water and desalinated seawater for irrigation in Axarquia, Southern Spain. Land 2024, 13, 2156. [Google Scholar] [CrossRef]
- Borrego-Marín, M.M.; Berbel, J. Cost-benefit analysis of irrigation modernization in Guadalquivir River Basin. Agric. Water Manag. 2019, 212, 416–423. [Google Scholar] [CrossRef]
- Berbel, J.; Martin-Ortega, J.; Mesa, P. A cost-effectiveness analysis of water-saving measures for the Water Framework Directive: The case of the Guadalquivir River Basin in Southern Spain. Water Resour. Manag. 2011, 25, 623–640. [Google Scholar] [CrossRef]
- Alliance for Water Stewarchip. A Global Standard for Water Stewardship. Available online: https://a4ws.org/ (accessed on 15 January 2023).
- National Institute of Statistics (INE). Agricultual Indices and Wages; National Institute of Statistics: Madrid, Spain, 2024. [Google Scholar]
- Expósito, A.; Berbel, J. A simplified hydro-economic model of guadalquivir river basin for analysis of water-pricing scenarios. Water 2020, 12, 1879. [Google Scholar] [CrossRef]
- Mesa-Jurado, M.A.; Martin-Ortega, J.; Ruto, E.; Berbel, J. The economic value of guaranteed water supply for irrigation under scarcity conditions. Agric. Water Manag. 2012, 113, 10–18. [Google Scholar] [CrossRef]
- EMASAGRA (Empresa Municipal de Abastecimiento y Saneamiento de Granada, S.A. 18009 Granada, Spain). Personal communication, 2025.
- Tocados-Franco, E.; Martínez-Dalmau, J.; Espinosa-Tasón, J.; Montilla-López, N.M. Trends in water-energy nexus and carbon emissions balance in Axarquia Region, Spain, in the period 1990–2030. Environ. Process. 2024, 11, 11. [Google Scholar] [CrossRef]
- Sayadi, S.; González-Roa, M.C.; Calatrava-Requena, J. Public preferences for landscape features: The case of agricultural landscape in mountainous Mediterranean areas. Land Use Policy 2009, 26, 334–344. [Google Scholar] [CrossRef]
- Provincial Council of Granada. Tourism Area. 2020. Available online: https://www.dipgra.es/servicios/areas/turismo/ (accessed on 4 September 2024).
- Instituto Nacional de Estadística. Encuesta de Turismo de Residentes. 2023. Available online: https://www.ine.es/dyngs/Prensa/ETR4T24.htm (accessed on 4 September 2024).
- Borrego-Marín, M.M.; Berbel, J. Análisis Coste-Beneficio de la Modernización de Regadíos. In X Simposio del Agua en Andalucía; Club del Agua Subterránea: Madrid, Spain, 2018; pp. 1067–1079. [Google Scholar]
- Muñoz-Repiso, J.M.C.; Flores, M.A.C.; Ríos, M.O.; Collado, R.R. Análisis de sectores clave de la economía española a partir de la Matriz de Contabilidad Social de España 2007. Key Sectors Analysis of the Spanish Economy Using a Social Accounting Matrix for 2007. Estudios Econ. Apl. 2013, 31, 621–653. [Google Scholar]
- Hutton, G. Global Costs and Benefits of Drinking-Water Supply and Sanitation Interventions to Reach the MDG Target and Universal Coverage; World Health Organization: Geneva, Switzerland, 2012. [Google Scholar]
- Ross, A. Benefits and costs of managed aquifer recharge: Further evidence. Water 2022, 14, 3257. [Google Scholar] [CrossRef]
- Confederación Hidrográfica del Guadalquivir (Sevilla, Spain). Personal communication, 2025.
- López, N. Recovery of Medieval Irrigation Ditches in Almeria: “Water Has Returned to Flow Through the Mountains”. Diario de Almería 2025. Available online: https://www.diariodealmeria.es/provincia/recuperacion-acequias-medievales-almeria-oria_0_2003491260.html (accessed on 4 January 2025).
- Levy Guillén, L. Percepciones Locales de los Impactos del Cambio Climático y Adaptaciones Entre los Agricultores de Montaña de Sierra Nevada, España; Universidad Politécnica de Madrid: Madrid, Spain, 2022; Available online: https://oa.upm.es/71147/1/TFM_LAURA_LEVY.pdf (accessed on 17 January 2025).
- Kebede, M.M.; Kumar, M.; Mekonnen, M.M.; Clement, T.P. Enhancing groundwater recharge through Nature-Based Solutions: Benefits and barriers. Hydrology 2024, 11, 195. [Google Scholar] [CrossRef]
- Boelens, R.; Hoogesteger, J.; Swyngedouw, E.; Vos, J.; Wester, P. Hydrosocial territories: A political ecology perspective. Water Int. 2016, 41, 1–14. [Google Scholar] [CrossRef]
- Lopez-Gunn, E.; Zorrilla, P.; Prieto, F.; Llamas, M. Lost in translation? Water efficiency in Spanish agriculture. Agric. Water Manag. 2012, 108, 83–95. [Google Scholar] [CrossRef]


| Careo Channels | Type of Channel | Diverted Volume (hm3) | Infiltrated Water Volume (hm3) |
|---|---|---|---|
| El Espino Channel | Careo channel | 1.99 | 1.64 |
| Trevélez Channel | Careo and water transfer channel | 0.06 | 0.06 |
| Mecina Channel | 1.2 | 0.57 | |
| Real y Nueva Channel | Careo and irrigation channel | 1.44 | 1.04 |
| Total infiltrated water (hm3) | 3.66 | ||
| Type | Indicators |
|---|---|
| Costs | (a) Direct and Indirect Conservation and Operation Costs |
| Benefits | (b) Increase in Agricultural Value Generation |
| (c) Increase in Employment in Agricultural Activities | |
| (d) Improvement in Water Supply Reliability | |
| (e) Increase in Tree Crops (CO2 Capture) | |
| (f) Increase in Induced Tourism | |
| (g) VAB Multiplier in the Rest of the Economy (Non-Agricultural) | |
| (h) VAB Employment in the Rest of the Economy (Non-Agricultural) |
| Conservation Cost of the Irrigation Communities of Bérchules Channels (per year) | |||
|---|---|---|---|
| Direct Conservation Costs | |||
| Acequia de Trevelez | EUR | 14,018 | |
| Acequia de El Espino | EUR | 7466 | |
| Acequia Real y Nuevo | EUR | 5668 | |
| Subtotal of Direct Costs | EUR | 27,152 | |
| Indirect Conservation Costs | |||
| Period from March to November | EUR | 16,200 | |
| Subtotal of Indirect Costs | EUR | 16,200 | |
| Total Annual Conservation Cost | EUR | 43,352 | |
| Cost Elements | Base Indicator | N° of Units | Unit | EUR/Unit | Unit | Total (106 EUR) | |
|---|---|---|---|---|---|---|---|
| (1) | Conservation and operation costs | Cost per m3 of water | 4.80 | hm3 | 0.009 | EUR/m3 | 0.043 |
| (2) = (1) Total operation and management cost | 0.043 | ||||||
| DIRECT BENEFITS | |||||||
| Provisioning Services | Base Indicator | N° of Units | Unit | EUR/unit | Unit | Total (106 EUR) | |
| (3) | Increase in agricultural value | GVA | 8143.3 | EUR/ha | 1.180 | ha | 9.609 |
| (4) | Increase in agricultural employment | Employment | 236.8 | jobs | 9526 | EUR/jobs | 2.256 |
| (5) | Increase in water-supply reliability | Water saved | 4.8 | hm3 | 0.01 | EUR/m3 | 0.048 |
| (6) = (3) + (4) + (5) Total provisioning services | 1.913 | ||||||
| Regulating Services | Base Indicator | N° of Units | Unit | EUR/unit | Unit | Total (106 EUR) | |
| (7) | Increase in tree crops (CO2 capture) | ha | 1416.0 | t/year | 70 | EUR/t (CO2eq) | 0.10 |
| (8) = (7) Total regulating services | 0.10 | ||||||
| Cultural Services | Base Indicator | N° of Units | Unit | EUR/unit | Unit | Total (106 EUR) | |
| (9) | Increase in induced tourism | Tourism system | 5278.4 | people/year | 42.5 | EUR/persons | 0.22 |
| (10) = (9) Total cultural services | 0.22 | ||||||
| (11) = (10) + (8) + (6) Total direct benefits | 12.24 | ||||||
| INDIRECT BENEFITS | Base Indicator | N° of Units | Unit | EUR/unit | Unit | Total (106 EUR) | |
| (12) | GVA multiplier in the rest of the economy (non-agricultural) | Multiplier | 0.8 | -- | -- | -- | 7.687 |
| (13) | GVA employment in the rest of the economy (non-agricultural) | GVA/non-agricultural employment | 120 | jobs | 18,864 | EUR/job | 2.273 |
| (14) = (12) + (13) Total indirect benefits | 9.96 | ||||||
| (15) = (14) + (11) Total benefits | 22.20 | ||||||
| (16) = (15)/(2) BENEFIT-COST RATIO | 512.01 | ||||||
Disclaimer/Publisher’s Note: The statements, opinions and data contained in all publications are solely those of the individual author(s) and contributor(s) and not of MDPI and/or the editor(s). MDPI and/or the editor(s) disclaim responsibility for any injury to people or property resulting from any ideas, methods, instructions or products referred to in the content. |
© 2025 by the authors. Licensee MDPI, Basel, Switzerland. This article is an open access article distributed under the terms and conditions of the Creative Commons Attribution (CC BY) license (https://creativecommons.org/licenses/by/4.0/).
Share and Cite
Vargas, W.; Berbel, J.; del Aguila, S.; Díaz-Cano, E. Economic Valuation of Ancestral Artificial Aquifer Recharge Systems in High Mountain Environments of Sierra Nevada, Spain. Water 2025, 17, 1413. https://doi.org/10.3390/w17101413
Vargas W, Berbel J, del Aguila S, Díaz-Cano E. Economic Valuation of Ancestral Artificial Aquifer Recharge Systems in High Mountain Environments of Sierra Nevada, Spain. Water. 2025; 17(10):1413. https://doi.org/10.3390/w17101413
Chicago/Turabian StyleVargas, Wilber, Julio Berbel, Sandra del Aguila, and Esther Díaz-Cano. 2025. "Economic Valuation of Ancestral Artificial Aquifer Recharge Systems in High Mountain Environments of Sierra Nevada, Spain" Water 17, no. 10: 1413. https://doi.org/10.3390/w17101413
APA StyleVargas, W., Berbel, J., del Aguila, S., & Díaz-Cano, E. (2025). Economic Valuation of Ancestral Artificial Aquifer Recharge Systems in High Mountain Environments of Sierra Nevada, Spain. Water, 17(10), 1413. https://doi.org/10.3390/w17101413