Article

A 21-Year Study of Virtual Water Trade in Ukraine’s Agricultural Sector: Crop Production and Water Use

Department of Civil, Environmental and Construction Engineering, University of Hawai’i at Manoa, Honolulu, HI 96822, USA
*
Author to whom correspondence should be addressed.
Water 2025, 17(8), 1231; https://doi.org/10.3390/w17081231
Submission received: 2 March 2025 / Revised: 14 April 2025 / Accepted: 17 April 2025 / Published: 21 April 2025
(This article belongs to the Special Issue Balancing Competing Demands for Sustainable Water Development)

Abstract

:
This study quantitatively evaluates Ukraine’s agricultural virtual water footprint over two decades (2001–2021), focusing on ten representative crops with varying water demands. We assess the environmental and economic implications of virtual water flows and emphasize the need for more sustainable agricultural water management. Our findings reveal a shift in Ukraine toward water-intensive crops despite their high-water requirements, highlighting critical trends in production and trade. While crops like sunflowers and maize generate higher economic returns per unit of weight, less water-intensive crops such as wheat and barley exhibit greater profitability per unit of water consumed, albeit with lower trade volumes. These insights challenge prevailing agricultural practices and underscore the necessity for a more strategic approach that balances economic productivity with responsible water stewardship. Our study provides a data-oriented framework for optimizing water use in Ukrainian agriculture, offering essential guidance for policy interventions and sustainable development.

1. Introduction

Agriculture consumes 70% of global freshwater and is the largest global user of the vital resource [1]. Climate crisis, population growth, and insufficient renewable energy increasingly challenge agricultural systems via ever-increasing water scarcity. In contrast, agricultural good trades embed water—already consumed during the production period—included in trade prices. Efficient water management is vital for maximizing agricultural profits in countries that rely heavily on food production. Research on sustainable water use in agriculture has expanded significantly over the past 25 years [2].
In the 21st century, Ukraine is a key player in global agricultural production and trade in Europe, leveraging its fertile black soils and advantageous geographical conditions [3]. Ukraine is one of the top exporters of wheat, barley, maize, and sunflower seeds, accounting for global exports of wheat (6.4%) and maize (9%), and is ranked among the top five crop-exporting countries. Ukraine supplies 38% of maize and 19.8% of barley production in Europe, which quantitatively indicates the food security dependence of Europe on Ukraine. Considering Ukraine’s substantial exports of maize and barley to neighboring European countries, it is important to evaluate the water footprint associated with their cultivation and export to estimate the long-term stability of Ukraine’s crop production.
Virtual water refers to the volume of water consumed in food production (including crops), which is transferred geographically when agricultural products are exchanged across borderlines between various regions and countries. International water trade in physical form has been rare [4], but with the rise of global agriculture exchange, water is increasingly traded through crops [5]. Chapagain and Hoekstra introduced global crop-specific virtual water content estimates, which serve as a foundation for many national analyses [6]. Importantly, virtual water quantifies the impact of local farming practices on global water resource patterns. The importing country’s water resource scarcity significantly influences the importing dynamics of agricultural products between trading nations [7]. In contemporary times, several nations have intentionally relinquished traditional crops of agricultural production because of the excessive water consumption required, which is often deemed economically unsustainable [8]. The trade of water embedded in agricultural products may alleviate the water-related stress of importing countries of water-intensive agricultural products. Ukraine, a significant agricultural producer and exporter in the 21st century, provides a unique situation that requires analyzing virtual water flow and its impact on food sustainability. Qatar, facing severe water scarcity, increasingly depends on virtual water imports for the country’s national food security. Higazy et al. [9] and Fu et al. [10] emphasized the importance of optimizing water efficiency in agricultural production. A balanced approach to managing water, food, and energy resources is essential for sustainable trade [11]. Ukraine undergoes complex trade-offs involved in water management in a unique situation of using extensive farmland for water-intensive crops, while maintaining the significant production of non-water-intensive crops.
Ukraine uses 29.17% of Europe’s farmland to grow water-intensive crops, such as maize, potatoes, soybeans, sugar beet, and sunflower seeds [3]. Despite achieving 53.23% of Europe’s yield per hectare, Ukraine contributes only 15.5% to the continent’s total grain production because of its low yield efficiency. Ukraine’s yield of water-intensive crops is 35.67% higher than the global average, contributing 3.12% to global water-intensive crop production. Although Ukraine has only 13% of Europe’s farmland, it produces 19.44% of the continent’s non-water-intensive crops, such as barley, lentils, lettuce, chicory, oats, and wheat. This is in stark contrast to the production of water-intensive crops. Ukraine’s relatively low crop yields (72.68% of the European average), primarily comprising less water-intensive varieties, explain this difference. This situation reflects an imbalance in the production of water-intensive versus non-water-intensive crops per unit of agricultural land area.
Effective water management is crucial for Ukraine’s agricultural sector, just as it is for all countries, particularly considering that both physical and economic water productivity is essential for good water governance [12]. Ukraine relies heavily on water-intensive crops. These crops are essential to Ukraine’s export economy, making up 5.24% of the world’s and 30.15% of Europe’s exports of water-intensive crops. Ukraine accounts for 7.24% of the world’s and 14.54% of Europe’s exports of non-water-intensive crops. These overall statistics highlight the country’s significant contributions to global agriculture, while also implying its potential vulnerability to sustainability challenges because of the imbalance between water-intensive and non-water-intensive crop exports. Virtual water analysis can be used to assess the environmental and economic trade-offs in Ukrainian agriculture. Examining the country’s virtual water trade can identify pathways to enhance domestic water-use efficiency and reduce environmental risks. As water scarcity intensifies worldwide, understanding Ukraine’s role in global virtual water dynamics is an exemplary component for sustainable agricultural development and production worldwide. Growth in global crop trade has increased interdependence among nations, mitigating the impacts of water scarcity and contributing to global stability [13]. The following discussion outlines key contributions of virtual water to global water and food security.
International trade theories accentuate the importance of trading relationships. Suweis et al. [14] showed that the global virtual water trade network (GVWTN) follows a small-world structure dominated by the GDP and rainfall of a few primary nations. Tamea et al. [15] found that population, GDP, and distance drive virtual water trade, which are trends further supported by Deng and Di [16,17] and Tette et al. [18], who introduced arable land per capita as an alternative driver. The mismanagement of virtual water may result in unsustainable practices. According to Rosa et al., approximately 52% of the global use of irrigation water is unsustainable [19]. Approximately 15% of this consumption is attributable to international trade. From 2000 to 2015, the trade of unsustainable virtual water increased by 18%, highlighting the urgent need for policies that improve water security in global food production. Yang et al. emphasized the importance of evaluating value-per-drop metrics for virtual water [20]. Multi-variate analyses by Tamra et al. [21] showed that economic factors strongly shape virtual water flows. Dalin et al. [22] demonstrated that enhanced trade connectivity has led to significant global water savings, from 18% in 1986 to 42% by 2007, while unsustainable practices remain a concern [19]. D’Odorico et al. [22] and Tayia et al. [23] further emphasized the environmental risks and geopolitical implications of Ukraine’s virtual water trade. Tayia et al. studied virtual water decoupling, a strategy used by water-scarce countries like Egypt to link water consumption to economic growth [23]. From 1962 to 2013, a rise in virtual-water imports for maize and soybeans from 11% and 7% to 15% and 22%, respectively, while wheat’s share dropped from over 50% to below 25%. Egypt imported around twelve million metric tonnes of wheat annually from 2017 to 2021, with 60% coming from Russia and over 22% from Ukraine [24]. The 2020 conflict between Russia and Ukraine posed significant risks to Egypt’s food security, emphasizing the importance of examining Ukraine’s agricultural sector and its virtual water dynamics, which are discussed in this work. Western and northern Ukraine excel in new water resource projects, but they face challenges in inadequate evaluation [25]. Eastern and southern Ukraine suffer from common post-Soviet water governance challenges. Barrett et al. highlighted similar challenges in Kazakhstan, such as deteriorating irrigation systems, fragmented institutions, and informal governance structures, conditions also evident in some of Ukraine’s agricultural regions [26]. The lack of quantitative tools hampers the integration of water resources into financial strategies and deters investments, particularly from foreign entities desiring unambiguous appraisals; the absence of cost justification further discourages potential investments. Wang et al. (2020) and Hellegers and Van Halsema (2021) supported the use of empirical water accounting as a tool for policy design and agricultural planning, particularly in water-scarce or export-oriented economies [27,28].
Considering Ukraine’s distinct international role and its politically unstable situation, we focused on the following two key questions: “How can we analyze Ukraine’s water-intensive and non-water-intensive crop exports regarding physical water consumption and economic profitability?” and “What recommendations can we make for Ukraine to improve water consumption efficiency and promote sustainability in its agricultural trade?”. The water-intensive category comprises, as already exemplified, sunflowers, soybeans, potatoes, maize, and sugar beet, while the non-water-intensive group includes barley, lentils, lettuce and chicory, oats, and wheat. This study explores the demand patterns of ten key crops, which are analyzed according to their water requirements, and it provides practical solutions and strategic recommendations to boost agricultural productivity and promote water management in Ukraine. Our methods developed in this study can be universally applied to balance economic growth with environmental sustainability in crop-producing countries.

2. Materials and Methods

This study employs a data-oriented approach to analyze agricultural water use in Ukraine. We gathered reliable information from various sources, including FAO databases and detailed satellite climate data. Using MATLAB R2024b (The MathWorks, Inc., Natick, MA, USA), we processed this data to measure the water consumption of different crops, track changes over time, and explore the economic impacts of agricultural water use. This methodology enables us to examine virtual water consumption and trade patterns, linking farming practices to broader issues of environmental and economic sustainability. Additionally, we consider the differences across Ukraine’s agricultural regions, which is crucial given the country’s significant role in global agriculture.

2.1. Data Collection and Preparation

The initial phase of data preparation involved collecting raw data from multiple reliable resources and pre-processing them to have consistent units and formats [29]. The raw crop data primarily consisted of climatic variables, crop characteristics, production volumes, and economic values.

2.1.1. Weather Data

We processed satellite and climate data from Climate Engine on a web browser using Google Earth Engine [30]. Climate Engine produces maps and time-series of environmental monitoring datasets, including remote sensing and gridded meteorological observations. The Climate Engine App provides access to geospatial databases, obtained from multiple satellites, for more than 200 nations and territories worldwide. The pre-processed data are used in multiple literature sources, for example, datasets of monthly climate and water balance at a high resolution from 1985 to 2015 [31]. In this study, we used TerraClimate satellite data to gather monthly measurements of the ASCE Grass reference evapotranspiration (ET) and precipitation in Ukraine from 2001 to 2021. We worked with data that have a 4 km resolution, which gave us clear details over time and space. The ASCE Grass reference ET shows how much water a well-watered, uniform grass crop, about 0.12 m tall, loses through evapotranspiration. This measure provides a reliable standard for comparing regional climate conditions.

2.1.2. Crop Data

The crop data used in this work were obtained from Food and Agriculture Organization’s (FAO) Irrigation and Drainage paper no. 56 “Crop evapotranspiration—Guidelines for computing crop water requirements”, which calculates crop evapotranspiration coefficients [32]. The information gathered includes the planting dates and the crop coefficient (Kc) values of each crop at specific growth stages (such as initial, middle, and later development stages). The Kc differentiates field crops from the grass reference, which is characterized by its uniform appearance and complete ground cover [33]. The Kc coefficient is also impacted by crop attribute changes over the growing period; hence, it is possible to transfer Kc standards between sites and climates.

2.1.3. Crop Production and Trade Data

Crop production and trade data were obtained from FAOSTAT, a database developed by the FAO for global agricultural statistics [3]. FAOSTAT crop data are obtained by its member countries and international organizations. The collected data include agricultural production, total cropland area, crop yield per acre, and total imports and exports of every crop.

2.2. Mathematical Modeling

Our model aimed to search characteristic quantities to relate crop evapotranspiration, virtual water metrics, and virtual water prices, as follows.

2.2.1. Crop Evapotranspiration

First, we determined the crop evapotranspiration, E T c m m , which measures the water evaporated from the crop field after being absorbed by plants, and it was calculated as follows:
E T c m m = E T o m m ×   K c E P [ m m ]
where E T o refers to evapotranspiration (i.e., volume of evaporated water per unit of land surface area, measured in mm), K c is the crop coefficient, and EP is the effective precipitation, which is approximately 80% of the total precipitation. The equation assesses the total water consumed by the crops from both irrigation and precipitation resources.
The equation can be applied to any period. In the analysis, E T c is expressed in [mm/day], reflecting the different growth cycles of the crops. These values are subsequently summed to yield an annual total [mm]. The term “year”, in this context, refers to the duration between planting and harvesting. Hence, the equation is presented in mm rather than mm/day to allow for its applicability across different temporal scales involved in crop growth and water consumption.

2.2.2. Calculation of Virtual Water Demand

The virtual water demand (VWD) [ m ³ / t o n n e s ] is defined as providing a measure of the water volume demand per unit crop yield (in mass), represented as follows:
V W D   [ m ³ / t o n n e s ] = ( E T c   [ m m ] × 10 ) /   C Y   [ t o n n e s / h a ]
where C Y is the crop yield [tonnes/ha] defined as the total production mass [tonnes] per unit of land area utilized [hectare], and the factor of 10 is a constant to convert E T c from [mm] to [m3/ha].

2.2.3. Calculation of Total Virtual Water

The total amount of virtual water (VW) [ m ³ ] consumed by the crops was calculated using the following equation:
V W   [ m ³ ] = V W D [ m ³ / t o n n e s ] × T P   [ t o n n e s ]
where T P is the total production mass [tonnes]. Moreover, the total amount of virtual water consumed by crops can be understood within the context of annual consumption. However, it is important to note that certain crops, such as wheat, barley, and oats, are often harvested multiple times within a year. Each harvest may be influenced by varying weather conditions, including seasonal precipitation and evapotranspiration patterns.
For the sake of simplicity, the analysis assumed that all wheat was harvested once per year. In return, while the calculation of virtual water was technically based on individual harvests, the results are presented in cubic meters [ m ³ ] rather than cubic meters per year [ m ³ / y r ]. We applied this technique across various scenarios without being limited to a specific temporal frame.

2.2.4. Calculation of Virtual Water Imported and Exported

The total amount of virtual water imported (VWimp) [ m ³ ] and exported (VWexp) [ m ³ ] was calculated using the following equations:
V W i m p   [ m ³ ] = V W D   [ m ³ / t o n n e s ] × T Q i m p   [ t o n n e s ]
V W e x p   [ m ³ ] = V W D   [ m ³ / t o n n e s ] × T Q e x p   [ t o n n e s ]
where T Q i m p and T Q e x p are the total quantities [tonnes] of crops, imported and exported, respectively.

2.2.5. Calculation of Virtual Water Price

The price of virtual water (VWP) was calculated using the following equations:
V W P   [ U S D / m ³ ] = G P V p r o d   /   V W  
where G P V p r o d represents the 2014–2016 Gross Production Value (GPV) used in the production of crops [USD], and VWP is the virtual water price per unit volume [ U S D / m ³ ] . The equation provides insight into the monetary value of the water consumed in crop production.

2.2.6. Calculation of Virtual Water Price Imported and Exported

To quantify the economic value of water embedded in crop trade, we calculated the VWP for both imports and exports. This metric provides insight into how much water is effectively ‘priced’ within the agricultural supply chain. Specifically, the calculations are shown as follows:
V W P i m p   [ U S D / m ³ ] = T V i m p   [ U S D ]   /   V W i m p   [ m ³ ]
V W P e x p [ U S D / m ³ ] = T V e x p   [ U S D ]   /   V W e x p   [ m ³ ]
where T V i m p represents the constant 2014–2016 total value of imported crops [ U S D ] , and V W P i m p indicates the imported virtual water price [ U S D / m ³ ] . Similarly, T V e x p represents the constant 2014–2016 total value of exported crops [ U S D ] , and V W P e x p means the exported virtual water price [ U S D / m ³ ] , which provides the quantitative monetary value of the water imported and exported, respectively.

2.3. MATLAB Implementation

This section explains how to process input data and calculate important virtual water indicators for annual crops, as described in Section 2.2. The script combines data on crop production, weather, and trade. It calculates key metrics such as water productivity, total water usage, and the economic value of water used in trade.

2.3.1. Data Input and Initialization

After the script loads the crop, weather, production, and trade datasets, it iterates them over each country–crop combination to simplify multi-season crops as equivalent single season crops. The numerical computation heavily runs nested for-loops to iterate through countries, crops, and years over the selected datasets. Below is a detailed breakdown of these loops and the associated calculations, particularly for evapotranspiration (ETc), virtual water metrics, and data validation.
The outmost loop iterates over each country in the dataset:
for ci = 1:length(country_list)
    country = country_list{ci};
   ⋮
end
The outer loop processes data country by country. The script checks for a corresponding weather file for each country. If missing, the country is logged in a skipped list, and the loop continues without further processing. Within each country, the middle-nested loop, processes each crop, as follows:
for cj = 1:length(crop_list)
    crop = crop_list{cj};
   ⋮
end
The middle loop matches crop data (e.g., coefficients Kc, planting dates, and so forth) to the specific country. Validations are to ensure that a specific crop exists in the dataset and that essential parameters like planting dates are available. If any missing data are logged, then the crop is skipped. The script retrieves the planting month from crop data and converts it to a numeric month value, such as May 2002 is 17, as follows:
planting_month_num = month(datetim ...
      ['01-', planting_month{1}, '-2000'],...
       'InputFormat', 'dd-MMMM-yyyy'));
The planting date is computed, and the harvest date is derived by adding the crop’s total growth duration, as follows:
planting_date = datenum(planting_year, planting_month_num, 1);
harvest_date = planting_date + crop_info.("Total days");
For every crop–country pair, the second nested loop computes the metrics of each year, as follows:
for yi = 1:length(years)
    year = years(yi);
   ⋮
end
This inner loop iterates through the years from 2001 to 2021 to calculate annual ETc and VW metrics. Checks ensure that dates for planting and harvesting fall within the correct year. Invalid dates raise errors to prevent misalignment in temporal calculations.

2.3.2. Evapotranspiration (ETc) Calculation

The main calculation focuses on determining ETc for each crop, which is the water lost via evaporation and transpiration. ETc is computed based on the following crop growth stages: initial, development, mid-season, and late-season.
The script uses daily crop coefficients (Kc) for each of the following growth stages:
  • Initial Stage: Initial constant Kc values are used.
  • Development Stage: The Kc values increase proportionally to the crop growth.
  • Mid-Season Stage: The peak Kc values are used to represent full crop growth.
  • Late Season Stage: The Kc values decrease as the crop matures.
Daily Kc values are calculated for each growth stage as follows:
   daily_kc_init = repmat(crop_info.("Kc Init")(1),...
      crop_info.("Initial days")(1), 1);
   daily_kc_mid = repmat(crop_info.¶ ("Kc Mid")(1), ...
      crop_info.("Middle days")(1), 1);
   daily_kc_end = repmat(crop_info.("Kc End")(1), ...
      crop_info.("Late days")(1), 1);
   daily_kc_dev = repmat(mean([crop_info.("Kc Init")(1), ...
      crop_info.("Kc Mid")(1)]), ...
       crop_info.("Development days")(1), 1);
   daily_kc = [daily_kc_init; daily_kc_dev; ...
   daily_kc_mid; daily_kc_end];
These values are aligned with the crop’s growth duration to compute daily ETc using Kc × ETo. Daily Kc values are combined into monthly averages to ensure alignment with the calendar months, shown as follows:
   for month_idx = 1:total_months
       current_month = mod(planting_month_num + ...
         month_idx - 1 - 1, 12) + 1;
         month_mask = month(daily_date_array_datetime) ...
          == current_month;
       monthly_kc(month_idx) =
   mean(daily_kc_full(month_mask));
   end
The planting month is retrieved from crop data and converted to a numeric month value, as follows:
   planting_month_num = month(datetime(['01-', ...
   planting_month{1}, '-2000'], 'InputFormat', 'dd-MMMM-yyyy')
The planting date is computed, and the harvest date is derived by adding the crop’s total growth duration, as follows
   planting_date = datenum(planting_year,planting_month_num,1)
   harvest_date = planting_date + crop_info.("Total days")
Afterwards, the script computes monthly ETc by multiplying the average Kc values with reference evapotranspiration (ETo) from the weather dataset. If precipitation exceeds water demand, then excess precipitation values are set to zero. A correction is applied in the final month to account for partial growth. For the final month of the crop cycle, only the days leading to harvest are included, as follows:
   ratio_of_last_month=days_until_harvest / days_in_last_month;
   monthly_ETc(end)=monthly_ETc(end) * ratio_of_last_month;
and then summing monthly ETc provides the total amount of water used by the crop:
   total_ETc = sum(monthly_ETc);

2.3.3. Virtual Water Calculation

Using the total ETc, the script calculates virtual water demand (VW per tonne of crop) and total virtual water, which is shown as follows:
       vw_demand = (total_ETc * 10)/crop_yield;
where ETc is measured in millimeters, and the crop yield is in tonnes per hectare. The factor of 10 is introduced to convert tonnes per hectare to millimeters using the representative water density (i.e., 1 tonne/m3). The total virtual water is calculated as VW demand multiplied by the total crop production, as follows:
       vw = vw_demand * production;

2.3.4. Trade and Financial Data Processing

A second computation script processes the trade and financial data, including the quantities and values of crop imports and exports, utilizing a similar three-layer nested for-loops iterating through countries, crops, and years to calculate the virtual water content in imports and exports. The price of virtual water is computed by dividing the total trade value (standardized to 2014–2016 USD) by the virtual water content in m3 to provide the economic value of virtual water traded between countries.

2.3.5. Results Compilation

The script generates several output files, including virtual water productivity, total virtual water, and trade data for each combination of crop, country, and year. Countries or crops with missing or inconsistent data are stored in binary (.mat) files for traceability and reproducibility. These outputs provide a detailed overview of water use and trade, allowing for further analysis in subsequent stages.

2.3.6. Validation and Error Handling

The code incorporates validation checks to ensure proper execution. If country or crop data are missing, then the script logs the issue and skips to the next iteration. If any calculation yields invalid values (e.g., NaN or infinite VW), then the entry is skipped. Skipped countries and their crops are logged separately for traceability. This is shown, as follows:
       if isempty(vw_productivity) || ...
          isnan(vw_productivity)   || ...
          isinf(vw_productivity) ;
            continue;
       end
For incomplete datasets (e.g., missing years), the corresponding fields are left blank, following the assumption that all available data were reported. Temporal alignment checks ensure that planting and harvest dates are within valid ranges for the year, shown as follows:
       if ~(harvest_date >= datenum(year, 1, 1) &&
          harvest_date <= datenum(year, 12, 31))
         error ...
       end
Valid results are appended to an output table and exported to an MS Excel file, which is used for the virtual water trade analysis.

3. Results

Over the past two decades, especially since 2000, Ukraine’s agricultural production has changed a lot. There has been an increase in growing water-intensive crops like sugar beets, potatoes, soybeans, sunflowers, and maize. Several factors led to this shift. Ukraine has very fertile black soil (chernozem) and a good climate for these high-yield, water-reliant crops. Additionally, improvements in irrigation and water management have reduced drought risks. Domestic and foreign investments have further supported the growth of these profitable crops.
Table 1 compares Ukraine’s water-intensive and non-water-intensive crops across different areas. During the 21-year study period, farmers grew a total of 1.36 billion tonnes of water-intensive crops. On average, these five crops occupied about 10.96 million hectares of land, producing around 5.9 tonnes per hectare. On average, each tonne of crop required 490.15 cubic meters of water, leading to a total virtual water consumption of 665 billion cubic meters over the study period. Of this total, irrigation used around 347 billion cubic meters, while natural rain provided about 318 billion cubic meters.
In contrast, the production of five non-water-intensive crops—wheat, barley, lentils, lettuce, and oats—stayed stable. Over the same 21 years, farmers produced a total of 658 million tonnes of these crops. They cultivated an average of 10.25 million hectares, with an average yield of 3.05 tonnes per hectare. The average virtual water productivity for these crops was 48 cubic meters of water per tonne, which gave a total water consumption of 31.52 billion cubic meters over the study period. Irrigation contributed about 64.6 million cubic meters to this total, while precipitation accounted for the remaining 31.46 billion cubic meters. These figures are based on the average virtual water productivity of 48 cubic meters per tonne, the total production of 658 million tonnes over the study period, and the average yield of 3.05 tonnes per hectare.
In contrast, the other five non-water-intensive crops—wheat, barley, lentils, lettuce, and oats—maintained stable production levels. A total of 658 million tonnes of non-water-intensive crops were produced over 21 years. The average land area cultivated with non-water-intensive crops was around 10.25 million hectares, with an average yield of 3.05 tonnes of crops per hectare of land. The average virtual water productivity for these crops was 48 m3-water/crop-tonne, resulting in a total water consumption of 31.52 B m3 over the 21-year study period. Closer examination revealed that irrigation contributed approximately 64.6 million m3 to the total, with precipitation accounting for the remaining 31.46 B m3. These values were derived based on the average virtual water productivity of 48 m3 per crop tonne, the total production volume of 658 million tonnes over the study period, and the average yield of 3.05 tonnes per hectare.
The data were evaluated to determine economic trends. Although non-water-intensive crops have shown steady production, they may not significantly drive Ukraine’s agricultural economic growth. Non-water-intensive crops often yield lower returns compared to high-demand, water-intensive crops like soybeans, sunflowers, and maize, which cater to lucrative export markets. Non-water-intensive crops may lack the international market appeal and profitability as much as water-intensive crops offer. As a result, Ukraine’s agricultural sector has shifted its focus toward more profitable, high-demand crops that can better capitalize on both the country’s fertile soil and export potential.
Furthermore, our trade dynamics analysis, including imports and exports, provides apparent insights into Ukraine’s position in the global food market. Exporting water-intensive crops also entails exporting the virtual water embedded within them, i.e., the enormous volume of water consumed from the seeding to the harvest. Exports of the two types of crops could have extensive policy implications, particularly in the context of water scarcity.

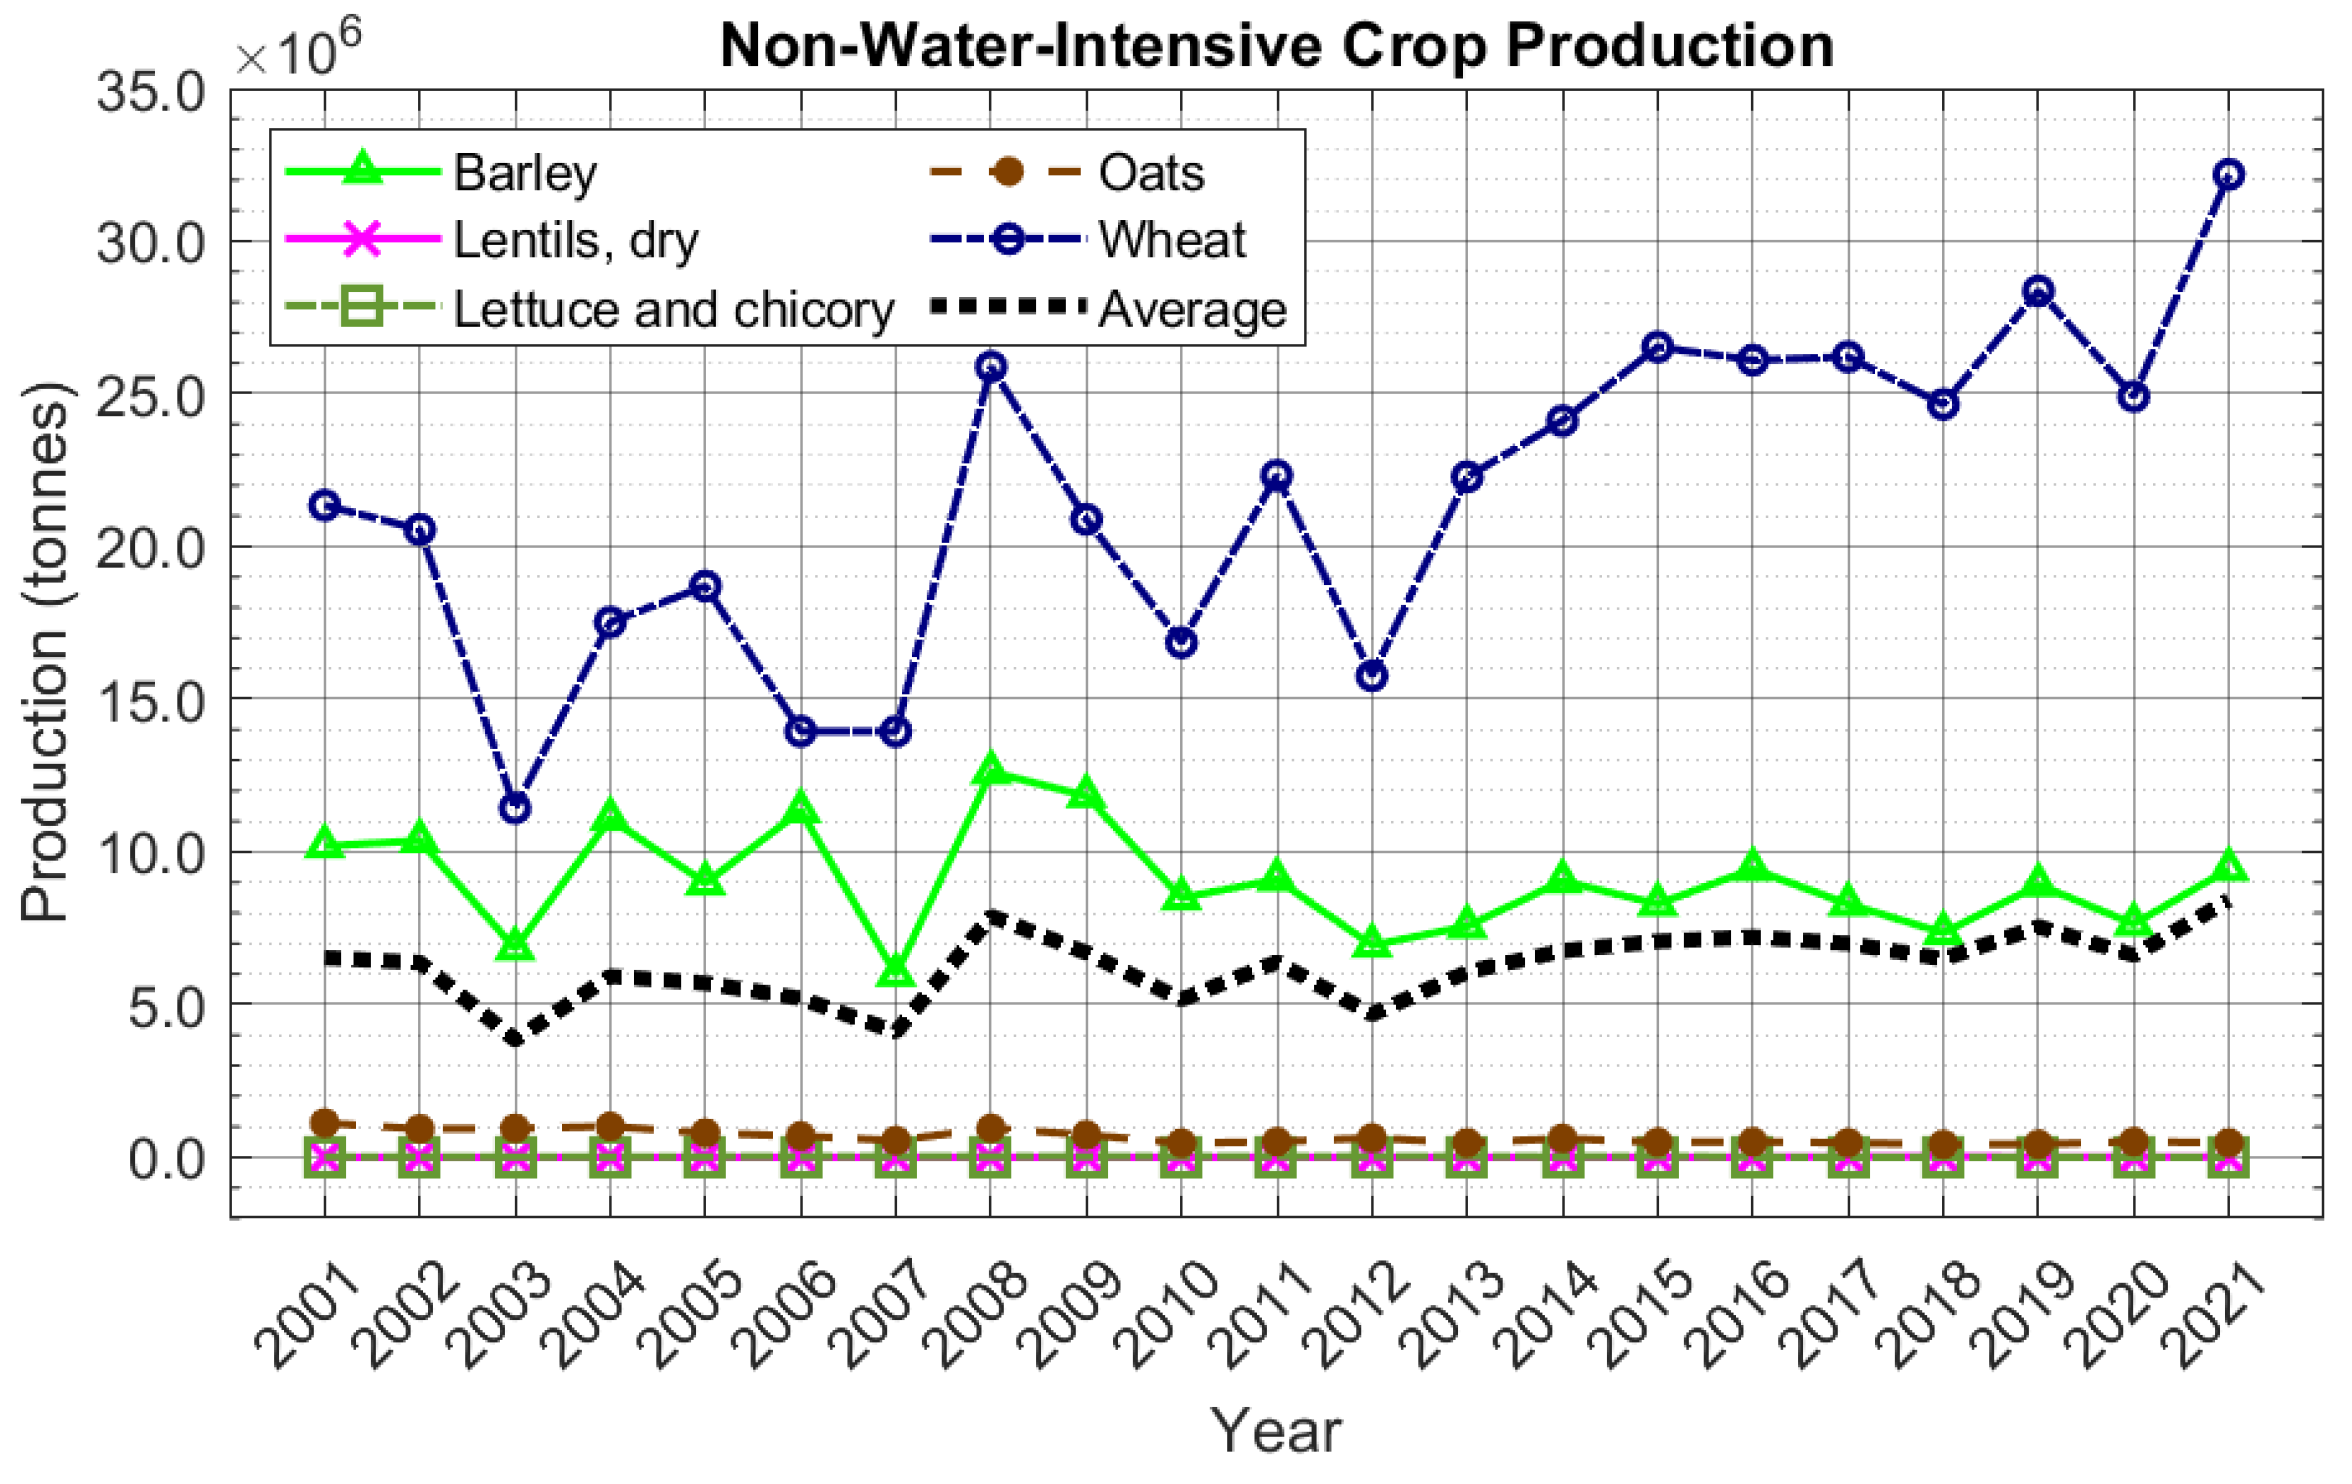
3.1. Crop Production Trend (2001–2021)

Annual production data for both crop categories highlight the notable increase in water-intensive crops versus the stable production of non-water-intensive crops, as shown in figures below.
Figure 1 illustrates the growth patterns of five water-intensive crops, described above. The production of maize (corn) and sunflower seed showed steady increases with multi-year variations. Since 2010, maize production has seen a remarkable increase, following a consistent upward trend. The production figures for this crop have varied significantly, with a notable peak occurring in 2021. There was a sharp rise in production between 2010 and 2011, followed by a period of continuous growth, regardless of some fluctuations observed during this time. In contrast to maize, potato production has maintained a relatively stable profile throughout the years. We noted a slight upward trend in potato production during the early years, from 2001 to 2006, which was then followed by a period of stability. Throughout this timeframe, potatoes have shown minimal fluctuations in production compared to other crops. Soybeans have the lowest production levels among the five crops analyzed. Their trend is relatively constant, featuring only minor fluctuations in their production figures. While there has been a gradual increase in recent years, they still rank as the lowest-producing crop in this comparison. Sugar beet production has been more unpredictable compared to potato production. We observed significant peaks in 2007 and 2008. More recently, between 2015 and 2021, a gradual downward trend emerged. The production of sunflower seeds steadily increased from 2001 to 2021. While the growth rate may seem gradual, it is consistently positive. There have been minor fluctuations from year to year, but the overall trend shows a clear upward movement. The overall average production, which encompasses all five crops, has shown a gradual increase over time, indicating a broader growth in the production of water-intensive crops, reflecting changes in agricultural practices and crop management. In summary, we observed the following production trends: Maize (corn) has experienced the most significant increase in production, standing out among crops. Potatoes remain stable with only minor fluctuations, while sugar beet shows an erratic pattern with a decline post-2008. Sunflower seed production is on a steady rise, and although soybeans have low production levels, they show slight growth. Overall, the trend in average production of these water-intensive crops is upward, indicating an increase in agricultural output.
Figure 2 illustrates the growth patterns of five non-water-intensive crops, listed in the previous section. Barley exhibits a production trajectory that remains largely stable, with only minor fluctuations over time. Although there is a discernible slow growth trend across the years, the data do not reveal any significant spikes that would suggest drastic shifts in production levels. A significant decline in barley production occurred around 2007, followed by a steady recovery, showcasing the resilience and adaptability of barley production in challenging conditions. Among the crops examined, dry lentils consistently show the lowest production levels, indicating their minor role in agriculture. Their output has remained stable over time, with little to no significant growth or decline. The production of lettuce and chicory, much like that of lentils, remains consistently low and stable. There are no noticeable upward or downward trends, indicating a steady demand without significant growth. Oats have low production levels, similar to lentils and lettuce. Their production trends are flat over the years, showing little change. This stability categorizes oats as a minor agricultural crop. Wheat is the most abundantly cultivated crop and requires less water compared to other crops, highlighting its vital role in global agricultural production. Over the years, wheat production has experienced significant fluctuations, but there has been a clear overall increase. Notably, production peaked in 2008 and again in 2021, although there were periods of decline surrounding these peaks. Since 2010, the production trend has begun to stabilize; however, notable variations persist. The average production figure shows the mean output of the five crops analyzed, revealing a steady but slow increase in non-water-intensive crop production over time. Variations in this average are largely driven by trends in wheat production, highlighting its significant impact on overall crop dynamics. Wheat is the most dominant crop, showing significant fluctuations but an overall increasing trend in production. Barley, on the other hand, demonstrates moderate stability with only slight variations. Lentils, lettuce, and oats maintain very low and stable production levels. Although the average production trend is upward, it is primarily influenced by wheat.
Figure 3 illustrates a clear upward trend in the production and yield of sunflower seed. From 2001 to 2021, sunflower seed production steadily increased because of growing market demand and expanded cultivation. Initially stable, production rose significantly over time as agricultural techniques improved and farming areas expanded. By 2021, production exceeded 15 million tonnes, reflecting enhanced yield efficiency and interest in sunflower cultivation. Although yield shows consistent growth, the increase is less steep compared to production. This suggests that a portion of the production growth may be because of the expansion of cultivated land rather than yield efficiency alone. Rising yields, which show an upward trend with some fluctuations, account for the increase in production. This growth is likely due to improved efficiency, as indicated by a higher yield per hectare, as well as the expansion of sunflower seed farming areas. The increased yields imply advancements in seed varieties, irrigation techniques, and overall farming practices.
Figure 4 analyzes the trends in wheat production and yield from 2001 to 2021 based on the obtained data to report an overall growth in wheat production, with significant fluctuations and consistent yield improvements post-2009. Wheat production has experienced several peaks and declines, particularly in the years 2003, 2006, 2010, and 2012, typically following a cycle of 2–3 years. Despite these fluctuations, overall production increased from approximately 20 million tonnes in 2001 to 33 million tonnes by 2021. In the earlier years, from 2001, yields gradually decreased, fluctuating between 2.0 and 3.0 tonnes per hectare. However, starting in 2010, yields improved steadily, reaching nearly 4.5 tonnes per hectare by 2021. The fluctuations in wheat production, which correspond to changes in yields, highlight the potential impact of land use changes.

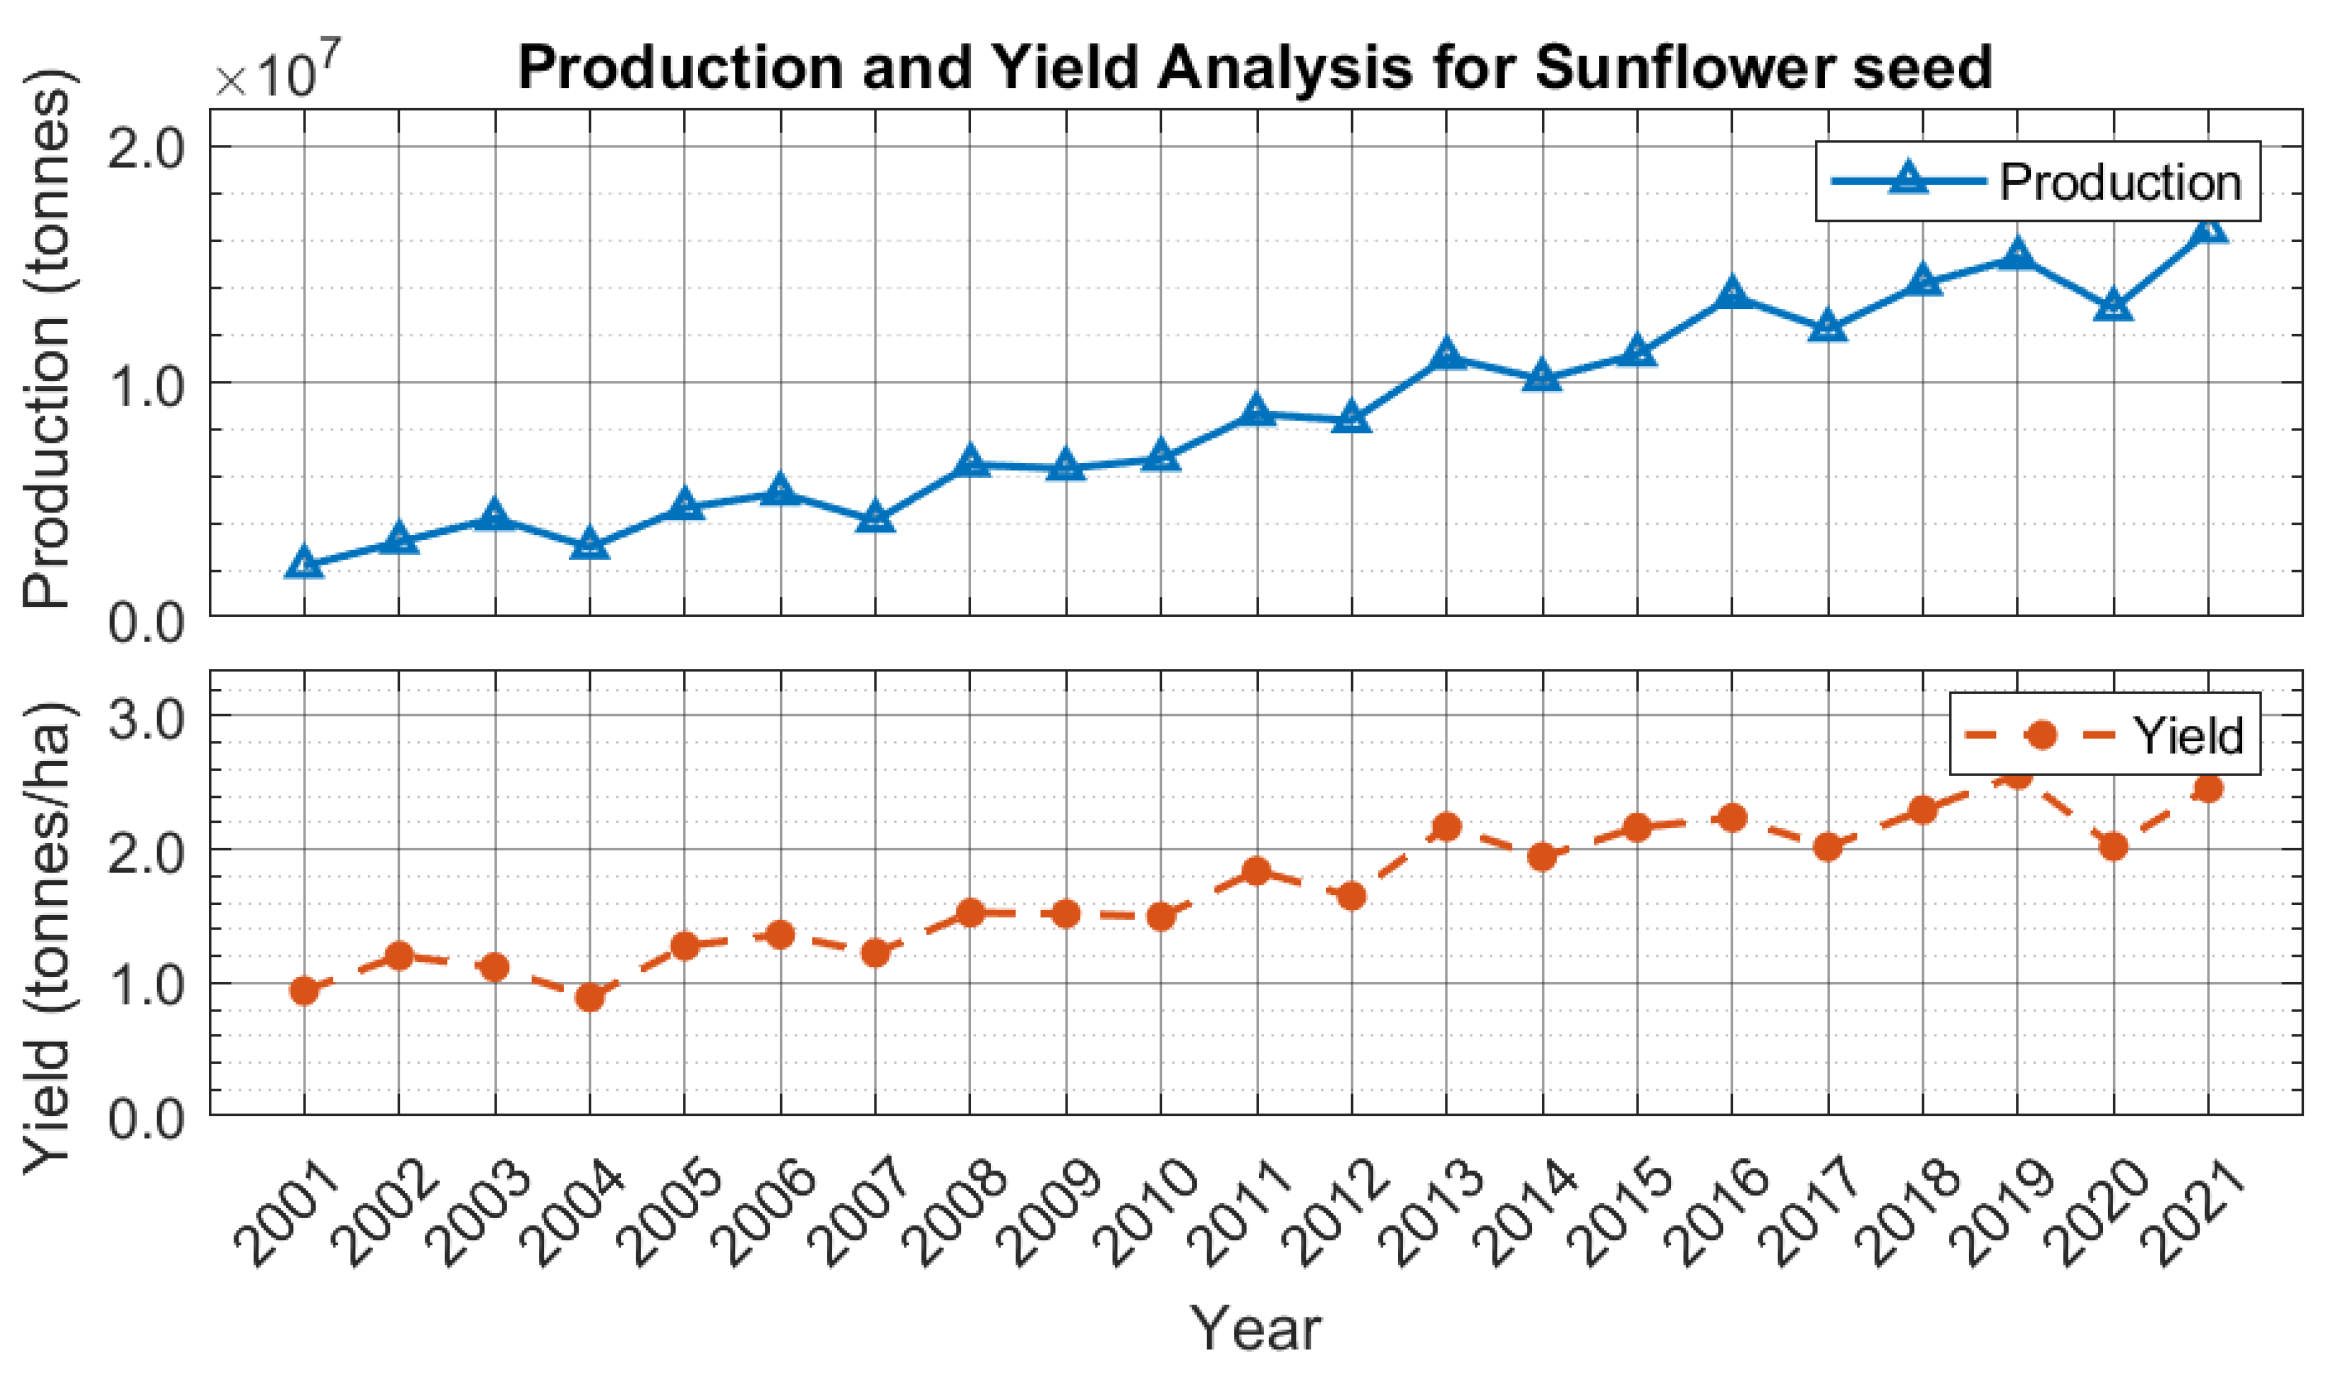
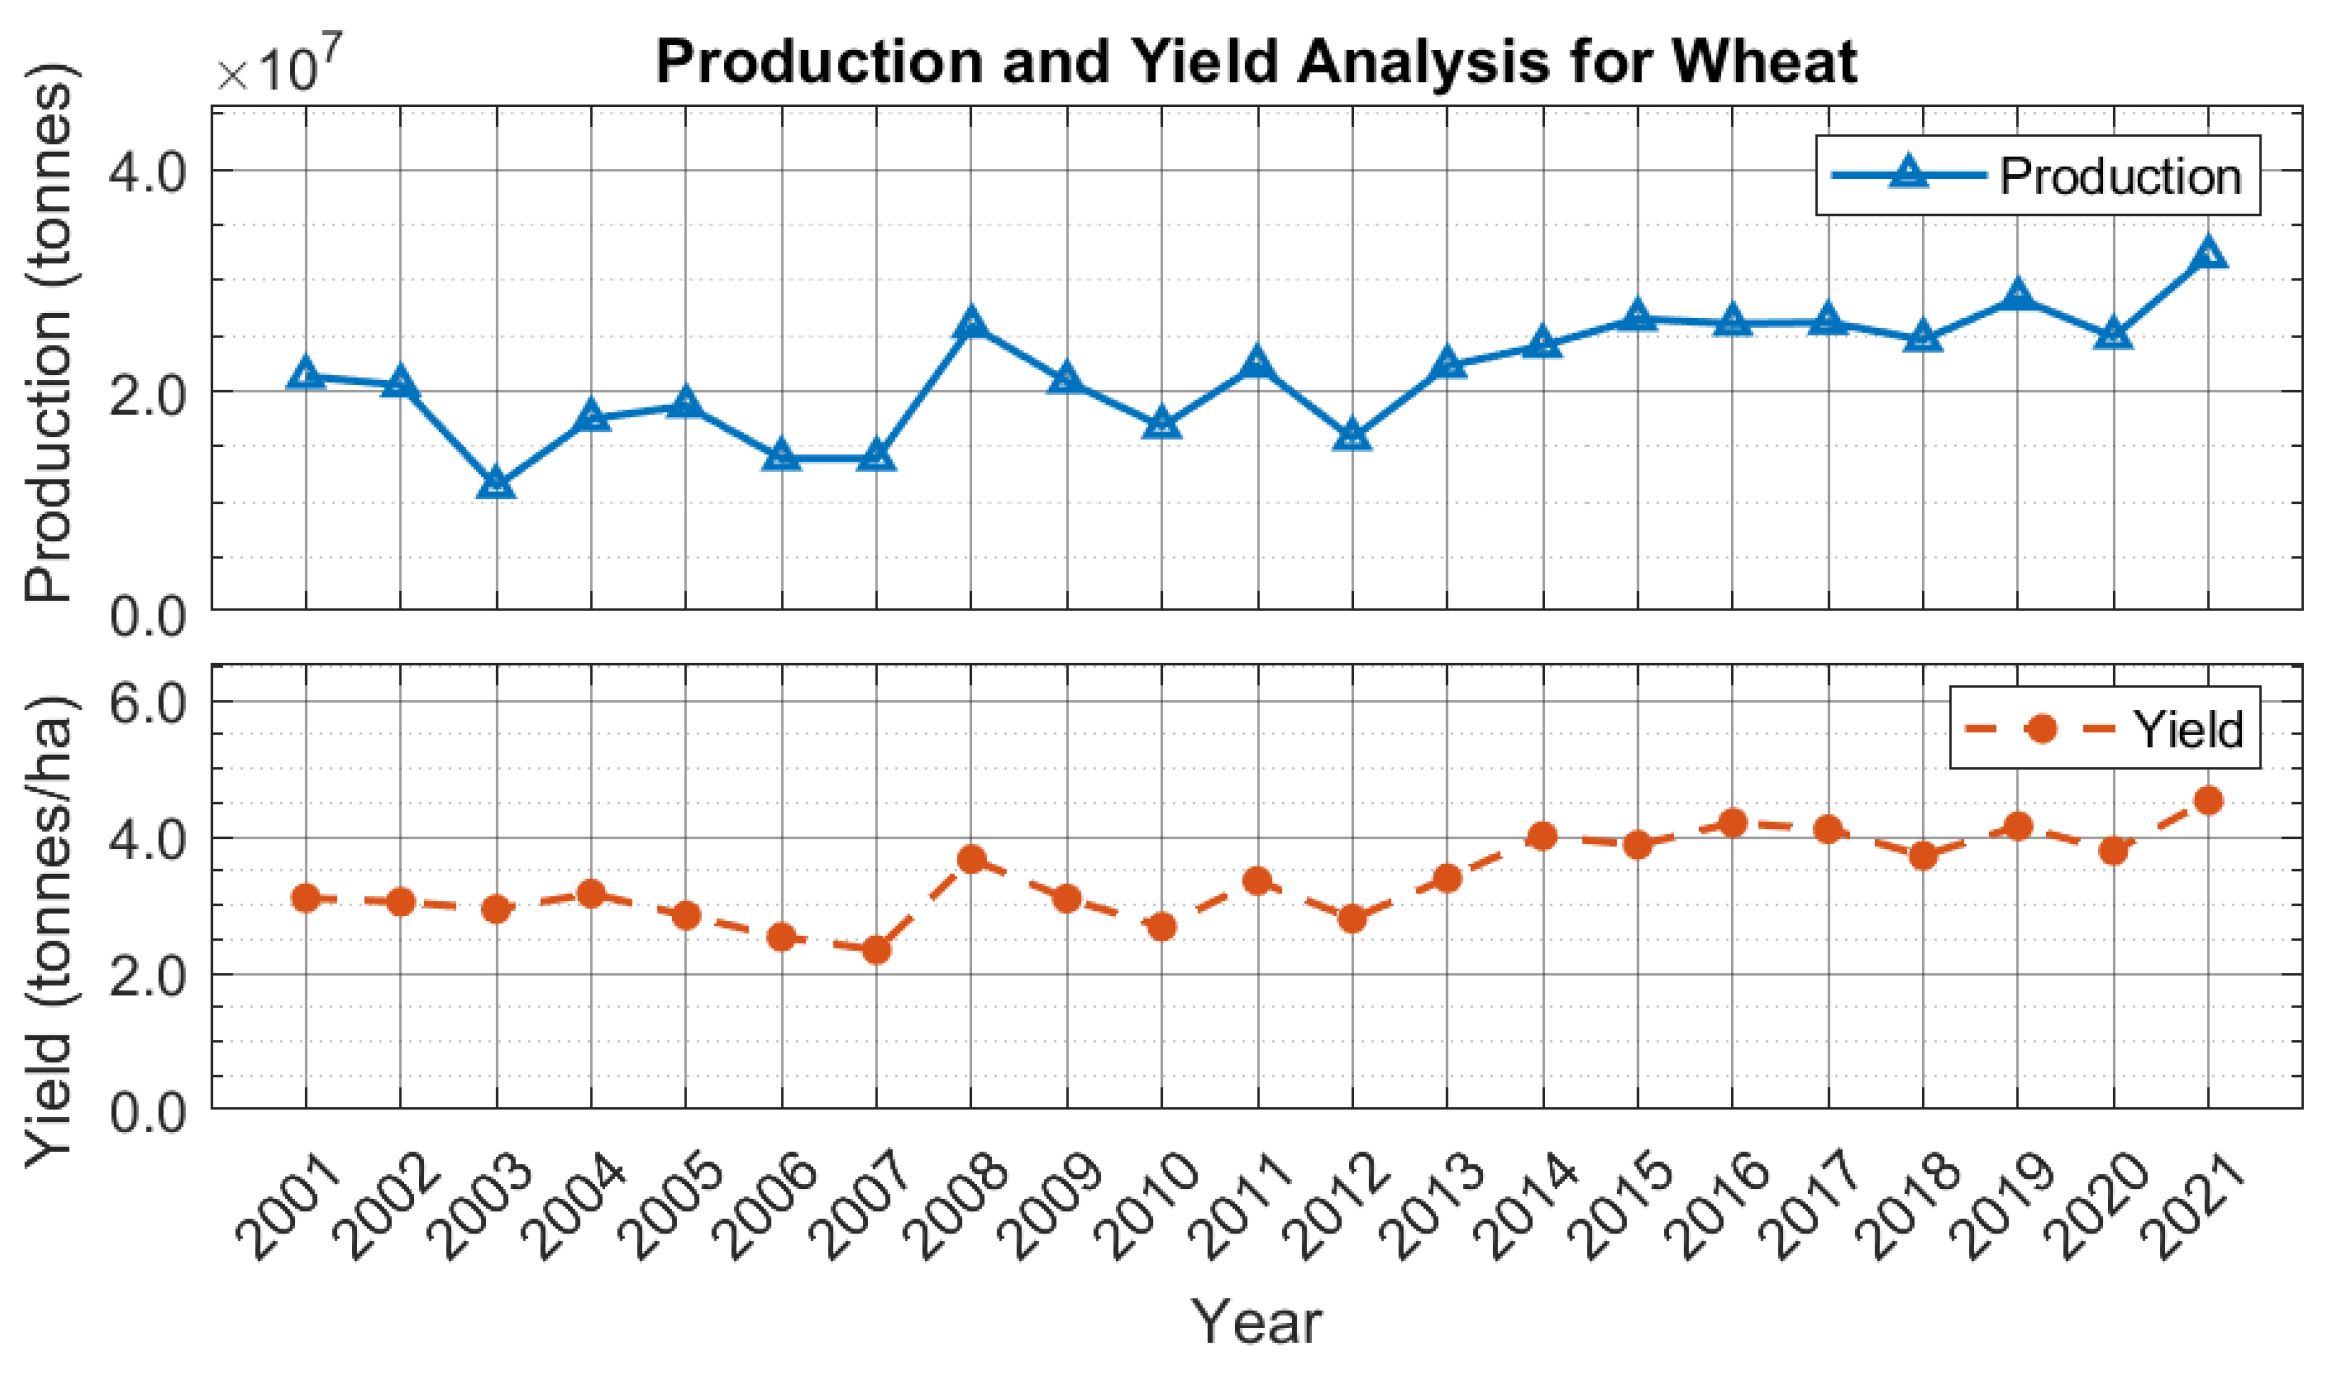
3.2. Virtual Water Productivity and Total Virtual Water Trends (2001–2021)

Virtual water productivity is examined as a measure of the water volume needed per crop weight; thus it provides trends of agricultural water-use efficiency.
Figure 5 illustrates the virtual water productivity, in linear and logarithmic scales, of five water-intensive crops: maize (corn), potatoes, soybeans, and sunflower seeds. Virtual water productivity measures the efficiency of water usage in crop production, expressed as cubic meters of water per tonne of crop yield. A lower virtual water productivity value indicates more efficient water use, while a higher value suggests greater water demand per production unit. The graphs analyze water-intensive crops on the following two scales: a linear scale, which shows direct variations in water productivity, and a logarithmic scale, which highlights changes in virtual water productivity across different scales. Soybeans and sunflower seeds consistently exhibit the highest virtual water productivity values, indicating significant water consumption per production unit. In contrast, potatoes, maize, and sugar beet maintain much lower virtual water productivity values, suggesting that they use water more efficiently than soybeans and sunflower seeds. The general trend indicates a gradual decline in virtual water productivity across most crops, implying improvements in irrigation techniques, crop breeding, and water management strategies. However, soybeans and sunflower seeds still show high water consumption, emphasizing the need for further enhancements in water use efficiency. Overall, the gradual decline in virtual water productivity suggests advancements in agricultural technology, but targeted improvements in high-water-use crops are still necessary. Soybeans and sunflower seeds continue to seek enhancements in water use efficiency.
Figure 6 analyzes the trends in virtual water productivity for selected non-water-intensive crops from 2001 to 2021. virtual water productivity, measured in cubic meters of water per tonne of crop yield. A lower virtual water productivity value reflects better water efficiency, while a higher value suggests increased water consumption relative to crop output. Among the crops analyzed, dry lentils display the most significant fluctuations in water-use efficiency, with notable spikes in specific years, particularly in 2009, 2014, and 2020. In contrast, lettuce and chicory consistently show the lowest virtual water productivity values, indicating superior water-use efficiency. Meanwhile, barley, oats, and wheat show moderate and relatively stable virtual water productivity trends throughout the observed period. The average virtual water productivity, represented by a black dashed line in the graphs, remains relatively stable across the years. Overall, non-water-intensive crops exhibit superior water-use efficiency compared to their water-intensive counterparts. However, dry lentils require particular attention because of their unusual variability. Barley, oats, and wheat exhibit synchronized moderate fluctuations, particularly between 2008 and 2015. These variations are likely influenced by climate changes and improvements in farming practices. In contrast, lentils have experienced significant production spikes in 2009, 2014, and 2020, which heavily impact the overall trend in the volatility water productivity index. This suggests that lentil yields are unstable to market forces. Conversely, lettuce and chicory show stable production but follow a consistent downward trend, likely related to their lowest production levels.
Figure 7 outlines the total virtual water trend for water-intensive crops, i.e., the total water consumption linked to crop production, measured in cubic meters (m3). Sunflower seeds have emerged as a leading crop in terms of total virtual water usage, surpassing all other agricultural products. From 2001 to 2016, there was a consistent increase in virtual water consumption, indicating a significant growth in sunflower seed production. However, between 2016 and 2021, this growth trend stabilized, suggesting that, while the area cultivated with sunflowers likely expanded, the overall water demand reached a more sustainable level compared to other crops. This pattern highlights the complex relationship between crop cultivation and water resources, emphasizing the importance of sunflowers in the agricultural landscape. Over the years, the total virtual water associated with potato production has remained relatively constant, reflecting a steady approach to both cultivation practices and water management. This stability implies that farmers are employing reliable and consistent water consumption patterns in potato farming, ensuring the sustainable use of water resources throughout various growing seasons. Between 2005 and 2018, soybean production showed a significant surge, leading to a notable increase in total virtual water usage related to this crop. This period of rapid expansion underscores the growing demand and improved cultivation practices within the soybean sector. As its production is the second largest among other crops, soybeans’ recent decline in virtual water consumption noticeably contributed to the total virtual water consumption. The peak in virtual water consumption occurred around 2018 to 2019, coinciding with heightened soybean production efforts. However, this upward trend did not continue, as a decline was observed from 2020 to 2021, which requires more in-depth socio-economic and political understanding. Maize, commonly referred to as corn, exhibits significant variability in its overall virtual water consumption. This variability is marked by sharp peaks during certain periods and substantial dips in others. Following 2010, there has been a clear upward trend in total water consumption associated with maize production. Nonetheless, the persistent variability indicates inconsistent production patterns. The trend in sugar beet cultivation shows a unique noticeable decline over the years. Specifically, there has been a gradual reduction in total virtual water consumption associated with this crop, which has been particularly clear since 2019.
Figure 8 shows total virtual water consumed per year associated with crop production. Total virtual water (VW) refers to the overall water consumption associated with crop production, measured in cubic meters (m3). Wheat and barley are the crops with the highest total virtual water consumption in agriculture. Among non-water-intensive crops, wheat stands out as the largest contributor to this consumption. The patterns of water usage for both wheat and barley show significant synchronization, with distinct peaks occurring in specific years, particularly in 2007, 2016, 2018, and 2021. Before 2010, lentils were associated with relatively low total virtual water usage, reflecting sustainable cultivation practices. However, around 2011, there was a noticeable upward trend in the virtual water used for lentil production. This increase reached a peak between 2017 and 2020, likely driven by factors such as an expansion in lentil farming areas or a decline in water efficiency in cultivation systems. Since 2018, lentils have been the only crop to show a continuous decline in virtual water volume. Lettuce and chicory exhibit the lowest overall virtual water consumption, showcasing remarkable water-use efficiency compared to other non-water-intensive crops. Between 2013 and 2018, there was a slight increase in total virtual water usage for these crops, followed by a downward trend, indicating ongoing improvements in their water conservation practices. Barley, oats, and wheat show similar patterns in virtual water usage throughout the year. In contrast, dry lentils, lettuce, and chicory exhibit complementary trends; when the virtual water consumption of dry lentils decreases, the usage of lettuce and chicory increases. Oats show a relatively stable growth and production pattern, requiring moderate water consumption similar to barley. This stability is characterized by only minor fluctuations over the years, notably in 2008, 2015, and 2021. In summary, wheat and barley have the highest total water consumption among crops because of their extensive cultivated areas and high yield demands. In contrast, lentils have experienced increased water usage since 2010, likely because of expanded production or changes in efficiency. Lettuce and chicory are the most water-efficient crops, maintaining low consumption levels. Oats show stable water usage patterns, similar to those of wheat and barley. Overall, while lentils’ virtual water consumption has risen, effective water management since 2018 has helped stabilize consumption across various crops.

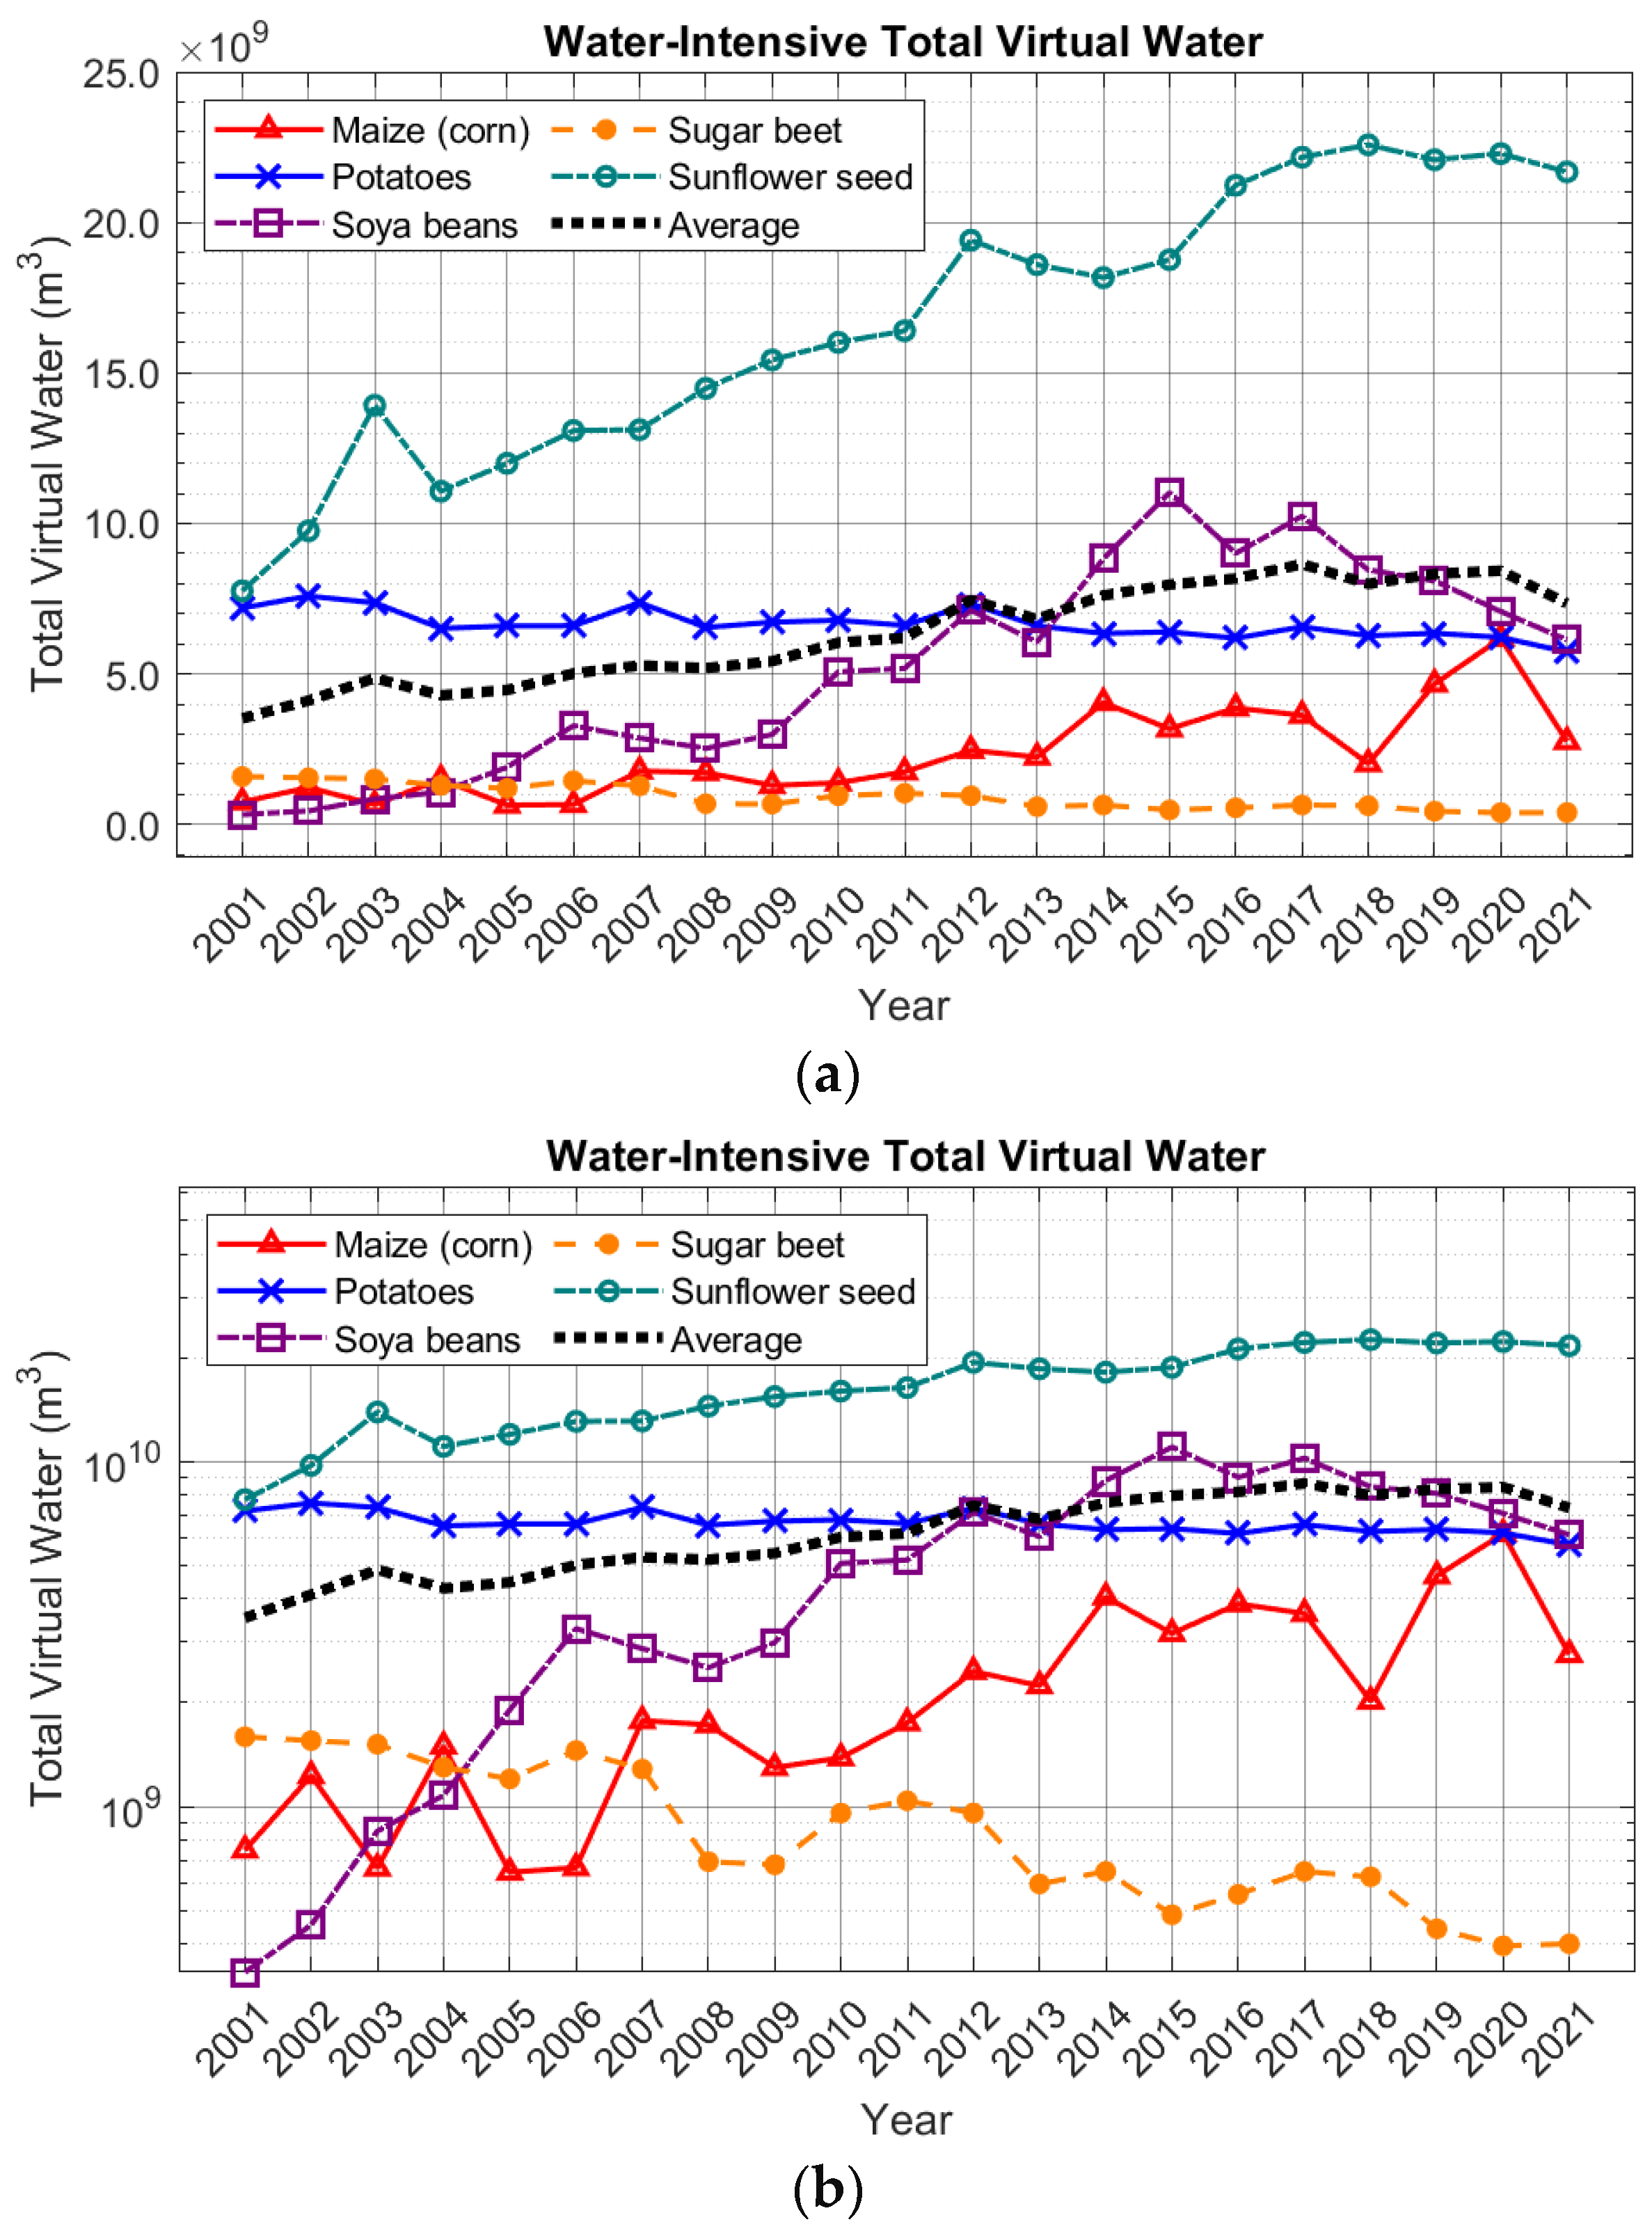
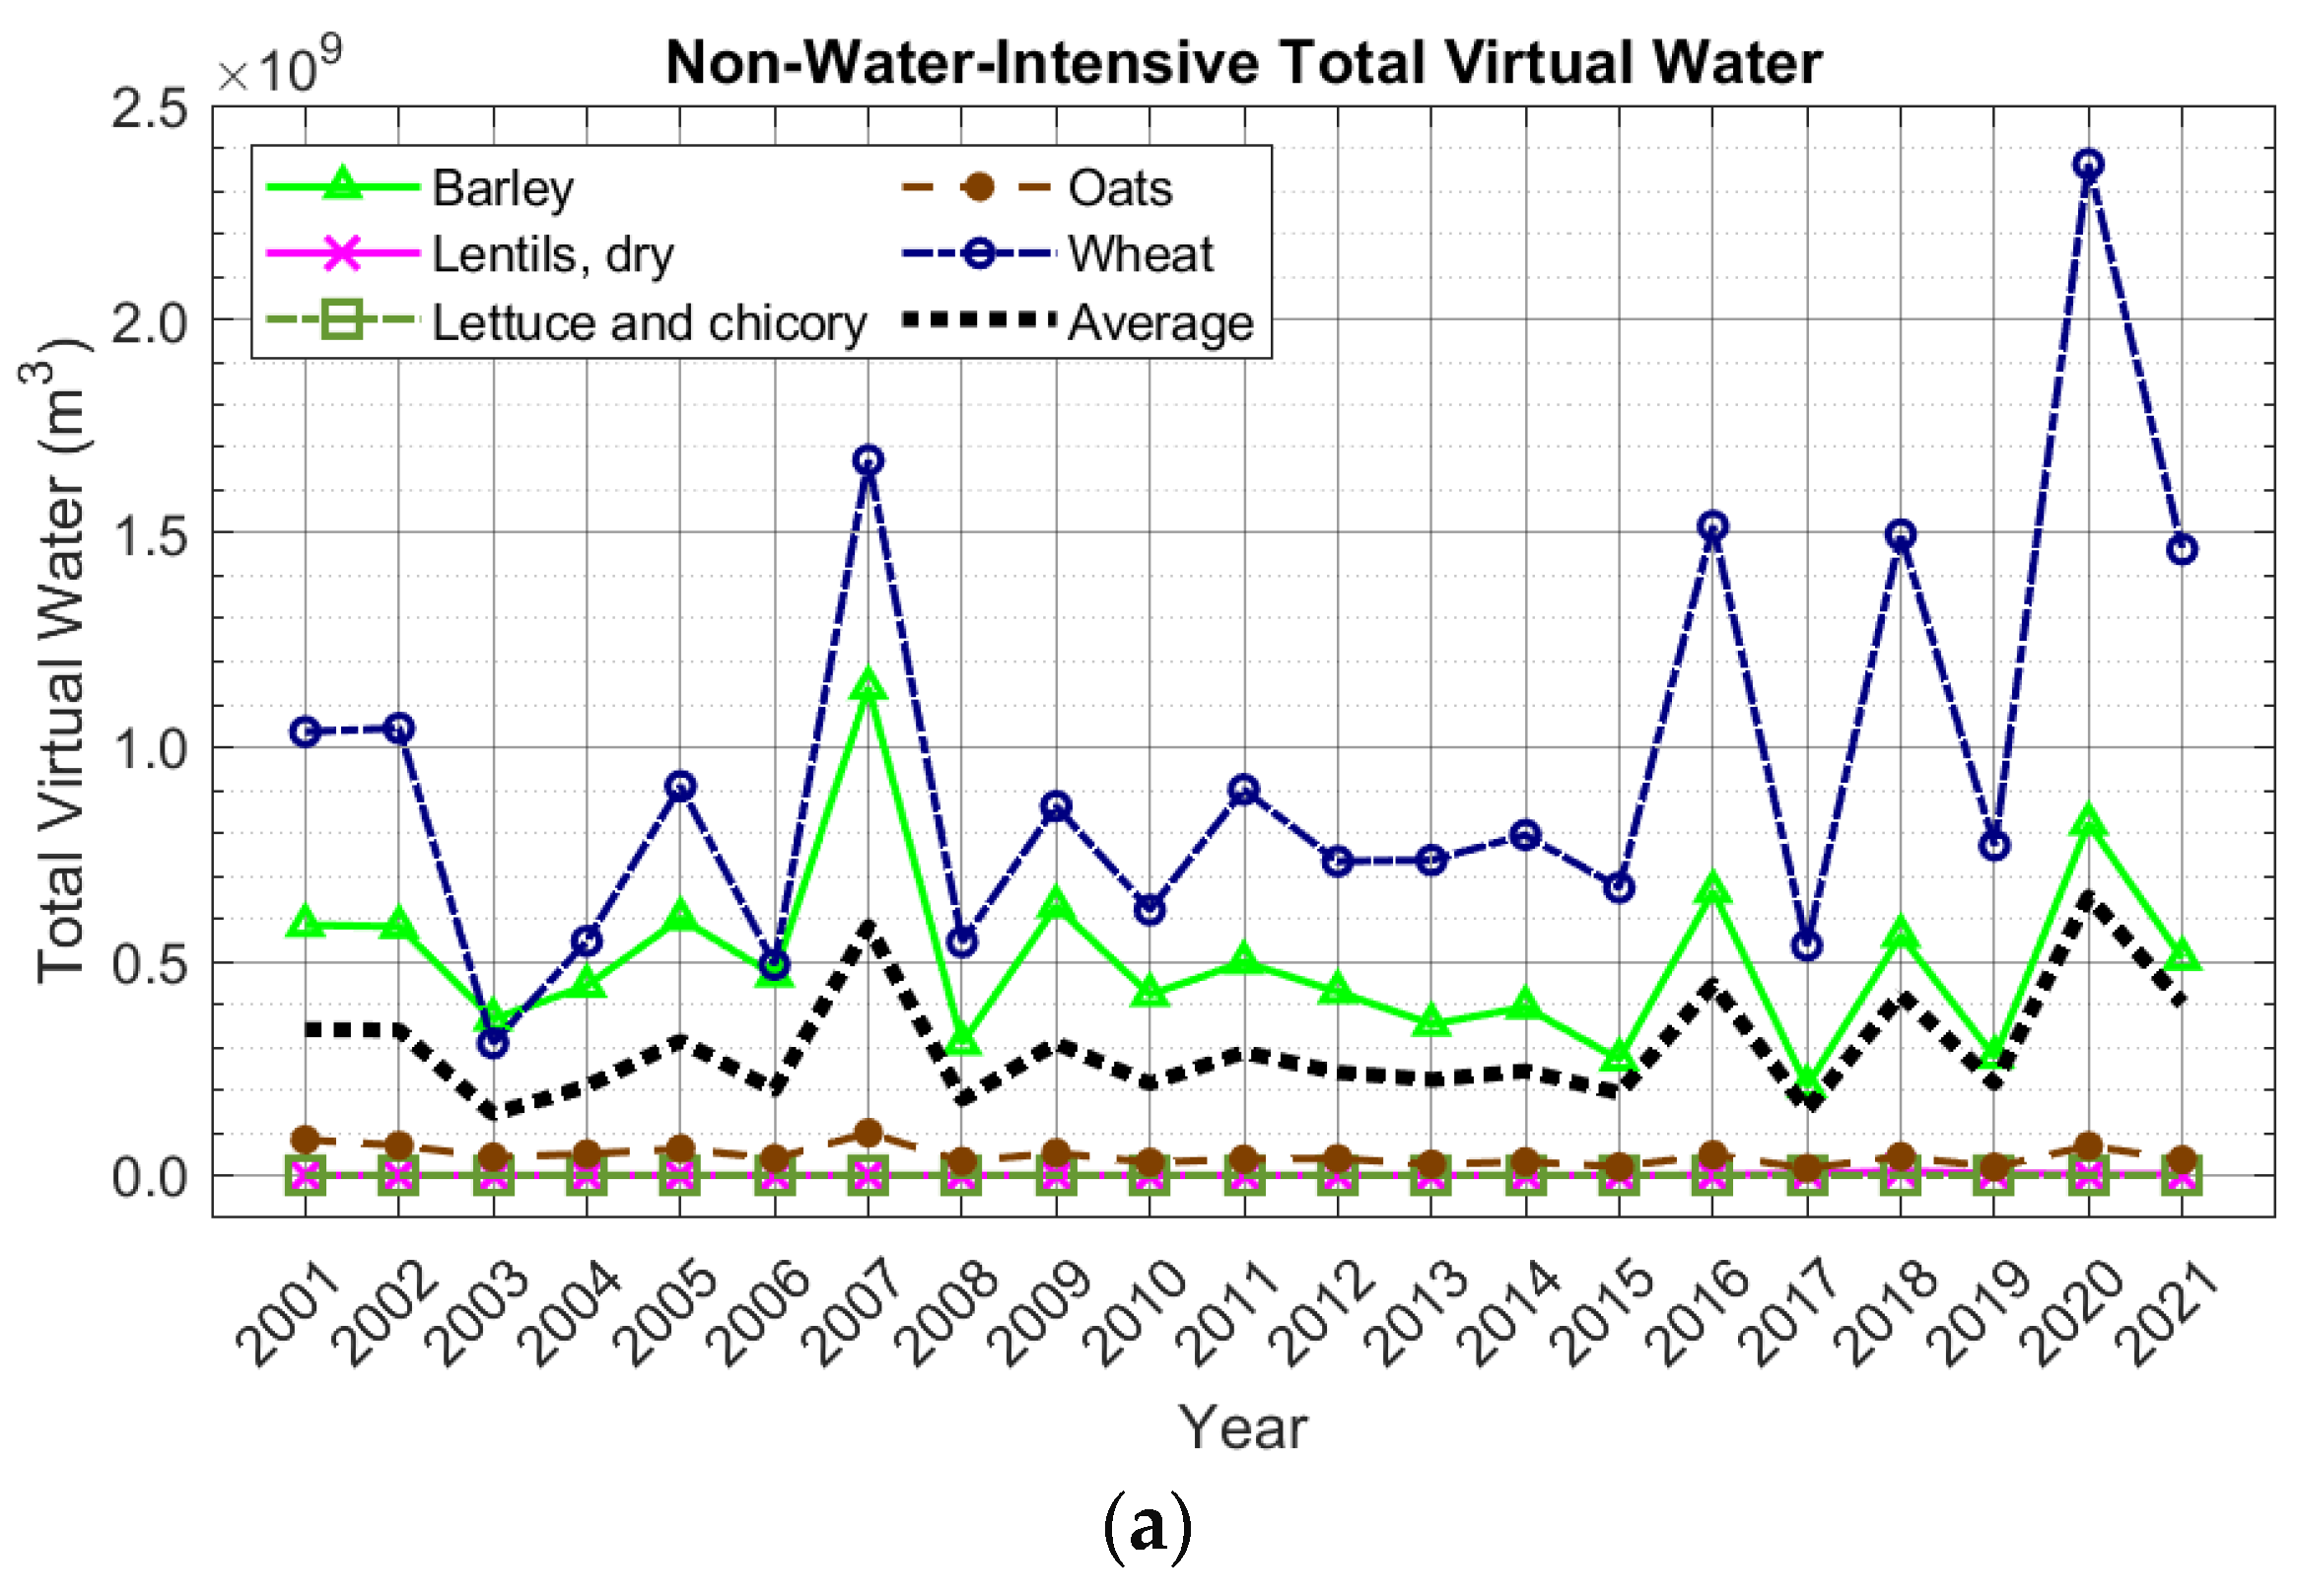
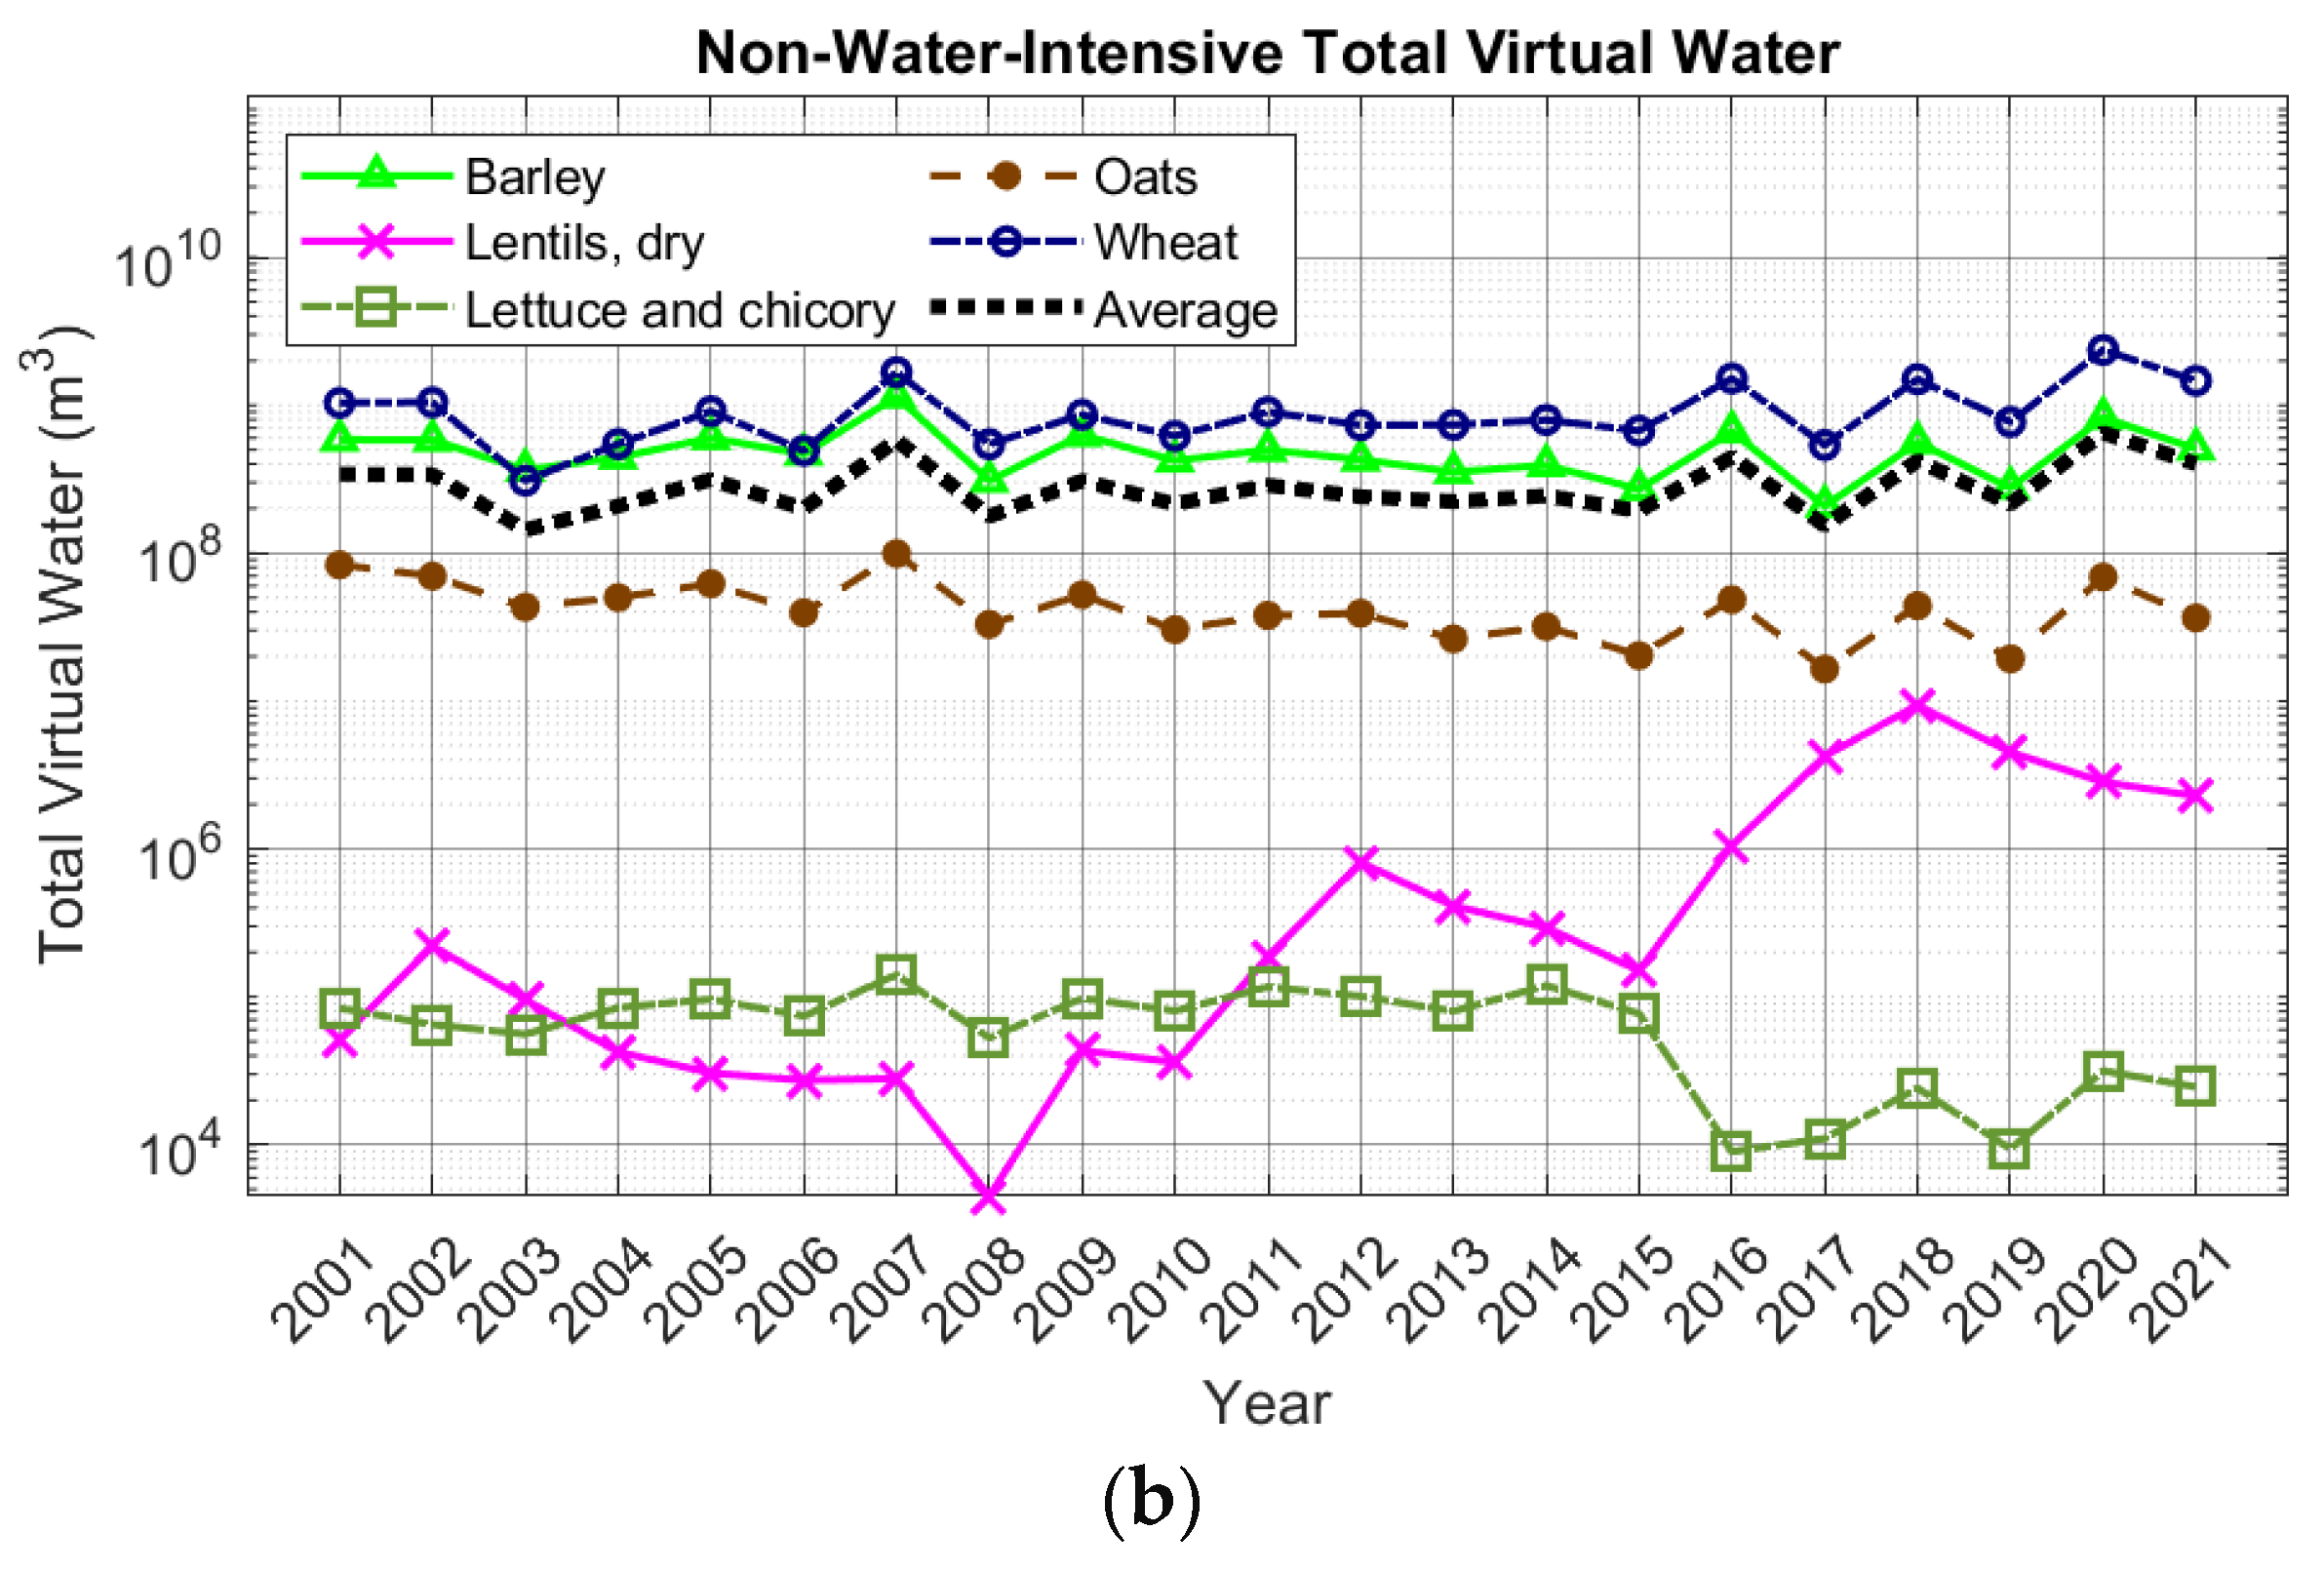
3.3. Total Virtual Water Consumption Trend (2001–2021)

Balancing water productivity and consumption is essential for sustainable agriculture. This consideration is particularly important given the variability of water sources, such as irrigation and precipitation. Visualizing trends in total, irrigation, and precipitation virtual water provides insights into evolving water use patterns in Ukrainian agriculture.
Figure 9 shows annual virtual water consumption trends for water-intensive and non-water-intensive crops between 2001 and 2021. The total virtual water usage for water-intensive crops has consistently increased, rising from approximately 18 B cubic meters (B m3) in 2001 to over 40 B m3 in 2018. This trend indicates a growing demand for these crops over time. In contrast, non-water-intensive crops show considerable variability, with several spikes and dips in usage. Notable peaks occurred in 2007, 2016, 2019, and 2021, likely due to changes in production areas, climate impacts, or yield fluctuations. This high variability highlights the need for more frequent adjustments in production based on market conditions and other influences. While water-intensive crops experienced significant growth in water consumption until 2018, this trend has recently plateaued and begun to decline. For water-intensive crops, it is crucial to maintain yield improvements while also reducing water consumption through precision irrigation and the adoption of drought-resistant crop varieties. In contrast, the trends for non-water-intensive crops appear to be oscillatory but unpredictable. It is essential to implement strategies that minimize production volatility to ensure a stable supply despite climate crisis and market fluctuations.
Figure 10 illustrates trends in irrigation virtual water. The total volume of irrigation virtual water rose significantly from about 8 B cubic meters in 2001 to around 30 B cubic meters by 2018. This increase highlights a growing reliance on water-intensive crops and irrigation practices. Contributing factors may include more agricultural land for these crops, increased dependence on irrigation, and changes in rainfall patterns requiring more irrigation to maintain yields. After peaks in irrigation water use between 2017 and 2018, a decline occurred from 2019 to 2021, implying a strong reliance on artificial watering methods and improvements in irrigation efficiency. Most years show minimal irrigation reliance for non-water-intensive crops. However, an outlying spike occurred in 2012, which was unusual compared to typical usage patterns. The rapid decline in water usage after the 2013 peak suggests that this event was exceptional and not indicative of a long-term trend in irrigation practices. Historically, water-intensive crops have required significant irrigation volumes, peaking in 2018 but showing recent signs of decline. Non-water-intensive crops rarely require irrigation.
Figure 11 shows the precipitation virtual water usage in crops, indicating the volume of rainwater that supports crop production. From 2001 to 2021, the contribution of precipitation to virtual water rose significantly, increasing from about 10 B cubic meters to 22 B cubic meters. This trend suggests either increased rainfall in key agricultural areas or a larger area dedicated to growing water-intensive crops that depend on this natural precipitation. Notably, years such as 2007, 2009, and 2017 experienced drops in precipitation volume. These declines might be because of climate variability or reduced reliance on rain-fed agriculture at those times. However, subsequent years have shown recovery in rainfall levels, highlighting the influence of natural climate cycles. Non-water-intensive crops show significant fluctuations in performance, highlighted by distinct peaks and valleys. These variations show a strong sensitivity to annual rainfall patterns. Years with substantial rainfall—like 2007, 2010, 2016, 2018, and 2020—result in notable productivity peaks. Conversely, poor performance in other years suggests challenges because of inconsistent rainfall, often leading farmers to use irrigation. Unlike water-intensive crops, non-water-intensive crops do not display a consistent long-term trend in water usage related to rainfall. This inconsistency may be because of the variability of farming practices, changes in cultivation areas, or a reduced focus on these crops during certain periods.

3.4. Virtual Water Trade and Global Dynamics

Ukraine’s various types of virtual water trades are summarized in Table 2. Ukraine imported a total of 6.3 million tonnes of crops, which included approximately 1.98 million tonnes of water-intensive crops and around 4.32 million tonnes of non-water-intensive crops. The total virtual water (VW) imported was 1.2 B m3, with about 88% (1.07 B m3) linked to water-intensive crops and only around 11.7% (140.7 million m3) associated with non-water-intensive crops. The average VW price for non-water-intensive crops is 5.79 USD per m3, which is higher than that for water-intensive crops, priced at 4.62 USD per m3. This indicates that non-water-intensive crop imports are more costly per unit of water consumption, potentially due to their higher value or specialized nature. Additionally, the majority of the VW associated with water-intensive crop imports comes from irrigation, totaling 573 million m3. This highlights a strong reliance on irrigated crops for these imports. In contrast, non-water-intensive crops depend significantly more on precipitation, utilizing 139.6 million m3 of rainwater compared to just 1.08 million m3 of irrigation water. This suggests a greater reliance on rain-fed production for non-water-intensive crops.
Ukraine exported 555.4 million tonnes of crops, which is nearly 88 times more than its imports of 6.3 million tonnes. The total volume of water (VW) exported was 114.08 B m3, with approximately 95% associated with water-intensive crops (100.48 B m3), while non-water-intensive crops accounted for 13.6 B m3. The average VW price for exported crops is only USD 0.93 per m3, significantly lower than the 4.75 USD per m3 for imports. This suggests that Ukraine primarily exports staple grains with a lower price per unit of water, while importing higher-value, lower-volume crops. Most of the VW in exported water-intensive crops comes from irrigation, totaling 55.77 B m3, but precipitation also plays a significant role, contributing 44.7 B m3. In contrast, non-water-intensive crops rely more on precipitation (13.57 B m3) than irrigation (32.36 million m3), highlighting their dependence on rain-fed production. The average VW value for non-water-intensive crop exports is 3.73 USD per m3, considerably higher than the USD 0.55 per m3 for water-intensive crops. This indicates that the non-water-intensive crops exported by Ukraine likely have a higher market value per unit of water used, potentially signifying premium products.
Ukraine imports virtual water at 4.75 USD/m3 (for 1.20 B m3), compared to USD 0.93/m3 (for 114.0 B m3) from exports, indicating their USD 5.7 B expenses, i.e., less than 5% of USD 106.0 B revenue. This indicates that Ukraine is bringing in higher-value, lower-volume crops while exporting bulk agricultural commodities like wheat and barley at lower prices. Ukraine is a significant global net exporter of virtual water, primarily due to its production of water-intensive crops. The country imports fewer crops but pays a higher price per unit water volume, while its exports are much larger in volume but have a lower price per unit water volume. Irrigation water is crucial for sustaining Ukraine’s agricultural exports, making water conservation strategies essential for long-term sustainability. The virtual water import/export data presented in Table 1 indicate that future agricultural policies could be advantageous for countries with political, economic, and geographical conditions similar to those of Ukraine. Improving irrigation efficiency can help reduce virtual water exports and alleviate stress on water resources. As the climate crisis intensifies and global temperatures rise, transitioning toward higher-value crops could enhance trade balances and increase net economic profits. Additionally, exploring more sustainable rain-fed agriculture can reduce dependence on irrigation water. Lastly, investigating alternative crops that are more temperature-resistant and less water-intensive could promote Ukraine’s long-term agricultural sustainability.

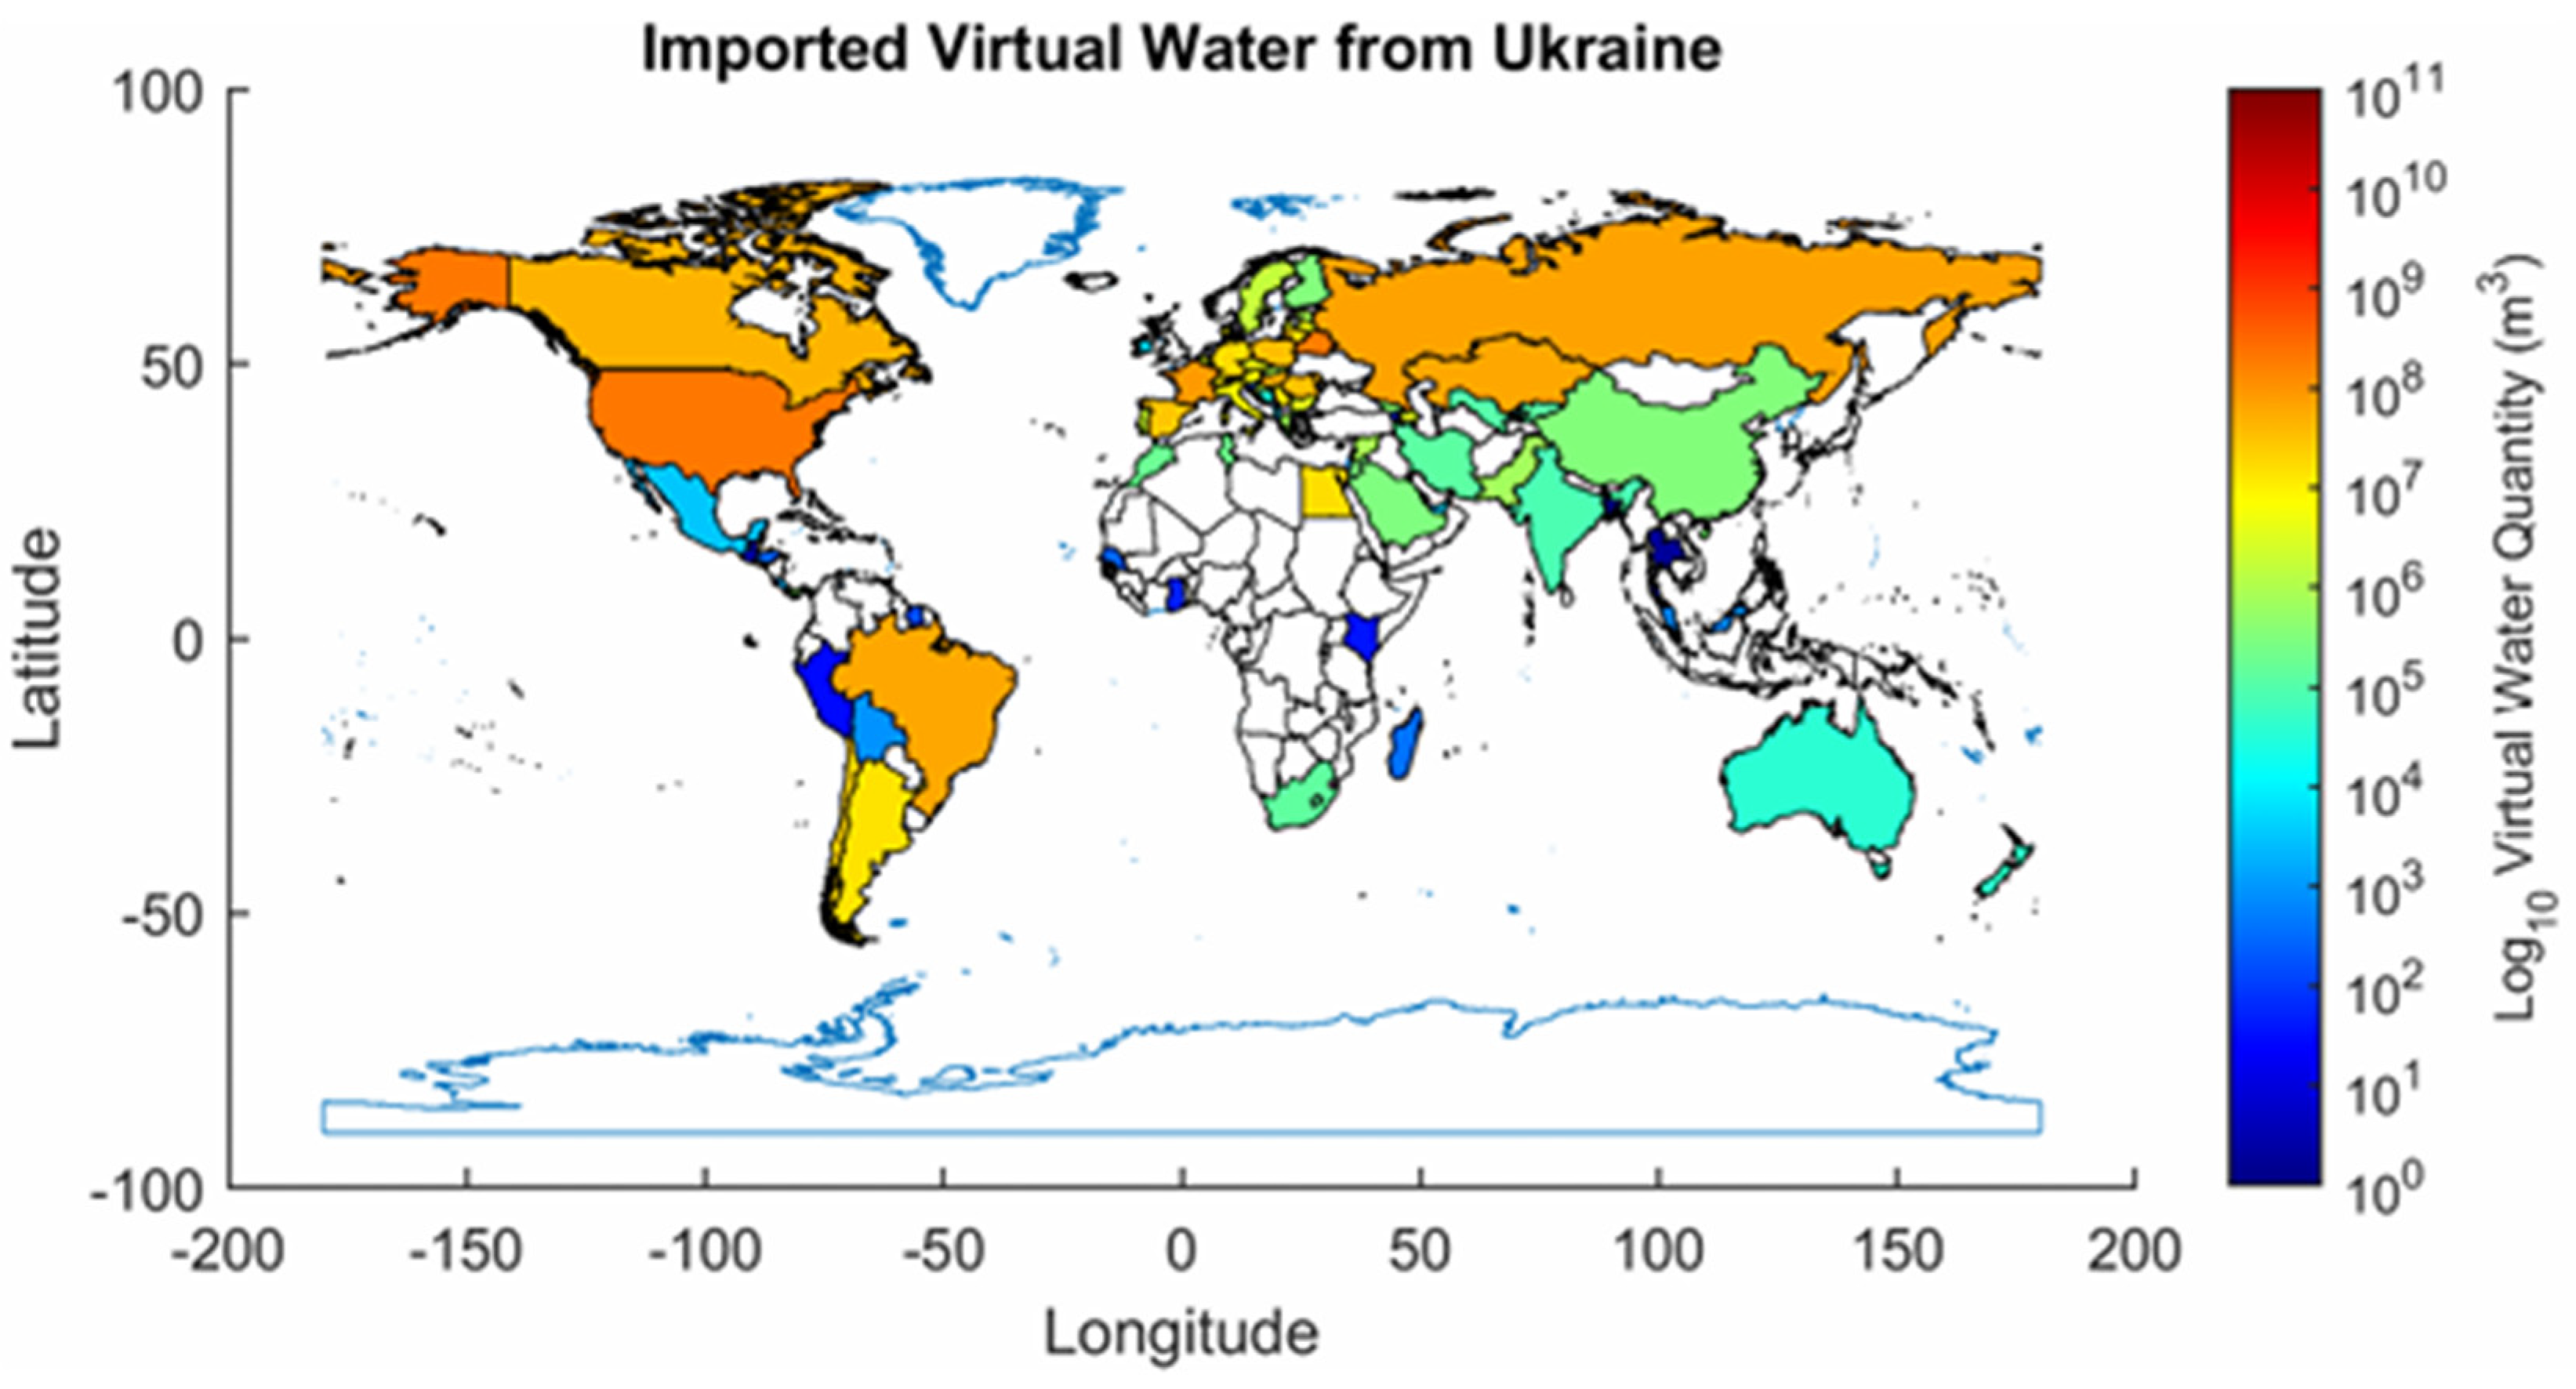
3.4.1. Virtual Water Trade Patterns and Global Dynamics

Ukraine’s agricultural exports play a central role in the global trade of virtual water (VW), particularly due to the country’s heavy reliance on water-intensive crops, such as maize and sunflower. Ukraine’s trade partners in terms of exported and imported VW are discussed as follows.
Figure 12 shows that most of Ukraine’s virtual water exports are directed toward Europe, the Middle East, North Africa, and East Asia. Major recipients include China, Egypt, Spain, Turkey, and Italy, which are primarily located in the Northern Hemisphere. These countries import significant quantities of Ukrainian water-intensive crops, such as maize, wheat, and sunflower seeds. Over the two decades from 2001 to 2021, the total volume of virtual water exported from Ukraine through these traded crops amounted to approximately 100 billion cubic meters. This trend highlights Ukraine’s role as a net virtual water exporter, as it transfers large volumes of embedded virtual water—contained within exported crops—to regions where water for producing equivalent amounts of these crops is scarce.
Figure 13 presents a global map illustrating the virtual water imported by Ukraine over the past two decades in contrast to Figure 12 depicting the water exported from Ukraine. The volume of virtual water entering Ukraine is significantly lower than the water being exported, with a difference of approximately two orders of magnitude. The majority of Ukraine’s imported virtual water comes from North and South America, specifically the United States and Brazil, as well as select European countries. This disparity highlights a persistent trade imbalance regarding water productivity and export value. The data from these maps support previous findings that Ukraine’s agricultural economy is primarily focused on exporting water-intensive crops that have relatively low virtual water prices (VWPs). This situation suggests that the country may be compromising long-term water sustainability for short-term economic gains, particularly in cases where export crops require a large amount of water but yield low returns per cubic meter.

3.4.2. Policy Implications and Recommendations

Ukraine’s agricultural exports and crop production practices are influenced by economic factors, government policies, and climate conditions. There is a strong global demand for profitable crops that use a lot of water, like maize and sunflower seeds. This demand has led Ukraine to focus its exports on these crops, even though they do not provide the best economic returns for the amount of water they consume. Agricultural policies in the country have encouraged the production of crops aimed at export. However, changes in climate, such as droughts and uneven rainfall, have increased the need for irrigation. This has made the problem of water-intensive crop farming even worse. Together, these issues highlight the urgent need for solutions that balance making a profit with managing water resources sustainably, particularly given ongoing climate and geopolitical challenges. Trade diversification is a good strategy. By focusing on exporting crops like wheat and barley, which have higher virtual water prices, Ukraine can ease the demand on irrigation resources and boost economic efficiency. Using virtual water pricing in agricultural policy can help make subsidy structures and trade incentives more sustainable. By setting national targets for water-use efficiency based on virtual water data, we can improve planning and conserve resources. These findings position Ukraine’s water trade not just as an economic issue, but also as a matter of national water security and long-term sustainability.

4. Conclusions

The findings of this study provide significant insights into Ukraine’s virtual water trade, emphasizing the interplay between crop selection, economic returns, and water-use efficiency. Over the 21-year period, Ukraine’s agricultural trade is marked by a heavy reliance on water-intensive crop exports, contributing to 114.08 B cubic meters (m3) of virtual water exports between 2001 and 2021.
One of the central findings was the substantial increase in water-intensive crop production, which constituted 67.4% of Ukraine’s total crop production from 2001 to 2021. Water-intensive crops averaged 5.90 tonnes per hectare, nearly twice the yield of non-water-intensive crops, which produced 3.06 tonnes per hectare. These water-intensive crops had an average yield of 5.90 tonnes per hectare, nearly double that of non-water-intensive crops, which averaged 3.06 tonnes per hectare. However, the total virtual water consumption for these crops reached 665.99 B m3, accounting for 95.48% of Ukraine’s agricultural water use. In contrast, non-water-intensive crops, which represented 32.6% of agricultural output, used only 31.52 B m3 of virtual water (4.52% of total) but produced higher revenue per cubic meter of water. Water-intensive crops have a higher export value per tonne at USD 204.88, compared to USD177.85 for non-water-intensive crops. However, their virtual water value is much lower at USD 0.55 per cubic meter, while non-water-intensive crops yield USD 3.73 per cubic meter.
Water-intensive crops have a higher export value of USD 204.88 per tonne, compared to USD 177.85 for non-water-intensive crops. However, their virtual water value is only USD 0.55 per cubic meter, while non-water-intensive crops yield USD 3.73 per cubic meter. This indicates that Ukraine is exporting large quantities of water with relatively low economic returns. Furthermore, 55.77 B cubic meters—representing 49% of exported virtual water—comes from irrigation, highlighting the significant dependence on managed water resources for water-intensive crops. The reliance on irrigation for water-intensive crops shows an imbalance in water allocation, which may worsen with climate variability. In contrast, non-water-intensive crops rely mainly on precipitation, using 31.46 B cubic meters of natural water and only 64.6 million cubic meters of irrigation (0.02% of total use). This suggests that focusing on non-water-intensive crops could enhance economic resilience and water sustainability.
Crop performance data reveal that wheat, barley, and potatoes demonstrated stable production and superior water-use efficiency even during drought years compared to maize and sunflower seed. Sunflower seed production, despite its scale, contributed disproportionately to total virtual water consumption, particularly from 2010 to 2018. Non-water-intensive crops such as lentils and lettuce maintained minimal irrigation needs and lower total water footprints while offering high virtual water value. A consistent rise in irrigation demand for water-intensive crops until 2018, followed by a sharp drop during the 2019–2020 drought, underscored the vulnerability of current production systems to climate shocks. These dynamics highlight the importance of targeted crop diversification and investment in drought-resilient, water-efficient farming systems.
The current trajectory of Ukraine’s virtual water trade, while economically driven by global demand for high yield crops, exposes the country’s agricultural sector to increasing water stress. The dominance of water-intensive crops in both total production and exports suggests a potential misalignment between economic profitability and water conservation goals. Given that 88.1% of Ukraine’s exported virtual water comes from water-intensive crops, policy interventions aimed at rebalancing crop selection could optimize water resources and enhance economic efficiency. Future studies should investigate the long-term economic impacts of shifting production strategies toward non-water-intensive crops. Climate change projections should also be incorporated into virtual water trade models to assess potential risks associated with prolonged droughts or changes in precipitation patterns. Additionally, understanding the impact of global trade policies on Ukraine’s agricultural exports will be crucial for ensuring both economic resilience and water sustainability.
These findings indicate a significant misalignment between current agricultural trade practices and sustainable water resource management. Policymakers should utilize virtual water metrics to inform crop selection, prioritizing high-value and water-efficient crops such as barley and wheat instead of maize and sunflower seeds. By integrating virtual water metrics into national agricultural and trade policies, resource allocation can be optimized, dependence on irrigation can be reduced, and resilience to water stress can be strengthened, especially in light of expected climatic shifts and economic uncertainties.
Ukraine should create targeted trade incentives that favor crops generating higher economic returns for each unit of water consumed. A strategic shift toward less water-intensive alternatives can lessen the burden on irrigation infrastructure and promote sustainable water management practices. Additionally, investments in agricultural innovation aimed at improving the yields of water-efficient crops could further enhance Ukraine’s potential for sustainable exports.
Future research should investigate how the geopolitical changes that have occurred since 2021 have affected Ukraine’s virtual water trade. It will be essential to incorporate climate change scenarios into agricultural trade and water-use models to evaluate future risks and develop adaptive strategies. Furthermore, this study is part of a larger research initiative aimed at creating a new multi-indicator virtual water efficiency index that can be applied at global, national, and farm levels. The goal of this future work is to enhance agricultural water sustainability and to better inform effective policy-making.

Author Contributions

Conceptualization, A.S.K. and A.S.A.; methodology, A.S.A.; software, A.S.A.; validation, A.S.K. and A.S.A.; formal analysis, A.S.A.; investigation, A.S.K. and A.S.A.; data curation, A.S.A.; writing—original draft preparation, A.S.A.; writing—review and editing, A.S.K.; visualization, A.S.K. and A.S.A.; supervision, A.S.K.; project administration, A.S.K.; funding acquisition, A.S.K. All authors have read and agreed to the published version of the manuscript.

Funding

This work was supported in part by the US National Science Foundation (Grant No. 2034824).

Data Availability Statement

The original data presented in the study are openly available in the authors’ repositories [29]. These data were derived from the following resource available in the public domain: Food and Agriculture Organization of the United Nations [3].

Conflicts of Interest

The authors declare no conflict of interest.

References

  1. Statistics, UN World Water Development Report. Available online: https://www.unesco.org/reports/wwdr/en/2024/s (accessed on 11 December 2024).
  2. Velasco-Muñoz, J.F.; Aznar-Sánchez, J.A.; Belmonte-Ureña, L.J.; Román-Sánchez, I.M. Sustainable Water Use in Agriculture: A Review of Worldwide Research. Sustainability 2018, 10, 1084. [Google Scholar] [CrossRef]
  3. Statistics, Food and Agriculture Organization of the United Nations. Available online: http://www.fao.org/statistics/en (accessed on 11 December 2024).
  4. Hoekstra, A.Y.; Wiedmann, T.O. Humanity’s Unsustainable Environmental Footprint. Science 2014, 344, 1114–1117. [Google Scholar] [CrossRef] [PubMed]
  5. Gleick, P. The Myth and Reality of Bottled Water; Pacific Institute: Oakland, CA, USA, 2010. [Google Scholar]
  6. Chapagain, A.K.; Hoekstra, A.Y. The Global Component of Freshwater Demand and Supply: An Assessment of Virtual Water Flows between Nations as a Result of Trade in Agricultural and Industrial Products. Water Int. 2008, 33, 19–32. [Google Scholar] [CrossRef]
  7. Anderson, K. Agricultural Trade, Policy Reforms, and Global Food Security; Palgrave Studies in Agricultural Economics and Food Policy; Palgrave Macmillan: London, UK; New York, NY, USA, 2016; Volume 1, ISBN 978-1-137-47168-0. [Google Scholar]
  8. Rockström, J.; Gupta, J.; Qin, D.; Lade, S.J.; Abrams, J.F.; Andersen, L.S.; Armstrong McKay, D.I.; Bai, X.; Bala, G.; Bunn, S.E.; et al. Safe and Just Earth System Boundaries. Nature 2023, 619, 102–111. [Google Scholar] [CrossRef]
  9. Higazy, N.; Merabet, S.; Khalifa, R.; Saleh, A.; Al-Sayegh, S.; Hosseini, H.; Wahib, S.; Alabsi, R.; Zarif, L.; Mohamed, M.S.; et al. Water Footprint Assessment and Virtual Water Trade in the Globally Most Water-Stressed Country, Qatar. Water 2024, 16, 1185. [Google Scholar] [CrossRef]
  10. Fu, T.; Xu, C.; Huang, X. Analysis of Virtual Water Trade Flow and Driving Factors in the European Union. Water 2021, 13, 1771. [Google Scholar] [CrossRef]
  11. Cazcarro, I.; Dilekli, N. Developing the Food, Water, and Energy Nexus for Food and Energy Scenarios with the World Trade Model. Water 2021, 13, 2354. [Google Scholar] [CrossRef]
  12. FAO. The Dimensions of Water Productivity. In FAO Water Reports 2020 65, Rome; FAO: Rome, Italy, 2020. [Google Scholar]
  13. Walsh, P. Operationalizing the Incentive Theory: Modernizing U.S. Bureaucracy to Effectively Predict and Prevent War. Mil. L. Rev. 2016, 224, 87. [Google Scholar]
  14. Suweis, S.; Konar, M.; Dalin, C.; Hanasaki, N.; Rinaldo, A.; Rodriguez-Iturbe, I. Structure and Controls of the Global Virtual Water Trade Network. Geophys. Res. Lett. 2011, 38, L10403. [Google Scholar] [CrossRef]
  15. Tamea, S.; Allamano, P.; Carr, J.A.; Claps, P.; Laio, F.; Ridolfi, L. Local and Global Perspectives on the Virtual Water Trade. Hydrol. Earth Syst. Sci. 2013, 17, 1205–1215. [Google Scholar] [CrossRef]
  16. Deng, G.; Di, K. A Study on the Characteristics and Influencing Factors of the Global Grain Virtual Water Trade Network. Water 2025, 17, 288. [Google Scholar] [CrossRef]
  17. Deng, G.; Di, K. A Study of Virtual Water Trade among G20 Countries from a Value-Added Trade Perspective. Water 2024, 16, 2808. [Google Scholar] [CrossRef]
  18. Tette, A.S.K.; Odey, G.; Ahmad, M.J.; Adelodun, B.; Choi, K.-S. Crop Water Use and a Gravity Model Exploration of Virtual Water Trade in Ghana’s Cereal Agriculture. Water 2024, 16, 2077. [Google Scholar] [CrossRef]
  19. Rosa, L.; Chiarelli, D.D.; Tu, C.; Rulli, M.C.; D’Odorico, P. Global Unsustainable Virtual Water Flows in Agricultural Trade. Environ. Res. Lett. 2019, 14, 114001. [Google Scholar] [CrossRef]
  20. Yang, X.; Zhuo, L.; Xie, P.; Huang, H.; Feng, B.; Wu, P. Physical versus Economic Water Footprints in Crop Production: A Spatial and Temporal Analysis for China. Hydrol. Earth Syst. Sci. 2021, 25, 169–191. [Google Scholar] [CrossRef]
  21. Tamea, S.; Carr, J.A.; Laio, F.; Ridolfi, L. Drivers of the Virtual Water Trade. Water Resour. Res. 2014, 50, 17–28. [Google Scholar] [CrossRef]
  22. Dalin, C.; Konar, M.; Hanasaki, N.; Rinaldo, A.; Rodriguez-Iturbe, I. Evolution of the Global Virtual Water Trade Network. Proc. Natl. Acad. Sci. USA 2012, 109, 5989–5994. [Google Scholar] [CrossRef]
  23. Tayia, A.; Collins, A.M.; Gilmont, M. The Role of Virtual-Water Decoupling in Achieving Food–Water Security: Lessons from Egypt, 1962–2013. Water Int. 2022, 47, 1118–1139. [Google Scholar] [CrossRef]
  24. Wally, A.; Akingbe, O. Egypt: Decline in Ukraine Wheat Imports Drives Egypt to Diversify Its Suppliers|USDA Foreign Agricultural Service. Available online: https://fas.usda.gov/data/egypt-decline-ukraine-wheat-imports-drives-egypt-diversify-its-suppliers (accessed on 11 December 2024).
  25. Sunduk, A. Cost Characteristics of Water Resources of Ukraine in the Measurement of the Market Economy. Ann. Univ. Paedagog. Cracoviensis. Stud. Ad Didact. Biol. Pertinentia 2016, 4, 139–146. [Google Scholar]
  26. Barrett, T.; Feola, G.; Khusnitdinova, M.; Krylova, V. Adapting Agricultural Water Use to Climate Change in a Post-Soviet Context: Challenges and Opportunities in Southeast Kazakhstan. Hum. Ecol. 2017, 45, 747–762. [Google Scholar] [CrossRef]
  27. Hellegers, P.; Van Halsema, G. SDG Indicator 6.4.1 “Change in Water Use Efficiency over Time”: Methodological Flaws and Suggestions for Improvement. Sci. Total Environ. 2021, 801, 149431. [Google Scholar] [CrossRef] [PubMed]
  28. Wang, W.; Wang, J.; Cao, X. Water Use Efficiency and Sensitivity Assessment for Agricultural Production System from the Water Footprint Perspective. Sustainability 2020, 12, 9665. [Google Scholar] [CrossRef]
  29. Afifi, A.S.; Kim, A.S. GitHub Repositories. Available online: https://github.com/ASAfifi/Virtual-Water-calculating-MATLAB-codes/ (accessed on 10 April 2025).
  30. Climate Engine—Democratizing Space-Borne Data and Analytics. Available online: https://www.climateengine.org/ (accessed on 23 January 2025).
  31. Abatzoglou, J.T.; Dobrowski, S.Z.; Parks, S.A.; Hegewisch, K.C. TerraClimate, a High-Resolution Global Dataset of Monthly Climate and Climatic Water Balance from 1958–2015. Sci. Data 2018, 5, 170191. [Google Scholar] [CrossRef] [PubMed]
  32. Allan, R.; Pereira; Raes, D.; Smith, M. Crop Evapotranspiration-Guidelines for Computing Crop Water Requirements-FAO Irrigation and Drainage Paper 56; FAO: Rome, Italy, 1998. [Google Scholar]
  33. Tarantino, E.; Onofrii, M. Determinazione Dei Coefficienti Colturali Mediante Lisimetri. Bonifica 1991, 9, 119–136. [Google Scholar]
Figure 1. Annual production of water-intensive crops [tonnes] in Ukraine (2000–2021) for maize (corn), potatoes, soybeans, sugar beets, sunflower seeds, and their average production.
Water 17 01231 g001
Figure 2. Annual production of non-water-intensive crops [tonnes] in Ukraine (2000–2021) for barley, dry lentils, lettuce and chicory, oats, wheat, and their average production. The means and standard deviations of dry lentils, lettuce and chicory, and oats are 0.003 ± 0.005, 0.011 ± 0.007, and 0.643 ± 0.214 Mtonnes, respectively.
Water 17 01231 g002
Figure 3. Production [tonnes] and yield [tonnes/ha] of sunflower seeds in Ukraine (2001–2021).
Water 17 01231 g003
Figure 4. Production [tonnes] and yield [tonnes/ha] of wheat in Ukraine (2001–2021).
Water 17 01231 g004
Figure 5. Annual water productivity of water-intensive crops [m3/tonnes] in Ukraine (2000–2021) for maize (corn), potatoes, soybeans, sugar beets, sunflower seeds, and their average productivity: (a) linear- and (b) log-scales.
Water 17 01231 g005
Figure 6. Annual water productivity of non-water-intensive crops [m3/tonnes] in Ukraine (2000–2021) for barley, dry lentils, lettuce and chicory, oats, wheat, and their average productivity: (a) linear- and (b) log-scales.
Water 17 01231 g006
Figure 7. Annual virtual water usage of water-intensive crops [m3] in Ukraine (2000–2021) for maize (corn), potatoes, soybeans, sugar beets, sunflower seeds, and their average productivity: (a) linear- and (b) log-scales.
Water 17 01231 g007
Figure 8. Annual virtual water usage of non-water-intensive crops [m3] in Ukraine (2000–2021) for barley, dry lentils, lettuce and chicory, oats, wheat, and their average virtual water: (a) linear- and (b) log-scales.
Water 17 01231 g008aWater 17 01231 g008b
Figure 9. The annual sum of total virtual water for both water-intensive and non-water-intensive crops [m3] in Ukraine (2000–2021).
Water 17 01231 g009
Figure 10. The annual sum of irrigation virtual water for both water-intensive and non-water-intensive crops [m3] in Ukraine (2000–2021).
Water 17 01231 g010
Figure 11. The annual sum of precipitation virtual water for both water-intensive and non-water-intensive crops [m3] in Ukraine (2000–2021).
Water 17 01231 g011
Figure 12. The global distribution of Ukraine’s exported virtual water flows in Log-scale [m3] associated with agricultural goods, aggregated over the period 2000–2021.
Water 17 01231 g012
Figure 13. The global distribution of Ukraine’s imported virtual water flows in Log-scale [m3] associated with agricultural goods, aggregated over the period 2000–2021.
Water 17 01231 g013
Table 1. Summary comparison of water-intensive and non-water-intensive crops in Ukraine (2001–2021).
VariableUnitsWater-Intensive (Percentage of Total)Non-Water-Intensive (Percentage of Total)
Total Production[tonnes]1,358,778,820
(67.37%)
658,109,957
(32.63%)
Total Land Area[ha]230,220,055
(51.68%)
215,271,767
(48.32%)
Total VW Consumption[m3]665,998,601,560
(95.48%)
31,520,476,106
(4.52%)
Irrigation VW Consumption[m3]347,374,766,866
(99.98%)
64,624,630
(0.02%)
Precipitation VW Consumption[m3]318,623,834,693
(91.01%)
31,455,851,476
(8.99%)
Average Yield[tonnes/ha]5.903.06
Average VW Productivity[m3/tonne]490.1547.90
Table 2. Summary comparison of amounts and values of diverse types of VW imported to and exported from Ukraine from 2001 to 2021).
VariablesUnitsAll CropsWater-IntensiveNon-Water-Intensive
Imports to Ukraine
Total Weight[tonnes]6,300,447.561,977,236.894,323,210.67
Avg. Weight[USD/tonne]910.632490.06188.27
Total VW[m3]1,206,948,284.851,066,283,249.22140,665,035.63
Avg. VW[USD/m3]4.754.625.79
Total Irr. VW[m3]574,368,670.11573,288,889.071,079,781.04
Avg. Irr. VW [USD/m3]3.903.902.18
Total Prec. VW[m3]632,579,614.74492,994,360.16139,585,254.59
Avg. Prec. VW [USD/m3]5.535.455.81
Exports from Ukraine
Total Weight[tonnes]555,402,453.57270,287,450.55285,115,003.02
Avg. Weight [USD/tonne]191.00204.88177.85
Total VW[m3]114,081,239,682.16100,476,739,619.2813,604,500,062.88
Avg. VW[USD/m3]0.930.553.73
Total Irr. VW[m3]55,806,491,944.1355,774,134,147.4632,357,796.67
Avg. Irr. VW[USD/m3]0.420.424.80
Total Prec. VW[m3]58,274,747,738.0344,702,605,471.8213,572,142,266.21
Avg. Prec. VW[USD/m3]1.420.723.72
Disclaimer/Publisher’s Note: The statements, opinions and data contained in all publications are solely those of the individual author(s) and contributor(s) and not of MDPI and/or the editor(s). MDPI and/or the editor(s) disclaim responsibility for any injury to people or property resulting from any ideas, methods, instructions or products referred to in the content.

