Abstract
The analysis and simulation of water quality in distribution networks is a complex issue of great concern today. The analysis of the evolution of water age as a simple indicator of water quality in the network is of great interest in both the design and operation phases. Understanding the factors that have the strongest influence on water quality is key to developing adequate strategies aimed at preserving it. This paper first analyses the factors with the biggest influence on the tank’s water age to support the selection of the most appropriate configuration from the point of view of water quality during design phases. Then, the main considerations when modelling tanks following the different mixing models considered in Epanet are presented. Also, real tank behaviour is characterised through field measurements and Epanet simulations in order to determine the best-fitting mixing model.
1. Introduction
The primary objective of a water distribution network (WDN) is to provide users with the required demand under optimal pressure and quality conditions. As water travels from treatment plants to users’ taps, water quality (WQ) parameters change, including an increase in water age, a decrease in disinfectant concentration (chlorine), and an increase in disinfectant by-products such as trihalomethanes (THMs).
Under normal operating conditions, changes in WQ are caused by multiple factors. Chemical reactions that begin during the treatment process continue within bulk water and pipe walls. Additionally, water from different sources can be mixed in tanks and network junctions, modifying its quality [1]. Furthermore, accidental or intentional contamination episodes can occur, which can have serious consequences for the WDN [2,3].
Analysing the network’s behaviour in terms of WQ is crucial for gaining a deeper understanding of the processes involved. This enables operators to take more accurate actions to preserve WQ and enhance the security and resilience of the system.
Hydraulic models followed by WQ models are necessary to determine travel times, water age, blending, and subsequent WQ throughout the system by considering the various water travel paths and quality transformations. It is impossible to accurately determine these factors without the use of such models [4,5,6].
Epanet [7] is a widely used software for simulating hydraulics and WQ in WDN. These models provide the concentration of a certain substance, source tracing, water age, and, occasionally, travel times at any point in the network [8].
But developing a reliable WQ model with Epanet is a complex task that involves multiple factors. Firstly, a valid hydraulic model is necessary to accurately determine the pipe flow rates, which must be detailed enough and properly calibrated [9,10]. Therefore, it is crucial to model all elements of the system from a WQ perspective to obtain accurate and coherent simulation results, particularly tanks where water can be retained for a long time and small pipes if the WQ model extends to the taps. Furthermore, it is crucial to have a demand allocation that closely reflects reality. This is because water can remain stagnant for long periods before being consumed in dead-end pipelines.
WQ is mainly affected by reactions in bulk water, interactions with pipe walls, flow mixing, ageing, and mixing within storage tanks [11]. Because WQ in WDN is a very broad field of study, this paper focuses on the analysis of the changes that occur in storage tanks.
Storage tanks are the network components with the greatest impact on WQ because water spends a certain amount of time in them before being released back into the network, and in the meantime, important changes in quality parameters can occur [12,13]. These changes can include increased water age and various aesthetic and chemical reactions, such as chlorine decay, the growth of disinfectant by-products, and changes in appearance [14].
In order to achieve accurate simulation results when developing a WQ analysis of a WDN, it is necessary to adequately model water tanks as these elements affect the behaviour of the whole network [15,16,17,18].
WQ deterioration in tanks is a common issue discussed in the literature. Studies on storage tanks can be classified into three areas: (1) monitoring and sampling [19,20,21], (2) physical-scale modelling [22,23,24], and (3) mathematical modelling [25,26]. This paper focuses on mathematical modelling (3) and its validation with real measurements (1).
With this aim, the Epanet 2.2 software was used to mathematically determine the evolution of WQ in tanks. When modelling tanks in Epanet, two main aspects must be considered regarding the evolution of WQ: the selected mixing model and the connection of the inlet/outlet pipes to the tank and to the system, apart from the mode of operation. The following paper seeks to achieve the following:
- Present the main considerations for properly modelling tanks in Epanet.
- Determine the most influential factors on water age in tanks.
- Discuss and compare the water quality behaviour of the different mixing models.
- Compare the simulation results with field measurements for a real-life case study in order to determine the mixing model that better reflects reality.
The rest of the paper is structured as follows. Section 2 provides an analysis of the mixing models available in Epanet and the key considerations when modelling tanks in Epanet. Section 3 presents two graphs showing the maximum water age in tanks as a function of the most influential factors. Section 4 focuses on the development of two theoretical case studies for analysing water age evolution for the available mixing models. Section 5 outlines the development of a real-life case study with the objective of determining the most accurate mixing model for a real tank. Following this, Section 6 discusses the analysis presented in the paper. Finally, Section 7 summarises the main conclusions of the work.
2. Methodology
2.1. Epanet’s Mixing Models within Storage Tanks
The real behaviour of water within storage tanks is complex and depends on several aspects, such as tank geometry, pipe inlets/outlets, convection, diffusion, and turbulent flow. Therefore, computational fluid dynamics (CFD) methods can be used to precisely model real tank behaviour [27]. The use of CFD methods in tank modelling is of great interest during the design phase as they provide detailed insight into momentum and mass transport in tanks, allowing for the determination of the best internal tank configurations to preserve WQ [28,29].
However, solving these equations requires significant time and computational power, which hinders their integration into a comprehensive quality model of the entire network.
Epanet 2.2 implements four different types of models to characterise mixing within storage tanks [7], as presented in Figure 1. In this case, it is assumed that elements behave ideally, with clearly defined preferential paths and stagnation zones. When modelling a tank with Epanet, the objective is to select the mixing model that best represents reality.
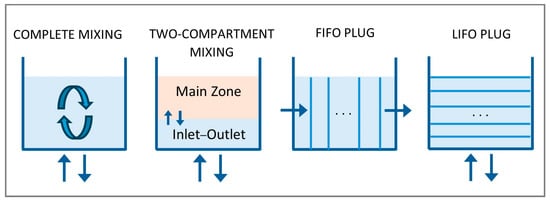
Figure 1.
Tank mixing models in Epanet [7].
- Complete mixing: This model assumes that all water entering the tank is immediately and fully mixed with the water already present in the tank.
- Two-compartment mixing: The storage volume of a tank is divided into two compartments, both of which are assumed to be completely mixed. The inlet/outlet pipes of the tank are located in the first compartment. When new water enters the tank, it mixes with the water in the first compartment. If the first compartment is full, the excess water flows into the second compartment, where it mixes with the water already stored there. Water exits the tank from the first compartment. When the first compartment is emptied, it receives an equivalent amount of water from the second compartment to make up the difference, as long as it has stored water. The first compartment simulates short-circuiting between inflow and outflow, while the second compartment simulates the dead zones of the tank.
- FIFO plug flow: This model assumes that water does not mix during its residence time in a tank; instead, it is stored in separate parcels. Water parcels move through the tank in a segregated manner, with the first parcel to enter (first input) also being the first to leave (first output). This behaviour occurs when inlet and outlet pipes are located at opposite ends of the tank and baffles are present inside or when tanks are fed from the top.
- LIFO plug flow: This model is similar to the previous one, but in this case, water parcels stack up on top of each other, with water entering and leaving the tank at the bottom in reverse order of entry (last input is first output). This behaviour is typical when both inlet and outlet pipes are very close to each other or when there is a single inlet/outlet pipe.
2.2. Influence of Inlet/Outlet Pipe Configuration on the Mixing Model
When determining the mixing model that best simulates the real behaviour of WQ in a tank, several aspects need to be considered. Firstly, it is important to note that the different models available in Epanet 2.2 aim to reproduce the interaction between inlet/outlet volumes with the stored volume for each time interval. All of these models are dependent on the inlet/outlet pipe disposal, tank geometry, and baffle configuration to guide the flows inside the tank if present, as shown in Figure 2.
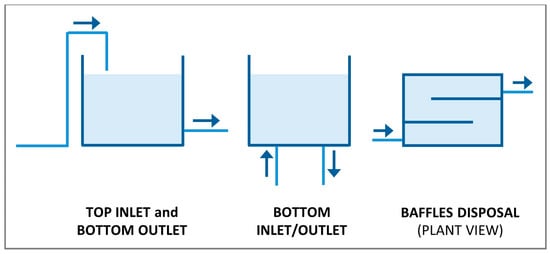
Figure 2.
Inlet/outlet pipe configuration and baffles in tanks (from left to right).
Furthermore, the physical configuration of inlet and outlet pipes has a significant impact on the flow of water inside a tank, including the creation of preferred paths and stagnation zones. As a result, the selection of the most appropriate mixing model is influenced by the inlet/outlet pipe configuration.
For instance, when using separated inlet/outlet pipes with baffles, it is expected that the FIFO model will be the most accurate. However, in a pipe configuration where the inlet and outlet pipes are close, the LIFO or two-compartment mixing models are likely to provide the most accurate results.
2.3. Influence of Tank Connection to the System on the Mixing Model
It is not only the disposal of the inlet/outlet pipes that affects the WQ in tanks but also the connection of the tanks to the network. Figure 3 shows two different connections that significantly affect the daily water renewal rate and the evolution of water age inside the tank.
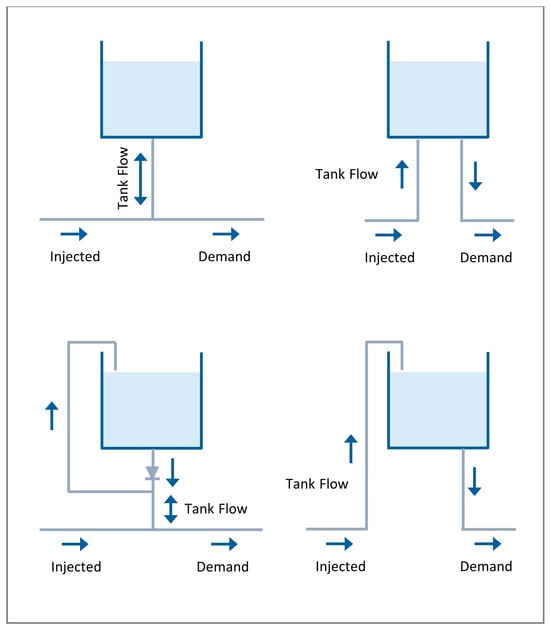
Figure 3.
Single (left) and independent (right) pipe connections to the system, with bottom inlet pipes (up) and upper inlet pipes (down).
In a single-pipe connection, the tank behaves as a balance tank. It fills when the demand flow is lower than the injected flow, and it empties in the opposite case. The daily renewal rate in this case depends on the tank regime. The higher the difference between the maximum and minimum operating levels of the tank, the higher the daily renewal rate.
Tanks with independent inlet/outlet pipe connections have a lower water age because all the demand water flow enters the tank, resulting in a higher daily renewal rate compared to tanks with a single-pipe connection.
2.4. Influence of Tank Operation on Water Age
Tank operation is also closely linked to WQ, which determines the daily renewal rate. Regulating tanks have regular inlet and outlet flows, and minimum and maximum operation settings govern the daily renewal rate.
In the case of balance tanks, their operating regime is not regular, so it is not possible to determine the daily renewal rate a priori. Therefore, low daily renewal rates are expected when the tank is almost full, and high renewal rates are expected in certain situations when the network demands high flows from them (emergencies).
The volume of the tank compared to its inflow and outflow is also important as this, in turn, determines the operating regime. In particular, pressure-breaking tanks have minimal storage capacity, so they have little influence on the system’s WQ.
2.5. Cycling Simulation Results for Water Quality Analysis: Influence of Initial Quality
To achieve accurate and coherent simulation results when developing a WQ model of a network, it is necessary to first model the hydraulic behaviour properly and allow enough simulation time for all hydraulic and quality results to stabilise, reaching cyclic behaviour as shown in Figure 4 and Figure 5. This includes pressures, tank levels, flows, and water age. At this stage, the control laws for the regulating elements of the network, including the initial levels of tanks, must be adjusted to match the values at which they repeat after a certain simulation time.
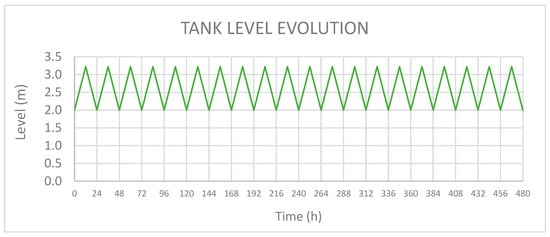
Figure 4.
Evolution of a tank level: cyclic behaviour.
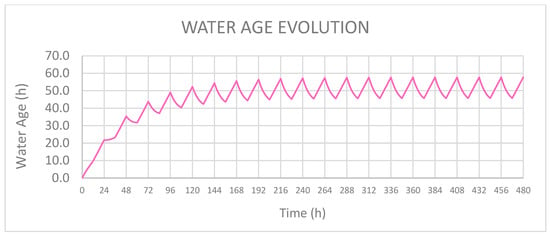
Figure 5.
Complete mixing model: evolution of water age in a tank.
It is important to note that in Epanet, when referring to tank quality, it corresponds to the WQ on the outlet side. For complete mixing models, the WQ at the tank outlet is the same as the average WQ of the entire volume of water within the tank. Therefore, the initial quality applies to all the water contained in the tank.
However, for two-compartment mixing, FIFO plug flow, and LIFO plug flow, it is not possible to define the initial quality at the inner compartments or parcels. This is because, through the Epanet interface or toolkit, users only have access to set the WQ at the outer tank section. It is therefore important to ensure cyclic behaviour in the tanks before performing any analysis.
3. Analysis of Maximum Water Age in Tanks as a Function of the Most Influential Factors
The evolution of water age in tanks depends essentially on the volume of water renewed daily in relation to the total volume stored. For complete mixing, it can therefore be calculated using the following expression [30]:
where Tr is the renewal time in hours, VT is the total tank used volume, and Vi the incoming volume to the tank during one day.
Even in the case of complete mixing, the volume renewed depends on how the tank is connected to the network, as shown in Figure 3, i.e., whether the supply and discharge are through a single pipe or separate pipes, and also on the supplied flow rate versus the demand rate.
Figure 6 and Figure 7 show how the maximum water age varies based on the supply regime, the demand regime, and the ratio between the supplied volume and the reserve volume.
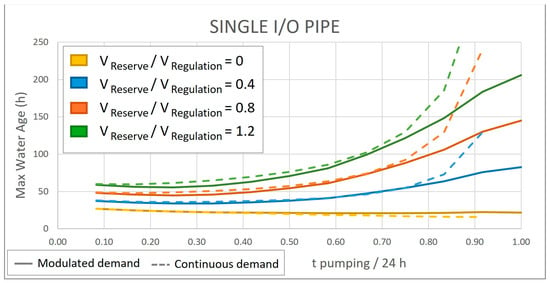
Figure 6.
Evolution of water age in a tank with a single-pipe connection to the network.
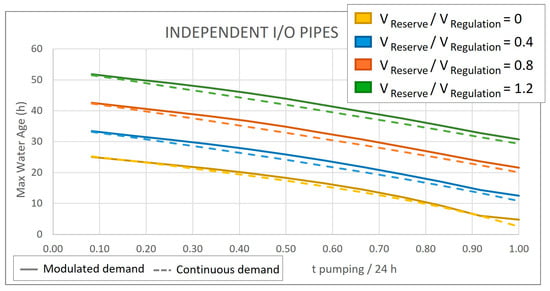
Figure 7.
Evolution of water age in a tank with an independent inlet/outlet pipe connection to the network.
Firstly, for simplicity, it has been assumed that the volume demand remains constant and that the daily volume supply is continuous for a certain number of supply hours, equal to the volume demand in 24 h. The results are represented in continuous lines.
Additional simulations were conducted to evaluate the impact of demand fluctuations on the results, represented in dashed lines, using a standard southern European demand pattern, as shown in Figure 8.
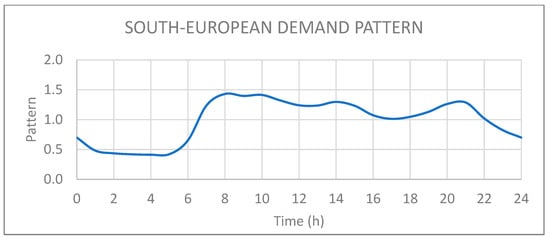
Figure 8.
South-European demand pattern.
For tanks that have a single-pipe connection to the network (Figure 6) and a constant demand (continuous lines), the water age increases as the supply regime approaches a permanent regime and equals the demand flow, i.e., no water enters the tank to renew the water age. However, these times decrease as the demand flow modulates over time. In the case of the modulation curve shown in Figure 8, for example, the maximum water age is given by the dashed lines. During extended supply periods, the variation in demand flow significantly affects the water age in the tank. This is because it determines the rate of renewal, which allows fresh water to enter the tank when the demand is below the supplied flow.
For tanks that have independent inlet/outlet pipes (Figure 7), the results for continuous average demand and modulated demand are also similar, even for extended supply regimes. In this case, because all supplied volume enters the tank, the demand fluctuation does not affect the results.
Water age is lower with independent inlet/outlet pipe connections than with a single connection and still increases with the rate of reserve volume. However, unlike single-pipe connections to the network, for independent inlet/outlet, the water age decreases as the supply time increases as a steady inlet flow continuously renews the water stored in the tank.
4. Analysis of Water Age Evolution for Different Mixing Models
In previous sections, the influence of certain parameters on water age was analysed for design purposes, assuming complete mixing. However, Epanet offers other mixing models for simulating tank behaviour. A comparison between the results obtained with the different models is made in the following sections.
4.1. Case Study 1
Case Study 1 (Figure 9) focuses on the evolution of water age in a tank connected to a single inlet/outlet pipe, which serves as a balance tank, for the four mixing models available in Epanet. A 2125 m3 balance tank with the geometrical characteristics given in Table 1 is considered.
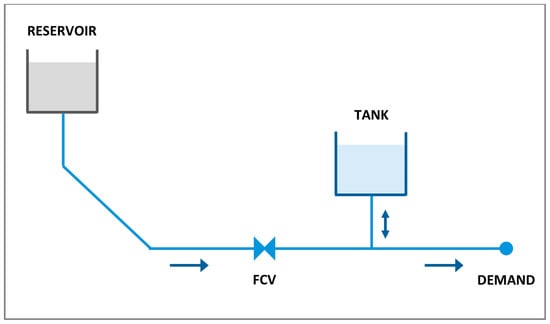
Figure 9.
Case Study 1 network diagram.

Table 1.
Tank properties.
There is a continuous demand node of 15 L/s. The whole system is fed in 12 h by a flow of 30 L/s coming from an upper reservoir and controlled by a flow control valve (FCV), resulting in a daily average flow to the balance tank of 0.
Figure 10 summarises the hydraulic behaviour of Case Study 1:
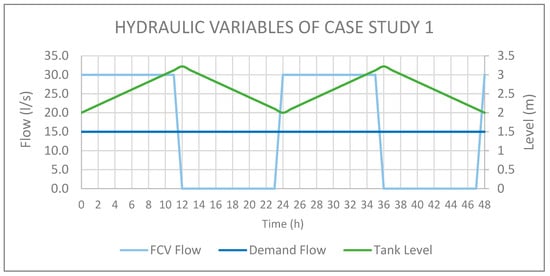
Figure 10.
Evolution of the main hydraulic variables in Case Study 1.
- At night, when the demand is lower, the tank fills up from 2.0 to 3.2 m.
- During the day, as demand increases, the tank level drops from 3.2 to 2.0 m.
Note that the presented tank configuration, with a single-pipe connection to the network, does not allow for simultaneous inlet and outlet flows to the tank. Therefore, the tank fills when the injected flow is higher than the demand flow and empties when the injected flow is lower than the demand flow.
Even though the maximum level of the tank is 4 m, it only reaches 3.2 m, so in practice, according to the real maximum and minimum levels reached, the used volume of the tank is 1700 m3 instead of its total capacity of 2125 m3. As a result, the daily water renewal rate is about 40%, so it takes approximately 2.5 days to renew all the water stored in the tank.
Finally, the hydraulic and quality results in Case Study 1 stabilise at approximately 20 days or 480 h of simulation time (Figure 5). Therefore, the analysis is focused on the results from the last 48 h of the simulation.
4.1.1. Complete Mixing
In complete mixing, all the water that enters the tank fully mixes with the water already inside. Figure 11 shows that as the tank fills, new water with a low water age enters the tank, so the water age decreases. Conversely, when the tank is being emptied, the water age increases as the stored volume keeps ageing.
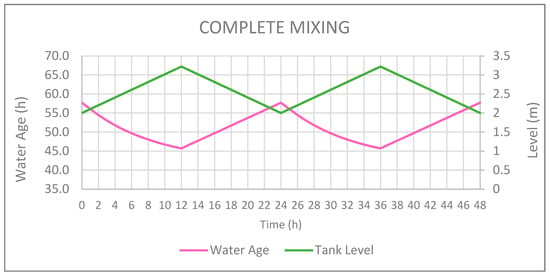
Figure 11.
Complete mixing: evolution of water age and tank level.
The maximum water age is 57.7 h, which coincides with the renewal time of all stored volume according to (1), i.e., approximately 2.5 days. This same value can be obtained from Figure 6 for tsupply/24 = 0.5, VReserve/VSupplied = 2125/2/(30 × 12 × 3.6) ≈ 0.8, and constant demand.
4.1.2. Two-Compartment Mixing
In two-compartment mixing, the total available storage volume of the tank is divided into two compartments, both of which are assumed to be completely mixed. The inlet/outlet pipes of the tank are located in the first compartment.
In Epanet, the mixing fraction is defined as the fraction of the total volume dedicated to the first compartment. The simulations in the example were performed with mixing fractions of 0.2, 0.5, and 0.8, and the results are displayed in Figure 12.
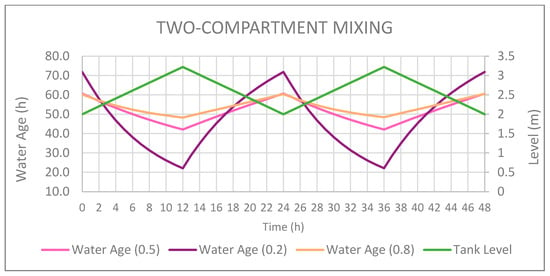
Figure 12.
Two-compartment mixing: evolution of tank level and water age for three mixing fractions.
The results obtained for a mixing fraction of 0.5 and 0.8 are similar to those obtained for complete mixing. This is because the mixing fraction is related to the total volume (max. level of 4 m) and not to the actual volume used (max. level of 3.2), as depicted in Figure 13, so all the used volume is mostly or totally located in the first compartment.

Figure 13.
The three mixing fractions (f) considered and the corresponding levels of the first compartment.
However, when the mixing fraction is 0.2, the tank behaves as a real two-compartment mixer. The first compartment only reaches a level of 0.8 m, and from there on, all volumes correspond to the second compartment. When the tank is filling, new water enters the first compartment and mixes completely with the water already present. The volume of the first compartment is lower than the volume supplied, so the water age decreases faster (remember that in these cases, the tank quality reported by Epanet is that of the first compartment). On the contrary, during the emptying of the tank, water exits the first compartment and is replaced by water from the second compartment, which has a higher water age. This results in a faster increase in water age.
The results indicate that the supplied volume compared to the mixing fraction is crucial when selecting a two-compartment mixing system. Special attention should be paid to the renewed volume and initial level of the tank. The hydraulic behaviour of the tank affects the role of the mixing fraction, which in turn determines the variability of the water age.
4.1.3. FIFO Plug Flow
The FIFO plug flow model assumes that water parcels move through the tank separately. The first parcel to enter is also the first to leave. In the case of opposite inlet and outlet pipes, this would correspond to a horizontal movement of the parcels. Also, the presence of baffles within tanks will lead to FIFO behaviour. In the case of vertical stratification, it would correspond to filling the tank from the top, as shown in Figure 14.
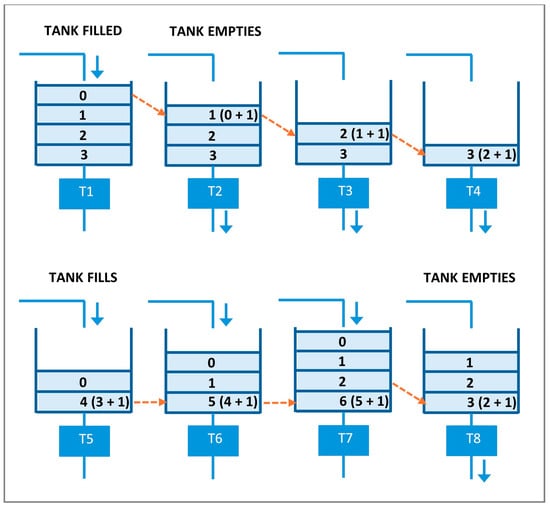
Figure 14.
FIFO plug flow: evolution of water age in the parcels of the tank. Numbers on parcels stand for the water age, in h. Each figure represents the evolution of parcels over a time step of 1 h.
To enhance comprehension of the behaviour of FIFO plug flow, the scheme presented in Figure 14 was developed. It shows the evolution of the water age of the parcels in the tank, starting from a full tank and assuming fixed time steps of 1 h.
As the tank empties, the upper parcels age at a rate of 1 h per time step. This ensures that each parcel reaches the lower location, which is shown by Epanet, with the same water age. Therefore, the water age simulation presents a constant value when the tank is emptying.
Furthermore, as the tank fills, upper parcels are generated with a lower water age, which increases when filling at a rate of 1 h. Meanwhile, the lower parcel remains stored and ages with each time step at a rate of 1 h. Therefore, during the filling process, the simulation shows a constant rate of increase in water age.
The simulation results, shown in Figure 15, follow this behaviour (remember that the tank quality reported by Epanet is that of the outlet parcel). During the tank filling process, there is no outgoing flow, and the water age of the bottom parcels increases with the time it takes to fill the tank. When the tank is emptied, there is no incoming flow, resulting in a drop in water age from 55.8 to 43.8 h, which is the time it takes to fill the tank, i.e., 12 h, and it remains constant during emptying because the time it takes for the water to leave the tank is the time it takes for the age of the stored water to increase.
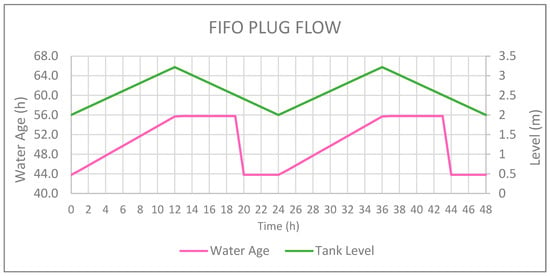
Figure 15.
FIFO plug flow: evolution of water age and tank level.
The fact that the sudden change in age does not occur immediately at the start of the emptying time is due to the initial volume assumed, which is different from the volume renewed in each cycle. Thus, part of the water introduced two cycles earlier is consumed first, followed by part of the water introduced in the previous cycle, with a difference in age of 12 h.
4.1.4. LIFO Plug Flow
The behaviour of LIFO plug flow is similar to that of FIFO plug flow. But in this case, water parcels are stacked on top of one another, and the last one to enter the tank is the first to leave. In the case of vertical stratification, it would correspond to filling and emptying the tank from the bottom.
To better understand the behaviour of the LIFO plug flow model, the scheme presented in Figure 16 shows the water age evolution of the parcels inside the tank, starting from a full tank and fixed time steps of 1 h.
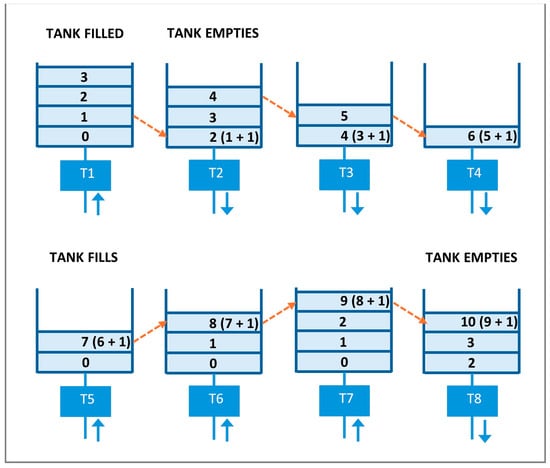
Figure 16.
LIFO plug flow: evolution of water age in the parcels of the tank. Numbers on parcels stand for the water age in h. Each figure represents the evolution of parcels over a time step of 1 h.
As the tank empties, the stored parcels age at a rate of 1 h at each time step. Thus, the lowest parcel (whose value is that provided by Epanet) ages at a rate of 2 h.
In addition, as the tank fills, new water with a low water age enters the tank, creating lower parcels with a sudden decrease in the water age simulation results. Meanwhile, the water stored in the upper parcels ages at each time step, resulting in an abrupt increase in water age when the tank begins to empty.
Note that under normal conditions, where there is always some reserve volume stored in the tanks, the upper parcels never leave the network nor mix with other parcels and continue to age at each simulation time step, reaching high water age values up to the total simulation time.
Figure 17 shows the simulation results, where the water age decreases abruptly to zero when the tank is being filled as new water enters the tank and fills the lower parcel. Conversely, when the tank empties, the water age doubles in real time because the old water stored in the upper-lagged parcels exits as it gets older. At the end of the emptying cycle, there is a peak in water age that corresponds to the upper parcels that were never renewed.
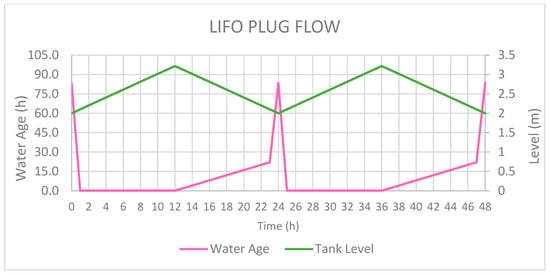
Figure 17.
LIFO plug flow: evolution of water age and tank level.
4.2. Case Study 2
Figure 18 shows the network for Case Study 2, which is similar to Case Study 1. However, in this case, the tank has two independent connection pipes. Therefore, all demand flow enters the tank before exiting the network, and incoming and outgoing flow can overlap.
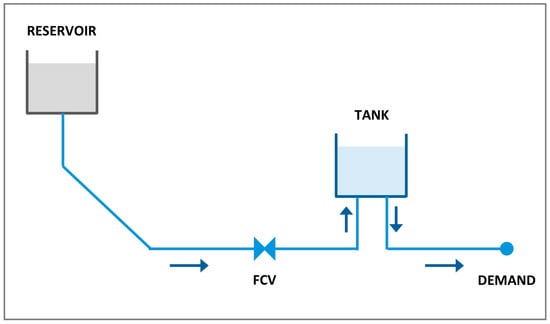
Figure 18.
Case Study 2 network diagram.
The hydraulic behaviour is similar in both cases but not the quality behaviour. The detailed analysis of WQ behaviour in each case was carried out following the same steps as shown for Case Study 1. But it is important to note that the daily water renewal rate in Case Study 2 is higher, at 80%, because all supplied water enters the tank, i.e., . A similar result is obtained from Figure 7 for the same parameters used in Case Study 1. Thus, in general terms, the water age in Case Study 2 will be lower than in Case Study 1, as shown in Figure 19, Figure 20, Figure 21 and Figure 22. A similar analysis to that followed for Case Study 1 justifies the different behaviour for each mixing model.
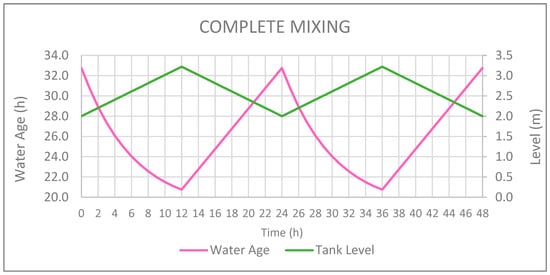
Figure 19.
Evolution of water age and tank level for complete mixing: independent I/O pipes.
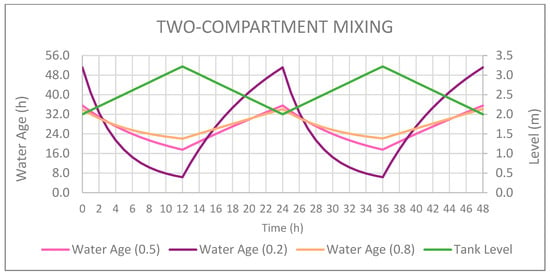
Figure 20.
Evolution of water age and tank level for two-compartment mixing: independent I/O pipes.
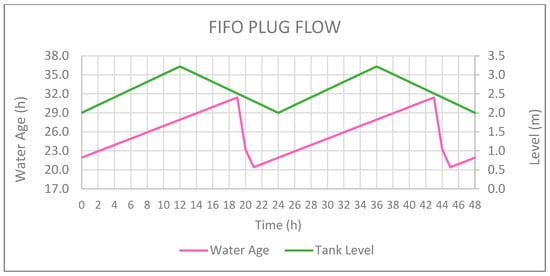
Figure 21.
Evolution of water age and tank level for FIFO plug flow: independent I/O pipes.
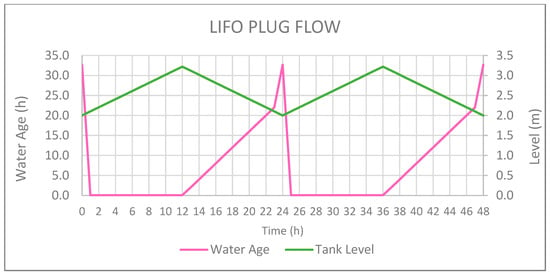
Figure 22.
Evolution of water age and tank level for LIFO plug flow: independent I/O pipes.
4.3. Revealing the Quality of Water inside the Tank
As stated before, Epanet provides the water age in the storage tanks as that of the tank outlet. Therefore, the total average water age of the volume stored within the storage tank is unknown, except for the complete mixing model.
One way to get a rough idea of the quality of the water in the different compartments or parcels inside the tank is to empty it, cancelling the inflow. Figure 23 illustrates the evolution of water age for different mixing models as the tank empties.
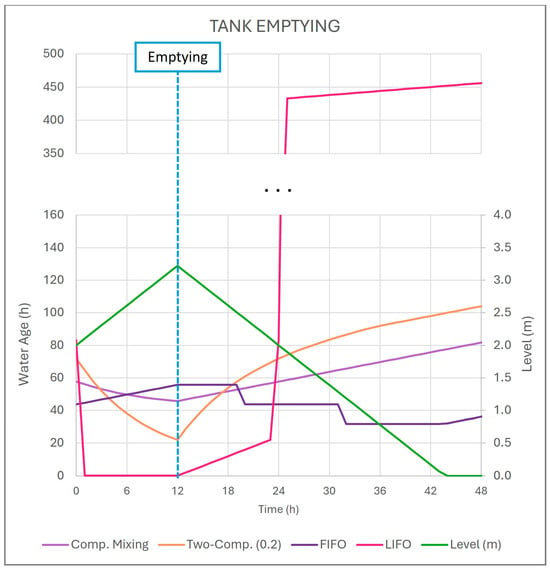
Figure 23.
Evolution of water age when the tank empties.
For the complete mixing model, the water age calculated in Epanet at the tank outlet coincides with the average water age of the entire volume of water within the tank, so the water age increases linearly as the tank empties, reaching about 80 h.
The two-compartment mixing model operates in two stages. In the first stage, the first compartment with the lower water age begins to empty, and the water from the second compartment fills the left volume of the first compartment, so the water age increases rapidly at first. In the second stage, once the second compartment empties, all volumes with higher water age remain exclusively in the first compartment, and there is no further mixing between volumes with high and low water age, resulting in a softening of the line slope, reaching about 100 h.
The FIFO plug flow has a decreasing water age during emptying, as expected from the study of the behaviour of this model. This is due to the fact that water exits the tank at a faster rate than it entered, so the water age decreases in steps as the different segments are consumed.
The LIFO plug flow exhibits an abrupt increase in water age when the tank empties. This is because the stored water in the tank ages without being renewed, and when the tank empties, all the volume stored in the upper part exits, resulting in an abrupt increase in water age, reaching, in this case, about 450 h, which is similar to the total simulation time.
5. Field Tests
The mixing that best represents real tank behaviour can be determined by following the evolution of a tracer injected into the tank [31]. The tracer can be controlled at both the inlet and outlet of the tank. When dealing with non-reactive materials, intermittent injection is sufficient as there will be no reaction over time. On the other hand, the tracer can be a reactive substance that undergoes decay or growth while remaining in the tank. By monitoring the concentration at the tank outlet, it is possible to determine the evolution of the substance inside the tank and, consequently, the most suitable mixing model to match reality.
Continuous monitoring of chlorine residual concentrations is common in many WDNs. In this way, following the chlorine evolution at the tank’s inlet and outlet permits us to choose the Epanet mixing model that reproduces reality with higher accuracy.
5.1. Description of the Facilities
The drinking water supply system in the study includes several tanks. The following analysis was carried out in one of these tanks, whose configuration is shown in Figure 24.
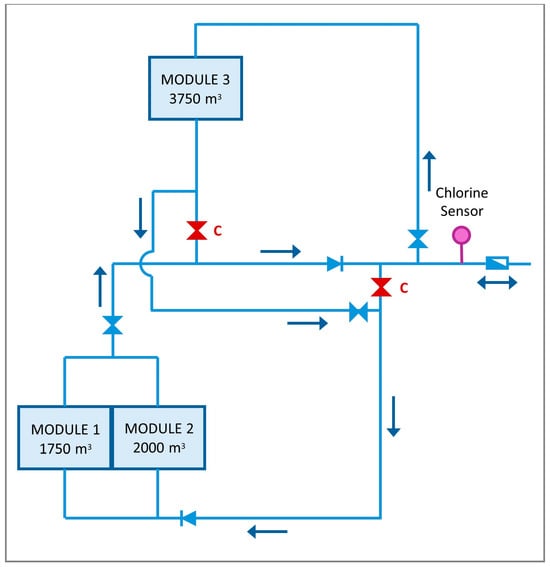
Figure 24.
Tank configuration (plant view).
The tank operates by creating a sequential circulation circuit. Water first enters Module 3, which has the highest capacity, from the bottom right and exits the tank from the bottom left. It then flows in parallel to Modules 1 and 2, entering from the bottom and exiting from the opposite bottom side. The modules are connected to the network through a single pipe, allowing water to enter or leave the module compound but never at the same time. A chlorine sensor is located at the point where the set of tanks connects to the network.
A priori, given the tank configuration, it is not clear which mixing model would be the most appropriate. Under ideal operating conditions, the system exhibits FIFO behaviour. However, in more realistic scenarios, water flows with different ages may interact, so complete mixing or two-compartment mixing may be more appropriate. Furthermore, due to the close proximity of the inlet and outlet pipes, a short-circuit may occur at the bottom of the modules. This could cause water to remain on the upper side of the tank for longer periods, resulting in a LIFO model.
As previously noted, reality is much more complex, and the behaviour of a real tank may be a combination of these theoretical models. However, to integrate tanks into a complete WQ model of the entire network, it is necessary to determine, through experimental measurements, which Epanet simplified model best represents reality.
On average, the tank demand is 19.85 L/s, with a regulating volume of 1715 m3 when three modules are operating. Additionally, there is a reserve volume of 2465 m3 to ensure supply security. Figure 25 displays the level evolution and inlet/outlet flows for the tank’s module set over a 48 h interval.
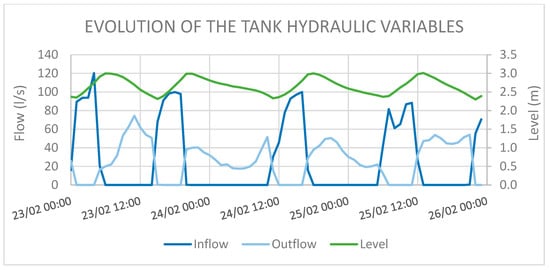
Figure 25.
Evolution of the tank level, inlet, and outlet flows.
The graph illustrates that the filling and emptying regimes are clearly differentiated due to the single-pipe connection to the network.
The field tests carried out consisted of making the various modules independent and characterising their behaviour from the point of view of WQ. Figure 26 presents the operation schemes that governed the field test.
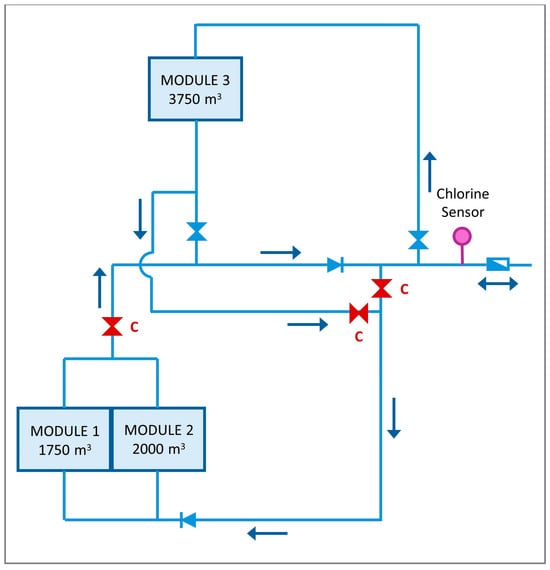
Figure 26.
Tank configuration when performing the field tests. Modules 1 and 2 are isolated.
5.2. Determination of Chlorine Bulk Coefficient
To model the behaviour of the tank, it is necessary to first determine the bulk coefficient that governs chlorine decay.
The laboratory obtained the bulk coefficient of chlorine from six samples taken from two points, A and B, located in the transport pipe connecting the tank to the network. Three samples were taken from each point, and they were kept at a constant temperature of 20 °C. The chlorine concentration was periodically measured, and the measurements were validated using two different sampling equipment.
The evolution of chlorine concentration (C) follows a first-order decay, as described by Levenspiel in 1999.
where K is the chlorine bulk reaction rate, C0 is the initial chlorine concentration, and t is the time step between C and C0 measurements.
The relationship between chlorine concentration and water age for the samples taken at 20 °C is presented in Table 2 and Table 3.

Table 2.
Chlorine decay over time in sample A.

Table 3.
Chlorine decay over time in sample B.
By representing the results in a logarithmic base, a line is obtained whose slope corresponds to the bulk coefficient K. In this way, the bulk coefficient of chlorine is determined to be 0.0145 h−1, which is similar for the two measurement points.
5.3. Experimental Assessment of the Evolution of Chlorine at the Tank Inlet/Outlet Pipe
The chlorine evolution in the tank was experimentally determined by isolating Module 3 in the first phase. Module 3 has a higher capacity of 3750 m3 and was used to obtain the chlorine concentration at the outlet of Module 3, which will be the inlet of Modules 1 and 2 in the second phase, from which water returns to the network. The evolution of chlorine in Modules 1 and 2, which are located in parallel with volumes of 1750 and 2000 m3, respectively, was finally obtained.
Figure 27 presents the results obtained for Module 3 over a 24 h period starting on 17 June 2019 at 00:00.
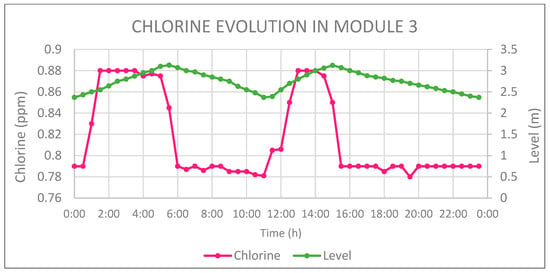
Figure 27.
Tank level and chlorine evolution in Module 3.
The graph illustrates that during the filling of the tank, water with a lower water age is introduced, so the chlorine measurements increase up to 0.9 ppm. Conversely, when the tank is being emptied, chlorine measurements decrease abruptly to 0.8 ppm due to the increase in water age after being stored inside the tank, resulting in a decrease in chlorine values.
It is important to note that the field tests were conducted in accordance with the tank’s operational rules. It was not possible to extend the field tests in order to preserve the WQ in Modules 1 and 2 as we were trying not to significantly increase the water age in them. Therefore, the field tests were conducted on three alternate days to assess the repeatability of the results without affecting normal system operation.
The analysis of Module 3 indicates that the chlorine value decreases by approximately 0.1 ppm compared to the input value. No fluctuations are observed, resulting in a constant chlorine value.
After studying Module 3 independently, the chlorine evolution at the pipe connection to the rest of the network was analysed with all modules in operation in order to characterise the chlorine evolution at Modules 1 and 2.
Figure 28 shows that in this case, chlorine evolution follows a similar trend to that of Module 3. However, the decrease in chlorine is higher as the storage volume and water age increase.
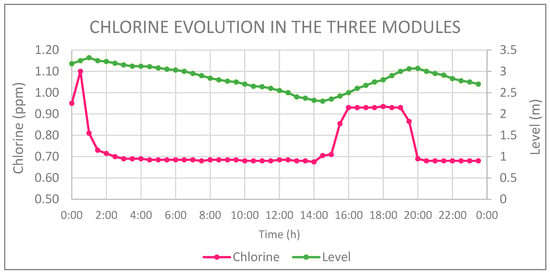
Figure 28.
Tank level and chlorine evolution with all three modules operating.
The experimental analysis indicates that when all three modules are operating, chlorine is reduced by approximately 0.25 ppm, of which 0.1 ppm is reduced in Module 3 and 0.15 ppm in Modules 1 and 2.
The larger decrease in chlorine concentration observed in Modules 1 and 2 may be due to the simplified internal configuration assumed, resulting in a 3750 m3 module with baffles. Guiding baffles reduce stagnation zones and promote higher stored volume renewal, thereby decreasing the total water age of all stored volume. However, because it takes more time to renew a higher volume, an increase in water age at the tank outlet is observed, resulting in a higher decrease in chlorine concentration.
5.4. Epanet Modelling
The purpose of modelling the tank behaviour with Epanet is to theoretically analyse the water age and chlorine evolution inside the tanks and to compare the results obtained with experimental measurements in order to determine the Epanet mixing model that better simulates the observed measurements and confirm whether or not this model matches the model derived from the physical tank characteristics, including the baffles inside Modules 1 and 2.
Figure 29 illustrates the chlorine evolution and tank level for a 48 h simulation using Epanet for Module 3 and all available mixing models.
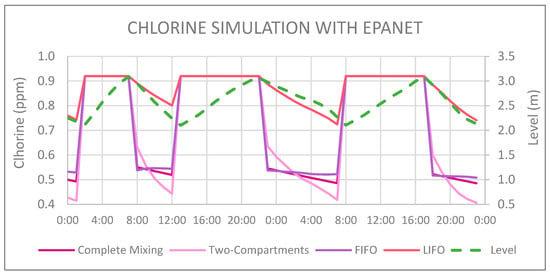
Figure 29.
Simulated chlorine evolution for all mixing models available in Epanet.
The tank behaviour with the three modules was simulated using Epanet to determine the mixing model that best represents reality. As Modules 1 and 2 together have similar characteristics to Module 3, the results obtained are comparable to those of Module 3 alone.
6. Discussion
6.1. Water Age Simulations
The first part of this study focused on the identification and analysis of the main factors influencing water age in tanks.
This resulted in two graphs (Figure 6 and Figure 7) showing the maximum water age as a function of the reservoir’s connections to the network, the reserve and injection volumes, and the supply regime, assuming complete mixing within tanks.
In the case of a tank connected to the network by a single pipe, the water age increases as the supply time and the VRes/VSupplied ratio increase. However, the modulation of the demand curve has little influence on the water age for continuous supply of less than 0.75 days = 18 h, which is the recommended period to have flexibility in the supply schedule. On the other hand, for supply periods longer than 18 h, the water age can increase significantly as the modulation curve smooths.
The independent inlet/outlet pipe configuration gives better results in terms of water age. This configuration allows for higher reserve volumes, which is beneficial for meeting peak demand and emergencies. It is also less dependent on the supply regime, allowing different supply strategies to be implemented, such as optimising the pumping schedule to minimise energy costs, without penalising water age.
In addition to external parameters, the flow behaviour within the reservoir can also impact water age. This is analysed in the case studies in Section 4. The maximum water age is also dependent on the mixing model in all cases.
The first three models, complete mixing, two-compartment mixing, and FIFO plug flow, provide similar maximum times but with different evolutions as they all renew the entire volume in some way.
The LIFO plug flow model has the smallest water age evolution. However, at the top, a remnant remains whose age increases and becomes visible when it is consumed, for example, when the tank is emptied, as shown in Section 4.
6.2. Field Tests
The aim of the experimental tests was to determine which mixing model available in Epanet best reproduces the measurements taken in a real tank. Therefore, the decay amount and the trend of this decay were considered.
Firstly, it is important to note that the simulated chlorine decay for complete mixing, two-compartment mixing, and FIFO plug flow is significantly higher than that observed in field tests. During the experimental phase, a decay of 0.1 ppm was observed, while the simulations resulted in a decay of approximately 0.35 ppm. This indicates a significant difference between the models and reality. Additionally, the simulated and observed chlorine decay for the LIFO plug flow model is similar, at 0.1 ppm. Regarding the decay amount, LIFO plug flow better reproduces reality. This means that as the tank fills and empties from the bottom, only the lower part of the tank is renewed, resulting in stratification in the upper part.
Regarding the decay trend, for complete mixing, two-compartment mixing, and LIFO plug flow, the simulation of chlorine decay shows a descending trend during emptying, which does not correspond to reality. However, FIFO plug flow presents continuous values during emptying without fluctuations, which matches the results observed in field tests. Therefore, in the lower part of the tank, there is an area that behaves like FIFO plug flow.
Thus, it can be concluded that the tank’s behaviour matches the FIFO plug flow model with stagnation in the upper part of the tank. Figure 30 illustrates this behaviour, with stratification in the upper section and FIFO plug flow behaviour in the lower section, where water enters from one side and moves in an orderly manner to the outer section. Unfortunately, this combined model is not currently offered by Epanet, which could be an important improvement for the future given the experimental results observed in our case study.
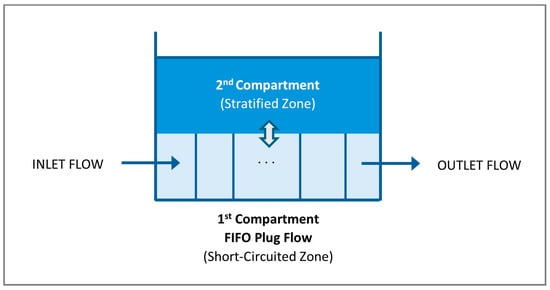
Figure 30.
Schematic of the proposed mixing model.
7. Conclusions
As reviewed in this work, storage tanks can have a significant impact on the WQ that is finally provided to consumers. Therefore, analysing the tank behaviour is crucial during both the design and operation phases.
This paper highlights the impact of various factors on water age, including the tank connections to the network, the supply regime, the ratio of renewed water to reserve volume, and the mixing model.
The present study demonstrates the significance of connecting tanks to the network with one or two pipes, assuming a complete mixing model. The consumption regime only has an impact in specific cases, such as very long supplies and a single-pipe connection to the network.
Moreover, quality and energy savings are often conflicting objectives. One way to address both objectives is to separate the inlet and outlet pipes of the tanks. This approximates the behaviour of a FIFO plug flow model and ensures that there are no retained water volumes as the water age increases. The use of inner baffles can facilitate this behaviour.
However, if the inlet and outlet are located in the lower part of the tank, stratification of the water in the upper parts may occur, as observed in the field test. In these cases, new mixing models should be proposed to adjust the observed behaviour and incorporate it into the simulation software. In the future, we aim to develop a new mixing model and perform its implementation.
Nevertheless, to prevent water from being stored in the upper part of the tanks for long periods of time, it is advisable to feed the tanks from the top and to separate the inlet and outlet pipes.
Finally, to measure the water age of a tank in operation, one can monitor the decay of the concentration of a reactive substance, such as chlorine, as presented in the field test section. The comparison between the concentration of the reactive substance at the tank inlet and outlet can be an indicator of how long water has been in the tank once the decay constant is calibrated. Then, the appropriate mixing model should be adjusted to justify the observed behaviour and determine the necessary measures in cases of excessive time.
Author Contributions
Conceptualisation, F.M.-A. and M.H.; methodology, F.M.-A., M.H. and P.C.; validation, F.M.-A., M.H. and P.C.; formal analysis, F.M.-A., M.H. and P.C.; writing—original draft preparation, M.H.; writing—review and editing, M.H., F.M.-A. and P.C.; visualisation, M.H. and F.M.-A. All authors have read and agreed to the published version of the manuscript.
Funding
This research received no external funding.
Data Availability Statement
The data for the examples presented in this study are available on request from the corresponding author. The data for the experimental case not reported here are not public due to confidentiality reasons because a real network was used as an example.
Conflicts of Interest
The authors declare no conflicts of interest.
References
- Spencer, C. Water quality in the distribution system. A review. J. AWWA 2012, 104, 45–55. [Google Scholar] [CrossRef]
- Grayman, W.; Clark, R.; Harding, B.; Maslia, M.; Aramini, J. Reconstructing Historical Contamination Events. In Book Water Security and Safety; McGraw-Hill: New York, NY, USA, 2004; pp. 10.2–10.55. [Google Scholar]
- Janke, R.; Tryby, M.; Clark, R. Protecting Water Supply Critical Infrastructure: An Overview. In Book Securing Water and Wastewater Systems Global Experiences; Springer-Science: Berlin/Heidelberg, Germany, 2014; pp. 29–85. [Google Scholar]
- Grayman, W.; Mahmood, F.; Roberts, M. Water Quality Calibration. In Book Handbook for Water Distribution Systems Model Calibration; Parault, P., Ziemann, S., Eds.; AWWA: Denver, CO, USA, 2023; pp. 91–111. [Google Scholar]
- Hervás, M.; Martínez-Alzamora, F.; Conejos, P.; Alonso, J.C. Advantages of the Event Method for the Simulation of Water Quality in Pressurised Water Systems. Water 2024, 16, 599. [Google Scholar] [CrossRef]
- Conejos Fuertes, P.; Martínez Alzamora, F.; Hervás Carot, M.; Alonso Campos, J.C. Building and exploiting a Digital Twin for the management of drinking water distribution networks. Urban Water J. 2020, 17, 704–713. [Google Scholar] [CrossRef]
- Rossman, L.A.; Woo, H.; Tryby, M.; Shang, F.; Janke, R.; Haxton, T. EPANET 2.2 User Manual; Water Infrastructure Division, Center for Environmental Solutions and Emergency Response, U.S. Environmental Protection Agency: Cincinnati, OH, USA, 2020. [Google Scholar]
- Vidal, R.; Martínez-Alzamora, F.; Ayza, M. Applications of water quality models in water distribution networks simulation. Ing. Del Agua 1994, 1, 55–68. [Google Scholar]
- AWWA. Computer Modeling of Water Distribution Systems. M32 Manual, 4th ed.; AWWA: Denver, CO, USA, 2017. [Google Scholar]
- Grayman, W. History of water quality modelling in distribution systems. In Proceedings of the 1st International WDSA/CCWI Joint Conference, Kingston, ON, Canada, 23–25 July 2018. [Google Scholar]
- Kirmeyer, G.; Friedman, M.; Martel, K.; Noran, P.; Smith, D. Practical guidelines for maintaining distribution system water quality. J. AWWA 2001, 93, 62–73. [Google Scholar] [CrossRef]
- Grayman, W.; Deininger, R.; Green, A.; Boulos, P.; Bowcock, R.; Godwin, C. Water quality and mixing models for tanks and reservoirs. J. AWWA 1996, 88, 60–73. [Google Scholar] [CrossRef]
- Grayman, W.; Rossman, L.; Arnold, C.; Deininger, R.; Smith, C.; Smith, J.; Schnipke, R. Water Quality Modeling of Distribution System Storage Facilities; AWWA Research Foundation: Denver, CO, USA, 2000. [Google Scholar]
- Mahmood, F.; Pimblett, J.; Grace, N.; Grayman, W. Evaluation of water mixing characteristics in distribution system storage tanks. J. AWWA 2005, 97, 74–88. [Google Scholar] [CrossRef]
- Akuffo, I.; Cobbina, S.J.; Alhassan, E.H.; Nkoom, M. Assessment of the quality of water before and after storage in the Nyankpala Community of the Tolon-Kumbungu District, Ghana. Int. J. Sci. Technol. Res. 2013, 2, 221–227. [Google Scholar]
- Clark, R.M.; Abdesaken, F.; Boulos, P.F.; Mau, R.E. Mixing in distribution system storage tanks: Its effect on water quality. J. Environ. Eng. 1996, 122, 814–821. [Google Scholar] [CrossRef]
- Edwards, J.; Maher, J. Water quality considerations for distribution system storage facilities. J. Am. Water Work. Assoc. 2008, 100, 60–65. [Google Scholar] [CrossRef]
- Kennedy, M.S.; Moegling, S.; Sarikelle, S.; Surava, K. Assessing the effects of storage tank design on water quality. J. Am. Water Work. Assoc. 1993, 85, 78–88. [Google Scholar] [CrossRef]
- Pinheiro, A.; Monteiro, L.; Almeida, M.; Covas, D. Water mixing in rectangular storage tanks: Small-scale versus field tests. J. Hydraul. Res. 2023, 61, 233–248. [Google Scholar] [CrossRef]
- Chalchisa, D.; Megersa, M.; Beyene, A. Assessment of the quality of drinking water in storage tanks and its implication on the safety of urban water supply in developing countries. Environ. Syst. Res. 2018, 6, 12. [Google Scholar] [CrossRef]
- Malinowski, N.; Domingos, S.; Wylie, J.; Morgan, M.J.; Metcalfe, S.; Walsh, T.; Ahmed, W.; Kaksonen, A.H.; Puzon, G.J. Free-living amoeba and associated pathogenic bacteria in well-chlorinated drinking water storage tanks. ACS EST Water 2022, 2, 1511–1520. [Google Scholar] [CrossRef]
- Rossman, L.; Grayman, W. Scale-model studies of mixing in drinking water storage tanks. J. Environ. Eng. 1999, 125, 755–761. [Google Scholar] [CrossRef]
- Pinheiro, A.; Monteiro, L.; Carneiro, J.; Almeida, M.; Covas, D. Water Mixing and Renewal in Circular Cross-Section Storage Tanks as Influenced by Configuration and Operational Conditions. J. Hydraul. Eng. 2021, 147, 04021050. [Google Scholar] [CrossRef]
- Tian, X.; Roberts, P.J. Mixing in water storage tanks. I: No buoyancy effects. J. Environ. Eng. 2008, 134, 974–985. [Google Scholar] [CrossRef]
- Sauner, J.; Maslia, M.; Grayman, W. Storage tank mixing models: Comparison of tracer data with model simulation. In Proceedings of the World Environmental and Water Resources Congress: Restoring Our Natural Habitat, Tampa, FL, USA, 15–19 May 2007; pp. 1–11. [Google Scholar]
- Abrha, B.; Ostfeld, A. Analytical Solutions to Conservative and Non-Conservative Water Quality Constituents in Water Distribution System Storage Tanks. Water 2021, 13, 3502. [Google Scholar] [CrossRef]
- Grayman, W.; Arnold, C. Overview of CFD methods in analysis of distribution system tanks and reservoirs. In Proceedings of the AWWA Annual Conference, Anaheim, CA, USA, 15–19 June 2003. [Google Scholar]
- Gualtieri, C. Analysis of flow and concentration fields in a baffled circular storage tank. In Proceedings of the 33rd IAHR Congress: Water Engineering for a Sustainable Environment, Vancouver, BC, Canada, 9–14 August 2009. [Google Scholar]
- Fard, M.A.; Baruah, A.; Barkdoll, B.D. CFD modeling of stagnation reduction in drinking water storage tanks through internal piping. Urban Water J. 2021, 18, 608–616. [Google Scholar] [CrossRef]
- Ormsbee, L.; Wood, D. Identification of supply source percentages and water age using KYPIPE and KYFSI. In Proceedings of the AWWA Annual Conference, Cincinnati, OH, USA, 1 December 1991. [Google Scholar]
- Grayman, W.; Rossman, L.; Deininger, R.; Smith, C.; Arnold, C.; Smith, J. Mixing and aging of water in distribution system storage facilities. J. AWWA 2004, 96, 70–80. [Google Scholar] [CrossRef]
Disclaimer/Publisher’s Note: The statements, opinions and data contained in all publications are solely those of the individual author(s) and contributor(s) and not of MDPI and/or the editor(s). MDPI and/or the editor(s) disclaim responsibility for any injury to people or property resulting from any ideas, methods, instructions or products referred to in the content. |
© 2024 by the authors. Licensee MDPI, Basel, Switzerland. This article is an open access article distributed under the terms and conditions of the Creative Commons Attribution (CC BY) license (https://creativecommons.org/licenses/by/4.0/).