Article

Geochemical Surveys of Ground and Surface Waters in the Abandoned Hg-Mine of Abbadia San Salvatore (Central Italy): A Preparatory Investigation before Remediation

1
Department of Earth Sciences, University of Florence, Via G. La Pira, 4, 50121 Firenze, Italy
2
CNR-IGG Institute of Geosciences and Earth Resources, Via G. La Pira, 4, 50121 Firenze, Italy
3
S.B.C., Geologi Associati, Via XX Settembre, 78, 50129 Firenze, Italy
4
Unione dei Comuni Amiata Val d’Orcia, Unità di Bonifica, Via Grossetana, 209, 53025 Piancastagnaio, Siena, Italy
5
Parco Museo Minerario di Abbadia San Salvatore, Via Suor Gemma, 1, 53021 Abbadia San Salvatore, Siena, Italy
*
Authors to whom correspondence should be addressed.
Water 2024, 16(9), 1210; https://doi.org/10.3390/w16091210
Submission received: 3 April 2024 / Revised: 19 April 2024 / Accepted: 22 April 2024 / Published: 24 April 2024

Abstract

:
Since 2013, 34 surveys of surface and ground waters within and outside the former Hg-mine of Abbadia San Salvatore (Italy), which is currently under remediation, were performed for determining Hg, As, Sb, and main and minor solutes. The water quality is rather poor since most waters show relatively high Hg concentrations (up to 695 µg/L). Differently, As and Sb only overcome the Italian law thresholds in a few sites. A high geochemical variability was observed for most groundwaters without any clear relationship between wet and dry periods. The main source of chalcophile elements is likely related to: (i) the interaction between meteoric waters and soils contaminated by the previous production of mercury; or (ii) the interaction between meteoric waters and the anthropic filling material of a former paleo-valley near the furnaces edifices. While the remediation is expected to be concluded in 2025, the aquifer contamination still remains a problem. Our investigation, including geochemical/hydrogeological modeling, is prodromal to future activities aimed at reducing the Hg content. Currently, the construction of a hydraulic barrier is apparently the most suitable solution to minimize the interaction processes between water–rock and man-made material, which are responsible for the 10-year concentration variability.

1. Introduction

One of the most important aspects to be considered when dealing with the operation and closure activities of a mining site is related to the presence of contaminated surface and ground water bodies, e.g., [1]. In these environments, the most common contaminants are the Potentially Toxic Metals (PTMs; [2]). The interaction between mine wastes (e.g., tailings, calcines) and meteoric waters indeed causes the pollution of surface waters and shallow aquifers, posing severe risks to the ecosystems and human health. The mineralogical composition of the rocks interacting with rainwater determines the properties of the mine waters [3], and reference therein. Waters affected by mining activities are often acidic, producing Acid Mine Drainage (AMD) [4,5,6]. These waters are generated when rock-bearing ore deposits have a high content of pyrite and/or other metal sulfides [7] and low abundance of carbonate minerals [3], or the weathering of the carbonates is not enough to balance the acidity produced by sulfide oxidation. However, circumneutral mining-derived waters (hereafter, CMW) can also be characterized by high levels of sulfates and dissolved PTMs. Ref. [3] reported that CMW are generated when the host rocks are characterized by equal stoichiometric amounts of pyrite, limestone, and dolomite, along with feldspar, mafic-silicates, zeolite, and/or through mixing processes of different waters [8] and reference therein. The oxidation of metal sulfides is neutralized in situ by dolomite/calcite dissolution, causing elevated concentrations of Ca- and Mg-rich waters and the precipitation of Al and Fe hydroxides/oxides. On the other hand, the resulting high content of dissolved sulfate can be decreased by gypsum precipitation [9]. The remediation of AMD-derived waters can successfully be obtained by biotic and abiotic options, e.g., [10]. A different scenario occurs when CMW groundwater bodies react with gangue minerals, especially in residues where mercury (Hg) is the main contaminant, e.g., [11]. This is the case of the former Hg-mining area of Abbadia San Salvatore (hereafter, ASS) (Tuscany, Central Italy), located in the eastern part of Mt. Amiata, the most recent volcanic structure of the Tuscan Magmatic Province [12]. The ASS mine has been classified as the fourth-largest mercury district in the world [13], and references therein. The ore mineral for Hg production was cinnabar (HgS) and the main gangue minerals were calcite, gypsum, dolomite, dawsonite, and clays [14,15]. More than 100,000 tons of liquid Hg was produced in the Hg district of Mt. Amiata [16] and about 70% of the total production was derived from the ASS mine. The on-going remediation at the ASS mine has not yet interested the surface waters and the shallow aquifer, with the methodological approach to remove mercury andantimony and arsenic, though occurring at a lower extent, still being a matter of debate. According to [17], AMD and CMW waters are one of the most serious causes of the pollution of water bodies. In recent decades, the implementation of contaminant transport and flow models in groundwater has gained increasing relevance [18] for the remediation processes of contaminated sites. This is crucial for defining and designing interventions aimed at securing and remediating groundwater [19].
The main aims of this work are to: (i) geochemically characterize the surface and ground waters, after 10 years of surveys mostly carried out on a seasonal basis, within and adjacent to the mining area, with a particular focus on mercury, antimony, and arsenic, whose concentrations were often above the threshold values defined by the European Community (1, 5, and 10 µg/L, respectively), as evidenced by a preliminary investigation carried out by [11]; (ii) conduct geochemical modeling by means of PHREEQC 3.5.0 software [20] to speciate Hg, As, and Sb and determine whether the three chalcophile elements were preferentially partitioned in solution or co-precipitating with other minerals; and (iii) present a water flow and Hg transport model, preparatory to the remediation actions to be undertaken in the near future on surface and ground waters of the ASS mine.

Study Area and Brief Hydrogeological Outlines

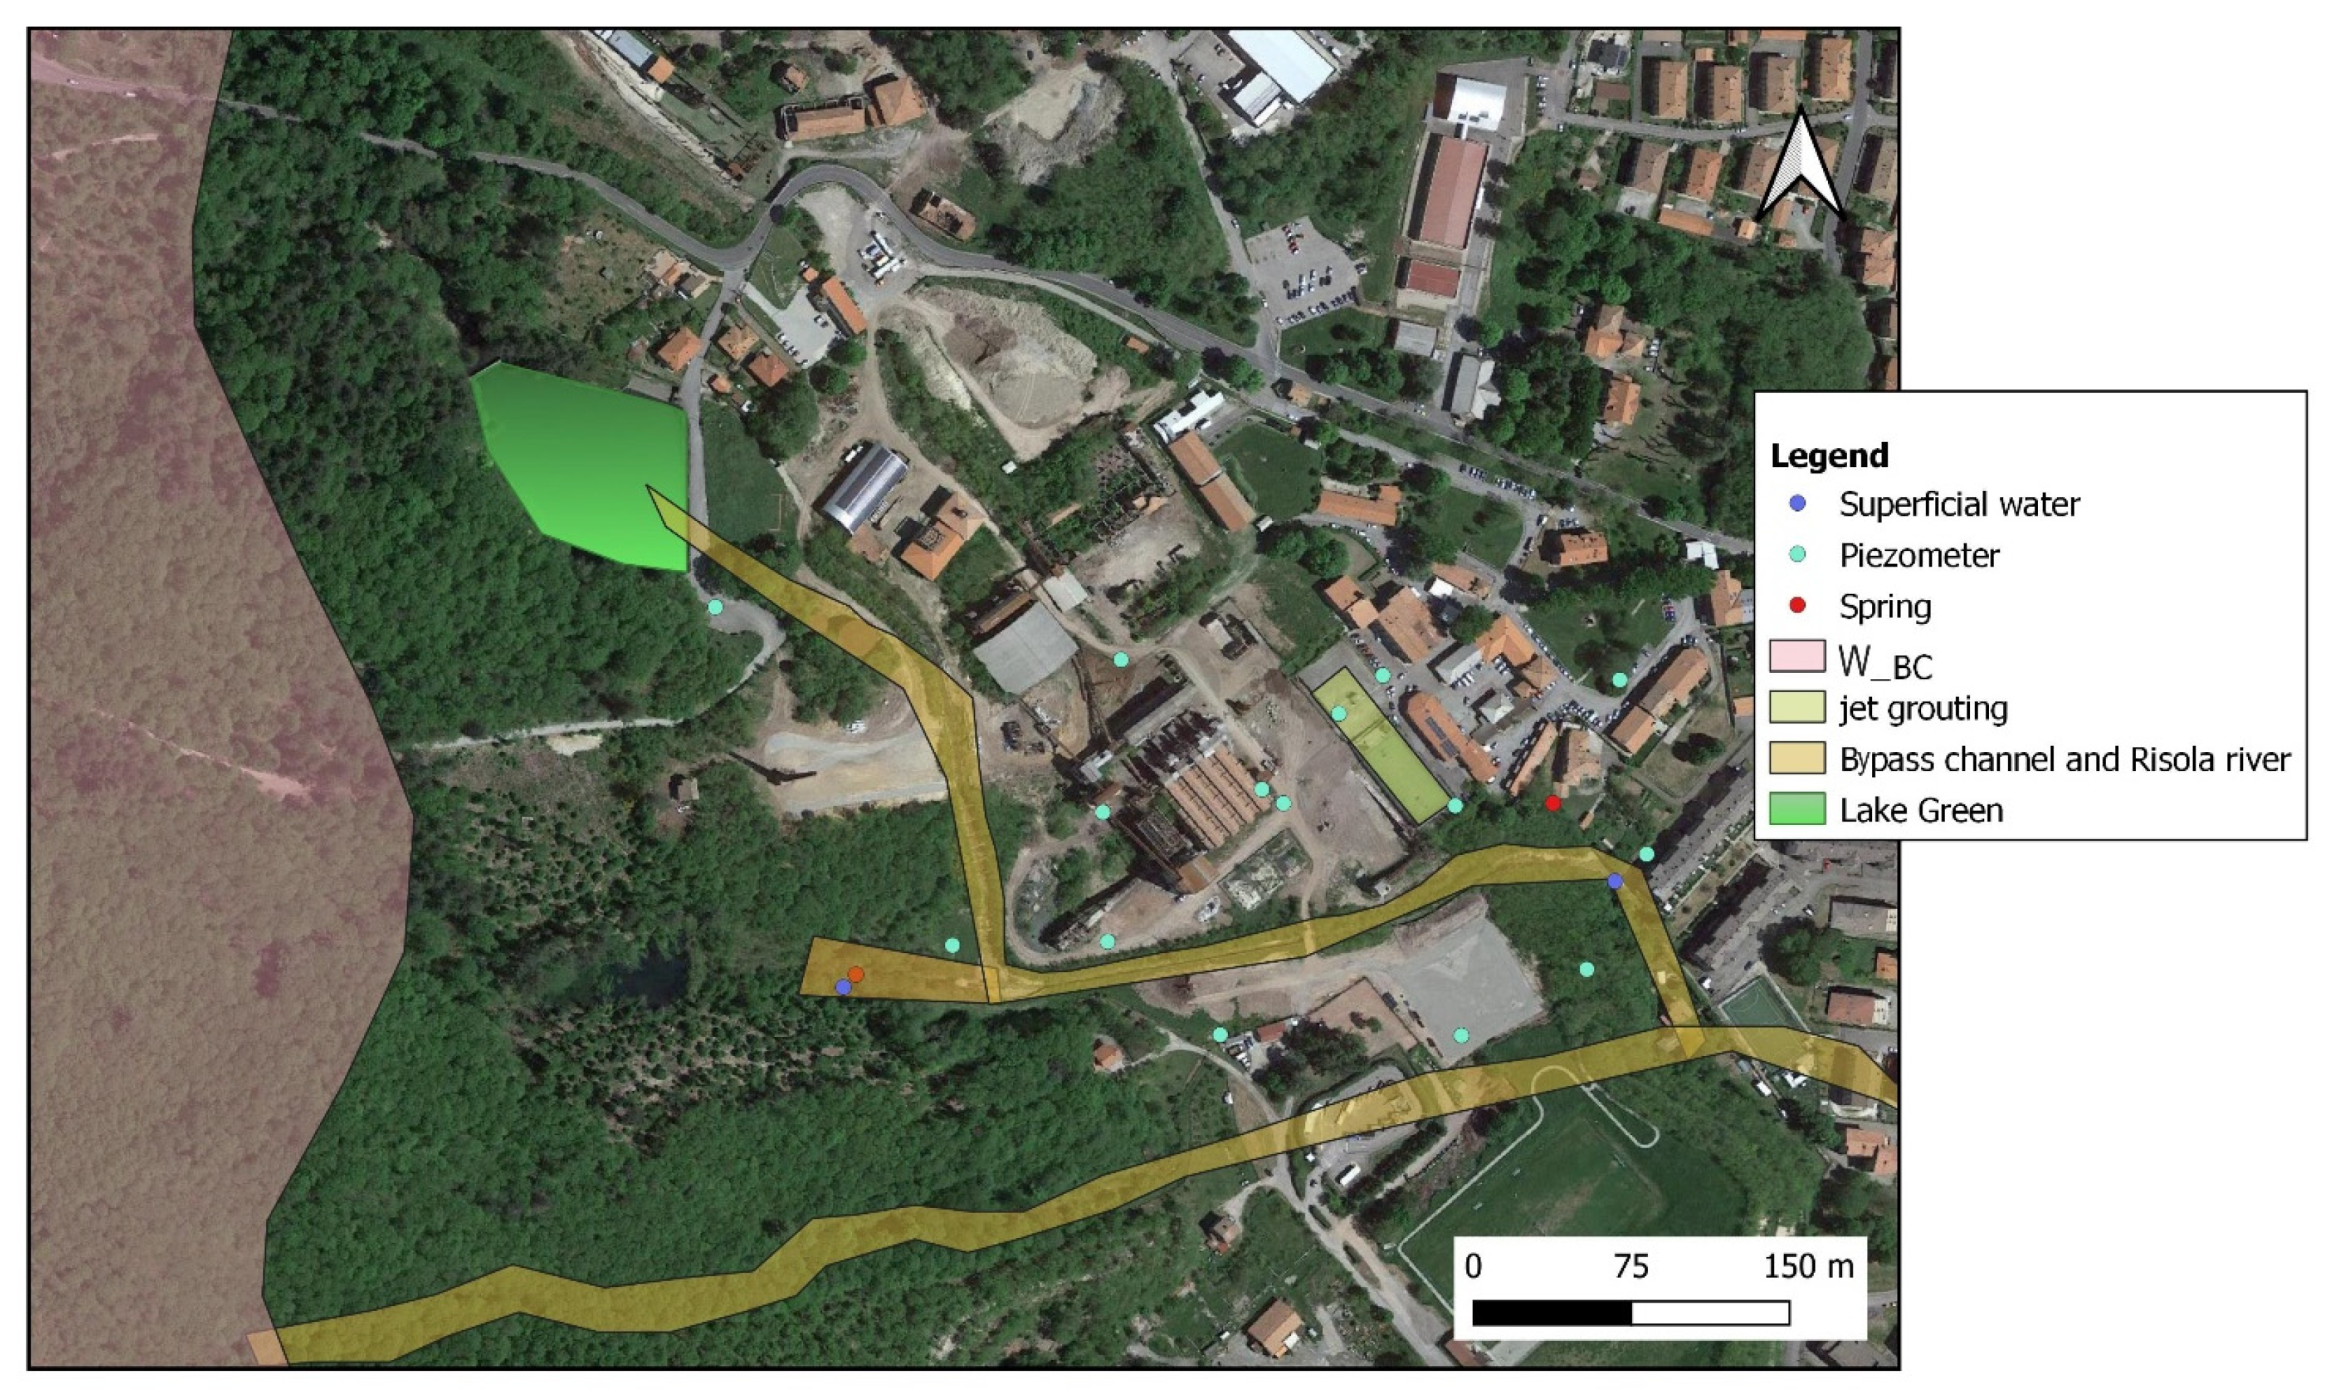
The former Hg-mining area of ASS is located a few km NNW of the homonymous town (Figure 1) and lies on the volcanic products of Mt. Amiata (300 to 200 ka; e.g., [12]). The mine definitively shut down in the early eighties when the demand for mercury abruptly decreased mostly due to its toxicity. In 2007, the very first reclamation project to avoid the contamination of the local aquifer took place. A physical barrier was built with an impermeable cover that extended down to a 15 m depth using the jet grouting technique on a small area (roughly 4500 m2) belonging to the local municipality and located in the central-eastern part of the mining area [11]. In 2008, the mining concession passed from ENI (AGIP Division) to the Municipality of ASS [11]. Currently, the mining complex covers about 65 ha (Figure 1) and was divided into seven different sectors based on the increasing Hg concentrations of the environmental matrices, mainly from north to south [21,22,23]. The most contaminated portion (Sector 6, Figure 1) is situated in the southern part of the mine, where Gould and Nesa furnaces, condensers, driers, and other mining facilities are also located. The old owner of the mining concession drilled several piezometers to monitor the shallow aquifer. Some of them were destroyed or cemented. In 2013, remediation activities took place, during which a by-pass channel, to convoy the meteoric waters with the aim of decreasing their interaction with the contaminated soils, was built, e.g., [11]. Since 2013, inside and outside the mining area, new piezometers were drilled and a periodical geochemical survey started to verify the quality of the groundwater system and the degree of contamination due to Hg, As, and Sb.
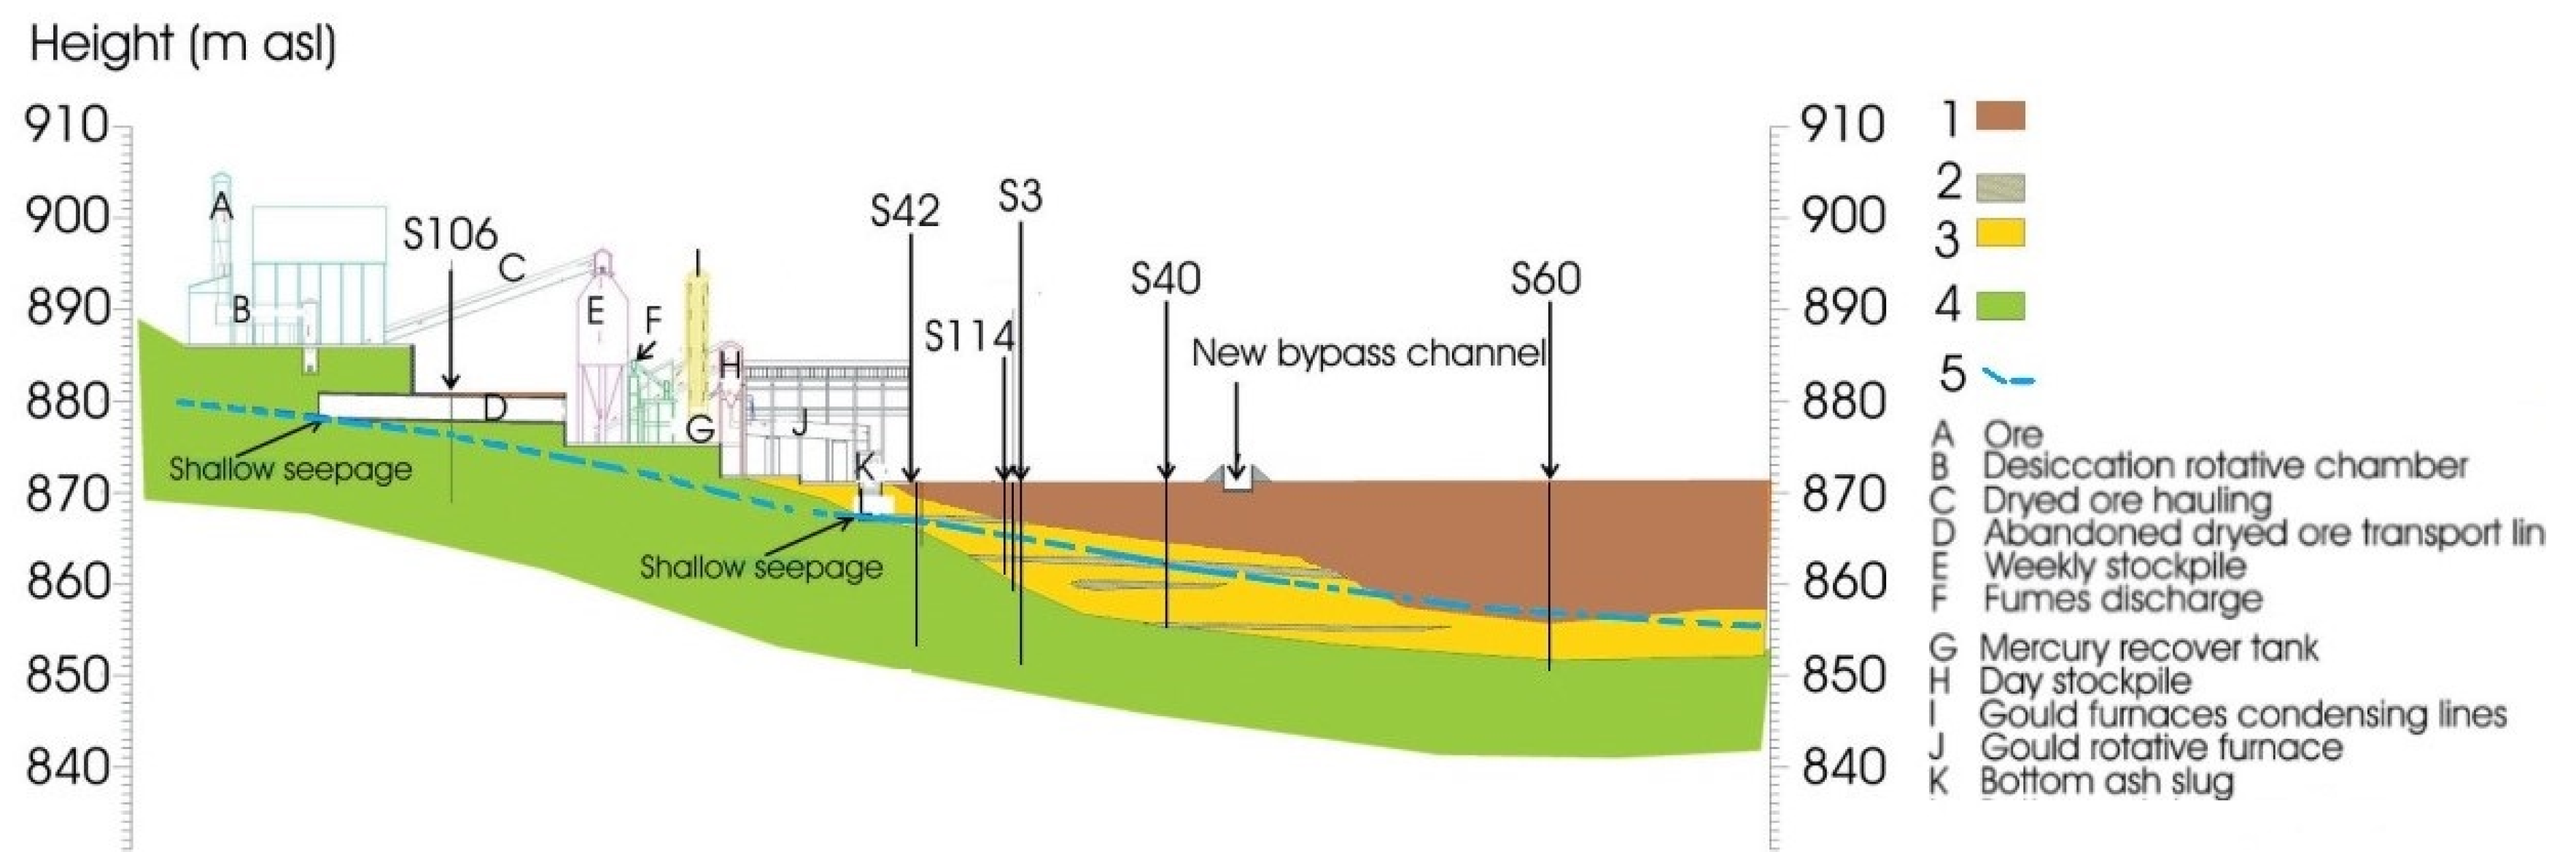
A schematic geological cross section (NW-SE) and the groundwater surface of the mining area (modified after [11]) were reconstructed according to piezometer logs (Figure 2). The mining complex is mostly located in the NW sector of the area, above the altered trachyte products of the Mt. Amiata volcanic edifice. The furnace buildings are above the volcanic products and fluvio-lacustrine deposits (remnants of a paleo-valley), the latter overlying the volcanic material and characterized by intercalations of organic clays and silts. The paleo-valley was partly filled by coarse gangue. Here, fragments of bricks and concrete were found during the piezometers’ drilling. Occasionally, Hg droplets were also recovered [11]. Overall, the filling material (up to 15 m depth), mostly dominated by anthropogenically derived material, is located in front of the edifices hosting the Nesa and Gould furnaces (Figure 2).
The artificial canal (ca. 3 m deep; Figure 1 and Figure 2) was built between 2013 and 2014, during which several thousand cubic meters of soils and altered volcanic material were excavated. Apparently, the water chemistry of the shallow aquifer was not significantly affected by the earthworks. One of the most important operations carried out in Sector 6, from March 2021 to July 2023, was the reclamation of the chimney area (Figure 1), from where the exhausted fumes, after the production of liquid Hg, were convoyed through two underground gas pipelines. During the removal of the subterranean tunnels, liquid Hg was found in the soil and high concentrations of gaseous Hg (>20,000 ng/m3) were measured in the air. This area located to the NW of the condensers was covered with 70 cm of concrete and then impermeabilized. Afterward, the concentration of gaseous Hg in the air dramatically decreased to about 100 ÷ 200 ng/m3 (A. Esposito and F. Piccinelli, personal communication). In 2023, the edifice hosting the Nesa furnace as well as the furnace was cleaned, whereas that of the Gould furnaces is expected to be concluded by summer 2024. A severe cleaning operation of the condensers connected to the Nesa and Gould furnaces was initiated in September 2022 and ended in May 2023. The condenser pipelines were then permanently sealed, since after the cleaning activity the concentration of gaseous Hg remained high (>5000 ng/m3). A dump was built in the southeastern portion of Sector 6 to store the contaminated materials with no archeometallurgical value derived from excavations, demolitions, and cleaning. This fully impermeabilized dump will accommodate up to 10,000 m3 of material. Once the reclamation operations have been terminated, the entire mining area will be remodeled. Eventually, the capping of the external ground will minimize the water–soil interaction and the water seepage. One of the most critical points to be solved is related to the surface and underground waters, since preliminary investigations carried out in 2013 and 2014 evidenced relatively high contents of Hg, As, and Sb [11]. Moreover, negative effects suffered by the water bodies due to the remediation operations and earthworks on the ground of the mining area are likely. Presently, a hydraulic barrier characterized by three to five pumping wells is planned, whereas how to treat the waters is still matter of discussion. Consequently, it is important to geochemically characterize the waters and verify the compositional variability of the potential contaminants on a seasonal basis to both locate the hydraulic barrier and define the amount of water to be treated.
The climate regime around the Mt. Amiata volcano is typical of a temperate sub-Mediterranean environment [24], and reference therein. Located in a remote area, the mountain is a massif that may intercept perturbation mainly from the Atlantic Ocean to the west and the Mediterranean region to the south and, subordinately, to NE Europe. The most common winds are from the west (in autumn and spring) and south-east (in winter) [24]. At the summit, the annual average temperature is from 6.8 °C to 12.6 °C (the Abbadia San Salvatore weather station TOS111000114 [25]). The average annual rainy days are up to 130 (in 2018), yielding rainfall amounts of around 1200 mm/year [26]. In 2019, precipitations at ASS (822 m a.s.l.) reached 1996 mm/yr (weather station TOS111000114 [25]). During winter, the top of Mt. Amiata has a snow cover that may last for about three months. According to [27], every year, the shallow aquifer receives a significant replenishment from the melting of the snow cover.
Hydrogeological studies carried out by [28] in the study area showed a shallow seepage of about 6 m (Figure 2), which refers to the shallow aquifer present in the ASS mine. The authors of [28] also reported that mining activities significantly affected the underground water circulation. The CMW from Galleria Italia (hereafter GIT) are indeed considered the main drainage of the mining galleries. Moreover, the ASS shallow aquifer is of a limited thickness and appears to be substantially disconnected from the main Mt. Amiata aquifer, the latter supplying good quality waters to several municipalities in southern Tuscany and northern Latium.

2. Sampling and Analytical Methods

During the ten years of water monitoring (from 2013 to 2023), periodical surveys of waters from piezometers (S101, S102, S106, S108, S109, S111, S113, S118, S2est, S6N, S1N, S60, S42, S120, S124, and S128), springs (SR8, SR10A, and GIT), and surface waters (GRN, VAL, and VIV) were carried out. The depth of the piezometers is between 15 and 20 m, with the only exception of S128 (42 m depth), whilst the water level follows the local morphology since it decreased from north to south. Generally, water sampling was carried out every four months (January–February, April–May, and September–October) to evidence possible variations due to wet and dry periods. The location of the sampling sites is reported in Figure 1. The piezometers S60, S42, and S124 are positioned close to the mining structure, while the others, except for S1N, S2EST, and S6N which are situated near the area where the reclamation process was completed in 2007, are distributed upstream (e.g., S101 and S102) and downstream (e.g., S60 and S111) of the mining area. The groundwater flow is WE-oriented [11], up to remnants of the Spirek and Cermak–Spirek furnaces and then shifts to SSE, though it is impossible to rule out interferences with a NE-SW-oriented water flow, which could have an impact on some of the collected waters (i.e., S107, which has not been sampled since 2016). As far as the springs are concerned, SR8 and SR10A are small water discharges located in eastern and western portions of the mining area, respectively, the former draining some old mine galleries. The surface waters comprise a local creek (VAL) and two small lakes (Goroncino, GNR, and Muraglione, VIV).
A portable universal phreatimeter reel with a circuit board equipped with an acoustic signal when the probe touches the water was used to measure the water table depth before the water sampling. A submersible pump connected to a 12V battery was used to sample the piezometer waters under dynamic conditions. Before sampling, the volume of the tube connected to the pump was discharged at least three times. However, occasionally, this operation failed because some piezometers were not able to dispense enough water and four to twelve hours were necessary before recovering a sufficient amount of water. In other cases, trucks and bulldozers used for remediation inside the mining area destroyed some of the pre-existing piezometers, e.g., S106 was demolished in January 2022 and rehabilitated in June 2023.
Four filtered (0.45 µm) aliquots were collected at each site and transferred to double-sealing polyethylene bottles with insert caps or dark glass bottles. The first one (125 mL) was used to analyze major and minor anions (HCO3, Cl, SO42−, NO3, and F) as well as NH4+. The second aliquot (50 mL) was acidified with 0.5 mL of Suprapur HCl for the determination of the main cations (Na+, K+, Ca2+, and Mg2+). The third aliquot (50 mL) was acidified with 0.5 mL of Ultrapure HNO3 for the analysis of As, Sb, Al, and Fe. The first two elements were analyzed by ICP-MS at the C.S.A. Laboratories of Rimini up to September 2021 and at the Laboratories of the Department of Earth Science of the University of Florence (DST-UNIFI). From September 2021, Al and Fe were analyzed at the laboratories of DST-UNIFI. Finally, the last aliquot (50 mL) was transferred to a dark glass bottle for the analysis of Hg. Before sampling, each bottle was cleaned with MilliQ water and left overnight after adding 5 mL of concentrated HCl (37%). Eventually, they were abundantly rinsed with MilliQ water. After drying, 0.5 mL of Ultrapure HCl or Ultrapure HNO3 (according to the expected Hg concentrations) were added. The waters were filtered at 0.45 μm.
The temperature (°C), pH, electrical conductivity (E.C., in μS/cm), and redox potential (Eh, in mV) were determined in the field with a portable multiprobe HI98194. Except for NH4+ and HCO3, which were measured by molecular spectrophotometry using the Nessler method and by acidimetric titration, respectively, ion chromatography (761 Compact IC-Metrohm and 861 Advanced Compact IC-Metrohm, respectively) was used to analyze the main anions and cations. The analytical error was <3%. From 2013 to 2018, dissolved Hg was analyzed at the C.S.A. Laboratories of Rimini according to the EPA 254.1 (1994) method. From October 2019, a new method was set up using a Lumex RP-92 [29] connected to a Lumex RA-915M, whereas from November 2022, the method to analyze dissolved Hg (HCl-acidified aliquot) was improved by combining the Lumex RA-915M with a Lumex-Pyro 915+ (Meloni et al., in prep.) when the concentrations were >2 µg/L (HNO3-acidified aliquot). The detection limits for As, Sb, Al, and Fe were <0.1 µg/L, while for Hg it was <0.1 µg/L (C.S.A. Laboratories of Rimini, Italy) and 10 ng/L (DST-UNIFI and CNR-IGG mercury laboratory, respectively). The analytical error for the three trace elements was <10%.

2.1. Geochemical Modeling with PHREEQC

The pH and Eh values and the concentrations of major cations and anions, Hg, As, and Sb in some selected waters were modeled using the geochemical code PHREEQC version 3.5.0 [20] to estimate the aqueous solution speciation. The calculation of the equilibrium between aqueous solutions and minerals, gases, solid solutions, exchangers, and sorption surfaces constitutes the foundation of the PHREEQC geochemical code. Depending on the database used, PHREEQC implements a variety of aqueous activity models. The great majority of these models use the Davies equation, also known as the B-Dot activity model, as the Lawrence Livermore National Laboratory model [30] and WATEQ4F [31]. In the present study, the thermodynamic properties of some minerals relevant to our simulations were checked and eventually added to the PHREEQC minteq.v4, a database used by [13] and derived from MINTEQA2 version 4 [32,33] that uses the B-Dot activity model. The pe was calculated considering Eh. For the water samples with high concentrations of As, Sb, and Hg (S1N, S6N, S2EST, SR10A, S113, S2EST, GRN, S118, and S124), the Saturation Index (SI) calculated as the log(IAP)/Ksp, where IAP is the Ionic Activity Product and Ksp is the constant of the solubility product of selected minerals, was calculated and utilized to describe the water equilibrium state with respect to the mineral phases. Since September 2021, the concentrations of Fe and Al were also measured. These were used to improve the computing of element speciation and SI, taking into account Al-silicate minerals and Fe-oxy-hydroxides, as well as Fe-bearing minerals that could be a sink e.g., Sb [34]. Since no silica concentrations were determined, the Fourier geothermometer was used, which reports the solubility of quartz/calcedony as a function of temperature [35] to compute a theorical abundance of silica.

2.2. Flow and Hg Transporting Modeling with ModFlow 6.4.2

To create the flow and transport model, the ModFlow 6.4 [36] software with the ModelMuse graphical interface was used. The boundary conditions (BC) were selected according to [37], utilizing the Dirichlet BC. The term “constant-head conditions” is used where the hydraulic head values are constant (or piecewise constant) in time and space. Dirichlet BCs represent the influence of surface water bodies within groundwater models, for situations where the hydraulic head imposed on the groundwater system can be assumed independent of subsurface flow variations. In our case, the polygons to the west of the study area (pink in Figure 3) and Lake Green to the north of the mine (green in Figure 3) represent the recharge area. Subsequently, the Boundary Conditions for the main creeks within the study area, including the by-pass channel that convoys the main surface waters and springs, were defined with different hydraulic heads along the flow path.
Since the flow rate of the spring discharges and surface waters was not directly determined, an average flow rate of 0.1 L/s was attributed according to the field observation. The boundary conditions are represented in Figure 3.
Three periods were evaluated for the simulation: (i) steady state; (ii) a 6-month transient representing the wet period; and (iii) another 6-month transient representing the dry period. For the modeling of the subsoil and the layer in which the aquifer is included, the results of old core drilling carried out in the mining area were used, which revealed three layers: (i) soil, tailings, and paleosoil (12 m thick); (ii) altered trachyte; and (iii) trachyte (total thickness of 20 m). The model also requires a transmissivity value (T) of the soil. Based on the recharge times of some piezometers, a value of T = 2 × 10⁻⁶ m/s was estimated [38]. A low transmissivity value of 8.2 × 10⁻⁷ m/s [38] was assigned to the area corresponding to the jet grouting (15 m thick, yellowish in Figure 3). As reported below, As and Sb were considered less impactful from an environmental point of view since only occasionally they showed concentrations higher than thresholds imposed by the European Community directives for the groundwater of 10 and 5 μg/L, respectively. Consequently, the transport model was limited to Hg. The concentration of dissolved Hg measured in the dry and wet periods was required and then assigned to the piezometer, with no source flow as the constant value, as a mass input to the springs. A background value of 0.1 µg/L was assigned to the modeled area and to BC. Lake Green BC had a measured value (0.1 µg/L) and was used for the model, which was run according to the contents determined during the last year of sampling.

3. Results

The minimum, maximum, mean, and median values of temperature (T), electrical conductivity (E.C.), pH, redox potential (Eh), water table depth (piezometers), and those of the main anions and cations, As, Hg, and Sb, and Al and Fe for each sampling site are reported in Table 1, Table 2, Table 3, Table 4 and Table 5, respectively, whereas the whole dataset is reported in the Supplementary Materials Files S1 and S2. The temperatures changed with the season, with the highest values measured during the dry period (Tables S1–S22—Supplementary Materials File S1). The pH resulted in being slightly acid to neutral (5.9–7.9), except for some piezometers (e.g., S2EST, S1N, S101, S108, and S6N) whose waters occasionally showed more alkaline pH values (up to 11.3). No clear relationship with the sampling period was observed for the pH as well as the E.C., the latter showing large variability (from 60 to 1771 μS/cm) within each survey. Regarding the Eh values, a relatively large amount of variability was observed, since it varied from very negative (e.g., S1N in October 2020) to highly positive (e.g., S2EST during January 2022). The main cation was Ca2+ with concentrations of up to 534 mg/L (S120 during June 2018), followed by Na+ + K+ and Mg2+, the highest contents being of 108 mg/L (S42 during January 2021) and 43 mg/L (S108 in January 2020), respectively. Sulfate and bicarbonate were the main anions with concentrations of up to 1398 (S120 in June 2018) and 244 (S42 in October 2020) mg/L, respectively. Chloride and NO3 always showed concentrations < 50 mg/L, while those of NH4+ were between <0.01 and 2.5 mg/L, except GIT, whose abundance was up to 3.5 mg/L (May 2020). Finally, those of F and Br did not exceed 2 and 3.5 mg/L, respectively. As previously described, the concentrations of Al and Fe were determined from September 2021 onward. The minimum content of Al and Fe in all analyzed waters always turned out to be higher or equal to 0.1 µg/L, but with significant spatial and temporal variations.
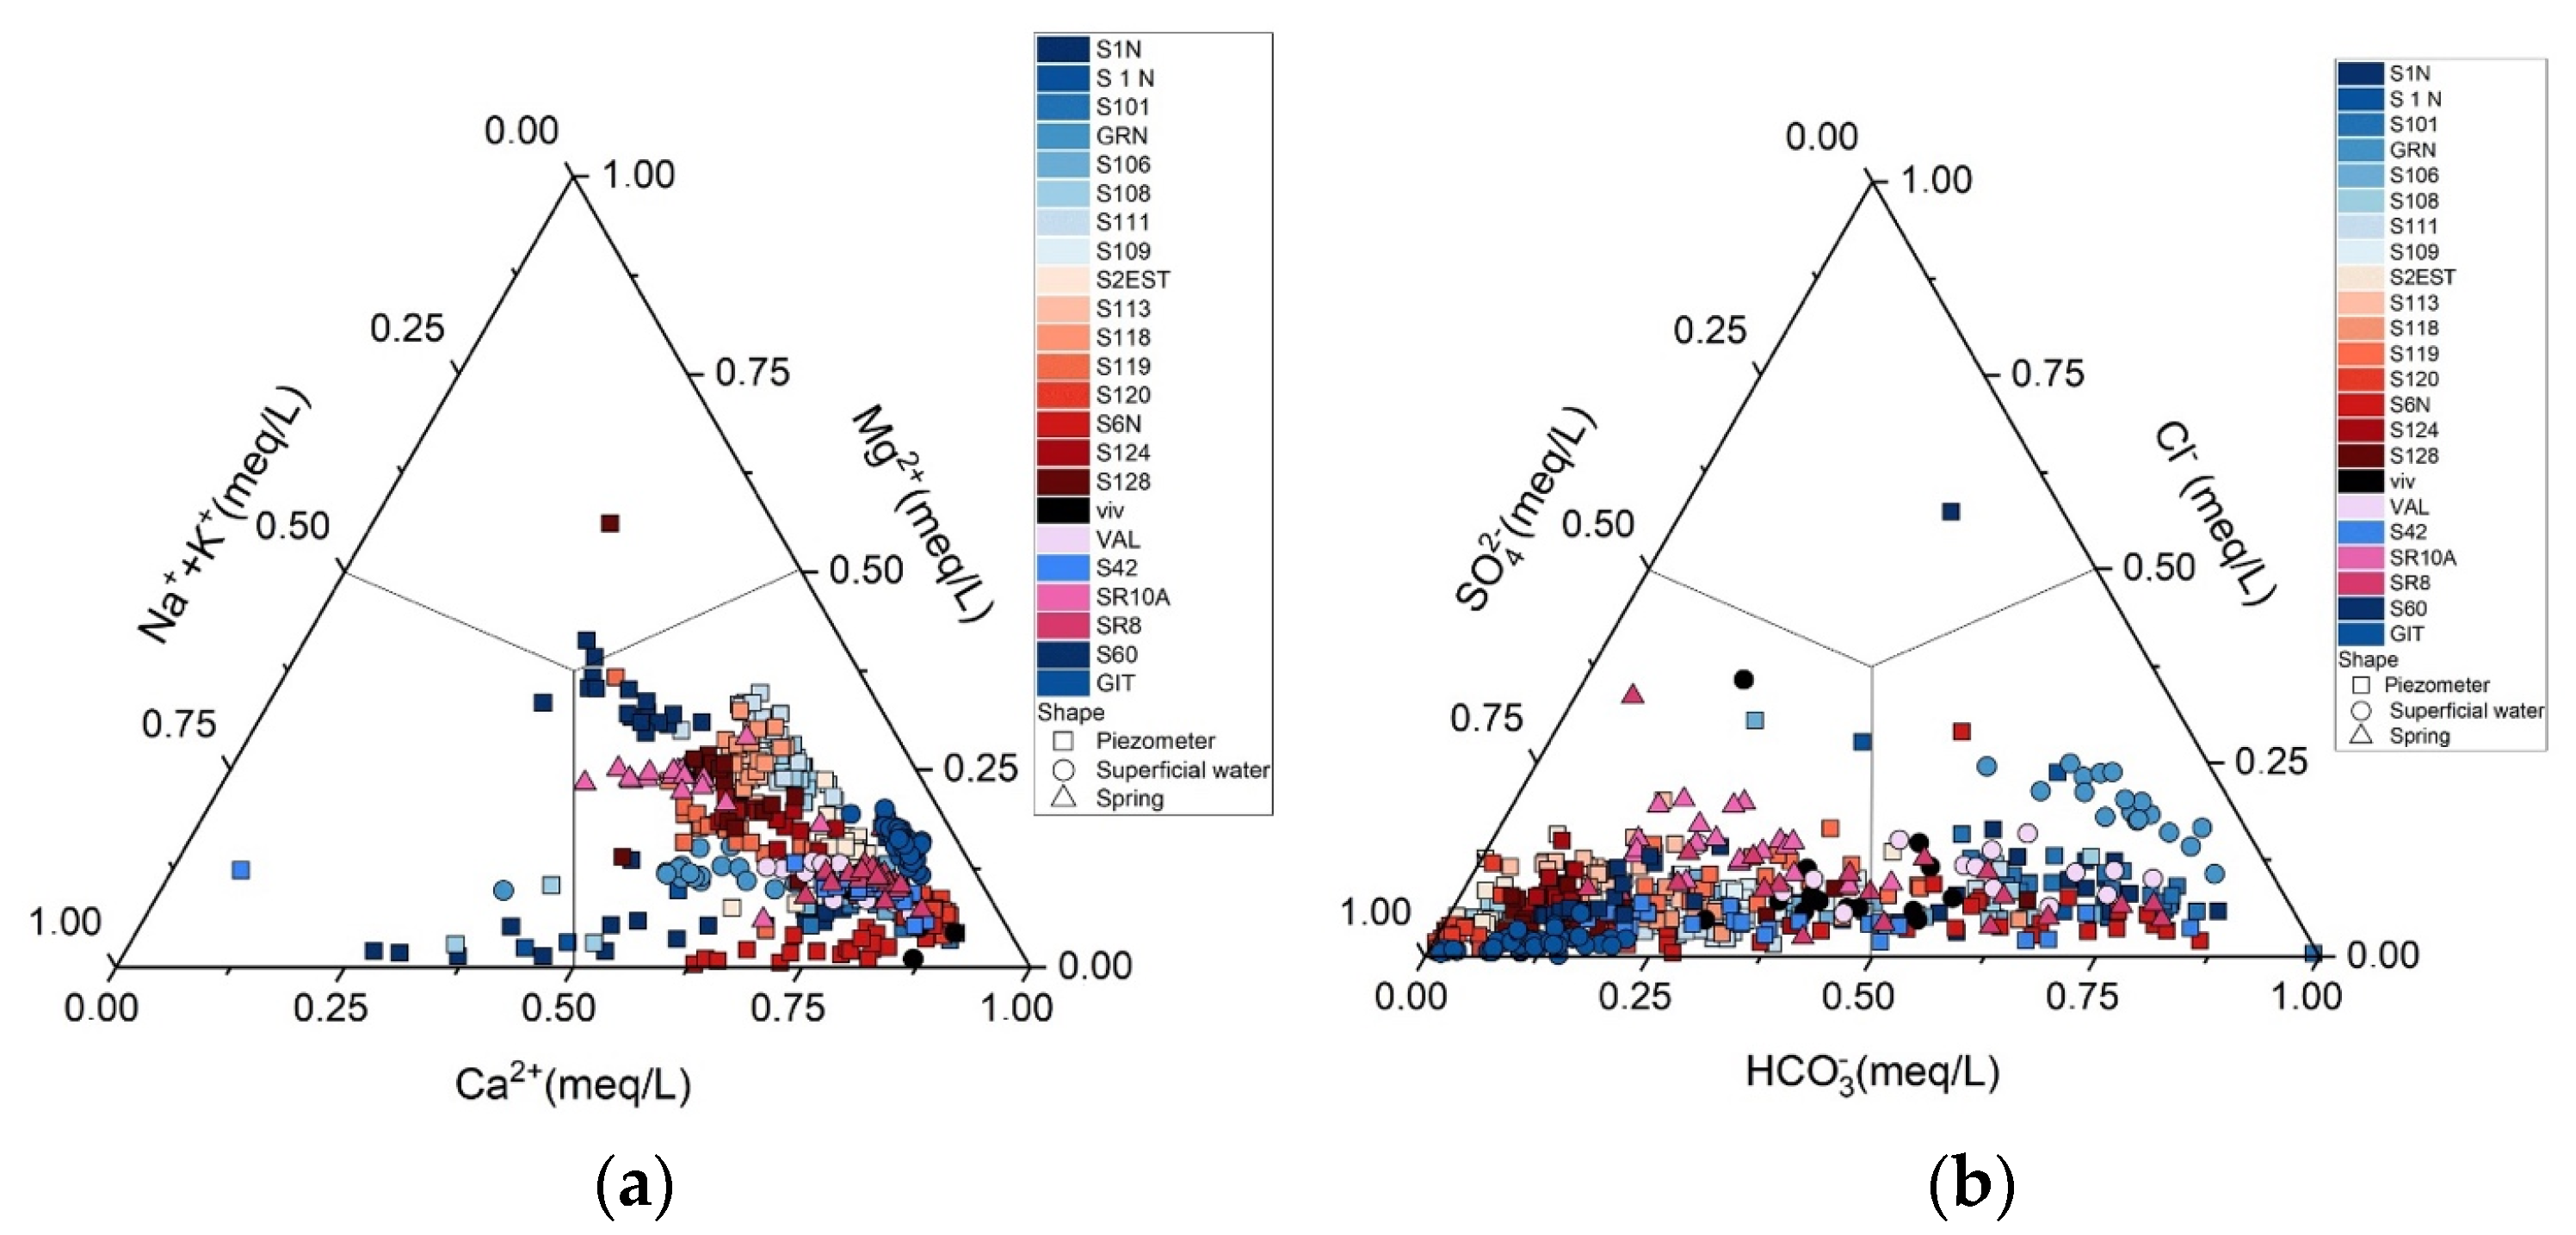
From a classification point of view, most ASS waters can be regarded as CMW and characterized by three geochemical facies (Figure 4): (i) Ca(Mg)-SO4, which was the prevailing composition (S113, S120, and S124 preserved this geochemical facies in time), (ii) Ca(Mg)-HCO3 (S101 is the only water that maintains this composition over time), and (iii) (Na+K)-HCO3. In most cases, the arsenic concentrations were below the European Comunity (hereafter, EC), although a few exceptions were related to the GIT sample (>10 µg/L in almost all surveys), S2EST, and S6N in 2013 and 2014 (up to 12.8 and 14.9 µg/L, respectively). The Sb concentration of 5 µg/L was exceeded in the waters collected from the piezometers within the mining area (S1N, S6N, S42, S106, S118, and S124). During the 10-year-long survey, all waters from piezometers, springs, and streams had, at least once, a Hg content > 1 µg/L. Strikingly high Hg concentrations, i.e., 456, 695, and 298 µg/L, were measured in the waters from S2EST, S6N, and S124 in May 2014, January 2014, and September 2021, respectively. It is worth noting that after the construction of the bypass canal, the concentrations of As, Sb, and Hg of the waters within the mining area decreased, indicating its effectiveness in reducing the water–rock/soil interaction [11]. For all the waters collected outside the mining area (e.g., S101, S109, S111, and VIV), the contamination threshold for As and Sb was never overcome, whereas it occurred, though sporadically, for Hg (e.g., S101 and S109 in 2019).
The highest concentrations of Al and Fe were found in GIT (up to 6596 µg/L in May 2023 and 32,100 µg/L in May and October 2016, respectively). High contents of Al (>1000 µg/L) were measured in the waters collected from S120 and, occasionally, S1N (September 2022 and June 2023). Conversely, a high concentration of Fe (>1000 µg/L) was found in the S128 waters, except in June 2023 (16 µg/L).

4. Discussion

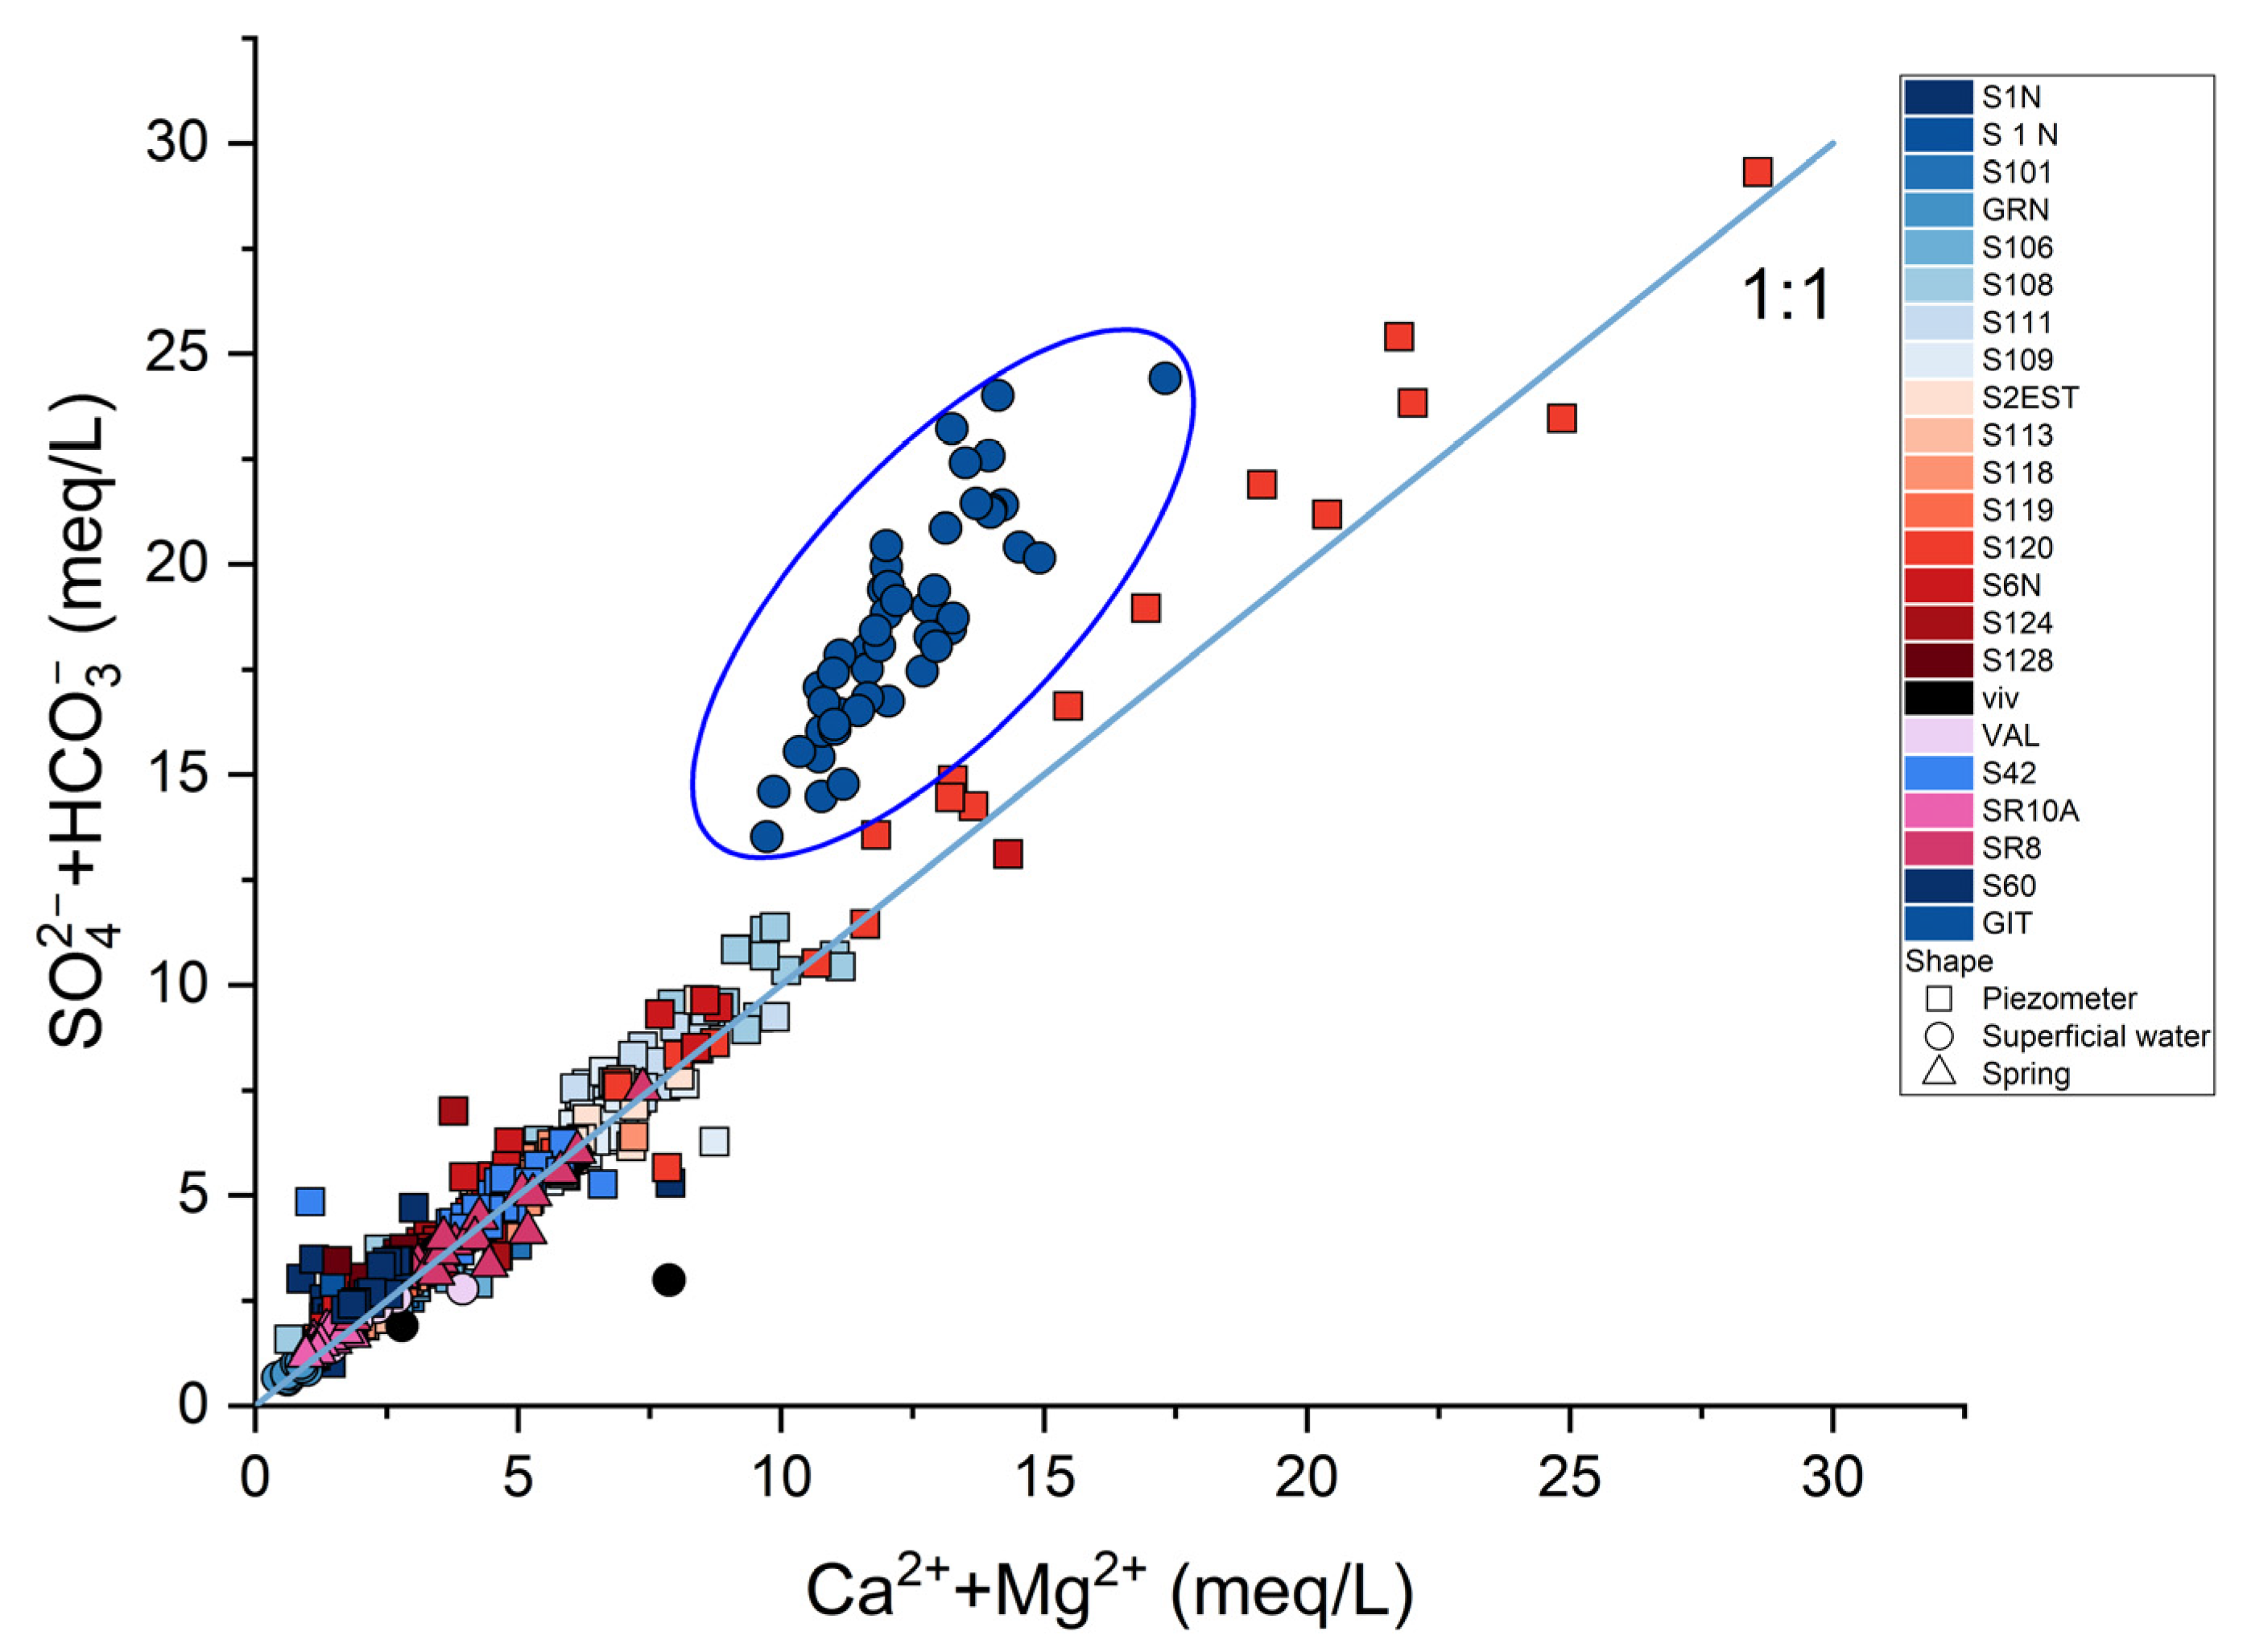
As previously reported by [11], the area of Sector 6 is relatively small (500 × 500 m), but a large compositional variability has been observed over the years. Only a few waters indeed maintained the same composition from 2015 to 2023: S101 and GRN (Ca(Mg)-HCO3) and S113, S120, and S124 (Ca(Mg)-SO4). Setting aside S1N, which showed a relatively large temporal variability (Ca-HCO3 and Ca-SO4, and Na-HCO3 in February 2013, May 2014, January 2017, January 2021, April 2021, May 2022, and October 2022), and, to a minor extent, S108 (February and September 2013), GRN (May 2015), and S42 (January 2021), the other waters modified their composition from Ca(Mg)-SO4 to Ca(Mg)-HCO3. The Ca(Mg)-SO4 waters generally showed high E.C., though always below 2200 μS/cm. The bicarbonate and sulfate earth alkaline waters are related to water–rock interaction processes between meteoric waters and carbonate (mainly calcite) and sulfate (e.g., gypsum and anhydrite) minerals. This is also supported by the SO4+HCO3 vs. Ca2++Mg2+ binary diagram of Figure 5, where all the samples approach the stoichiometric line, with the exception of those collected from Galleria Italia (GIT—black circle in Figure 5) due to a significant increase in SO4, likely resulting from oxidation processes of poly-metallic sulfides.
The Na-HCO3 waters are instead rather scarce. The enrichment of Na with respect to Cl is likely related to incongruent dissolution processes of silicate minerals [39]. However, the origin of the geochemical composition of piezometer S1N remains unclear. In the past, unpleasant odors were recognized, possibly associated with sewage waters mixed with those of the piezometer. The negative Eh values are likely indicative of the presence of wastewaters, although the source of contamination has still not been recognized.
As stated above, the concentrations of As and Sb dramatically decreased after the construction of the bypass canal, whereas the decrement of Hg was more smooth. The behavior of the chalcophile elements in the GIT waters was slightly different when compared to the other waters. The mercury, As, and Sb contents indeed remained relatively constant with time. The GIT waters are indeed a mixture of the waters draining all the mine galleries, thus the geochemical composition results in being less affected by seasonal variations. The concentrations of As vs. those of Sb (in μg/L) are reported in Figure 6. The relatively high content of As (>10 μg/L, circle in Figure 6) is typical of waters circulating within the Mt. Amiata volcanic rocks [40]. Waters with Sb concentrations >5 μg/L were numerically greater than those showing As >10 μg/L and only refer to a few piezometers, e.g., S1N, S6N, S42, S106, S118, and S124 (Figure 6), which are located close to waste mining materials from other mines (e.g., Morone and Siele) containing a significant amount of stibnite, realgar, and orpiment [41]. Except for S106, where the Sb contents resulted in being >5 μg/L until January 2017, followed by a significant decrease, those of S6N and S1N remained almost constant over time. A persistent content of Sb >5 μg/L was instead found in the S118 sample in January 2022. Samples S124 and S42 Sb only occasionally had concentrations higher than 5 µg/L, 17.5 and 8.9 µg/L, respectively (January 2023), and 7.7 µg/L only for S124 (May 2019). In October 2021, the slag-rich terranes were reclaimed and stored in the special waste dump built within the mining area. The presence of As- and Sb-sulfides is also supported by the positive correlation between Sb and As when waters from the piezometer S118 are considered (inset of Figure 6).
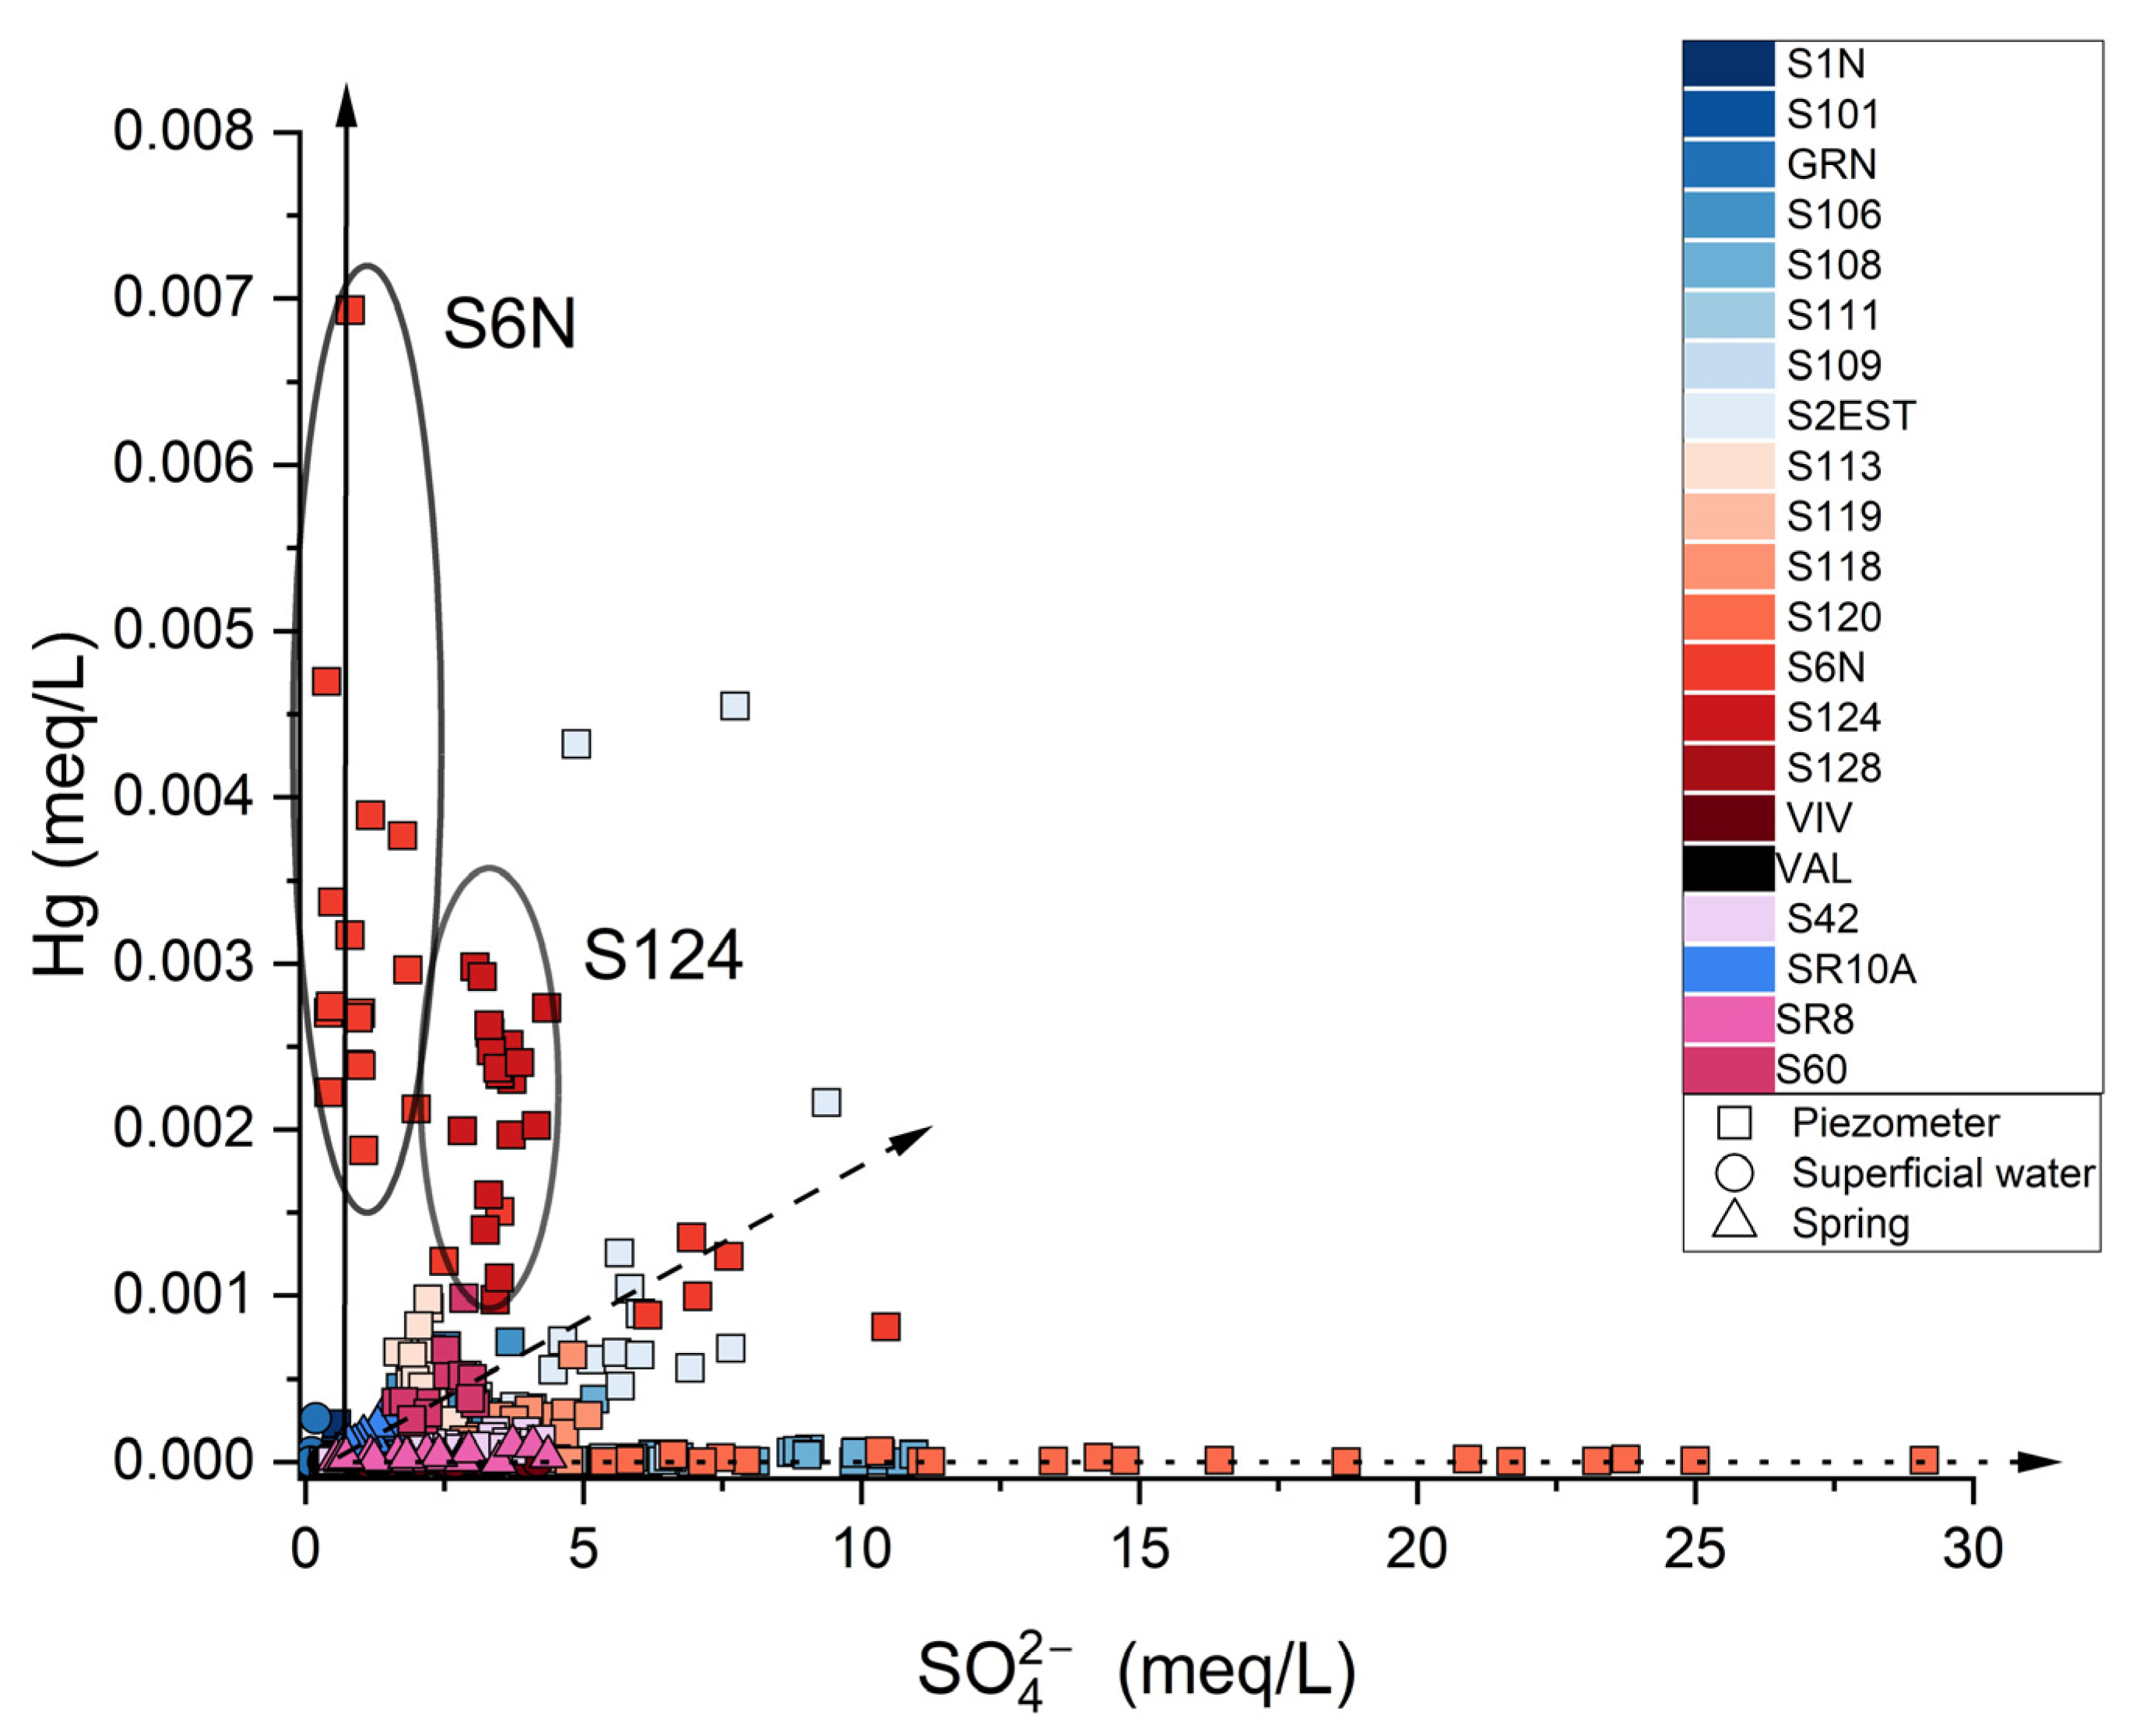
As far as Hg is concerned, concentrations >1 µg/L were measured in all the analyzed samples within the mining area. Waters collected from S6N, S2EST, and S124 showed extremely high concentrations (Table 4). It is likely that there are multiple sources of Hg (e.g., materials resulting from the processing of Hg, the dissolution of altered Hg-bearing minerals, etc.). Despite the low solubility of liquid Hg (3 × 10⁻⁷ mol/kg, [42]), its presence, recorded during the piezometer drilling, likely contributed to the observed concentrations in the studied waters along with that derived from the dissolution of altered Hg-bearing minerals (cinnabar and metacinnabar) and slags and tailings. By plotting the concentrations of Hg vs. SO4 in meq/L (Figure 7), three main trends can be evidenced, as follows: (a) low Hg and high SO4 concentrations (dotted line), (b) a positive correlation between Hg and SO4 (dashed line), and (c) an increasing Hg concentration and constant sulfate (solid line). The first trend is characterized by those samples characterized by high SO4 concentrations (up to 1398 mg/L, e.g., S120, S108, and SR8), low Hg concentrations (<0.1 µg/L), and an acidic pH down to 4.64 (e.g., S120), suggesting the interaction between meteoric waters and Hg-poor gangue minerals. The second trend includes most waters (e.g., S2EST), likely due to the dissolution of Hg-bearing minerals according to the reaction (Equation (1)) [43], which could contribute to the presence of SO4 in the water:
HgS ( s ) + 2 O 2 + 2 H 2 O Hg ( OH ) 2 ( aq ) + SO 4 2 + 2 H +
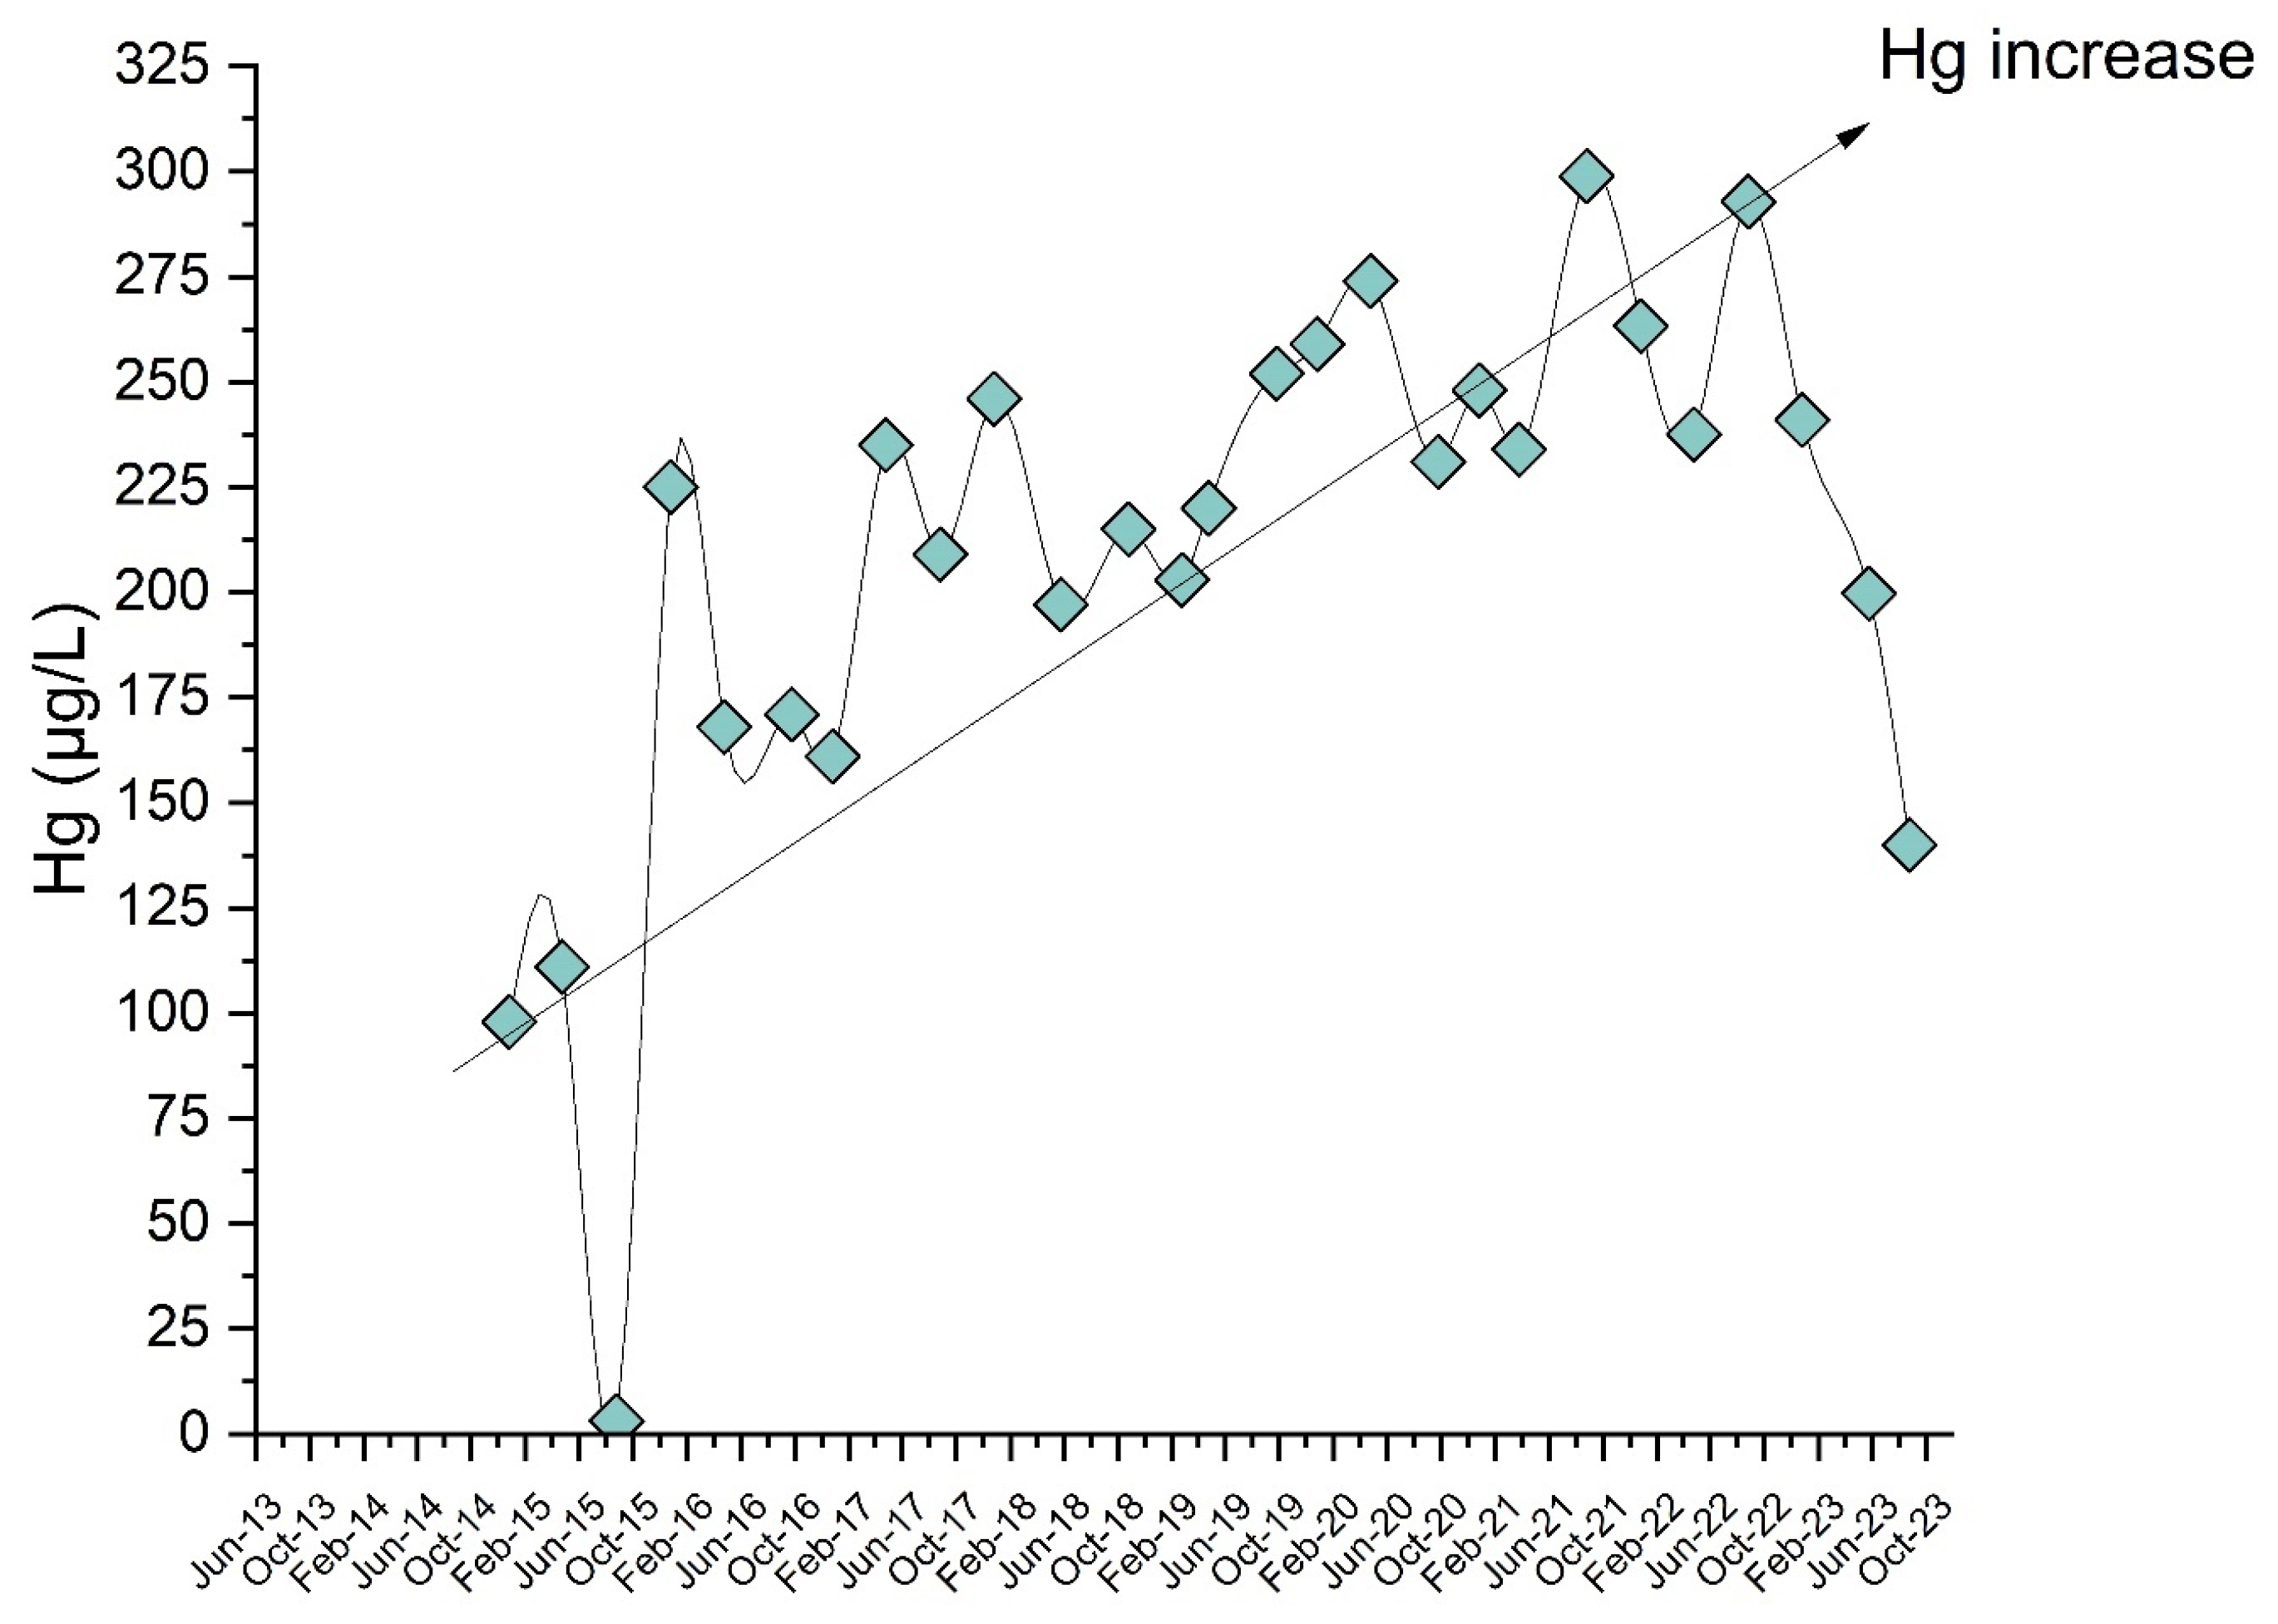
The third trend is depicted by the S6N and S124 waters, which, as already pointed out, were those showing the highest concentrations of Hg. The S124 waters were sampled near the Nesa condensers. From January 2014 to September 2022, the Hg concentrations increased (up to 298 µg/L in September 2021) and then abruptly decreased (Figure 8). The S124 piezometer is in the NW portion of the mining area, where the subterranean pipelines supplying the post-roasting exhausted fumes to the discharging chimney were present. Consequently, the incremented content of Hg with a time recorded in the S124 waters (Figure 8) is likely related to the increasing interaction of meteoric waters with the material hosted inside the pipelines, which, as observed during the excavations, were broken in several segments. Once the pipelines were partly removed and partly covered with foam (end of 2022) to avoid any interaction with the meteoric waters, the concentration of dissolved Hg in the S124 started to decrease significantly.
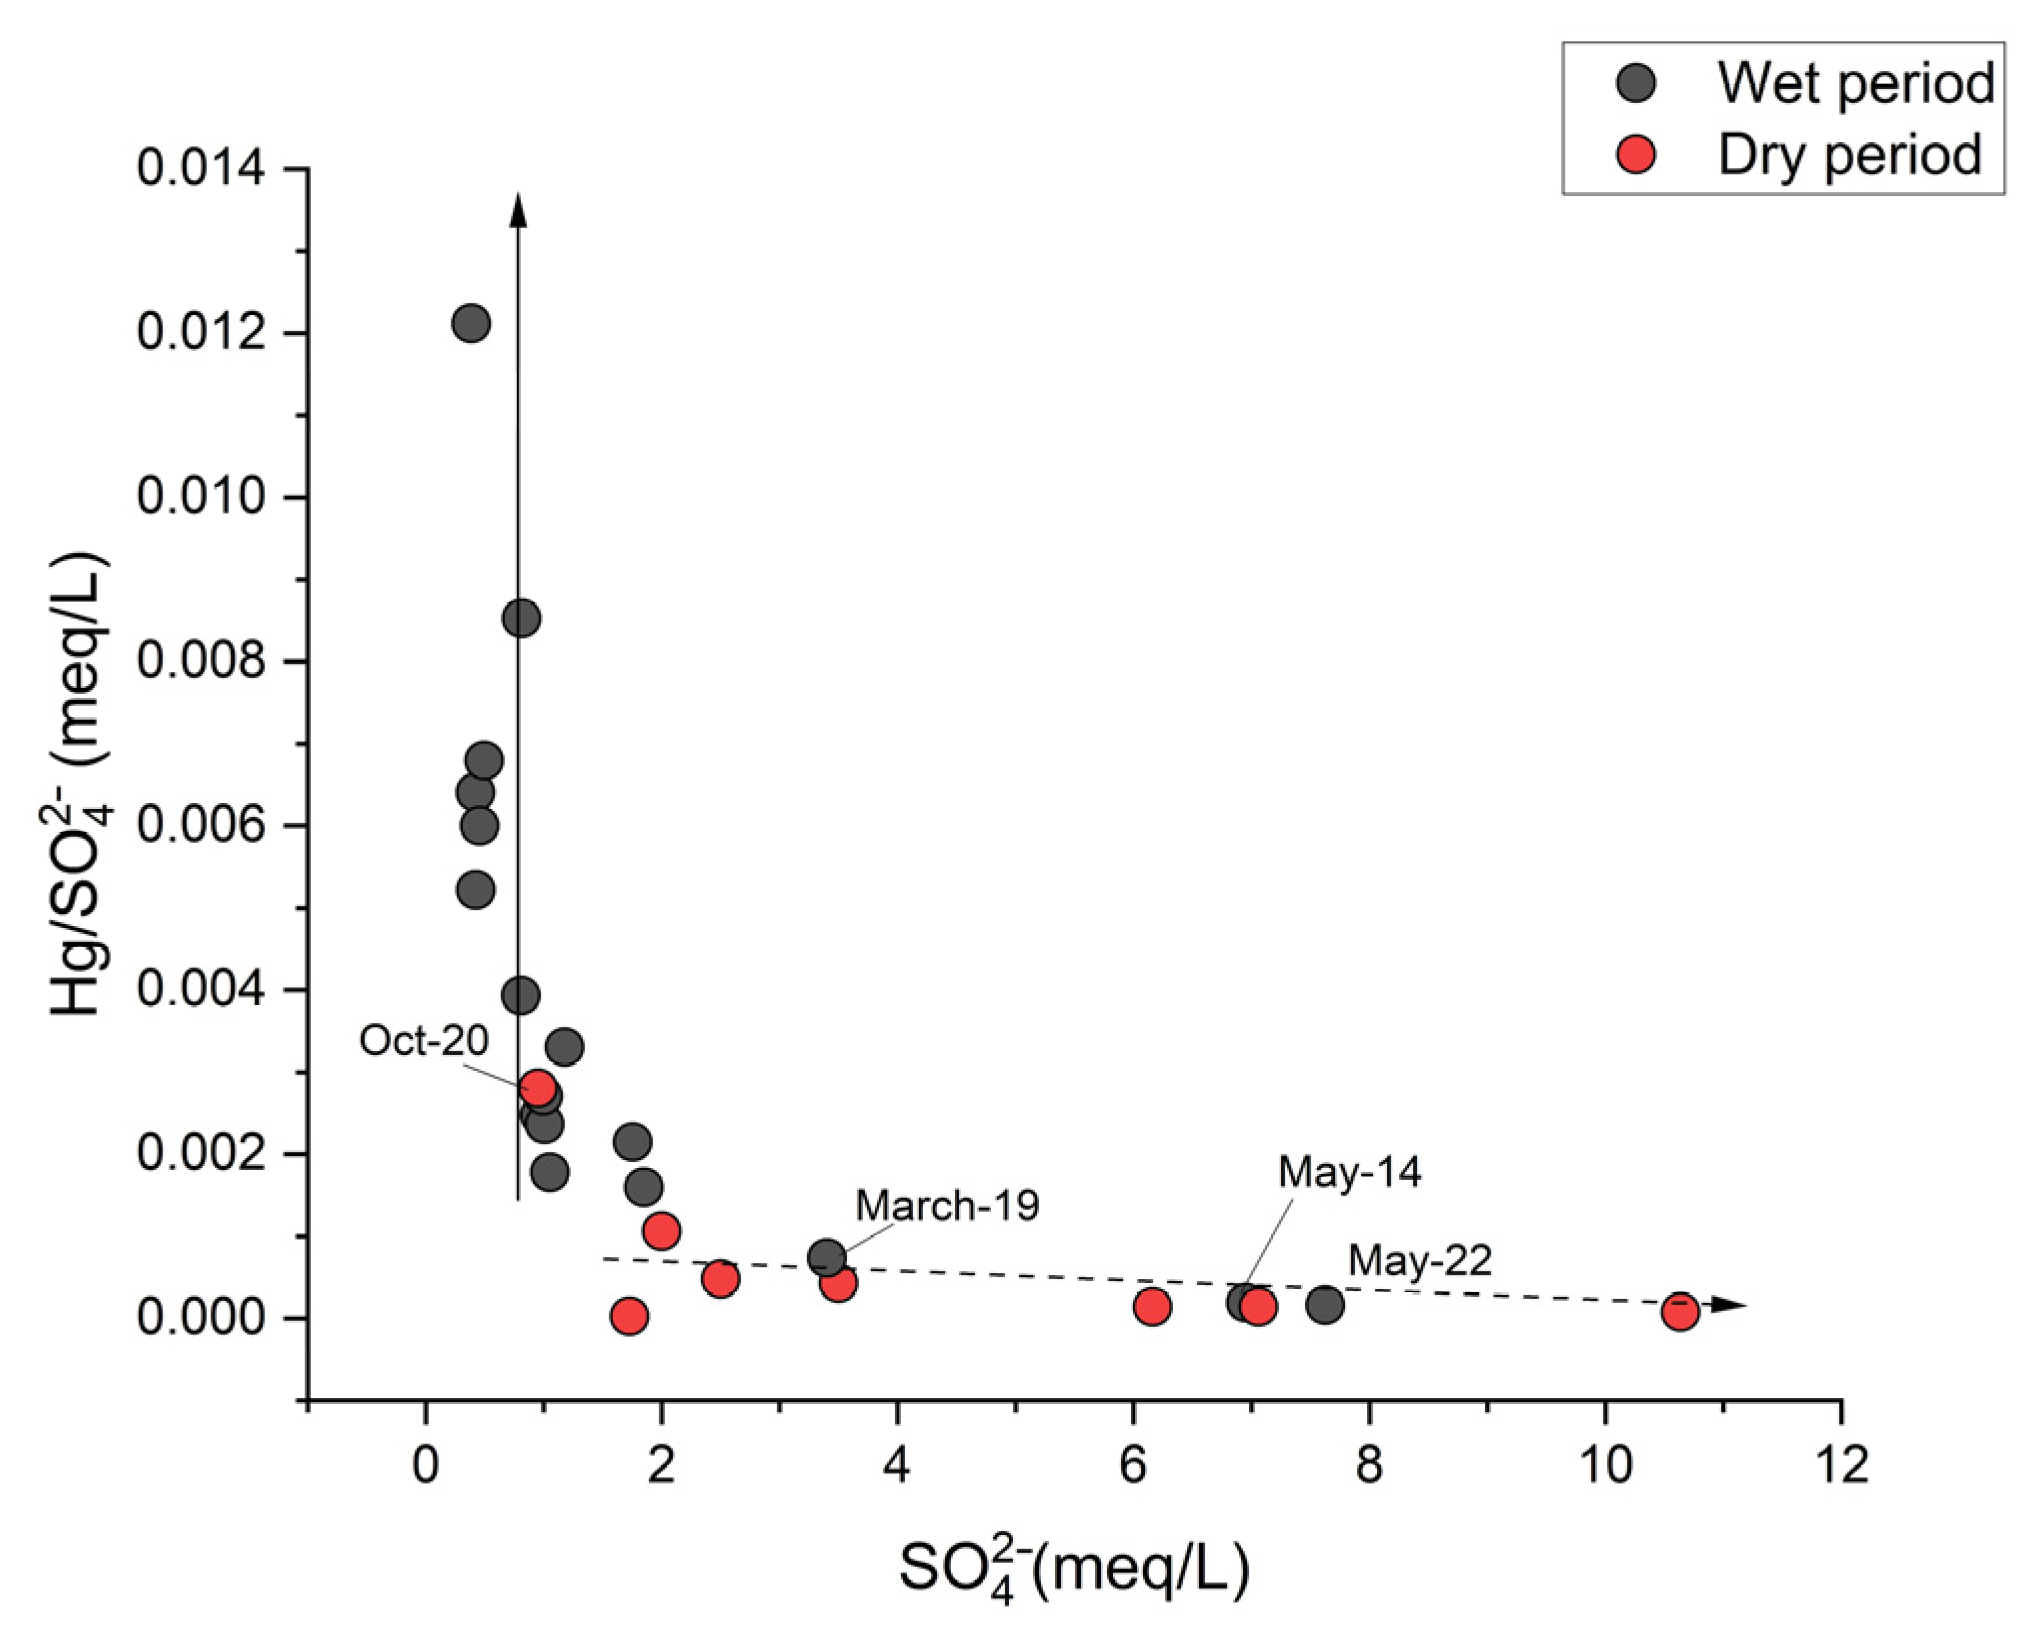
On the other hand, the behavior of the S6N piezometer was different with respect to the S124, which is represented by two trend (Figure 9).
The first trend (solid line) is characterized by an increasing Hg/SO4 ratio, while the SO4 concentration is relatively constant. All the sampling waters refer to wet periods, i.e., the water table is closer to the ground, suggesting that the interaction with Hg-rich levels favors an increasing solubilization of Hg. The dry period (dash line) is related to the increase of SO4 with respect to the dissolution of Hg in waters. This turns out to be true with the exception of May 2014 and 2022 and March 2019. In these three periods, the total rainfall (17.8 mm, 95.8 mm, and 38.2 mm, respectively; TOS11000114 [25]) is very low, allowing to mostly refer to a dry rather than a wet period.
The S6N piezometer is situated at the border of the physical barrier constructed in 2007, where droplets of liquid Hg as well as Hg-bearing minerals were found in the soil [28]. This barrier was built close to the Cermak–Spirek furnaces whose edifice was destroyed in the sixties. A parking area was subsequently constructed along with a couple of basketball and volleyball playgrounds.
This study has evidenced that the reclamation of the ASS mine waters is critical due to their large compositional variability in terms of both geochemical facies and concentrations of Hg and, subordinately, As and Sb. While the concentrations of As and Sb do not pose significant environmental challenges, those of Hg are one to two orders of magnitudes higher than the limit imposed by the EC. Consequently, geochemical modeling was applied to compute the saturation indices and element speciation, being of paramount importance in order to verify the contaminant flow and mobility in the local shallow groundwater system.

4.1. PHREEQ-C Modeling—Saturation Indices (SI) and Speciation

The results of the SI for the selected waters are reported in the Supplementary Materials File S3).
Calcite and dolomite result in being oversaturated in S1N, while they approach saturation (SI > 0) in SR8 and S6N. Gypsum and anhydrite are always undersaturated. Iron oxides and hydroxides, such as ferrihydrite and goethite, hematite, and magnetite, are almost or entirely over-saturated. Kaolinite and boehmite are oversaturated or in equilibrium, respectively, as well as alunite. According to [44,45,46], Fe- and Al-hydroxides and oxides can adsorb As3+, As5+, Sb3+, and Sb5+, which strongly influence the speciation, mobility, and fate of antimony and arsenic in the environment. Arsenic in solutions occurred as As5+, and the three main species were HAsO42−, H2AsO4, and CaAsO42− and, occasionally, MgAsO4. In particular, at pH > 8 the main As species is CaAsO42−, and calcite and dolomite can precipitate. Therefore, in waters characterized by high contents of As and oversaturated in calcite and dolomite, arsenate may enter the crystal lattice of the carbonate minerals by replacing CO32− and precipitate as Ca3(AsO4)2. The authors of [13] reported that the soil leachates from the Lame mining dump located a few km north of the ASS mine, where waste material from a different Hg mining area of the Mt. Amiata district was stored, showed features similar to those of the studied waters. This is likely due to the fact that, as already mentioned, most waters from the shallow aquifer of ASS are hosted within a small paleo-valley, filled by the same waste material characterizing the Lame dumping area. Between January 2020 and September 2021, however, the redox conditions drastically decreased and the pH clustered around 7 or even weakly acid. In this case, the predominant species is H3AsO30 and, consequently, As5+ reduces to As3+. According to [13,47], the reduction of As5+ to As3+ could potentially be the primary mechanism for the release of arsenic into groundwater, promoted by anaerobic conditions.
Owing to the fact that data on the sulfur-reduced species are not available and that the abundances of Cl were <15 mg/L on average, the main Hg species is Hg0(aq). According to many authors, e.g., [48,49,50], in surface and ground waters, the Hg0(aq) is the main species at a low to neutral pH. As shown in the Eh-pH diagram in [13], the Hg0(aq) field is rather wide. This is apparently in agreement with the presence of liquid Hg recorded during the S6N piezometer drilling.
Waters from S1N, S6N, and S118 are the sole sites where the Sb concentrations were >1 µg/L. In these waters, Sb, similarly to As, is consistently occurring as Sb5+, and the main three species are SbO3, Sb(OH)6, and CaSb(OH)6+. When the redox condition drastically decreases (January 2020 and September 202), the main species for Sb is Sb3+ as antimonious hydroxide (Sb(OH)30). According to [51], in reducing environments, Sb(OH)₃0 and As(OH)₃0 prevail and can easily be extracted from aqueous solutions or subsequently removed through adsorption onto a metal-oxide-based sorbent after being oxidized back to the oxidized forms As5+ and Sb5+. S1N, S6N, and S118 result in being oversaturated in SbO2, usually known as cervantite (Sb2O4). However, in the S1N waters, whose geochemical composition was characterized by the largest variability among the studied samples, antimony precipitated as SbO2 and romeite (Ca2Sb2O7) when the waters had a pH > 10.5 (January 2014, October 2020, and June 2023) and a Sb concentration > 3 µg/L. Where Fe was available, in the simulation after September 2021, Sb was oversaturated in tripuhyte (FeSbO4). In oxidizing conditions, Sb occurs as Sb5+(SbO3), while under reduced conditions, Sb prevails as Sb3+(Sb(OH)3) and schafarzikite (FeSbO2) is present, confirming the results by [13]. PHREEQC modeling shows that where calcite is oversaturated and the concentrations of Fe are available, As and Sb are sequestered, limiting their mobility within the water.

4.2. Flux and Transport Modeling

The flow model is reported in Figure 10a,b for the wet and dry periods, respectively, and computed by ModFlow, allowing the hydraulic model to be verified by comparing the measured water levels of the piezometers with those calculated by the model. The water outflow, reported in Figure 10, is W-E-oriented, following the topography of the area. As previously highlighted, there were only sporadically shown concentrations > 10 μg/L (e.g., GIT) and the model did not reveal major criticalities. The behavior of Sb is similar, since the content of 5 μg/L is only overcome in two waters (S6N and S118). Consequently, our transport modeling is limited to the behavior of Hg, with its concentrations being in most waters > 1 μg/L.
The iso-contour maps of the Hg concentrations in the wet and dry periods, respectively, are reported in Figure 11a,b. They were modeled using the Hg concentrations of the last survey carried out in 2023. The Hg contamination is mainly limited to the former mining area, except for piezometers S6N and S2EST, from which a plume is generated and tends to migrate to the east, likely affecting the mercury concentrations of the S108 water. The Hg dissolved concentrations in the S108 piezometer (4.4 and 7.5 µg/L in the wet and dry periods, respectively) appear to be compatible with a dilution process which affects the S2EST and S6N waters. However, some doubts may arise about the exact location of these two piezometers since it is probable that they were at the border or even inside the former remediated area in 2007. Since no more precise information is presently available, we decided to consider the worst scenario, i.e., both S2EST and S6N are situated outside the remediated area and, consequently, their waters may contribute and mix with the shallow aquifer to the east.
To understand how far the water flow from S6N and S2EST is possibly extending to the east, the piezometer S110 (Figure 10), drilled in 2014, was included in the model. In March 2024, the piezometer was indeed purged and the waters were sampled and analyzed for mercury (Hg). The month of March is referred to as a wet period, during which the Hg content was 0.11 µg/L. Since no information concerning the dry period is available, the Hg concentration measured in September 2016 (0.6 µg/L) was applied to run the model.
The Hg plume generated by the S6N and S2Est waters is reduced in both the wet and dry periods (Figure 11), and only low concentrations make it across piezometer S110, thus posing limited problems to the shallow aquifer outside the former mining area. However, no specific information is available on the shallow aquifer between piezometer S108 and S110. This poses some difficulties in defining the true extent of the Hg-plume. In addition, more in-depth information on the lithology and hydraulic properties of the terranes (e.g., transmissivity) between these two piezometers could help to refine the Hg plume trend.
The SR10A spring and GRN surface waters, located in the western portion of the study area (Figure 1), are diluted by the arrival of Hg-free water from Lago Green (located to the north of the study area) once they enter the bypass channel. The S124 waters, located close to the Nesa condensers (Figure 1) and showing a Hg concentration of up to 298 µg/L, do not affect those related to S128, while those of S42 (18 m depth) are apparently less influenced during the wet period. This result is rather important since the S128 piezometer is cemented down to the depth of 42 m, thus avoiding any interaction with the shallow aquifer. We can thus assess that the Hg contamination does not extend to the deeper aquifer, being only limited to the shallower groundwater system within the mining area.
Waters from the S120 and S60 piezometers (Figure 1 and Figure 11) appear to draw from very localized and small aquifers as the Hg iso-concentration lines are clamped on them. The outflow from piezometers S106 and S1N is apparently blocked or diluted by the jet grouting barrier and no interaction with the groundwater system outside the mining area is evidenced.
Nevertheless, to further refine the model and understand whether the shallow aquifer outflow is affecting the groundwaters outside the ASS mining area, three additional piezometers at the depth of 15 m should possibly be drilled upstream and downstream of S110 and between S108 and S110 (Figure 10). We can conclude that the Modflow model is suggesting that the shallow aquifer of the mining area should not be regarded as a single aquifer, but characterized by multiple water “pockets”. This would facilitate the remediation operations aimed at the removal of mercury, notwithstanding that a physicochemical approach is expected to be applied.

5. Conclusions

The former Hg-mining area of ASS is presently under remediation activities. However, the seasonal geochemical surveys carried out since 2013 have evidenced high concentrations of Hg (up to 695 μg/L) and, to a very minor extent, As and Sb in the shallow aquifer and surface waters. Moreover, significant compositional variability was observed in terms of major, minor, and chalcophile elements and was not apparently associated with seasonality. The pH and Eh values were also variable. Interestingly, an abrupt decrease of Eh in some groundwaters was observed concurrently with the digging up of the subterranean pipelines where the exhausted fumes were convoyed to the sole-existing chimney during the production of liquid mercury. The results obtained by the Modflow model show that it is difficult to consider the shallow aquifer in the mining area as a typical homogeneous groundwater system. The low transmissivity indeed impedes the regular continuity of the aquifer, which, in most cases, is extremely localized and regarded as a sort of “pocket” aquifer, as shown by the low amount of water discharged during the sampling activity. The criticalities evidenced by the Modflow model and related to a possible extension of a Hg-plume outside the mining area (Figure 11) is presently hypothetical since it needs to be confirmed by new piezometers that are to be drilled downstream of S6N, S2Est, and S108. However, a significant dilution of these Hg-rich waters is currently occurring, as shown by the abrupt decrease in the Hg concentrations to the east. One of the most important results obtained by this 10-year-long survey is that the Hg contamination, as well as that of As and Sb, is likely limited to the mining area. This would strongly facilitate any technique to be adopted for the removal of mercury.

Supplementary Materials

The following supporting information can be downloaded at: https://www.mdpi.com/article/10.3390/w16091210/s1, Supplementary Material File S1 Tables S1–S22: Temporal variability of the physicochemical parameters and concentrations of the main solutes of the piezometer and surface and spring waters; Supplementary Material File S2 Tables S23–S44: Temporal variation of As, Hg, Sb, Al, and Fe in the piezometer and surface and spring waters; Supplementary Material File S3 Tables S45–S52: Tables with saturation index (SI) of water simulation.

Author Contributions

Conceptualization, F.M., J.C., G.M., B.N. and O.V.; methodology, F.M., J.C., B.N. and O.V.; software, F.M. and G.M.; validation, O.V., D.R., F.B. and B.N.; formal analysis, F.M. and J.C.; investigation, J.C., F.M., B.N., F.B., B.N. and O.V.; resources, D.R. and O.V.; data curation, F.M., J.C. and G.M.; writing—original draft preparation, J.C., F.M., B.N., F.B, B.N., D.R., G.M. and O.V.; writing—review and editing, J.C., F.M., B.N., F.B., B.N., D.R., G.M. and O.V.; visualization, J.C., F.M., B.N., F.B., B.N., D.R., G.M. and O.V.; supervision, J.C., F.M., B.N., G.M. and O.V.; project administration, D.R. and O.V.; funding acquisition, D.R. and O.V. All authors have read and agreed to the published version of the manuscript.

Funding

This research received no external funding.

Data Availability Statement

The data presented in this study are available in the article and Supplementary Material.

Acknowledgments

Many thanks are due to A. Esposito and F. Piccinelli for their help during the sampling sessions, and C. Maccelli for the analysis at ICP-MS. We are grateful to D. Cicchella and an anonymous reviewer for their comments and suggestions on sn early version of the manuscript.

Conflicts of Interest

The authors declare no conflicts of interest.

References

  1. Bain, J.G.; Mayer, K.U.; Blowes, D.W.; Frind, E.O.; Molson, J.W.H.; Kahnt, R.; Jenk, U. Modelling the closure-related geochemical evolution of groundwater at a former uranium mine. J. Contam. Hydrol. 2001, 52, 109–135. [Google Scholar] [CrossRef] [PubMed]
  2. Li, Y.; Zhao, Q.; Liu, M.; Guo, J.; Xia, J.; Wang, J.; Qiu, Y.; Zou, J.; He, W.; Jiang, F. Treatment and remediation of metal-contaminated water and groundwater in mining areas by biological sulfidogenic processes: A review. J. Hazard Mater. 2023, 443, 130377. [Google Scholar] [CrossRef] [PubMed]
  3. Madzivire, G.; Gitari, W.M.; Kumar Vadapalli, V.R.; Ojumu, T.V.; Petrik, L.F. Fate of sulphate removed during the treatment of circumneutral mine water and acid mine drainage with coal fly ash: Modelling and experimental approach. Min. Engin. 2011, 24, 1467–1477. [Google Scholar] [CrossRef]
  4. Iribar, V.; Izco, F.; Tames, P.; Antiguedad, I.; da Silva, A. Water contamination and remedial measures at the Troya abandoned Pb-Zn mine (The Basque Country, Northern Spain). Environ. Geol. 2000, 39, 800–806. [Google Scholar] [CrossRef]
  5. Nordstrom, D.K. Hydrogeochemical processes governing the origin, trans-port and fate of major and trace elements from mine wastes and mineralized rock to surface waters. Appl. Geochem. 2011, 26, 1777–1791. [Google Scholar] [CrossRef]
  6. Nordstrom, D.K. Mine waters: Acidic to circmneutral. Elements 2011, 7, 393–398. [Google Scholar] [CrossRef]
  7. Galván, L.; Olías, M.; Cerón, J.C.; de Villaran, R.F. Inputs and fate of contaminants in a reservoir with circumneutral water affected by acid mine drainage. Sci. Tot. Environ. 2021, 762, 143614. [Google Scholar] [CrossRef]
  8. Gomo, M. Conceptual hydrogeochemical characteristics of a calcite and dolomite acid mine drainage neutralised circumneutral groundwater system. Water Sci. 2018, 32, 355–361. [Google Scholar] [CrossRef]
  9. Bowell, R.J.; Dill, S.; Cowan, J.; Wood, A. A review of sulfate removal options for mine waters. In Mine Water 2004—Proceedings International Mine Water Association Symposium 2; Jarvis, A.P., Dudgeon, B.A., Younger, P.L., Eds.; Newcastle upon Tyne (University of Newcastle): Newcastle, UK, 2004; pp. 75–91. [Google Scholar]
  10. Johnson, B.D.; Hallberg, K.B. Acid mine drainage remediation options: A review. Sci. Tot. Environ. 2005, 338, 3–14. [Google Scholar] [CrossRef]
  11. Vaselli, O.; Nisi, B.; Rappuoli, D.; Bianchi, F.; Cabassi, J.; Venturi, S.; Tassi, F.; Raco, B. Geochemical characterization of the ground waters from the former Hg-mining area of Abbadia San Salvatore (Mt. Amiata, central Italy): Criticalities and perspectives for the reclamation process. Ital. J. Geosci. 2015, 134, 304–322. [Google Scholar] [CrossRef]
  12. Laurenzi, M.A.; Braschi, E.; Casalini, M.; Conticelli, S. New 40Ar-39Ar dating and revision of the geochronology of the Monte Amiata Volcano, Central Italy. Ital. J. Geosci. 2015, 134, 255–265. [Google Scholar] [CrossRef]
  13. Meloni, F.; Montegrossi, G.; Lazzaroni, M.; Rappuoli, D.; Nisi, B.; Vaselli, O. Total and leached arsenic, mercury and antimony in the mining waste dumping area of Abbadia San Salvatore (Mt. Amiata, Central Italy). Appl. Sci. 2021, 11, 7893. [Google Scholar] [CrossRef]
  14. Rimondi, V.; Chiaranti, L.; Lattanzi, P.; Benvenuti, M.; Beutel, M.; Colica, A.; Costagliola, P.; Di Bendetto, F.; Gabbani, G.; Gray, J.E.; et al. Metallogeny, explotation and environmental impact of the Mt. Amiata mercury ore district (Southern Tuscany, Italy). Ital. J. Geosci. 2015, 134, 323–336. [Google Scholar] [CrossRef]
  15. Dini, A. Mines and minerals in the Mining district of Monte Amiata. In Il Vulcano di Monte Amiata; E.S.A. Edizioni Scientifiche e Artistiche: Nola, Italy, 2017; pp. 343–369. [Google Scholar]
  16. Segreto, L. Monte Amiata. Il mercurio italiano. In Strategie Internazionali e Vincoli Extra-Economici; Angeli, F., Ed.; AbeBooks Inc.: Milano, Italy, 1991. (In Italian) [Google Scholar]
  17. Gandy, C.J.; Smith, J.W.N.; Jarvis, A.P. Attenuation of mining-derived pollutants in the hyporheic zone: A review. Sci. Tot. Environ. 2017, 373, 435–446. [Google Scholar] [CrossRef] [PubMed]
  18. Stefania, G.A.; Rotiroti, M.; Fumagalli, L.; Zanotti, C.; Bonomi, T. Numerical modeling of remediation scenarios of a groundwater Cr (VI) plume in an alpine valley aquifer. Geosciences 2018, 8, 209. [Google Scholar] [CrossRef]
  19. ISPRA. Sviluppo e Valutazione di Modelli di Flusso in Acquiferi Porosi; ISPRA: Roma, Italy, 2021; Volume 193, ISBN 978-88-448-1048-1. (In Italian)
  20. Parkhurst, D.L.; Appelo, C.A.J. User’s guide to PHREEQC (Version 2)-A computer program for speciation, batch-reaction, one-dimensional transport, and inverse geochemical calculations: U.S. Geological Survey. Water-Resour. Investig. Rep. 1999, 312, 99–4259. [Google Scholar]
  21. Vaselli, O.; Nisi, B.; Rappuoli, D.; Cabassi, J.; Tassi, F. Gaseous elemental mercury and total and leached mercury in building materials from the former Hg-mining area of Abbadia San Salvatore (Central Italy). Int. J. Environ. Res. Public Health 2017, 14, 425. [Google Scholar] [CrossRef] [PubMed]
  22. Vaselli, O.; Rappuoli, D.; Bianchi, F.; Nisi, B.; Niccolini, M.; Esposito, A.; Cabassi, J.; Giannini, L.; Tassi, F. One hundred years of mercury exploitation at the mining area of Abbadia San Salvatore (Mt. Amiata, Central Italy): A methodological approach from a complex reclamation activity before the establishment of a new mining park. In El Patrimonio Geologico y Minero; Identidad y Motor de Desarrollo. Publicaciones del Instituto Geologico y minero de Espana Serie: Cuadernos del Museo Geominero, n. 29; Proceed. XVII Congreso Internacional sobre Patrimonio Geologico’ y Minero; Instituto Geológico y Minero de España: Madrid, Spain, 2019; pp. 1109–1126. ISBN 978-84-9138-081-8. [Google Scholar]
  23. Meloni, F.; Farieri, A.; Higueras, P.L.; Esbrì, M.J.; Nisi, B.; Cabassi, J.; Rappuoli, D.; Vaselli, D. Mercury distribution in plants and soils from the former mining area of Abbadia San Salvatore (Tuscany, Central Italy). Environ. Geochem. Health 2023, 45, 8523–8538. [Google Scholar] [CrossRef]
  24. Magi, F.; Doveri, M.; Menichini, M.; Minissale, A.; Vaselli, O. Groundwater response to local climate variability: Hydrogeological and isotopic evidences from the Mt. Amiata volcanic aquifer (Tuscany, central Italy). Rend. Lincei. Sci. Fis. Nat. 2019, 30, 125–136. [Google Scholar] [CrossRef]
  25. SIR. Available online: http://www.sir.toscana.it (accessed on 28 March 2024).
  26. Doveri, M.; Menichini, M.; Provenzale, A.; Scozzari, A. Groundwater response to climate changes: Examples of observed and modeled trends on Tuscany aquifers (central Italy). In Atti del Convegno “XVII Giornata Mondiale dell’Acqua-Strategie di Adattamento Alla Domanda e Alla Disponibilità di Risorse Idriche”; Accademia dei Lincei: Roma, Italy, 2017. [Google Scholar]
  27. Caparrini, F.; Castelli, F.; Ercolani, G. Adattamento ed Implementazione del Modello Idrologico MOBIDIC per il Bilancio dei Bacini Idrografci e Dell’acquifero del Monte Amiata, Relazione Finale per Regione Toscana; Regione Toscana: Florence, Italy, 2011; p. 78. (In Italian) [Google Scholar]
  28. Bianchi, F.; Corti, F.; Vaselli, O.; Rappuoli, D. Bonifica area mineraria Lotto 6: Relazione conclusiva sulle indagini e studi degli anni 2011 e 2012. In Modalità Operative per la Bonifica; Technical Report, Municipality of Abbadia San Salvatore; Unità di Progetto Bonifica: Abbadia San Salvatore, Italy, 2012; p. 53. [Google Scholar]
  29. Lazzaroni, M. Investigating Hg Dispersion in the Environment: The Experience from the Abandoned Mining Area of Abbadia San Salvatore (Tuscany, Central Italy) between Research and Remediation Activities of Natural and Anthropic Matrices. Ph.D. Thesis, University of Florence, Florence, Italy, 2022; p. 213. [Google Scholar]
  30. Delany, J.M.; Lundeen, S.R. The LLNL Thermochemical Database: Revised Data and File Format for the EQ3/6 Package; Lawrence Livermore National Laboratory: Livermore, CA, USA, 1991. [Google Scholar]
  31. Ball, J.B.; Nordstrom, D.K. User’s Manual for WATEQ4F, with Revised Thermodynamic Data Base and Test Cases for Calculating Speciation of Major, Trace, and Redox Elements in Natural Water; Open-File Report 91-183; U.S. Geological Survey: Reston, VA, USA, 1991.
  32. Allison, J.D.; Brown, D.S.; Novo-Gradac, K.J. MINTEQA2/PRODEFA2—A Geochemical Assessment Model for Environmental Systems—Version 3.0 User’s Manual; Environmental Research Laboratory, Office of Research and Development U.S. Environmental Protection Agency: Athens, GA, USA, 1990.
  33. U.S. Environmental Protection Agency. MINTEQA2/PRODEFA2, A Geochemical Assessment Model for Environmental Systems—User Manual Supplement for Version 4.0; National Exposure Research Laboratory, Ecosystems Research Division: Athens, GA, USA, 1998.
  34. Johnston, S.G.; Bennett, W.W.; Doriean, N.; Hockmann, K.; Karimian, N.; Burton, E.D. Antimony and arsenic speciation, redox-cycling and contrasting mobility in a mining-impacted river system. Sci. Total Environ. 2020, 710, 136354. [Google Scholar] [CrossRef]
  35. Fournier, R.O.; Potter, I.I. Revised and expanded silica (quartz) geothermometer. Bull. Geotherm. Resour. Counc. 1982, 11, 3–12. [Google Scholar]
  36. Langevin, C.D.; Hughes, J.D.; Provost, A.M.; Russcher, M.J.; Niswonger, R.G.; Panday; Sorab; Merrick; Damian; Morway, E.D.; et al. MODFLOW 6 Modular Hydrologic Model version 6.4.2: U.S. Geological Survey Software Release; U.S. Geological Survey: Reston, VA, USA, 2023. [CrossRef]
  37. Franke, O.L.; Reilly, T.E.; Bennett, G.D. Definition of Boundary and Initial Conditions in the Analysis of Saturated Ground-Water Flow Systems: An Introduction. In Techniques of Water-Resources Investigations of the U.S. Geological Survey; USGS: Washington, DC, USA, 1987. [Google Scholar]
  38. Rappuoli, D. Bonifica del Terreno di Proprietà Comunale Interessato Dall’ex Sito Minerario di Abbadia San Salvatore; Technical Report, Municipality of Abbadia San Salvatore; Unità di Profetto di Bonifica: Abbadia San Salvatore, Italy, 2009; p. 120. [Google Scholar]
  39. Schofield, S.; Jankowski, J. Hydrochemistry and isotopic composition of Na-HCO3-rich groundwaters from the Ballimore region, central New South Wales, Australia. Chem. Geol. 2004, 211, 111–134. [Google Scholar] [CrossRef]
  40. Vaselli, O.; Lazzaroni, M.; Nisi, B.; Cabassi, J.; Tassi, F.; Rappuoli, D.; Meloni, F. Discontinuous geochemical monitoring of the galleria Italia circumneutral waters (former Hg-mining area of Abbadia San Salvatore, Tuscany, Central Italy) feeding the Fosso Della Chiusa Creek. Environments 2021, 8, 15. [Google Scholar] [CrossRef]
  41. Meloni, F.; Nisi, B.; Gozzi, C.; Rimondi, V.; Cabassi, J.; Montegrossi, G.; Rappuoli, D.; Vaselli, O. Background and geochemical baseline values of chalcophile and siderophile elements in soils around the former mining area of Abbadia San Salvatore (Mt. Amiata, southern Tuscany, Italy). J. Geochem. Explor. 2023, 255, 107324. [Google Scholar] [CrossRef]
  42. Ariya, P.A.; Amyot, M.; Dastoor, A.; Deeds, D.; Feinberg, A.; Kos, G.; Poulain, A.; Ryjkov, A.; Semeniuk, K.; Subir, M.; et al. Mercury Physicochemical and Biogeochemical Transformation in the Atmosphere and at Atmospheric Interfaces: A Review and Future Directions. Chem. Rev. 2015, 115, 3760–3802. [Google Scholar] [CrossRef]
  43. Barnett, M.O.; Turner, R.R.; Sanger, P.C. Oxidative dissolution of metacinnabar (b-HgS) by dissolved oxygen. Appl. Geochem. 2001, 16, 1499–1512. [Google Scholar] [CrossRef]
  44. Thanabalasingam, P.; Pickering, W.F. Specific sorption of antimony (III) by the hydrous oxides of Mn, Fe, and Al. Water Air Soil Pollut. 1990, 49, 175–185. [Google Scholar] [CrossRef]
  45. Masue, Y.; Loeppert, R.H.; Kramer, T.A. Arsenate and arsenite adsorption and desorption behavior on coprecipitated aluminum: Iron hydroxides. Environ. Sci. Technol. 2007, 41, 837–842. [Google Scholar] [CrossRef] [PubMed]
  46. Guo, X.; Wu, Z.; He, M.; Meng, X.; Jin, X.; Qiu, N.; Zhang, J. Adsorption of antimony onto iron oxyhydroxides: Adsorption behavior and surface structure. J. Hazard. Mater. 2014, 276, 339–345. [Google Scholar] [CrossRef]
  47. Young, S.D. Chemistry of Heavy Metals and Metalloids in Soils. In Book Heavy Metals in Soils. Traces Metals and Metalloids in Soils and Their Bioavailability, 3rd ed.; Alloway, B.J., Ed.; Springer: Dordrecht, The Netherlands, 2013; Volume 22, pp. 51–95. [Google Scholar]
  48. Morel, F.M.; Kraepiel, A.M.; Amyot, M. The chemical cycle and bioaccumulation of mercury. Annu. Rev. Ecol. Syst. 1998, 29, 543–566. [Google Scholar] [CrossRef]
  49. Bagnato, E.; Parello, F.; Valenza, M.; Caliro, S. Mercury content and speciation in the Phlegrean Fields volcanic complex: Evidence from Hydrothermal system and fumaroles. J. Volcanol. Geotherm. Res. 2009, 189, 250–260. [Google Scholar] [CrossRef]
  50. Park, C.M.; Katz, L.E.; Liljestrand, H.W. Mercury speciation during in situ thermal desorption in soil. J. Hazrd. Mater. 2015, 300, 624–632. [Google Scholar] [CrossRef] [PubMed]
  51. Han, Y.S.; Seong, H.J.; Chon, C.M.; Park, J.H.; Nam, I.H.; Yoo, K.; Ahn, J.S. Interaction of Sb (III) with iron sulfide under anoxic conditions: Similarities and differences compared to As (III) interactions. Chemosphere 2018, 195, 762–770. [Google Scholar] [CrossRef] [PubMed]
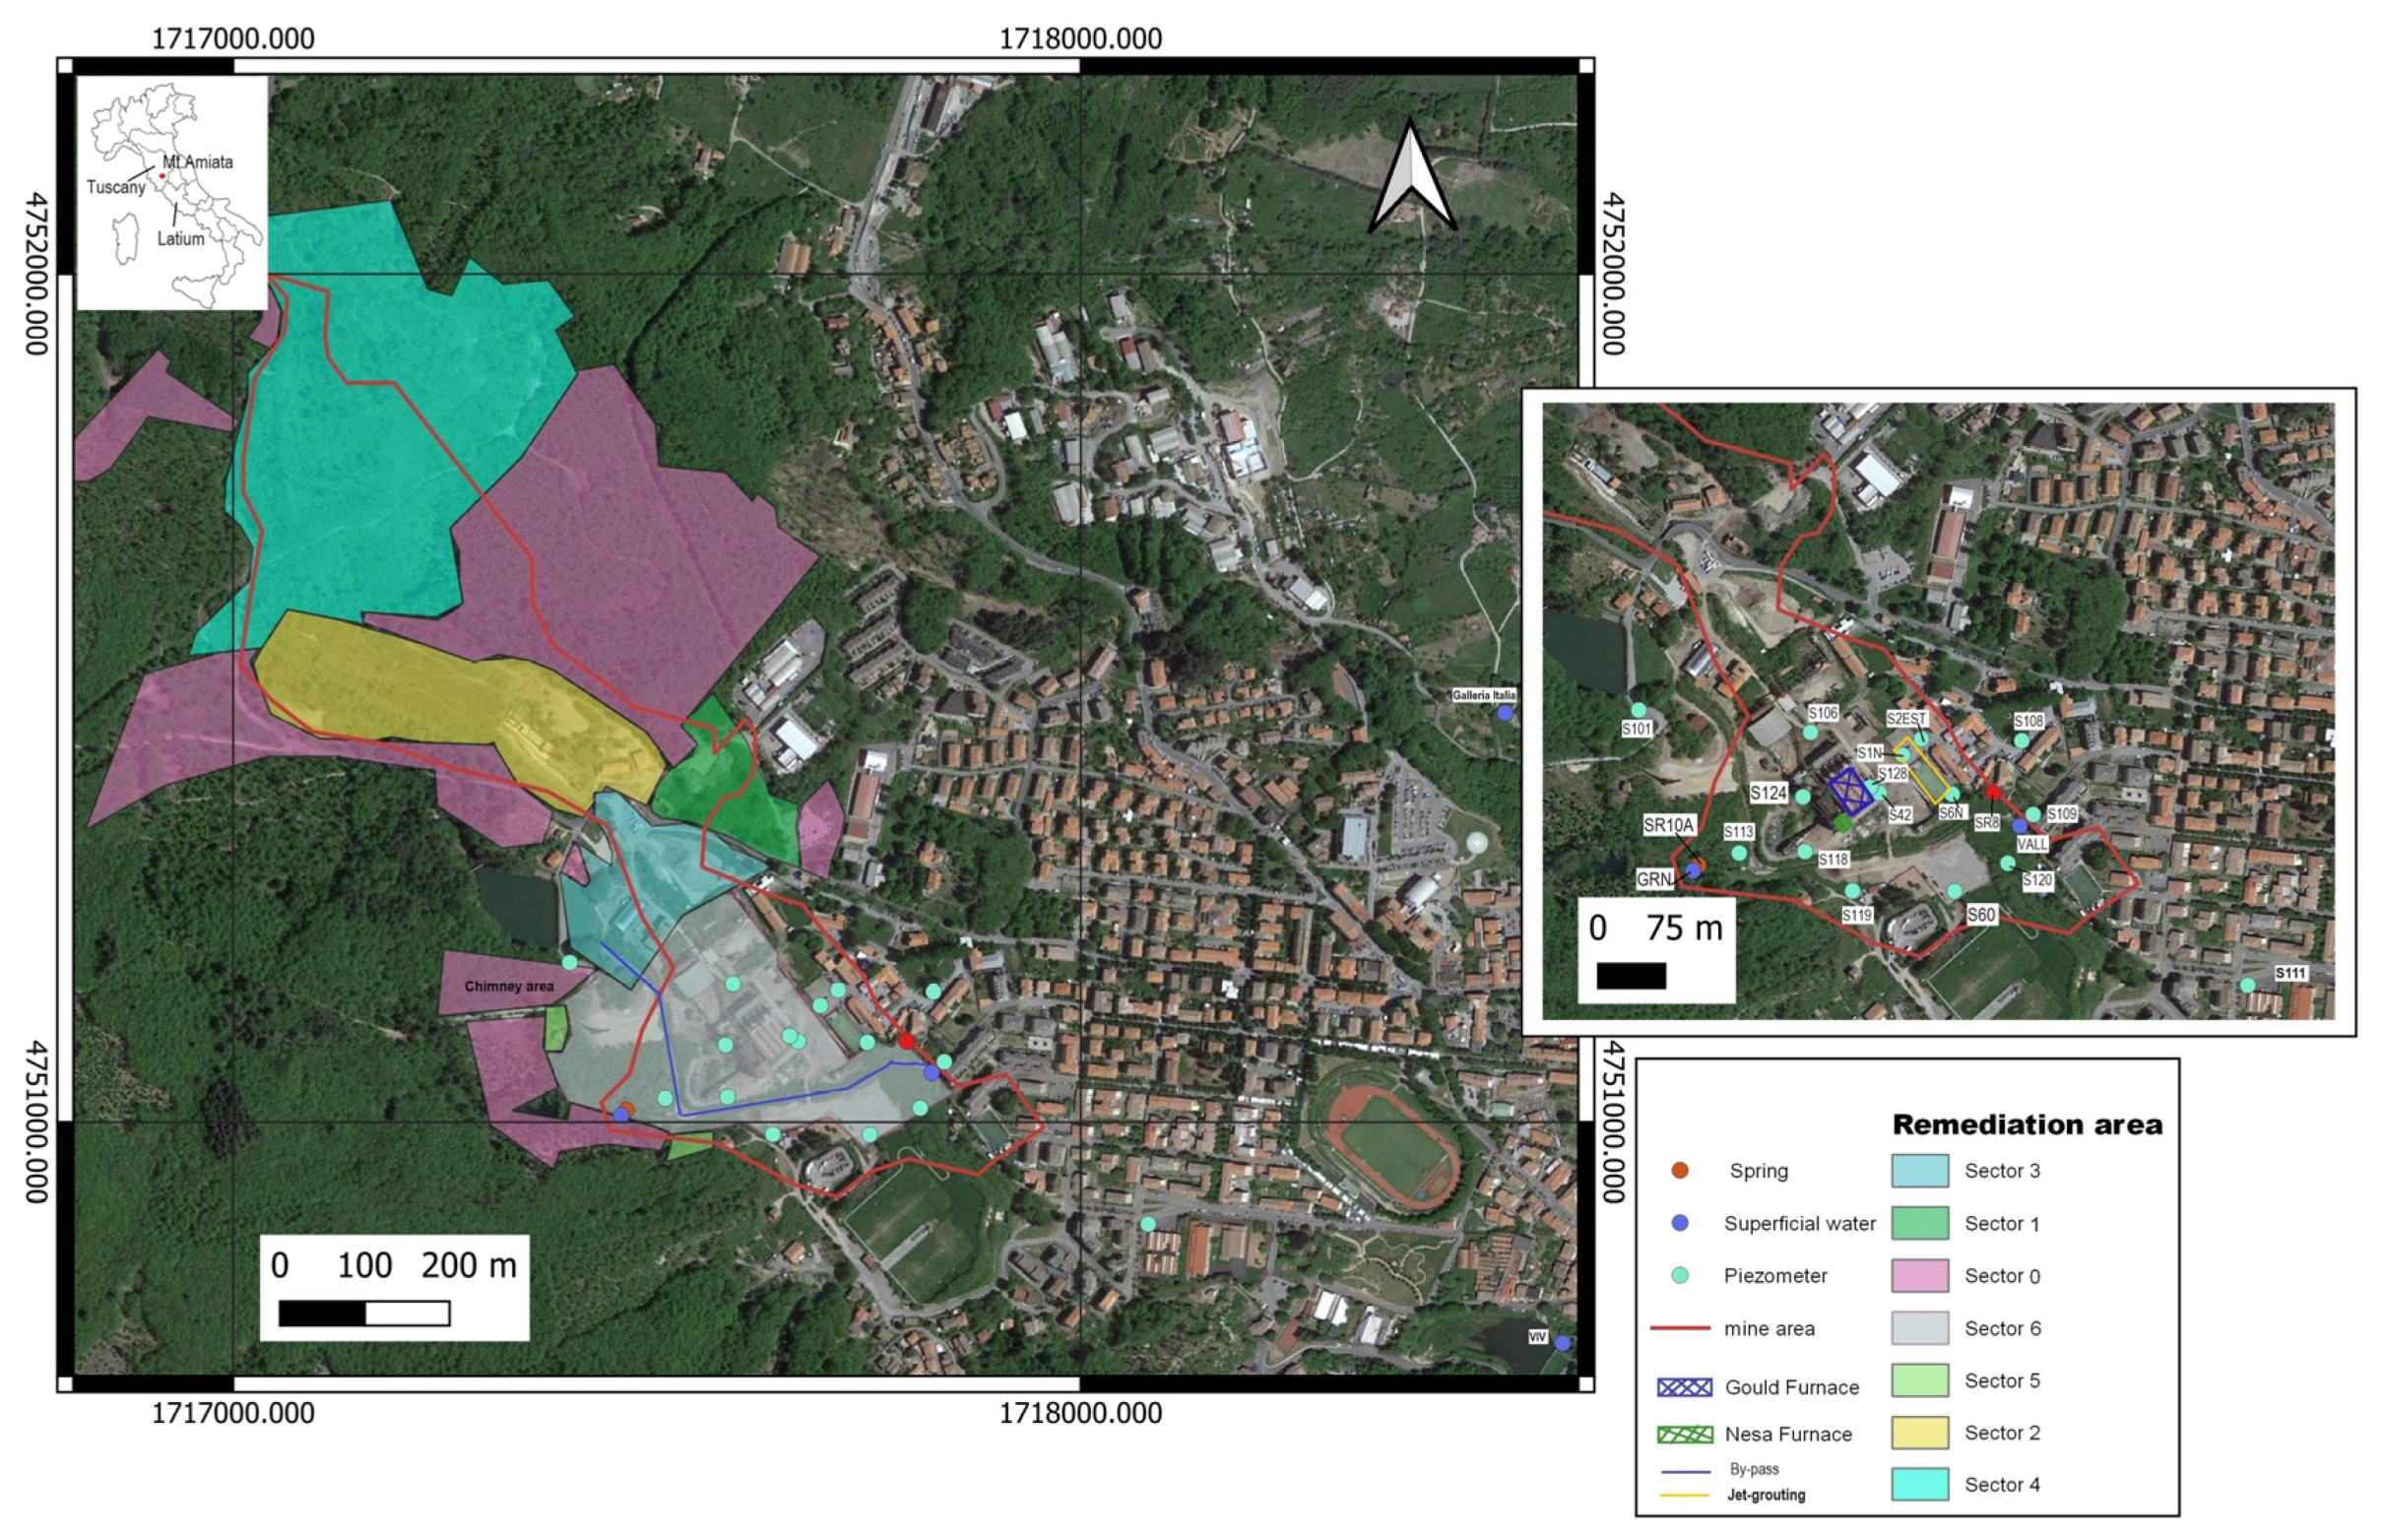
Figure 1. Current status of the remediation activity in the ASS mine and location of the sampling sites.
Water 16 01210 g001
Figure 2. Schematic NW-SE-oriented geological cross-section of the mining area as reconstructed by piezometer logs (the black arrows with S and a number on top refer to the piezometers used to reconstruct the subsurface). The main mining structures are also reported. LEGEND: (1) coarse roasting products; (2) lenses of organic-rich clays and silts; (3) fluvio-lacustrine deposits consisting of fine sand and silt and organic-rich clay silt layers; (4) trachyte characterized by highly variable lithology, with presence of compact, fractured, and altered volcanic material; and (5) groundwater surface, which occasionally seeps within some of the mining buildings. Modified after [11].
Water 16 01210 g002
Figure 3. Boundary conditions for flux and transport modeling.
Water 16 01210 g003
Figure 4. (a) Triangular diagram of the main cations and (b) triangular diagram of the main anions for all the samples collected inside and outside the mining area of ASS from 2013 to 2023.
Water 16 01210 g004
Figure 5. Binary diagram of SO4+HCO3 vs. Ca+Mg (meq/L) for all studied waters collected inside and outside the former mining area of ASS. The 1:1 line is the stoichiometric ratio between the two considered parameters.
Water 16 01210 g005
Figure 6. Binary diagram As vs. Sb (µg/L) for the waters collected from 2013 to 2023. At the top right-hand corner, the binary diagram As vs. Sb (µg/L) in logarithmic scale for the waters from the S118 piezometer. The highest Sb and As concentrations are related to the 2022–2023 surveys.
Water 16 01210 g006
Figure 7. Binary diagram of Hg vs. SO42− (in meq/L) for all the waters collected from 2013 to 2023. See the text for the explanation of the trends depicted by the dotted, dashed, and solid lines.
Water 16 01210 g007
Figure 8. Temporal variations of the concentration of Hg for the S124 waters.
Water 16 01210 g008
Figure 9. Binary diagram Hg/SO42− vs. SO42− (in meq/L) of the S6N waters. For the explanation of the two trends depicted by the dashed and solid line, see the text.
Water 16 01210 g009
Figure 10. (a) Flux model for the wet period and (b) flux model for the dry period both with piezometric contour lines (in blue). The contour lines are in brown.
Water 16 01210 g010
Figure 11. (a) Transport modeling of Hg in the wet period; (b) transport modeling of Hg in the dry period. The question mark indicates the area where we don’t have available information on the shallow aquifer.
Water 16 01210 g011
Table 1. Sample ID, interval of the survey years, minimum (Min), maximum (Max), Mean and Median of Temperature (°C), Electrical Conductivity (E.C., in mS/cm), Redox potential (Eh, in mV), and Hydraulic head (in m above topographic field level (t.f.l.).
Sample IDYearTpHE.C.EhHydraulic Head
RangeMinMaxMeanMedianMinMaxMeanMedianMinMaxMeanMedianMinMaxMeanMedianMinMaxMeanMedian
S1NFeb-13/Sep-235.615.512.813.16.611.38.57.81221093327.0250.0−22628383.485.03.96.85.04.9
S2ESTFeb-13/Sep-236.314.012.813.04.910.06.05.7286807563.0603.0−15373190.0210.04.37.05.45.5
S6NFeb-13/Sep-234.814.112.512.96.29.67.57.42201150494.0399.0−86293138.0156.05.28.87.27.4
S42May-13/Sep-234.914.511.611.55.77.66.76.7280780526.0540.018293142.0172.53.36.44.64.6
S60May-13/Sep-215.516.012.212.05.77.36.56.6212593372.3357.040277156.3156.014.815.515.215.3
S101Sep-15/sep-236.514.011.511.56.211.47.07.0142735408.0378.0−40477186.0171.57.113.39.28.8
S106Feb-13/Sep-235.114.010.911.05.47.66.76.6169690389.0370.5−18268132.3128.03.57.24.54.3
S108Feb-13/Sep-236.015.213.013.05.510.67.16.82201120756.0839.5−140863174.0150.03.78.95.45.3
S109Feb-13/Sep-236.116.512.212.25.57.66.86.81691066692.0701.0−2.6302161.0167.05.99.68.18.2
S111Feb-13/Sep-235.414.512.312.56.57.97.17.03201039731.1759.0−1.7266142.5149.04.66.65.45.4
S113Feb-13/Sep-235.114.811.412.45.47.76.25.0172850372.4340.02.9340189.0210.06.614.88.07.0
S118Sep-14/Sep-235.414.812.212.75.97.96.66.5199738534.3572.031290154.7151.55.96.96.46.4
S119Sep-14/Sep-235.216.012.913.26.07.86.76.6172560280.5245.026321145.0137.011.512.211.911.8
S120Sep-14/Sep-234.715.012.112.14.47.35.55.422017711147.51123.029368209.9222.014.618.216.216.3
S124Jan-15/Sep-235.314.012.112.85.47.86.15.93092160570.3502.030324199.6220.55.912.07.16.8
S128Jan-15/Sep-236.014.011.712.05.57.66.36.1196540360.8383.0−3821876.744.02.86.54.85.0
VIVSep-17/Sep-233.020.012.414.15.98.37.47.4206657402.2385.0−2128489.971.5----
VALSep-17/Sep-233.023.011.412.75.98.67.27.2130520287.6272.029284128.8119.0----
SR8Sep-14/Sep-233.718.811.912.35.88.47.37.2130757458.3402.0−2.6263111.4116.0----
SR10ASep-14/Sep-234.414.511.512.05.97.76.76.7109530225.9200.027291151.5164.0----
GRNSep-14/Sep-233.216.311.012.45.68.27.17.169390144.5111.55.6273124.7125.0----
GITJan-09/Sep-237.619.414.915.05.57.06.26.27361567930.7916.9n.d.n.d.n.d.n.d.----
Table 2. Sample ID, interval of the survey years, minimum (Min), maximum (Max), Mean, and Median of the main anions (in mg/L).
Sample IDYearHCO3FClBrNO3SO42−
RangeMinMaxMeanMedianMinMaxMeanMedianMinMaxMeanMedianMinMaxMeanMedianMinMaxMeanMedianMinMaxMeanMedian
S1NFeb-13/Sep-233115297.697.7<0.10.50.30.32.4299.06.4<0.11.90.70.40.9163.82.96.116045.031.0
S2ESTFeb-13/Sep-231.28725.819.5<0.12.00.60.45.72712.010.0<0.10.80.30.33.13912.010.044450248.0259.0
S6NFeb-13/Sep-2380227149.0157.00.21.60.70.51.4478.26.2<0.11.20.60.60.37.82.82.019502127.056.0
S42May-13/Sep-2349244114.08.0<0.10.60.30.22.9147.88.1<0.10.90.60.64.02013.013.523234141.0154.0
S60May-13/Sep-21214028.928.5<0.10.50.20.24.9137.97.1<0.10.70.30.32.86.14.84.878147115.0113.6
S101Sep-15/sep-2361217147.0143.0<0.10.50.20.20.52310.39.9<0.11.50.70.7<0.14.81.30.80.85631.533.0
S106Feb-13/Sep-233115276.259.0<0.10.40.10.14.64710.98.9<0.11.30.60.56.31810.99.927177100.0100.0
S108Feb-13/Sep-232122671.250.0<0.11.70.30.25.62712.09.3<0.13.50.70.5<0.1187.68.216525307.0322.0
S109Feb-13/Sep-2326188126.0126.5<0.11.30.30.210.53216.916.2<0.11.00.50.31.51812.012.571274203.0213.0
S111Feb-13/Sep-2399188142.8146.4<0.11.80.40.44.44012.710.6<0.11.80.70.6<0.14.71.81.640333238.0255.0
S113Feb-13/Sep-236.03923.723.2<0.11.10.30.36.82212.211.8<0.10.80.50.40.51510.510.869140104.4103.0
S118Sep-14/Sep-235111572.668.9<0.10.60.30.23.31910.810.6<0.10.70.60.71.73621.925.130244173.2179.3
S119Sep-14/Sep-23357346.546.0<0.10.60.20.24.7218.68.4<0.11.10.60.60.18.72.01.73013468.860.2
S120Sep-14/Sep-234.519327.912.0<0.11.10.40.32.75616.010.8<0.12.20.70.41.8188.18.42581398706.6665.5
S124Jan-15/Sep-232217334.828.0<0.10.60.30.36.83011.810.4<0.11.20.60.6173023.223.1136209168.3166.3
S128Jan-15/Sep-231211734.726.80.10.80.40.32.3116.66.2<0.11.50.70.5<0.15.91.10.642162127.2132.4
VIVSep-17/Sep-2332123100.8110.0<0.10.50.20.26.13812.810.7<0.11.40.70.71.05.72.72.254201100.593.7
VALSep-17/Sep-234218881.373.0<0.10.80.30.26.0169.69.0<0.12.50.70.40.65.32.01.81616149.835.7
SR8Sep-14/Sep-2324204118.999.00.11.50.40.36.17415.411.0<0.10.60.30.20.4133.82.726210104.097.5
SR10ASep-14/Sep-23215129.828.6<0.10.40.20.24.2169.79.3<0.10.50.30.31.08.43.43.0307552.751.0
GRNSep-14/Sep-23307746.643.9<0.10.90.20.15.5117.47.10.20.30.20.2<0.12.00.70.62.8146.45.9
GITJan-13/Sep-2367192128.5120.00.12.00.90.81.63413.712 n.d.n.d. n.d. n.d. 0.11.60.30.2338586473.6475.4
Table 3. Sample ID, interval of the survey years, minimum (Min), maximum (Max), Mean, and Median of the main cations (in mg/L).
Sample IDYearCa2+Mg2+Na+K+NH4+
RangeMinMaxMeanMedianMinMaxMeanMedianMinMaxMeanMedianMinMaxMeanMedianMinMaxMeanMedian
S1NFeb-13/Sep-2315130.035.028.00.4223.01.03.04613.913.30.15519.113.1<0.010.20.10.1
S2ESTFeb-13/Sep-233112688.095.02.02711.011.06.73013.212.75.51610.49.7<0.011.10.10.1
S6NFeb-13/Sep-232627084.065.00.1103.02.00.2189.18.68.93920.420.1<0.010.50.10.1
S42May-13/Sep-238.012079.079.03.08.06.06.03.69112.09.06.91712.413.0<0.010.90.10.1
S60May-13/Sep-21163225.226.09.61612.813.0111613.012.63.61410.610.9<0.010.40.10.1
S101Sep-15/sep-23209556.853.00.54.03.03.01.1106.05.61.6254.03.3<0.010.40.10.1
S106Feb-13/Sep-234410963.459.02.06.04.04.03.4137.26.41.9104.94.2<0.010.50.10.1
S108Feb-13/Sep-2312170104.5114.00.64321.521.09.53216.517.3102819.320.0<0.010.50.20.1
S109Feb-13/Sep-2329160111.0114.04.0138.59.03.02210.410.05.92013.814.2<0.011.20.10.0
S111Feb-13/Sep-233015089.894.48.64127.830.08.44217.016.97.12313.914.7<0.010.10.10.1
S113Feb-13/Sep-23274333.632.87.7118.98.98.2119.910.04.8107.87.9<0.011.10.20.1
S118Sep-14/Sep-23379863.062.82.52817.518.61.7159.59.64.72919.320.00.011.40.20.1
S119Sep-14/Sep-23178130.225.81.3115.24.88.0139.59.03.97.66.26.3<0.010.30.10.0
S120Sep-14/Sep-23106534266.9241.64.12512.512.35.8128.38.29.45928.122.2<0.011.00.10.1
S124Jan-15/Sep-23487658.556.53.01310.310.84.41210.010.63.72117.519.00.042.51.71.8
S128Jan-15/Sep-239.94836.036.44.1139.410.27.82112.812.60.1136.96.9<0.011.60.30.2
VIVSep-17/Sep-234415072.865.60.48.85.05.25.38.97.37.74.5106.96.80.020.50.20.1
VALSep-17/Sep-23247341.033.50.56.43.53.55.28.56.76.62.67.04.54.1<0.011.00.10.1
SR8Sep-14/Sep-233311973.068.12.5176.55.76.5138.88.43.59.35.54.80.010.60.20.1
SR10ASep-14/Sep-23133419.719.11.86.95.35.64.3128.48.51.8115.55.3<0.010.10.00.0
GRNSep-14/Sep-236.82013.213.11.13.11.71.64.59.05.75.61.54.73.23.1<0.010.10.10.1
GITJan-13/Sep-23167243193.119116.53422.722.97.51511.511.35.0139.49.50.023.50.80.2
Table 4. Sample ID, interval of the survey years, minimum (Min), maximum (Max), Mean, and Median of As, Hg, and Sb (in µg/L).
Sample IDYearAsSbHg
RangeMinMaxMeanMedianMinMaxMeanMedianMinMaxMeanMedian
S1NFeb-13/Sep-230.35.81.81.30.3174.83.6<0.1223.11.2
S2ESTFeb-13/Sep-230.5131.61.3<0.11.50.40.13.045684.155.4
S6NFeb-13/Sep-230.5155.24.68.83722.321.14.6695261.6270.7
S42May-13/Sep-230.11.60.70.7<0.18.91.20.5<0.12612.611.7
S60May-13/Sep-211.01.81.31.3<0.12.70.40.2249942.537.4
S101Sep-15/sep-230.22.41.41.5<0.12.00.50.4<0.12.90.70.5
S106Feb-13/Sep-23<0.12.70.80.4<0.1133.5.0.30.37229.529.8
S108Feb-13/Sep-230.68.62.11.9<0.11.20.30.2<0.1383.21.2
S109Feb-13/Sep-230.71.71.21.2<0.12.90.50.1<0.12.60.60.4
S111Feb-13/Sep-230.56.72.22.2<0.12.50.50.3<0.12.60.60.4
S113Feb-13/Sep-230.61.51.21.2<0.11.20.30.29.69845.449.0
S118Sep-14/Sep-230.94.02.11.9<0.1162.80.60.56423.325.2
S119Sep-14/Sep-235.58.66.66.5<0.10.90.20.2<0.13.31.00.6
S120Sep-14/Sep-23<0.13.91.31.0<0.12.20.50.2<0.19.11.80.9
S124Jan-15/Sep-230.62.11.71.7<0.1181.60.13.1299208.6225.0
S128Jan-15/Sep-23<0.12.11.11.1<0.11.50.30.1<0.16.71.50.9
VIVSep-17/Sep-231.85.23.23.00.31.20.70.6<0.12.50.50.3
VALSep-17/Sep-231.28.13.52.7<0.11.40.70.6<0.12.51.10.9
SR8Sep-14/Sep-231.56.84.04.1<0.11.80.40.30.1102.81.7
SR10ASep-14/Sep-231.52.92.12.1<0.10.90.20.13.62912.911.7
GRNSep-14/Sep-230.93.81.71.70.21.20.40.4<0.1261.40.2
GITJan-13/Sep-237.0129.49.4<0.10.60.40.4<0.12.20.40.2
Table 5. Sample ID, interval of the survey years, minimum (Min), maximum (Max), Mean, and Median of Al and Fe (in µg/L).
Sample IDYearAlFe
RangeMinMaxMeanMedianMinMaxMeanMedian
S1NSep-21/Sep-234038771390.5196.03.48522.79.9
S2ESTSep-21/Sep-2386577266.6249.94.0158.58.4
S6NSep-21/Sep-23134922.016.43.547287.229.7
S42Sep-21/Sep-232.58627.16.01.06413.75.0
S101Sep-21/Sep-230.17416.47.20.9215.52.0
S106Sep-21/Sep-23212322.122.13.96.05.05.0
S108Sep-21/Sep-237.84819.312.13.26318.96.5
S109Sep-21/Sep-234.66917.89.41.3207.43.0
S111Sep-21/Sep-236.42711.48.02.760496.67.0
S113Sep-21/Sep-23284033.735.21.9135.34.0
S118Sep-21/Sep-236.710730.623.26.05122.814.3
S119Sep-21/Sep-233.5126.75.51.66.73.32.6
S120Sep-21/Sep-23102114341224.31207.07.111226.214.0
S124Sep-21/Sep-230.11911.412.50.48.05.66.1
S128Sep-21/Sep-237.03814.09.01611,8328136.910,839.4
VIVSep-21/Sep-23139636.822.52211365.156.7
VALSep-21/Sep-23136532.633.25.410248.439.4
SR8Sep-21/Sep-23166436.333.14.113842.615.0
SR10ASep-21/Sep-23124923.718.61.6134.93.1
GRNSep-21/Sep-236.63015.014.32.721283.779.0
GITSep-21/Sep-231496596701.8346.0587632,10017,928.317,642.6
Disclaimer/Publisher’s Note: The statements, opinions and data contained in all publications are solely those of the individual author(s) and contributor(s) and not of MDPI and/or the editor(s). MDPI and/or the editor(s) disclaim responsibility for any injury to people or property resulting from any ideas, methods, instructions or products referred to in the content.