Article

Prey Supply and Predation as Potential Limitations to Feasibility of Anadromous Salmonid Introductions in a Reservoir

by
Rachelle C. Johnson
1,2,*,
Benjamin L. Jensen
1,
Tessa J. Code
1,2,
Jeffrey J. Duda
1 and
David A. Beauchamp
1
1
U.S. Geological Survey, Western Fisheries Research Center, 6505 Northeast 65th Street, Seattle, WA 98115, USA
2
School of Aquatic and Fishery Sciences, University of Washington, 1122 NE Boat Street, Box 355020, Seattle, WA 98195, USA
*
Author to whom correspondence should be addressed.
Water 2024, 16(8), 1157; https://doi.org/10.3390/w16081157
Submission received: 20 January 2024 / Revised: 9 April 2024 / Accepted: 12 April 2024 / Published: 19 April 2024

Abstract

:
Introducing anadromous fish upstream of migration barriers has frequently been proposed as a conservation strategy, but existing conditions and future changes to the ecosystems above barriers such as invasive species, climate change, and varying water operations influence the capacity to support such introductions. In the Upper Skagit River, Washington, USA, introduction of anadromous salmonids above three high-head dams was proposed; however, the proliferation of invasive redside shiner Richardsonius balteatus fundamentally altered reservoir food web interactions, presenting potential challenges for the growth and production of introduced anadromous salmonids. By combining empirical measurements of zooplankton availability and temporal patterns in thermal structure of the reservoir with bioenergetics model simulations to quantify the rearing capacity of Ross Lake, we estimated the lake could support millions of sockeye salmon fry entering in spring after accounting for temporal consumption demand by the existing planktivore community dominated by redside shiner. The initial fry estimates varied according to the expected fry-to-smolt survival rate, and whether salmonids would be thermally restricted from prey in the epilimnion. This translated to estimates of 189,000 to 285,000 smolts leaving the following spring, and 7700 to 11,700 returning adults, using mean fry-to-smolt and smolt-to-adult survival rates from a nearby sockeye salmon population. We also estimated that predation potential could pose substantial mortality for lake-rearing sockeye or Chinook salmon, although it is expected to play a lesser role in limiting survival of species that only migrate through the reservoir. These results provide a case study and framework for examining bottom-up and top-down food web processes that influence growth and survival of introduced anadromous salmonids in reservoir habitats, thus guiding the direction of future feasibility studies in Ross Lake and other regulated rivers where introduction programs are considered.

1. Introduction

Species reintroductions are becoming an increasingly popular and important tool to conserve biodiversity considering ongoing rapid ecological change [1,2,3]. The goal is to re-establish viable populations of at-risk species throughout their native range after extirpation. Despite its popularity, decades of failed reintroductions prompted researchers and the International Union for Conservation of Nature (IUCN) to develop guidelines for reintroduction programs to help mitigate risk, increase chance of success, and improve our understanding of factors driving reintroduction success [4,5]. Reintroduction can aid in freshwater fish conservation, as many species face extreme range contraction [6]; however, many of these programs have been unsuccessful [7]. Two key factors correlated with reintroduction success for freshwater fishes are (1) adequately addressing the initial cause for decline, and (2) thoroughly assessing habitat availability and quality in the reintroduction area [7]. These factors are reflected in the various guidelines provided for managing reintroduction programs (e.g., [8,9,10]).
Introducing anadromous salmonids above impassable dams is gaining traction as a method of restoring populations restricted from historical spawning and rearing habitat [8] or as conservation introductions into new habitats. Trap and haul programs are one of the only methods available to reintroduce anadromous salmonids to historical spawning habitat upstream of high head dams (i.e., those not suitable for volitional passage structures such as ladders) and are currently being used and proposed in regulated systems throughout the Pacific Northwest, reviewed in Kock et al. [10]. Many of these programs are in their infancy or have scant monitoring data, limiting our ability to evaluate factors driving success or failure of reintroduction efforts into and above reservoir habitats. Kock et al. [10] reported considerable variation in the effectiveness of the programs reviewed, but also noted that success is context-dependent and defined by different management objectives of stakeholders. Limitations to success of reintroduction into reservoirs are varied [10] and can include migration delays and handling stress leading to high mortality rates for adults, differences in stock-specific production rates of the donor populations [11], the differential fitness of hatchery fish and impacts of interbreeding [12,13], high juvenile mortality rates associated with predation in reservoirs [14], and other challenges for downstream migrating juveniles (e.g., mismatch between water operations and migration timing, collection efficiency of smolt traps, handling stress during collection) [15,16].
Reservoirs present a suite of challenges to anadromous fishes due to new and intensified biotic interactions operating in novel food webs [17]. Reservoirs tend to harbor more nonnative species compared to natural habitats [18], which can affect the growth and survival of juvenile salmonids through direct and indirect pathways associated with temporal food supply, predation, or competition. Extreme seasonal drawdowns in high head reservoirs can also alter food webs and prey availability by limiting benthic production [19] and can also challenge upstream and downstream migrations. However, extreme drawdowns can limit invasive competitors/predators and improve the downstream migration success of smolts [20]. While predation in reservoir habitats can limit the survival of juvenile salmonids, these habitats can also provide better growing conditions and larger sizes that confer higher survival as migrants contend with strong size-selective mortality processes through downstream migration and ocean residency [21,22,23,24]. Additionally, cold water available in deep thermally stratified reservoirs provide important thermal refuge for adult fish on their spawning migration [25].
The feasibility and success of anadromous introductions will depend on numerous physical and ecological risks and constraints [8,10]—an important component of which is evaluating the existence of any food web constraints of the recipient habitats. Understanding carrying capacity for nearly obligate lake rearing species like sockeye salmon Oncorhynchus nerka, or Chinook salmon O. tshawytscha that facultatively use lakes as primary juvenile rearing habitats [22,26], is critical to evaluate whether reservoirs can support enough smolt production to achieve introduction goals. Adequate zooplankton supply is required to support the minimum growth and body size required to reduce predation risk in reservoirs as well as survive outmigration and the first year in the ocean. The availability of zooplankton is directly related to juvenile growth and smolt production potential [27,28]. Overstocking could reduce zooplankton, induce density-dependent growth suppression, and inhibit subsequent survival, which would undermine success of an introduction [28]. While such bottom-up controls are central to the models of many sockeye salmon stocking and enhancement programs, the importance of predation in limiting survival and smolt production has also been acknowledged [29,30,31].
In the Skagit River, Washington, the re-licensing of three high-head hydropower dams with the Federal Energy Regulatory Commission has prompted requests by stakeholders to study fish passage and introductions of anadromous salmonids above these dams. In response, a fish passage program has been proposed with the goal to “meaningfully contribute to recovering self-sustaining, harvestable salmon runs in the Skagit River watershed without negatively impacting native Skagit Basin fish populations and the Skagit River watershed ecosystem” [32]. The number of returning adults that could be produced from this currently inaccessible habitat will be determined by the spawning capacity in the mainstem Skagit River and the tributaries upstream of the dams in addition to survival rates during successive life stages—freshwater rearing, downstream smolt migration, marine residency, and upstream adult migration. Habitat capacity in the mainstem and tributaries above the dams may be limited—intrinsic potential (IP) modeling estimated that most of this habitat is of low or medium IP for Chinook salmon and coho salmon O. kisutch, and while a more high-IP habitat exists for steelhead O. mykiss (anadromous rainbow trout) [33], bioenergetic analysis of native rainbow trout growth suggests that low growth potential in these habitats could limit survival of steelhead smolts [34]. The reservoirs may offer better growth for freshwater rearing life histories; however, proliferation of invasive redside shiner Richardsonius balteatus in Ross Lake in the early 2000s could limit zooplankton supply for reservoir rearing fish [35]. Additionally, predation pressure by multiple species of piscivorous salmonids could also substantially reduce juvenile survival, and thus smolt production [36].
Building on a quantitative analysis of the reservoirs under current conditions [35,36], we evaluated the Ross Lake food web in the context of anadromous salmonid introductions to determine the suitability of this habitat for smolt production. Our primary objectives were to (1) estimate the resource capacity in Ross Lake and the number of lake-rearing juveniles that could be supported using bioenergetics modeling, and (2) estimate predation potential and evaluate the impact on survival and smolt production of lake-rearing fish as well as those migrating through the reservoir. Our analysis focused specifically on limitations within the reservoir habitat. We did not consider spawning potential in the tributaries and assumed it was not limited; thus, we address the question as, assuming that spawning and incubation habitats are not limiting, what level of smolt production could be supported by reservoir-rearing juveniles. Coupled with studies evaluating constraints throughout the remainder of the life cycle, this study contributes to a broader understanding of the feasibility of introducing anadromous salmonids above these dams.

2. Methods

2.1. Study System

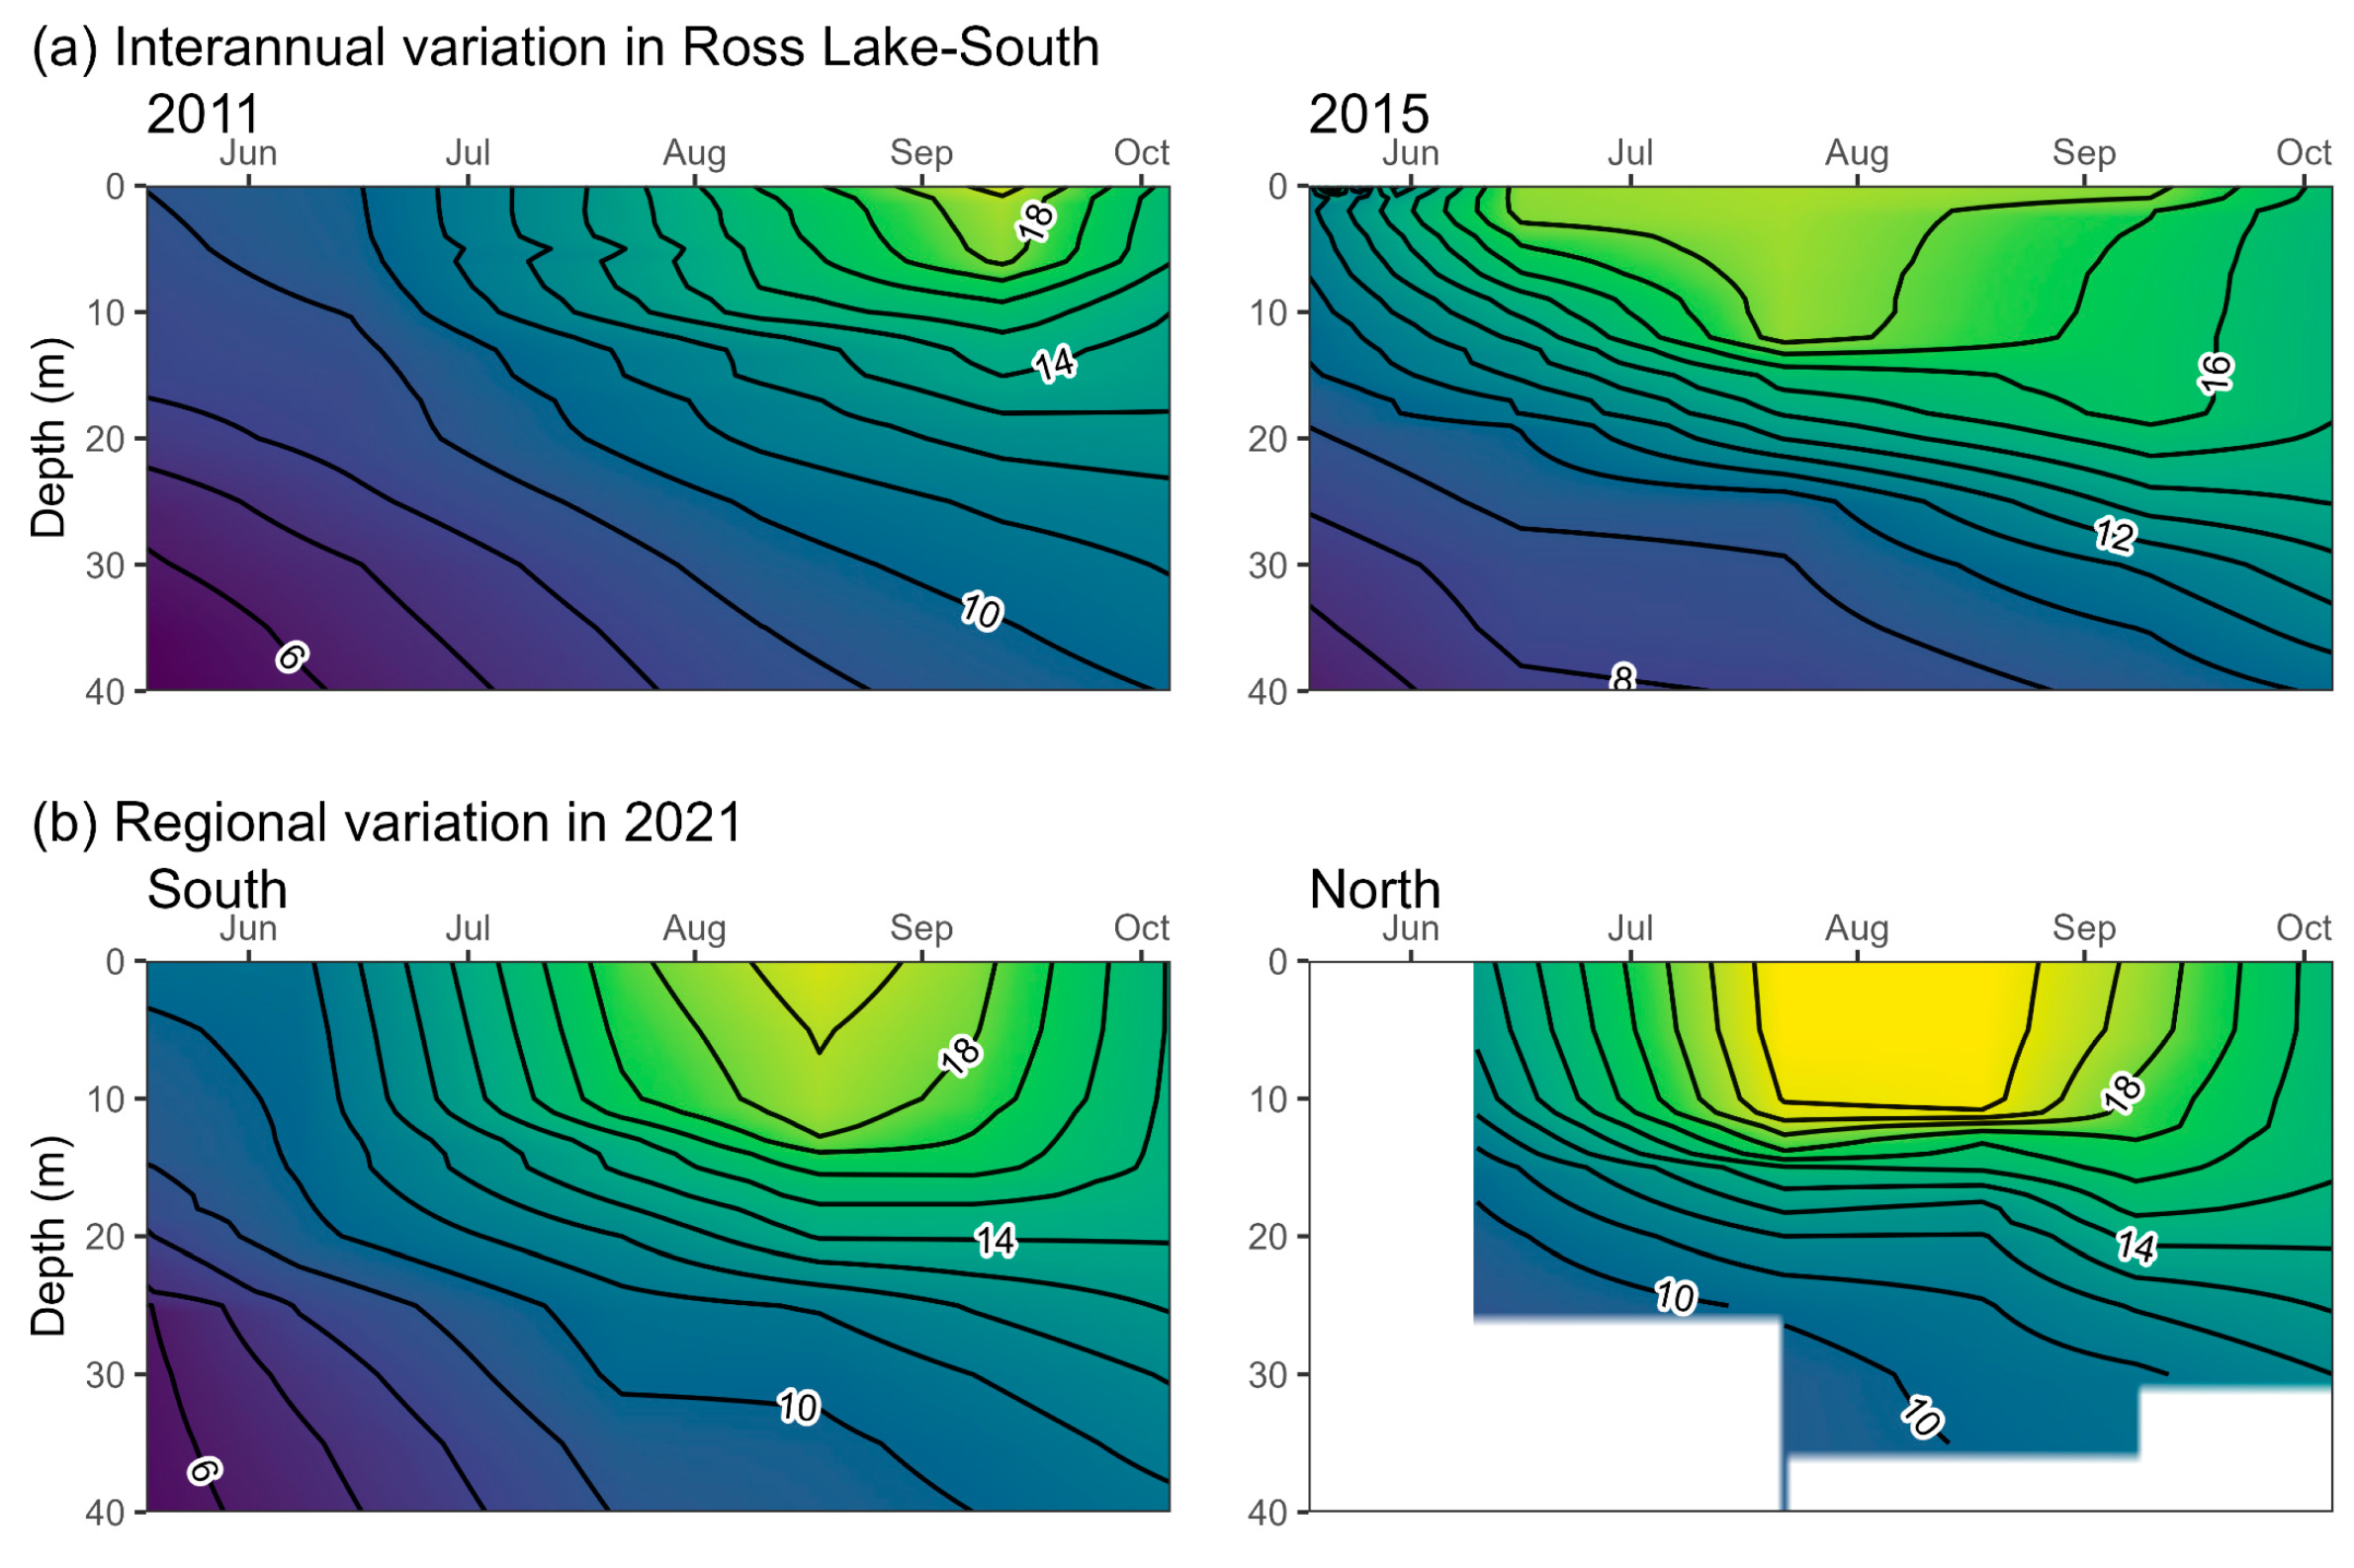
The Skagit River flows from headwaters in southwestern British Columbia, Canada approximately 240 km through northwestern Washington before draining into Puget Sound (Figure 1). The Upper Skagit River is impounded by three hydroelectric dams that were completed in 1924 (Gorge Dam), 1930 (Diablo Dam), and 1949 (Ross Dam) and are operated in an integrated manner for electricity production for Seattle City Light. Ross Lake is the largest (storage at full pool = 1.78 km3) and most upstream of the three reservoirs, with water surface at 489 m elevation and extending 37 km at full pool, which is approximately 1.6 km past the border with British Columbia. Ross Lake is typically drawn down 16–25 m during the winter, although drawdowns have extended to 40 m in recent years. The reservoir thermally stratifies from around June through October, with peak surface temperatures of 18–22 °C and hypolimnetic temperatures around 8–12 °C (Figure 2).
Downstream of the dams, the Skagit River supports some of the largest populations of Endangered Species Act-listed Chinook salmon, steelhead, and bull trout Salvelinus confluentus (resident, fluvial, and anadromous) in the Puget Sound region [37]. In addition, the river also supports large populations of coho salmon, pink salmon O. gorbuscha, and chum salmon O. keta. The river also hosts a suite of other native species including daces Rhinichthys spp., threespine stickleback Gasterosteus aculeatus, suckers Catostomus spp., lampreys Lampetra spp., sculpins Cottus spp., mountain whitefish Prosopium williamsoni, white sturgeon Acipenser transmontanus, resident rainbow trout, and resident and anadromous coastal cutthroat trout O. clarkii clarkii. Above the dams, the reservoirs, tributaries, and Skagit River mainstem have stream resident and adfluvial populations of native rainbow trout, as well as bull trout and Dolly Varden S. malma which are genetically distinct from populations below the dams [38]. Nonnative species above the dams include brook trout S. fontinalis, presumed to have adfluvial and resident life histories, and invasive redside shiner which occupy exclusively lentic habitat and have become very abundant since their unauthorized introduction around 20 years ago.

2.2. Candidate Anadromous Species and Life Histories

The potential limitations to the growth and survival of introduced anadromous salmonids in the reservoirs is dependent upon the timing of and size at migration into and out of the reservoir, and temporal occupancy of this habitat. These traits vary among species and life history types within species; therefore, we must evaluate these limitations for each species and life history. The following section reviews candidate species for introduction and their observed life history traits related to juvenile size and migration in the Skagit River below the dams.
Chinook salmon—Chinook salmon in the Skagit River below the dams exhibit three general juvenile migration strategies: fry migrants, parr migrants, and yearling migrants [39,40]. Fry migrants quickly migrate downstream following emergence and rear in estuarine habitats for several months before migrating into marine nearshore or pelagic habitats. Migrant fry arrive in the estuary at an average size of 39 mm fork length (FL), usually in February or March. Parr migrants rear for several months in freshwater habitat, reaching an average size of 75 mm FL, before migrating to marine habitats usually in late May or June. Yearling migrants rear for over a year in freshwater habitats until an average size of 120 mm FL, before migrating to the Salish Sea typically from late March through May. Utilization of lakes and reservoirs by juvenile Chinook salmon is common, and the extent of occupancy in these habitats varies [22,23,26]. Lake or reservoir rearing has been an advantageous life history strategy for rapid growth by Chinook salmon in Lake Washington [22] and the regulated Willamette Basin, presumably due to higher growth potential in the lentic habitat [21,23,24]. Therefore, it is reasonable to assume that the yearling migrant life history could include reservoir rearing (emigrating to the reservoir as fry) [23] if Chinook salmon are introduced above the dams, presuming an adequate growth environment is available.
Steelhead—Wild steelhead in the Skagit River below the dams typically rear in freshwater for 2–3 years before out migrating either as age-2 smolts (most common) at an average size of 161–172 mm FL, or as age-3+ smolts (less common) at an average size of 180–191 mm FL [41]. Migration occurs during February–June, though it typically peaks in April–May [41]. Utilization of a lake or reservoir habitat for rearing by juvenile steelhead is exceedingly rare for anadromous individuals of this species, with no occurrences reported in natural lakes or reservoirs [26,42], except for a single instance in Lake Washington where out-migrating smolts were observed feeding on the spring Daphnia bloom in the lake for less than a month [43]. Thus, it seems likely that if introduced above the dams, utilization of a reservoir habitat by steelhead would be limited to a short duration during smolt out-migration.
Sockeye salmon—Sockeye salmon fry typically recruit to lakes soon after emergence in the spring and rear for 1–2 years before migrating to the ocean. Baker Lake provides the only population of sockeye salmon currently in the Skagit River basin. This population is primarily supported by hatchery fry released into Baker Lake and Lake Shannon each spring, with minimal natural production observed. Most sockeye salmon in Baker Lake spend one full year in the lake, migrating to the ocean as age-1 smolts at an average size of 112 mm FL and 13 g, though small fractions of the population also exhibit migration in their first year or at ages 2–3 (N. Overman, Washington Department of Fish & Wildlife, written communication, January 2023). Sockeye salmon and potentially Chinook salmon are therefore the most likely anadromous salmonids to utilize reservoirs as primary freshwater growth habitats.
Coho salmon—Coho salmon in the Salish Sea typically rear in freshwater for just over a year, migrating to the ocean during the following spring (primarily in May) where they spend approximately 18 months before returning to freshwater in September–November (peak in October) to spawn at age-3 [44,45]. A lake habitat is not commonly used by coho salmon during their freshwater rearing in Washington or further south, in contrast to observations of lake rearing reported in British Columbia and Alaska [26]. Further, coho salmon have not been observed using reservoir habitat for extended periods of rearing in the western United States, and thus we expect that a lake-rearing life history for this species would be unlikely in Ross Lake.

2.3. Bioenergetics Simulations

Bioenergetics simulations were run for a hypothetical sockeye salmon population in Ross Lake to estimate per capita consumption demand on Daphnia using Fish Bioenergetics 4.0 [46] and the parameterized model for sockeye salmon [47]. All inputs described below, and the corresponding code required to run these simulations are published in the U.S. Geological Survey’s ScienceBase repository [48]. Empirical measures of sockeye salmon size were taken from Baker Lake (a nearby system with an existing sockeye salmon hatchery; Figure 1) and used as surrogate rates for growth and mortality (N. Overman, Washington Department of Fish & Wildlife, written communication, January 2023). For these simulations, we used an initial weight of 0.2 g, which was estimated from mean size of Baker Lake hatchery releases during the spring, and final weight (12.8 g) was estimated from the mean size of smolts captured the following year in the floating surface collector (FSC) during peak emigration in May, the peak month of emigration (N. Overman, Washington Department of Fish & Wildlife, written communication, January 2023). All smolts that get transported around the dam during their outmigration get collected by the FSC. We ran the simulation for 365 d, beginning on 1 May, to estimate daily per capita consumption by fitting to initial and final weight. The mean release timing of hatchery fry into the lake was closer to mid-April; however, we started the simulation on 1 May to align the end of the simulation with peak timing of smolt emigration from the lake. Thus, by using the initial weight of when juveniles begin feeding in the lake, we simulated the amount of food required by a juvenile salmon to reach the target weight (i.e., average weight of juvenile smolts at the FSC), assuming these parameters to be reasonable benchmarks for putative sockeye performance in Ross Lake.
Thermal experience for the model inputs was estimated using mean temperatures at depth from vertical temperature profiles collected in Ross Lake from May through November in 2010–2021, and surface temperatures in the forebay from November through April in 2009, 2010, and 2013 (data collected and maintained by Seattle City Light). We assumed that when the epilimnion was <18 °C, sockeye salmon would be evenly distributed over 0–30 m. When the epilimnion was ≥18 °C, we assumed that sockeye salmon would be evenly distributed within 10–30 m, thus avoiding exposure to warmer epilimnetic temperatures. We then computed thermal experience as the mean temperature across all depths occupied (Table 1).
Sockeye salmon are predominantly planktivorous in lakes and reservoirs, consuming high proportions of zooplankton (preferentially Daphnia when available) during the spring, summer, and into autumn across a range of zooplankton densities [49,50,51]. Reflecting this, we used data characterizing the average seasonal diet proportions by wet weight from O. nerka in the Lewis River reservoirs [51] and energy densities from the literature [52,53] to inform our diet inputs for the simulations (Supplementary Table S1). Daphnia weigh about 50% less and contain about 50% less water when sampled from stomach contents of salmonids than when measured from fresh zooplankton samples [52,54]; therefore, simulated consumption of Daphnia (g) was multiplied by 2 to estimate the fresh weight consumed for direct comparison to available biomass and production.

2.4. Daphnia Availability and Sockeye Salmon Capacity in Ross Lake

We utilized published data on monthly Daphnia production (biomass produced/month), standing stock biomass, and consumption demand of the existing zooplanktivores in Ross Lake (rainbow trout and redside shiner) to quantify the remaining prey availability and evaluate resource capacity for sockeye salmon rearing in the lake [35,36]. Importantly, while we included multiple prey types in our bioenergetic simulations of sockeye salmon consumption (Supplementary Table S1), we evaluated carrying capacity based only on the availability of Daphnia, assuming this key prey would be the most important to support sockeye salmon. As such, we are assuming that the other prey types exist in sufficient quantity to support the estimated consumption demand by sockeye salmon and would not be limiting. Current consumption demand versus Daphnia availability was evaluated for the whole sampled water column (0–20 m depth) in addition to a depth-use scenario to determine whether thermally driven behavior may limit access to food supply, as behavioral thermoregulation in lentic habitats is well documented for sockeye salmon [55] and Chinook salmon [23]. For this depth-use scenario, consumption demand versus prey availability was evaluated separately for the epilimnion (0–10 m) and the metalimnion (10–20 m) during thermally stratified periods when warmer epilimnetic temperatures might inhibit access by salmonids. We assumed that salmonids would be restricted to the metalimnion during peak thermal stratification, whereas redside shiners could use the entire available prey supply; thus, redside shiner consumption was evenly divided between the two layers, and rainbow trout consumption was restricted to the metalimnion. This depth-use scenario is a simplification to characterize depth-stratified consumption demand assuming salmonids are restricted from the epilimnion. We expect this to occur when epilimnetic temperatures exceed 18 ℃. Depth-stratified gillnet sampling in Ross Lake showed that most rainbow trout (around 70%) were occupying depths below the epilimnion when temperatures exceeded 18 °C [36]. These assumptions are also consistent with bioenergetic-based estimates of temperature-dependent growth potential at observed (rainbow trout and redside shiner) or expected (sockeye salmon) feeding rates (Supplementary Figure S1).
We evaluated Ross Lake’s rearing capacity for sockeye salmon on a monthly basis using two conservative estimates of carrying capacity: (1) based on a maximum exploitation rate of 50% of combined Daphnia production by the entire planktivorous fish community, assuming that the food available for sockeye salmon was what remained after consumption by the existing planktivores [51,56], and (2) based on a maximum exploitation rate of 50% of combined Daphnia production + standing stock biomass. We designated these capacity scenarios to avoid overcropping Daphnia below levels from which they could rebound [28]. Given uncertainties in estimation, interannual variability, and our understanding of how salmonid predation regulates availability of zooplankton prey, this approach provides a mechanistically based decision structure that can be used to manage the level of risk deemed acceptable when determining carrying capacity. We evaluated monthly carrying capacity for the 0–20 m depth strata and the segregated depth use scenario described above. For this depth-use scenario, we assumed sockeye salmon could only access Daphnia below the epilimnion and therefore set the maximum exploitation rate to 50% of production + biomass in the metalimnion. We estimated rearing capacity in terms of the initial number of juvenile sockeye salmon that could be fed each month, and the corresponding number of fry entering the reservoir in spring, by dividing the monthly remaining Daphnia available (maximum exploitation rate–current consumption demand of existing rainbow trout and redside shiner) by the monthly per capita consumption rates from the sockeye salmon bioenergetics simulations described above.
For the two carrying capacity scenarios, we calculated the initial number of fry required to enter Ross Lake in May to fit our estimated carrying capacity in September (the most limiting month for prey supply in both scenarios) and the resulting number of smolts produced the following May, assuming survival rates were constant throughout the year. We calculated these figures across a range of annual in-lake fry-smolt survival rates including the range observed in Baker Lake (min = 3.6%, mean = 8.5%, max = 14.3%; N. Overman, Washington Department of Fish & Wildlife, written communication, January 2023) and using a global average of 25% survival [57] as our maximum bound estimate. We then estimated how many adults would be expected to return under each scenario using the smolt-to-adult return rate from Baker Lake sockeye salmon from recent years (2015–2021: 4.1%) compared to the historical mean (1999–2021: 6.3%; N. Overman, Washington Department of Fish & Wildlife, written communication, January 2023). We did not incorporate predation into the carrying capacity model, as we expect predation mortality to be dynamic and variable, and thus challenging to incorporate. Therefore, we evaluated the two processes separately. The impact of different predation rates on the abundance of fry and smolts can be inferred through the scenarios modeling various rates of fry-smolt survival.
Predation potential was evaluated using simulated monthly consumption by the current piscivore populations in Ross Lake, based on an age-structured unit population of 1000 bull trout > 200 mm FL; the abundance of the other salmonid species were scaled to this base value by using relative frequencies from gill net surveys [58]. As such, for every 1000 bull trout > 200 mm FL, the relative abundances for other salmonids corresponded to 2430 rainbow trout, 286 brook trout, and 126 Dolly Varden > 200 mm FL [36]. We used this age-structured unit population as a base because the population abundances of the salmonid species are not well studied in this system. Accordingly, the base consumption estimates from the unit population can be scaled up or down using a simple expansion factor to evaluate different predation scenarios across alternative estimates of population abundance [58]. Daily consumption was simulated for each age class of each species using bioenergetics models, which were informed by predator growth rates (from scale analysis), seasonal and size-specific stomach content analysis and stable isotope mixing models for each species and size class of predator. Thermal experience was estimated using empirical depth distributions and monthly vertical temperature profiles (see Johnson et al. [36] for detailed methods and results of this analysis). Under current conditions, the primary fish prey in the lake is redside shiner; however, a measurable proportion of salmonid prey are also consumed, and the proportion of salmonids in the diet would almost certainly change following introduction of anadromous fishes depending on their densities and spatial/temporal availability. Thus, we quantified minimum predation potential as the current population consumption on resident salmonids and then explored a range of higher proportional contributions of putative anadromous fish to piscivore diets to bound a reasonable range of possible predation mortality rates.
Simulated consumption of all fish prey was converted to numbers of lake-rearing sockeye and Chinook salmon by dividing the biomass consumed (g) by the daily simulated body weight (g) for sockeye salmon from the bioenergetic simulations described in the carrying capacity section above. Daily growth of lake-rearing Chinook salmon was simulated assuming they recruit to the lake as fry [23] in March and grow to the same size as the yearling life history below the dams (Initial size: 39 mm FL, 0.7 g; Final size: 120 mm FL, 19.7 g). Predation was adjusted for gape limitation of the predator population, assuming that predators could consume fusiform prey up to 50% of their length [58,59,60,61,62]. Daily FL (mm) for each age class of predator, juvenile sockeye salmon, and lake-rearing Chinook salmon were estimated from the simulated weight using length-weight regressions developed for the resident populations (Supplementary Table S2), Baker Lake sockeye salmon 2010–2021 ( W = 2.61 × 10 6 × F L 3.264 , R 2 = 0.938, N = 8301, FL range: 60–173 mm; N. Overman, Washington Department of Fish & Wildlife, written communication, January 2023), and Skagit River steelhead as a surrogate for Chinook ( W = 1.52 × 10 5 × F L 2.94 , R 2 = 0.99, N = 628, FL range: 45–235 mm) [63]. This was performed for several scenarios, assuming that predation on juvenile sockeye and Chinook salmon would account for a range from 10–90% of the total fish portion of the diet. We evaluated this range of scenarios because we do not know how piscivores may shift their diets in response to introduced salmonids. These ranges were selected to bracket the range of possibilities, which we determined from data on rainbow trout and bull trout diets in lakes and reservoirs where pelagic salmonids like kokanee were the major prey item observed, sometimes accounting for 100% of their diets [60,64,65]. For species that would only be using the reservoir as a migration corridor, predation mortality was estimated using a similar approach but only during the month(s) of expected migration using the size of expected migrants (detailed in the species descriptions section of the methods above).
Abundance of the salmonid piscivores has not been well studied in this system; however, annual snorkel surveys in the Upper Skagit River (British Columbia) provide some abundance index data for bull trout in the Ross Lake basin [66]. Telemetry studies on bull trout in the Upper Skagit River have shown that most of the population migrates between Ross Lake and the Skagit River for at least some portion of the year [67], supporting our choice to use these surveys to estimate abundance of the Ross Lake population. These surveys (1998, 2009–2017, and 2020) were conducted during early September and covered only mainstem reaches starting at the Chittenden Bridge immediately upstream of the Ross Lake reservoir to the confluence with the Sumallo River (31.3 river km upstream). Notably, these surveys occur about a month before spawning is believed to begin, and thus these counts may considerably underestimate the actual spawning population [67,68]. Abundance of Upper Skagit River bull trout was estimated at ca. 4800 adults in 2011 using counts from these surveys and an assumed survey area representing around 40% of the high-quality spawning habitat accessible to Ross Lake [69]. Updating this estimate with counts from surveys in 2017 and 2020 (1241 and 1070 individuals, respectively), we estimated an adult bull trout population in Ross Lake from 2700 to 3100. Thus, for our analysis of predation potential on introduced anadromous salmonids, we also evaluated predation by the piscivore population relative to an estimated abundance of 3000 bull trout >200 mm FL in Ross Lake, which upon the expansion described above corresponds to 7290 rainbow trout, 858 brook trout, and 378 Dolly Varden.

3. Results

3.1. Daphnia Availability and Sockeye Salmon Capacity

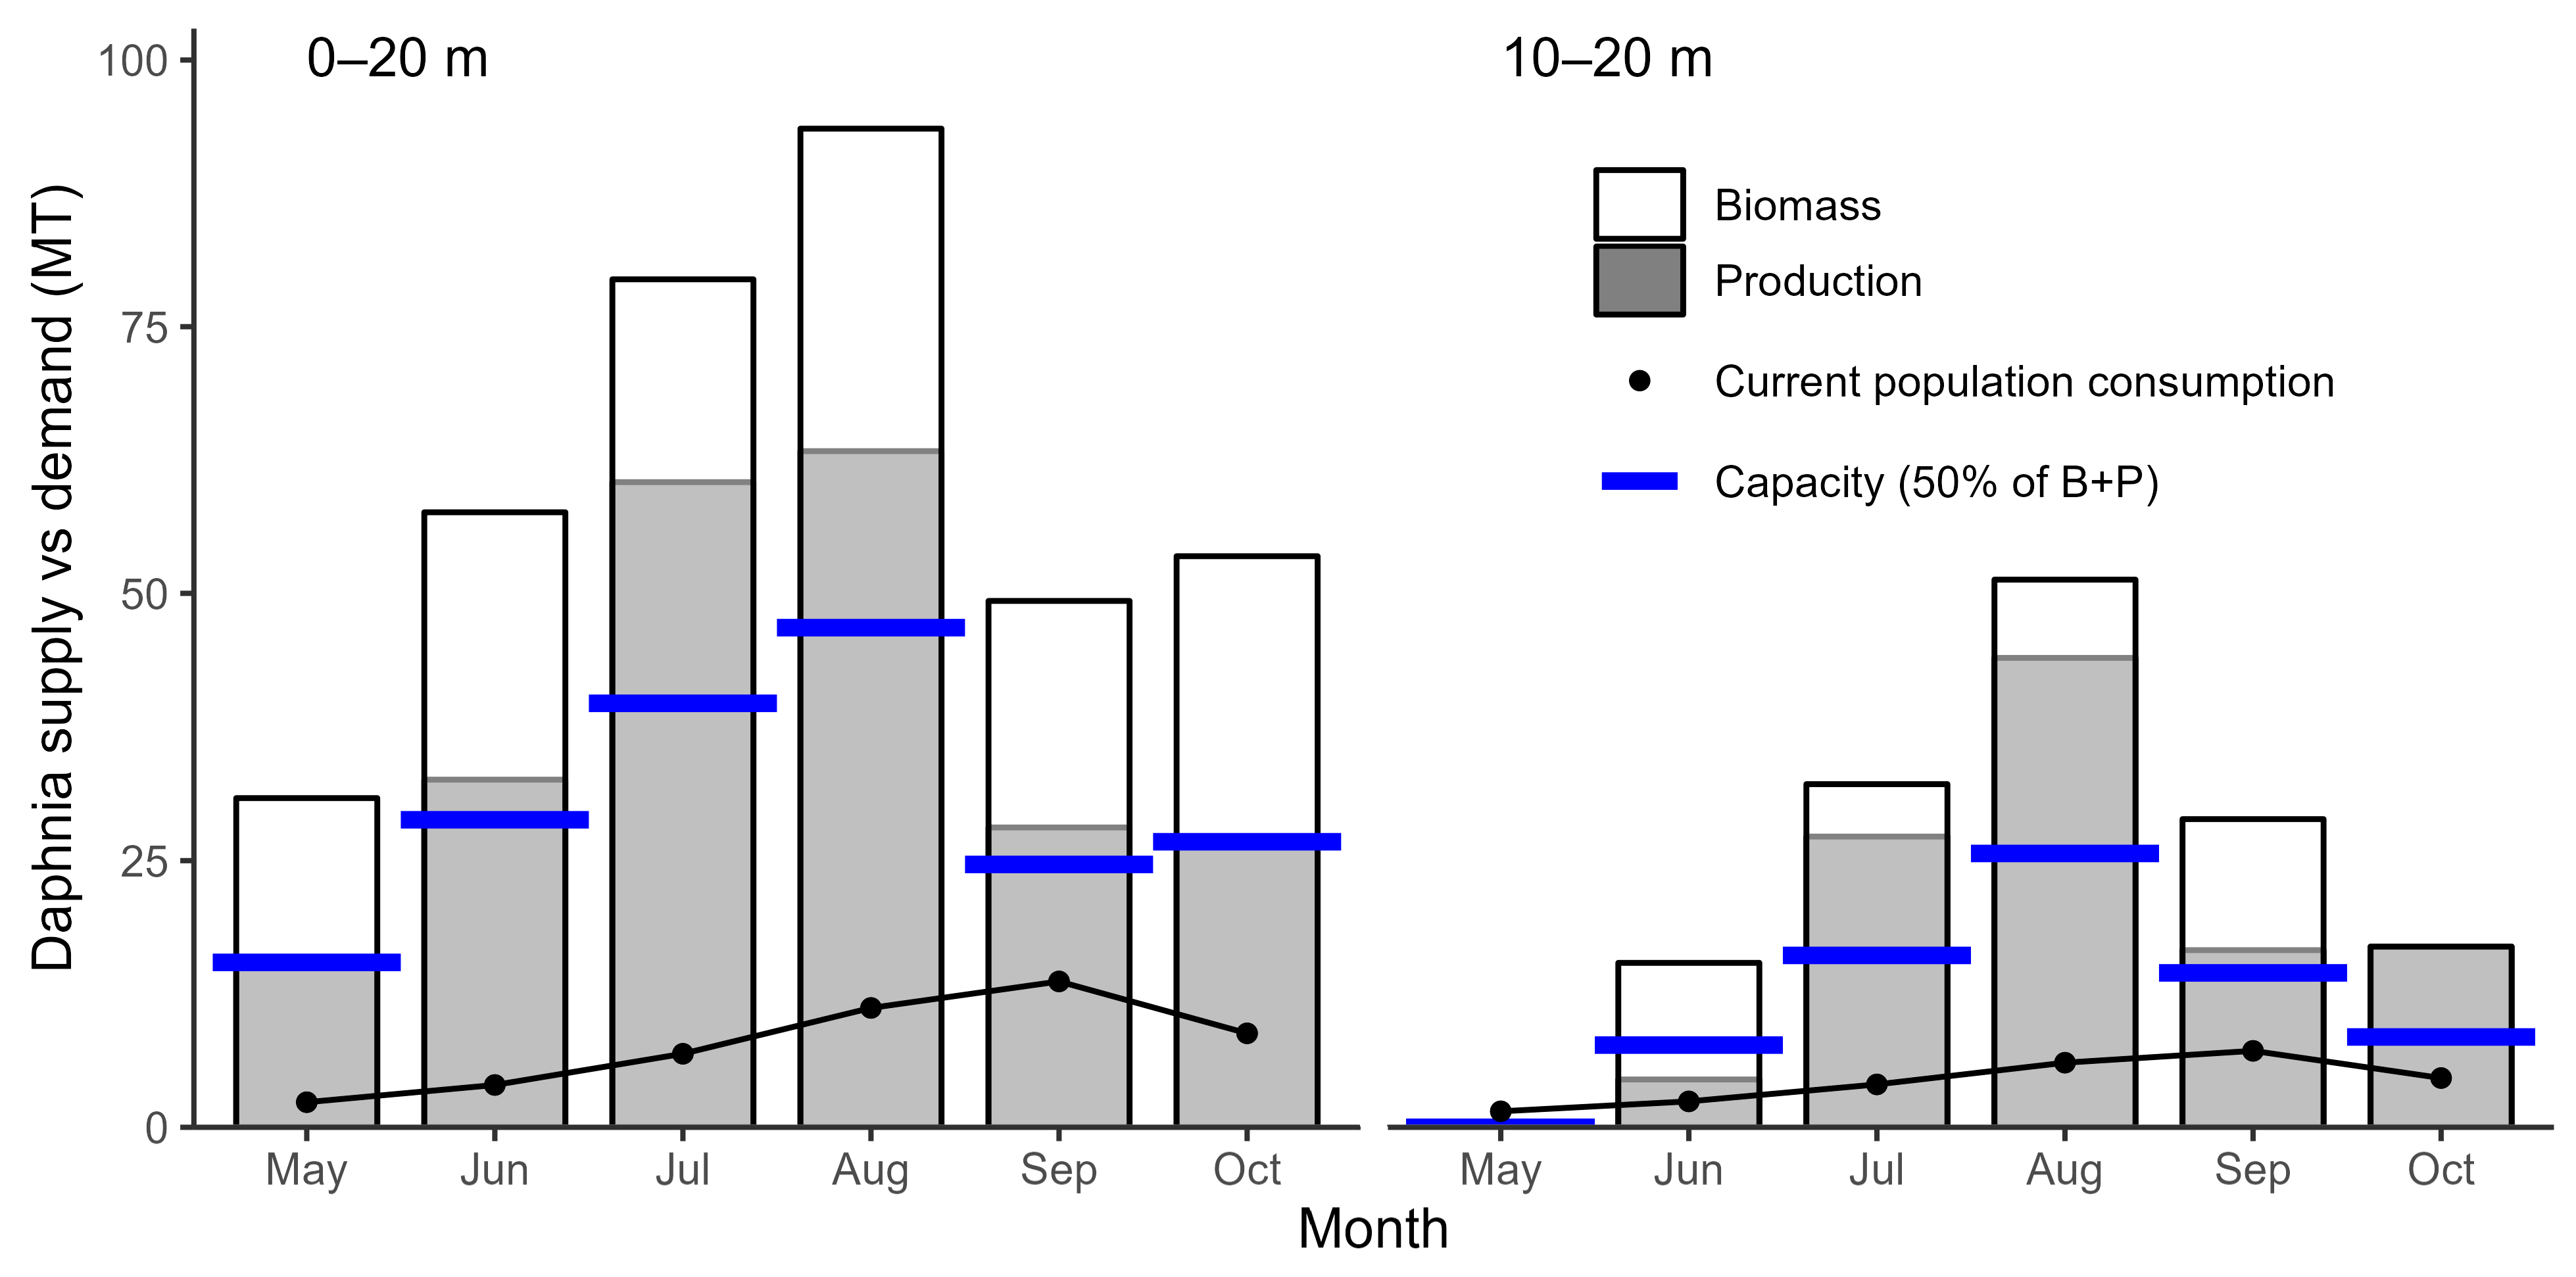
Daphnia densities in Ross Lake were low across all months, years, and regions sampled, with <1 individual/L observed except during June 2019 (Figure 3). Densities were typically, but not always, lower in the metalimnion compared to the epilimnion, and these densities were consistently lower than the threshold at which sockeye will switch from feeding exclusively on Daphnia (0.4 individuals/L) [50]. During the growing season, the supply of Daphnia (in terms of biomass and production) was lowest in May and continually increased to a peak in August before declining substantially in September (Figure 4). However, consumption demand by the dominant planktivores in the lake (redside shiner and rainbow trout) was lowest in May and highest in September, indicating that prey were most limited in late summer.
Bioenergetic simulations estimated that juvenile sockeye salmon in Ross Lake would annually consume 74.2 g Daphnia (fresh weight) per capita. The monthly initial abundance of juvenile sockeye salmon that could be supported by the Daphnia supply in Ross Lake varied by nearly fortyfold depending on the month, thermal restriction scenario evaluated, and the carrying capacity definition used (Table 2). Using the more conservative capacity definition (maximum consumption demand constrained to 50% of Daphnia production by the existing planktivore community plus introduced sockeye salmon), we estimated that Ross Lake could not support any additional planktivores in June if they are thermally restricted to the metalimnion, whereas around 5,140,000 could be supported if not restricted. September was the most limiting month assuming no thermal restriction and could support around 54,000 juveniles, which corresponded to initial fry abundances (assuming entry on 1 May) of 87,000 if annual fry-smolt survival is 25% or 125,000 if annual fry-smolt survival is 8.5%.
Capacity estimates were considerably higher when using the more liberal capacity definition—maximum consumption demand of 50% of Daphnia production + biomass by the existing planktivore community plus introduced sockeye salmon (Table 2). Under this constraint, September was still the most limiting month, and we estimated capacity to support around 1,460,000 juveniles during this month if sockeye salmon are not restricted from the epilimnion. This corresponded to initial fry abundances of 2,330,000 (resulting in 583,000 smolts) if annual fry–smolt survival is 25% or 3,352,000 (resulting in 285,000 smolts) if annual fry–smolt survival is 8.5%. These capacity estimates were 51% higher than in the scenario of thermal restriction from the epilimnion. The month of June could support the highest number of juveniles under the scenario of no thermal restriction (10,356,000), which corresponded to initial fry abundances of 11,650,000 or 12,768,000 assuming annual fry–smolt survival of 25% or 8.5%, respectively.
Using the constraint of a maximum consumption demand of 50% of Daphnia biomass + production by the existing planktivore community plus introduced sockeye salmon in the most limiting month of September as the nominal scenario, we estimated potential smolt production in the following spring from 106,830 smolts under a scenario of thermal restriction and low fry–smolt survival (3.6%) to 582,592 smolts under a scenario of no thermal restriction and high fry–smolt survival (25%; Table 3). The potential number of returning adults varies with the juvenile capacity estimate as well as survival at the fry-to-smolt and smolt-to-adult stages (Table 3), with a low estimate of 4380 adults (juveniles experience thermal restriction during the most limiting month, fry–smolt survival = 3.6%, and smolt–adult survival = 4.1%) and a high estimate of 36,703 (juveniles do not experience thermal restriction during the most limiting month, fry–smolt survival = 25%, and smolt–adult survival = 6.3%). Using the mean fry–smolt survival rate from Baker Lake sockeye salmon (8.5%) and their contemporary mean smolt-to-adult survival (4.1%), we estimated adult returns from 7742 to 11,682, under capacity scenarios of thermal restriction and no thermal restriction in the most limiting month, respectively.

3.2. Predation Mortality

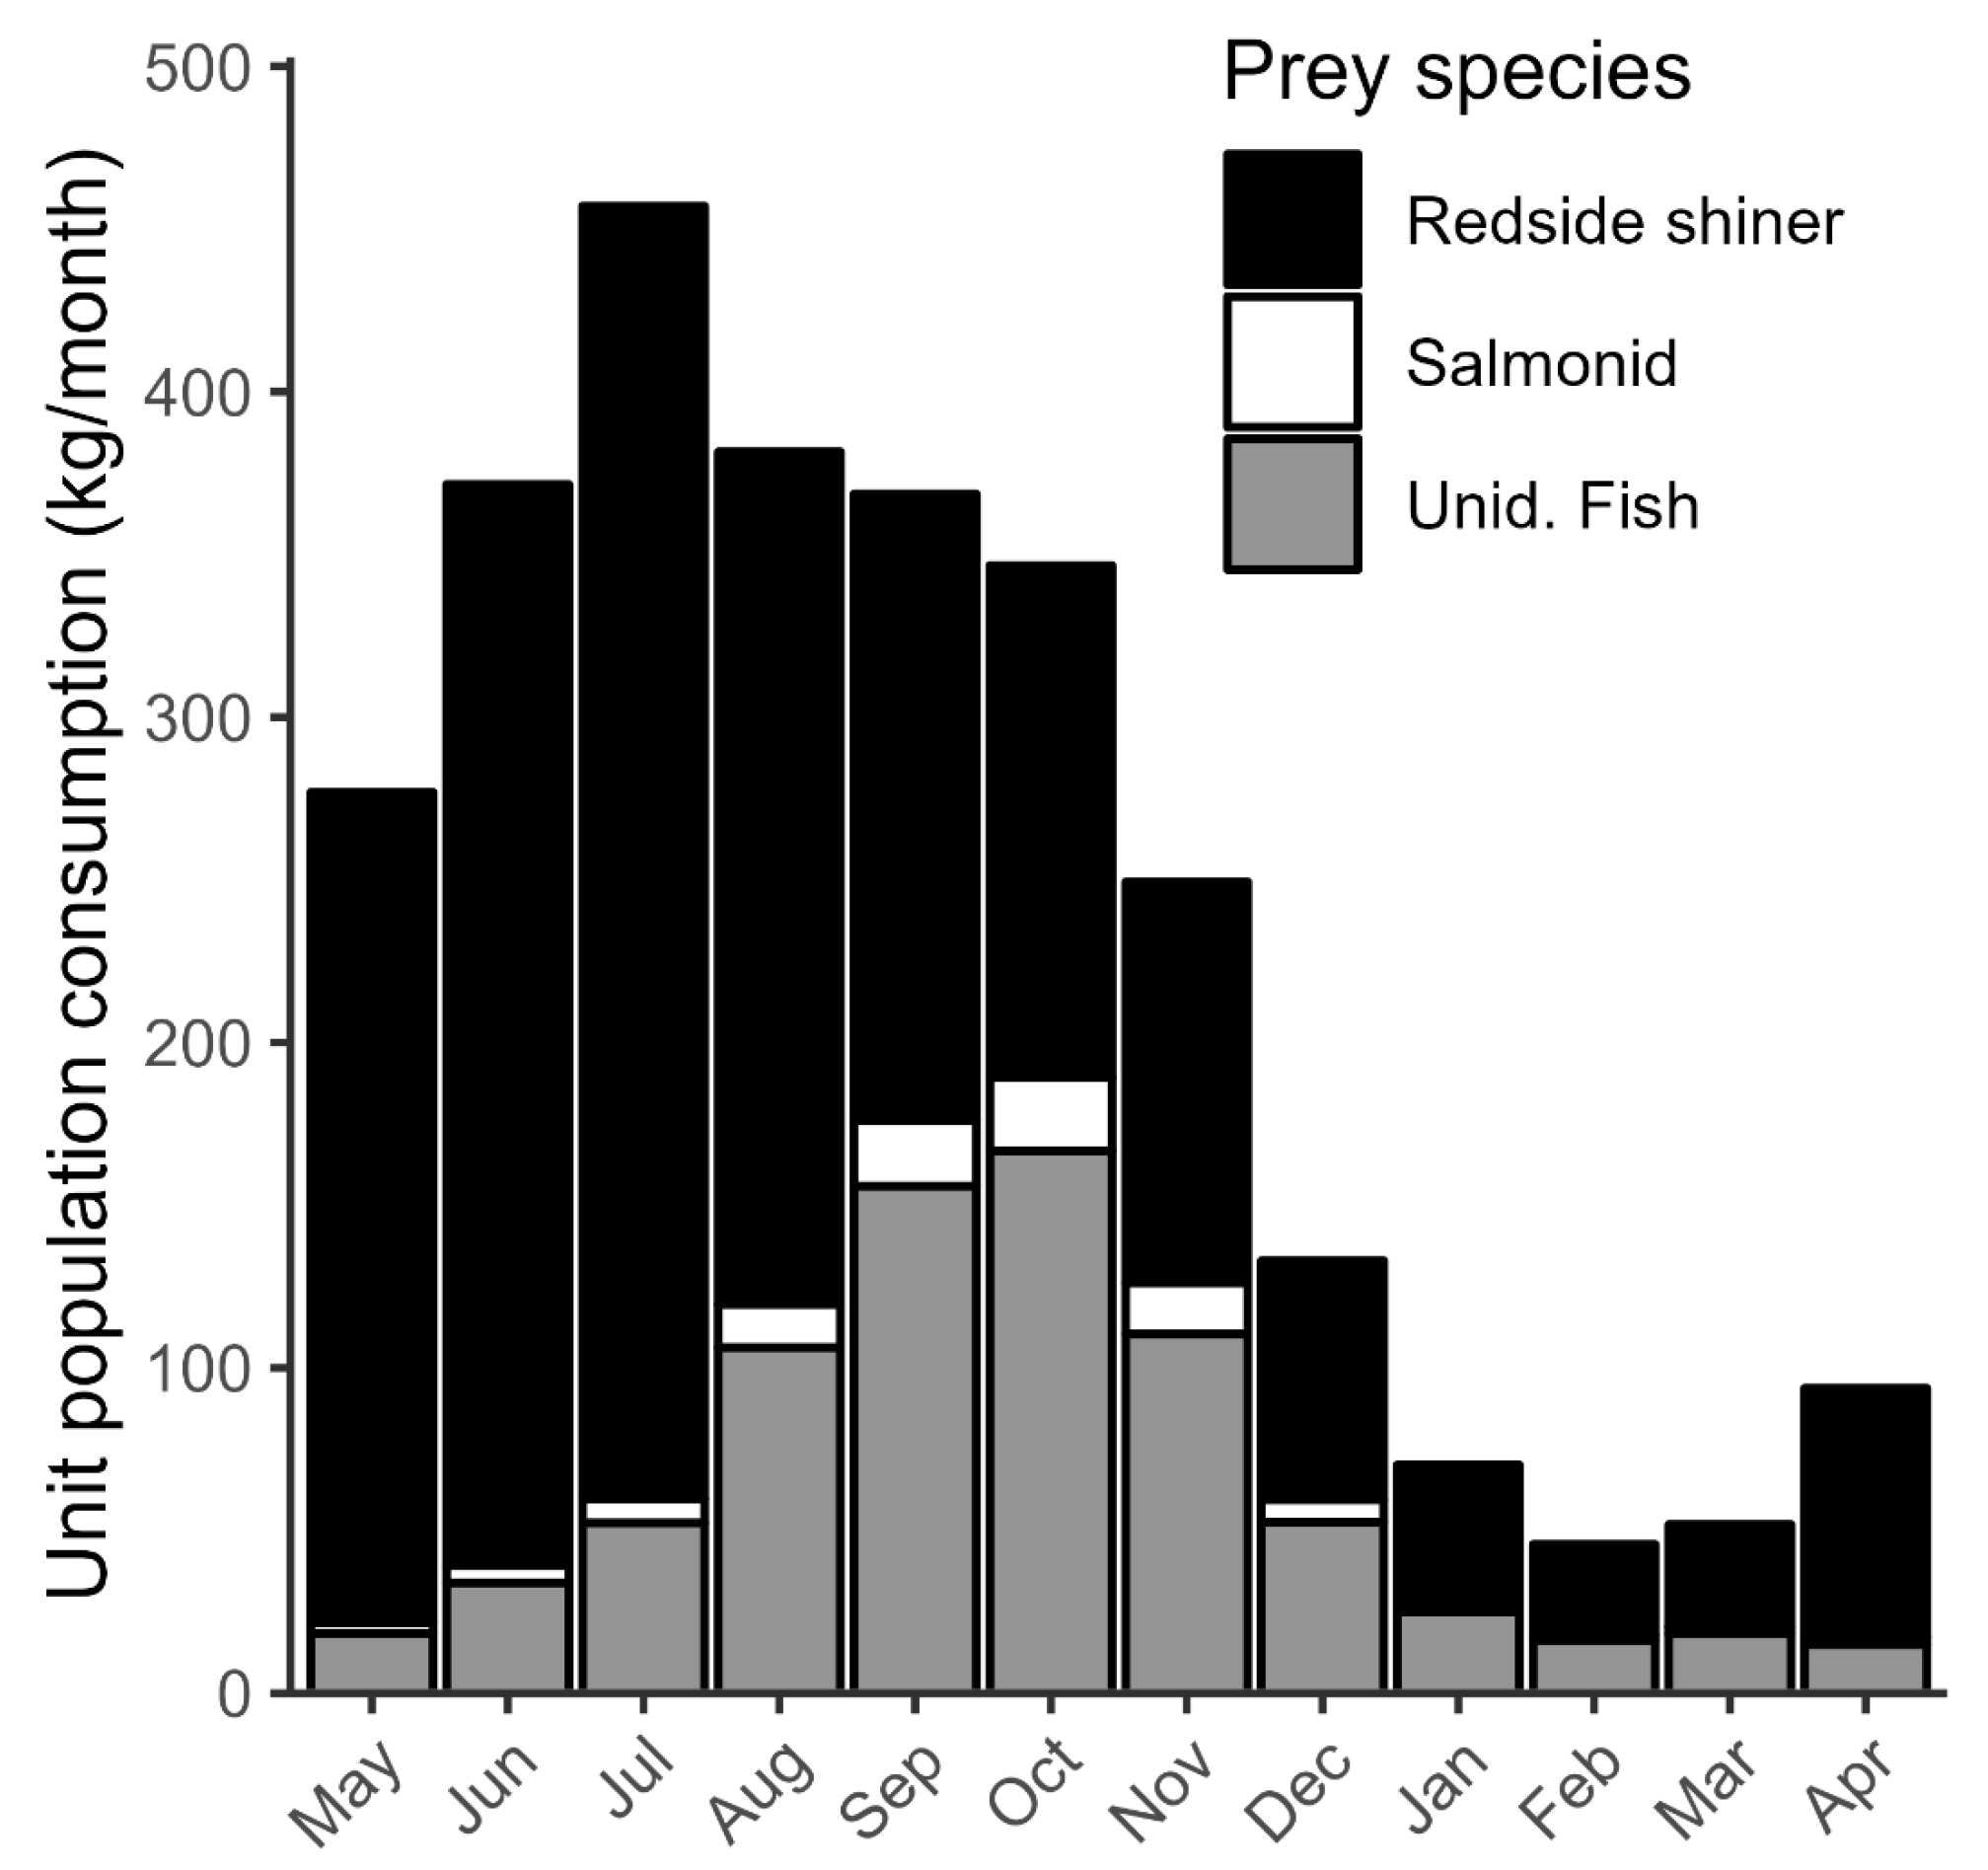
The unit population of piscivores (bull trout, rainbow trout, brook trout, and Dolly Varden, relative to 1000 bull trout > 200 mm FL) in Ross Lake consumed an estimated 2846 kg of fish annually, with most composed of nonnative redside shiner (1972 kg) and unidentified fish (771 kg) and a smaller portion of salmonids (103 kg). Fish consumption was highest during the growing season, peaking during July, and was lowest during Dec–Apr (Figure 5). Current predation on salmonids was lowest in spring and increased through summer and fall. Simulated consumption during winter was very low, and consumption of salmonid prey, based on diet interpolations between fall and spring, was extremely low.
We assumed that the current predation demand on native salmonids would represent the minimum expected predation potential on introduced salmonids. Thus, to estimate a minimum level of predation in terms of numbers of fish, assuming that 100% of predation on native salmonids (i.e., adfluvial residents) would be replaced by anadromous salmonids, we divided monthly biomass of salmonids consumed by the average monthly body weight of sockeye salmon from bioenergetics simulations. This resulted in an estimated 59,293 juveniles consumed annually by a unit predator population referenced to 1000 bull trout > 200 mm FL. Chinook salmon that migrated directly to the reservoir for rearing until achieving smolt size the following year would be subjected to an estimated loss of 16,748 juveniles during the 12 months of simulated reservoir rearing (beginning on 1 March). This translates into considerably lower mortality for the species migrating through the reservoir compared to species or life history types that reared predominantly in the reservoir (Table 4). The fry-migrant life history of Chinook salmon would be the smallest fish migrating through the reservoir and are thus the most vulnerable; however, the overall impact of predation would be buffered because metabolically regulated consumption rates are lower during their expected migration during March when water temperatures are very low.
Current consumption rates of salmonids in Ross Lake may not reflect diets following introduction of anadromous salmonids, due to the expected higher densities of anadromous juveniles entering the reservoir in larger concentrated pulses compared to the resident salmonid population. Also, predatory salmonids would have easier access to them during thermal stratification compared to redside shiner. Therefore, we also evaluated predation potential across a range of proportions of diet switching to anadromous juveniles. The predation potential for sockeye salmon was highest during the spring, when consumption of fish prey was low but increasing and the newly recruited sockeye salmon were small; however, predation would be heavily influenced by the portion of total fish consumption that shifted to lake-rearing sockeye or Chinook salmon (Figure 6). In spring and early summer, predation by the unit piscivore population relative to 1000 bull trout could be substantial in May alone, for example ranging from around 96,000 sockeye salmon if they comprised 10% of total fish consumption, to 868,000 if they became 90% of the total fish consumption. This could compound into considerable annual mortality in the lake, from 273,000 individuals if sockeye salmon were 10% of the fish prey consumed across the year, to 2,453,000 individuals if they were 90% of the fish prey consumed. Due to the larger size of yearling smolts and earlier emigration to the lake compared to sockeye salmon, we estimated lower predation potential on Chinook salmon (Figure 6). We estimated comparable annual mortality during their first 12 months of reservoir rearing from 66,000 individuals if lake-rearing Chinook salmon were 10% of the fish prey consumed across the year, to 594,000 individuals if they were 90% of the fish prey consumed.
Fish migrating through the reservoir would be exposed to less predation pressure in the reservoir, and the impact would be dependent on their size, the duration and timing of migration, and the response of the predators to a predictable annual pulse of prey (Figure 7). Despite their small size, the fry-migrant life history of Chinook salmon may be less vulnerable to predation as their expected window of migration occurs when predator consumption rates are relatively low. This would translate to predation potential estimates of 7207 to 64,860 fry across the migration window, assuming 10–90% of fish consumption by the unit predator population was targeted at migrating Chinook salmon fry. Predation potential decreases as size/age at migration increases, with age-3 steelhead smolts exhibiting the lowest numeric maximum predation potential (Figure 7).
Expanding from the predation impact by a unit population of 1000 bull trout > 200 mm FL and the corresponding abundances of the other predatory salmonids to our best estimate of the actual predator population abundance (all piscivores relative to 3000 bull trout >200 mm FL) has the largest implications for fry–smolt survival rates of lake-rearing sockeye and Chinook salmon. This could translate into annual losses through predation of 818,000 juvenile sockeye salmon if they were 10% of the fish fraction of annual consumption, to 7,358,000 individuals if they were 90% of the fish prey consumed. Estimates of predation potential on juvenile Chinook salmon in their first 12 months of reservoir rearing are considerably lower compared to sockeye salmon and range from 198,000 individuals if they were 10% of the fish prey consumed across the year, to 1,783,000 individuals if they were 90% of the fish prey consumed.

4. Discussion

We used bioenergetic modeling to identify the mechanisms by which bottom-up and top-down food web processes can present potential challenges to the production and survival of anadromous salmonids in reservoir systems. Given the recent popularity for such interventions, our work provides a framework for evaluating the feasibility of introducing anadromous salmonids above high-head dams. Results showed that modest resource capacity may be available to support lake rearing for pelagic anadromous salmonids in Ross Lake; however, predation could limit juvenile survival, and thus the smolt production, of lake-rearing species. Predation would also affect smolts migrating through the reservoir, but to a lesser extent. The levels of mortality would depend on the size of the juveniles, timing and duration of reservoir occupancy, and the proportion of piscivore diets that would shift to anadromous salmonids. The relative role of predation in driving overall fry–smolt survival rates of any introduced populations will depend on the number of fry entering the reservoir, and thus can only be evaluated in the context of the estimated reproduction potential of the tributaries.
Our evaluation of both carrying capacity and predation potential on lake-rearing sockeye salmon is strongly influenced by their expected growth rate and the potential effects of size-selective mortality. We used growth data from Baker Lake sockeye salmon as a surrogate for what could happen in Ross Lake. In the Baker Lake system, most juvenile sockeye are stocked from the hatchery into the lake in the spring as fed fry (mean size approx. 0.2 g), and age-1 smolts (mean: 112 mm FL) are larger than what is typical for the species (mode of age-1 smolt lengths: 60–90 mm) [57]. Sockeye salmon growth in lakes is closely linked to zooplankton density (mg/m2) and water temperature [27,70], and thus low-zooplankton biomass in Ross Lake may result in lower-than-expected growth. Although the lake could theoretically support additional slower-growing fish (because their individual consumption demand is lower), this would likely present a tradeoff with increased mortality. Slower-growing juveniles would be more vulnerable to predation during reservoir rearing, which could result in lower fry–smolt survival rates. Smaller smolt size could also result in lower marine survival rates [71].
Uncertainty in how effectively sockeye salmon would be able to feed on the low zooplankton densities observed in Ross Lake limit our ability to predict how these various tradeoffs may play out in Ross Lake. Our analysis of zooplankton production was limited to Daphnia, whose densities were most often at or below the threshold where sockeye salmon feed exclusively on Daphnia (0.4 individuals/L) [50]; thus, it may be important to expand future zooplankton studies to include other prey species such as copepods. Notably though, Daphnia were the dominant zooplankton taxa consumed by rainbow trout in Ross Lake, with larger bodied Leptodora also contributing substantially in some seasons. However, we observed minimal proportions of copepods or Bosmina in rainbow trout diets, and copepod densities were similarly low from May to October (<0.7/L) [48]. Further, kokanee exhibit around 70% lower capture success on copepods compared to Daphnia (30% success compared to 100% success) [70], and thus switching to copepods would likely result in lower foraging efficiency and growth rate for sockeye juveniles. Functional response experiments would improve our understanding of the relationship between zooplankton density and sockeye salmon consumption/growth rates. Such experiments have been performed with kokanee; however, the experimental prey densities used previously (minimum of 3 Daphnia/L) [72] were not representative of the low Daphnia density observed in Ross Lake.
We identified that predation potential on lake rearing juveniles may be a substantial limitation to survival and corresponding smolt production in Ross Lake; however, uncertainty in how piscivores would shift towards introduced anadromous species corresponds to a large range of potential effect size. In Kachess Lake, Washington—a reservoir where bull trout co-occur with a community of pelagic kokanee, non-pelagic salmonids, redside shiner, and other littoral/benthic prey fish—stable isotope mixing models estimated that pelagic salmonids contributed 76% of bull trout diets [65]. Kokanee are also the dominant prey for bull trout in Lake Billy Chinook [60], and for larger bull trout, rainbow trout, and cutthroat trout in Pend Oreille Lake, Idaho [64]. Additionally, stable isotope analysis suggested that native rainbow trout consume Chinook salmon fry during the spring in some reservoirs in the Willamette River, Oregon [73]. During periods of stratification when the epilimnion is too warm for most salmonids, pelagic species such as sockeye salmon may be more available to piscivorous salmonids than redside shiner because of their overlapping thermal preferences and depth use. Under current conditions lacking anadromous salmonid introductions, diel vertical migration to feed on redside shiner in the epilimnion may be the most efficient foraging strategy due to the high densities of these prey fish [74]; however, we would expect this to change as densities of salmonids increase in deeper water following proposed introductions. Further, predation on juvenile sockeye salmon can determine fry survival in lakes and has been a barrier to success for some enhancement/stocking programs [29,30,75]. We expect that predation pressure will vary as predator populations change over time; however, by using the unit population approach, predation impacts can be easily updated by multiplying across our estimated size-structured consumption rates, which incorporate seasonal variability in diet, consumption rates, and relative abundance among species and size/age classes of predators.
Bull trout and rainbow trout in Ross Lake are currently feeding at relatively low or average proportions of their theoretical maximum consumption rates (%Cmax; bull trout: 25–31%; rainbow trout: 31–36%) [36]. One possible explanation for this is that warm temperatures in the epilimnion limit foraging opportunities for these predators during the summer, preventing them from fully exploiting the redside shiners. Alternatively, if bull trout can remain in contact with high densities of redside shiners and maintain higher-than-average feeding rates in the epilimnion, some fraction of these predators might adopt this strategy, as long as prey densities remain high in predictable nearshore locations, and epilimnetic temperatures do not increase. If densities of introduced salmonids are high enough, this could increase consumption rates by the predators beyond what we estimated in our simulations. Bull trout are also known to binge feed (i.e., temporary episodes when %Cmax > 100%) while tracking pulses of salmon migrations, so predation rates on migrating smolts could also exceed our predictions [76,77]. Recent studies tracking predator–prey behaviors at floating smolt collectors have reported bull trout tracking pulses of smolt migrations at these structures, as they do in lake outlets of natural systems [78,79].
Introduced anadromous salmonids will need to navigate the tradeoffs between growth potential and survival in tributary habitats versus predation risk in the reservoirs. Given the high levels of predation in Ross Lake under current conditions, life history expressions that migrate at larger sizes/older ages may be advantageous for introduced anadromous salmonids in this system. Production of such life histories will thus be limited by growth potential and habitat availability in the tributaries. Intrinsic potential (IP) modeling of the Skagit River mainstem and other tributaries above the dams indicated that these habitats are of predominantly low or medium IP for Chinook and coho salmon [34], suggesting potential habitat limitations for these species. The IP modeling indicated that high IP habitat is more prevalent for steelhead; however, bioenergetic analyses of juvenile rainbow trout growth in Ross Lake tributaries have estimated low scope for growth for this species [34]. That study determined that age-2 rainbow trout did not attain adequate growth rates to reach the size of successful age-2 or age-3 steelhead smolts downstream of the dams without extending the duration of stream rearing and incurring additional substantial mortality. This initial analysis indicates that growth potential of these extended stream rearing life histories may be limited for tributaries of Ross Lake.
Our analysis was limited to scenarios of single species introductions; evaluating the food web capacity for introductions of multiple species simultaneously would become increasingly complex. The rearing capacity of the reservoir could support one or a mix of juvenile salmonid species, but the finite availability of zooplankton would need to be shared among species and life history types. Introducing multiple species might distribute predation impacts among species, but this would depend on differential spatial–temporal overlap with piscivores and their relative abundance. It may also be important to consider any cascading effects to redside shiner survival and abundance that may be associated with decreased zooplankton availability (resource competition with sockeye salmon) or decreased predation pressure if piscivore diets shift to consuming more salmonids and fewer redside shiner. These food web interactions will play out within the physical context of the reservoir hydrology as driven by climate and water operations, thus highlighting the importance of evaluating seasonal flow management in relation to thermal stratification, juvenile migration timing, and the corresponding effects on migration rates through the reservoir and vulnerability to predation. Exploration of these more complex responses is beyond the scope of this study, but nonetheless important to consider for further evaluations of feasibility. If experimental introductions are to occur, an adaptive management and research program would be critical to address these concerns and adequately monitor food web changes and factors driving introduction success. A successful introduction program will rely on adult returns that exceed replacement enough to support harvest and sufficient spawner escapement, which could be a challenge in this system given the limitations to growth and survival that have been identified thus far. Future feasibility studies would therefore benefit from focusing on these potential challenges identified for the juvenile life stage.

Supplementary Materials

The following supporting information can be downloaded at: https://www.mdpi.com/article/10.3390/w16081157/s1, Figure S1: Growth potential as a function of temperature for existing planktivores and anadromous salmonids proposed for introduction into Ross Lake; Table S1: Diet proportions and energy densities (J/g wet weight) used for sockeye salmon Oncorhynchus nerka bioenergetics simulations; Table S2: Length-weight regressions for salmonids in Ross Lake.

Author Contributions

Conceptualization, R.C.J. and D.A.B.; methodology, R.C.J. and D.A.B.; formal analysis, R.C.J.; data curation, R.C.J., B.L.J. and T.J.C.; writing—original draft preparation, R.C.J.; writing—Review and Editing, R.C.J., B.L.J., T.J.C., J.J.D. and D.A.B.; visualization, R.C.J.; supervision, D.A.B. and J.J.D. All authors have read and agreed to the published version of the manuscript.

Funding

Funding for this study was provided by Seattle City Light.

Data Availability Statement

Data generated as a part of this study described in the methods are published and available online (Johnson et al., 2024a) [36]. Data from Washington Department of Fish & Wildlife are not publicly available. Please contact N. Overman for information.

Acknowledgments

Funding and support for this study was provided by Seattle City Light—in particular, we thank Jeff Fisher, Erin Lowery, and the Diablo Lake boat house crew for critical support provided during our field operations. We would like to thank North Cascades National Park and Ross Lake Resort for their assistance with field sampling logistics. We also want to thank Tom Barnett in particular for his support, angling efforts, and knowledge of the Ross Lake fishery. We are grateful for Marshal Hoy, Jon Mclean, Karl Stenberg, Lisa Wetzel, Ella Wagner, and Nancy Elder for assistance in the field and laboratory. This study was improved by input from Tom Quinn and Julian Olden, and comments from two anonymous reviewers. Handling of vertebrates was conducted under the auspices of the Institutional Animal Care and Use Committee of the U.S. Geological Survey, Western Fisheries Research Center IACUC protocols #2008-57. Any use of trade, firm, or product names is for descriptive purposes only and does not imply endorsement by the U.S. Government.

Conflicts of Interest

The authors declare no conflicts of interest.

References

  1. Bubac, C.M.; Johnson, A.C.; Fox, J.A.; Cullingham, C.I. Conservation translocations and post-release monitoring: Identifying trends in failures, biases, and challenges from around the world. Biol. Conserv. 2019, 238, 108239. [Google Scholar] [CrossRef]
  2. Seddon, P.J.; Armstrong, D.P.; Maloney, R.F. Developing the science of reintroduction biology. Conserv. Biol. 2007, 21, 303–312. [Google Scholar] [CrossRef] [PubMed]
  3. Swan, K.D.; Lloyd, N.A.; Moehrenschlager, A. Projecting further increases in conservation translocations: A Canadian case study. Biol. Conserv. 2018, 228, 175–182. [Google Scholar] [CrossRef]
  4. Armstrong, D.P.; Seddon, P.J. Directions in reintroduction biology. Trends Ecol. Evol. 2008, 23, 20–25. [Google Scholar] [CrossRef] [PubMed]
  5. IUCN. Guidelines for Reintroductions and Other Conservation Translocations; Version 1.0; IUCN Species Survival Commission: Gland, Switzerland, 2013. [Google Scholar]
  6. He, F.; Zarfl, C.; Bremerich, V.; David, J.N.W.; Hogan, Z.; Kalinkat, G.; Tockner, K.; Jähnig, S.C. The global decline of freshwater megafauna. Glob. Chang. Biol. 2019, 25, 3883–3892. [Google Scholar] [CrossRef] [PubMed]
  7. Cochran-Biederman, J.L.; Wyman, K.E.; French, W.E.; Loppnow, G.L. Identifying correlates of success and failure of native freshwater fish reintroductions. Conserv. Biol. 2015, 29, 175–186. [Google Scholar] [CrossRef] [PubMed]
  8. Anderson, J.H.; Pess, G.R.; Carmichael, R.W.; Ford, M.J.; Cooney, T.D.; Baldwin, C.M.; McClure, M.M. Planning Pacific salmon and steelhead reintroductions aimed at long-term viability and recovery. N. Am. J. Fish. Manag. 2014, 34, 72–93. [Google Scholar] [CrossRef]
  9. Dunham, J.; Gallo, K.; Shively, D.; Allen, C.; Goehring, B. Assessing the feasibility of native fish reintroductions: A framework applied to threatened bull trout. N. Am. J. Fish. Manag. 2011, 31, 106–115. [Google Scholar] [CrossRef]
  10. Kock, T.J.; Ferguson, J.W.; Keefer, M.L.; Schreck, C.B. Review of trap-and-haul for managing Pacific salmonids (Oncorhynchus spp.) in impounded river systems. Rev. Fish Biol. Fish. 2021, 31, 53–94. [Google Scholar] [CrossRef]
  11. Matala, A.P.; Narum, S.R.; Saluskin, B.P.; Johnston, M.V.; Newell, J.E.; Fast, D.E.; Galbreath, P.F. Early observations from monitoring a reintroduction program: Return of sockeye salmon to a nursery lake of historical importance. Trans. Am. Fish. Soc. 2019, 148, 271–288. [Google Scholar] [CrossRef]
  12. Evans, M.L.; Johnson, M.A.; Jacobson, D.; Wang, J.; Hogansen, M.; O’Malley, K.G. Evaluating a multi-generational reintroduction program for threatened salmon using genetic parentage analysis. Can. J. Fish. Aquat. Sci. 2016, 73, 844–852. [Google Scholar] [CrossRef]
  13. Sard, N.M.; O’Malley, K.G.; Jacobson, D.P.; Hogansen, M.J.; Johnson, M.A.; Banks, M.A. Factors influencing spawner success in a spring Chinook salmon (Oncorhynchus tshawytscha) reintroduction program. Can. J. Fish. Aquat. Sci. 2015, 72, 1390–1397. [Google Scholar] [CrossRef]
  14. Kock, T.; Perry, R.; Hansen, G.; Haner, P.; Pope, A.; Plumb, J.; Cogliati, K.; Hansen, A. Evaluation of Chinook Salmon Fry Survival in Lookout Point Reservoir, Western Oregon, 2017; Open-File Report 2019-1011; U.S. Geological Survey: Reston, VA, USA, 2019.
  15. Flagg, T.A.; Ruehle, T.E. Cle Elum Lake Anadromous Salmon Restoration Feasibility Study: Summary of Research, 2000 Final Report to Bonneville Power Administration; BPA Report DOE/BP-64840-4; Bonneville Power Administration—Environment, Fish and Wildlife Division: Portland, OR, USA, 2000.
  16. Keefer, M.L.; Taylor, G.A.; Garletts, D.F.; Helms, C.K.; Gauthier, G.A.; Pierce, T.M.; Caudill, C.C. Reservoir entrapment and dam passage mortality of juvenile Chinook salmon in the Middle Fork Willamette River. Ecol. Freshw. Fish 2012, 21, 222–234. [Google Scholar] [CrossRef]
  17. Naiman, R.J.; Alldredge, J.R.; Beauchamp, D.A.; Bisson, P.A.; Congleton, J.; Henny, C.J.; Huntly, N.; Lamberson, R.; Levings, C.; Merrill, E.N.; et al. Developing a broader scientific foundation for river restoration: Columbia River food webs. Proc. Natl. Acad. Sci. USA 2012, 109, 21201–21207. [Google Scholar] [CrossRef] [PubMed]
  18. Johnson, P.T.J.; Olden, J.D.; Zanden, M.J.V. Dam invaders: Impoundments facilitate biological invasions into freshwaters. Front. Ecol. Environ. 2008, 6, 357–363. [Google Scholar] [CrossRef]
  19. Hansen, A.G.; Gardner, J.R.; Connelly, K.A.; Polacek, M.; Beauchamp, D.A. Trophic compression of lake food webs under hydrologic disturbance. Ecosphere 2018, 9, e02304. [Google Scholar] [CrossRef]
  20. Murphy, C.A.; Taylor, G.; Pierce, T.; Arismendi, I.; Johnson, S.L. Short-term reservoir draining to streambed for juvenile salmon passage and non-native fish removal. Ecohydrology 2019, 12, e2096. [Google Scholar] [CrossRef] [PubMed]
  21. Bourret, S.L.; Kennedy, B.P.; Caudill, C.C.; Chittaro, P.M. Using otolith chemical and structural analysis to investigate reservoir habitat use by juvenile Chinook salmon Oncorhynchus tshawytscha. J. Fish Biol. 2014, 85, 1507–1525. [Google Scholar] [CrossRef] [PubMed]
  22. Koehler, M.E.; Fresh, K.L.; Beauchamp, D.A.; Cordell, J.R.; Simenstad, C.A.; Seiler, D.E. Diet and bioenergetics of lake-rearing juvenile Chinook salmon in Lake Washington. Trans. Am. Fish. Soc. 2006, 135, 1580–1591. [Google Scholar] [CrossRef]
  23. Monzyk, F.R.; Emig, R.; Romer, J.D.; Friesen, T.A. Life-History Characteristics of Juvenile Spring Chinook Salmon Rearing in Willamette Valley Reservoirs; Oregon Department of Fish and Wildlife—Upper Willamette Research, Monitoring and Evaluation Program: Corvallis, OR, USA, 2014. [Google Scholar]
  24. Murphy, C.A.; Lee, C.S.; Johnson, B.; Arismendi, I.; Johnson, S.L. GrowChinook: An optimized multimodel and graphic user interface for predicting juvenile Chinook salmon growth in lentic ecosystems. Can. J. Fish. Aquat. Sci. 2019, 12, 564–575. [Google Scholar] [CrossRef]
  25. Naughton, G.P.; Keefer, M.L.; Clabough, T.S.; Knoff, M.J.; Blubaugh, T.J.; Sharpe, C.; Caudill, C.C. Reservoir provides cool-water refuge for adult Chinook salmon in a trap-and-haul reintroduction program. Mar. Freshw. Res. 2018, 69, 1995–2007. [Google Scholar] [CrossRef]
  26. Arostegui, M.C.; Quinn, T.P. Reliance on lakes by salmon, trout and charr (Oncorhynchus, Salmo and Salvelinus): An evaluation of spawning habitats, rearing strategies and trophic polymorphisms. Fish Fish. 2019, 20, 775–794. [Google Scholar] [CrossRef]
  27. Edmundson, J.A.; Mazumder, A. Linking growth of juvenile sockeye salmon to habitat temperature in Alaskan Lakes. Trans. Am. Fish. Soc. 2001, 130, 644–662. [Google Scholar] [CrossRef]
  28. Koenings, J.P.; Kyle, G.B. Consequences to juvenile sockeye salmon and the zooplankton community resulting from intense predation. Alsk. Fish. Res. Bull. 1997, 4, 120–135. [Google Scholar]
  29. Cartwright, M.A.; Beauchamp, D.A.; Bryant, M.D. Quantifying cutthroat trout (Oncorhynchus clarki) predation on sockeye salmon (Oncorhynchus nerka) fry using a bioenergetics approach. Can. J. Fish. Aquat. Sci. 1998, 55, 1285–1295. [Google Scholar] [CrossRef]
  30. Foerster, R.E.; Ricker, W.E. The effect of reduction of predaceous fish on survival of young sockeye salmon at Cultus Lake. J. Fish. Res. Board Can. 1941, 5, 315–336. [Google Scholar] [CrossRef]
  31. Sorel, M.H.; Hansen, A.G.; Connelly, K.A.; Wilson, A.C.; Lowery, E.D.; Beauchamp, D.A. Predation by northern pikeminnow and tiger muskellunge on juvenile salmonids in a high-head reservoir: Implications for anadromous fish reintroductions. Trans. Am. Fish. Soc. 2016, 145, 521–536. [Google Scholar] [CrossRef]
  32. Seattle City Light. Final License Application to the Federal Energy Regulatory Committee. Exhibit E—Appendix G: Skagit Project Upstream and Downstream Fish Passage Program. 2023. Available online: https://www.seattle.gov/light/skagit/Relicensing/default.htm (accessed on 8 November 2023).
  33. Duda, J.J.; Hardiman, J.M. Applying Intrinsic Potential Models to Evaluate Salmon (Oncorhynchus spp.) Introduction into Main-Stem and Tributary Habitats Upstream from the Skagit River Hydroelectric Project, Northern Washington; Open-File Report 2023-1077; U.S. Geological Survey: Reston, VA, USA, 2023; p. 44.
  34. Jensen, B.L.; Johnson, R.C.; Duda, J.J.; Ostberg, C.O.; Code, T.J.; Mclean, J.H.; Stenberg, K.D.; Larsen, K.A.; Hoy, M.S.; Beauchamp, D.A. Growth performance of rainbow trout in reservoir tributaries and implications for steelhead growth potential above Skagit River dams. N. Am. J. Fish. Manag. 2023, 43, 1427–1446. [Google Scholar] [CrossRef]
  35. Johnson, R.C.; Code, T.J.; Stenberg, K.D.; Mclean, J.H.; Jensen, B.L.; Hoy, M.S.; Beauchamp, D.A. Change in growth and prey utilization for a native salmonid following invasion by an omnivorous minnow in an oligotrophic reservoir. Hydrobiologia 2024, in press. [Google Scholar]
  36. Johnson, R.C.; Hoy, M.S.; Stenberg, K.D.; Mclean, J.H.; Jensen, B.L.; Code, T.J.; Ostberg, C.O.; Beauchamp, D.A. Shift in piscivory following invasion of a minnow in a mid-elevation reservoir. Ecol. Freshw. Fish. 2024, 00, e12778. [Google Scholar] [CrossRef]
  37. Connor, E.J.; Pflug, D.E. Changes in the distribution and density of pink, chum, and Chinook salmon spawning in the Upper Skagit River in response to flow management measures. N. Am. J. Fish. Manag. 2004, 24, 835–852. [Google Scholar] [CrossRef]
  38. Smith, M.J. Final Report: Population Structure and Genetic Assignment of Bull Trout (Salvelinus confluentus) in the Skagit River Basin; University of Washington: Seattle, WA, USA, 2010. [Google Scholar]
  39. WDFW; SRSC. Skagit Chinook Recovery Plan; Washington Department of Fish and Wildlife (WDFW) & Skagit River System Cooperative (SRSC): La Conner, WA, USA, 2005.
  40. Zimmerman, M.S.; Kinsel, C.; Beamer, E.; Connor, E.J.; Pflug, D.E. Abundance, survival, and life history strategies of juvenile Chinook salmon in the Skagit River, Washington. Trans. Am. Fish. Soc. 2015, 144, 627–641. [Google Scholar] [CrossRef]
  41. Thompson, J.N.; Beauchamp, D.A. Size-selective mortality of steelhead during freshwater and marine life stages related to freshwater growth in the Skagit River, Washington. Trans. Am. Fish. Soc. 2014, 143, 910–925. [Google Scholar] [CrossRef]
  42. Lowery, E.D.; Beauchamp, D.A. Baseline Food Web Assessment of the Upper Clackamas River Basin Prior to Reintroduction of Bull Trout; Report # WACFWRU-010-02; US Geological Survey, Washington Cooperative Fish and Wildlife Research Unit: Seattle, WA, USA, 2010.
  43. Beauchamp, D.A. Riverine predation on sockeye salmon fry migrating to Lake Washington. N. Am. J. Fish. Manag. 1995, 15, 358–365. [Google Scholar] [CrossRef]
  44. Quinn, T.P.; Losee, J.P. Diverse and changing use of the Salish Sea by Pacific salmon, trout, and char. Can. J. Fish. Aquat. Sci. 2022, 79, 1003–1021. [Google Scholar] [CrossRef]
  45. Zimmerman, M.S.; Irvine, J.R.; O’Neill, M.; Anderson, J.H.; Greene, C.M.; Weinheimer, J.; Trudel, M.; Rawson, K. Spatial and temporal patterns in smolt survival of wild and hatchery coho salmon in the Salish Sea. Mar. Coast. Fish. 2015, 7, 116–134. [Google Scholar] [CrossRef]
  46. Deslauriers, D.; Chipps, S.R.; Breck, J.E.; Rice, J.A.; Madenjian, C.P. Fish Bioenergetics 4.0: An R-based modeling application. Fisheries 2017, 42, 586–596. [Google Scholar] [CrossRef]
  47. Beauchamp, D.A.; Stewart, D.J.; Thomas, G.L. Corroboration of a bioenergetics model for sockeye salmon. Trans. Am. Fish. Soc. 1989, 118, 597–607. [Google Scholar] [CrossRef]
  48. Johnson, R.C.; Code, T.J.; Hoy, M.S.; Jensen, B.L.; Stenberg, K.D.; Ostberg, C.O.; Duda, J.J. Upper Skagit Reservoir Food Web Data, 2005–2021; U.S. Geological Survey Data Release: Reston, VA, USA, 2024. [CrossRef]
  49. Hansen, A.G.; Polacek, M.; Connelly, K.A.; Gardner, J.R.; Beauchamp, D.A. Food Web Interactions in Kachess and Keechelus Reservoirs, Washington: Implications for Threatened Adfluvial Bull Trout and Management of Water Storage—Final Report; Washington Cooperative Fish and Wildlife Research Unit: Seattle, WA, USA, 2017. [Google Scholar]
  50. Scheuerell, J.M.; Schindler, D.E.; Scheuerell, M.D.; Fresh, K.L.; Sibley, T.H.; Litt, A.H.; Shepherd, J.H. Temporal dynamics in foraging behavior of a pelagic predator. Can. J. Fish. Aquat. Sci. 2005, 62, 2494–2501. [Google Scholar] [CrossRef]
  51. Sorel, M.H.; Hansen, A.G.; Connelly, K.A.; Beauchamp, D.A. Trophic feasibility of reintroducing anadromous salmonids in three reservoirs on the North Fork Lewis River, Washington: Prey supply and consumption demand of resident fishes. Trans. Am. Fish. Soc. 2016, 145, 1331–1347. [Google Scholar] [CrossRef]
  52. Luecke, C.; Brandt, D. Notes: Estimating the energy density of Daphnid prey for use with rainbow trout bioenergetics models. Trans. Am. Fish. Soc. 1993, 122, 386–389. [Google Scholar] [CrossRef]
  53. McCarthy, S.G.; Duda, J.J.; Emlen, J.M.; Hodgson, G.R.; Beauchamp, D.A. Linking habitat quality with trophic performance of steelhead along forest gradients in the South Fork Trinity River watershed, California. Trans. Am. Fish. Soc. 2009, 138, 506–521. [Google Scholar] [CrossRef]
  54. Stockwell, J.D.; Bonfantine, K.L.; Johnson, B.M. Kokanee foraging: A Daphnia in the stomach is worth two in the lake. Trans. Am. Fish. Soc. 1999, 128, 169–174. [Google Scholar] [CrossRef]
  55. Brett, J.R. Energetic responses of salmon to temperature: A study of some thermal relations in the physiology and freshwater ecology of sockeye salmon (Oncorhynchus nerka). Am. Zool. 1971, 11, 99–113. [Google Scholar] [CrossRef]
  56. Hansen, A.G.; Gardner, J.R.; Beauchamp, D.A.; Paradis, R.; Quinn, T.P. Recovery of sockeye salmon in the Elwha River, Washington, after dam removal: Dependence of smolt production on the resumption of anadromy by landlocked kokanee. Trans. Am. Fish. Soc. 2016, 145, 1303–1317. [Google Scholar] [CrossRef]
  57. Quinn, T.P. The Behavior and Ecology of Pacific Salmon and Trout, 2nd ed.; University of Washington Press: Seattle, WA, USA, 2018. [Google Scholar]
  58. Beauchamp, D.A.; Wahl, D.H.; Johnson, B.M. Predator-Prey Interactions In Analysis and Interpretation of Freshwater Fisheries Data; Guy, C.S., Brown, M.R., Eds.; American Fisheries Society: Bethesda, Maryland, 2007; pp. 765–842. [Google Scholar]
  59. Baldwin, C.M.; Beauchamp, D.A.; Van Tassell, J.J. Bioenergetic assessment of temporal food supply and consumption demand by salmonids in the Strawberry Reservoir food web. Trans. Am. Fish. Soc. 2000, 129, 429–450. [Google Scholar] [CrossRef]
  60. Beauchamp, D.A.; Van Tassell, J.J. Modeling seasonal trophic interactions of adfluvial bull trout in Lake Billy Chinook, Oregon. Trans. Am. Fish. Soc. 2001, 130, 204–216. [Google Scholar] [CrossRef]
  61. Juanes, F.; Buckel, J.A.; Scharf, S.F. 2002. Feeding ecology of piscivorous fishes. In Handbook of Fish Biology and Fisheries; Hart, P.J.B., Reynolds, J.D., Eds.; Blackwell Science Ltd.: Oxford, UK, 2002; pp. 267–283. [Google Scholar]
  62. Winters, L.K.; Budy, P. Exploring crowded trophic niche space in a novel reservoir fish assemblage: How many is too many? Trans. Am. Fish. Soc. 2015, 144, 1117–1128. [Google Scholar] [CrossRef]
  63. Thompson, J.N.; Beauchamp, D.A. Growth of juvenile steelhead Oncorhynchus mykiss under size-selective pressure limited by seasonal bioenergetic and environmental constraints. J. Fish Biol. 2016, 89, 1720–1739. [Google Scholar] [CrossRef] [PubMed]
  64. Clarke, L.R.; Vidergar, D.T.; Bennett, D.H. Stable isotopes and gut content show diet overlap among native and introduced piscivores in a large oligotrophic lake. Ecol. Freshw. Fish 2005, 14, 267–277. [Google Scholar] [CrossRef]
  65. Hansen, A.G.; Gardner, J.R.; Connelly, K.A.; Polacek, M.; Beauchamp, D.A. Resource use among top-level piscivores in a temperate reservoir: Implications for a threatened coldwater specialist. Ecol. Freshw. Fish 2022, 31, 469–491. [Google Scholar] [CrossRef]
  66. Foster, J. Skagit River Snorkel Survey Report; Triton Environmental Consultants Ltd.: Vernon, BC, Canada, 2020. [Google Scholar]
  67. Nelson, T.C. Final Report: Upper Skagit Watershed Native Char Project 2001–2004; LGL Limited Environmental Research Associates: Sidney, BC, Canada, 2006. [Google Scholar]
  68. Nelson, T.C.; Mussell, C.E.J.; Rissling, J. Progress Report 2003: Upper Skagit Watershed Native Char Project; LGL Limited Environmental Research Associates: Sidney, BC, Canada, 2004. [Google Scholar]
  69. Seattle City Light. Biological Evaluation—Supplement: Impacts of entrainment of bull trout. In Skagit River Hydroelectric Project License (FERC no. 553) Amendment: Addition of a Second Power Tunnel at the Gorge Development; Seattle City Light: Seattle, WA, USA, 2012. [Google Scholar]
  70. Hyatt, K.D.; Stockner, J.G. Responses of sockeye salmon (Oncorhynchus nerka) to fertilization of British Columbia coastal lakes. Can. J. Fish. Aquat. Sci. 1985, 42, 320–331. [Google Scholar] [CrossRef]
  71. Henderson, M.A.; Cass, A.I. Effect of smolt size on smolt-to-adult survival for Chilko Lake sockeye salmon. Can. J. Fish. Aquat. Sci. 1991, 48, 988–994. [Google Scholar] [CrossRef]
  72. Koski, M.L.; Johnson, B.M. Functional response of kokanee salmon (Oncorhynchus nerka) to Daphnia at different light levels. Can. J. Fish. Aquat. Sci. 2002, 59, 707–716. [Google Scholar] [CrossRef]
  73. Murphy, C.A.; Romer, J.D.; Stertz, K.; Arismendi, I.; Emig, R.; Monzyk, F.; Johnson, S.L. Damming salmon fry: Evidence for predation by non-native warmwater fishes in reservoirs. Ecosphere 2021, 12, e03757. [Google Scholar] [CrossRef]
  74. Eckmann, M.; Dunham, J.; Connor, E.J.; Welch, C.A. Bioenergetic evaluation of diel vertical migration by bull trout (Salvelinus confluentus) in a thermally stratified reservoir. Ecol. Freshw. Fish 2018, 27, 30–43. [Google Scholar] [CrossRef]
  75. Beauchamp, D.A.; Lariviere, M.G.; Thomas, G.L. Evaluation of competition and predation as limits to juvenile kokanee and sockeye salmon production in Lake Ozette, Washington. N. Am. J. Fish. Manag. 1995, 15, 193–207. [Google Scholar] [CrossRef]
  76. Furey, N.B.; Hinch, S.G. Bull trout movements match the life history of sockeye salmon: Consumers can exploit seasonally distinct resource pulses. Trans. Am. Fish. Soc. 2017, 146, 450–461. [Google Scholar] [CrossRef]
  77. Furey, N.B.; Hinch, S.G.; Mesa, M.G.; Beauchamp, D.A. Piscivorous fish exhibit temperature-influenced binge feeding during an annual prey pulse. J. Anim. Ecol. 2016, 85, 1307–1317. [Google Scholar] [CrossRef] [PubMed]
  78. Smith, C.D.; Hatton, T.W.; Adams, N.S. Monitoring Fish Abundance and Behavior, Using Multi-Beam Acoustic Imaging Sonar, at a Selective Water Withdrawal Structure in Lake Billy Chinook, Deschutes River, Oregon, 2020; Open-File Report 2022-1038; U.S. Geological Survey: Reston, VA, USA, 2022; pp. 1–31.
  79. Smith, T.W.; Liermann, B.W.; Eby, L.A. Ecological assessment and evaluation of potential eradication approaches for introduced redside shiners in a montane lake. N. Am. J. Fish. Manag. 2021, 41, 1473–1489. [Google Scholar] [CrossRef]
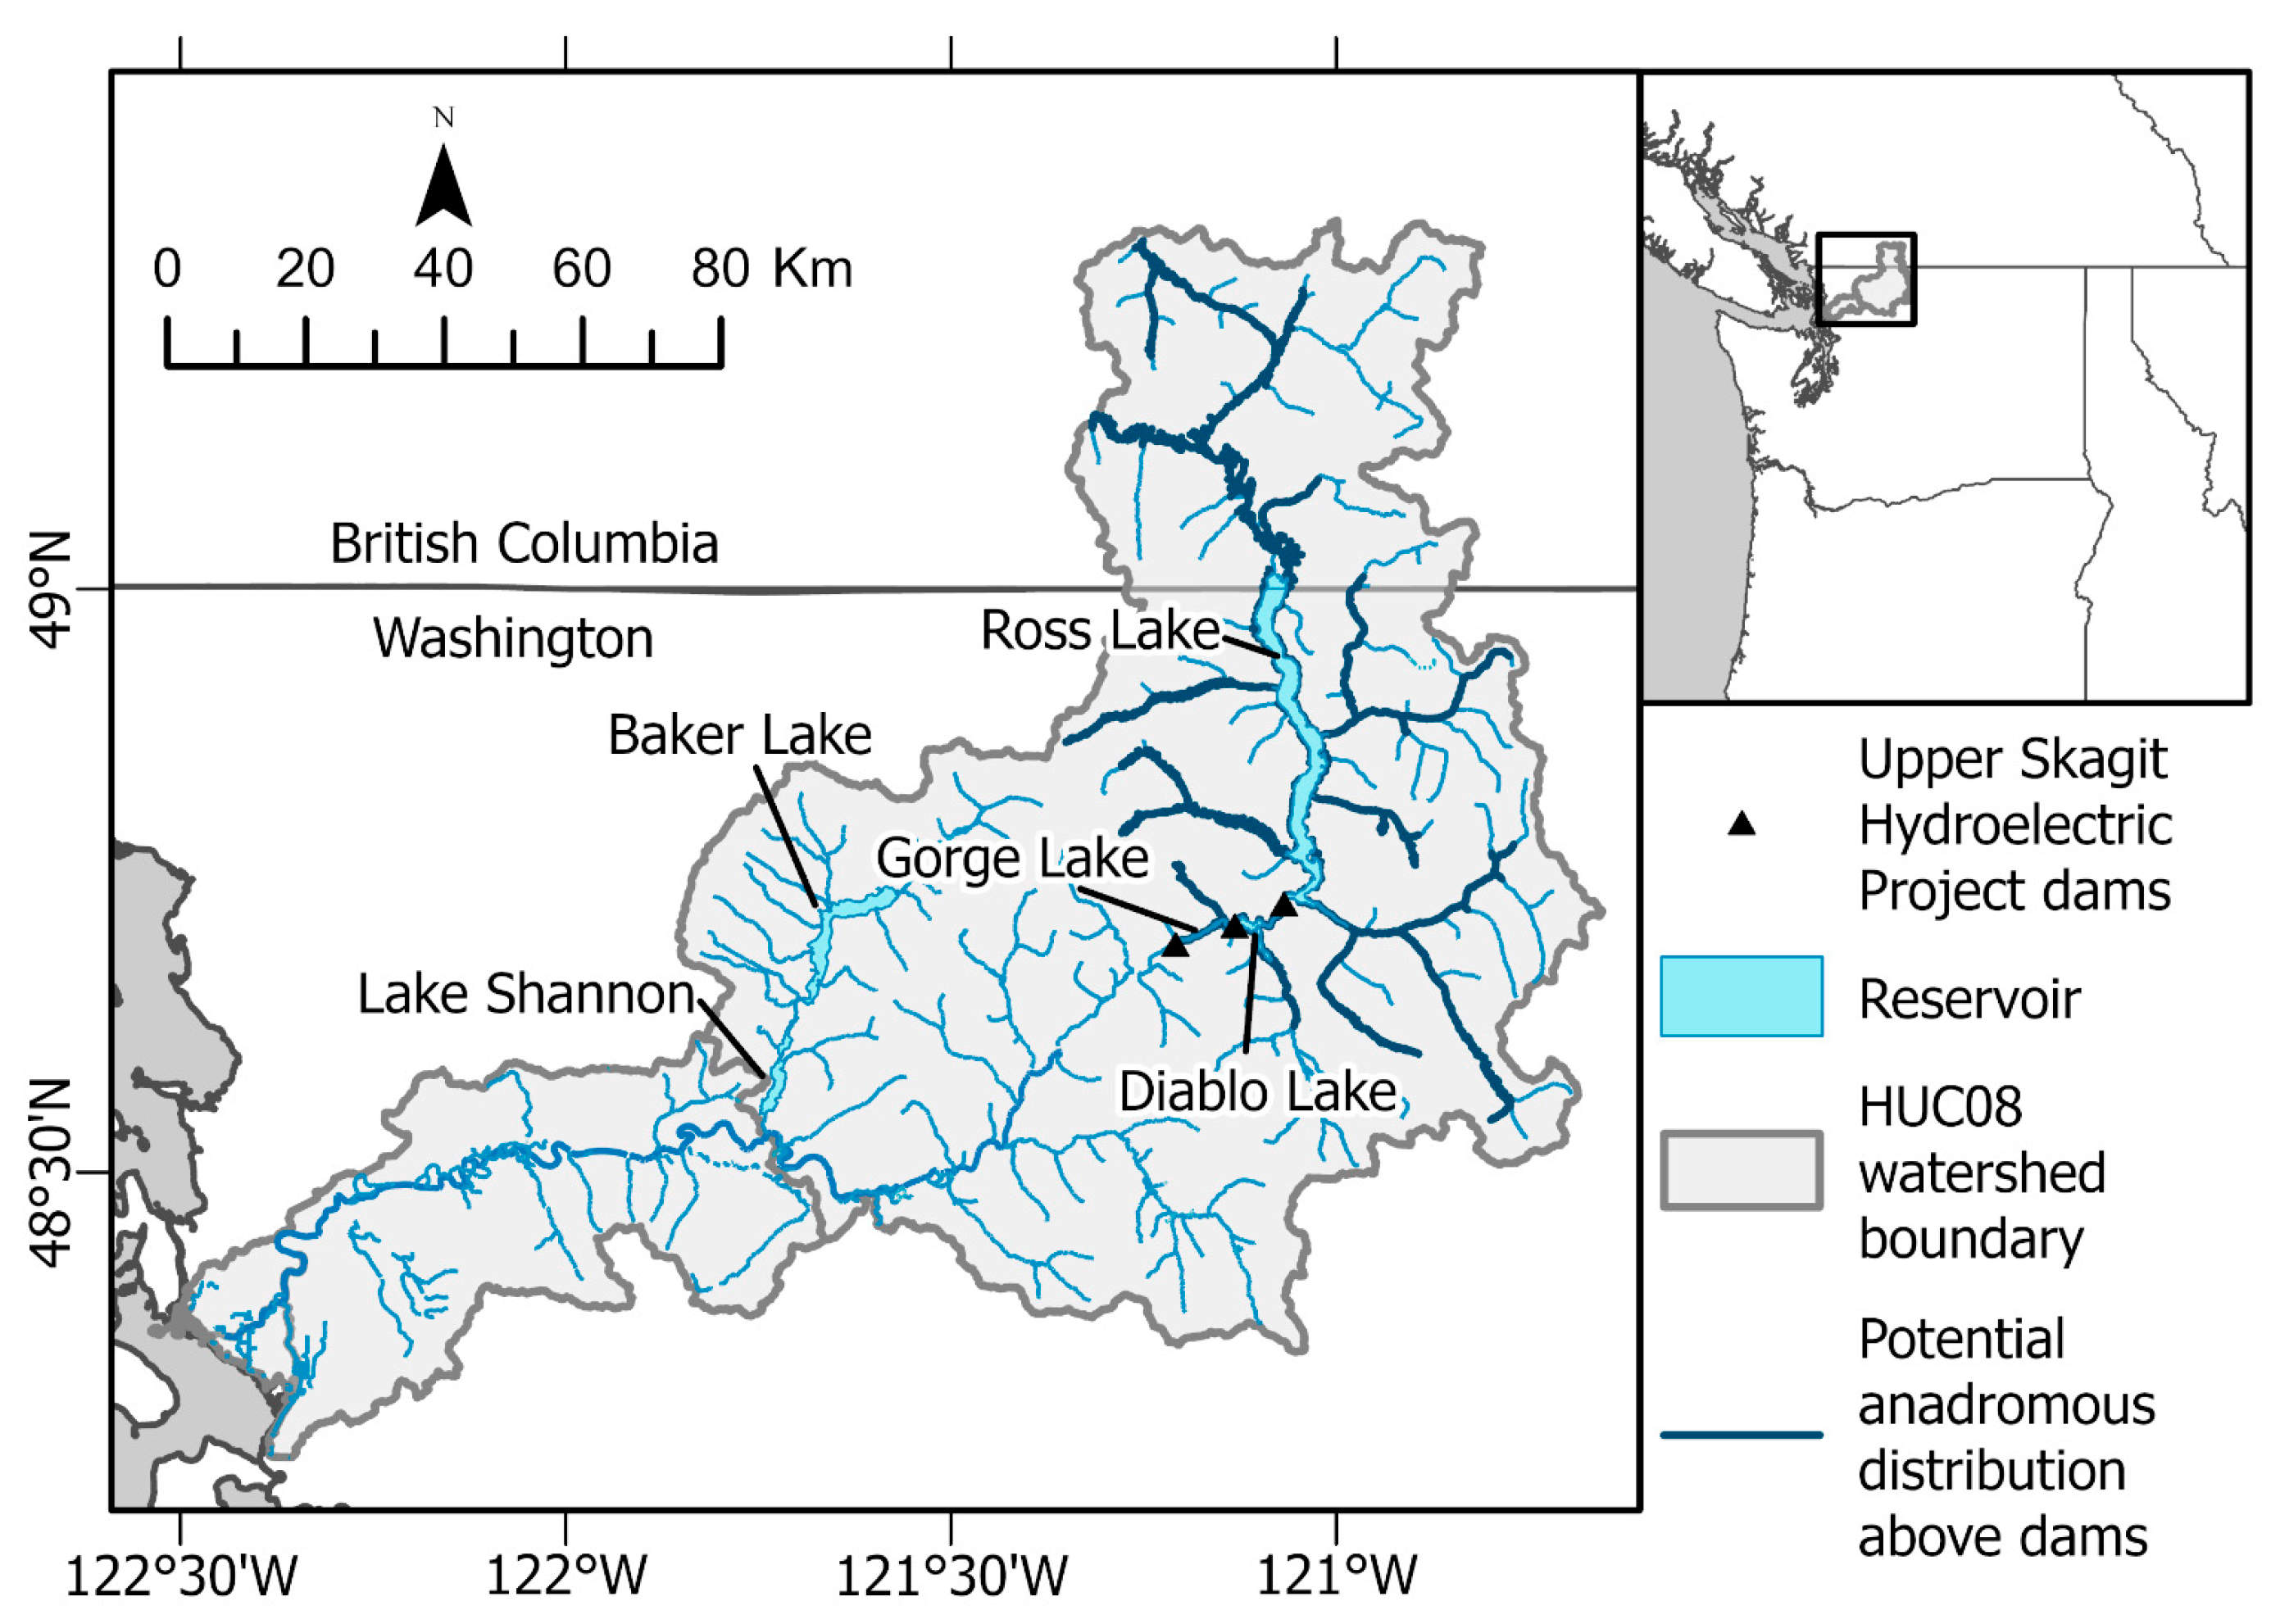
Figure 1. Map of the study system. The potential anadromous distribution above the dams indicated is based only on potential physical access to those stream segments (i.e., no migration barriers). Further details and habitat quality results from intrinsic potential modeling can be found in Duda and Hardiman [33].
Water 16 01157 g001
Figure 2. Isoclines for Ross Lake showing variation in thermal structure (°C) by year (a) and region (b). Water temperature is represented by color, with 1°C delineations marked by the black lines. The Ross Lake South site is located mid-lake in the pelagic zone near the confluence with Big Beaver Creek, and the North site was located mid-lake in the pelagic zone near the confluence with Little Beaver Creek. Site locations are detailed in Figure 1 in Johnson et al. [36]. Reprinted from Johnson et al. [36], with permission.
Water 16 01157 g002
Figure 3. Average monthly densities for Daphnia in Ross Lake 2019–2021. Dashed line represents the threshold density (0.4/L) at which sockeye salmon Oncorhynchus nerka begin to feed exclusively on Daphnia [50].
Water 16 01157 g003
Figure 4. Daphnia supply versus demand (metric ton, MT) for the combined epi- and metalimnion (0–20 m depth) and the epilimnion (0–10 m depth) in Ross Lake. Current population consumption demand includes redside shiner Richardsonius balteatus and rainbow trout Oncorhynchus mykiss. Carrying capacity of the resource, indicated for each month (blue bars), is defined as 50% of total biomass (B) + production (P).
Water 16 01157 g004
Figure 5. Monthly piscivorous consumption demand on fish prey in Ross Lake under current conditions by the unit predator population (1000 bull trout Salvelinus confluentus, 2430 rainbow trout Oncorhynchus mykiss, 286 brook trout S. fontinalis, and 126 Dolly Varden S. malma > 200 mm FL). Unid. Fish = unidentified fish.
Water 16 01157 g005
Figure 6. Monthly predation potential on sockeye Oncorhynchus nerka and Chinook salmon O. tshawytscha juveniles rearing in Ross Lake as a function of the proportion of current predator fish consumption (from 10% to 90%) that switch to introduced sockeye salmon. The proportion of fish in predator diets varied by species, season, and size class—see text for details. Predation potential is shown for the unit predator population (i.e., all piscivores relative to 1000 bull trout Salvelinus confluentus > 200 mm fork length) and abundance of 3000 bull trout > 200 mm fork length that reflects the best existing data on bull trout population size in the Upper Skagit basin. Red lines in the upper right panel denote initial sockeye salmon fry abundance (solid line) and the carrying capacity in the most limiting month of September (dashed line) estimated from the scenario where capacity was defined as 50% of Daphnia biomass + production, sockeye salmon were thermally restricted from prey in the epilimnion, and in-lake fry survival across the year was 8.5%. Note the different x-axes between (a) and (b) panels—months in each panel are ordered to begin with the expected timing of recruitment to the lake.
Water 16 01157 g006
Figure 7. Predation potential of various anadromous species and migrant expressions in Ross Lake for the unit predator population (i.e., all piscivores relative to 1000 BT > 200 mm fork length). Panel labels include the expected size at migration for each species and life history type (see text for citations). Each point represents the estimated predation assuming a different fraction of the predator fish consumption (10–90%) switches to each species/life history. Shaded panel indicates the expected month of migration.
Water 16 01157 g007
Table 1. Mean, minimum, and maximum daily thermal experience in each month used for simulated sockeye salmon Oncorhynchus nerka in Ross Lake.
Temperature °C
MonthMinMeanMax
May7.48.59.5
June9.610.611.8
July11.813.014.0
August13.113.814.7
Sepetember13.915.215.5
October12.013.514.7
November8.810.412.1
December5.87.18.7
January4.65.15.7
Febuary4.14.24.6
March4.14.65.1
April5.26.37.6
Table 2. Monthly estimates of sockeye salmon capacity (#s of juveniles) and the corresponding number of fry entering the lake in May, assuming annual fry survival (S) is 8.5% (mean fry-smolt survival in Baker Lake, N. Overman, Washington Department of Fish & Wildlife, written communication, January 2023) or 25% (global average) [57]. Capacity estimates are given for two depth-use scenarios: (1) salmonids have full access to the water column (0–20 m; i.e., no thermal restriction) or (2) salmonids are thermally restricted from the epilimnion (10–20 m) during stratification. The thermal restriction scenario is not included for May or October because we would not expect thermal exclusion of salmonids in these months. For each depth-use scenario, estimates are shown based on (1) a conservative carrying capacity definition for total consumption not to exceed 50% of production and (2) a more liberal definition of consumption not to exceed 50% of production + biomass. Capacity estimates for the most limiting month of September are in bold.
Capacity DefinitionMonthNo Thermal Restriction (0–20 m)Thermal Restriction (10–20 m)
CapacityInitial Fry Abundance
(S = 8.5%)
Initial Fry Abundance
(S = 25%)
CapacityInitial Fry Abundance
(S = 8.5%)
Initial Fry Abundance
(S = 25%)
50% biomass + productionMay10,046,61810,046,61810,046,618---
June10,355,76712,767,57311,649,7372,193,3572,704,1792,467,421
July8,127,82212,271,37510,246,8982,986,5964,509,1593,765,258
August6,170,44711,485,8128,751,2233,399,7996,328,4644,821,757
September1,460,6253,352,0452,330,369968,0182,221,5421,544,434
October2,093,8175,884,4093,743,769---
50% productionMay3,940,7303,940,7303,940,730---
June5,135,6056,331,6615,777,307000
July5,780,3378,727,1457,287,3802,380,0583,593,4083,000,584
August3,553,5156,614,5955,039,7652,760,4155,138,3003,914,952
September54,338124,70286,694150,563345,533240,217
October553,3761,555,194989,443---
Table 3. Hypothetical population estimates of smolt production and adult returns based on two different juvenile carrying capacity scenarios. Scenario 1: juvenile carrying capacity is based on a maximum exploitation rate of 50% Daphnia production + biomass in the most limiting month of September, assuming juveniles are thermally excluded from the epilimnion. Scenario 2: juvenile carrying capacity is based on maximum exploitation rate of 50% Daphnia production + biomass in the most limiting month of September, assuming juveniles are not thermally excluded from the epilimnion. Fry survival rates represent in-lake survival estimates for age-1 smolts from Baker Lake from the time of hatchery release to collection at the floating surface collector (2009–2021). The historical smolt–adult return rate (SAR) of 6.3% is an average from Baker Lake in 1999–2021 and the recent SAR of 4.1% is an average from 2015 to 2021.
Adult Returns
ScenarioFry-Smolt Survival (%)Initial Fry Abundance in LakeSmolt AbundanceSAR: 4.1%SAR: 6.3%
13.62,967,493106,83043806730
8.52,221,542188,831774211,896
25.01,544,434386,10815,83024,325
23.64,477,597161,193660910,155
8.53,352,045284,92411,68217,950
25.02,330,369582,59223,88636,703
Table 4. Estimated predation potential on introduced anadromous salmonids migrating through Ross Lake, assuming that 100% of current salmonid consumption switches to each of these migrant expressions. Expected fork length (FL, mm) and weight (g) of migrants of each species/life-history type were assumed from their populations downstream of the dams. Potential numbers consumed are reported for the size-structured predator population relative to 1000 bull trout Salvelinus confluentus (including 2430 rainbow trout Oncorhynchus mykiss, 286 brook trout S. fontinalis, and 126 Dolly Varden S. malma), and the population relative to the estimated abundance of 3000 bull trout (including 7290 rainbow trout, 858 brook trout, and 378 Dolly Varden).
Predation Potential (Individuals)
Species/Life-HistoryFL (mm)Weight (g)Population EstimateMarchMayJune
Chinook fry-migrant390.721000 BT2745--
3000 BT8237--
Chinook parr-migrant754.901000 BT--1062
3000 BT--3185
Chinook yearling12019.701000 BT-158-
3000 BT-474-
Steelhead age-2 smolt13024.901000 BT-125-
3000 BT-375-
Steelhead age-3 smolt16550.301000 BT-62-
3000 BT-186-
Disclaimer/Publisher’s Note: The statements, opinions and data contained in all publications are solely those of the individual author(s) and contributor(s) and not of MDPI and/or the editor(s). MDPI and/or the editor(s) disclaim responsibility for any injury to people or property resulting from any ideas, methods, instructions or products referred to in the content.