Abstract
Wireless sensor networks have gained significant attention in recent years due to their wide range of applications in environmental monitoring, surveillance, and other fields. The design of a groundwater quality and quantity monitoring network is an important aspect in aquifer restoration and the prevention of groundwater pollution and overexploitation. Moreover, the development of a novel localization strategy project in wireless sensor groundwater networks aims to address the challenge of optimizing sensor location in relation to the monitoring process so as to extract the maximum quantity of information with the minimum cost. In this study, the improved hybrid butterfly artificial gorilla troop optimizer (iHBAGTO) technique is applied to optimize nodes’ position and the analysis of the path loss delay, and the RSS is calculated. The hybrid of Butterfly Artificial Intelligence and an artificial gorilla troop optimizer is used in the multi-functional derivation and the convergence rate to produce the designed data localization. The proposed iHBAGTO algorithm demonstrated the highest convergence rate of 99.6%, and it achieved the lowest average error of 4.8; it consistently had the lowest delay of 13.3 ms for all iteration counts, and it has the highest path loss values of 8.2 dB, with the lowest energy consumption value of 0.01 J, and has the highest received signal strength value of 86% for all iteration counts. Overall, the Proposed iHBAGTO algorithm outperforms other algorithms.
1. Introduction
Wireless sensor networks (WSNs) are becoming increasingly widespread in various areas, especially in environmental monitoring applications. Optimizing sensor location in relation to the monitoring process can help to extract the maximum quantity of information with the minimum cost. In the field of groundwater pollution, the utilization of sensors that provide real-time measurements would significantly reduce site characterization times and costs and provide more complete and continuous data-sets for long-term monitoring. However, within the use of sensors in the environmental monitoring field, one of the most relevant problems is linked, in addition to the requisites of the sensor itself, to the correct individuation of the sensor’s position in relation to the phenomenon to monitor [1].
2. Literature Review
The development of a novel localization strategy project in wireless sensor networks aims to address the challenge of accurately locating wireless sensor nodes in an ad hoc network environment [2]. Wireless sensor networks have gained significant attention in recent years due to their wide range of applications in environmental monitoring, surveillance, and other fields. In such networks, the accurate localization of sensor nodes is critical for effective data processing, resource allocation, and network management. Traditional localization strategies in wireless sensor networks rely on various techniques such as time of arrival, time difference of arrival, received signal strength, and angle of arrival measurements. However, these techniques have limitations such as high complexity, low accuracy, and dependence on specific hardware configurations [3]. Therefore, there is a need to develop novel localization strategies that can overcome these limitations and provide a more accurate and efficient localization of sensor nodes. The literature review on wireless sensor network is shown in Table 1 as follows:

Table 1.
Literature review on WSS.
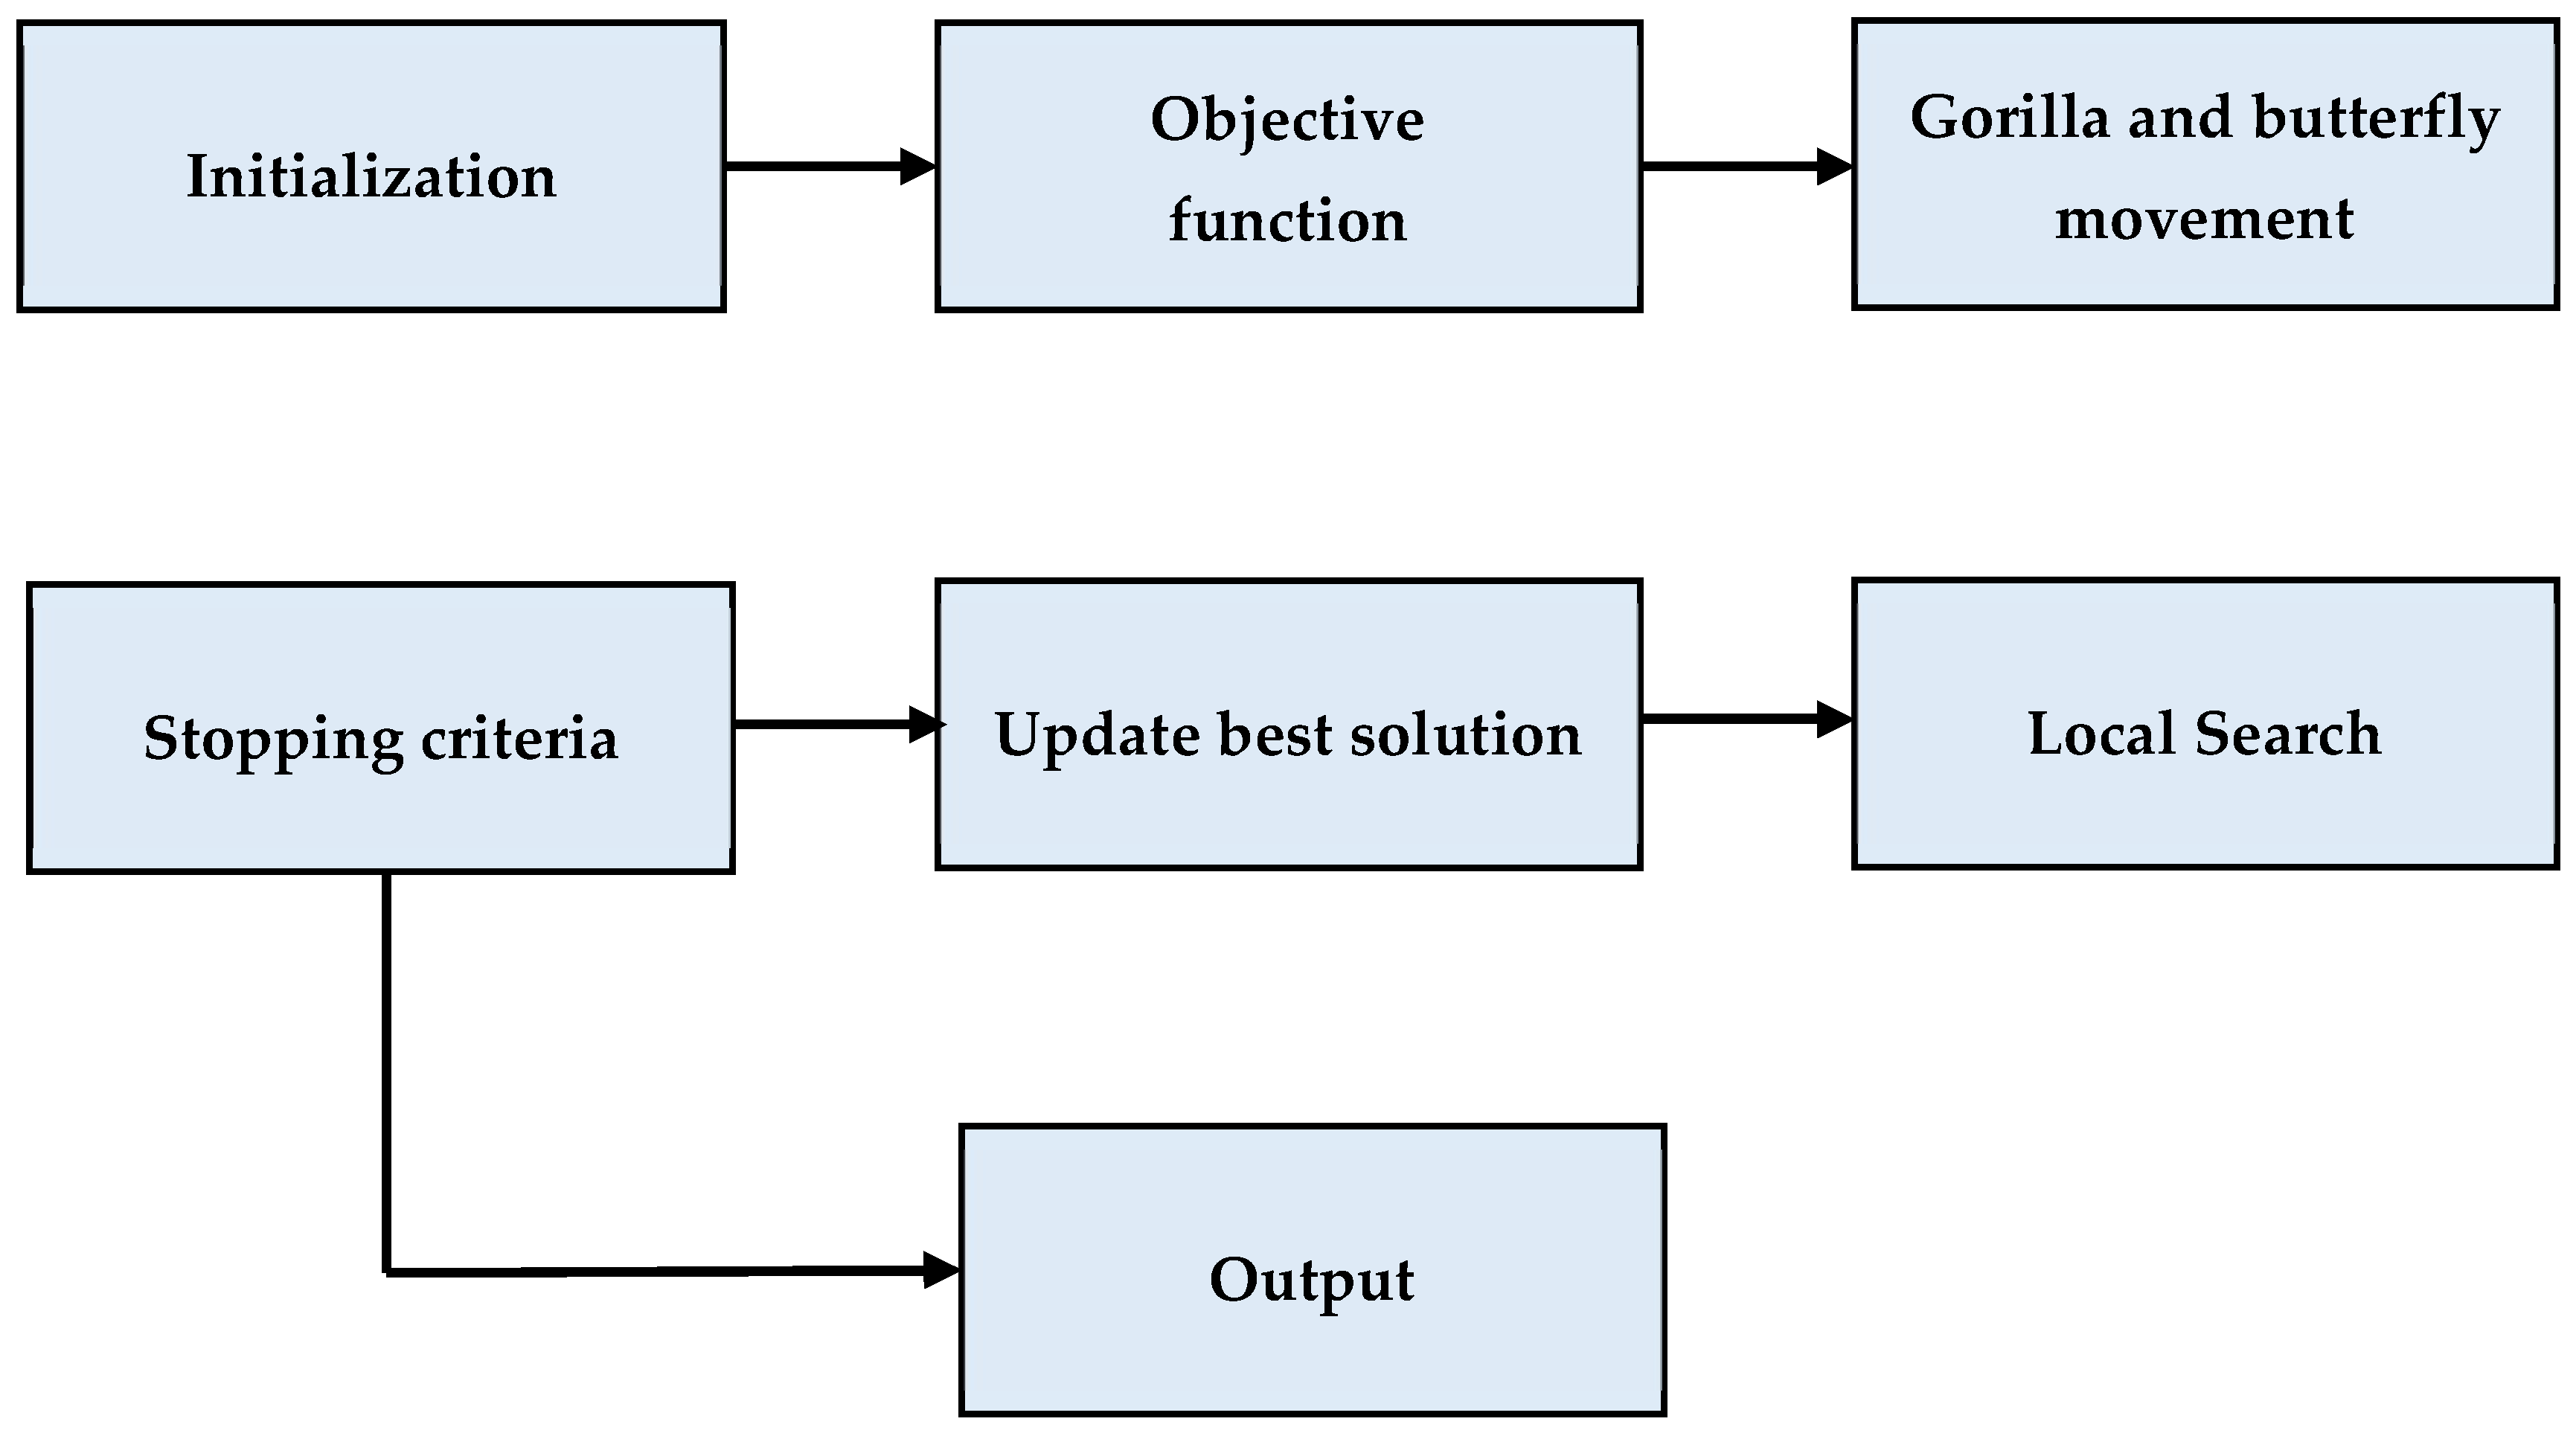
This study developed and implemented a novel localization strategy based on machine learning and optimization techniques. The proposed strategy addresses existing techniques’ limitations and provides accurate localization in various network scenarios. This paper also involves evaluating and comparing the proposed strategy with existing techniques using simulation and experimental studies (Figure 1). The development of a novel localization strategy in wireless sensor networks project aims to advance wireless sensor network technology through the development of a more accurate and efficient localization strategy to improve various applications’ performances in this field [7].
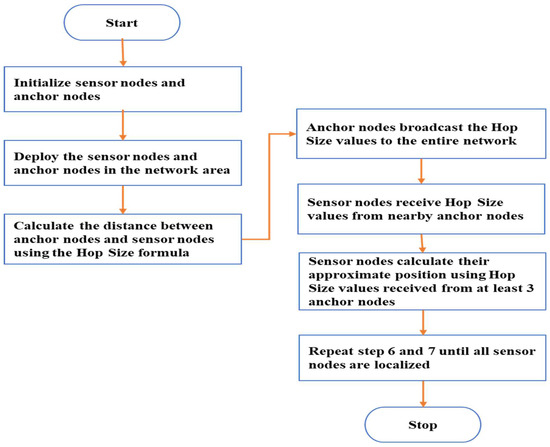
Figure 1.
Flowchart of proposed method.
Ref. [9] presented Artificial Rabbit Optimization (ARO), a meta-heuristic algorithm inspired by the survival strategies of rabbits. ARO’s performance was evaluated through comparisons with other optimization algorithms on 31 benchmark functions and five engineering problems. The findings indicated that ARO consistently outperforms its counterparts in addressing these challenges. Furthermore, the practical application of the ARO optimizer in the fault diagnosis of a rolling bearing showcases its effectiveness in tackling complex real-world issues. The research in [10] introduced a novel swarm intelligence algorithm named Northern Goshawk Optimization (NGO) that emulates the hunting behavior of northern goshawks. The algorithm’s effectiveness was evaluated across sixty-eight objective functions and benchmarked against eight established algorithms. Results from simulations indicated the superior performance of NGO, which was validated further through its successful resolution of four real-world design problems. The study in [11] used ten chaotic maps from the Hunger Games Search (HGS) method, with an emphasis on animal foraging behavior and hunger instincts. The incorporation of chaotic maps into HGS improves performance across three distinct scenarios, with faster convergence in Scenario 2. The algorithm’s efficacy was evaluated using CEC2017 and 23 classical benchmark problems, as well as through its application in real-world engineering challenges, and the results were promising when compared to those in the existing literature. The Slime Mould Algorithm (SMA) [12] is a metaheuristic algorithm based on populations, characterized by a balance between exploitation and exploration. A study introduced an enhanced version called the MSMA, which incorporates chaotic opposition-based learning, adaptive parameter control techniques, and a spiral search approach. The MSMA demonstrated superior performances compared to alternative algorithms in terms of convergence accuracy, speed, and stability, showcasing its effectiveness in addressing real-world optimization challenges.
The main objectives of this study were as follows:
- For the localization of the nodes, a multi-objective improved hybrid butterfly artificial gorilla troop optimizer is used.
- The hybrid (butterfly artificial intelligence + artificial gorilla troop optimizer) and improved hybrid butterfly artificial gorilla troop optimizer techniques are used for the analysis.
As required by the article, the following sections are organized as follows. Section 1 provides a description of the Introduction, and Section 2 discusses the literature evaluation. Section 3 describes research on the proposed new node localization model. Section 4 presents the results and discussion. In Section 5, the conclusion is provided alongside appropriate citations.
3. Materials and Methods
3.1. New Node Localization Model
The Butterfly Optimization Algorithm (BOA) has been used in various applications, including wireless sensor network (WSN) localization strategies. In localization strategies, the BOA can be used to optimize the positions of sensor nodes in the network, which is crucial for the accurate localization of the sensor nodes [13] in wireless sensor networks (WSNs). The BOA optimizes the positions of anchor nodes by minimizing errors between measured and estimated distances. It efficiently explores solutions to converge toward the global optimum, enhancing the localization accuracy, whereas anchor node optimization is vital for precise localization, as it aids in distance estimation, minimizes errors, and improves the overall WSN performance in environmental monitoring applications. The BOA’s role in optimizing anchor nodes is essential for improving the efficiency and effectiveness of WSNs in environmental monitoring tasks. The optimization is based on minimizing the error between the distances measured by the anchor nodes and the distances estimated by the sensor nodes. To use the BOA for localization, the algorithm’s objective function is the sum of the errors between the measured distances and the distances estimated by the sensor nodes. The BOA then optimizes the positions of the anchor nodes to minimize this objective function. The BOA’s ability to explore the solution space efficiently and converge to the global optimum makes it a suitable optimization algorithm for localization strategies. In addition, the BOA can be combined with other optimization algorithms, such as the artificial gorilla troop optimizer, to enhance its performance and improve the localization accuracy. Resulting hybrid algorithms, such as the iHBAGTO algorithm, have been shown to outperform other localization algorithms in terms of accuracy and convergence rate. In developing a new node localization model, the performances of wireless sensor networks (WSNs) should be improved [14]. The localization model should be able to accurately determine the locations of sensor nodes in dense networks to enable the efficient placement of WSNs. The precise positioning of sensor nodes can track small variations in various applications such as pollutant concentrations, temperature, pressure monitoring, and gas leaks. To achieve this goal, a new heuristic algorithm can be used to solve the complexities of localization in dense networks. This algorithm is designed to solve multi-functional derivations and optimize the localization process. The algorithm considers signal strength, time of flight, and arrival angle to determine the sensor nodes’ locations accurately [15].
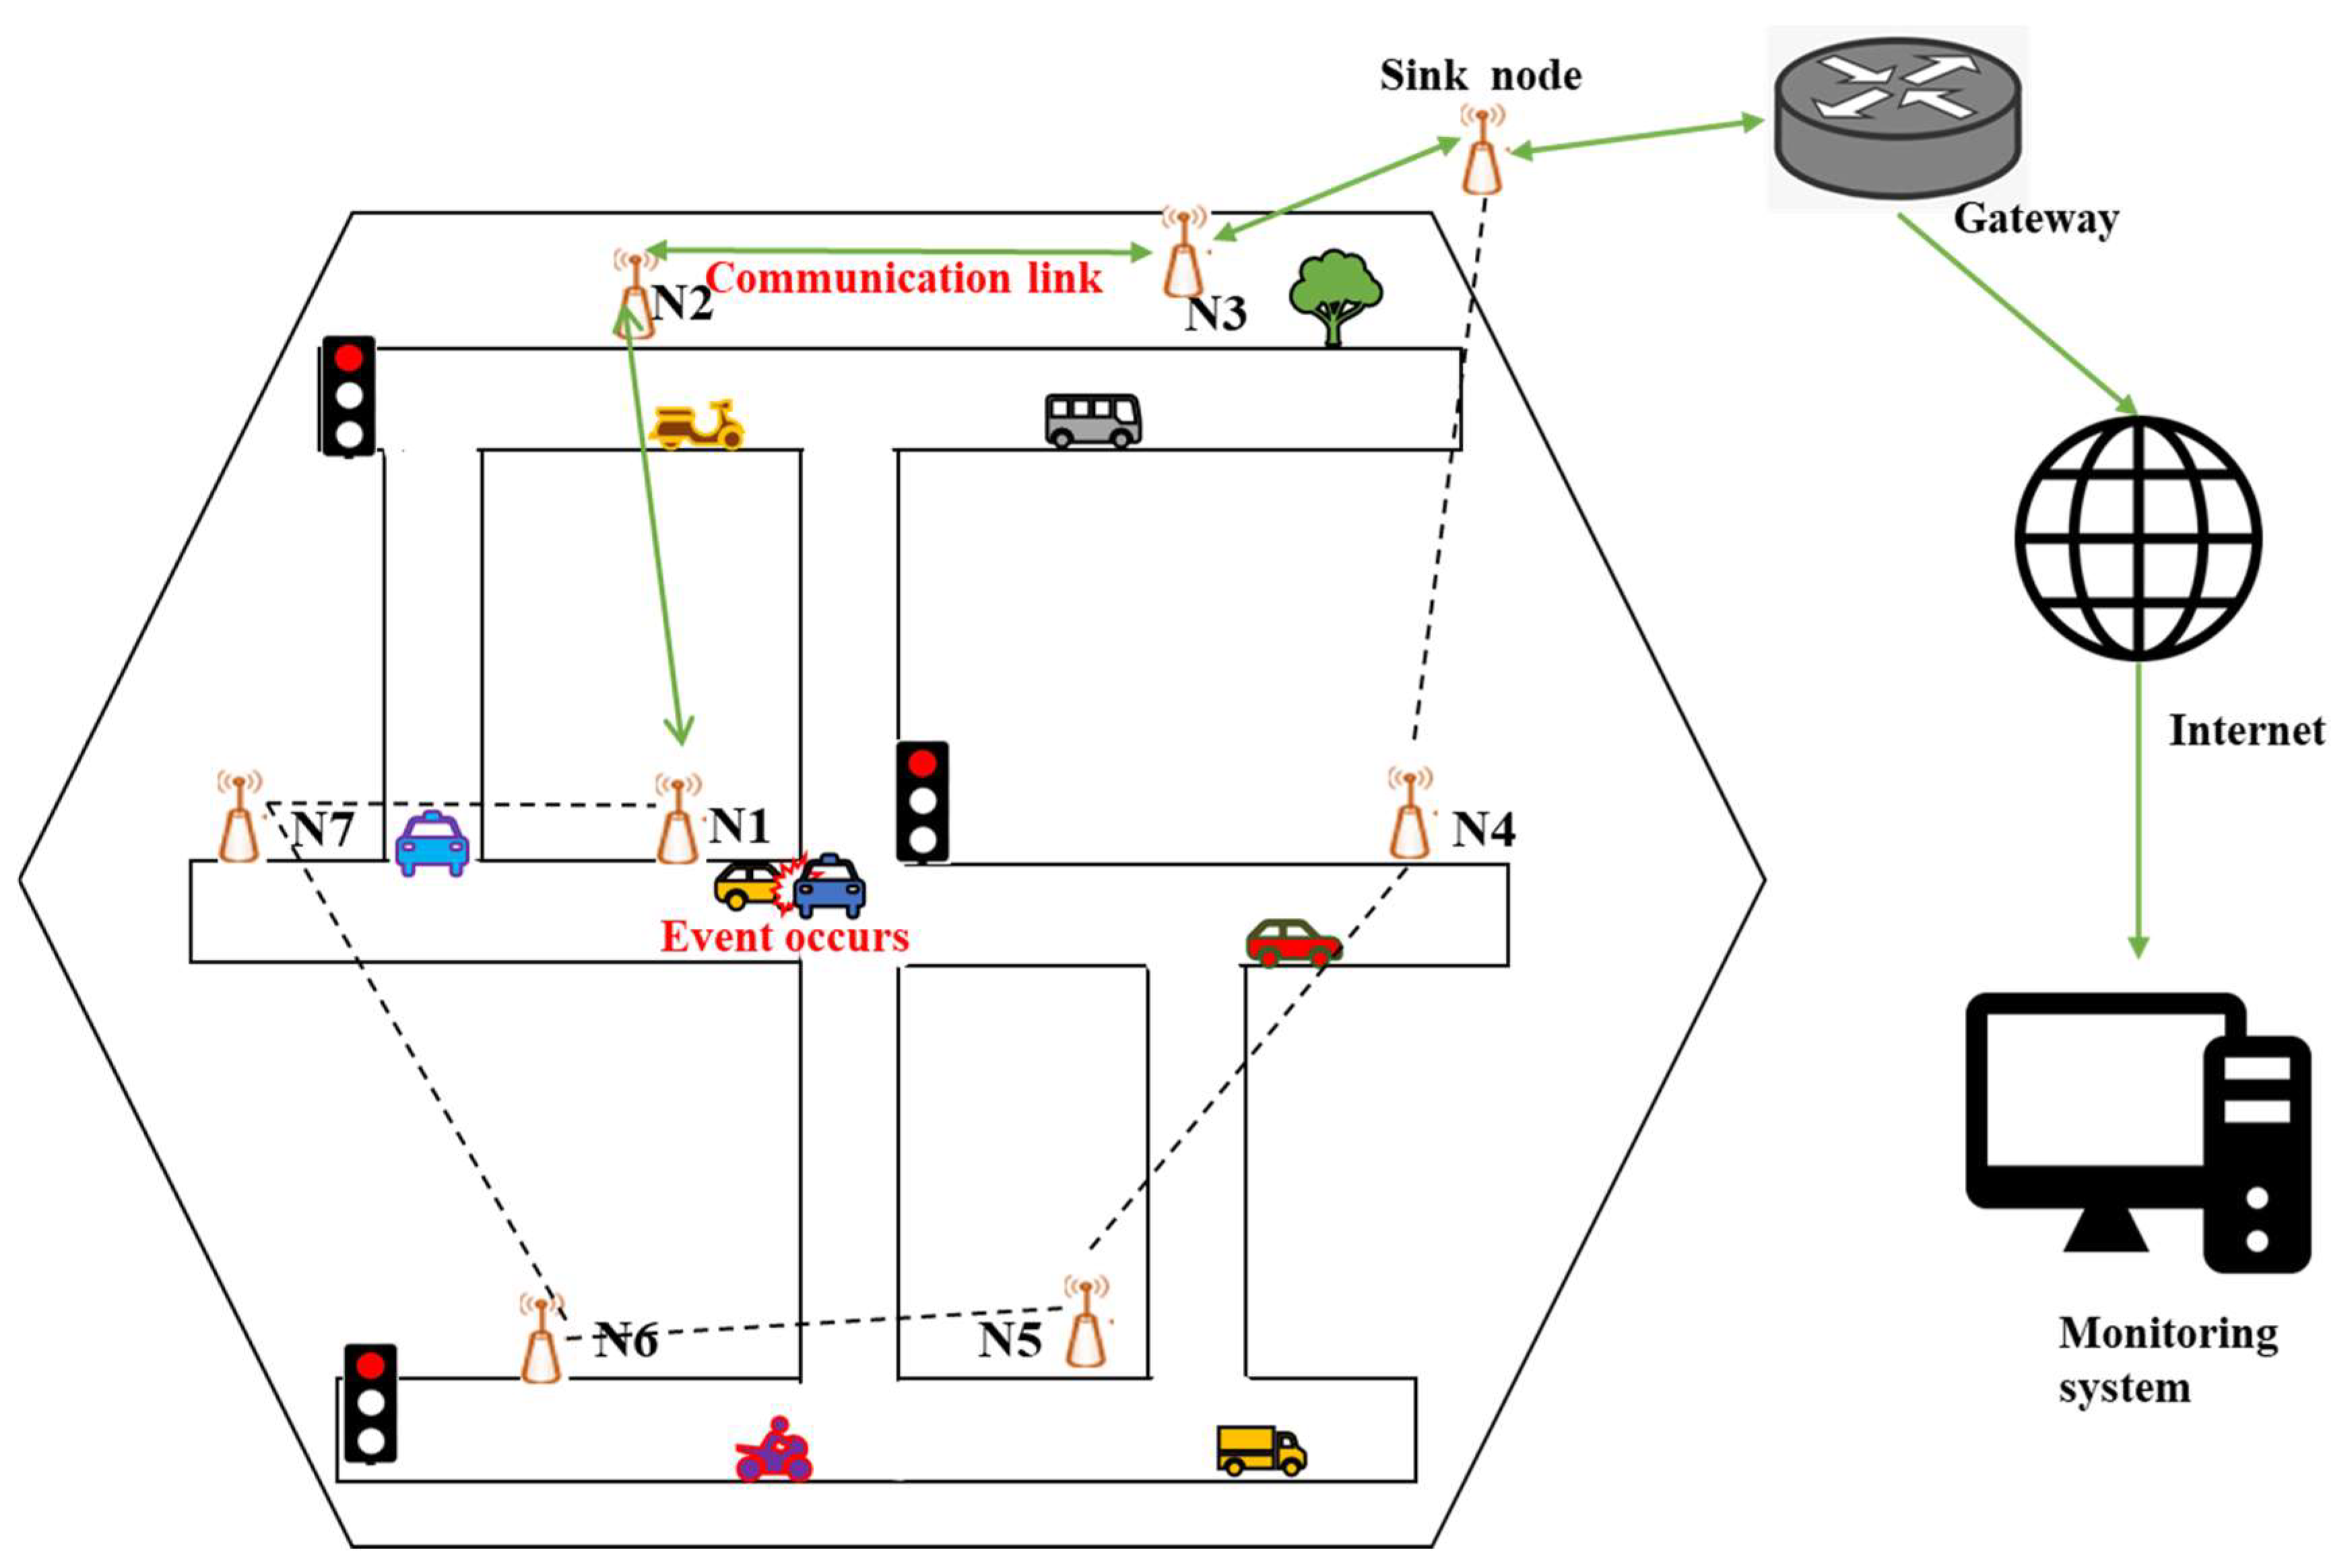
The new node localization model was developed using a combination of simulation and experimental techniques (Figure 2). The simulation used a suitable network simulator, and the experimental work was performed using real sensor nodes. The performance of the new localization model was evaluated based on several metrics, such as accuracy, precision, and computation time. The proposed localization model has several benefits, including improved efficiency in WSN placement, higher accuracy in tracking minute variations, and improved performances in various applications [16]. Overall, developing a new node localization model is an essential step toward improving the performances of WSNs and enhancing their applicability in various fields.
AHD = ∑i = j di,j
∑i = j hi,j
∑i = j hi,j
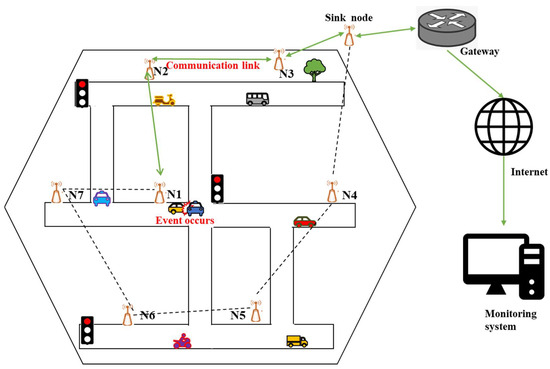
Figure 2.
Wireless sensor network localization.
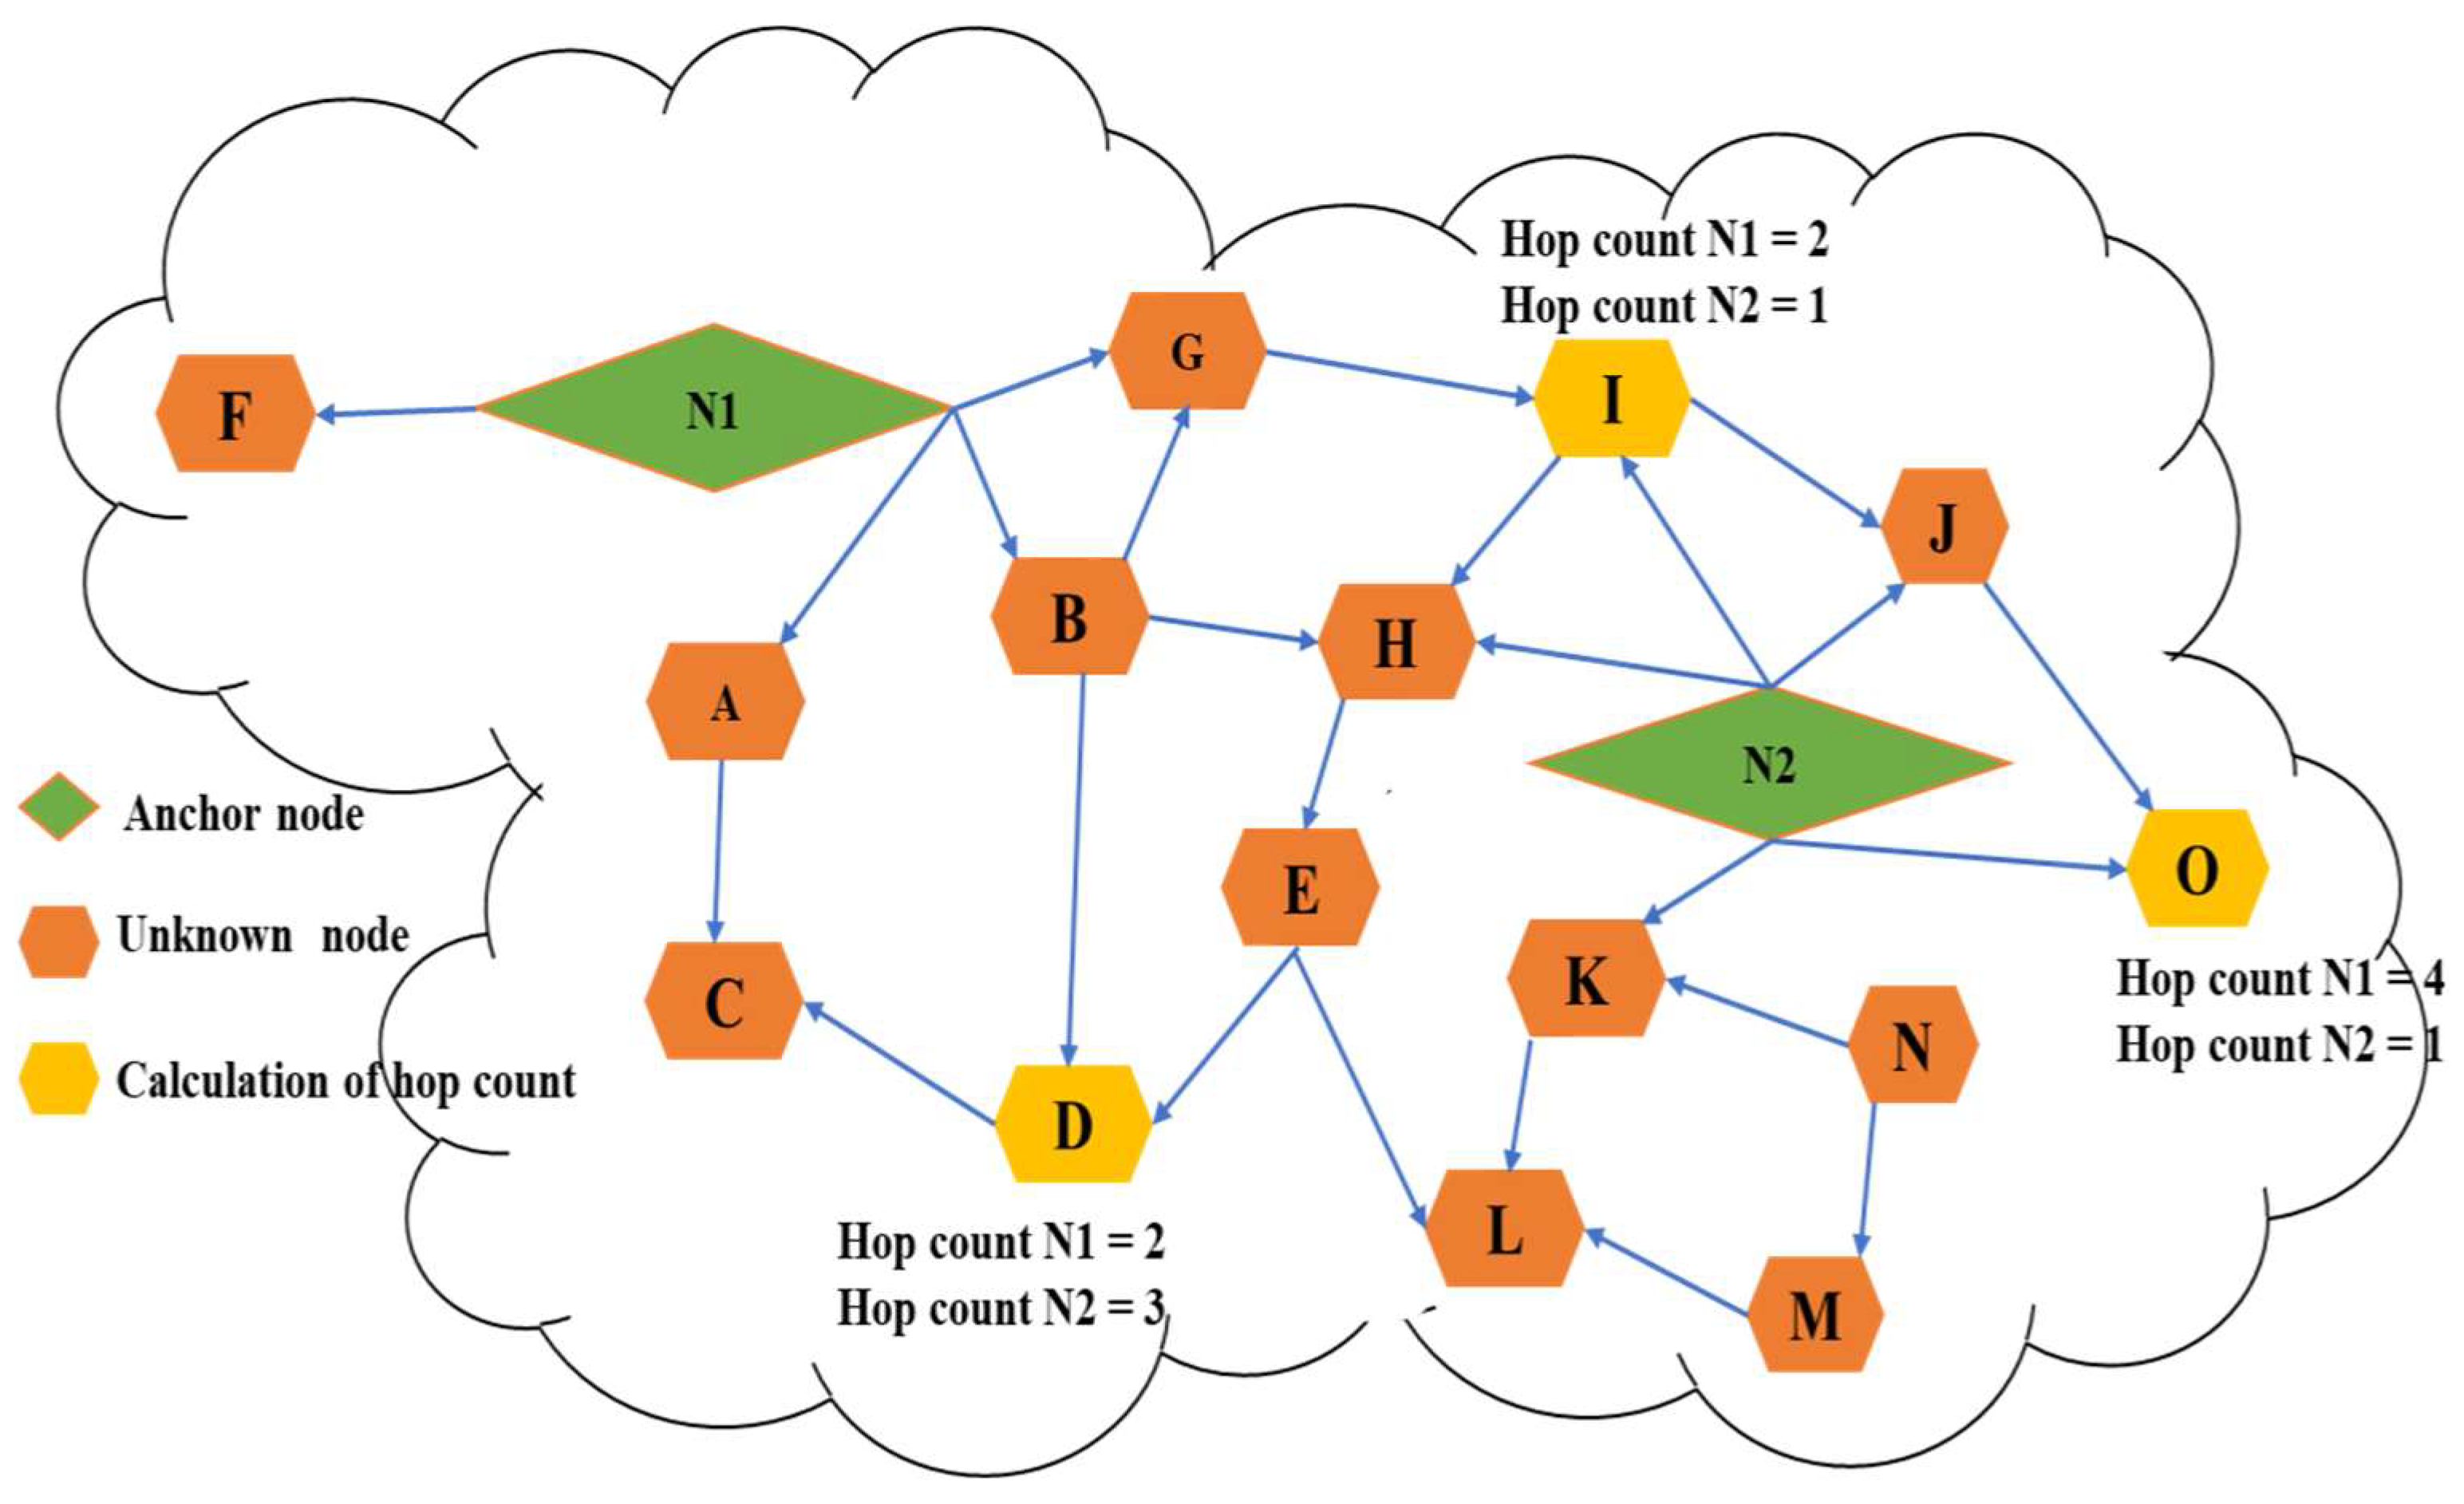
This equation represents the average hop distance (AHD) metric used to evaluate the performance of a routing protocol in wireless sensor networks (Figure 3). The numerator of the equation (∑i = j di, j) represents the sum of distances between all pairs of nodes i and j that have successfully communicated with each other. The denominator of the equation (∑i = j hi, j) represents the number of successfully established communications between all pairs of nodes i and j. Therefore, the AHD metric measures the average number of hops required for successful communication between pairs of nodes in the network. The lower the AHD value, the better the performance of the routing protocol in terms of energy efficiency and data delivery [17].
du, i = AHD × hu
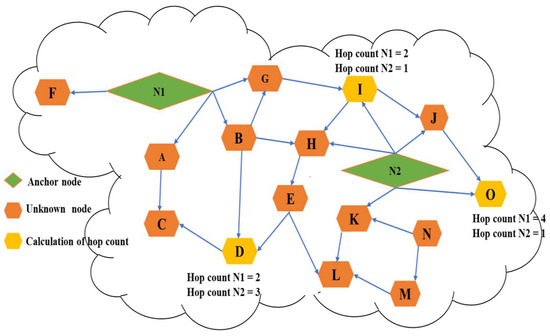
Figure 3.
Determining hop count.
Here, i represents the approximate distance between an anchor node “i” and an unlocalized node “u” in a wireless sensor network. The AHD is the average hop distance calculated using the equation AHD = ∑i = j di, j/∑i = j hi, j. The value of di, j is calculated as (xi − xj)2 + (yi − yj)2 and represents the Euclidean distance between the coordinates of anchor nodes i and j. The minimum hop value between i and j is represented by hi, j. The hop size is the hop size from anchor node i to its neighbors, and it is broadcasted by node i using controlled flooding throughout the network [18]. The value of hu, i represents the number of hops between anchor node i and the unlocalized node u.
3.2. Hybrid Butterfly Artificial Gorilla Troop Optimizer (iHBAGTO)
A hybrid algorithm combines two or more algorithms to solve problems and achieve better results than individual algorithms. In the context of wireless sensor networks (WSNs), the design of a novel hybrid heuristic algorithm called iHBAGTO is proposed to improve localization performance by reducing localization errors and increasing convergence rates [19].
The iHBAGTO algorithm was designed to discover the locations of anchor nodes close to the near-optimal target nodes, improving the localization accuracy. The algorithm combines the benefits of two popular algorithms, i.e., the Butterfly Algorithm (BA) and the gorilla troops optimizer (GTO), to achieve better results than individual algorithms. The proposed hybrid algorithm, iHBAGTO, combines the strengths of the BA and GTO algorithm using the search capabilities of the BA to find the optimal anchor node positions and the exploration capabilities of the GTO to refine the positions of the anchor nodes [20]. Combining the Butterfly Optimization Algorithm (BOA) with the artificial gorilla troop optimizer (GTO) brings several benefits to enhancing the localization accuracy in wireless sensor networks (WSNs). The BOA efficiently explores solution spaces and converges to global optima, making it suitable for localization strategies, while the GTO offers unique optimization capabilities inspired by gorilla troops’ behavior. This combination leverages their individual strengths to improve the overall optimization for sensor node localization, leading to enhanced accuracy, reduced errors in distance estimation, faster convergence rates, adaptability to complex environments, and superior performance compared to other localization algorithms, as demonstrated by the iHBAGTO algorithm. This helps to maximize the accuracy of localization and reduce localization errors. The algorithm is as follows:
- Initialization: Initialize the population of solutions randomly.
- Objective Function: Evaluate the fitness of each solution using an objective function.
- Butterfly Movement: Apply butterfly movement to update the positions of solutions based on the best solution found so far.
- Local Search: Apply local search to improve the solutions by exploring the neighborhood of each solution.
- Update Best Solution: Update the best solution found so far.
- Stopping Criteria: Check if the stopping criteria are met. If not, go back to step 2.
- Output: Return the best solution found as the final solution.
The input data include the coordinates of anchor nodes and the range of the sensors in the wireless sensor network (WSN) (Figure 4). The Butterfly Optimization Algorithm component aims to optimize the positions of anchor nodes to improve the accuracy of node localization. This component optimizes the localization by considering the energy efficiency and connectivity of the nodes. The gorilla troop optimizer algorithm component is responsible for optimizing the positions of the anchor nodes to improve the convergence rate and minimize localization errors. The hybrid algorithm component integrates the output of both the Butterfly Optimization Algorithm and gorilla troop optimizer algorithm to determine the optimized coordinates of the anchor nodes. The localization strategy component uses the optimized coordinates of anchor nodes to determine the locations of the target nodes in the WSN. The output data include the coordinates of the target nodes in the WSN, which are localized with higher accuracy and precision [21].
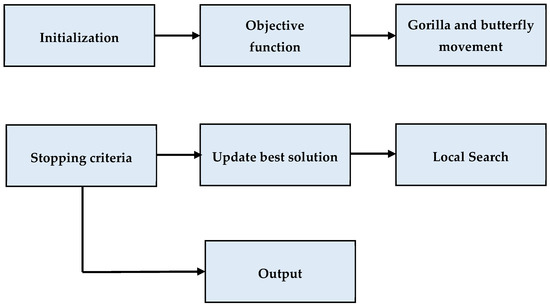
Figure 4.
Hybrid algorithm (Butterfly Artificial Intelligence + artificial gorilla troop optimizer).
The hybrid butterfly artificial gorilla troop optimizer (iHBAGTO) algorithm is a heuristic optimization technique designed to efficiently locate the anchor nodes close to the near-optimal target nodes to increase localization accuracy and reduce localization errors. The algorithm starts by initializing the populations of gorillas and butterflies, where each individual represents a candidate solution. The fitness of each individual is evaluated based on the localization error [22]. The Hybrid Butterfly Artificial Gorilla Troop Optimizer algorithm is represented in Algorithm 1.
| Algorithm 1 Algorithm for Hybrid Butterfly Artificial Gorilla Troop Optimizer |
| Input: Number of anchor nodes (n), number of target nodes (m), number of iterations (T), lower and upper bounds for the variables, parameters for GTO algorithm (x, D, β), parameters for butterfly operator (p, r) Output: The best solution found during the optimization process // Initialize populations of gorillas and butterflies for k = 1 to n + m randomly initialize the position of the individual and evaluate the fitness of the individual End for for t = 1 to T for k = 1 to n randomly select a gorilla individual A(k) if Rand < z then perform ‘Move to an unknown location’ operation else if Rand >= 0.5, then perform ‘Transition to other gorillas’ operation else perform ‘Migrate to a known position’ operation End if evaluate the fitness of the new individual if (new individual fitness > A(k)) replace A(k) with the new individual End if // Perform exploitation phase using GTO strategies for i = 1 to n randomly select a gorilla individual A(k) If (V >= D) perform ‘Follow the Silverback’ strategy Else perform ‘Competition for adult females’ strategy evaluate the fitness of the new individual End if End for if (new individual > fitness than A(k)) replace A(k) with the new individual End if for i = 1 to do n randomly select a gorilla individual A(k) if (Rand < p) apply butterfly operator to A(k) with parameter r evaluate the fitness of the new individual else if the new individual has a better fitness than A(k) replace A(k) with the new individual End if // Select best solutions from both populations sort individuals in both populations based on fitness select the top n individuals from the gorilla population select the top m individuals from the butterfly population replace the worst n individuals in the gorilla population with the selected individuals replace the worst m individuals in the butterfly population with the selected individuals // Output the best solution found sort individuals in both populations based on fitness return individuals with best fitness |
In the exploitation phase, two strategies, Follow the Silverback and Competition for adult females, are used to select and modify the positions of the gorillas. In the exploration phase of the algorithm, the GTO operators—Move to an unknown location, Transition to other gorillas, and Migrate to a known position—are applied to randomly selected gorilla individuals [11]. Additionally, the butterfly operator is applied to randomly selected gorillas to explore the solution space further. After evaluating the fitness values of the modified individuals, the best solutions from both populations are selected, and the worst individuals in each population are replaced with them. This process is repeated for a fixed number of iterations.
The output of the iHBAGTO algorithm is the best solution found during the optimization process. Combining the GTO algorithm with the butterfly operator allows the iHBAGTO algorithm to effectively balance exploration and exploitation to improve the localization accuracy and convergence rate. Overall, this algorithm is useful for solving optimization problems related to localization, especially because the locations of anchor nodes being close to near-optimal target nodes is crucial.
The artificial gorilla troop optimizer (GTO) is a nature-inspired optimization algorithm modeled after gorilla troops’ behavior in the wild. The GTO algorithm consists of two main phases: exploration and exploitation. In the exploration phase, three different operators are used to explore the search space, including moving to an unknown location, transitioning to other gorillas, and migrating to a known position [23]. These operators are represented using a set of equations that involve random values and parameters:
where PA(t + 1) denotes the gorilla position at time t + 1, LB and UB denote the lower and upper bounds, and random values range from 0 to 1. A(t) refers to the current position of the gorilla. Then, the pseudocode for the Artificial Gorilla Troop Optimizer (GTO) Algorithm is represented in Algorithm 2:
(UB − LB) × r1 + LB Rand < x
PA(t + 1) = {(r2 − V) × Er(t) + W × U Rand ≥ 0.5
E(k) − W × (E(t) − ZEr(t) + r3 × (E(t) − ZEr(t))) Rand < 0.5
W = V × i
U = X × E(t)
X = [−V, V]
| Algorithm 2 Pseudocode for the Artificial Gorilla Troop Optimizer (GTO) Algorithm |
| Input: objective function Output: the best solution Initialization: population of gorillas within the search space Set max_iter = maximum number of iterations, parameters x, M, β, and i. For each gorilla Evaluate fitness End for a. Perform the exploration phase: For each gorilla Generate a random number, Rand If (Rand < x) move to a new random location within the search space Else If (Rand ≥ 0.5) follow the silverback gorilla using the equation PA(t + 1) Else If (Rand < 0.5) compete for adult females using the equation PE(k) End if End for b. Evaluate the fitness of each gorilla after the exploration phase. c. Perform the exploitation phase: for each gorilla Calculate the values of V and D If (V ≥ D) follow the silverback using the equation PA(t + 1) Else If (V < D) compete for adult females using the equation PE(k) End if End for Evaluate fitness Output best solution found |
In the exploitation phase, two strategies are applied, depending on the value of a parameter D. The first strategy, called Follow the Silverback, is applied when V (a calculated value based on the position of the gorilla candidate) is greater than or equal to D. In this strategy, the best solution, Esilverback, is followed, and the candidate position is updated based on the distance between the current position and Esilverback.
PA(t + 1) = W × M × (E(t) − Esilverback) + E(t)
M = (|1/n ∑n PEk(t)|G)1/8
G = 2W
The second strategy, Competition for adult females, is applied when V is less than D. In this strategy, the candidate position is updated using a formula that involves a parameter β, a random value r5, and a function of the total number of gorillas as n. The GTO algorithm is designed to balance exploration and exploitation in the search for the optimal solution.
PE(k) = Esilverback − (Esilverback × Q − E(t) × Q) × A
Q = 2 × r5 − 1
T = β × h
h = {n1, Rand ≥ 0.5
n2, Rand < 0.5
n2, Rand < 0.5
The Butterfly Optimization Algorithm is a metaheuristic optimization algorithm inspired by the flight behavior of butterflies. The algorithm process involves initializing a population of butterflies within the boundaries of the search space and evaluating their stimulus intensity through the objective function. The algorithm starts by defining the objective function f(x), sensory morphology c, power exponent a, boundary, and probability p. It then creates a population of butterflies A = {a1, a2, ..., an}. It determines their stimulus intensity Ik through the objective function and then proceeds through a series of iterations where the fitness of each butterfly is calculated and the best position of the butterfly is found. Each butterfly’s fragrance is calculated based on its fitness value during each iteration, and a random number is generated to determine whether a global or local search method should be used.
Ak(t + 1) = Akt + (r2 × b* − Akt) Fk
Here, Ak(t+1) is the current position of the butterfly k at time t, b* is the position of the best butterfly found so far, r is a random number between 0 and 1, and Fk is the fragrance of the butterfly k. If a global search is chosen, the butterfly flies toward the butterfly with the highest fitness using the global search equation. If a local search is chosen, the butterfly randomly selects two other butterflies (i, j) and flies toward a position between them using the local search equation.
Ak(t+1) = Akt + (r2 × Ait − Ajt) Fk
Here, Ait and Ajt are the positions of two randomly selected butterflies i and j at time t. The power exponent a is updated during each iteration to control the global and local search balance. As the number of iterations increases, the power exponent decreases, which gives more weight to the global search. The algorithm repeats this process until a termination condition is met, such as reaching the maximum number of iterations, and outputs the best solution found [13]. Further, the steps involved in the Butterfly Artificial Intelligence process is represented in Algorithm 3:
| Algorithm 3 Algorithm for Butterfly Artificial Intelligence Process |
| Input: Objective function f(a), sensory morphology c, power exponent x, boundary probability p, butterfly population size n, the maximum number of iterations max_iter, F-fitness Output: Best solution found b* Initialization: population A = {a1, a2, ..., an} with intensity Ik for t = 1 to max_iter Calculate the fitness of each butterfly i in A Find best_position End for While convergence not met for k = 1 to n Calculate the fragrance of butterfly k Generate a random number P between 0 and 1 if (P <= p) Select a butterfly j with the highest fitness Update the position of a butterfly i using the global search equation: Ak(t+1) = Akt + (r2 * b* − Akt) Fk r = random number between 0 and 1 b* = best solution found Fk = fragrance of butterfly k else Select two random butterflies i and j Update the position of butterfly k using the local search equation: Ak(t+1) = Akt + (r2 * Ait − Ajt) Fk Ait and Ajt are the positions of butterflies i and j in the current iteration End if if (new_F < F(k)) Update solution space F(k) = new_F end if if (new_F ≤ f_min) f_min = new_F update best_position end if end for Update the power exponent a and p a = 1 − (t/max_iter) end while end for Output the best solution found b* |
The design of the novel hybrid heuristic algorithm, iHBAGTO, is an essential step toward improving the localization performances of WSNs by reducing localization errors and increasing convergence rates. The performance of the iHBAGTO algorithm was evaluated based on convergence rate, average error, and standard deviation. The results show that the iHBAGTO algorithm achieves a lower average error and faster convergence rate than individual algorithms. The iHBAGTO algorithm can be applied in various applications, such as military, robotics, and environmental monitoring, to improve the accuracy of localization and aid decision making [24].
3.3. Multi-Functional Derivation
Multi-functional derivation is a mathematical process that considers multiple variables and their relationships to each other to derive an optimal solution. By considering multiple variables and their relationships, multi-functional derivation enables the formulation of a comprehensive localization strategy that can be used in various WSN applications, including environmental monitoring, military, and robotics. The multi-functional derivation process in wireless sensor networks (WSNs) optimizes node positions by analyzing variables like delay, path loss, energy consumption, and received signal strength (RSS), enhancing communication and energy efficiency. Delays are assessed to improve communication efficiency, while path loss variations inform optimal node placements for accurate signal propagation. Energy patterns are analyzed for sustainability, and RSS variations are examined for reliable communication. This analysis of variables’ interplay results in a balanced solution for enhanced localization, integrating delay, path loss, energy, and RSS analyses to optimize anchor node positions, ensuring precise localization, improved data collection, and adaptive strategies for ongoing network optimization, ultimately enhancing network performance, efficiency, and data accuracy in WSNs [25]. The designed localization strategy based on multi-functional derivation maintains a reasonable localization accuracy while increasing the number of target nodes. The iHBAGTO algorithm, a hybrid algorithm combining the strengths of the Butterfly Algorithm and gorilla troop optimizer, is used to implement this strategy and achieve better localization results.
3.4. Test and Efficiency of the Designed iHBAGTO
To evaluate the effectiveness of the designed HBAGTO-based node positioning strategy in wireless sensor networks (WSNs), a series of experiments can be conducted by creating five networks with varying parameters such as network area, number of target nodes, anchor nodes, and sensing range. The experiments can be designed to test the efficiency of the iHBAGTO algorithm in different scenarios and conditions. The performance of the iHBAGTO algorithm can be compared with those of other custom algorithms in terms of metrics such as delay, path loss, energy, and RSS. The metrics can be measured for each network, and the results can be compared to determine the effectiveness of the iHBAGTO algorithm. By analyzing the experimental results, the performance of the iHBAGTO algorithm can be evaluated, and its strengths and weaknesses can be identified. The results can be used to refine the algorithm and improve its performance in different scenarios. Evaluating the iHBAGTO algorithm’s performance can provide insights into the effectiveness of the multi-functional derivation approach and the hybrid algorithm design [26]. It can also help identify the algorithm’s potential applications and limitations in real-world scenarios. Overall, the hybrid algorithm of Butterfly Optimization and a gorilla troop optimizer combines the strengths of both algorithms to improve the localization accuracy, convergence rate, and energy efficiency in WSNs.
4. Results and Discussion
This study developed a new node localization model for wireless sensor networks (WSN) using a novel hybrid heuristic algorithm called the improved hybrid butterfly artificial gorilla troop optimizer (iHBAGTO). The main goal of the localization strategy was to achieve the efficient and precise positioning of sensor nodes in dense WSNs, which is very useful in groundwater monitoring. In this context, one of the most relevant problems is linked, in addition to the requisites of the sensor itself, to the correct individuation of a sensor’s position in relation to the phenomenon to monitor. Therefore, optimizing sensor location can allow us to extract the maximum quantity of information with the minimum cost. This would significantly improve the characterization process by reducing site characterization times and costs and provide more complete and continuous data-sets for long-term monitoring.
The iHBAGTO algorithm was designed to discover the locations of anchor nodes close to the near-optimal target nodes to increase the convergence rate and maximize accuracy in localization while reducing localization errors. The existing Artificial Rabbit Optimization (ARO) [27], Northern Goshawk Optimization (NGO) [28], Hunger Games Search (HGS) [29], and Slime Mould-inspired Algorithm (SMA) [30] approaches were compared with the proposed iHBAGTO algorithm.
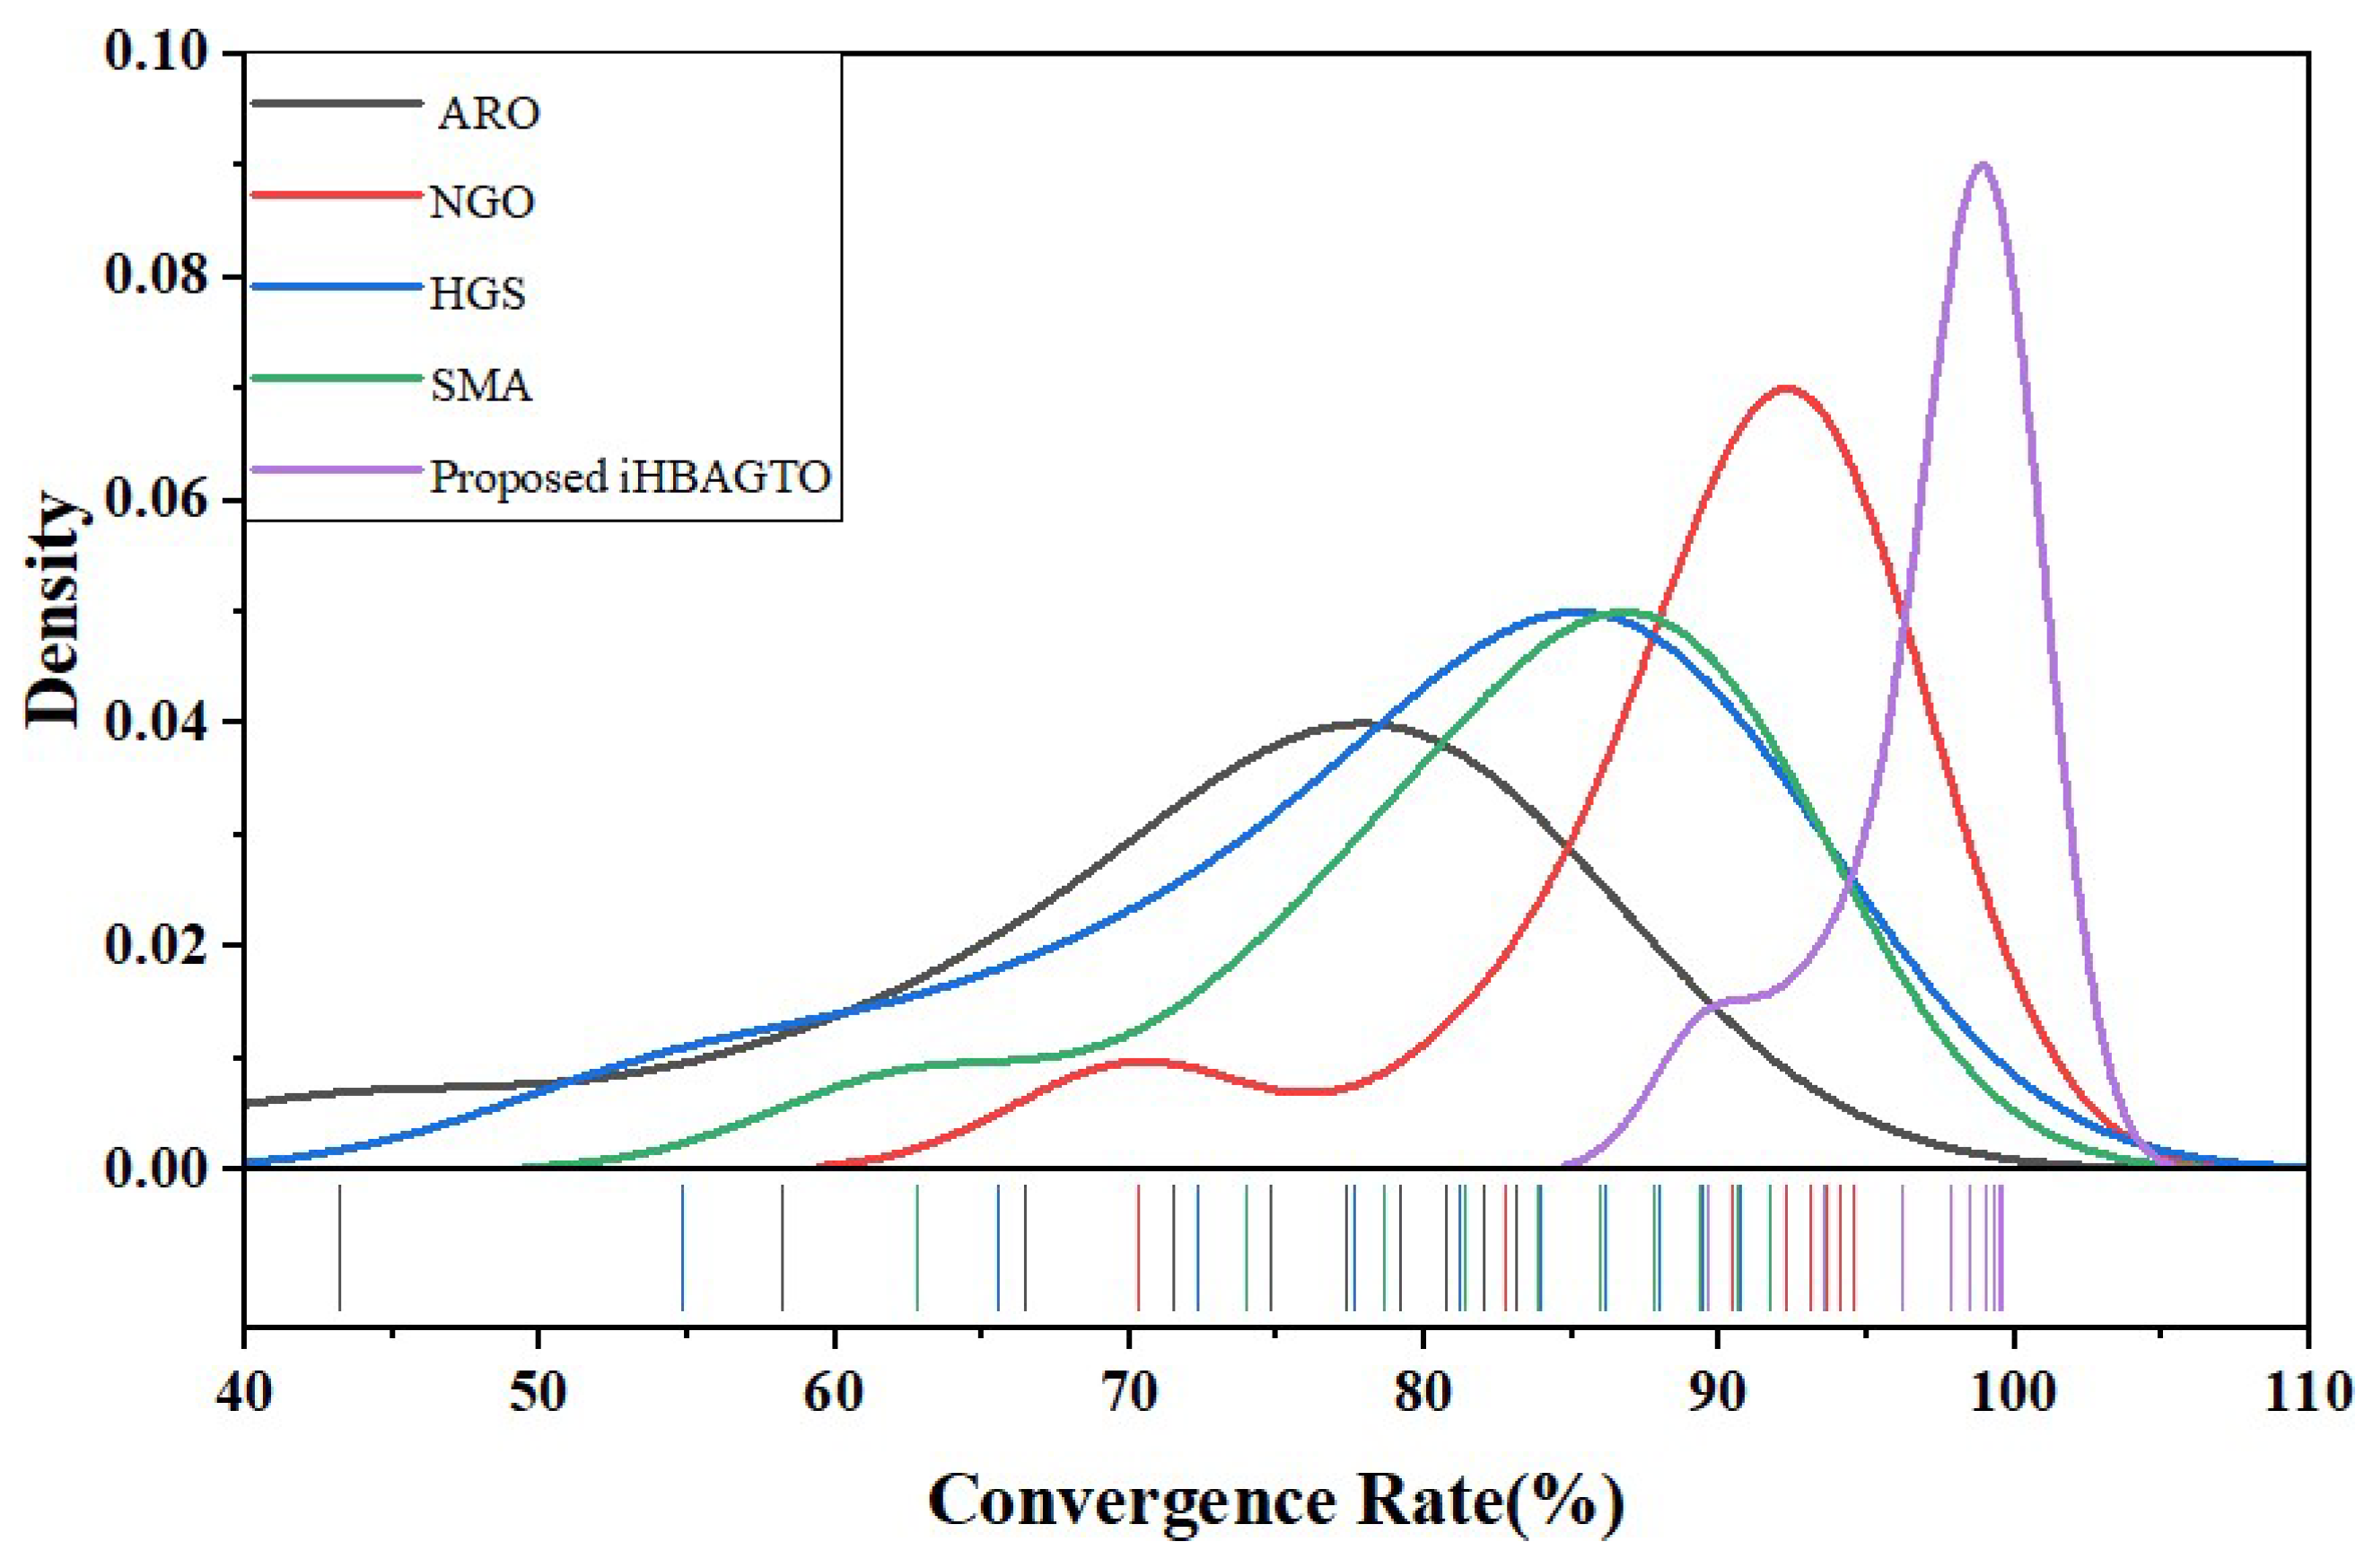
Table 2 presents a comparative analysis of the convergence rates achieved by the proposed iHBAGTO algorithm and four other algorithms: Artificial Rabbit Optimization (ARO), Northern Goshawk Optimization (NGO), Hunger Games Search (HGS), and the Slime Mould-inspired Algorithm (SMA). The comparison is based on the number of iterations required for these algorithms to converge. The convergence rate is a critical metric in optimization algorithms as it indicates how quickly an algorithm reaches an optimal solution or a near-optimal solution. A lower number of iterations typically signifies a faster convergence rate, implying that the algorithm is efficient in finding solutions. By examining the convergence rates of these algorithms, the effectiveness and efficiency of each algorithm in solving optimization problems can be assessed. The iHBAGTO algorithm’s performance was evaluated alongside those of these established algorithms to provide insights into the algorithm’s comparative strengths and weaknesses [14].
Table 2.
Convergence rate of existing and proposed systems.
Figure 5 displays the convergence rates of five optimization algorithms. The convergence rate measures how fast an algorithm can converge to the optimal solution. The proposed system converges faster to the optimal solution within few iterations than the other algorithms. As we can see from Figure 5, the iHBAGTO algorithm achieved the highest convergence rate among all algorithms, reaching 89.6% after just 10 iterations and increasing up to 99.6% after 90 iterations. NGO follows this with a convergence rate of 70.3% at 10 iterations, which improves up to 94.5% at 100 iterations.
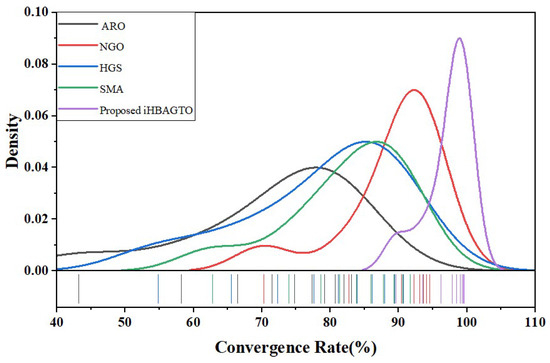
Figure 5.
Convergence rates of various algorithms.
On the other hand, ARO, HGS, and the SMA had relatively low convergence rates ranging from 43.2% to 78.6% after 10 iterations, which increased to 83.1%, 90.7%, and 91.7%, respectively, at 100 iterations. Figure 5 shows that the iHBAGTO algorithm has the highest convergence rate at all iterations, followed by the HGS algorithm. The ARO, NGO, and SMA had lower convergence rates at all iterations. This indicates that the iHBAGTO algorithm is more efficient in finding the optimal solution than the other algorithms.
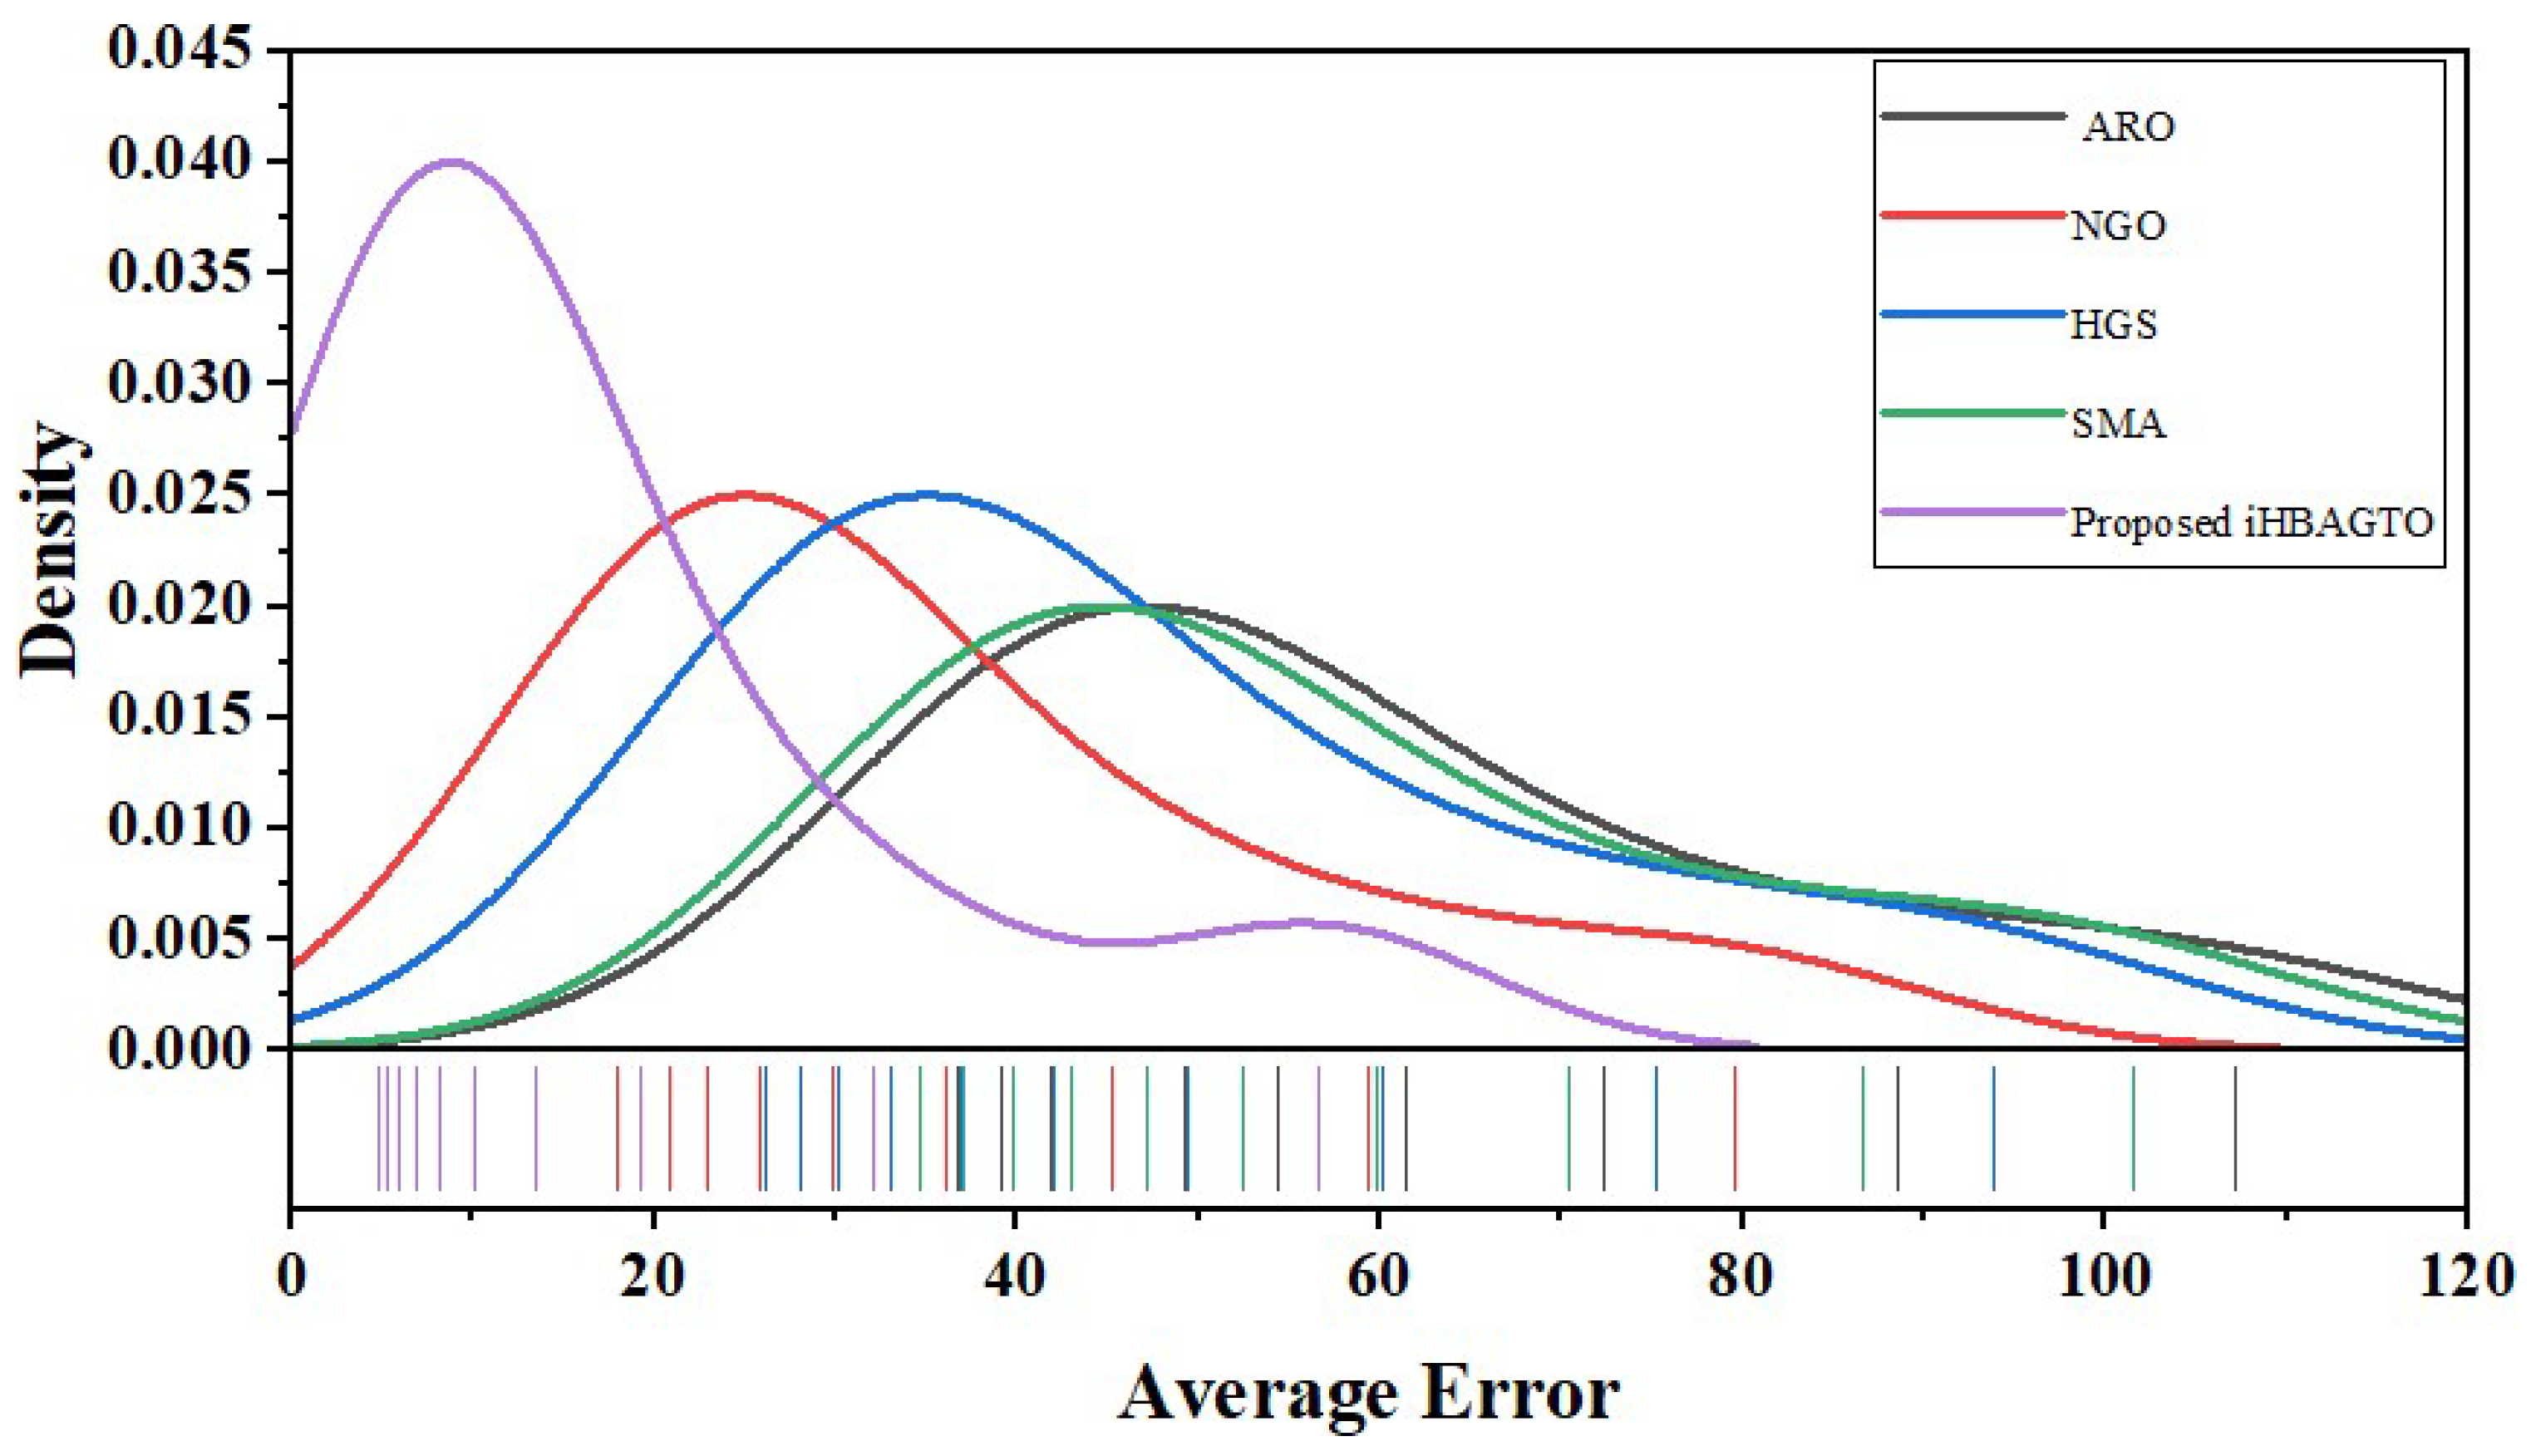
Table 3 compares several existing optimization algorithms (ARO, NGO, HGS, and SMA) to the proposed algorithm called iH-BAGTO. The comparison is based on the average error over different numbers of iterations. The average error metric outlines the typical deviation of a solution from the ideal or optimal solution. Comparing these algorithms allows us to evaluate their performance in terms of convergence to the optimal solution over multiple iterations. Lower average error values indicate greater accuracy and efficiency in obtaining the optimal solution within a given number of iterations. This comparison assists in understanding the strengths and weaknesses of each algorithm and can guide the selection of the best optimization approach for specific problem domains.
Table 3.
Average errors for ARO, NGO, HGS, the SMA, and the proposed iHBAGTO algorithm for different numbers of iteration.
Figure 6 shows a comparison of various algorithms in terms of average error. At the beginning iterations (10–20), the ARO and HGS algorithms have higher average errors than the others, whereas the proposed iHBAGTO algorithm has the lowest average error. As the number of iterations increases, the average error decreases for all algorithms, but the iHBAGTO algorithm consistently outperforms the others with the lowest average error. After 100 iterations, the iHBAGTO algorithm achieves the lowest average error of 4.8, while the next best algorithm, NGO, achieves an average error of 18.0. ARO, HGS, and the SMA perform relatively poorly, with average errors ranging from 26.1 to 36.8. Overall, Figure 6 demonstrates the superior performance of the iHBAGTO algorithm in achieving the lowest average error compared to the other optimization algorithms [16].

Figure 6.
Iteration vs. average error comparison for ARO, NGO, HGS, the SMA, and the iHBAGTO algorithm.
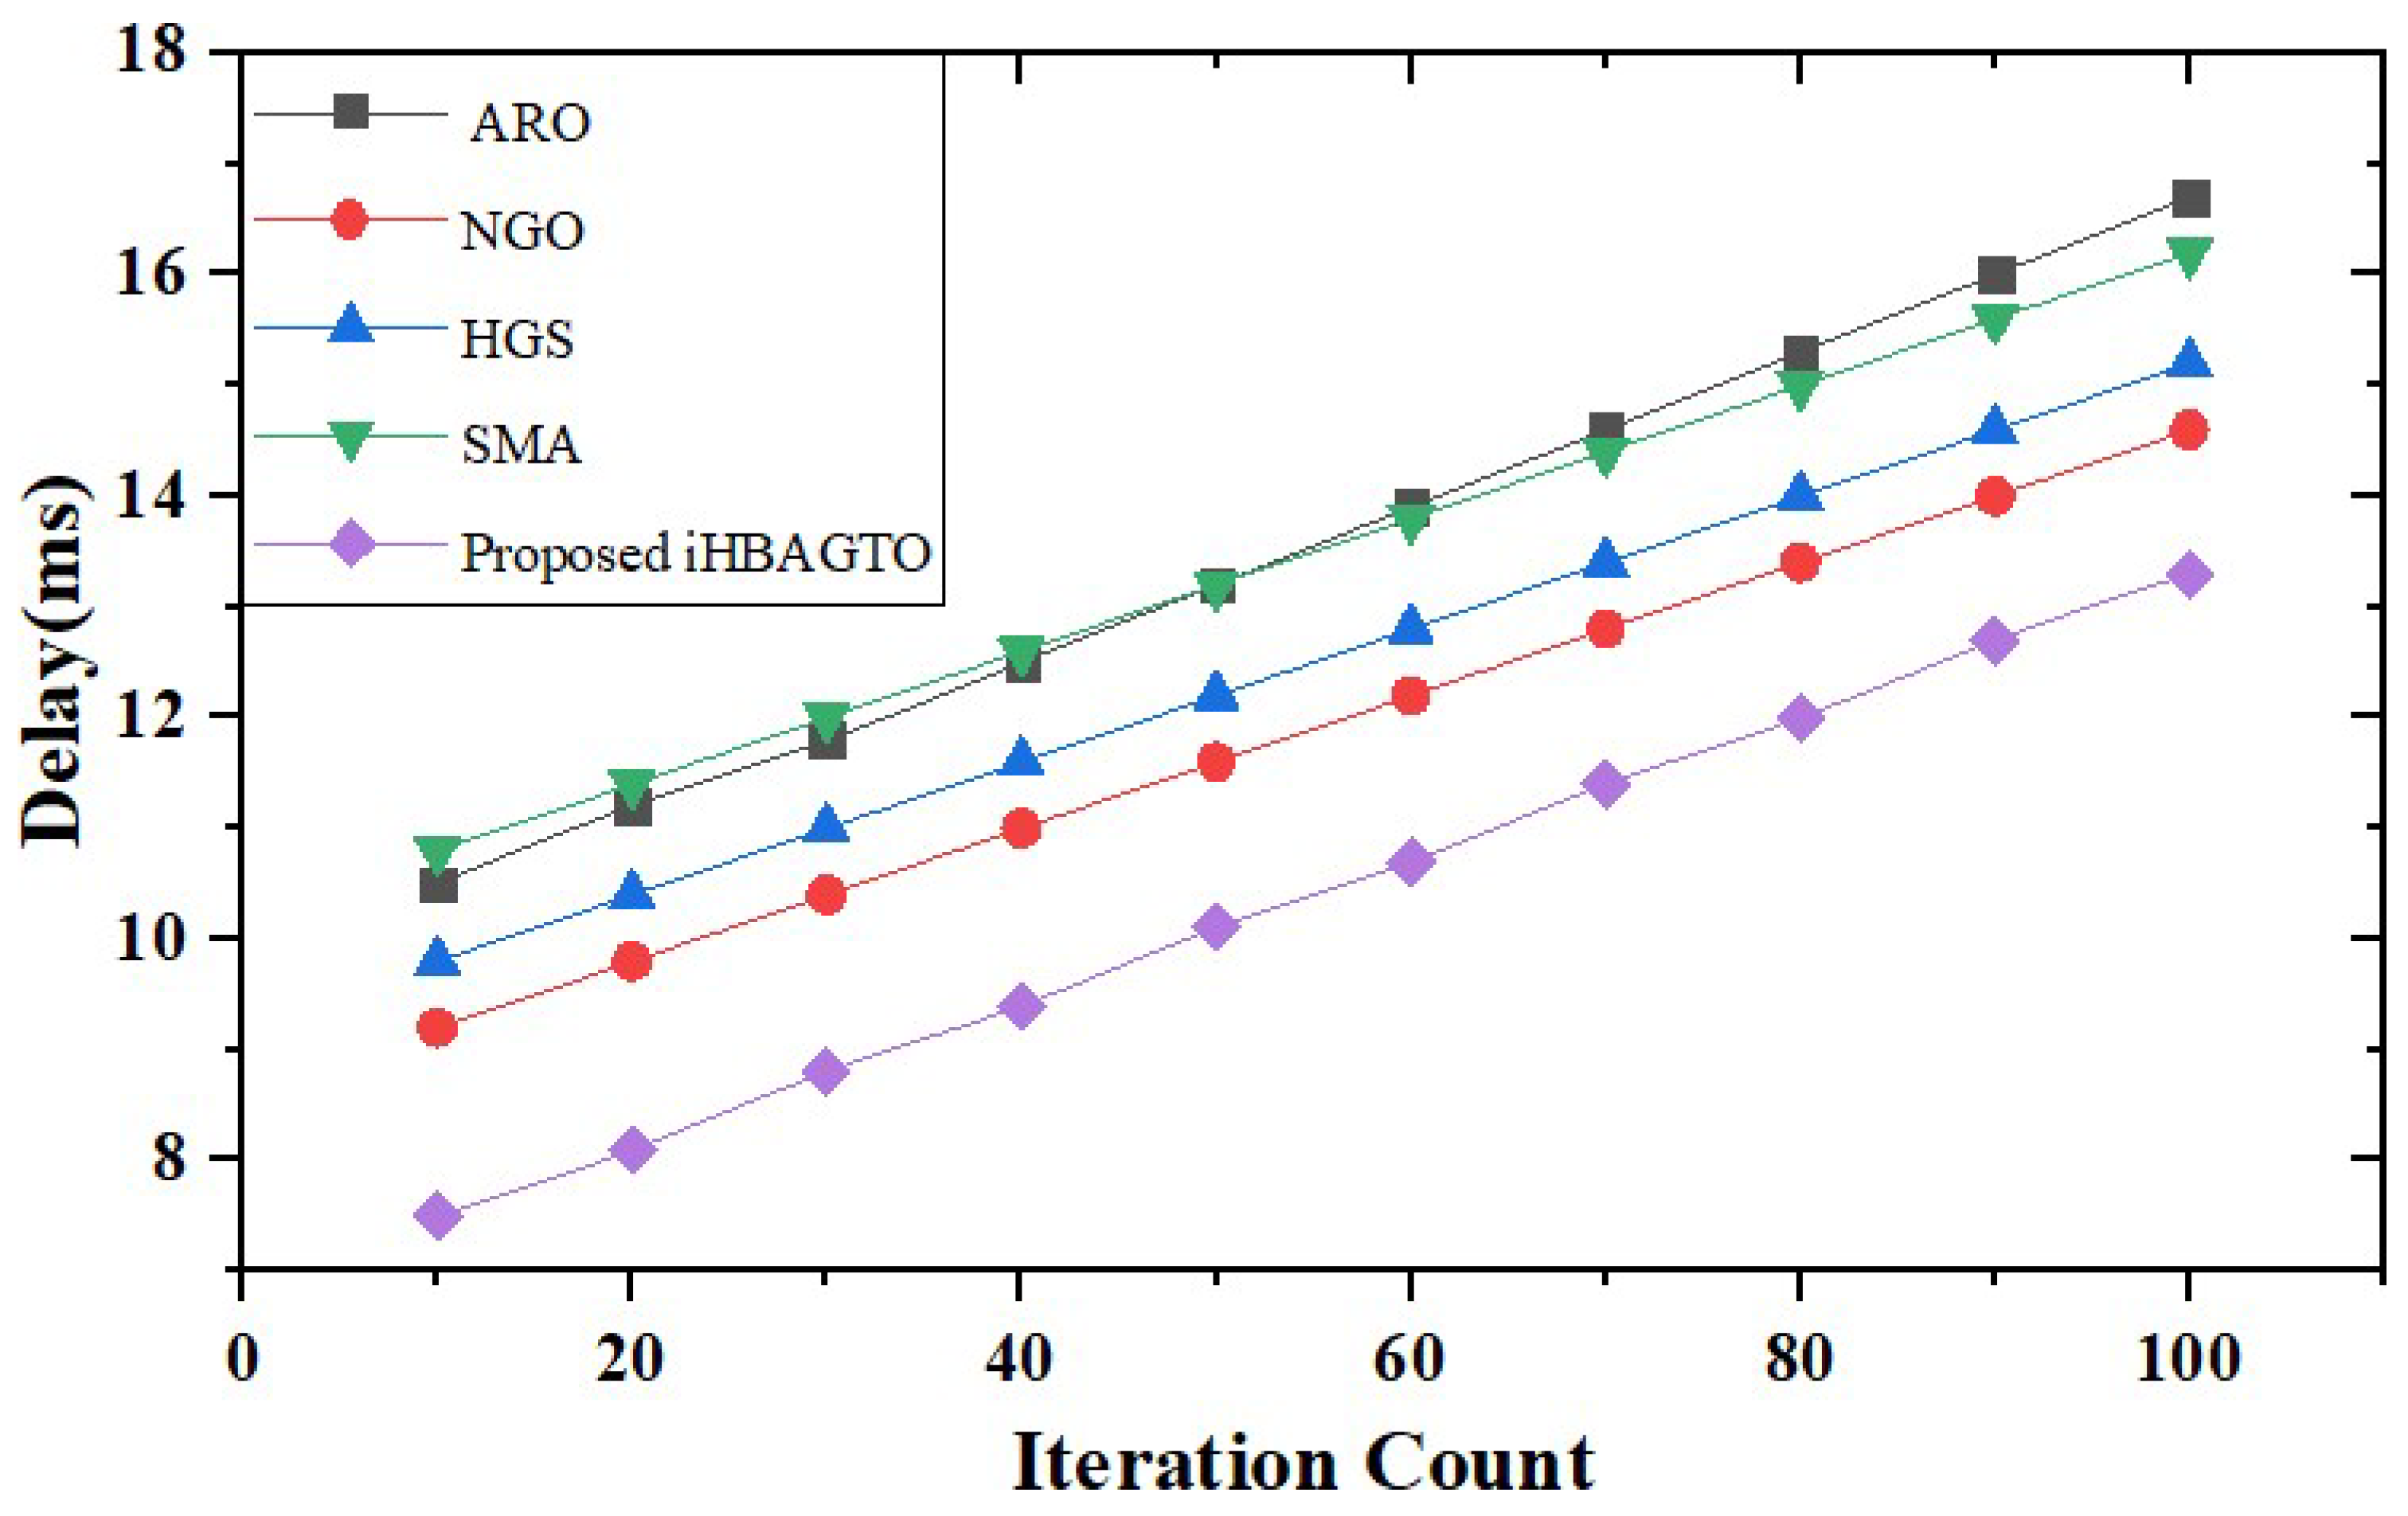
Table 4 presents a comparison of iteration counts and corresponding delays (measured in milliseconds) for five different optimization algorithms applied to a specific optimization problem. These algorithms are Artificial Rabbit Optimization (ARO), Northern Goshawk Optimization (NGO), Hunger Games Search (HGS), the Slime Mould-inspired Algorithm (SMA), and the newly proposed iHBAGTO algorithm. The iteration counts refer to the number of iterations or cycles that each algorithm goes through during the optimization process. A higher iteration count typically indicates that the algorithm requires more cycles to converge to an optimal or near-optimal solution. The delays, measured in milliseconds, represent the time taken by each algorithm to complete a set number of iterations. Lower delay values suggest that the algorithm processes iterations more quickly, which can be advantageous in time-sensitive applications or scenarios where rapid optimization is crucial [26].
Table 4.
Comparison of the existing ARO, NGO, HGS, and SMA approaches and the iHBAGTO algorithm regarding the delay (RSS).
Figure 7 compares iteration counts versus delay for the five algorithms. The x-axis represents the number of iterations, and the y-axis represents the millisecond delay. As can be seen from the graph, the proposed iHBAGTO algorithm has the lowest delay compared to the other algorithms for all iteration counts. As the number of iterations increases, the delays for all algorithms increase, but the proposed iHBAGTO algorithm consistently has the lowest delay. The delay for the proposed iHBAGTO algorithm is consistently lower than those of the other algorithms, with a minimum delay of 7.5 ms and a maximum delay of 13.3 ms. The delay for ARO ranges from 10.5 ms to 16.7 ms. The delay for NGO ranges from 9.2 ms to 14.6 ms. The delay for HGS ranges from 9.8 ms to 15.2 ms, and the delay for the SMA ranges from 10.8 ms to 16.2 ms. Overall, the proposed iHBAGTO algorithm outperforms the other algorithms regarding the delay, even as the number of iterations increases.
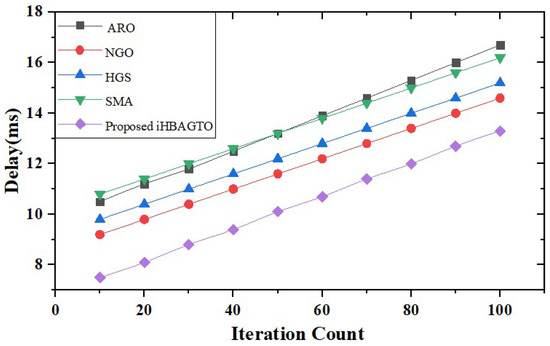
Figure 7.
Increasing the count of iterations versus energy consumption of existing and proposed algorithms.
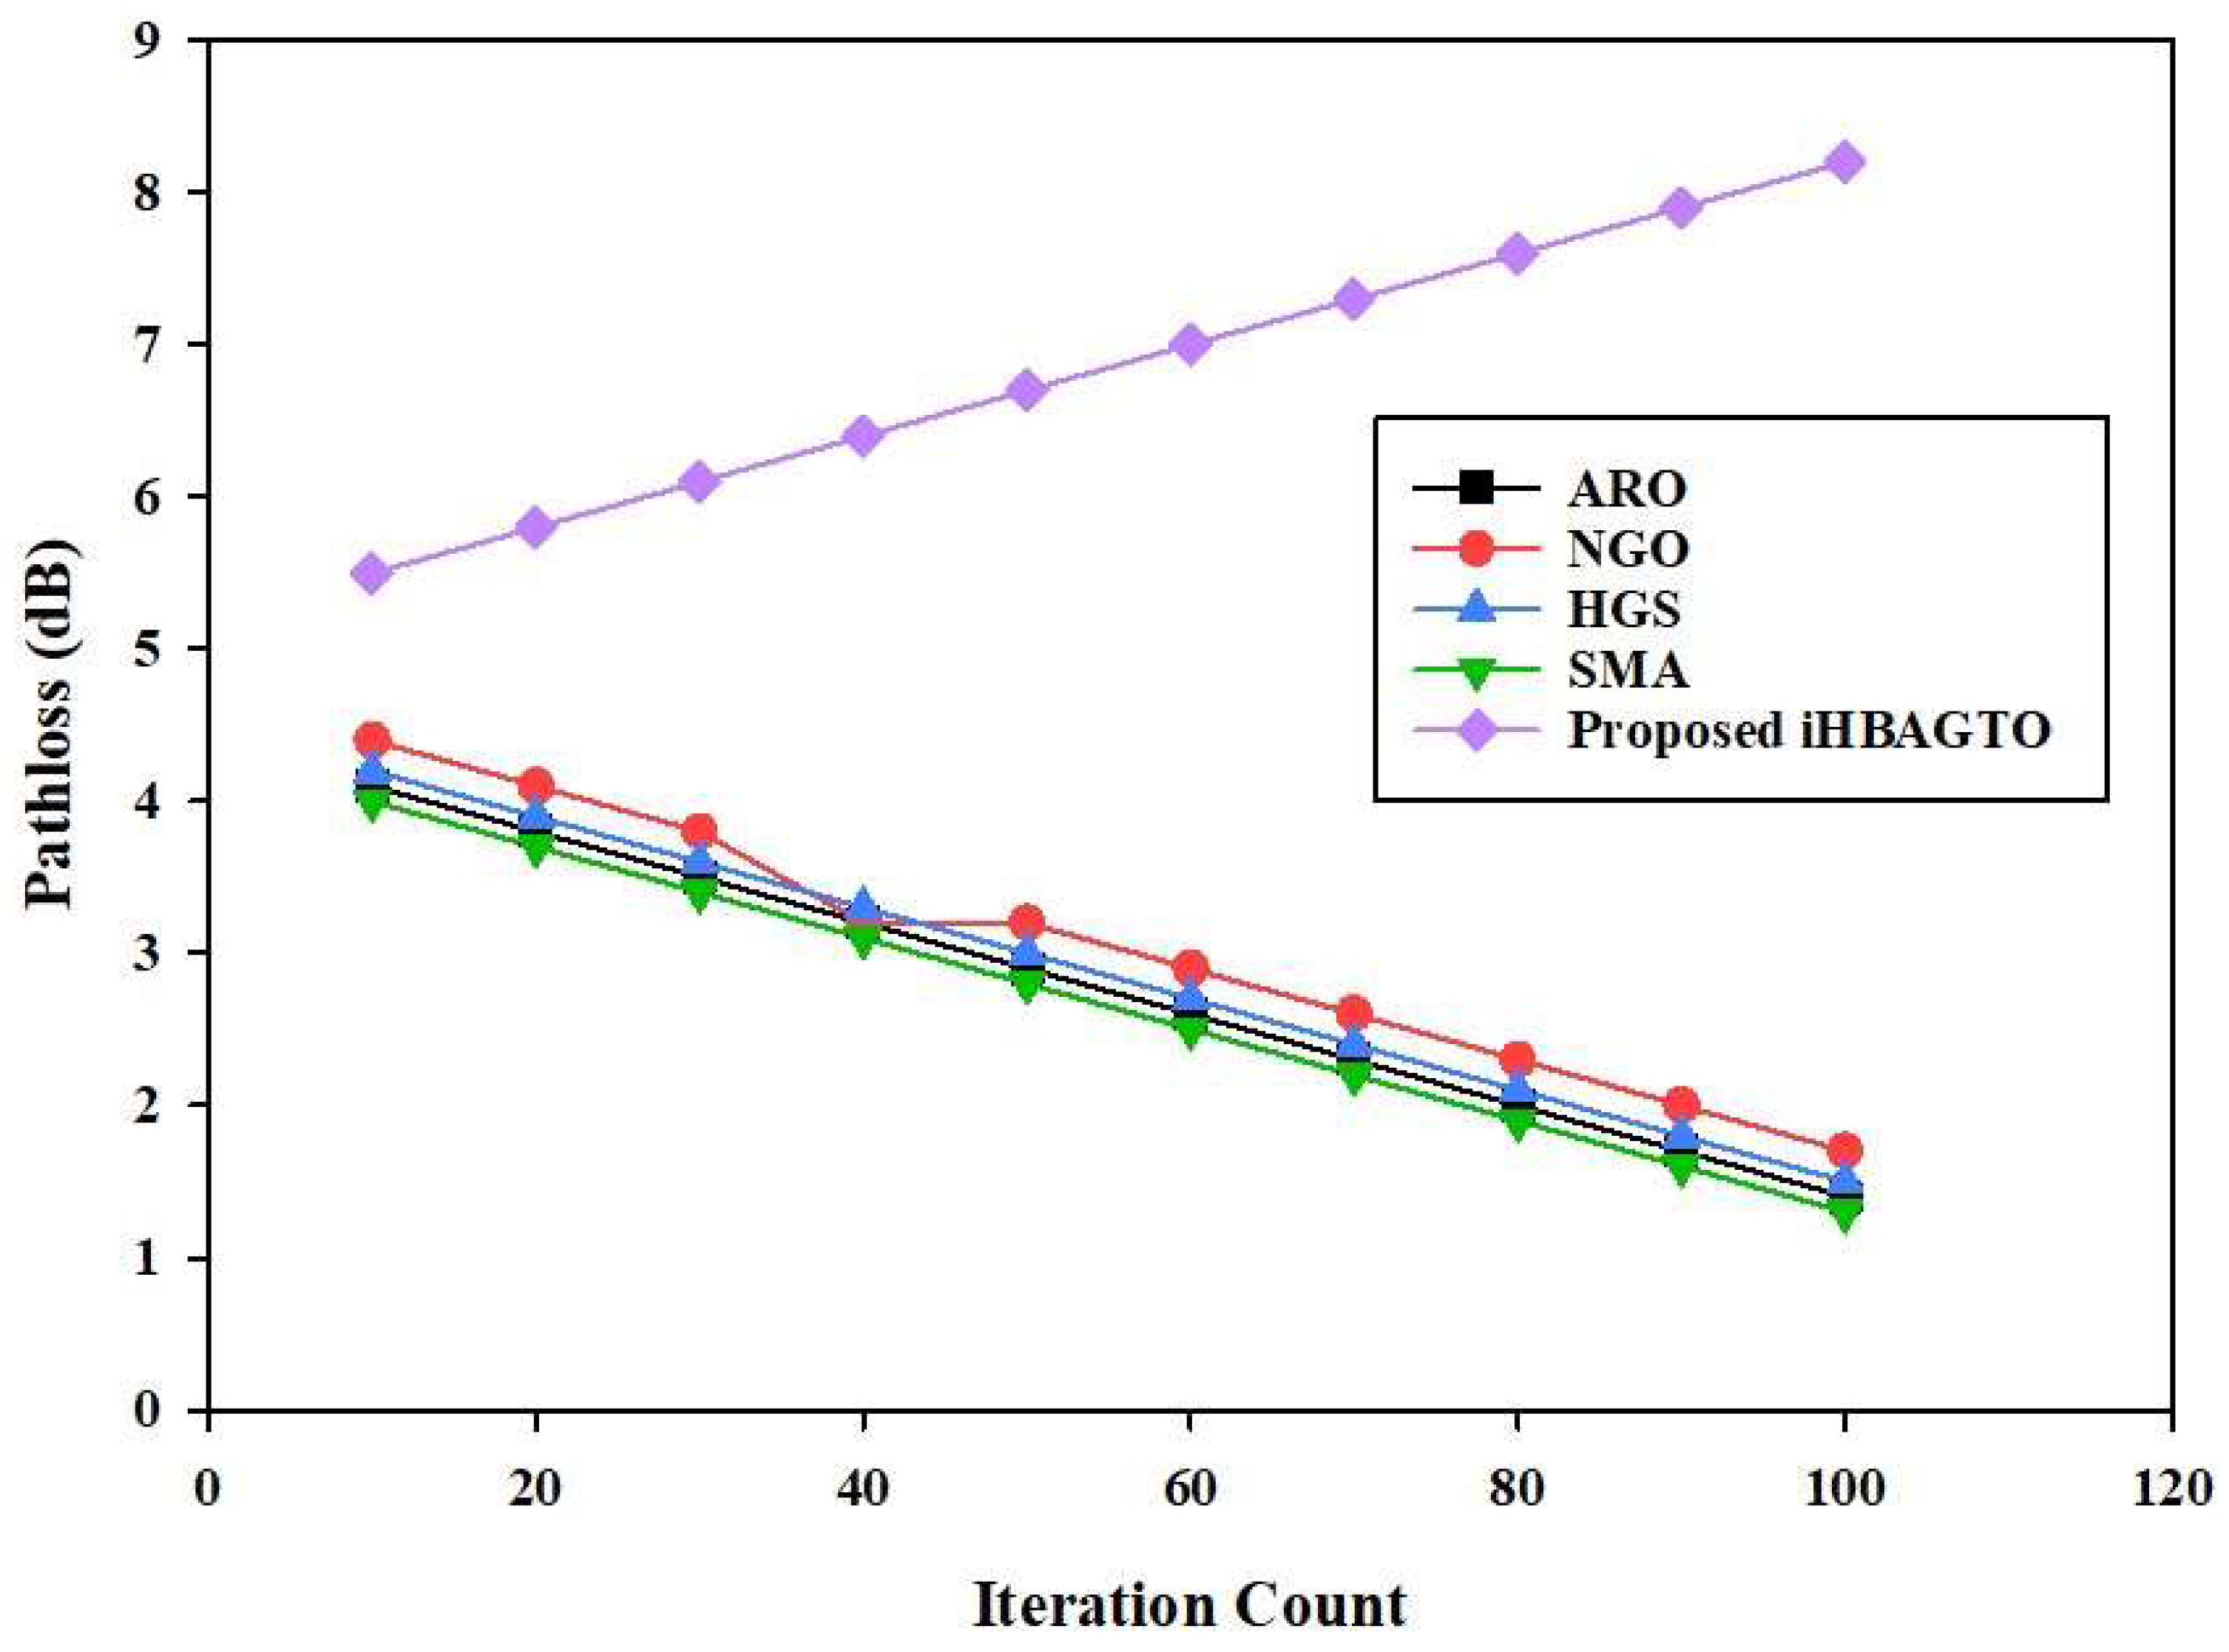
At each iteration count, the path loss values for each algorithm were observed and are shown in Table 5. It can be observed that for all algorithms, the path loss decreases as the iteration count increases, indicating improved performance.
Table 5.
Comparison of various methods based on path loss.
Figure 8 shows that the proposed iHBAGTO algorithm has the highest path loss values among all the algorithms for all iteration counts. At 10 iterations, the path loss for iHBAGTO is 5.5 dB, while the path loss values for ARO, NGO, HGS, and the SMA are 4.1 dB, 4.4 dB, 4.2 dB, and 4.0 dB, respectively. At iteration count 100, the iHBAGTO algorithm has the highest path loss value of 8.2 dB, while the other algorithms have path loss values ranging from 1.3 dB to 1.7 dB. However, as the iteration count increases, the iHBAGTO algorithm outperforms the other algorithms, achieving the lowest path loss value of 8.2 dB at iteration count 100. Overall, the proposed iHBAGTO algorithm performs better than the other algorithms in path loss reduction.

Figure 8.
Comparison of path losses of ARO, NGO, HGS, the SMA, and the proposed iHBAGTO algorithm over iterations.
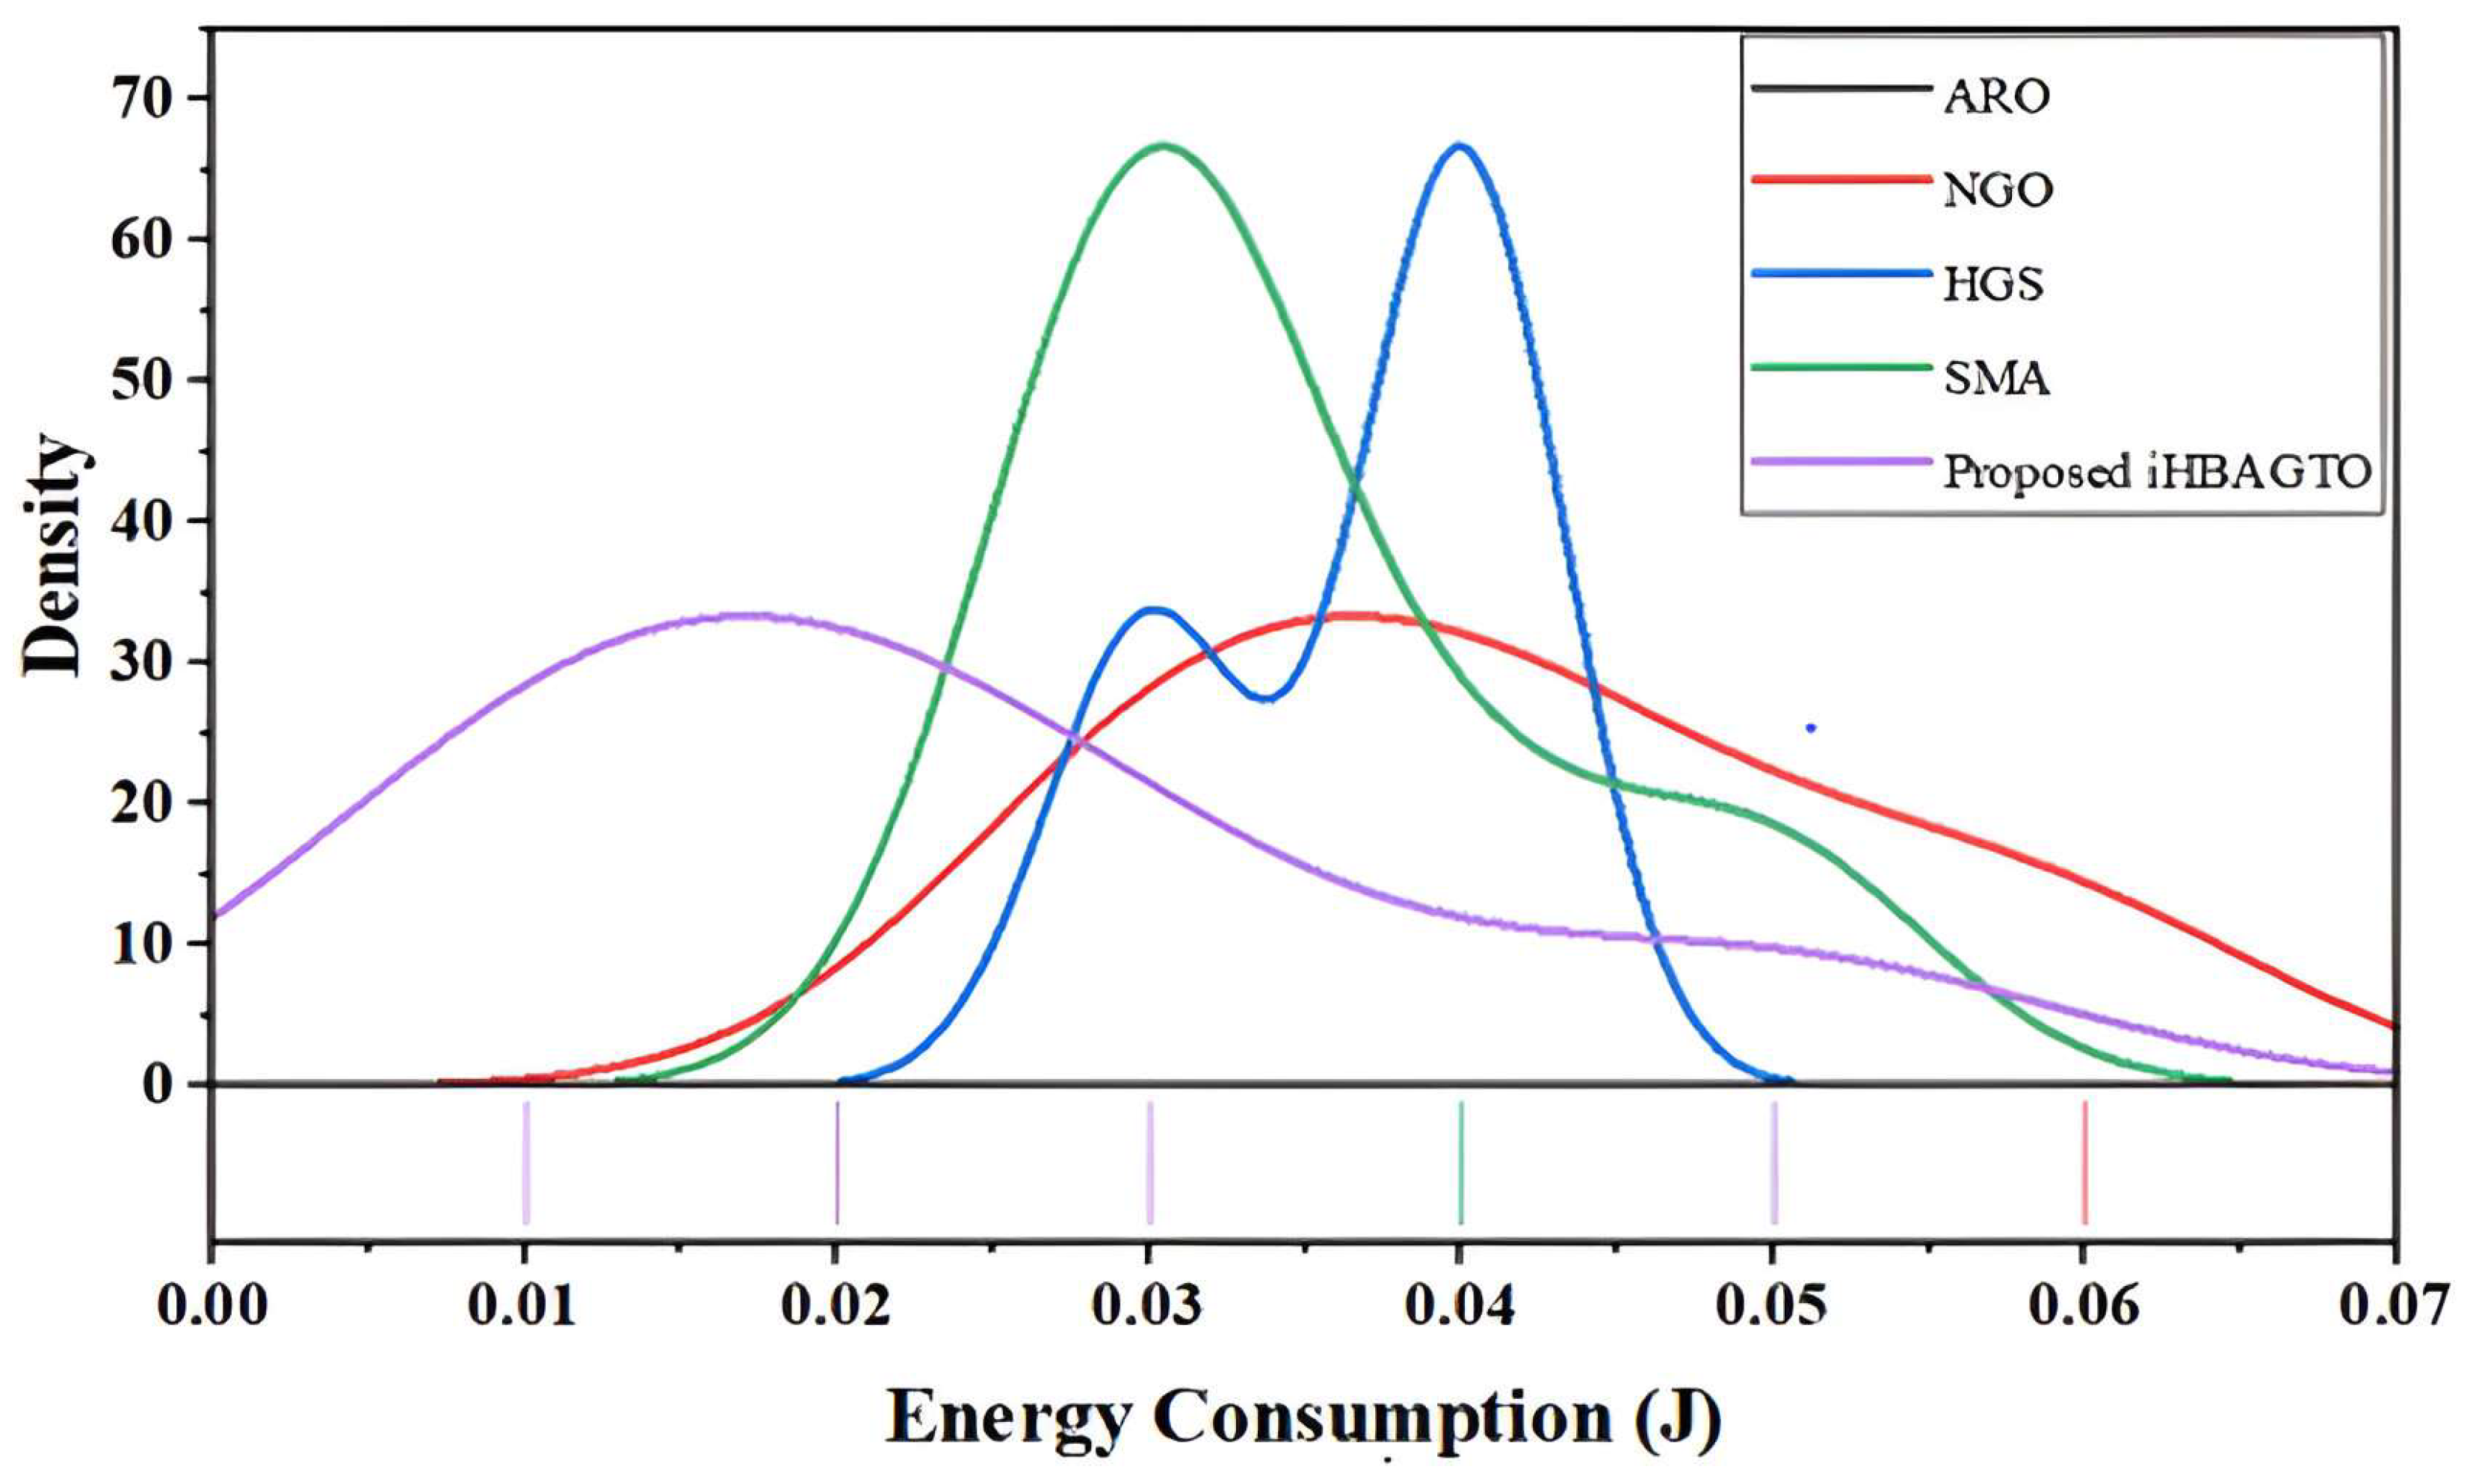
Table 6 presents a comparison of energy consumption among different optimization algorithms concerning the number of iterations. The table outlines the results for the Artificial Rabbit Optimization (ARO), Northern Goshawk Optimization (NGO), Hunger Games Search (HGS), the Slime Mould-inspired Algorithm (SMA), and the proposed improved Hybrid Bat Algorithm (iHBAGTO) algorithm. This comparison aims to evaluate the energy efficiency of these algorithms during optimization processes, providing insights into their resource utilization patterns over varying iteration counts.
Table 6.
Comparison of energy consumption for ARO, NGO, HGS, the SMA, and proposed iHBAGTO algorithm over iterations.
Figure 9 indicates the energy consumed by each algorithm at different iteration counts. As the iteration count increases, the energy consumption values for each algorithm may increase or decrease. For instance, at 10 iterations, the ARO algorithm and SMA have energy consumption values of 0.05 J, while the iHBAGTO algorithm has an energy consumption value of 0.05 J at the same iteration count. Overall, the iHBAGTO algorithm has the lowest energy consumption values across all iteration counts, while the HGS algorithm has the highest. This information is useful in evaluating the efficiency and effectiveness of each algorithm in terms of energy consumption, which can be an important factor in practical applications where energy resources are limited.
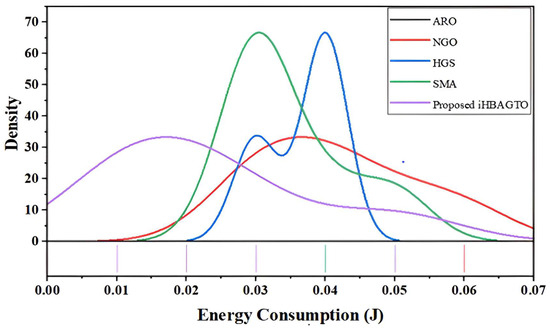
Figure 9.
Iteration counts versus energy consumption for various algorithms.
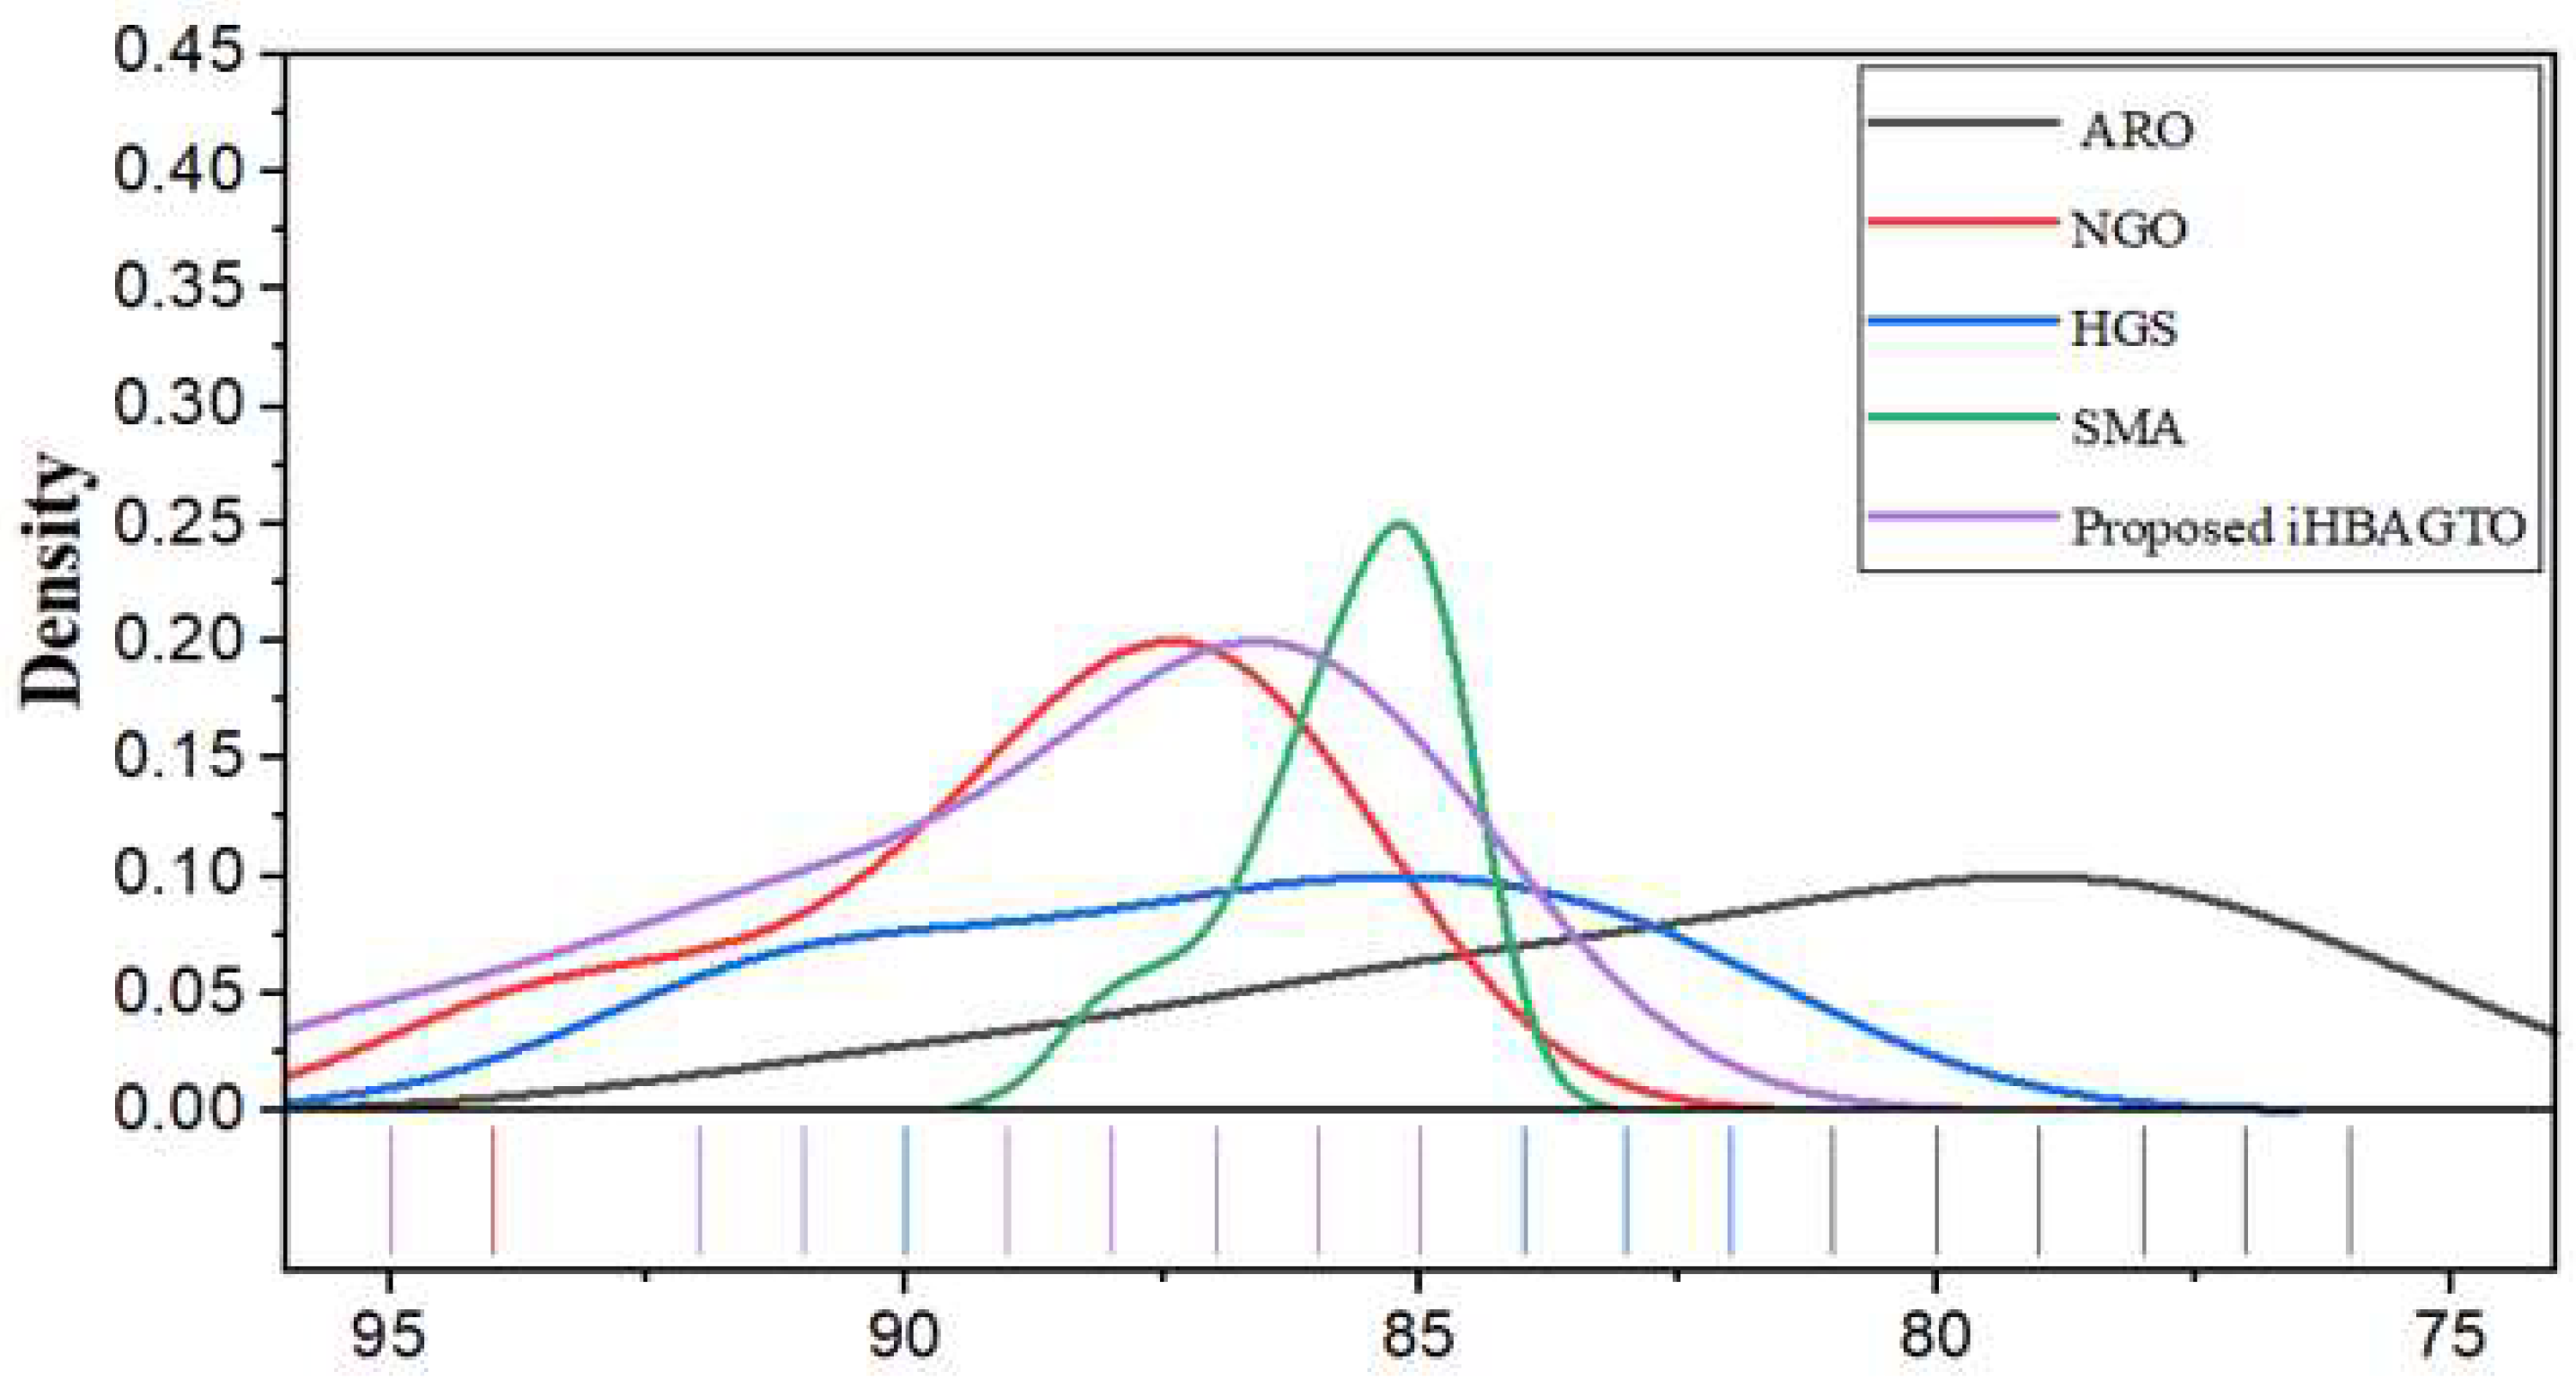
Table 7 shows the RSS values for the Artificial Rabbit Optimization (ARO), Northern Goshawk Optimization (NGO), Hunger Games Search (HGS), Slime Mould-inspired Algorithm (SMA), and proposed iHBAGTO algorithm at different iteration counts. The numerical measures indicate the signal strength in decibel-milliwatts (dBm), with higher values indicating stronger signal strength.
Table 7.
Increasing iteration counts versus RSS for ARO, NGO, HGS, SMA, and proposed iHBAGTO algorithm.
Figure 10 depicts the received signal strengths of various algorithms. At 10 iterations, the iHBAGTO algorithm has the highest RSS value (95 dBm), followed by the NGO algorithm (94 dBm), while the ARO and HGS algorithms have the lowest values (90 dBm and 92 dBm, respectively). As the iteration count increases, the iHBAGTO algorithm consistently shows the highest RSS values, reaching 86 dBm at 100 iterations. The NGO algorithm also has relatively strong RSS values, ranging from 94 dBm at 10 to 88 dBm at 100 iterations. In contrast, the ARO algorithm and SMA have lower RSS values, ranging from 90 to 83 dBm and 88 dBm to 85 dBm, respectively. The HGS algorithm has the lowest RSS values, ranging from 92 to 82 dBm. Overall, the proposed iHBAGTO algorithm outperforms the other algorithms in terms of RSS, achieving the highest signal strength values over all iterations.
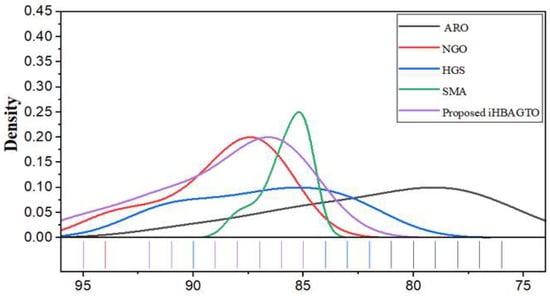
Figure 10.
Comparison of RSS for ARO, NGO, HGS, SMA, and proposed iHBAGTO algorithm over iterations.
5. Application in the Monitoring of Fractured and Karstic Aquifers
When monitoring contaminant plumes in fractured and karstic aquifers, the presence of heterogeneity and especially the anisotropy of a medium could invalidate the results of the monitoring if the positioning of the sensors results in the assumption of an equivalent porous medium (EPM) [31]. In aquifers characterized by a fractured matrix, prior to developing monitoring and remediation strategies, it is necessary to set up mathematical flow and solute transport models that are able to take into account the presence of discontinuities that act as preferential flow pathways [32]. The available commercial codes generally assume of a homogeneous and isotropic medium, which has proved to be oversimplified and unrealistic in such complex systems and can therefore make monitoring unreliable [33,34].
In this case, study [35] simulated plume by means of a rough walled parallel plate model coupled with a geostatistical analysis [36] that clearly exhibits (Figure 11) a locally anisotropic behavior in correspondence to the hotspot area, due to the anticline formation of the fractured rock limestone formation in the ENE–WSW direction. In this case, it appeared evident that the position of the monitoring points realized by the Water Agency under the EPM assumption partially failed to capture the contamination. Moreover, in the study, the wells showing the highest values of contamination, which were determined after the model construction, were the initial points available and were not representative enough.
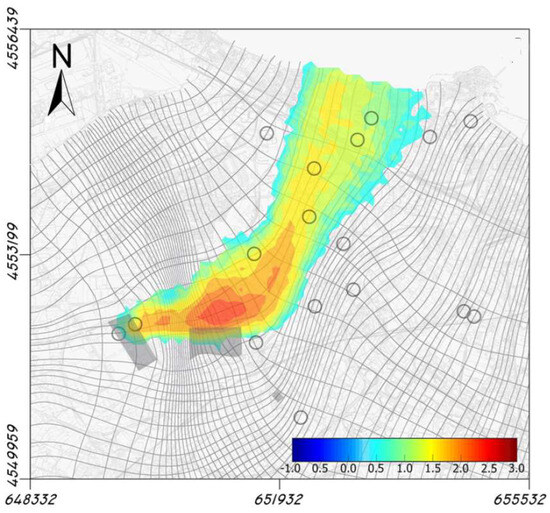
Figure 11.
Plume propagation and locations of monitoring points [34].
The proposed multi-objective improved hybrid butterfly artificial gorilla troop optimizer (iHBAGTO) could be successfully adopted for cost-effective groundwater monitoring network designs by combining it with a calibrated groundwater flow and transport numerical model and a deterministic interpolator method (Ordinary kriging), adopting a framework similar to the ones proposed by Reed et al. [37] and Wu et al. [38]. The contaminant plume at time tm (to represent future conditions to be monitored) will be simulated using the calibrated flow and transport model. An interpolated plume on the basis of known concentrations on selected well locations will be compared, in terms of both mass and first and second moments, with the simulated plume output from the transport model. The iHBAGTO will undergo several iterations until the difference between the simulated and interpolated plumes is minimal and convergence is achieved. The objective function for each potential monitoring network sampling scheme will be evaluated in terms of total monitoring costs while considering the accuracies of the estimated global mass and spatial plume moments based on the sampling data.
6. Conclusions
The long-term monitoring of large-scale contaminant plumes in groundwater requires a cost-effective monitoring network design based on simulation–optimization methodologies in order to achieve substantial cost savings by eliminating unnecessary samples. The planning and management of a monitoring system for soil and/or groundwater is a process that requires subsequent adjustments during project execution, by eliminating the useless or inefficient points or by eventually adding more points, i.e., optimizing the monitoring point locations.
When monitoring contaminant plumes in fractured and karstic aquifers, the presence of heterogeneity and especially the anisotropy of the medium could invalidate the results of the monitoring if the positioning of the sensors results in the assumption of an equivalent porous medium [39]. Therefore, the number of points to monitor and their positions cannot be excluded from optimization studies on reducing data redundancy with consequent reductions in costs, without significantly affecting the accuracy and adequacy of the sampled data [1].
This study developed a new node localization model for wireless sensor networks (WSNs) using a novel hybrid heuristic algorithm called the improved hybrid butterfly artificial gorilla troop optimizer (iHBAGTO), which was specifically designed to discover the locations of anchor nodes close to near-optimal target nodes to increase the convergence rate and maximize accuracy in localization while reducing localization errors. The existing Artificial Rabbit Optimization (ARO), Northern Goshawk Optimization (NGO), Hunger Games Search (HGS), and Slime Mould-inspired Algorithm (SMA) approaches were compared with the iHBAGTO algorithm. The results show that the latter algorithm improved the localization performance regarding convergence rate and average error and outperformed the other custom algorithms in metrics such as delay, path loss, energy, and RSS. Overall, this study showed that the proposed iHBAGTO-based localization strategy could significantly improve the localization performances of WSNs in dense networks [40].
Future research directions will be focused on coupling the proposed iHBAGTO with a calibrated groundwater flow and transport model and a deterministic interpolator method to provide an optimization approach for the realization of a cost-effective groundwater monitoring network design.
The proposed approach can be useful for water service companies, water managers, policymakers, and other stakeholders involved in groundwater monitoring and cleanup for more sustainable groundwater management.
Author Contributions
Conceptualization, M.B. and C.C.; methodology, M.B. and C.C; software, M.B.; validation, M.B.; formal analysis, M.B.; investigation, M.B.; resources, M.B. and C.C; data curation, M.B. and C.C; writing—original draft preparation, M.B. and C.C.; writing—review and editing, C.C.; visualization, M.B. and C.C.; supervision, C.C.; project administration, M.B. and C.C. All authors have read and agreed to the published version of the manuscript.
Funding
This research received no external funding.
Data Availability Statement
No new data were created or analyzed in this study.
Conflicts of Interest
The authors declare no conflict of interest.
References
- Cherubini, C.; Giasi, C.I.; Pastore, N. Application of modeling for optimal localization of environmental monitoring sensors. In Proceedings of the 2009 3rd International Workshop on Advances in Sensors and Interfaces, Trani, Italy, 25–26 June 2009; pp. 222–227. [Google Scholar] [CrossRef]
- Lauinger, V.; Buchali, F.; Schmalen, L. Blind Equalization and Channel Estimation in Coherent Optical Communications Using Variational Autoencoders. IEEE J. Sel. Areas Commun. 2022, 40, 2529–2539. [Google Scholar] [CrossRef]
- El-Dabah, M.A.; Hassan, M.H.; Kamel, S.; Abido, M.A.; Zawbaa, H.M. Optimal Tuning of Power System Stabilizers for a Multi-Machine Power Systems Using Hybrid Gorilla Troops and Gradient-Based Optimizers. IEEE Access 2023, 11, 27168–27188. [Google Scholar] [CrossRef]
- El Zini, J.; Rizk, Y.; Awad, M. A Deep Transfer Learning Framework for Seismic Data Analysis: A Case Study on Bright Spot Detection. IEEE Trans. Geosci. Remote Sens. 2020, 58, 3202–3212. [Google Scholar] [CrossRef]
- Guo, Y.; Pan, B.; Fu, Y.; Meng, M.Q.-H. CAM-FoC: A High Accuracy Lightweight Deep Neural Network for Grip Force Measurement of Elongated Surgical Instrument. IEEE Trans. Instrum. Meas. 2021, 70, 1–12. [Google Scholar] [CrossRef]
- Sihwail, R.; Omar, K.; Ariffin, K.A.Z.; Tubishat, M. Improved Harris Hawks Optimization Using Elite Opposition-Based Learning and Novel Search Mechanism for Feature Selection. IEEE Access 2020, 8, 121127–121145. [Google Scholar] [CrossRef]
- Singh, N.K.; Gope, S.; Koley, C.; Dawn, S.; Alhelou, H.H. Optimal Bidding Strategy for Social Welfare Maximization in Wind Farm Integrated Deregulated Power System Using Artificial Gorilla Troops Optimizer Algorithm. IEEE Access 2022, 10, 71450–71461. [Google Scholar] [CrossRef]
- El-Dabah, M.A.; Hassan, M.H.; Kamel, S.; Zawbaa, H.M. Robust Parameters Tuning of Different Power System Stabilizers Using a Quantum Artificial Gorilla Troops Optimizer. IEEE Access 2022, 10, 82560–82579. [Google Scholar] [CrossRef]
- Wang, L.; Cao, Q.; Zhang, Z.; Mirjalili, S.; Zhao, W. Artificial rabbits optimization: A new bio-inspired meta-heuristic algorithm for solving engineering optimization problems. Eng. Appl. Artif. Intell. 2022, 114, 105082. [Google Scholar] [CrossRef]
- Dehghani, M.; Hubálovský, Š.; Trojovský, P. Northern goshawk optimization: A new swarm-based algorithm for solving optimization problems. IEEE Access 2021, 9, 162059–162080. [Google Scholar] [CrossRef]
- Kutlu Onay, F.; Aydemír, S.B. Chaotic hunger games search optimization algorithm for global optimization and engineering problems. Math. Comput. Simul. 2022, 192, 514–536. [Google Scholar] [CrossRef]
- Tang, A.D.; Tang, S.Q.; Han, T.; Zhou, H.; Xie, L. A modified slime mould algorithm for global optimization. Comput. Intell. Neurosci. 2021, 2021, 2298215. [Google Scholar] [CrossRef] [PubMed]
- Said, M.; Houssein, E.H.; Deb, S.; Ghoniem, R.M.; Elsayed, A.G. Economic Load Dispatch Problem Based on Search and Rescue Optimization Algorithm. IEEE Access 2022, 10, 47109–47123. [Google Scholar] [CrossRef]
- Dehkordi, A.A.; Etaati, B.; Neshat, M.; Mirjalili, S. Adaptive Chaotic Marine Predators Hill Climbing Algorithm for Large-scale Design Optimisations. IEEE Access 2023, 11, 39269–39294. [Google Scholar] [CrossRef]
- López-Antequera, M.; Vallina, M.L.; Strisciuglio, N.; Petkov, N. Place and Object Recognition by CNN-Based COSFIRE Filters. IEEE Access 2019, 7, 66157–66166. [Google Scholar] [CrossRef]
- Mouassa, S.; Althobaiti, A.; Jurado, F.; Ghoneim, S.S.M. Novel Design of Slim Mould Optimizer for the Solution of Optimal Power Flow Problems Incorporating Intermittent Sources: A Case Study of Algerian Electricity Grid. IEEE Access 2022, 10, 22646–22661. [Google Scholar] [CrossRef]
- Tan, A.; Zhou, G.; He, M. Rapid Fine-Grained Classification of Butterflies Based on FCM-KM and Mask R-CNN Fusion. IEEE Access 2020, 8, 124722–124733. [Google Scholar] [CrossRef]
- Guo, G.-Q.; Chai, B.; Cheng, R.-C.; Wang, Y.-S. Real-Time Temperature Drift Compensation Method of a MEMS Accelerometer Based on Deep GRU and Optimized Monarch Butterfly Algorithm. IEEE Access 2023, 11, 10355–10365. [Google Scholar] [CrossRef]
- Pliatsios, D.; Goudos, S.K.; Lagkas, T.; Argyriou, V.; Boulogeorgos, A.-A.A.; Sarigiannidis, P. Drone-Base-Station for Next-Generation Internet-of-Things: A Comparison of Swarm Intelligence Approaches. IEEE Open J. Antennas Propag. 2022, 3, 32–47. [Google Scholar] [CrossRef]
- Salih, J.F.; Mohammed, H.M.; Abdul, Z.K. Modified Fitness Dependent Optimizer for Solving Numerical Optimization Functions. IEEE Access 2022, 10, 83916–83930. [Google Scholar] [CrossRef]
- Aldasoro, C.C.R.; Bhalerao, A. Volumetric Texture Segmentation by Discriminant Feature Selection and Multiresolution Classification. IEEE Trans. Med. Imaging 2007, 26, 1–14. [Google Scholar] [CrossRef]
- Elminaam, D.S.A.; Nabil, A.; Ibraheem, S.A.; Houssein, E.H. An Efficient Marine Predators Algorithm for Feature Selection. IEEE Access 2021, 9, 60136–60153. [Google Scholar] [CrossRef]
- Lin, Z.; Jia, J.; Gao, W.; Huang, F. Increasingly Specialized Perception Network for Fine-Grained Visual Categorization of Butterfly Specimens. IEEE Access 2019, 7, 123367–123392. [Google Scholar] [CrossRef]
- Prasanthi; Shareef, H.; Errouissi, R.; Asna, M.; Wahyudie, A. Quantum Chaotic Butterfly Optimization Algorithm with Ranking Strategy for Constrained Optimization Problems. IEEE Access 2021, 9, 114587–114608. [Google Scholar] [CrossRef]
- Zhang, B.; Yang, X.; Hu, B.; Liu, Z.; Li, Z. OEbBOA: A Novel Improved Binary Butterfly Optimization Approaches with Various Strategies for Feature Selection. IEEE Access 2020, 8, 67799–67812. [Google Scholar] [CrossRef]
- Yu, Y.; Lei, Z.; Wang, Y.; Zhang, T.; Peng, C.; Gao, S. Improving Dendritic Neuron Model with Dynamic Scale-Free Network-Based Differential Evolution. IEEE/CAA J. Autom. Sin. 2022, 9, 99–110. [Google Scholar] [CrossRef]
- Liu, G.; Jia, W.; Luo, Y.; Wang, M.; Heidari, A.A.; Ouyang, J.; Chen, H.; Chen, M. Prediction Optimization of Cervical Hyperextension Injury: Kernel Extreme Learning Machines with Orthogonal Learning Butterfly Optimizer and Broyden-Fletcher-Goldfarb-Shanno Algorithms. IEEE Access 2020, 8, 119911–119930. [Google Scholar] [CrossRef]
- Hashemi, M.H.; Kiliç, U.; Dikmen, S. Applications of Novel Heuristic Algorithms in Design Optimization of Energy-Efficient Distribution Transformer. IEEE Access 2023, 11, 15968–15980. [Google Scholar] [CrossRef]
- de Sousa, T.F.B.; Fernandes, M.A.C. Butterfly Neural Filter Applied to Beamforming. IEEE Access 2019, 7, 96455–96469. [Google Scholar] [CrossRef]
- Gharehchopogh, F.S.; Ucan, A.; Ibrikci, T.; Arasteh, B.; Isik, G. Slime mould algorithm: A comprehensive survey of its variants and applications. Arch. Comput. Methods Eng. 2023, 30, 2683–2723. [Google Scholar] [CrossRef]
- Cherubini, C. A Modeling Approach for the Study of Contamination in a Fractured Aquifer. Geotech. Geol. Eng. 2008, 26, 519–533. [Google Scholar] [CrossRef]
- Masciopinto, C.; Volpe, A.; Palmiotta, D.; Cherubini, C. 2010 A combined PHREEQC-2/parallel fracture model for the simulation of laminar/non-laminar flow and contaminant transport with reactions. J. Contam. Hydrol. 2010, 117, 94–108. [Google Scholar] [CrossRef]
- Cherubini, C.; Pastore, N. Modeling contaminant propagation in a fractured and karstic aquifer. Fresen. Environ. Bull. 2010, 19, 1788–1794. [Google Scholar]
- Cherubini, C.; Giasi, C.; Pastore, N. Fluid flow modeling of a coastal fractured karstic aquifer by means of a lumped parameter approach. Environ. Earth Sci. 2013, 70, 2055–2060. [Google Scholar] [CrossRef]
- Pastore, N.; Cherubini, C.; Giasi, C.I.; Dimitra, R. Numerical model of the behavior of chlorinated ethenes in a fractured, karstic limestone aquifer. Hydrogeol. J. 2021, 29, 667–686. [Google Scholar] [CrossRef]
- Cherubini, C.; Pastore, N.; Rapti, D.; Giasi, C.I. Numerical modeling of flow and transport in the Bari industrial area by means of rough walled parallel plate and random walk models. Hydrol. Earth Syst. Sci. 2018, 22, 5211–5225. [Google Scholar] [CrossRef]
- Reed, P.; Minsker, B.; Valocchi, A.J. Cost-effective long-term groundwater monitoring design using a genetic algorithm and global mass interpolation. Water Resour. Res. 2000, 36, 3731–3741. [Google Scholar] [CrossRef]
- Wu, J.; Zheng, C.; Chien, C.C. Cost-effective sampling network design for contaminant plume monitoring under general hydrogeological conditions. J. Contam. Hydrol. 2005, 77, 41–65. [Google Scholar] [CrossRef] [PubMed]
- Cherubini, C.; Pastore, N.; Francani, V. Different approaches for the characterization of a 707 fractured karst aquifer. WSEAS Trans. Fluid Mech. 2008, 1, 29–35. [Google Scholar]
- Tubishat; Alswaitti, M.; Mirjalili, S.; Al-Garadi, M.A.; Alrashdan, M.T.; Rana, T.A. Dynamic Butterfly Optimization Algorithm for Feature Selection. IEEE Access 2020, 8, 194303–194314. [Google Scholar] [CrossRef]


Disclaimer/Publisher’s Note: The statements, opinions and data contained in all publications are solely those of the individual author(s) and contributor(s) and not of MDPI and/or the editor(s). MDPI and/or the editor(s) disclaim responsibility for any injury to people or property resulting from any ideas, methods, instructions or products referred to in the content. |
© 2024 by the authors. Licensee MDPI, Basel, Switzerland. This article is an open access article distributed under the terms and conditions of the Creative Commons Attribution (CC BY) license (https://creativecommons.org/licenses/by/4.0/).