Article

Modeling the Impact of Climate Change on Streamflow in the Meghna River Basin: An Analysis Using SWAT and CMIP6 Scenarios

1
Department of Water Resources Engineering, Bangladesh University of Engineering and Technology, Dhaka 1000, Bangladesh
2
School of Engineering, Design and Built Environment, Western Sydney University, Penrith, NSW 2751, Australia
*
Author to whom correspondence should be addressed.
Water 2024, 16(8), 1117; https://doi.org/10.3390/w16081117
Submission received: 14 March 2024 / Revised: 11 April 2024 / Accepted: 12 April 2024 / Published: 14 April 2024

Abstract

:
This study assesses future climate change impacts on the hydrologic response of the Upper Meghna River Basin (UMRB), a major river system in Bangladesh. Separate SWAT (Soil and Water Assessment Tool) hydrologic models were developed for the three major sub-basins of the UMRB, i.e., Barak, Meghalaya, and Tripura, considering their unique geographical, hydrological, and land-use characteristics. To evaluate the efficiency of multi-site modeling in providing better model performance, the SWAT models were calibrated at both single and multiple locations. Those models were then simulated to estimate future flows using climate projection data from thirteen CMIP6 General Circulation Models (GCMs) under moderate and extreme emission scenarios, SSP2-4.5, and SSP5-8.5. The results revealed that the annual maximum flow will keep increasing gradually with time. The outlets of the Meghalaya sub-basin will experience a more significant rise in future flow in the upcoming decades compared to the Barak and Tripura sub-basins. Results showed that dry season flows with increases of up to 31–50% would be less affected compared to the wet periods, which could experience increases of up to 47–66%) across the sub-basins by the end of the 21st century under extreme emission projections. Besides an increasing trend in the mean flow, future flows at several outlets also exhibited an escalation in the intensity and frequency of extreme flood events.

1. Introduction

The increase in greenhouse gases, primarily caused by human activities, is the main driver of global climate change [1]. Multiple distinct changes are occurring in various regions because of climate change; these alterations will possibly accelerate as the earth continues to warm. The water cycle is being accelerated by climate change and causing shifts in rainfall patterns. Consequently, many areas will experience more severe drought while many will contend with heavier rainfall and subsequent flooding in the future [2]. Bangladesh, situated at the convergence of the Ganges, Brahmaputra, and Meghna River systems, is extremely susceptible to climate change [3,4]. A significant portion of the greater Ganges–Brahmaputra–Meghna (GBM) basin is taken up by the Meghna River basin, with 43% of its total area situated in Bangladesh [5]. Encompassing an 82,000 km2 region, the Meghna basin stands as one of the wettest regions globally, boasting an average yearly precipitation reaching up to 5800 mm [3]. Abundant precipitation, a complex river network, surrounding mountainous topography, and numerous large, deep depressions (locally known as ‘Haor’) are the major reasons that the flooding is frequent and lasts for an unusually long time in the Meghna basin. Anticipated changes in climate will lead to more frequent extreme rainfall events affecting the overall hydrology of the Meghna basin, which could be more severe than those affecting the two large adjacent basins [3,6]. A climate change-induced increase in the regional mean temperature of the Meghna basin is likely to alter its hydrological cycle [7,8] and affect the quantity of mean flow as well as extreme flow [9]. Predicting future extreme discharges is more critical than mean discharges, as changes in future hydrological extremes are anticipated to be higher than future hydrological mean discharges [10,11].
Previously, several studies have investigated how the flow at the basin outlets of the GBM basins would be affected due to climate change utilizing a variety of modeling approaches, like empirical/regression-based models [4,12,13,14] or hydrological models [15,16,17,18,19,20,21,22]. Nevertheless, very few research works have been carried out in the UMRB solely using hydrological models, i.e., SWAT, HEC-HMS, GBHM, H08, etc. [18,20,21,23,24,25,26,27]. In almost all of these studies [18,20,21,23,24,25,26,27], they considered the climate, geography, and hydrology of the entire basin as being uniform. The Meghna basin consists of three major sub-basins—Meghalaya, Barak, and Tripura, each with unique characteristics. Hence, assuming the whole Meghna basin as a homogeneous region may not be appropriate to assess how hydrology will be affected due to climate change. It is unlikely to attain good performance at all locations within a large basin using a global or regional-scale model [28] as the spatially distributed approach would increase the capability for dealing with internal hydrologic dynamics [29]. Eventually, global-scale or regional-scale hydrological models may provide similar results but with higher uncertainties compared to catchment-scale models [30,31]. Moreover, almost all the past studies [18,20,21,23,24,25,26] calibrated hydrological models at a single location (outlet) within a watershed. However, results from recent studies [27,32] suggested calibrating the complex hydrological models at multiple sites for better model performance as it better captures the spatial variability within the river basins. Based on these findings, the current study considered developing sub-basin scale hydrologic models (instead of a basin-scale model) for the major three sub-basins and evaluated the efficiency of the multi-site calibration approach for the UMRB. However, the major focus of this study was to investigate the climate change impacts on hydrological processes within the Meghna basin. In this study, the future flow projections were simulated under the latest Coupled Model Intercomparison Project Phase 6 (CMIP6)-based climate scenarios, known as Shared Socioeconomic Pathways (SSPs), whereas previous studies [18,20,21,23,24,25,26,27,33,34,35] evaluated climate change impacts on the streamflow using General Circulation Models (GCMs) and Regional Climate Models (RCMs) from CMIP3 and CMIP5.
In summary, this study first assessed the potential of sub-basin-scale hydrologic models developed for the major three sub-basins in the UMRB. Secondly, we compared the performance of two calibration strategies: calibrating at a single site versus calibrating at multiple sites. Finally, changes in future extreme flows were estimated using the best-suited models under SSP2-4.5 and SSP5-8.5 scenarios to assess the impacts of climate change. The findings will enhance the knowledge base of climate change impacts on Bangladesh, which is one of the countries most affected by climate change.

2. Materials and Methods
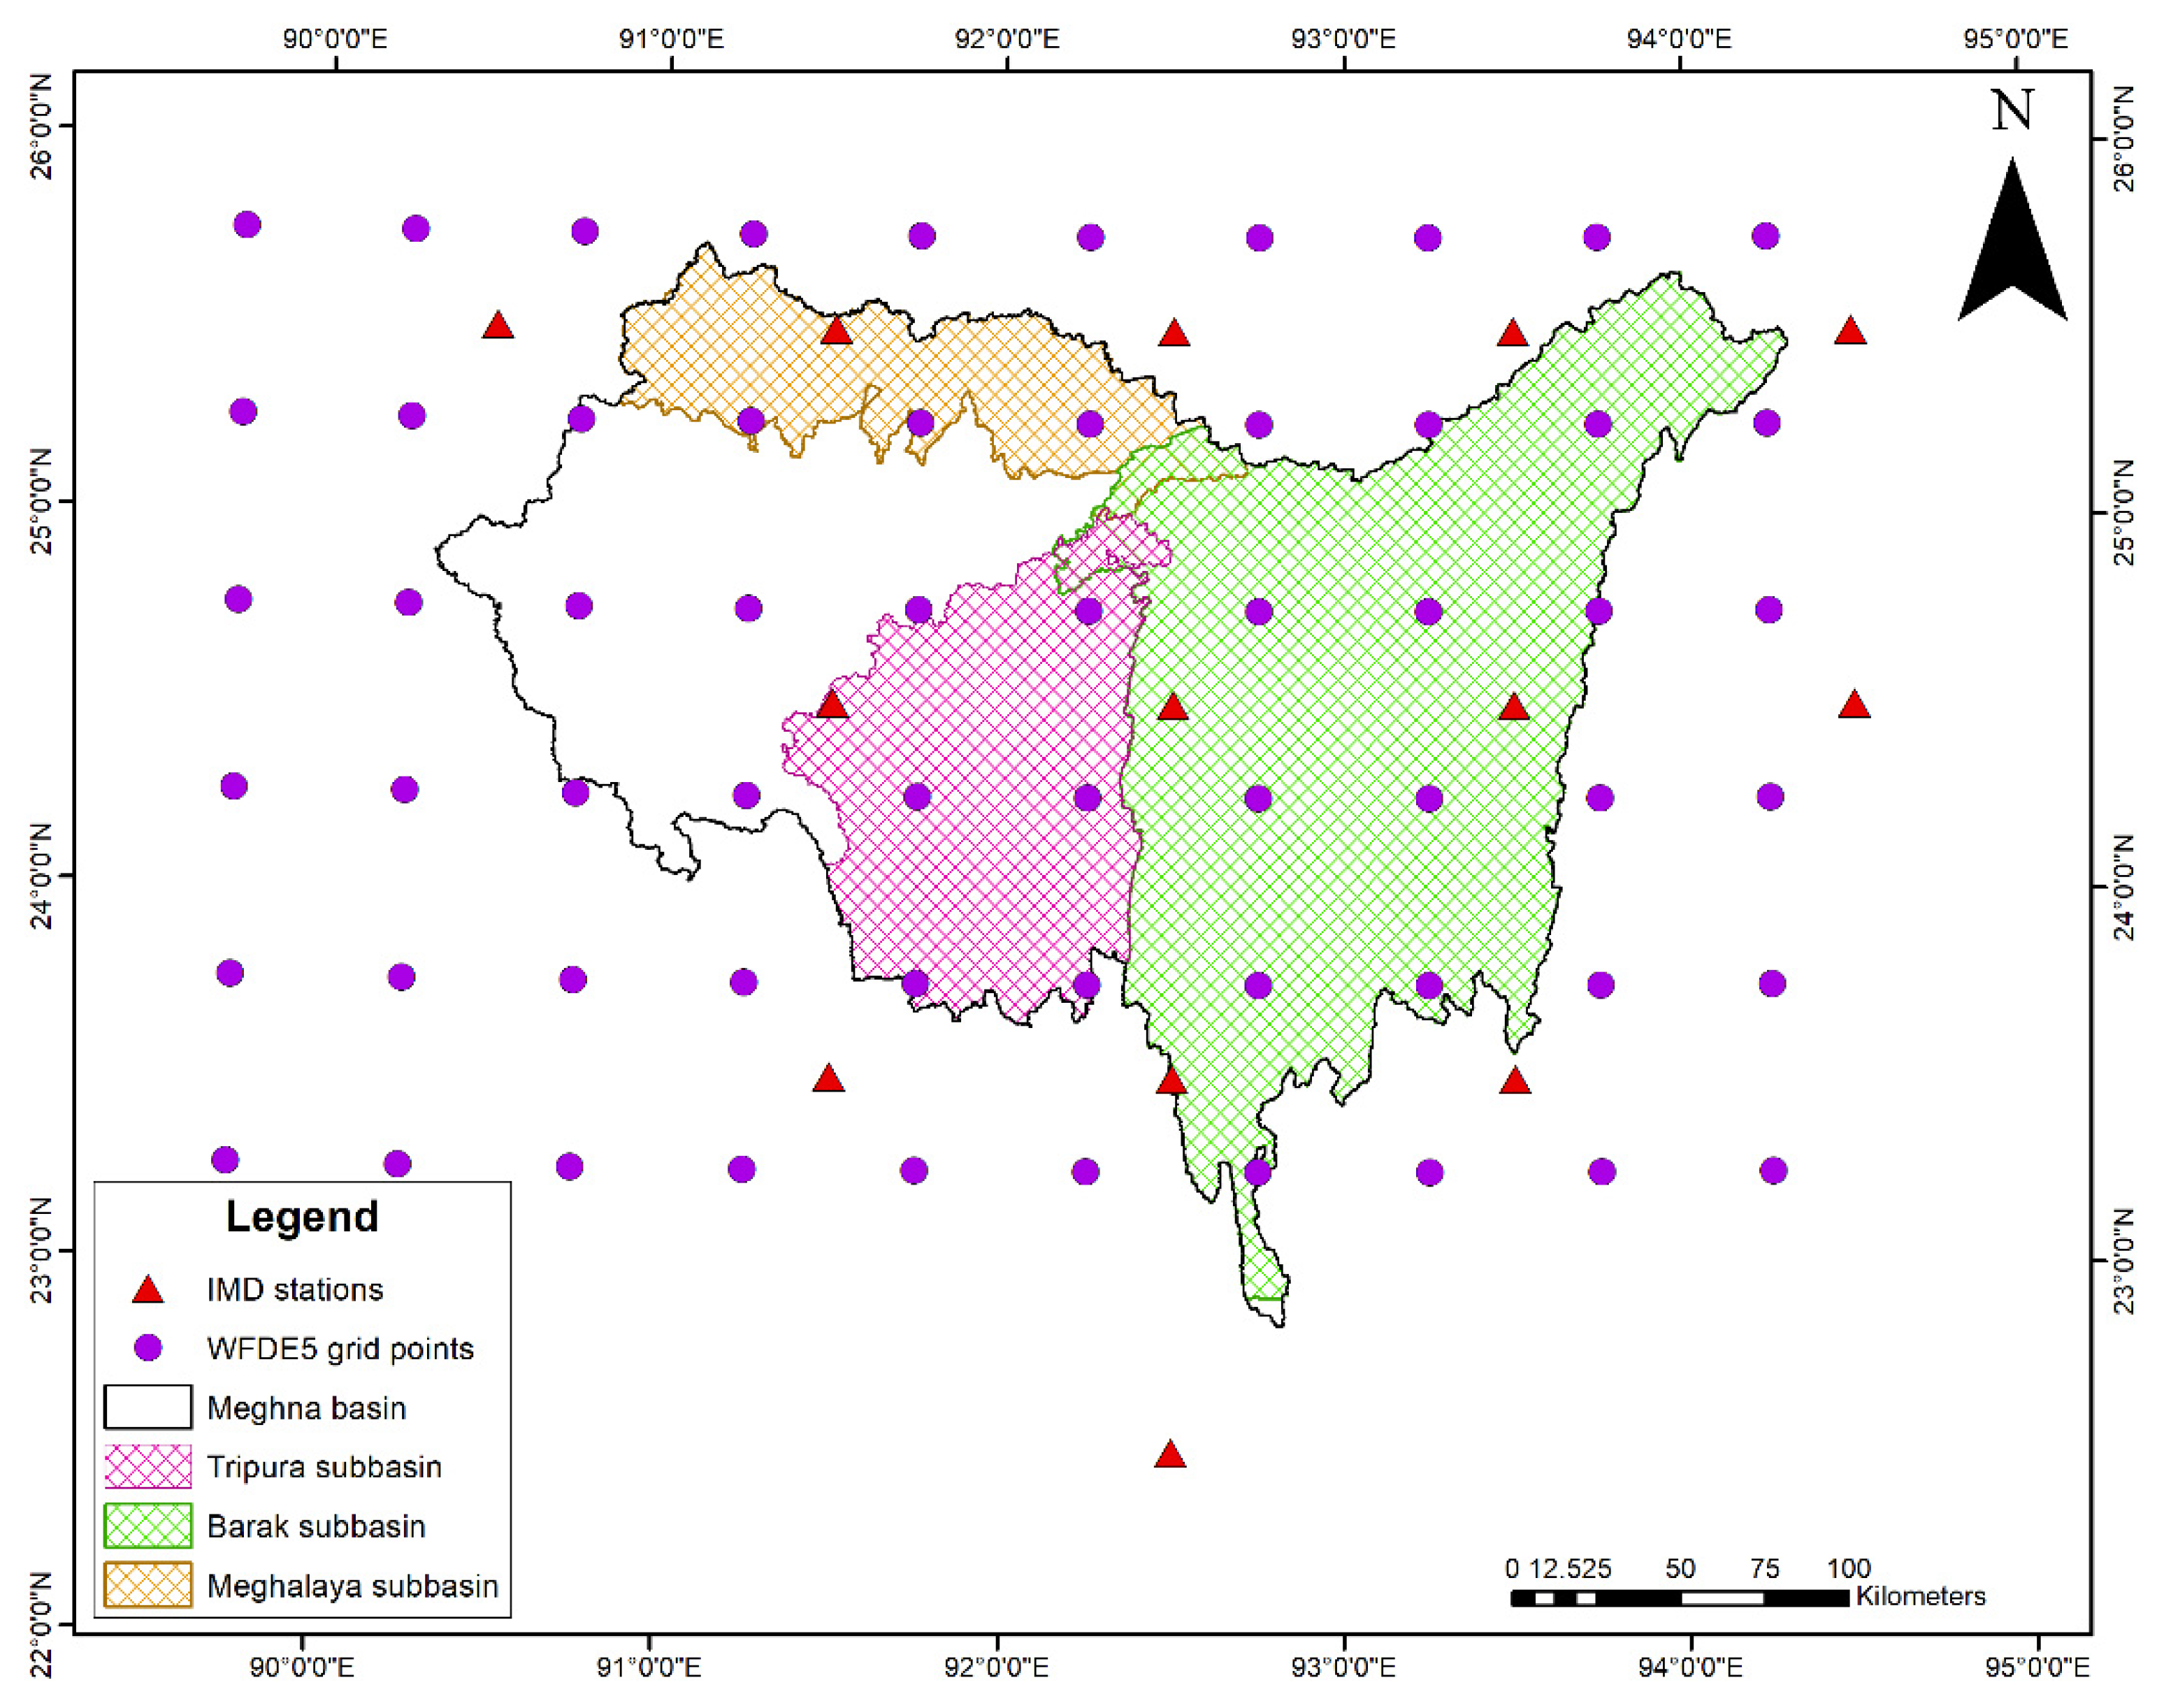
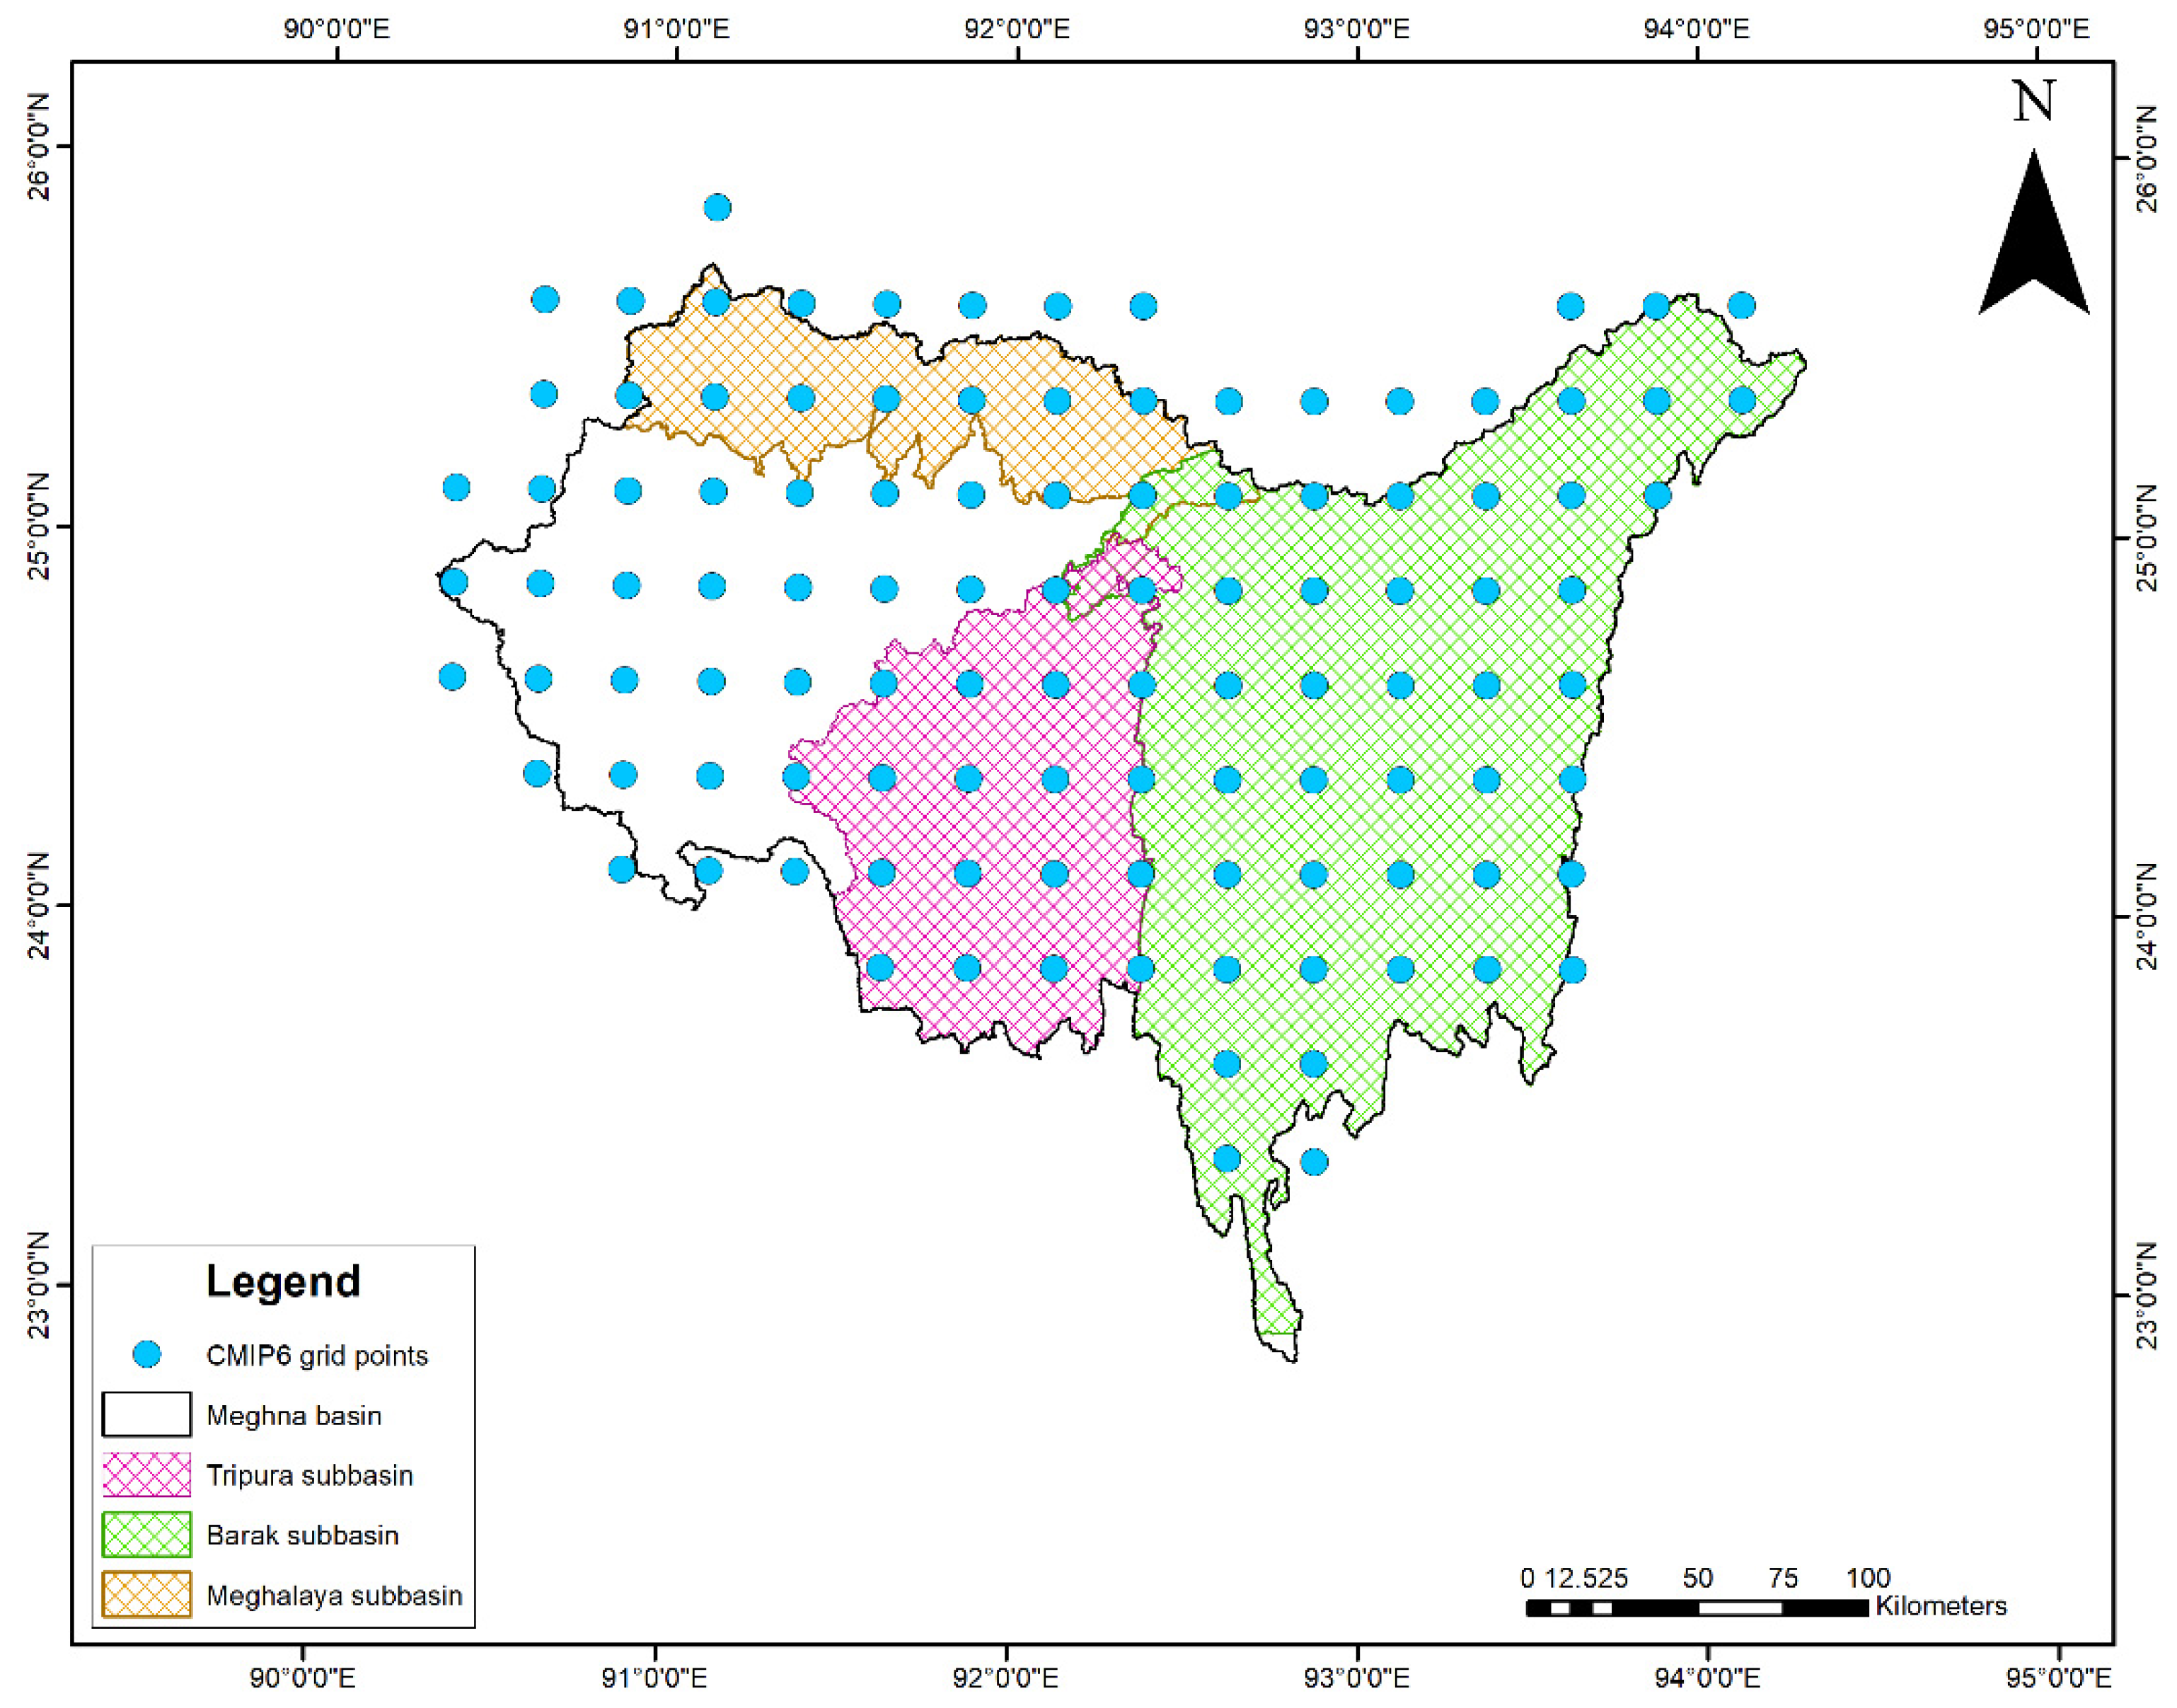
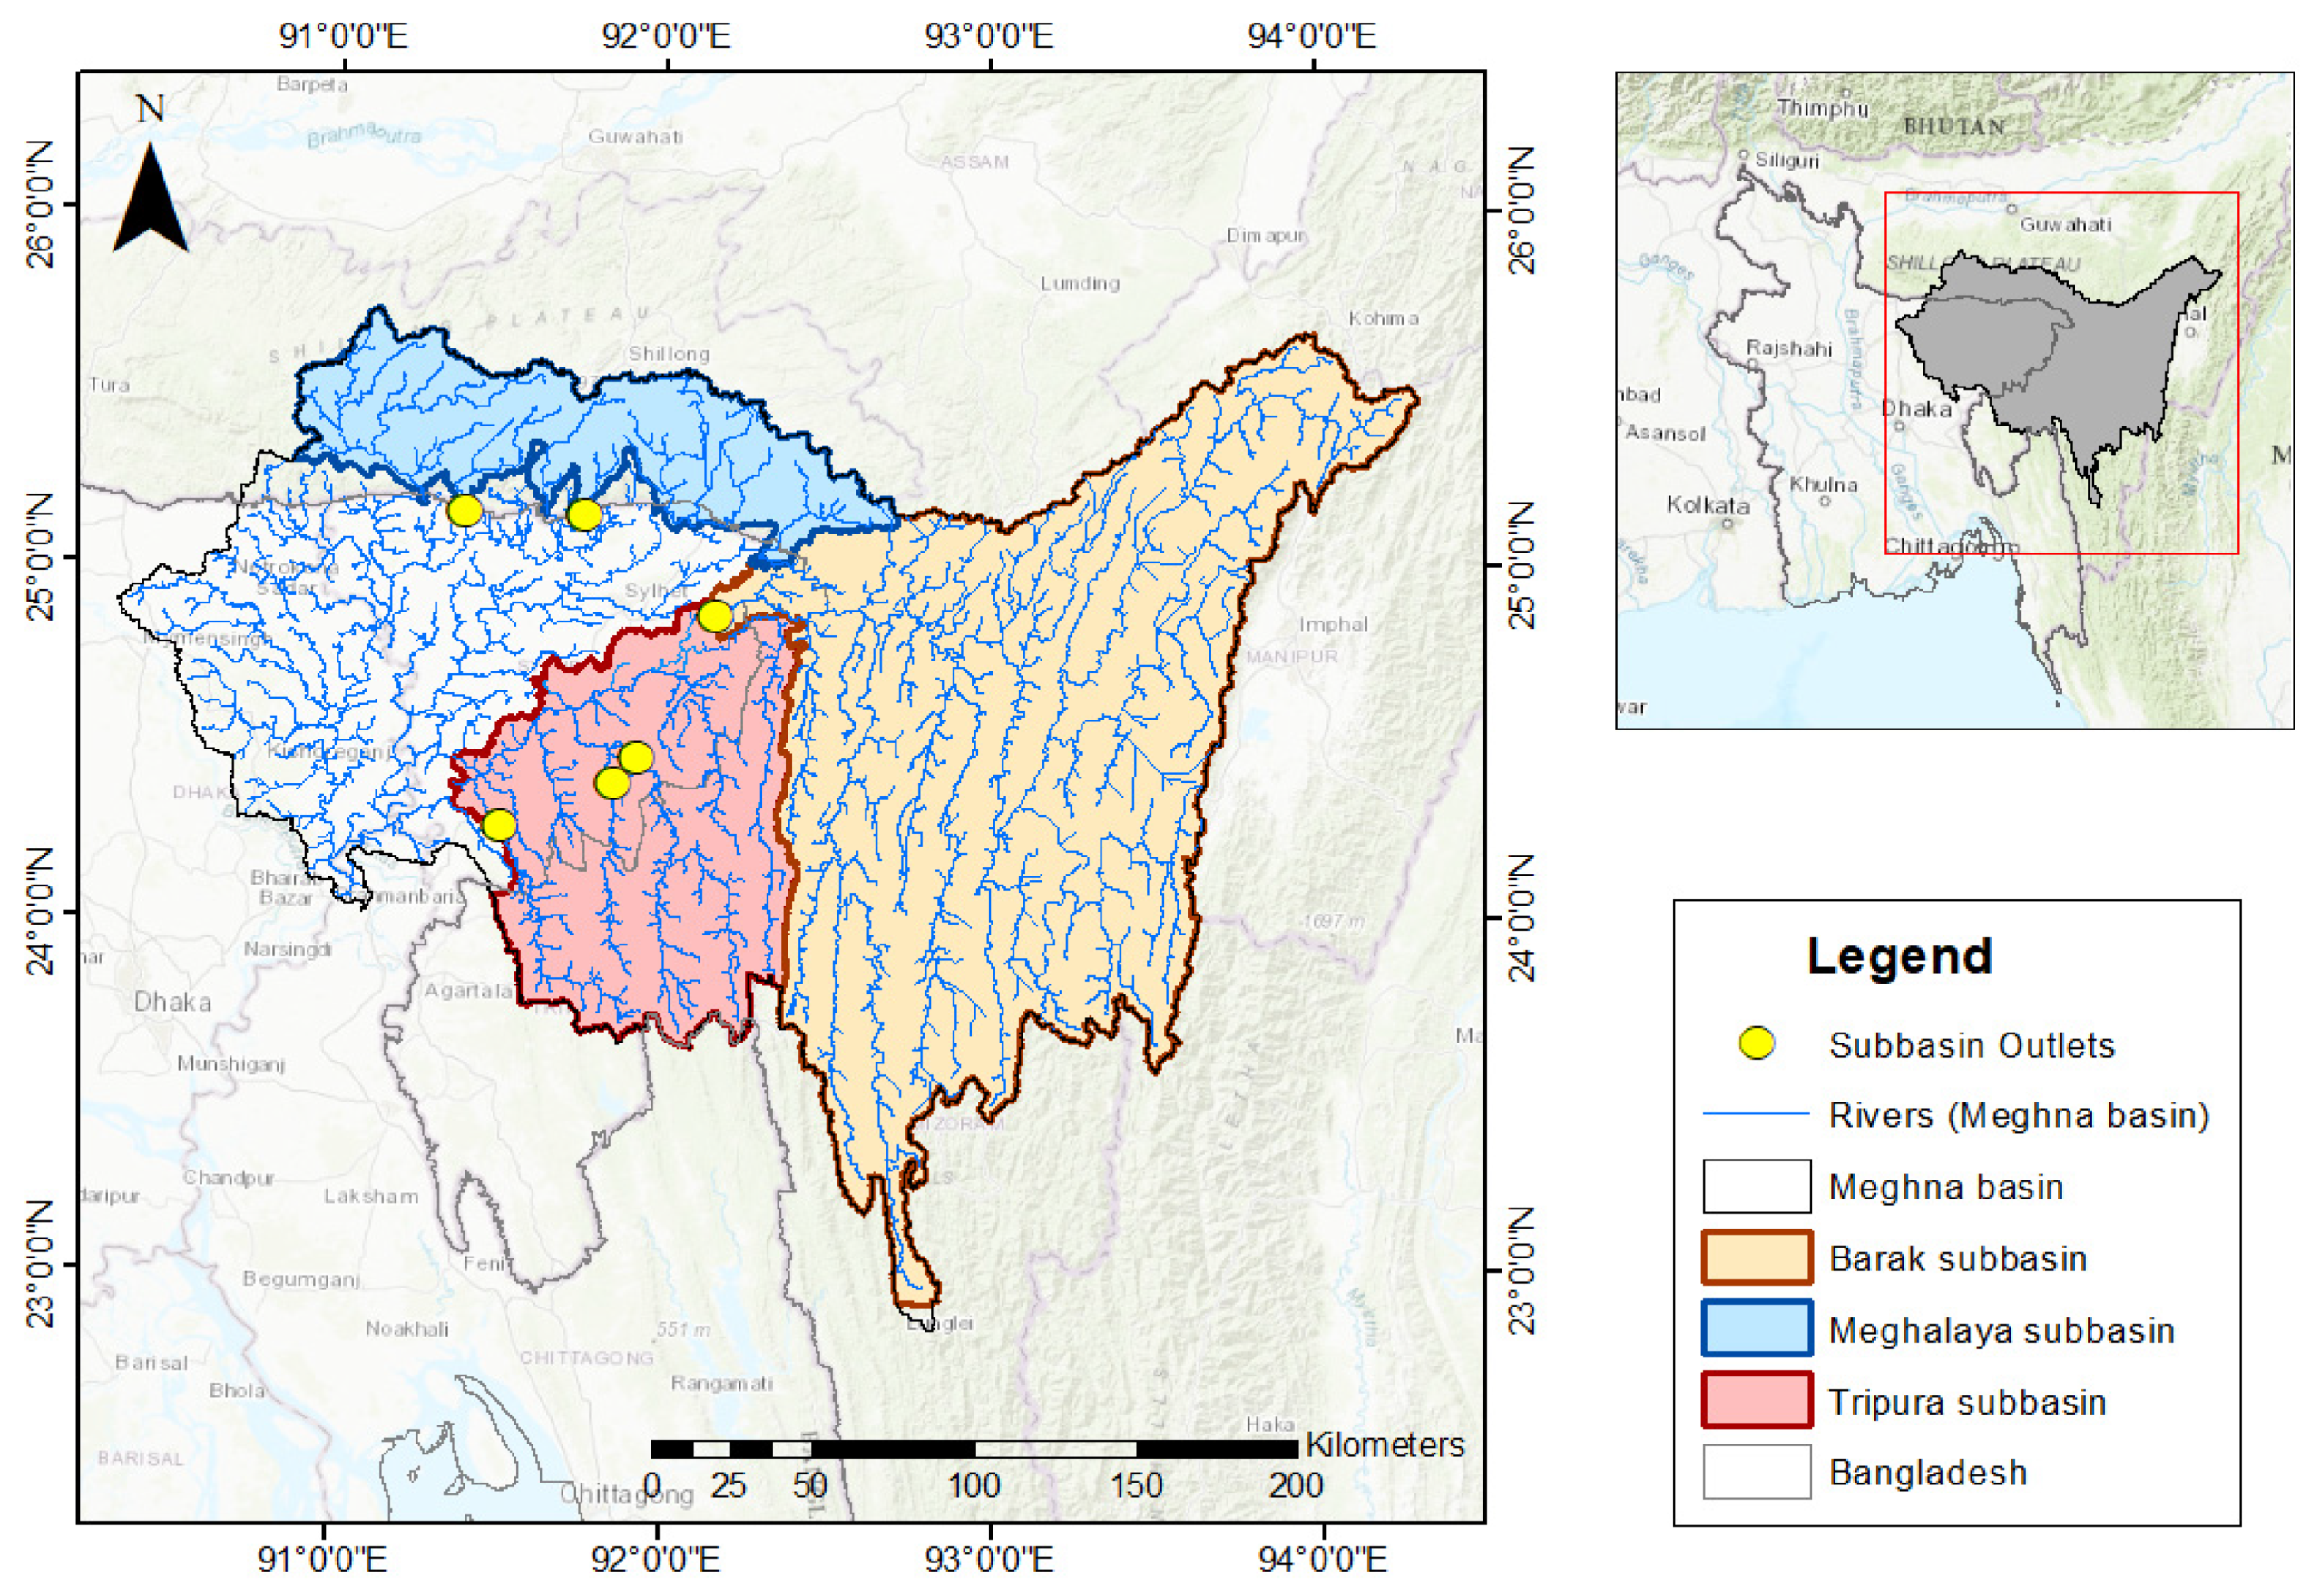
2.1. Study Area

The Meghna River basin encompasses a total area of 82,000 km2, with 47,000 km2 located in India and 35,000 km2 located in Bangladesh [36]. The overall river system in this basin can be separated into three main categories: (a) Rivers originating from the Meghalaya Plateau flowing southwards; (b) Rivers originating from the hills of Manipur, Mizoram, Nagaland; and (c) Rivers of the Tripura hills [37]. In general, the Upper Meghna River Basin (UMRB), with its major portion outside of Bangladesh, consists of three major sub-basins: the Meghalaya, the Tripura, and the Barak (Figure 1, Table A1).
The UMRB mainly consists of mountainous regions with a considerable amount of flat land [38]. The major portion of the Meghna Basin is occupied by forests located at the higher elevations of the northern and eastern states of India. The remaining portion of this basin that lies within Bangladesh is mostly used for agriculture [39]. The region experiences a humid subtropical climate marked by significant seasonal variations [40]. The dominant seasons in this region are Pre-monsoon (March-May), Monsoon (June–September), Post-monsoon (October–November), and Winter (December–February) [41]. The yearly rainfall fluctuates across the watershed, varying from 2200 mm in the western boundary to 5800 mm in the northeastern region, with an average of approximately 3212 mm. Two of the wettest locations in the world—Mawsynram and Cherrapunji—are in the Meghalaya sub-basin of the UMRB and receive an average of 11,871 and 11,777 mm of precipitation per year, respectively [42].

2.2. Data

2.2.1. Elevation, Soil and Land Use Data

A range of spatially distributed datasets, i.e., the Digital Elevation Model (DEM), Land Use Land Cover (LULC), and soil data, were collected and then preprocessed before setting up the SWAT models. The DEM (1 arc second or 30 m resolution) was acquired from the United States Geological Survey (USGS) database, sourced from the Shuttle Radar Topography Mission (SRTM). To define the soil properties, the Digital Soil Map of the World (DSMW) was obtained from the Food and Agriculture Organization (FAO) with a resolution of 5 arc minutes. The land covers across the entire watershed were delineated using the GlobCover Land Cover Map (300 m resolution), a product of the European Space Agency (ESA).

2.2.2. Climate Data and Hydrological Data

Observed weather data (precipitation, maximum and minimum temperature) for the UMRB were obtained from the WFDE5 dataset, and the remaining weather data (solar radiation, relative humidity, and wind speed) were collected from the India Meteorological Department (IMD) dataset (shown in Figure A1). The WFDE5 dataset is based on ERA5 reanalysis, where the WATCH (WATer and global CHange) Forcing Data methodology was applied to ERA5 reanalysis data [43]. This dataset has a resolution of 0.5° with daily temporal resolution. This study used the WFDE5 dataset from 1996 to 2018. For assessing the impact of climate change on the streamflow, 13 GCMs from the CMIP6 dataset were considered in this study [44]. This study utilized bias-corrected daily climate data (precipitation, maximum temperature, and minimum temperature) all at a resolution of 0.25° (shown in Figure A2), collected from a previous research work [45].
Observed discharge data at multiple outlets were acquired from the Bangladesh Water Development Board (BWDB) for the time period of 1996–2018. The considered locations were Sheola (SW 173) in the Barak sub-basin, Islampur (SW 332), and Muslimpur (SW 333) in the Meghalaya sub-basin and Shaistaganj (SW 158.1), Monu Railway Bridge (SW 201), and Kamalganj (SW 67) in the Tripura sub-basin. To address the missing values in observed discharge data, rating curves were derived using daily water levels to estimate daily discharge at the outlet locations.

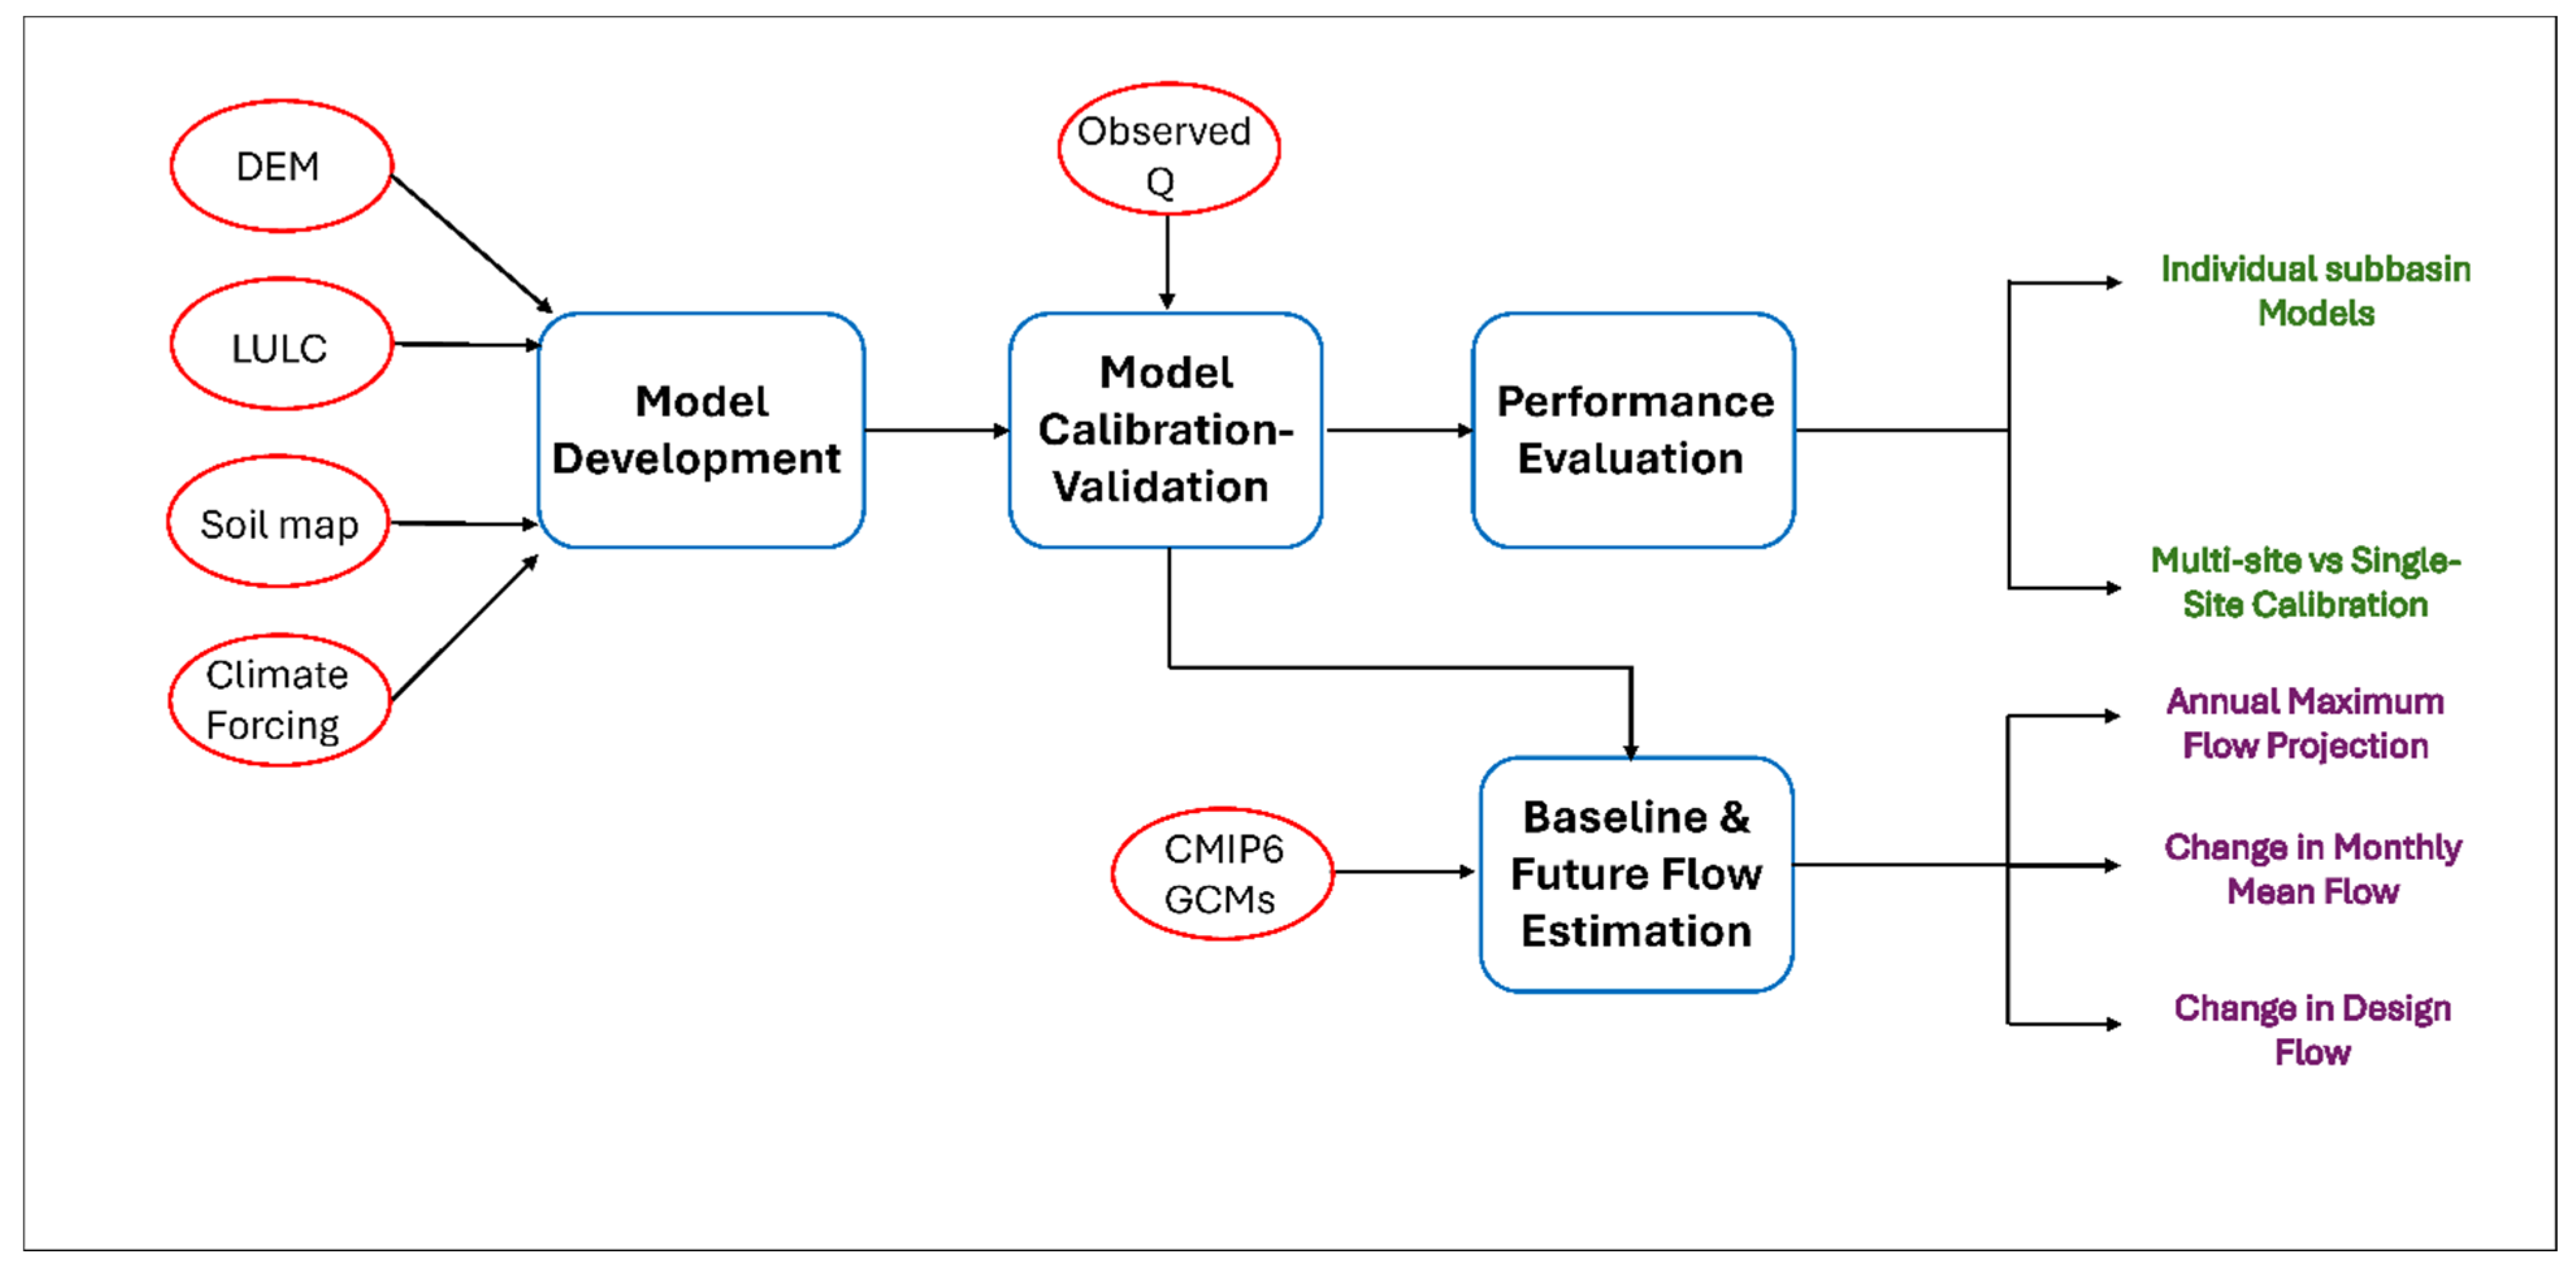
2.3. Methodology: The SWAT Model

This study involves SWAT hydrological modeling that mainly comprises three components, i.e., model development, model performance analysis, and future flow estimation. Three individual SWAT models were developed for the Barak, Tripura, and Meghalaya sub-basins using spatial watershed properties such as DEM, LULC data, soil information, and meteorological forcings, i.e., precipitation, maximum temperature, and minimum temperature, etc. The ‘sub-basin scale’ models were then calibrated (1996–2010) and validated (2011–2018) using the observed discharge from BWDB. The calibration and validation periods (1996–2018) were chosen depending on the reliable observed data availability, with fewer missing values at the selected stations. To evaluate the efficiency of the multi-site calibration approach, the Tripura and Meghalaya sub-basins were calibrated at multiple and single outlet points. Afterward, a comparison between these two calibration techniques was performed using different statistical parameters. After calibration–validation, the GCM data were used to simulate daily discharge for the baseline period and future period using the historical hindcast (1985–2014) and future forecast (2026 to 2100), respectively. The period spanning from 1985 to 2014 was selected as the baseline period to keep similarity with the GCM data source of this study. Later, the multi-model ensemble (average of the output flows from 13 GCMs of each timeline and emission scenario) was computed for both periods, and the future ensemble means were compared to that of the baseline period (1985–2014) to assess the climate change impacts on streamflow. A brief framework of this study is exhibited in Figure 2.

2.3.1. Model Background

In the 1970s, the United States Department of Agriculture (USDA)’s Agricultural Research Service (ARS) initiated the development of the SWAT model to calculate the flow of water, sediments, and nutrients from smaller sub-basins to the main basin’s outlet [46]. SWAT, a semi-distributed basin scale model, can simulate most of the components that exist in the hydrologic cycle, i.e., evapotranspiration, infiltration, surface runoff, channel routing, etc., quantifying the impact of elevation pattern, soil class, land use management practices, and agricultural practices in watersheds [46]. The SWAT-CUP package is basically utilized for calibrating and validating a developed SWAT model and for simultaneously performing sensitivity analysis and uncertainty analysis. SWAT-CUP packages mainly follow a ‘stochastic’ approach, rather than a ‘deterministic’ approach, to identify the error and uncertainty in the model for eventually finding out the optimum parameter ranges [47].

2.3.2. Model Setup

Multiple steps were followed to develop individual SWAT models for the UMRB. After collecting all the required data, the model was set up by conducting the following steps: delineating watersheds, defining the hydrologic response units (HRU), processing weather data, and selecting the respective methods to estimate different hydrologic components [48]. The SWAT-CUP program was later used for model calibration, sensitivity analysis, and model performance evaluation [47]. Finally, the developed SWAT model was simulated with future climate data to generate future flow at basin outlets.

2.3.3. Calibration Strategies

As previously mentioned, it is possible to disintegrate the UMRB into three major sub-basins: the Tripura sub-basin, the Barak sub-basin, and the Meghalaya sub-basin; therefore, separate SWAT models were developed for each basin. The goal was to assess whether the ‘sub-basin scale’ model provides any advantage over the ‘regional scale’ model. Another goal of this study was to evaluate whether the multi-site calibration approach can improve the model performance since it is expected that models capture the spatial variability more efficiently in the case of multi-site calibration for larger river basins. In this study, single- and multi-site calibration strategies were tested, as shown in Table 1. The calibration locations of Barak-01, Tripura-01, and Meghalaya-01 models were at Sheola (SW 173), Kamalganj (SW 67), and Muslimpur (SW 333), respectively. Tripura-02 was calibrated at Monu Railway Bridge (SW 201) and Kamalganj (SW 67), while Tripura-03 was calibrated at Shaistaganj (SW 158.1) in addition to the locations used in Tripura-02. Meghalaya-02 was calibrated at Islampur (SW 332) and Muslimpur (SW 333). Calibration locations were selected based on data availability and quality across monitoring stations. Based on this criterion, only one discharge station (outlet) was found to be available for the Barak sub-basin and therefore a multi-site calibration strategy was not possible to test for this basin.

2.3.4. Model Performance and Sensitivity Analysis

To obtain more reliable and realistic outputs, this study calibrated the best-suited models against the daily discharge data (1996–2018) at the outlets of these sub-basins with the help of SWAT-CUP. For calibration, the time period was considered from 1996 to 2010 while the validation was performed for 2011 to 2018. The model parameters (as in Table A2) were optimized using SWAT-CUP to minimize the discrepancy between the model outputs and the observations. As objective functions, SWAT-CUP used several statistical parameters such as the coefficient of determination (R2), the Nash–Sutcliffe model efficiency coefficient (NSE), the RMSE-observations standard deviation ratio (RSR), etc. to represent the model performance. Finally, the models with the best statistical output were considered as the baseline model for each of the sub-basins, which were later used for future flow simulation.
SWAT-CUP is also capable of identifying the sensitive parameters associated with the SWAT models through either global sensitivity or one-at-a-time sensitivity analysis. This study used the Sequential Uncertainty Fitting (SUFI-2) algorithm within the SWAT-CUP for the sensitivity analysis. Initially, 15 parameters related to different hydrologic components (mentioned in Table A2) were considered in this process. Eventually, the most sensitive parameters were determined by checking the associated p-values (<0.05) and larger t-test scores (absolute values) of each of the parameters [47]. Moreover, the uncertainties of the parameters were quantified by two statistics: the P-factor and the R-factor, related to a 95% prediction uncertainty envelope. The P-factor represents the proportion of the observed data accounted for by this envelope, while the R-factor signifies the extent of this envelope. The larger the P-factor (>0.7 for flow), the higher the model prediction accuracy, while the smaller the R-factor (<1.2 for flow), the lower the model prediction uncertainty [47].

2.3.5. Future Flow Simulation

The calibrated SWAT models were used to simulate future discharge at six outlets of the three sub-basins in the UMRB. In this study, two future emission scenarios were considered for future climate conditions: SSP2-4.5 (moderate) and SSP5-8.5 (extreme). All the stations considered during the model calibration phase were selected to predict future flow and analyze the climate change impacts up to the year 2100. The baseline period for estimating flow was from 1985 to 2014, and the future timeline was from 2026 to 2100. The future timeline was further split into three slices: near future (2026–2050), mid-future (2051–2075), and far future (2076–2100), and the flow variations were assessed with respect to the baseline (1985–2014) under both SSP2-4.5 and SSP5-8.5 scenarios. Using the daily climate dataset from 13 CMIP6 models (Table 2) as SWAT inputs, the future flow projection was simulated. Here, further analysis was performed based on the ensemble mean (average of the output flows) obtained from the 13 CMIP6 GCMs.

3. Results

The primary goal of this research work was to measure the anticipated effects of climate change on water flow within the Upper Meghna River Basin (UMRB). To achieve this, three SWAT models were developed to accurately depict the hydrological processes within the basin. Later, future climate projections were used within the developed SWAT models to estimate the future flows in the UMRB.

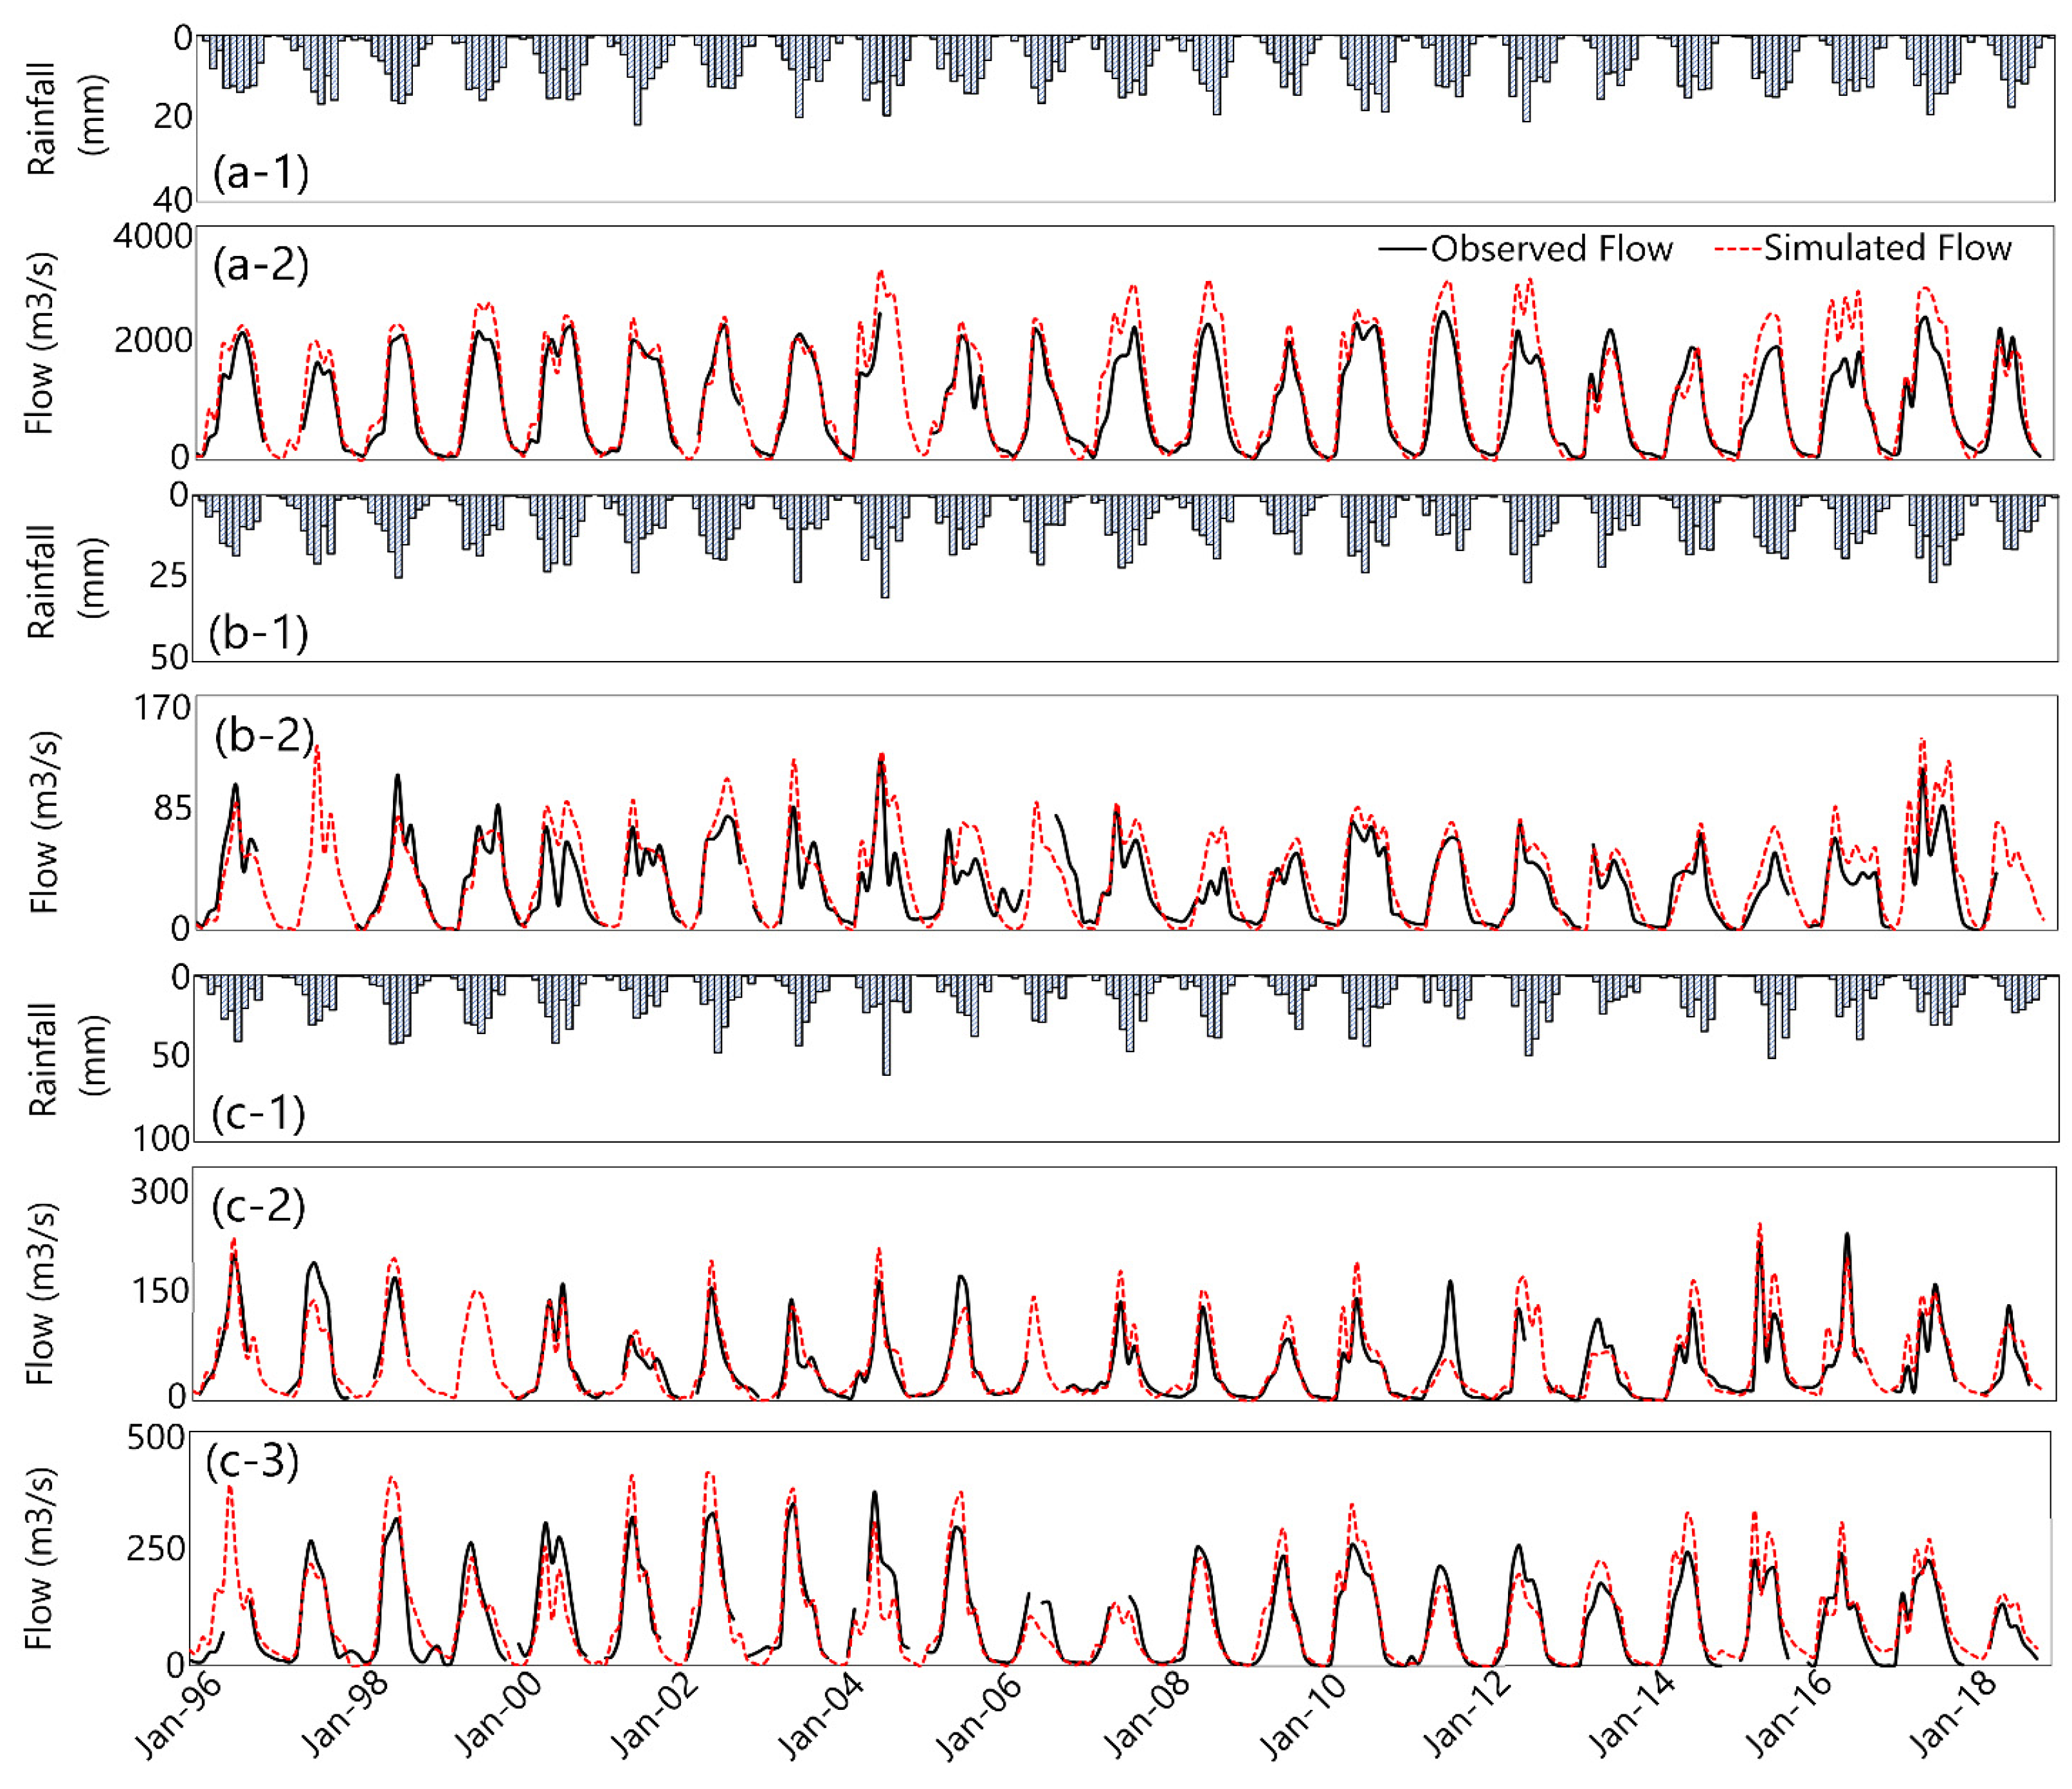
3.1. Results from SWAT Model Calibration and Sensitivity Analysis

Different model scenarios, considered in this study during model development, were compared using several objective functions (R2, NSE, RSR) to select the best possible model to simulate the discharge of the corresponding sub-basin with better accuracy. In the Barak sub-basin, the developed SWAT model (Barak-01) was calibrated only at Sheola and exhibited good performance, during both the calibration and the validation period, in terms of the values of the objective functions (Table 3). Two calibration options were considered for the SWAT model developed for the Meghalaya sub-basin (Meghalaya-01, Meghalaya-02). Although both models provided similar results in terms of R2 and NSE, the Meghalaya-02 model was chosen for further analysis as it was superior to the Meghalaya-01 model in terms of the P-factor (>0.7) and the R-factor (<1.20). Among the three models considered for the Tripura sub-basin, the model that was calibrated only at Kamalganj performed best according to Table 3. Hence, the Tripura-01 model was selected for further analysis. Time-series plots of observed and simulated monthly flows at the outlets of the selected models (Barak-01, Meghalaya-02, and Tripura-01) are shown in Figure 3 along with the average monthly precipitation at the basin.
The sensitivity analysis, performed by SWAT-CUP, provided an insightful outcome. Different sets of parameters were found to be sensitive (p < 0.05, |t| > 2) for each of the selected models for the three sub-basins. Table A3 shows the list of sensitive parameters corresponding to each ‘sub-basin’ model along with their p-values, t-test scores, and fitted values. In the Barak-01 model, SCS runoff curve number (CN2), moist bulk density (SOL_BD), and baseflow alpha factor (ALPHA_BF) were the sensitive parameters, while the Tripura-01 model had only one sensitive parameter: SCS runoff curve number (CN2). The sensitive parameters of the Meghalaya-02 model were SCS runoff curve number (CN2), moist bulk density (SOL_BD), average slope steepness (HRU_SLP), saturated hydraulic conductivity (SOL_K), and effective hydraulic conductivity (CH_K2).

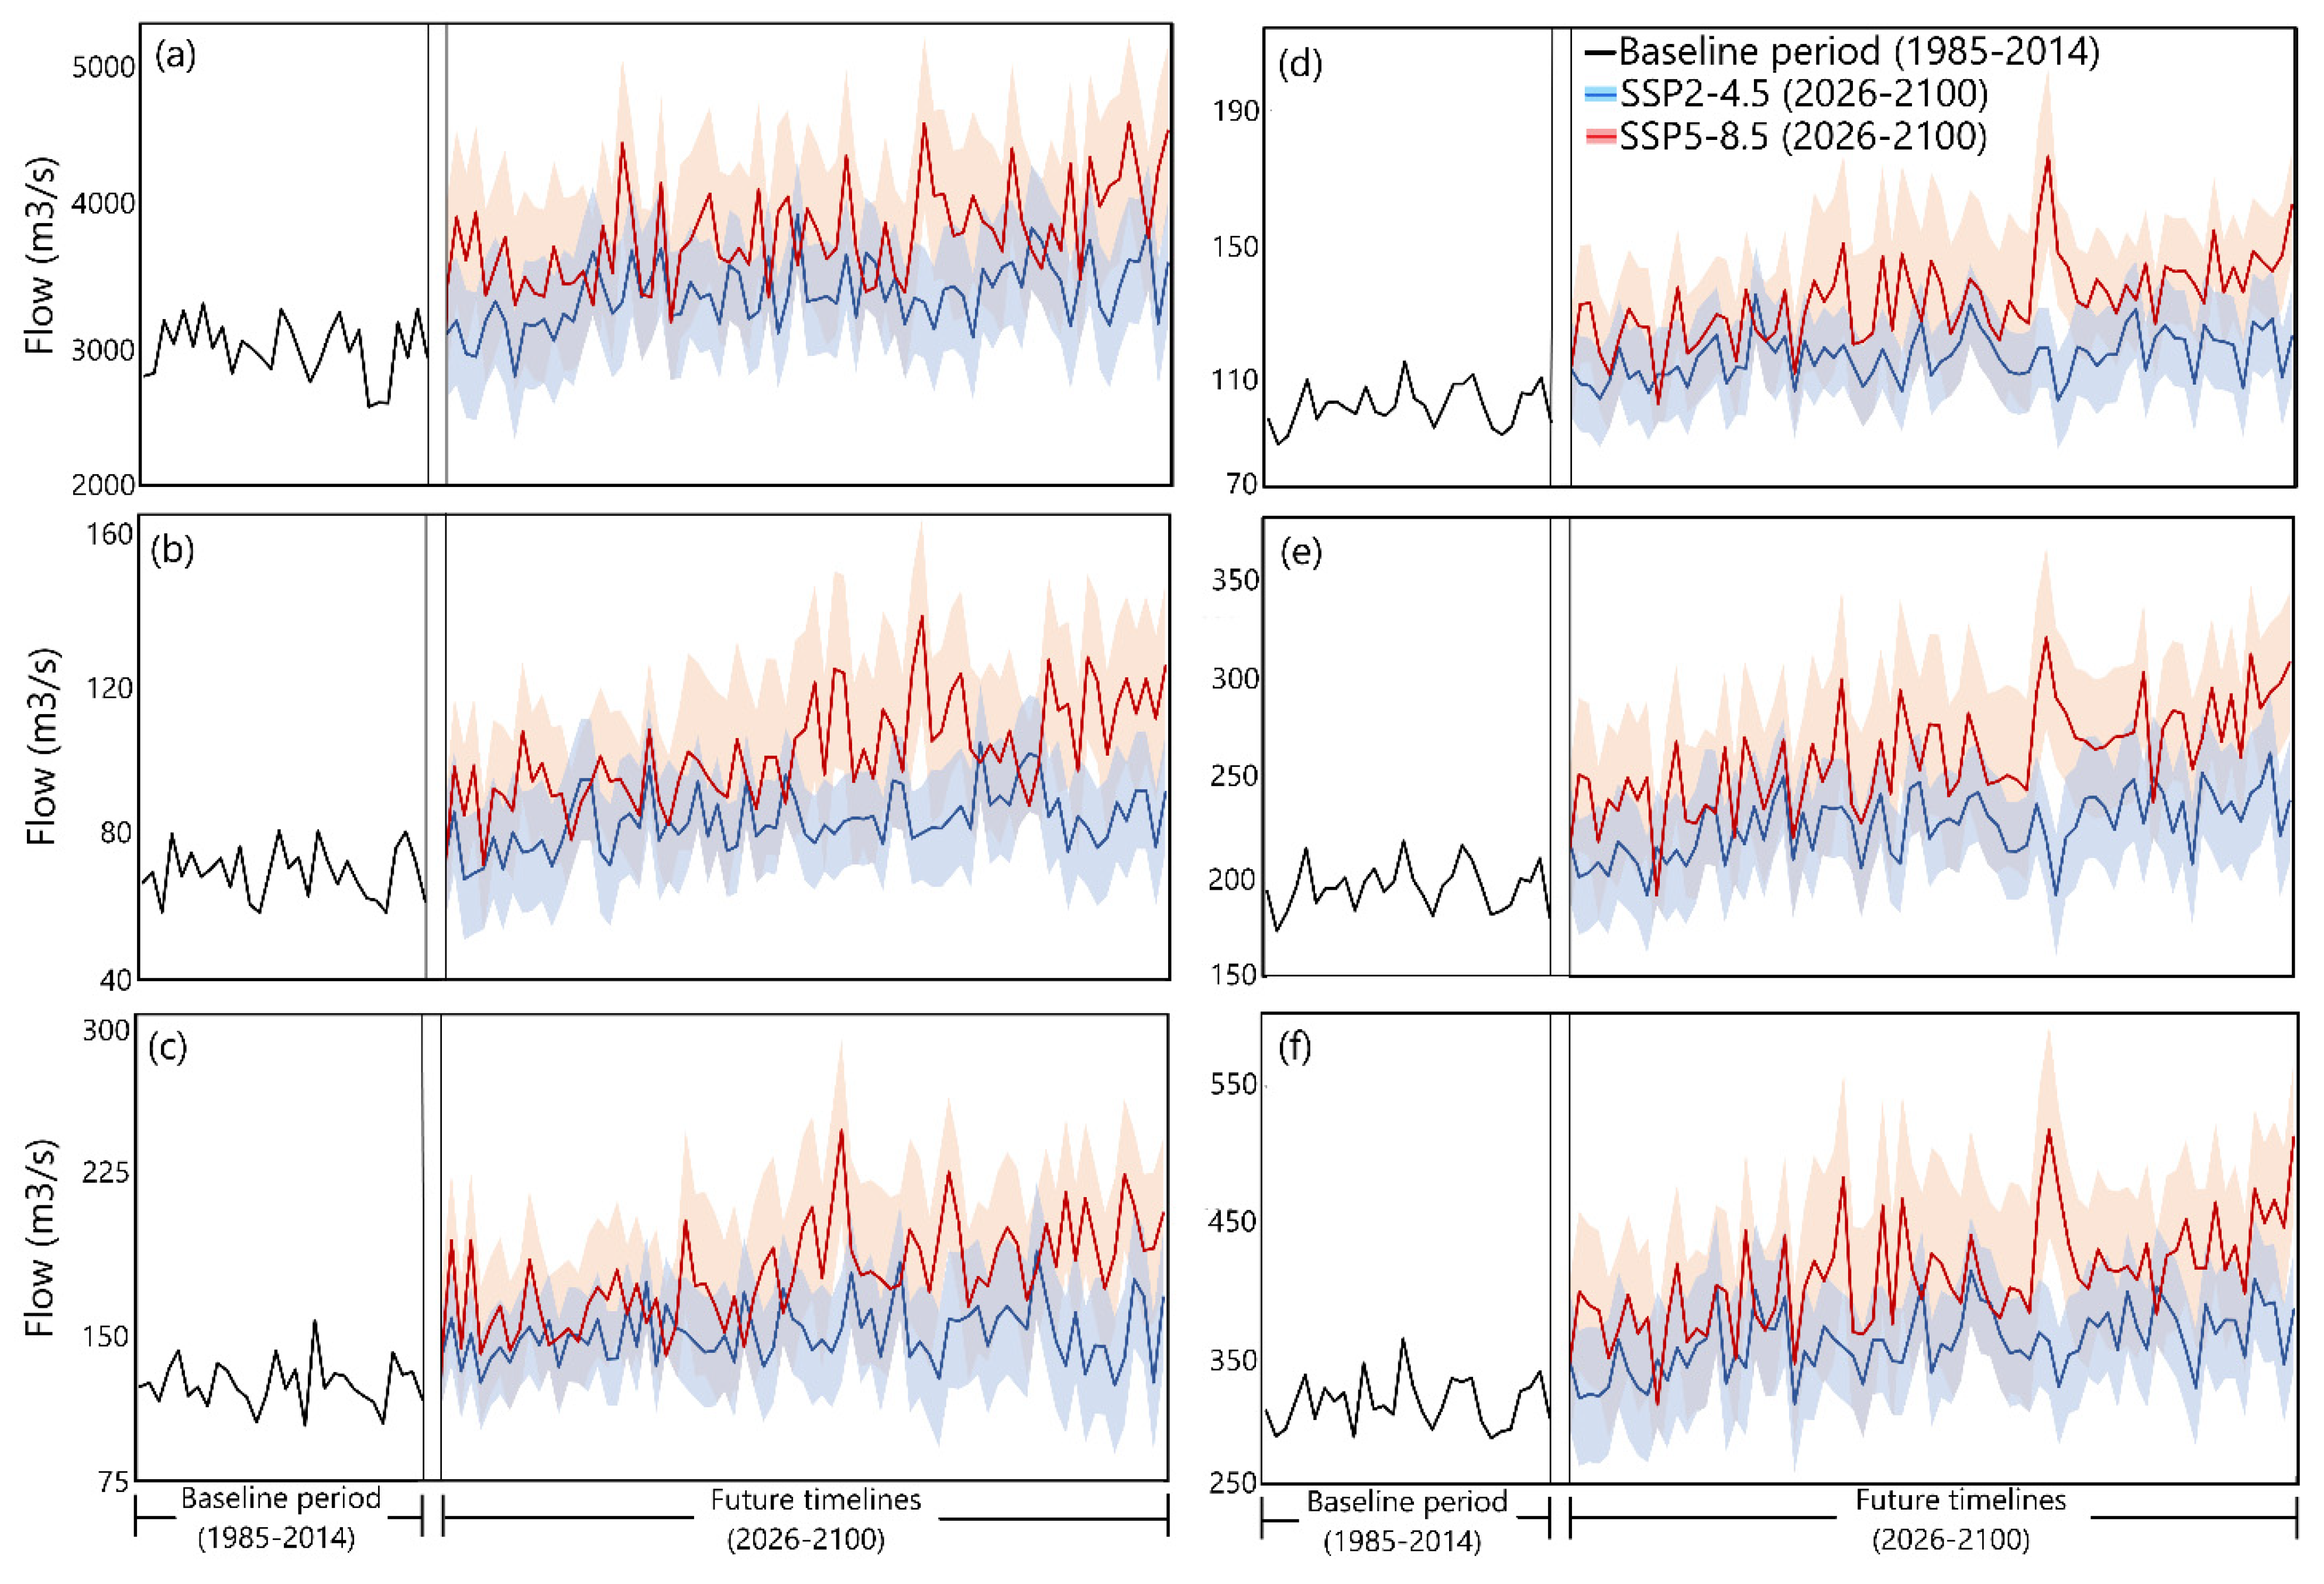
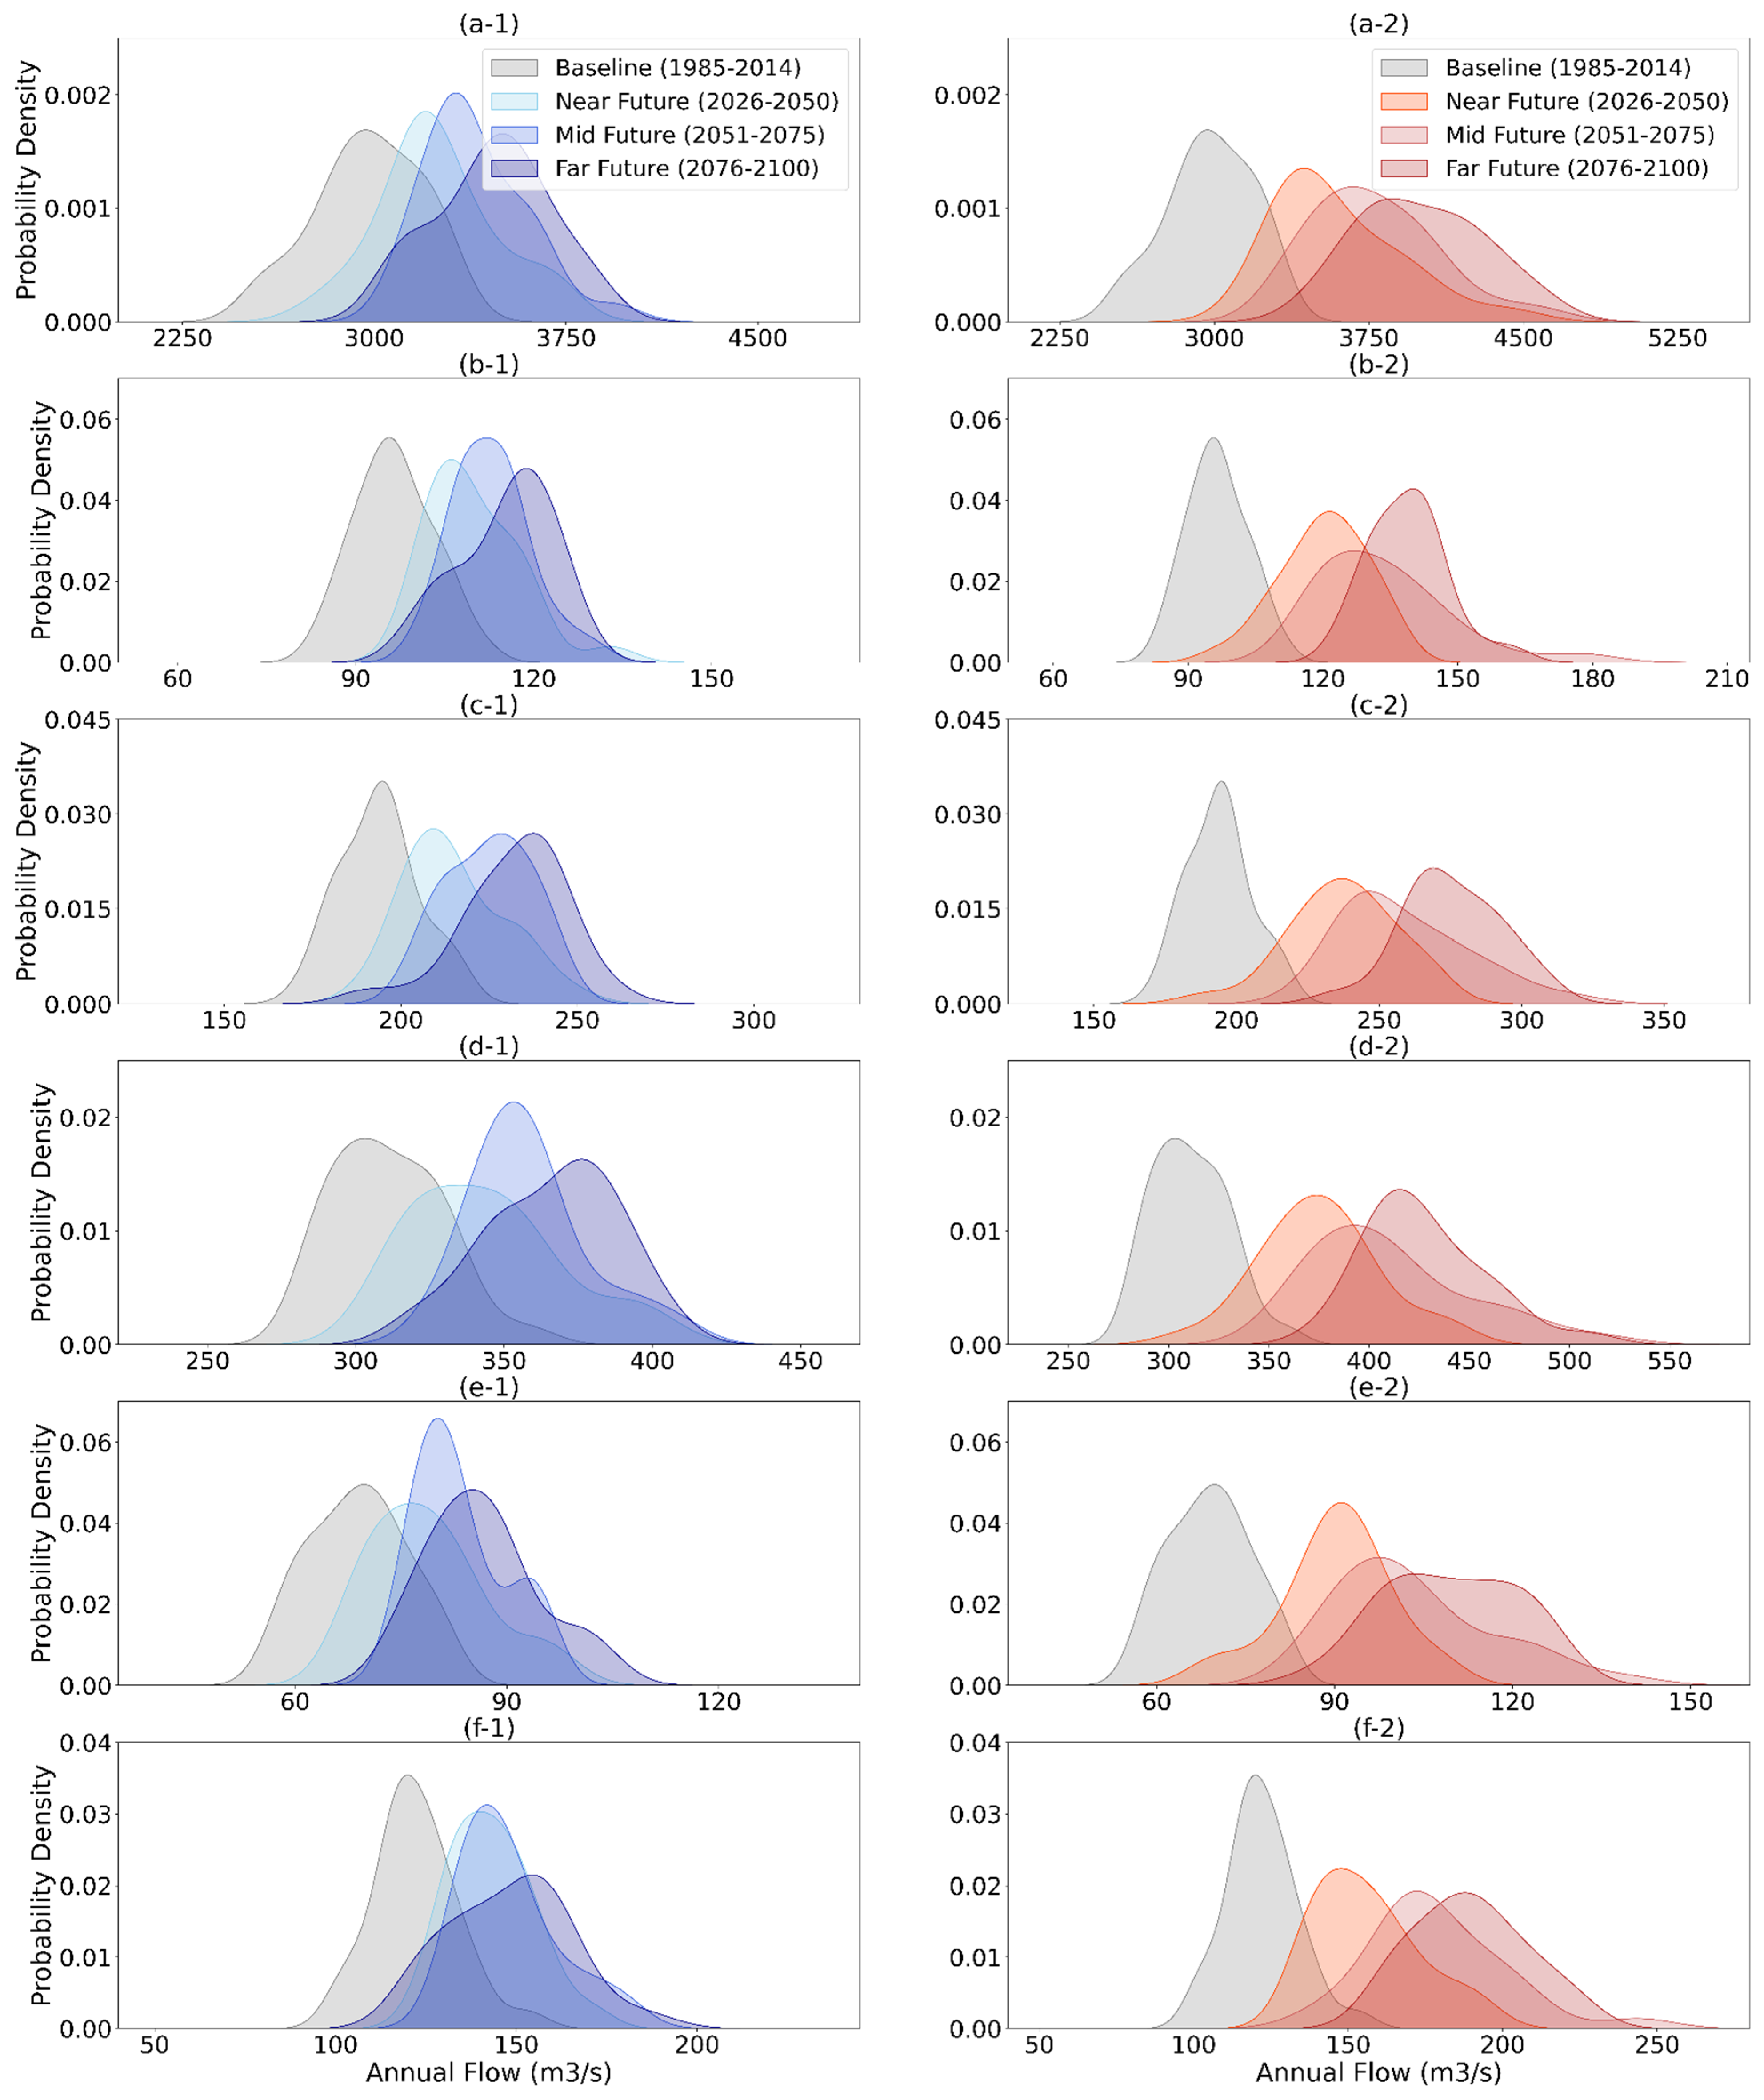
3.2. Climate Change Impact on Flow Availability

The selected SWAT models for the Meghalaya, Tripura, and Barak sub-basins were later utilized for simulating future flow using 13 CMIP6 GCMs considering 2 future emission scenarios: SSP2-4.5 and SSP5-8.5. After estimating the future flow at the six outlets up to the end of the 21st century, this study further analyzed how annual maximum flow, monthly mean flow, and design flow for a 100-year return period would be impacted due to climate change in the three future timelines.

3.2.1. Changes in Annual Maximum Flow

Throughout the baseline period (1985–2014), the Barak sub-basin experienced a flow of 2979.8 m3/s as the average of the annual maximum flow at Sheola. Under the SSP2-4.5 scenario, this flow increased to 3461.9 m3/s, whereas it reached 4003.9 m3/s under the SSP5-8.5 scenario during the far-future period (2076–2100). In the Tripura sub-basin, the average of the annual maximum flow during the baseline period ranged between 98.5 m3/s and 311.2 m3/s at different outlets. By the end of the 21st century, this range of average annual maximum flow increased up to 117.70 to 366.40 m3/s and 141.60 to 427.50 m3/s under SSP2-4.5 and SSP5-8.5, respectively. At the considered outlets of the Meghalaya sub-basin, the mean annual maximum flow was found to be 88.90–482.90 m3/s at different outlets during the baseline period. In the far-future period, 111.60–584.10 m3/s and 141.20–742.70 m3/s were the ranges of mean annual maximum flow at those major outlets in this sub-basin under the SSP2-4.5 and the SSP5-8.5 scenarios, respectively. Figure 4 shows how the annual maximum flow is expected to increase at the six outlets of these three sub-basins.
From the future flow estimation, it was revealed that the increase in the annual maximum flow would continue as the future timeline progressed, indicating that all three major sub-basins would experience more severe flows at their major outlets. The station located in the Barak sub-basin showed the least change in future annual maximum flow among all the stations considered in this study; it would experience up to 16% and 34% change in mean annual maximum flow by 2100 for SSP2-4.5 and SSP5-8.5 scenarios respectively. Moderate changes were observed at the selected stations located in the Tripura sub-basin, where mean annual maximum flow fluctuations ranged between 17 to 20% and 37 to 44% under SSP2-4.5 and SSP5-8.5 scenarios, respectively, in the far future. The Islampur station located in the Meghalaya sub-basin showed the highest number of variations in mean annual maximum flow across all three future timelines, except for the near future, under SSP2-4.5. The increase in average annual maximum flows at the two outlets of the Meghalaya basin varied between 21 to 25% and 55 to 59% for the far future under SSP2-4.5 and SSP5-8.5, respectively. Table 4 provides the details on the changes in the annual maximum flow for three future timelines based on the ensemble mean streamflow.
For a better understanding of how the distribution of flow changed at the major outlets, probability distribution functions (PDFs) were generated. Figure 5 shows how the distribution of annual maximum flow is expected to shift at the major outlets of these three sub-basins. The PDF curves representing the future flows are more ‘rightward shifted’ and in some cases more ‘spread out’, compared to the baseline PDF curves, indicating an increased mean in future flow distributions and an increased probability of extreme flow events.

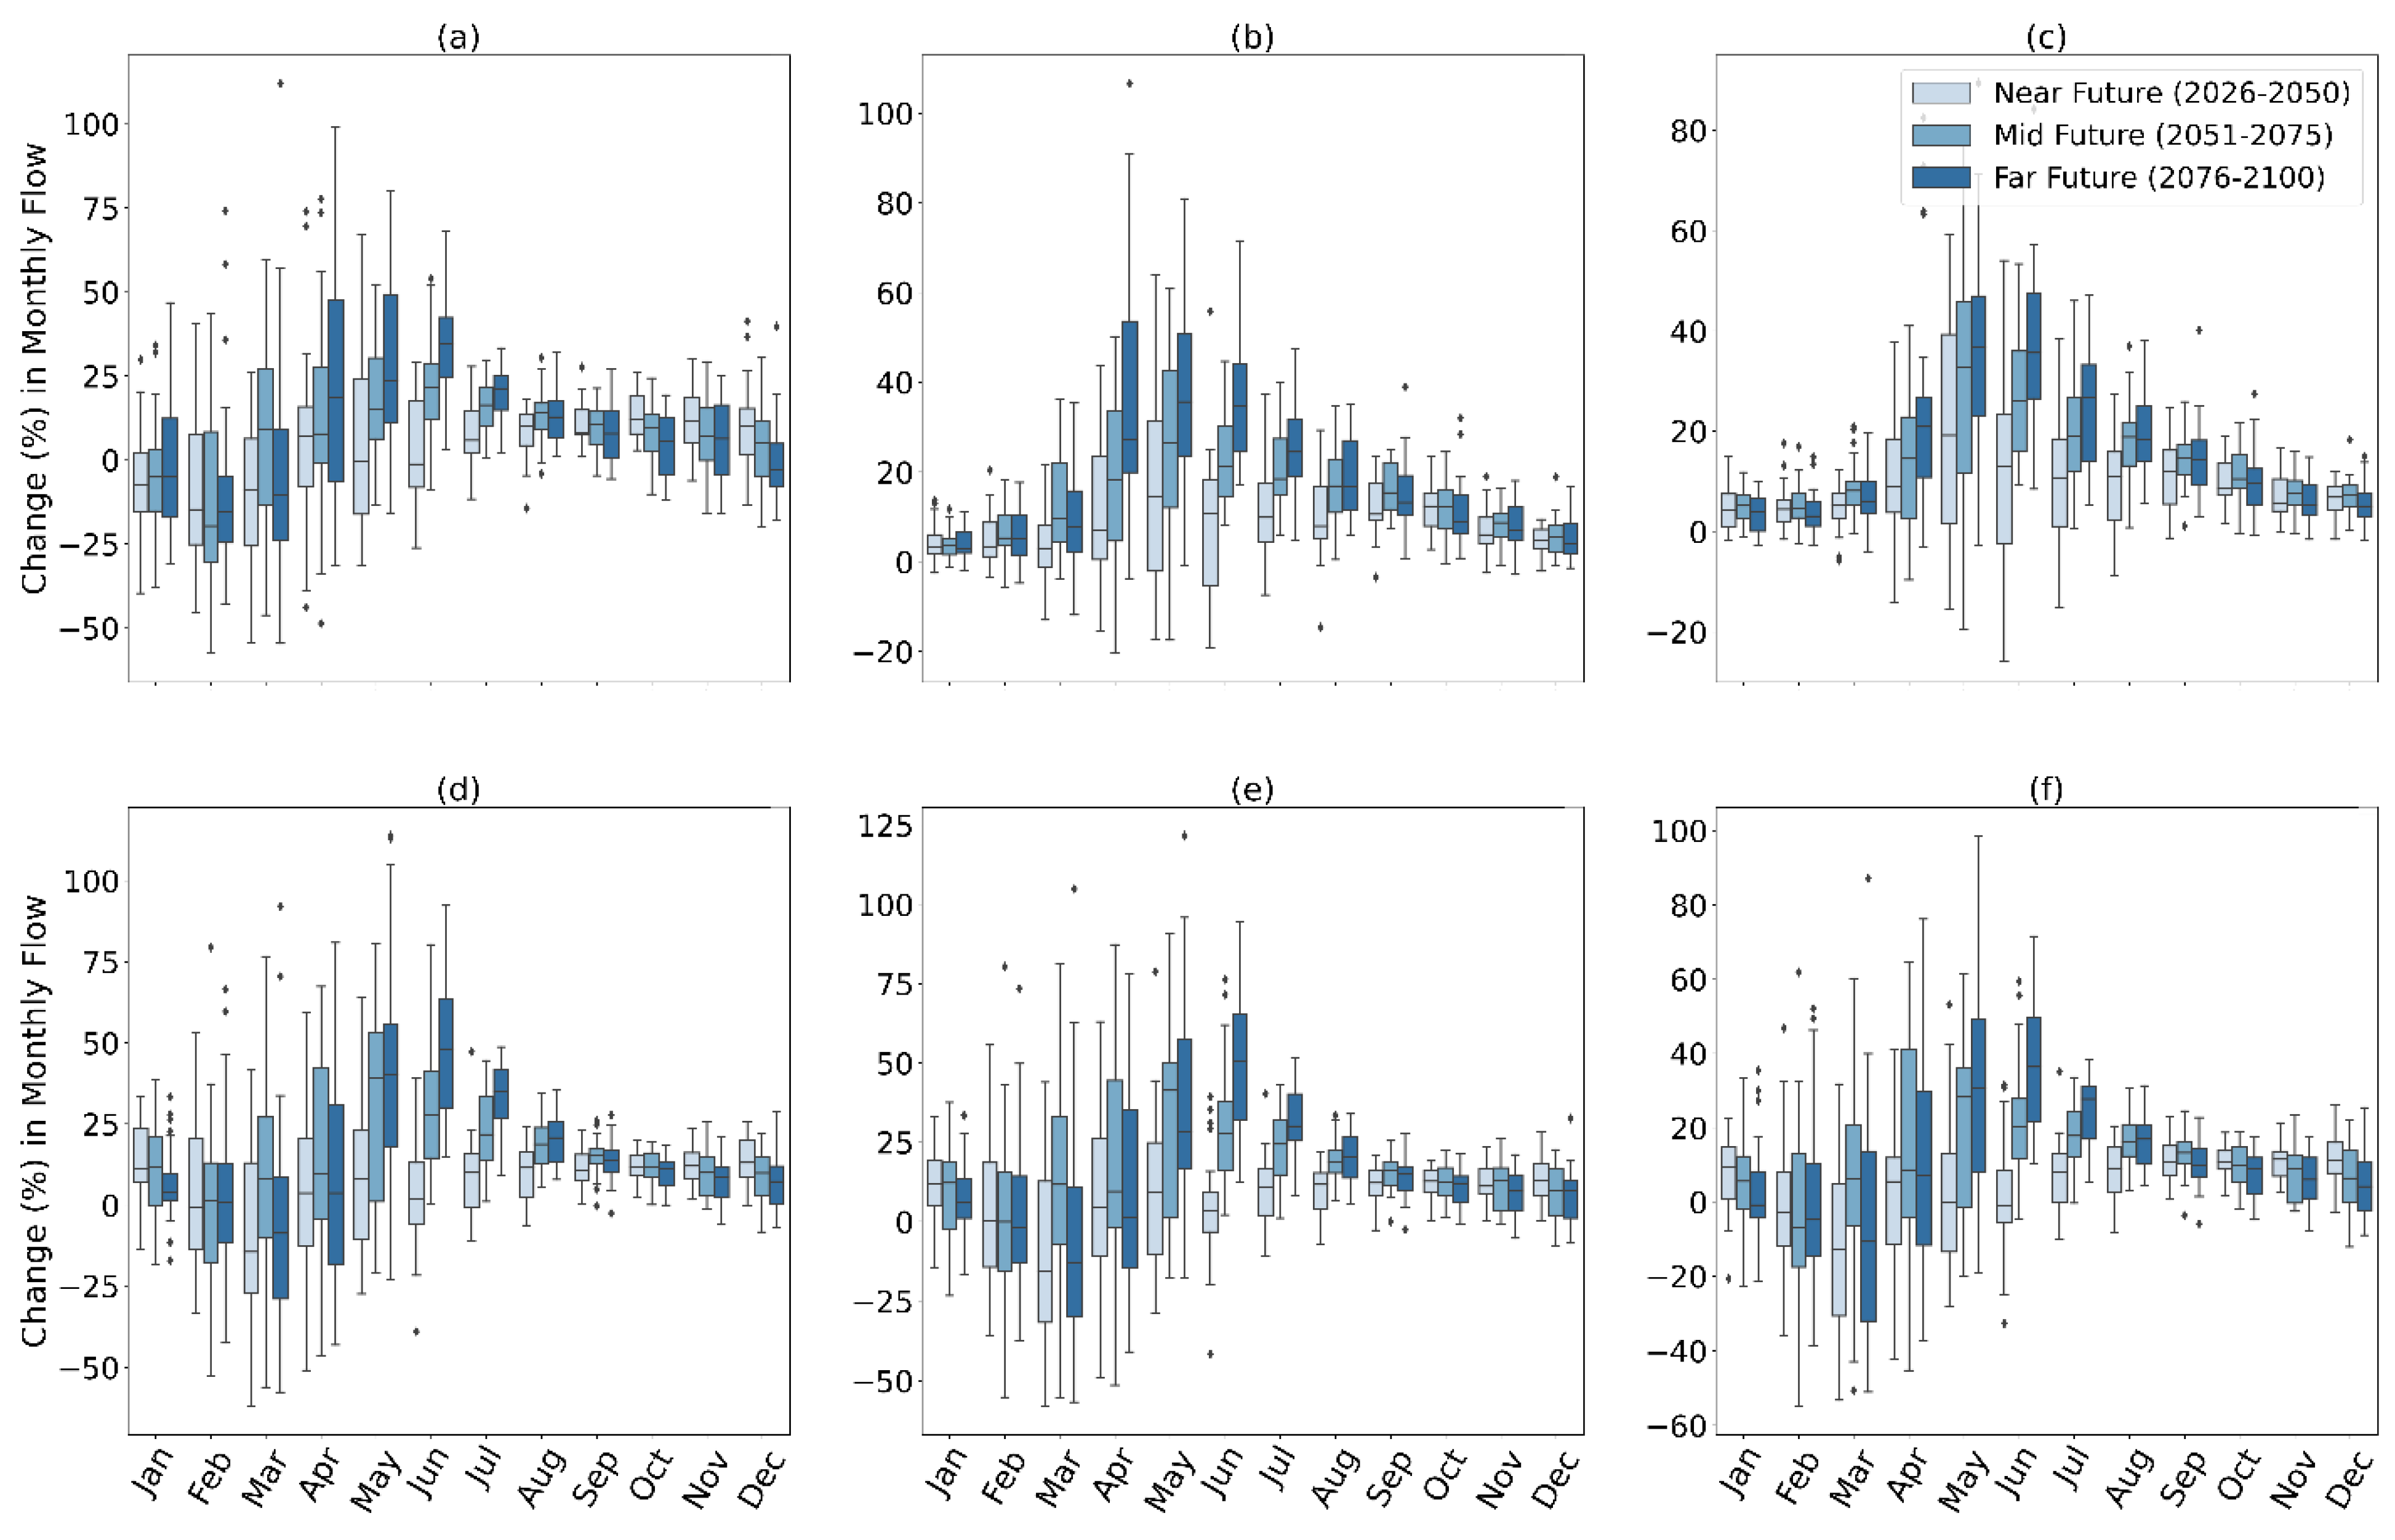
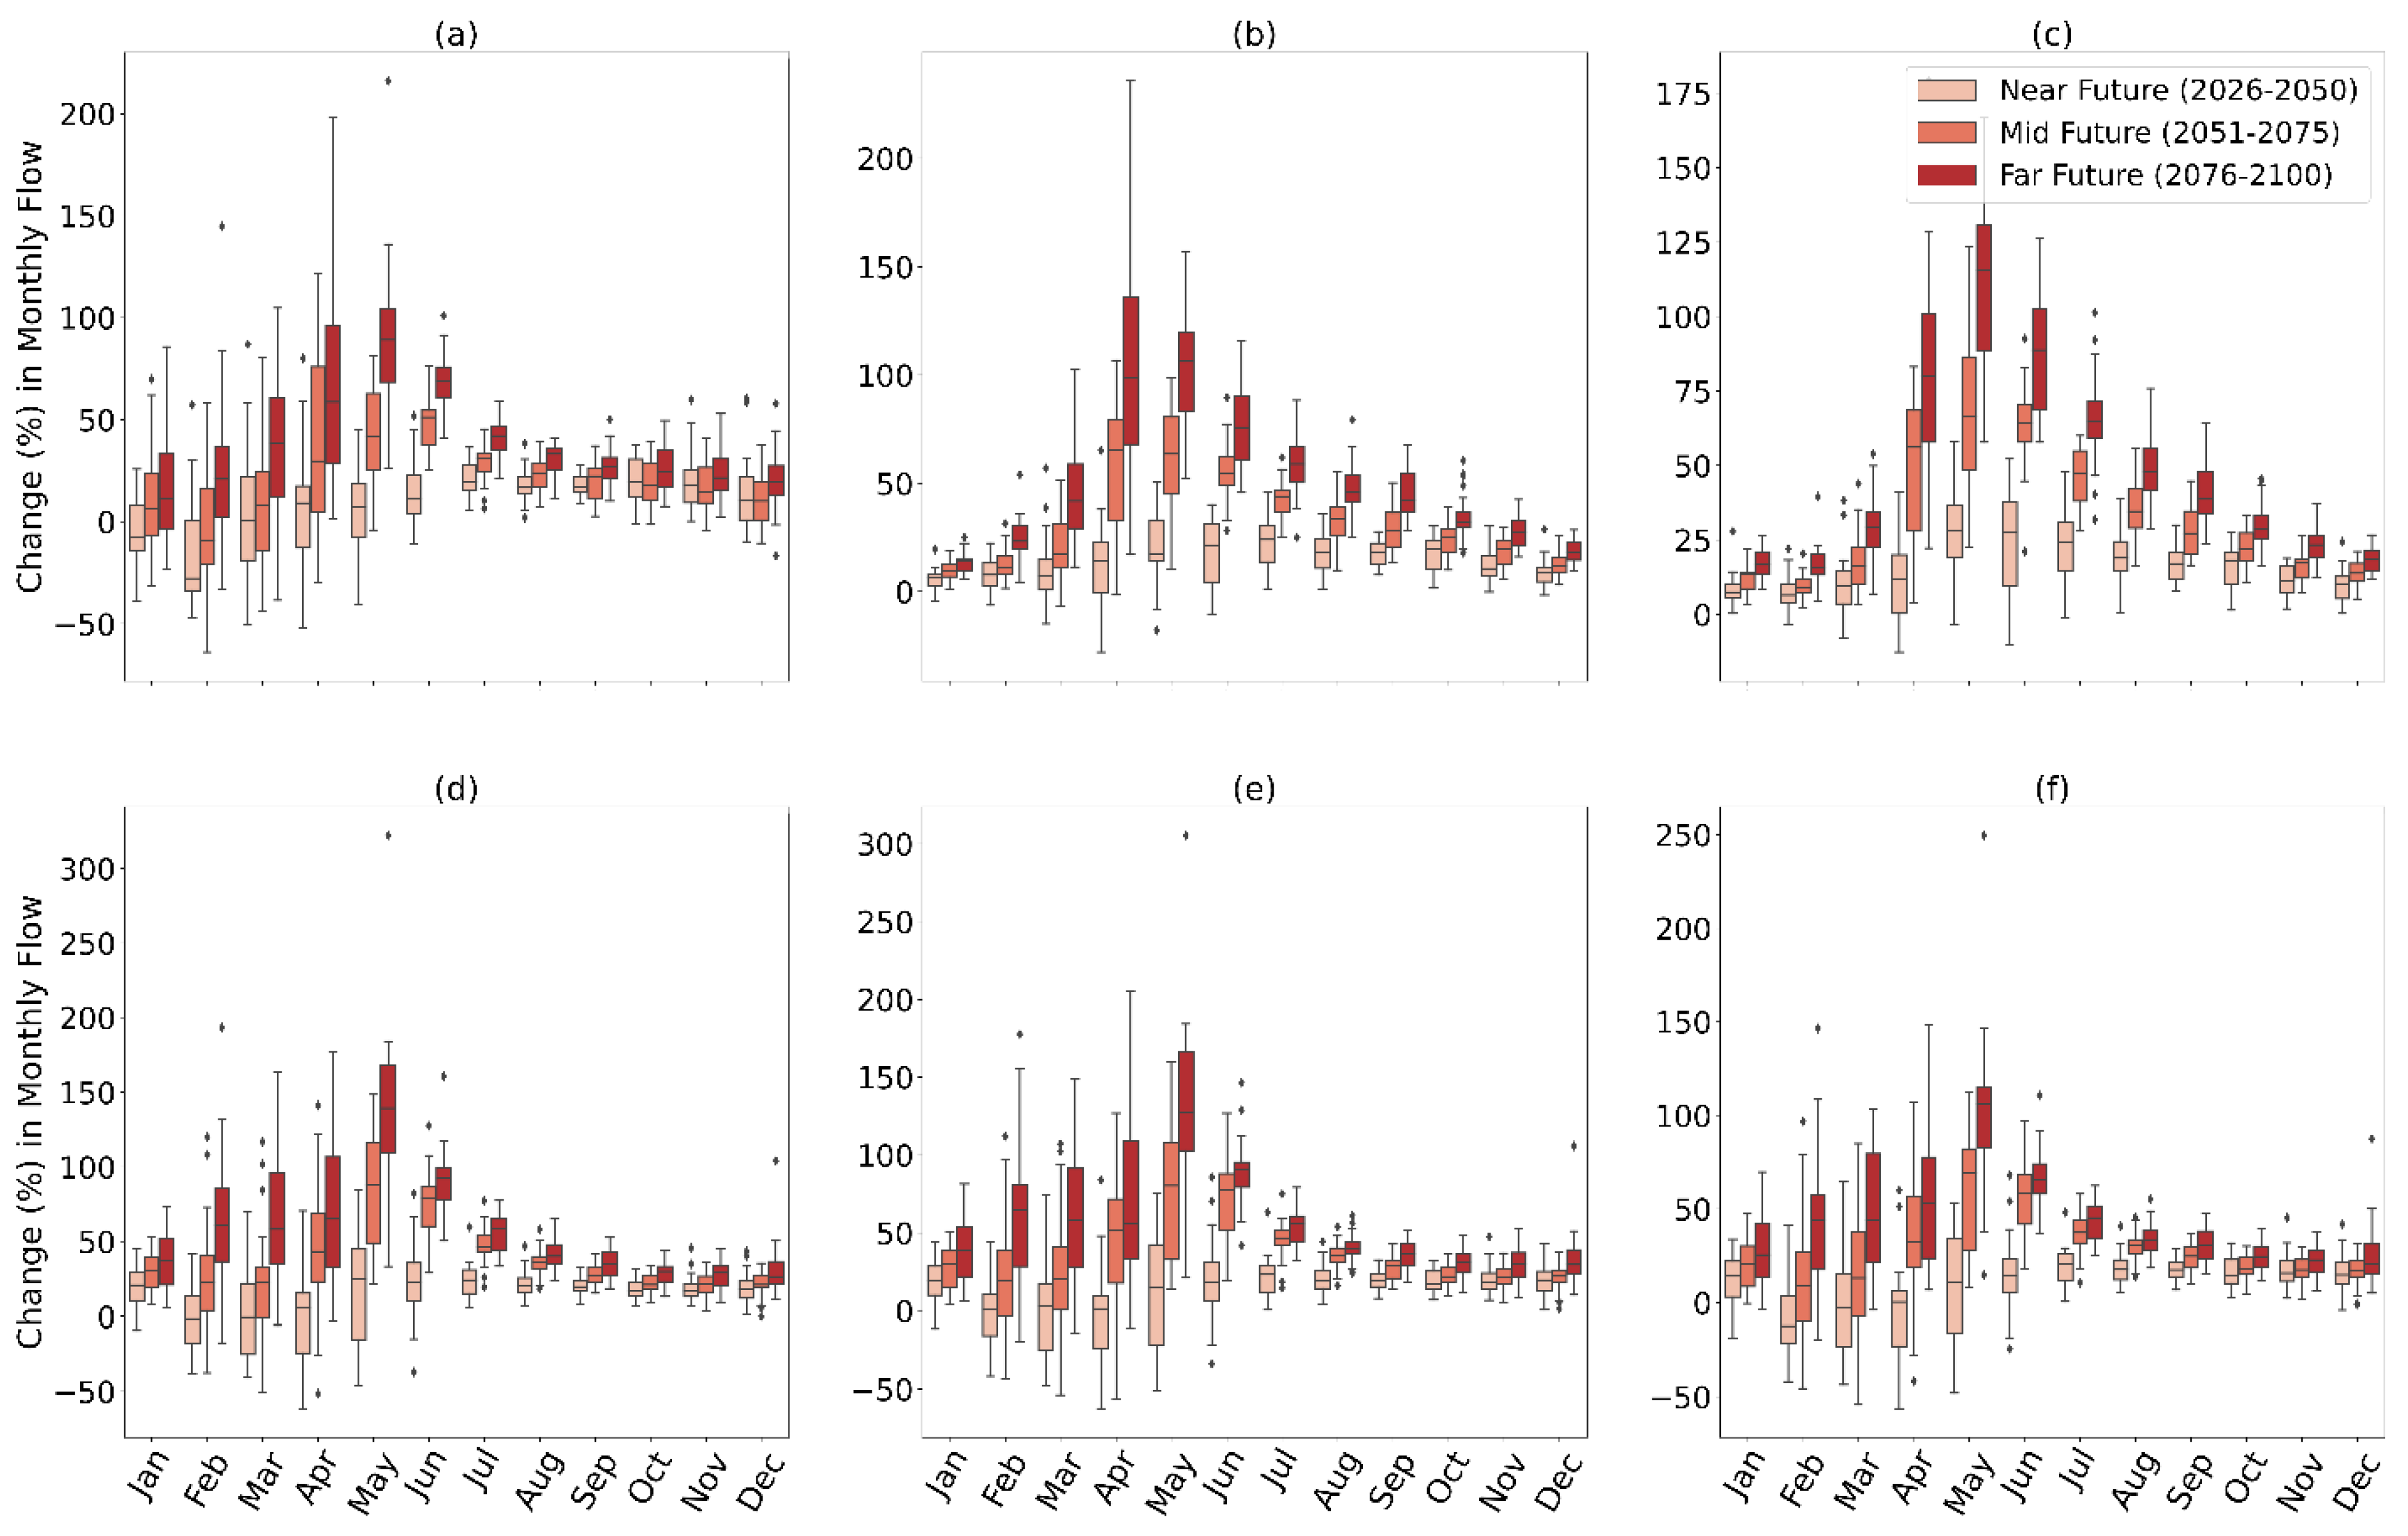
3.2.2. Changes in Monthly Mean Flow

From the analysis, it was observed that monthly flow at all locations in the Meghalaya sub-basin tended to increase in all the months, while monthly flow at the stations in the Tripura and the Barak sub-basins tended to increase only in specific months, especially in the monsoon season. At the outlets of the Meghalaya sub-basin (Muslimpur, Islampur), May and June were the most affected months, with up to a 19% and 27% increase in terms of monthly flow under SSP2-4.5 and SSP5-8.5 scenarios, respectively, during the near-future timeline. Toward the end of the century, the most affected month was April, in the Meghalaya sub-basin, with up to a 106% and 103% increase under SSP2-4.5 and SSP5-8.5 scenarios, respectively. The Barak sub-basin experienced a moderately increased flow (about 20% under the SSP5-8.5 scenario) at Sheola during the near future, but by the end of the century, the most affected months were April (24% and 33% increase under SSP2-4.5 and SSP5-8.5 scenarios, respectively) and May (59% and 82% increase under SSP2-4.5 and SSP5-8.5 scenarios). At the three outlets in the Tripura sub-basin (Kamalganj, Shaistaganj, Monu Railway Bridge), the most affected month was May, as the monthly flow changed significantly during all three timelines. The mean flow of May increased by 2–46% and 17–83% in the near future; 27–44% and 71–86% in the mid-future; 43–61%, and 106–138% in the far future under SSP2-4.5 and SSP5-8.5 scenarios, respectively. Figure 6 and Figure 7 illustrate how the monthly mean flow is expected to increase at the major outlets of these three sub-basins under two climate scenarios.
Overall, it was observed that by the end of this century, April, May, and June would be the three months in which the flow would significantly increase at almost all selected outlets in the three sub-basins. Additionally, the findings underwent further analysis through the categorization of all months into two distinct periods: the wet season spanning from May to October, and the dry season spanning from November to April [33]. In seasonal analysis, a severe increase in flow patterns was observed during the wet months compared to dry months as the timeline approached the end of the century. Details of the analysis conducted on the changes in the future seasonal flow are provided in Table 5 and Table 6. During the wet period, the flow would experience an increase of 18–28% under the SSP2-4.5 scenario, while the increase in flow would be 47–66% for extreme cases (SSP5-8.5) across the three sub-basins. Consequently, heavy monsoon floods are expected in the future downstream of the catchment, where the flood prone Haor region lies.

3.2.3. Changes in Design Flow at Different Return Periods

To establish the relationship between the severity of extreme hydrological events, such as monsoon floods, and their frequency, probability distribution functions (PDFs) were applied to annual maximum river flow data at six outlets, both for historical and future timeframes. This investigation explored six probability distribution functions, i.e., 2-Parameter Log-Normal (LN2), 3-Parameter Log-Normal (LN3), Pearson Type III (P3), Log Pearson Type III (LP3), Gumbel Distribution (Gumbel), and the Generalized Extreme Value (GEV), for fitting river gauge data [49,50,51]. Statistical parameters, i.e., the Probability Plot Correlation Coefficient (PPCC), the Root-Mean-Square Deviation (RMSD), and the Chi-square test (χ2) were utilized to select the most appropriate distribution function for each station. These analyses were conducted to assess the goodness of fit of the distribution functions. Eventually, based on the best distribution for a station, design flows for a 100-year return period were computed considering three future time periods, and comparisons were made with respect to the baseline period (1985–2014).
According to the results, the changing nature of the design flows was always on the increasing side for all the stations under both SSP2-4.5 and SSP5-8.5 scenarios as time progressed. Although a moderate increase in 100-year flows was observed at almost all the stations under the SSP2-4.5 scenario, a significant increase was observed under the SSP5-8.5 scenario. Overall, the stations located in the Meghalaya sub-basins showed the largest percentage of change in design flows. By the end of the 21st century, the 100-year discharges would increase by 13–28% under the SSP2-4.5 scenario, while it would increase by almost 40–59% under the SSP5-8.5 scenario across all the outlets of these three sub-basins. Estimated changes in future design flow at these stations under both scenarios, with respect to the baseline period, are shown in Table 7. Under the SSP5-8.5 scenario, the extreme flow variations seemed to be increasing up to the mid-future, which later showed a slightly lower increasing trend in all the stations. However, the case was a little bit different for the SSP2-4.5 scenario. The changing rate (increasing) of 100-year flows at three stations slightly slowed down during the mid-future and then again started increasing significantly, while for the remaining stations, the rate slowed down as the timeline progressed near the end of the century.

4. Discussion

One of the major goals of this study was to develop individual ‘sub-basin scale’ SWAT models, as regional-scale models generally compromise the quality of local performance at the sub-basin scale and are therefore unable to exhibit good performance at all locations. Past studies [30,31] showed that catchment-based models performed better with low uncertainty compared to global or regional hydrologic models. In the current work, three separate models were developed for the major three sub-basins (Barak, Meghalaya, Tripura). The outcome of the sensitivity analysis, performed by SWAT-CUP, varied, and different sets of parameters were found to be sensitive for each of the SWAT models. This is probably because the three sub-basins were unique in terms of geographical (elevation, soil types, land use, slope) and meteorological (precipitation, temperature) aspects. This implies that splitting the whole Meghna basin into its major three sub-basins was a justified approach.
Another primary focus of the current work was to conduct a comparison between single-site and multi-site calibration approaches. While single-site calibration may not be appropriate for basins with complex and spatially varied characteristics [52], the multi-site calibration approach is expected to be able to deal with high spatial variability [53,54] and further improve hydrologic simulations. In this regard, the Meghalaya and the Tripura sub-basins were calibrated and validated at single or multiple stations. The multi-site calibration could not be applied to the Barak sub-basin mainly because of data scarcity (lack of long-term quality data at multiple locations). No definite conclusion could be drawn from the results of the Meghalaya and the Tripura sub-basins. For the Tripura basin, the single-site model (Tripura-01) performed well, while for the Meghalaya basin, the multi-site (Meghalaya-02) model performed well. A past study [27] also performed a multi-site calibration approach in this basin using a modified SWAT model for riparian wetlands (SWATrw). Although the SWATrw showed an overall good performance, they found unsatisfactory model performance (NSE < 0.5, RSR > 0.5, PBIAS > ±25%) as per the goodness of fit criteria [55] for Islampur, Kamalganj, and Shaistaganj, as observed in the current study. Several previous studies also experienced similar outcomes where the multi-site calibration approach was not found to be significantly better with respect to the single-site calibration approach [53,56,57]. However, multi-site calibration procedures were found to be more sensitive to errors compared to single-site calibration [53]. One of the probable reasons for the poor results could be the failure of the model to translate the rainfall into runoff [56]. Therefore, we feel that further investigation is required to assess whether multi-site calibration is better for hydrologic modeling.
The overall results obtained in this study suggest that future flow will be more extreme in terms of magnitude and frequency in the UMRB. Simulated future flows in the UMRB obtained in this current study based on CMIP6 projections were compared with several previous estimates based on CMIP5 projections [20,26,27,33,34,35]. This study projected that, with the progression toward the end of the 21st century, the characteristics of the average annual maximum flow alterations would always be on the increasing side (a maximum increase of 20–30% and 34–59%, respectively, for near- and far-future timelines) at different stations under SSP5-8.5 scenarios. The anticipated alterations in yearly peak flow closely align with the findings reported by Masood et al., 2015 [33] and Whitehead et al., 2018 [34]. In their study, Masood et al., 2015 [33] forecasted a rise of 19.1% and 39.7% in yearly water flow within the Meghna Basin for the near (2015–2039) and far future (2075–2099) when contrasted with the reference period (1979–2003). This projection was based on simulations using five CMIP5 GCMs under the extreme RCP8.5 scenario. Whitehead et al., 2018 [34] also simulated the future flows in the Meghna Basin and found an increase of 35.2% and 86.9%, respectively, in the 2050s (2041–2060) and 2090s (2079–2098) using three CMIP5 models under RCP8.5. The analysis of monthly mean flows in this current study reveals that the future flow will be increased significantly (maximum increment > 80%) in April, May, and June in the far future (2076–2100) at almost all the outlets. However, this is slightly inconsistent with the results of Narzis, 2020 [26], who simulated a SWAT model for the UMRB using four CORDEX Regional Climate Models, projecting a maximum increment of the monthly flow in June under RCP4.5 and in August under RCP8.5 for the 2080s (2070–2099). From the seasonal perspective, the present study indicates that the flow during the wet season will be more significantly impacted across all projected timelines compared to the flow during the dry season. This projection is similar to the results obtained by Masood et al., 2015 [33], where they found a 41.8% and 24.2% increase in the wet and dry months, respectively, under RCP8.5. Our result is also consistent with the findings of Rahman et al., 2019 [27] and Narzis, 2020 [26], who also reported a significant increase in future flows during wet monsoon months (June-September). Under the extreme climate condition (SSP5-8.5), the current study reported that 100-year flows would increase almost 23–37% during the near future (2026–2050) and 46–68% during the mid-future (2051–2075) in the three sub-basins of the UMRB. This aligns with the observations made by Mohammed et al., 2018 [20], who projected that the 100-year return flow in the Meghna Basin would increase by 38% and 81% at 2 °C and 4 °C warming levels, respectively. In most of the cases, the percent increase in future flows was somewhat different for CMIP5-based projections compared to CMIP6-based projections [34]. The probable reasons for the differences could be the use of different spatial datasets, observed climate data, and hydrological models used in these studies. Additionally, differences observed between CMIP5-based studies and the current study based on CMIP6 projections could be a result of the different methods undertaken for the bias-adjustment and downscaling of these CMIP models [34]. These climate-forcing models may introduce a significant amount of uncertainties during the assessment of climate change impacts [58,59].
Although this study provided some significant results regarding the future flow characteristics in the UMRB, it has some limitations. For instance, daily precipitation and temperature data from WFDE5, with a resolution of 0.5 degrees, were utilized during the model development phase, whereas other weather variables (solar radiation, wind, humidity) were extracted at a 1-degree resolution. Higher-resolution climate data at sub-daily frequency could simulate future flow and flood scenarios more accurately. There was also a lack of continuous long-term discharge data, which led to the usage of rating curves using corresponding water levels. Moreover, no definite conclusion regarding single-site and multi-site calibration strategies could be made from the outcomes for the Meghalaya and Tripura sub-basins. In this regard, further investigation is required by incorporating more stations for calibration and validation based on the data availability. In addition, flows for different timelines were simulated without considering any land-use change to avoid complexity. However, in reality, land-use and land-class management undergo continuous change. Hence, more realistic results could be obtained if we could consider changing land management practices and urban growth.

5. Conclusions

For better planning and decision-making, it is imperative to know about future flows under different climate change scenarios, as it would help us to become aware of and prepare adequately for any climatic hazards. This study is mainly designed to provide a near idea of the climate change impacts on the intensity and frequency of floods and water availability in the Meghna River basin.
Individual SWAT models were developed in this study for three major sub-basins; however, no definite conclusion could be drawn from the model performance of single-site and multi-site calibration strategies. It is anticipated that more studies are needed with different calibration approaches of hydrologic models to obtain a clear answer in this regard. The probability distributions of future flows are projected to shift rightwards, indicating more extreme high flows to be expected in this region. The monthly assessment of future flow also disclosed that flows in April, May, and June would be mostly affected due to climate change. Further results on future flow revealed that dry season flows would be less affected compared to wet periods across the sub-basins. In terms of spatial perspectives, it was found that the outlets of the Meghalaya sub-basin would experience the maximum amount of change in the upcoming decades (than the Barak and the Tripura sub-basins). Moreover, the 100-year flows were found to increase in the coming future for almost all the stations under both SSP2-4.5 and SSP5-8.5 scenarios. The overall results indicate a significant increase in flooding in terms of magnitude and frequency, and this may cause long-lasting impacts on the downstream Haor region. Therefore, water resource planners need to develop a comprehensive water resource management plan in this basin to cope with the floods and to save infrastructures.

Author Contributions

Conceptualization, W.B.M. and N.J.; Data curation, W.B.M. and F.A.; Methodology, W.B.M. and N.J.; Software: W.B.M.; Supervision: N.J.; Visualization, W.B.M., N.J., F.A. and A.R.; Writing-original draft, W.B.M. and N.J.; Writing-review and editing, W.B.M., N.J., A.R. and F.A. All authors have read and agreed to the published version of the manuscript.

Funding

This research received no external funding.

Data Availability Statement

The datasets generated and analyzed during the current study are available from the corresponding author upon reasonable request.

Conflicts of Interest

The authors declare no conflicts of interest.

Appendix A

Table A1. Characteristics of the three sub-basins of the Upper Meghna River Basin.
AttributesMeghalayaBarakTripura
Area7642 km228,074 km210,895 km2
LocationNortheastern IndiaNagaland, Assam, Mizoram, ManipurEastern India
Precipitation2605–2878 mm
(2311 mm)
1682–1817 mm
(1749 mm)
2207–2415 mm
(2311 mm)
Elevation Range7–1890 m11–1931 m3–472 m
Slope Distributionmajority > 35%majority > 35%majority 10–35%
Dominant
Soil group
Ao75-2b-3647, Ao78-3c-3649, Ao74-2b-3646Bh16-2-3c-4301, Bd61-2c-3665Bd61-2c-3665, Ge51-2a-3707
Dominant
LULC
Grass-ranges (~50%) along with Forests (25–40%)Grass-ranges (~50%) along with Forests (25–40%)Agricultural lands and Grass-ranges (42%, 31%)
Table A2. Calibration parameters used for the SWAT models.
Parameter Name *DescriptionInitial Value Range **
R_CN2.mgtSCS runoff curve number for antecedent moisture condition II−0.2 to 0.2
V_ALPHA_BF.gwBase flow alpha-factor (1/days)0.0 to 1.0
V_GW_DELAY.gwGroundwater delay (days)30.0 to 450.0
V_GWQMN.gwThreshold depth of water in the shallow aquifer required for return flow to occur (mm water)0.0 to 2.0
V_GW_REVAP.gwGroundwater ‘revap’ coefficient0.0 to 0.2
R_SOL_AWC.solAvailable water capacity of the soil layer (mm water/ mm soil)−0.2 to 0.4
R_SOL_K.solSaturated hydraulic conductivity (mm/hr)−0.8 to 0.8
R_SOL_BD.solMoist bulk density (gm/cm3)−0.5 to 0.6
A_ESCO.hruSoil evaporation compensation factor0.0 to 0.2
R_EPCO.hruPlant uptake compensation factor0.0 to 0.5
R_HRU_SLP.hruAverage slope steepness (m/m)0.0 to 0.2
R_OV_N.hruManning’s ‘n’ value for overland flow−0.2 to 0.0
R_SLSUBBSN.hruAverage slope length (m)0.0 to 0.2
V_CH_N(2).rteManning’s ‘n’ value for the main channel0.0 to 0.3
V_CH_K(2).rteEffective hydraulic conductivity in main channel alluvium (mm/hr)0.0 to 130.0
Note(s): * V_: the existing parameters needs to be replaced by the given value, A_: the existing parameter is added with the given value and R_: the existing parameter value needs to be multiplied by (1 + the given value). ** Default values were set as the initial values of the considered parameters.
Table A3. Summary of the sensitive parameters for selected model cases.
Sub-basins and Model NameSensitive Parameterp-Valuet-TestFitted Value
Barak-01R_CN2.mgt0.00003−4.3927−0.13811
R_SOL_BD0.00057−3.5796−0.16450
V_ALPHA_BF.gw0.037792.110420.42501
R_SOL_K.sol **0.05329−1.96020.66410
A_ESCO.hru **0.06617−1.86150.03704
Tripura-01R_CN2.mgt0.00011−8.91387−0.09568
A_ESCO.hru **0.05257−1.96624−0.05913
R_HRU_SLP.hru **0.06150−1.825350.10764
Meghalaya-02R_CN2.mgt0.00008−8.69546−0.26041
R_SOL_BD.sol0.00014−3.99517−0.63703
R_HRU_SLP.hru0.00115−3.367520.07218
R_SOL_K.sol0.01231−2.55825−0.41086
V_CH_K(2).rte0.016092.4563381.8464
V_GW_DELAY.gw **0.05746−1.9262465.4086
Note(s): ** Parameters were not sensitive in terms of p-value (>0.05) but the values were still adjusted within the model.
Figure A1. Gridded climate data points (observed) in the Meghna River basin.
Water 16 01117 g0a1
Figure A2. Locations of the CMIP6 climate data (projected) in the Meghna River basin.
Water 16 01117 g0a2

References

  1. Kundu, A.; Dwivedi, S.; Chandra, V. Precipitation Trend Analysis over Eastern Region of India Using Cmip5 Based Climatic Models. ISPRS—International Archives of the Photogrammetry. Remote Sens. Spat. Inf. Sci. 2014, 8, 1437–1442. [Google Scholar]
  2. Khaing, M. Multi-Model Analysis of the Climate Change Impact and Adaptation of Hydropower Generation in the Myitnge River Basin. Master’s Thesis, Asian Institute of Technology, School of Engineering and Technology, Khlong Nueng, Thailand, 2014. [Google Scholar]
  3. Mirza, M.M.Q.; Warrick, R.A.; Ericksen, N.J. The implications of climate change on floods of the Ganges, Brahmaputra and Meghna rivers in Bangladesh. Clim. Chang. 2003, 57, 287–318. [Google Scholar] [CrossRef]
  4. Mirza, M.Q.; Dixit, A. Climate Change and Water Management in The GBM Basins. Water Nepal 1997, 5, 71–100. [Google Scholar]
  5. Rangachari, R.; Verghese, B.G. Making water work to translate poverty into prosperity: The Ganga-Brahmaputra-Barak region. In Ganges–Brahmaputra–Meghna Region: A Framework for Sustainable Development; University Press Ltd.: Dhaka, Bangladesh, 2001; pp. 81–142. [Google Scholar]
  6. Masood, M.; Takeuchi, K. Climate change impact on the manageability of floods and droughts of the Ganges-Brahmaputra-Meghna basins using Flood Duration Curves and Drought Duration Curves. J. Disaster Res. 2015, 10, 991–1000. [Google Scholar] [CrossRef]
  7. Oki, T.; Kanae, S. Global hydrological cycles and world water resources. Science 2006, 313, 1068–1072. [Google Scholar] [CrossRef] [PubMed]
  8. Arnell, N.W. Climate change and global water resources. Glob. Environ. Chang. 1999, 9, S31–S49. [Google Scholar] [CrossRef]
  9. Chalov, S.R.; Kasimov, N.S.; Romanchenko, A.O.; Pietron, J.; Thorslund, J.; Promakhova, E.V. Spatio-temporal variation of sediment transport in the Selenga River Basin, Mongolia and Russia. Environ. Earth Sci. 2015, 73, 663–680. [Google Scholar] [CrossRef]
  10. Pechlivanidis, I.G.; Donnelly, C.; Huang, S.; Aich, V.; Samaniego, L.; Eisner, S.; Shi, P. Analysis of hydrological extremes at different hydro-climatic regimes under present and future conditions. Clim. Chang. 2015, 141, 467–481. [Google Scholar] [CrossRef]
  11. Uhe, P.F.; Mitchell, D.M.; Bates, P.D.; Sampson, C.C.; Smith, A.M.; Islam, A.K.M.S. Enhanced flood risk with 1.5 °C global warming in the Ganges–Brahmaputra–Meghna basin. Environ. Res. Lett. 2019, 14, 074031. [Google Scholar] [CrossRef]
  12. Mirza, M.Q. Global warming and changes in the probability of occurrence of floods in Bangladesh and implications. Glob. Environ. Chang. 2002, 12, 127–138. [Google Scholar] [CrossRef]
  13. Immerzeel, W.W.; Van Beek, L.P.; Bierkens, M.F. Climate change will affect the Asian water towers. Science 2010, 328, 1382–1385. [Google Scholar] [CrossRef] [PubMed]
  14. Mohammed, K. Comparative Study of Performance for Real-Time Flash Flood Forecasting in the Upper Meghna Basin. Master’s Thesis, Institute of Water and Flood Management, Bangladesh University of Engineering and Technology (BUET), Dhaka, Bangladesh, 2017. [Google Scholar]
  15. Nishat, A.; Faisal, I.M. An assessment of the Institutional Mechanism for Water Negotiations in the Ganges–Brahmaputra–Meghna system. Int. Negot. 2000, 5, 289–310. [Google Scholar] [CrossRef]
  16. Salehin, M.; Chowdhury, J.U.; Islam, A.K.M.S. Development of a Water Resources Model as a Decision Support Tool for National Water Management; Technical Report; Institute of Water and Flood Management, BUET: Dhaka, Bangladesh, 2011. [Google Scholar]
  17. Hassan, A.; Wahid, S.; Shrestha, M.L.; Rashid, M.A.; Ahmed, T.; Mazumder, A.; Sarker, M.H.; Hossain, B.M.T.H.; Mumu, S.; Sarker, M.H. Climate Change and Water Availability in the Ganges-BrahmaputraMeghna Basin: Impact on Local Crop Production and Policy Directives. In Research Insights on Climate and Water in the Hindu Kush Himalayas; ICIMOD: Kathmandu, Nepal, 2014; p. 97. [Google Scholar]
  18. Islam, M.A.; Islam, S.L.; Hassan, A. Impact of Climate Change on Water with Reference to the Ganges-Brahmaputra-Meghna River Basin. In Chemistry and Water; Elsevier: Amsterdam, The Netherlands, 2017; pp. 121–160. [Google Scholar]
  19. Anand, J.; Gosain, A.K.; Khosa, R.; Srinivasan, R. Regional scale hydrologic modeling for prediction of water balance, analysis of trends in streamflow and variations in streamflow: The case study of the Ganga River basin. J. Hydrol. Reg. Stud. 2018, 16, 32–53. [Google Scholar] [CrossRef]
  20. Mohammed, K.; Islam, A.S.; Islam, G.M.T.; Alferi, L.; Bala, S.K.; Khan, M.J.U. Future floods in Bangladesh under 1.5 °C, 2 °C and 4 °C global warming scenarios. J. Hydrol. Eng. 2018, 23, 04018050. [Google Scholar] [CrossRef]
  21. Mondal, M.S.; Islam, A.S.; Haque, A.; Islam, A.; Biswas, S.; Mohammed, K. Assessing high-end climate change impacts on floods in major rivers of Bangladesh using multi-model simulations. Glob. Sci. Technol. J. 2018, 6, 1–14. [Google Scholar]
  22. Alam, S.; Ali, M.; Rahaman, A.Z.; Islam, Z. Multi-model ensemble projection of mean and extreme streamflow of Brahmaputra River Basin under the impact of climate change. J. Water Clim. Chang. 2021, 12, 2026–2044. [Google Scholar] [CrossRef]
  23. Alam, Z.R.; Rahman, M.M.; Islam, A.K.M.S. Assessment of Climate Change Impact on the Meghna River Basin using Geomorphology Based Hydrological Model (GBHM). In Proceedings of the 3rd International Conference on Water & Flood Management, Dhaka, Bangladesh, 8–10 January 2011. [Google Scholar]
  24. Ali, M.M.; Narzis, A.; Haque, S. Evaluation of Climate Change Scenarios of Upper Meghna River Basin using Hydrologic Modeling system (HEC-HMS). In Proceedings of the 2nd International Conference on Advances in Civil Engineering 2014 (ICACE), Chittagong, Bangladesh, 26–28 December 2014; Volume 3, pp. 54–63. [Google Scholar]
  25. Al Hossain, B.M.T.; Ahmed, T.; Aktar, M.N.; Fida, M.; Khan, A.; Islam, A.S.; Rahaman, A.Z. Climate Change Impacts on Water Availability in the Meghna Basin. In Proceedings of the 5th International Conference on Water & Flood Management, Dhaka, Bangladesh, 6–8 March 2015; pp. 6–8. [Google Scholar]
  26. Narzis, A. Impacts of Climate Change and Upstream Intervention on the Hydrology of the Meghna River Basin Using SWAT. Master’s Thesis, Department of Water Resources Engineering, Bangladesh University of Engineering and Technology (BUET), Dhaka, Bangladesh, 2020. [Google Scholar]
  27. Rahman, M.M.; Thompson, J.R.; Flower, R.J. Hydrological impacts of climate change on rice cultivated riparian wetlands in the Upper Meghna River Basin (Bangladesh and India). Hydrol. Sci. J. 2019, 65, 33–56. [Google Scholar] [CrossRef]
  28. Krysanova, V.; Hattermann, F.; Wechsung, F. Development of the ecohydrological model SWIM for regional impact studies and vulnerability assessment. Hydrol. Process. Int. J. 2005, 19, 763–783. [Google Scholar] [CrossRef]
  29. Qi, C.; Grunwald, S. GIS-based hydrologic modeling in the Sandusky watershed using SWAT. Trans. ASAE 2005, 48, 169–180. [Google Scholar] [CrossRef]
  30. Hattermann, F.F.; Krysanova, V.; Gosling, S.N.; Dankers, R.; Daggupati, P.; Donnelly, C.; Flörke, M.; Huang, S.; Motovilov, Y.; Buda, S.; et al. Cross-scale intercomparison of climate change impacts simulated by regional and global hydrological models in eleven large river basins. Clim. Chang. 2016, 141, 561–576. [Google Scholar] [CrossRef]
  31. Gosling, S.N.; Zaherpour, J.; Mount, N.J.; Hattermann, F.; Dankers, R.; Arheimer, B.; Breuer, L.; Ding Haddeland, I.; Kumar, R.; Kundu, D.; et al. A comparison of changes in river runoff from multiple global and catchment-scale hydrological models under global warming scenarios of 1 °C, 2 °C and 3 °C. Clim. Chang. 2017, 141, 577–595. [Google Scholar] [CrossRef]
  32. Daggupati, P.; Yen, H.; White, M.J.; Srinivasan, R.; Arnold, J.G.; Keitzer, C.S.; Sowa, S.P. Impact of model development, calibration and validation decisions on hydrological simulations in West Lake Erie Basin. Hydrol. Process. 2015, 29, 5307–5320. [Google Scholar] [CrossRef]
  33. Masood, M.; Yeh, P.F.; Hanasaki, N.; Takeuchi, K. Model study of the impacts of future climate change on the hydrology of Ganges–Brahmaputra–Meghna basin. Hydrol. Earth Syst. Sci. 2015, 19, 747–770. [Google Scholar] [CrossRef]
  34. Whitehead, P.G.; Jin, L.; Macadam, I.; Janes, T.; Sarkar, S.; Rodda, H.J.; Sinha, R.; Nicholls, R.J. Modelling impacts of climate change and socio-economic change on the Ganga, Brahmaputra, Meghna, Hooghly and Mahanadi river systems in India and Bangladesh. Sci. Total Environ. 2018, 636, 1362–1372. [Google Scholar] [CrossRef] [PubMed]
  35. Gädeke, A.; Wortmann, M.; Menz, C.; Islam, A.S.; Masood, M.; Krysanova, V.; Lange, S.; Hattermann, F.F. Climate impact emergence and flood peak synchronization projections in the Ganges, Brahmaputra and Meghna basins under CMIP5 and CMIP6 scenarios. Environ. Res. Lett. 2022, 17, 094036. [Google Scholar] [CrossRef]
  36. Kataoka, A.; Satomura, T. Numerical simulation on the diurnal variation of precipitation over northeastern Bangladesh: A case study of an active period 14–21 June 1995. Sola 2005, 1, 205–208. [Google Scholar] [CrossRef]
  37. Lehner, B.; Verdin, K.; Jarvis, A. HydroSHEDS Technical Documentation; World Wildlife Fund US: Washington, DC, USA, 2006; p. 5. [Google Scholar]
  38. Tateishi, R.; Hoan, N.T.; Kobayashi, T.; Alsaaideh, B.; Tana, G.; Phong, D.X. Production of Global Land Cover Data—GLCNMO2008. J. Geogr. Geol. 2014, 6, 99–122. [Google Scholar] [CrossRef]
  39. Hasan, G.M.J.; Alam, R.; Islam, Q.N.; Hossain, M.S. Frequency structure of major rainfall events in the north-east part of Bangladesh. J. Eng. Sci. Technol. 2012, 6, 690–700. [Google Scholar]
  40. Rafiuddin, M.; Uyeda, H.; Islam, M.N. Characteristics of monsoon precipitation systems in and around Bangladesh. Int. J. Clim. 2010, 30, 1042–1055. [Google Scholar] [CrossRef]
  41. Parry, L. Think the weather bad’s here? Spare a thought for these Indian villagers who live in the wettest place in the world with 40 FEET of rain a year. DailyMail, 22 October 2013. [Google Scholar]
  42. CEGIS. Master Plan of Haor Areas; Center for Environmental and Geographic Information Services: Dhaka, Bangladesh, 2012; Volume II. [Google Scholar]
  43. Cucchi, M.; Weedon, G.P.; Amici, A.; Bellouin, N.; Lange, S.; Müller Schmied, H.; Buontempo, C. WFDE5: Bias-adjusted ERA5 reanalysis data for impact studies. Earth Syst. Sci. Data 2020, 12, 2097–2120. [Google Scholar] [CrossRef]
  44. O’Neill, B.C.; Tebaldi, C.; van Vuuren, D.P.; Eyring, V.; Friedlingstein, P.; Hurtt, G.; Knutti, R.; Kriegler, E.; Lamarque, J.F.; Lowe, J.; et al. The scenario model intercomparison project (ScenarioMIP) for CMIP6. Geosci. Model Dev. 2016, 9, 3461–3482. [Google Scholar] [CrossRef]
  45. Mishra, V.; Bhatia, U.; Tiwari, A.D. Bias-corrected climate projections for South asia from coupled model intercomparison project-6. Sci. Data 2020, 7, 338. [Google Scholar] [CrossRef]
  46. Arnold, J.G.; Srinivasan, R.; Muttiah, R.S.; Williams, J.R. Large area hydrologic modeling and assessment part I: Model development 1. JAWRA J. Am. Water Resour. Assoc. 1998, 34, 73–89. [Google Scholar] [CrossRef]
  47. Abbaspour, K.C. Swat-Cup 2012. SWAT Calibration and Uncertainty Program—A User Manual; Eawag: Dübendorf, Switzerland, 2013; pp. 1–100. [Google Scholar]
  48. Aqnouy, M.; Jamal, S.; Hilal, I.; Bouadila, A.; Navarro Gabriel, J.; Loubna, B.; Reda, A. Assessment of the SWAT Model and the Parameters Affecting the Flow Simulation in the Watershed of Oued Laou (Northern Morocco). Ecol. Eng. 2019, 20, 104–113. [Google Scholar]
  49. Greenwood, J.A.; Landwehr, J.M.; Matalas, N.C.; Wallis, J.R. Probability weighted moments: Definition and relation to parameters of several distributions expressable in inverse form. Water Resour. Res. 1979, 15, 1049–1054. [Google Scholar] [CrossRef]
  50. Stedinger, J.R. Fitting log normal distributions to hydrologic data. Water Resour. Res. 1980, 16, 481–490. [Google Scholar] [CrossRef]
  51. Pilgrim, D.H.; Rowbottom, I.A.; Doran, D.G. Development of design procedures for extreme floods in Australia. In Application of Frequency and Risk in Water Resources, Proceedings of the International Symposium on Flood Frequency and Risk Analyses, Louisiana State University, Baton Rouge, LA, USA, 14–17 May 1986; Springer: Amsterdam, The Netherlands, 1987; pp. 63–77. [Google Scholar]
  52. Bannwarth, M.A.; Hugenschmidt, C.; Sangchan, W.; Lamers, M.; Ingwersen, J.; Ziegler, A.D.; Streck, T. Simulation of stream flow components in a mountainous catchment in northern Thailand with SWAT, using the ANSELM calibration approach. Hydrol. Process. 2015, 29, 1340–1352. [Google Scholar] [CrossRef]
  53. Lerat, J.; Andréassian, V.; Perrin, C.; Vaze, J.; Perraud, J.M.; Ribstein, P.; Loumagne, C. Do internal flow measurements improve the calibration of rainfall-runoff models? Water Resour. Res. 2012, 48, W02511. [Google Scholar] [CrossRef]
  54. Niu, J.; Shen, C.; Li, S.G.; Phanikumar, M.S. Quantifying storage changes in regional Great Lakes watersheds using a coupled subsurface-land surface process model and GRACE, MODIS products. Water Resour. Res. 2014, 50, 7359–7377. [Google Scholar] [CrossRef]
  55. Moriasi, D.N.; Arnold, J.G.; Van Liew, M.W.; Bingner, R.L.; Harmel, R.D.; Veith, T.L. Model evaluation guidelines for systematic quantification of accuracy in watershed simulations. Trans. ASABE 2007, 50, 885–900. [Google Scholar] [CrossRef]
  56. Shrestha, M.K.; Recknagel, F.; Frizenschaf, J.; Meyer, W. Assessing SWAT models based on single and multi-site calibration for the simulation of flow and nutrient loads in the semi-arid Onkaparinga catchment in South Australia. Agric. Water Manag. 2016, 175, 61–71. [Google Scholar] [CrossRef]
  57. Franco, A.C.L.; Oliveira, D.Y.D.; Bonumá, N.B. Comparison of single-site, multi-site and multi-variable SWAT calibration strategies. Hydrol. Sci. J. 2020, 65, 2376–2389. [Google Scholar] [CrossRef]
  58. Gädeke, A.; Hölzel, H.; Koch, H.; Pohle, I.; Grünewald, U. Analysis of uncertainties in the hydrological response of a model-based climate change impact assessment in a subcatchment of the Spree River, Germany. Hydrol. Process. 2014, 28, 3978–3998. [Google Scholar] [CrossRef]
  59. Hattermann, F.F.; Vetter, T.; Breuer, L.; Su, B.; Daggupati, P.; Donnelly, C.; Fekete, B.; Flörke, F.; Gosling, S.N.; Krysnaova, V. Sources of uncertainty in hydrological climate impact assessment: A cross-scale study. Environ. Res. Lett. 2018, 13, 015006. [Google Scholar] [CrossRef]
Figure 1. Location of Barak, Tripura, and Meghalaya sub-basins within the UMRB. On the inset, the surrounding region of the UMRB has been shown where the red box represents the region of interest.
Water 16 01117 g001
Figure 2. Flow diagram of the methodology.
Water 16 01117 g002
Figure 3. Observed versus Simulated Flow at Sheola (a-2) in the Barak sub-basin, at Kamalganj (b-2) in the Tripura sub-basin, and at Islampur (c-2) and Muslimpur (c-3) in the Meghalaya sub-basin. Here, the upper panels (a-1,b-1,c-1) represent the basin averaged monthly precipitation.
Water 16 01117 g003
Figure 4. Projected annual maximum flow at Sheola (a), Islampur (b), Muslimpur (c), Kamalganj (d), Shaistaganj (e), and Monu Railway Bridge (f) for different scenarios. Solid red and blue lines show the ensemble mean of 13 GCMs and the shaded red and blue region shows the 2.5th to 97.5th percentile range.
Water 16 01117 g004
Figure 5. Probability density function of annual maximum flow at Sheola (a-1,a-2), Kamalganj (b-1,b-2), Shaistaganj (c-1,c-2), Monu Railway Bridge (d-1,d-2), Islampur (e-1,e-2), and Muslimpur (f-1,f-2) for different time periods. Here, the left panels represent SSP2-4.5 scenarios whereas the right panels represent SSP5-8.5 scenarios.
Water 16 01117 g005
Figure 6. Changes in monthly mean flow at Sheola (a), Islampur (b), Muslimpur (c), Kamalganj (d), Shaistaganj (e), and Monu Railway Bridge (f) under SSP2-4.5. The points below and above the whiskers represent the outliers.
Water 16 01117 g006
Figure 7. Changes in monthly mean flow at Sheola (a), Islampur (b), Muslimpur (c), Kamalganj (d), Shaistaganj (e), and Monu Railway Bridge (f) under SSP5-8.5. The points below and above the whiskers represent the outliers.
Water 16 01117 g007
Table 1. Model development strategies for the individual SWAT models.
BasinSub-BasinCalibrationModel/Case Name
Upper Meghna River Basin (UMRB)Barakat one locationBarak-01
Tripuraat one locationTripura-01
at two locationsTripura-02
at three locationsTripura-03
Meghalayaat one locationMeghalaya-01
at two locationsMeghalaya-02
Table 2. Descriptions of 13 GCMs considered in this study.
Model NameOriginal Resolution
(Degree)
Downscaled Resolution (Degree)Scenarios (SSP)CountryInstitute
ACCESS-CM21.25 × 1.8750.25 × 0.25SSP2-4.5
SSP5-8.5
AustraliaCentre of Excellence for Climate System Science
ACCESS-ESM1-51.25 × 1.875
BCC-CSM2-MR1.1215 × 1.125ChinaBeijing Climate Centre
CanESM52.7906 × 2.8125CanadaCanadian Centre for Climate Modeling and Analysis
EC-Earth30.7018 × 0.703125EUEC-Earth Consortium
EC-Earth3-Veg0.7018 × 0.703125
INM-CM4-81.5 × 2RussiaInstitute for Numerical Mathematics
INM-CM5-01.5 × 2
MPI-ESM1-2-HR0.9351 × 0.9375GermanyMax Planck Institute for Meteorology (MPI-M)
MPI-ESM1-2-LR1.8653 × 1.875
MRI-ESM2-01.1215 × 1.125JapanMeteorological Research Institute
NorESM2-LM1.8947 × 2.5NorwayThe Norwegian Earth System Model
NorESM2- MM0.9424 × 1.25
Table 3. Performance of different models considering single-site or multisite calibration.
Sub-Basins and Model NameCalibration LocationCalibration (1996–2010)Validation (2011–2018)
R2NSERSRR2NSERSR
Barak-01Sheola0.820.630.610.820.600.62
Tripura-01Kamalganj0.760.720.620.910.860.38
Tripura-02Kamalganj0.540.420.760.450.220.88
Monu Rly.0.560.480.720.420.241.12
Tripura-03Kamalganj0.670.600.630.850.670.57
Monu Rly.0.800.780.470.870.440.75
Shaistaganj0.830.650.590.680.060.97
Meghalaya-01Muslimpur0.850.840.400.860.830.42
Meghalaya-02Muslimpur0.850.830.410.840.810.44
Islampur0.650.600.630.790.720.53
Table 4. Changes (%) in mean annual maximum flow for different scenarios.
Station Name Near Future (2026–2050)Mid-Future (2051–2075)Far Future (2076–2100)
SSP2-4.5SSP5-8.5SSP2-4.5SSP5-8.5SSP2-4.5SSP5-8.5
Sheola9.0520.8313.9626.8716.1834.37
Kamalganj13.8824.5816.8838.3019.5043.81
Monu Rly10.6120.6215.2331.9117.7337.39
Shaistaganj10.8722.3315.9833.7019.7642.14
Muslimpur17.0727.8521.1746.4321.2755.10
Islampur14.3330.8020.8650.1225.5458.86
Table 5. Changes (%) in seasonal flow pattern during dry period.
Station Name and IDNear Future (2026–2050)Mid-Future (2051–2075)Far Future (2076–2100)
SSP2-4.5SSP5-8.5SSP2-4.5SSP5-8.5SSP2-4.5SSP5-8.5
Sheola0.523.462.5413.852.9732.00
Kamalganj6.009.608.3728.044.8449.53
Monu Rly3.425.225.4619.962.9937.92
Shaistaganj5.979.569.5327.095.9449.87
Muslimpur6.309.697.9219.588.7531.15
Islampur6.239.319.4622.0811.6439.04
Table 6. Changes (%) in seasonal flow pattern during wet period.
Station Name and IDNear Future (2026–2050)Mid-Future (2051–2075)Far Future (2076–2100)
SSP2-4.5SSP5-8.5SSP2-4.5SSP5-8.5SSP2-4.5SSP5-8.5
Sheola7.7515.6414.4130.4018.0946.98
Kamalganj9.5621.0221.3848.0227.7565.95
Monu Rly6.8915.6416.4436.8221.1450.53
Shaistaganj9.3218.8821.5145.9927.4163.71
Muslimpur12.1821.0819.9144.0124.1263.64
Islampur11.7619.0619.0240.8323.6160.82
Table 7. Changes (%) in estimated design flow for a 100-year return period.
Station NameDesignFlow at Baseline
(m3/s)
Near Future
(2026–2050)
Mid-Future
(2051–2075)
Far Future
(2076–2100)
SSP2-4.5SSP5-8.5SSP2-4.5SSP5-8.5SSP2-4.5SSP5-8.5
Sheola3392.5412.1437.4617.3246.3516.8440.32
Kamalganj122.7818.9323.8416.2360.6315.8344.47
Monu Rly371.8315.5523.7415.7647.9913.6842.61
Shaistaganj222.8614.4224.1313.5246.3415.8241.73
Muslimpur152.0214.6635.8525.4661.0924.7355.58
Islampur85.0520.1127.9218.9968.4727.3558.25
Disclaimer/Publisher’s Note: The statements, opinions and data contained in all publications are solely those of the individual author(s) and contributor(s) and not of MDPI and/or the editor(s). MDPI and/or the editor(s) disclaim responsibility for any injury to people or property resulting from any ideas, methods, instructions or products referred to in the content.

