Abstract
This paper characterizes the composition of extracellular polymeric substances (EPSs) in different types of activated sludge (AS) processes and analyzes the biosorption of soluble organics when waste AS (WAS) is mixed with raw wastewater for primary carbon diversion. The fraction of AS organics identified as EPSs was 26% in a membrane bioreactor (MBR), 54% in conventional AS (CAS), and 51% in a trickling filter/solids contact (TF/SC) process. EPSs were found to be approximately 15% carbohydrates, 40% proteins, 40% humics, and 5% uronics in CAS and MBR AS. Biosorption was not correlated to the organic portion (VSS) of the WAS; however, statistically significant correlations were found for the total amount of EPSs (for TF/SC and CAS) and the protein fraction (for TF/SC and MBR) in the VSS. EPSs from different types of AS biosorbed the same amount of soluble organics, removing 1.43 ± 0.15 (n = 16) mg of soluble chemical oxygen demand (sCOD), and 1.20 ± 0.18 (n = 16) mg of truly soluble COD (ffCOD), per mg of cation exchange resin (CER) total extracted EPSs. Utilizing multiple extraction methods in series (CER–base–sulfide) increased EPS extraction yields by nearly 100% relative to CER alone and indicated different EPS fractionization for CAS (a smaller fraction of carbohydrates and a larger fraction of humics).
1. Introduction
Activated sludge (AS) contains various types of bacteria, protozoa, waste solids, and extracellular polymeric substances (EPSs). EPS prevalence and character are dependent on microbial growth phase and environmental conditions, though the mechanisms are not well understood [1]. EPSs consist of a combination of secretions, cell lysis products, hydrolyzed macromolecules, and sorbed organic compounds [1]. EPSs figure into the physicochemical properties of AS including the structure, surface charge, flocculation, settling and dewatering properties, and adsorption ability [1,2]. EPSs also serve as a means for biological functions such as cell-to-cell recognition and communication [2].
The literature suggests that a large fraction of the organic matter contained in AS consists of EPSs [3,4], but due to the dynamic nature of AS processes and wide variations in process types and operating modes, there is no consensus about what exactly constitutes EPSs. EPSs are often categorized as loosely-bound EPSs, tightly bound EPSs, and soluble EPSs, also referred to as soluble microbial products (SMPs) [1]. Physicochemical properties of the sludge are typically attributed to the bound portion of the EPSs, though some studies suggest that the SMPs may also play a role [1]. The SMPs can be separated using centrifugation, but the extraction of bound EPSs requires physical or chemical treatment in order for them to be released from the cell matrix before centrifugation [5]. The most common method is the cation exchange resin (CER) method.
Biosorption is a physicochemical process where AS acts as a sorbent that uptakes external nutrients and compounds from a sorbate—such as raw, untreated wastewater (WW)—into its cell matrix. In this process, the particulate and soluble organic matter contained in the WW adsorbs onto the AS flocs. Conventional primary wastewater treatment (gravity sedimentation) is effective at removing particulate organic matter, but ineffective in the removal of soluble organics. The soluble organics are generally oxidized during secondary treatment via high-energy-consuming aeration that can account for up to half of the total cost of treating wastewater. Advanced primary treatment can be used to increase the amount of particulate and/or soluble forms of organic carbon diverted in sludge to anaerobic digestion for increased methane gas production and the concomitant reduction of aeration energy needs in downstream secondary treatment. The high-rate biological contactor (HRBC) is a new primary treatment process that removes particulate organic matter and a portion of soluble organic matter by means of biosorption using waste AS (WAS) as biosorbent [6], followed by dissolved air flotation (DAF). The contactor operates with a short hydraulic retention time (HRT) (30 min or less) and low dissolved oxygen (DO) concentration (1.0 mg L−1 or less) to affect biosorption for enhanced carbon diversion. Carbon captured in this way (in DAF float) can be converted into energy (anaerobic digestion to methane to electricity/heat) rather than consuming energy for oxidation to carbon dioxide in secondary AS treatment. High biomethane potential (BMP) values for the DAF float in a pilot test using WAS from a trickling filter/solids contact (TF/SC) found that the oxidation of the sorbed organic matter in the HRBC was not significant [6].
EPSs in AS have been shown to have a prominent role in biosorption of heavy metals [7]. It has been shown that the properties of AS have a larger influence on biosorption than the properties of the influent wastewater [6]. In a prior study [8] using only WAS from a TF/SC process, total EPSs and the protein fraction of EPSs were statistically correlated to the removal of soluble chemical oxygen demand (sCOD) and truly soluble COD (ffCOD). The present study evaluates biosorption using WAS from a membrane bioreactor AS (MBR) process and a conventional AS (CAS) process in addition to TF/SC in a lab-scale HRBC to determine whether the type of AS makes a difference. Prior studies have evaluated the effect of extraction time on the CER method [8] and found that almost four times more EPSs were recovered with a 24 h extraction time rather than the more standard 0.75 h extraction period. Thus, CER extraction durations of 24 h were utilized in the present study. Because there are also other extraction methods available, the present study sought to determine whether three different sequential extractions could yield additional information about EPS fractionation and any new correlations to biosorption.
Though it has been observed that larger EPS concentrations in WAS correlate to more biosorption, it is unknown whether EPSs from different secondary treatment processes behave similarly. This study seeks to identify key compositional fractions of the EPSs responsible for biosorption from three different secondary treatment processes in a bench-scale HRBC.
2. Materials and Methods
2.1. Bench-Scale Biosorption
WW and WAS were collected and transported at ambient temperature and were utilized in tests within two hours of collection. Samples were taken at three different wastewater treatment plants (WWTPs) on the island of O‘ahu, HI treating residential wastewater via different secondary treatment technologies. WWTP A has a trickling filter/solids contact (TF/SC) process, with a constant flowrate of 13.0 million gallons per day (MGD), a solids retention time (SRT) of 1.0 day, and an average influent sCOD of 166 mg L−1. WWTP B has a membrane bioreactor (MBR) process, treating an average daily flow (ADF) of 2.5 MGD, with a SRT of 21 days, and an average influent sCOD of 184 mg L−1. WWTP C has a conventional activated sludge (CAS) process, treating an ADF of 0.6 MGD, with a SRT of 4.7 days, and an average influent sCOD of 288 mg L−1.
A primary treatment HRBC biosorption contact tank was simulated using a bench-scale 5 L plastic tank as described previously [6,8,9]. WW and WAS were mixed at a 5% WAS by volume mixing ratio, while being constantly stirred and aerated to maintain 1.0 mg L−1 dissolved oxygen for a 30 min contact time [6,8,9]. Solid–liquid separation following biosorption utilized a bench-scale dissolved air flotation (DAF) system, as described previously [6,8]. Tap water was pressurized to 413.69 kPa (60 psi) in a pressure vessel which was vigorously shaken for 2 min to ensure good dissolution. A total of 150 mL of pressurized tap water was added to 850 mL of biosorption contactor liquid in a one-liter graduated cylinder, resulting in an air-to-solid (A/S) ratio of 0.01–0.03 kg kg−1, resulting in the formation of a float and a subnatant. After a 3 min flotation time, the subnatant was collected and then pressurized to 413.69 kPa. Because DAF processes use pressurized DAF subnatant instead of tap water, a second batch of 850 mL from the biosorption contactor was subjected to DAF separation using the pressurized subnatant. The subnatant collected from the second batch was used for the analysis of biosorption.
WW, WAS, and DAF effluent (subnatant) were analyzed to examine and quantify biosorption. Total chemical oxygen demand (COD), soluble (1.5 µm filtered) COD (sCOD), truly soluble COD (both readily biodegradable and un-biodegradable) which is filtered and flocculated (ffCOD), total suspended solids (TSS), and volatile suspended solids (VSS) were measured based on Standard Methods [10] and according to previous studies [9]. Normalized removals of the various types of COD were calculated by dividing the removed COD by the mass of VSS in the WAS added to the biosorption contactor (mg sCOD removed per g VSS, and mg ffCOD removed per g VSS).
2.2. EPS Extraction and Characterization
Three extraction methods were used to extract EPSs from sludge samples. The primary extraction method used was the CER method [11], with an extraction time of 24 h. The typical extraction time used is 0.75 h; however, our prior work showed that extracted amounts of EPSs increase 3.5 times with an extraction time of 24 h. The CER method targets calcium- and magnesium-bound EPSs. The base extraction and sulfide extraction methods described by Park et al. [12] were also utilized because they target EPSs bound to different cations. CER, base, and sulfide extractions were conducted both in parallel and in series. Sludge pellets were rinsed and resuspended to original volumes with deionized water between extractions when conducted in series. The extracted EPS samples were characterized and measured using colorimetric methods [4,13] for concentrations of proteins [14], carbohydrates [15], humic acids [11], and uronic acids [16]. The amounts of EPSs were normalized per gram VSS subjected to extraction.
3. Results and Discussion
3.1. EPS Extraction and Characterization
Table 1 shows the chemical composition of the WAS from the three different WWTPs in this study using the CER extraction method with a 24 h extraction time. A total of 28–35% of the organic fraction of the WAS was extracted as EPSs from the CAS facility, 25–30% from the TF/SC facility, and 14–15% from the MBR facility. CAS systems select for a sludge that has good settling properties due to large flocs with bacteria, protozoa, cell debris, and colloids enmeshed together with “sticky” EPSs. TF/SC systems are a combination of biofilm slough from the TF and AS which also selects for good settleability and is indicated by a very similar EPS fraction to CAS. Dissimilarly, MBRs employ a membrane for solids separation and retention and do not select for settleability and thus appear to only have about 50% as much EPS concentration as CAS and TF/SC. This would agree with the idea that MBRs operated improperly so as to have high EPS concentrations will experience foaming and/or fouling [17].

Table 1.
EPS composition of WAS using CER extraction (WWTP A; n = 6, WWTP B; n = 5, WWTP C; n = 5).
The absolute amounts of carbohydrates, proteins, humic acids, and uronic acids are also shown in Table 1. The amounts of uronic acids in the EPSs were very similar for the different processes. The fraction of the total EPSs that was carbohydrates is quite similar for the three processes with 12% for the TF/SC, 15% for the CAS, and slightly more for the MBR with 18%. The fraction of proteins for MBR and CAS was similar at 40% and 41%, respectively, while it was lower for TF/SC at 32%. However, these percentages appear to be skewed by the humic acid fraction which is much higher for the TF/SC at 55%. This could be because the wasted sludge produced by biofilm systems are humus sludges. Generalizing, it appears that carbohydrates are the smallest fraction of the EPSs (less than 20%) and the amounts of proteins and humic acids are about the same in magnitude and together make up about 80% of the EPSs (except for TF/SC, which is skewed to humic acids). Other studies have found that humic acids are either the largest or second largest fraction of EPS organics [18]. The sources of humic substances in the sludges include dead microorganisms, animal residues, and plant degradation and polymerization [19].
Figure 1 and Table 2 show the normalized amounts of EPSs extracted using the three different extraction methods (CER, base, and sulfide) in series. The extractions must be conducted in series rather than separately in order to avoid extracting the same EPSs and thus allow the estimation of the “total” extractable EPSs. Because of the nature of the extractions, CER must be conducted first. The base extraction and the sulfide extraction can be performed in either sequence. Figure 1 shows the effect of the extraction sequence with the amount of EPSs extracted, normalized to the volume of WAS. It shows that the CER–base–sulfide sequence yields about a 20% greater amount of total extractable EPSs. Table 2 shows that CER yielded the largest amount of EPSs, then the base, followed by the sulfide extraction method. These findings align with the literature [12]. However, it is notable that the CER method alone only extracts 51–55% of the total extractable EPSs, and thus just using CER “misses” nearly half of the EPSs present in the sludge. The results in Table 2 are also consistent with Table 1 in that the total amounts of EPSs extracted line up as follows: CAS is slightly greater than TF/SC which is nearly double that of MBR.
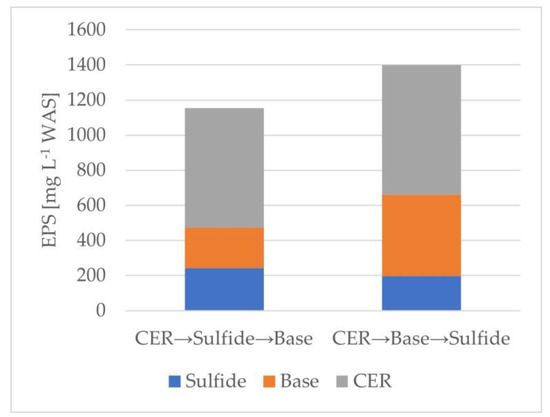
Figure 1.
Average EPS amounts extracted in series (n = 2).
Table 2.
Extraction yields from the varying methods ran in series (A; n = 5, B; n = 5, C; n = 5).
Figure 2 shows the fractionation (carbohydrate, protein, humics, and uronics) of the extracted EPSs from each extraction method (in the series CER–base–sulfide) at each facility as a fraction of the total EPSs extracted. Figure 2 shows that CER extracts more carbohydrates than the other two extraction methods, the base method extracts the most proteins, and the sulfide method extracts the most humics. When looking at the total fractionization of CER alone (which is what most published research does) versus the CER–base–sulfide sequence, there are only slight differences. This fractionation tends to agree with Park et al. [11] that lectin-like proteins linked to polysaccharides were bridged by calcium and magnesium, targeted by the CER, organic materials were linked with aluminum, which can be solubilized at high pH with the base extraction, and biopolymers were bound to iron, which could be removed from the flocs by the formation of FeS in the sulfide extraction. For the TF/SC and MBR processes, the fractions are nearly identical. However, for the CAS process, only using the CER extraction would lead one to believe that the fraction of carbohydrates is larger and the fraction of humics is lower than what they actually are when using all three extractions in series.
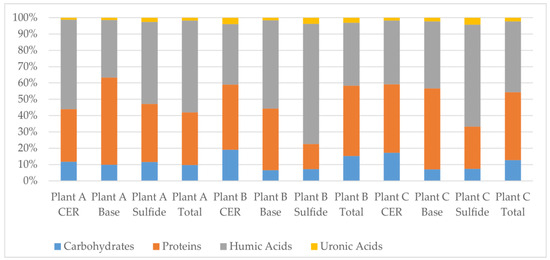
Figure 2.
EPS fractionation of each extraction (sequence CER–base–sulfide) at the three studied plants expressed as percent of total extracted amount (n = 5 for all tests).
3.2. Biosorption Correlation to EPSs
Biosorption experiments measured WAS EPSs as well as concentrations of sCOD and ffCOD in raw wastewater and DAF underflow to calculate removals, which ranged from 30 to 40%. The removed mass of COD was normalized per mass of VSS. Statistical analyses were conducted to determine whether correlations exist between normalized biosorption effectiveness and the amount of VSS, EPSs, or EPS components (carbohydrates, proteins, humics, and uronics) following CER extraction alone. Statistically significant correlations were only found for total EPSs and for the protein fractions, as shown in Table 3. Table 3 shows good statistical correlation for both sCOD and ffCOD removals in relation to the total EPSs and the protein fraction of the EPSs for the TF/SC process WAS (A). For the MBR process WAS (B), the sCOD and ffCOD removals were statistically correlated to the protein fraction of the EPSs. However, for the CAS process WAS (C), only total EPSs were statistically correlated to the sCOD removals. Biosorption removal is not correlated to VSS concentration for any of the three WAS.
Table 3.
Correlation of COD removal with CER-extracted total EPSs and protein EPSs.
Table 4 shows average values of unit mass removal of sCOD and ffCOD per unit mass of CER-extracted EPSs present in the WAS. It shows that that a greater amount of sCOD is removed than ffCOD, which is expected since ffCOD is a subset of sCOD. The data show that each mg of EPSs can remove about 1.4 mg of sCOD (or 1.2 mg of ffCOD). The unit removal rates are very similar for the EPSs in the three different processes, which could indicate that EPSs behave in the same way in each process and are responsible for biosorption. It is noted that such correlations do not exist when considering the VSS in the WAS used for biosorption. There was a large difference in total VSS in the different WAS samples (7500–8000 mg L−1 VSS for the MBR plant and about 3000 mg L−1 for the other two plants). This means that to estimate biosorption effectiveness in an HRBC process, one must measure the amount of EPSs available. If the total EPSs extracted using the sequence of three methods (CER–base–sulfide) were to be used to calculate the values in Table 4, then the unit removal rates would decrease to less than 1.0 because the amount of COD removed is unchanged, but the amount of EPSs nearly doubles.
Table 4.
Mass of soluble and truly soluble COD removed during biosorption per unit mass of total CER-extracted EPSs (A; n = 6, B; n = 5, C; n = 5).
Figure 3 and Figure 4 plot the normalized sCOD and ffCOD organic removals versus the normalized amount of total EPSs extracted via the CER method for the three facilities evaluated. The data show good correlation coefficients of 0.893 and 0.806 for sCOD and ffCOD, respectively. The data also show how the amount of EPSs in the WAS from the MBR process is very consistent (140–150 mg g −1 VSS), while the TF/SC process EPSs vary more widely from about 245 to 300 mg g −1 VSS, and the CAS process EPSs vary from about 275 to 345 mg g −1 VSS.
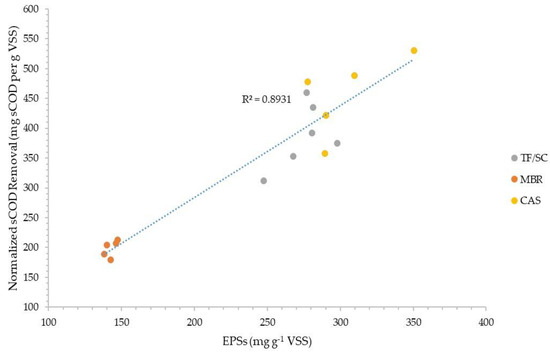
Figure 3.
Normalized soluble COD removal correlation with the amount of CER-extracted EPSs in the organic fraction of WAS.
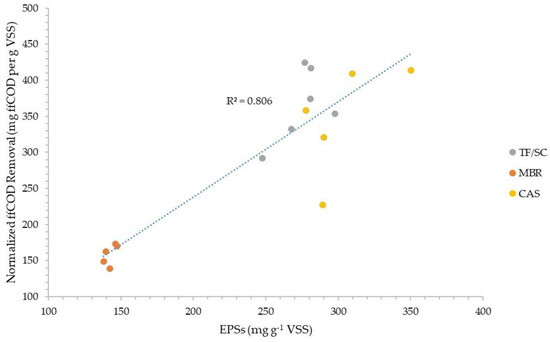
Figure 4.
Normalized truly soluble COD removal correlation with the amount of CER-extracted EPSs in the organic fraction of WAS.
Figure 5 and Figure 6 plot the normalized sCOD and ffCOD organic removals versus the normalized amount of each fraction (carbohydrate, protein, humics, and uronics) of the CER-extracted EPSs for the three facilities evaluated. The data show better correlations of the EPS fractions with sCOD than ffCOD, with correlation coefficients between about 0.61 and 0.75 for carbohydrates, humics, and proteins. For ffCOD, only humics had a relatively good correlation coefficient of about 0.81.
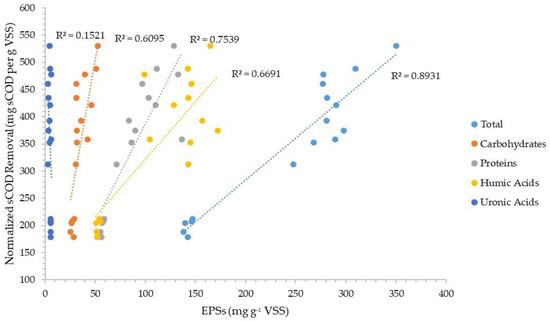
Figure 5.
Normalized soluble COD removal correlation with the four components of CER-extracted EPSs in the organic fraction of WAS.
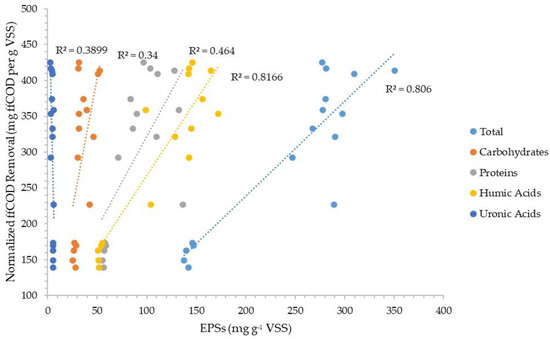
Figure 6.
Normalized truly soluble COD removal correlation with the four components of CER-extracted EPSs in the organic fraction of WAS.
Figure 7 and Figure 8 plot the normalized sCOD and ffCOD organic removals, respectively, versus the normalized CER-extracted total EPSs and the total EPSs extracted through the sequence of three extraction methods (CER–base–sulfide). The plots show slightly better correlations for the sequence of three extractions than the CER extraction alone. The data also show slightly better correlations for ffCOD than sCOD removal for both base and sulfide extractions when used in series.
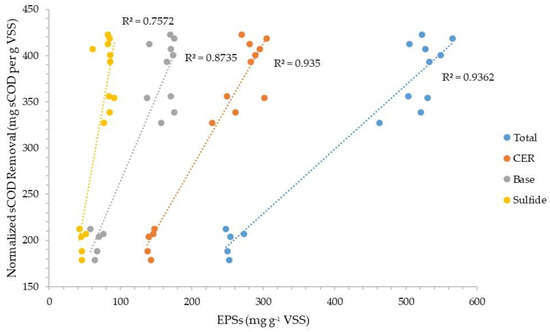
Figure 7.
Normalized soluble COD removal correlation with EPSs extracted via three different methods.
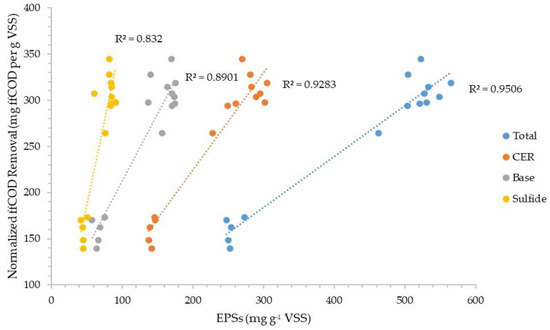
Figure 8.
Normalized truly soluble COD removal correlation with EPSs extracted via three different methods.
3.3. COD Removals with Reduced DO Concentration
Biosorption experiments were repeated for WWTP A (TF/SC) with a reduced DO concentration of 0.5 mg L−1 (instead of 1.0 in all other experiments) in the bench-scale contactor with a 30 min contact time. However, there was an error during the EPS analyses, rendering the data unusable. Thus, because good data existed for VSS, the ratio of 28% EPS/VSS (see Table 1) was used to calculate the amount of total CER-extracted EPSs, and the values of 1.43 ± 0.15 mg sCOD removed per mg CER EPS and 1.20 ± 0.18 mg ffCOD removed per mg CER EPS (see Table 4) were used to calculate removals. Three removal values (low, medium, and high) were calculated; for example, for sCOD: 1.43–0.15 = 1.28, 1.43, and 1.43 + 0.15 = 1.58. The calculated removals are compared to actual measured removals of sCOD and ffCOD in Table 5 and Table 6. This calculation essentially assumes that the biosorption removal of COD per unit mass EPS is the same at a DO of 1.0 mg L−1 and 0.5 mg L−1. The calculated sCOD and ffCOD removals were close to the actual measured sCOD and ffCOD removals. Comparing the average unit removal rate assumption for sCOD (Table 5) shows that the actual removals were somewhat greater. This could mean that there is a potential for greater biosorption (carbon diversion) when the contactor DO is reduced to 0.5 mg L−1. However, the data are less consistent for ffCOD (Table 6), with calculated values mostly equal to or greater than those measured. More experiments are needed to determine whether reducing contactor DO from 1.0 to 0.5 mg L−1 is a method to improve carbon diversion in the HRBC process.
Table 5.
Calculated and measured sCOD removal comparison for five replicate experiments.
Table 6.
Calculated and measured ffCOD removal comparison for five replicate experiments.
4. Conclusions
Biosorption for primary carbon diversion can be accomplished by employing a short-retention contactor where WAS is mixed with raw WW and the DO is maintained relatively low (0.5 to 1.0 mg L−1) to minimize oxidation [6,8,9]. Removal rates of sCOD and ffCOD between 30 and 40% can be achieved with an equivalent reduction in aeration energy requirements in downstream secondary treatment. The quantity of biosorption removal could not be correlated with the amount of VSS in the WAS from any type of AS process in the present study or prior studies [6,8,9]. However, biosorption can be correlated with EPSs, and thus the quantification of EPSs in an AS could potentially be used to predict the potential effectiveness of installing a biosorption process for primary carbon diversion. This study found statistically significant correlations between the biosorption removal of sCOD and ffCOD and the protein fraction of EPSs in the VSS (for TF/SC and MBR), the removal of sCOD and ffCOD and the total amount of EPSs in the VSS (for TF/SC), and the removal of sCOD and the total amount of EPSs in the VSS (for CAS). The mass of sCOD and ffCOD removed per mass of EPSs for the three AS processes ranged from 1.39 ± 0.08 to 1.50 ± 0.18 mg sCOD removed per mg CER-extracted EPSs and from 1.11 ± 0.08 to 1.33 ± 0.15 mg ffCOD removed per mg CER-extracted EPSs, respectively. Because the normalized removals were quite similar for the three AS, all the values were combined to obtain overall average removals of 1.43 ± 0.15 (n = 16) mg sCOD and 1.20 ± 0.18 (n = 16) mg ffCOD per mg CER-extracted EPSs. These values could be used to make predictions of biosorption effectiveness. For example, if a hypothetical 1.0 MGD CAS facility with an influent sCOD of 200 mg L−1 (1,668 lb d−1) might produce approximately 454 kg VSS d−1 that is 30% CER-extracted EPSs (thus, 136 kg EPS d−1), then the removal would be predicted as (136 kg EPSs d−1) × (1.43 kg sCOD per kg EPSs)/(757 kg sCOD d−1) = 0.257 or about 26% removal. This sCOD would be diverted to the solids treatment train and potentially converted to methane during anaerobic digestion instead of being oxidized in secondary treatment.
For WWTP A (TF/SC), it appeared that the sCOD and ffCOD removals could be estimated using the ratio of 28% EPSs/VSS, and 1.43 ± 0.15 mg sCOD removed per mg CER EPSs and 1.20 ± 0.18 mg ffCOD removed per mg CER EPSs when EPS values were not available. The key variables in this estimation are the EPSs/VSS ratio and the normalized removals. Because EPS production in AS is likely dependent on operating conditions such as SRT, loading rates, DO, and wastewater characteristics, these variables should be determined for the AS process for which predictions are needed.
The literature estimates that about 50% of the VSS in AS are EPSs, and this study found that this large fraction was only verifiable when multiple EPS extraction methods were conducted in series. When using the CER method alone with a 24 h extraction period (which is much longer than the typically used 45 min), the fraction of EPSs was only 14 to 30%. The amount of extracted EPSs approximately doubled when using CER, followed by base extraction, followed by sulfide extraction in series. The amounts of EPSs found in different types of AS were similar for CAS (54%) and TF/SC (51%), but much lower (24%) for MBR. The smaller amount of EPSs in the MBR is suggested to be due to selective pressure on CAS and TF/SC to retain a fast-settling sludge morphology, whereas there is no such selection pressure in an MBR. The composition of the EPSs was found to be about 15–18% carbohydrates, 40% proteins, 40% humics, and 4–5% uronics in CAS and MBR sludges. The TF/SC EPSs had a greater proportion of humics (55%) and a corresponding smaller fraction of proteins (35%). Utilizing the three extractions in series, relative to CER alone, indicated different EPS fractionization for CAS (a smaller fraction of carbohydrates and a larger fraction of humics). Utilizing multiple extraction methods in series (CER–base–sulfide) is necessary in order to quantify the total amount of EPSs in AS and to obtain more accurate estimates of the composition of the EPSs.
Author Contributions
Conceptualization, T.P.W. and R.W.B.J.; methodology, T.U., J.S., T.P.W. and R.W.B.J.; validation, T.P.W. and R.W.B.J.; formal analysis, T.U., T.P.W. and R.W.B.J.; investigation, T.U. and T.P.W.; writing—original draft preparation, T.U. and T.P.W.; writing—review and editing, T.P.W. and R.W.B.J.; visualization, T.U., T.P.W. and R.W.B.J.; supervision, T.P.W. and R.W.B.J.; project administration, R.W.B.J.; funding acquisition, R.W.B.J. All authors have read and agreed to the published version of the manuscript.
Funding
This research received funding from the R. M. Towill Corporation.
Data Availability Statement
The original contributions presented in the study are included in the article, further inquiries can be directed to the corresponding author/s.
Conflicts of Interest
The authors declare no conflicts of interest. The funders had no role in the design of the study; in the collection, analyses, or interpretation of data; in the writing of the manuscript, or in the decision to publish the results.
References
- Sheng, G.P.; Yu, H.Q.; Li, X.Y. Extracellular polymeric substances (EPS) of microbial aggregates in biological wastewater treatment systems: A review. Biotechnol. Adv. 2010, 28, 882–894. [Google Scholar] [CrossRef] [PubMed]
- Nouha, K.; Kumar, R.S.; Balasubramanian, S.; Tyagi, R.D. Critical review of EPS production, syntheses and composition for sludge flocculation. J. Environ. Sci. 2018, 66, 225–245. [Google Scholar] [CrossRef] [PubMed]
- Frolund, B.; Palmgren, R.; Keiding, K.; Nielsen, P.H. Extraction of extracellular polymers from activated sludge using a cation exchange resin. Appl. Microbiol. Biotechnol. 1996, 30, 1749–1758. [Google Scholar] [CrossRef]
- Liu, H.; Fang, H.H.P. Extraction of extracellular polymeric substances (EPS) of sludges. J. Biotechnol. 2002, 95, 249–256. [Google Scholar] [CrossRef] [PubMed]
- Wingender, J.; Neu, T.R.; Flemming, H. Microbial Extracellular Polymeric Substances: Characterization, Structure and Function, 1st ed.; Springer: Berlin/Heidelberg, Germany, 1999; p. 58. [Google Scholar]
- Wong, T.P.; Babcock, R.W., Jr.; Hu, B.; Schneider, J.; Milan, S. High rate biological contactor system using waste activated sludge from trickling filter/solids contact process. Water Sci. Technol. 2020, 81, 2202–2210. [Google Scholar] [CrossRef] [PubMed]
- Comte, S.; Guibaud, G.; Baudu, M. Biosorption properties of extracellular polymeric substances (EPS) resulting from activated sludge according to their type: Soluble or bound. Process Biochem. 2006, 41, 815–823. [Google Scholar] [CrossRef]
- Wong, T.P.; Babcock, R.W., Jr.; Uekawa, T.; Schneider, J.; Hu, B. Effects of Waste Activated Sludge Extracellular Polymeric Substances on Biosorption. Water 2022, 14, 218. [Google Scholar] [CrossRef]
- Schneider, J.; Babcock, R.W., Jr.; Wong, T.P.; Hu, B. Effects of Mixing Ratio, Contact Time and Dissolved Oxygen on Efficiency of Biosorption for Primary Carbon Diversion. Int. J. Water Wastewater Treat 2020, 6, 1–7. [Google Scholar]
- American Public Health Association/Amerian Water Works Association/Water Environment Federation. Standard Methods for the Examination of Water and Wastewater, 20th ed.; American Public Health Association/Amerian Water Works Association/Water Environment Federation: Washington, DC, USA, 1999. [Google Scholar]
- Frolund, B.; Griebe, T.; Nielsen, P.H. Enzymatic activity in the activated-sludge floc matrix. Appl. Microbiol. Biotechnol. 1995, 43, 755–761. [Google Scholar] [CrossRef] [PubMed]
- Park, C.; Novak, J.T. Characterization of activated sludge exocellular polymers using several cation-associated extraction methods. Water Res. 2007, 41, 1679–1688. [Google Scholar] [CrossRef] [PubMed]
- Raunkjaer, K.; Hvitved-Jacobsen, T.; Nielsen, P.H. Measurement of Pools of Protein, Carbohydrate and Lipid in Domestic Wastewater. Water Res. 1994, 28, 251–262. [Google Scholar] [CrossRef]
- Waterborg, J.H.; Matthews, H.R. The Lowry Method for Protein Quantitation. In Methods in Molecular Biology, 1st ed.; Walker, J.M., Ed.; Humana Press: Clifton, NJ, USA, 1984; Volume 1, pp. 1–3. [Google Scholar]
- Gaudy, A.F., Jr. Colorimetric Determination of Protein and Carbohydrate. Ind. Water Wastes 1962, 7, 17–22. [Google Scholar]
- Kintner, P.K., III; Buren, J.P.V. Carbohydrate Interference and Its Correction in Pectin Analysis Using the m-Hydroxydiphenyl Method. J. Food Sci. 1982, 47, 756–759. [Google Scholar] [CrossRef]
- Bella, G.D.; Torregrossa, M.; Viviani, G. The role of EPS concentration in MBR foaming: Analysis of a submerged pilot plant. Bioresour. Technol. 2011, 102, 1628–1635. [Google Scholar] [CrossRef] [PubMed]
- Wilén, B.M.; Jin, B.; Lant, P. Relationship between flocculation of activated sludge and composition of extracellular polymeric substances. Water Sci. Technol. 2003, 47, 95–103. [Google Scholar] [CrossRef] [PubMed]
- Wang, Z.; Li, X.; Siddiqui, M.A.; Liu, H.; Zhou, T.; Huang, S.; Gao, L.; Lin, C.Z.K.; Wang, Q. Effect of humic substances on the anaerobic digestion of secondary sludge in wastewater treatment plants; a review. Environ. Chem. Lett. 2023, 21, 3023–3040. [Google Scholar] [CrossRef]
Disclaimer/Publisher’s Note: The statements, opinions and data contained in all publications are solely those of the individual author(s) and contributor(s) and not of MDPI and/or the editor(s). MDPI and/or the editor(s) disclaim responsibility for any injury to people or property resulting from any ideas, methods, instructions or products referred to in the content. |
© 2024 by the authors. Licensee MDPI, Basel, Switzerland. This article is an open access article distributed under the terms and conditions of the Creative Commons Attribution (CC BY) license (https://creativecommons.org/licenses/by/4.0/).