Article

Effects of Phosphate and Arsenate on As Metabolism in Microcystis aeruginosa at Different Growth Phases

1
Key Laboratory of Land Surface Pattern and Simulation, Institute of Geographic Sciences and Natural Resources Research, Chinese Academy of Sciences, Beijing 100101, China
2
University of Chinese Academy of Sciences, Beijing 100049, China
3
School of Environmental and Chemical Engineering, Foshan University, Foshan 528011, China
*
Author to whom correspondence should be addressed.
Water 2024, 16(7), 940; https://doi.org/10.3390/w16070940
Submission received: 24 January 2024 / Revised: 17 March 2024 / Accepted: 19 March 2024 / Published: 25 March 2024

Abstract

:
Arsenic (As) metabolism in freshwater algae at different growth phases has rarely been documented. To address this gap, this study was conducted to assess the intra- and extracellular As metabolism, along with speciation changes, in Microcystis aeruginosa across three growth phases. The treatment involved varying concentrations of As (0, 0.4, 0.6, 0.8 and 1 mg/L, in the form of arsenate, iAsV) under three phosphorus levels (0.02 mg/L as low, 0.1 mg/L as medium, and 0.5 mg/L as high P in the form of phosphate). The findings revealed that extracellular iAsV remained the dominant As species during the lag and exponential growth phases of M. aeruginosa in the growth media, while intracellular trivalent As (iAsIII) emerged as the pronounced species during the exponential growth phase, but also exhibited a significant negative correlation with the P levels. Moreover, elevated P levels had promoted the formation of intra- and extracellular dimethylarsinic acid (DMA) and monomethylarsonic acid (MMA) in the exponential growth phase. During the stationary growth phase, intracellular iAsV was found to decrease with the increasing P levels. During the whole growth phases, P had consistently reduced algal As absorption levels. The significant promotion of algal As absorption in response to iAsV was observed only during the lag growth phase. The As bioaccumulation exhibited a correlational relationship with the algal reproduction. Both low and high P levels (0.02 and 0.5 mg/L) decreased the accumulation of As in algae cells during the exponential and stationary growth phases. The transformation and release rate of As were concomitantly influenced by P, and exhibited the same trends within the growth phase. These trends differed between the exponential and stationary growth phases, with an inhibitory effect being present during the former, while a promotional effect was observed during the latter. This study provides insight into potential As hazards in freshwater lakes with algae bloom.

1. Introduction

Arsenic (As) is a pervasive substance in the environment, and is toxic and carcinogenic. The widespread contamination of terrestrial and aquatic environments with As has received increasing attention over time [1]. In natural waters, As can be found in both inorganic forms (e.g., arsenite (iAsIII) and arsenate (iAsV)) and organic forms (e.g., dimethylarsinic acid (DMA) and monomethylarsonic acid (MMA)) [2]. iAsV dominates in oxidizing environments, and iAsIII dominates in reducing environments [3]. Arsenic toxicity is highly dependent on its chemical form. When compared to inorganic forms, organic forms are relatively less toxic. The International Agency for Research on Cancer (IARC 2012) has categorized inorganic As (iAs) as a Group I carcinogen for causing skin cancer, kidney cancer, and bladder cancer. Generally, water contaminated with As contains more than 10 μg/L As (WHO guideline value) [4], and, in some regions, these levels can reach as high as 1480 μg/L. Therefore, proper remediation techniques must be developed for the removal of iAs from water in order to reduce the human health risks associated with As.
The algal bioremediation of polluted water has gained more attention in recent years, largely as this it may present a promising and environmentally friendly method [5]. Lessonia nigrescens, Chlorella sp., Scenedesmus sp., and M. aeruginosa have been reported to have high As accumulation rates, with potential to be useful in water treatment processes [6,7]. Specifically, M. aeruginosa often dominates in freshwater ecosystems and causes algal blooms, while also showing high tolerance levels to iAsV [8]. Ongoing research has highlighted the potential of this algae to remove and detoxify iAsV via accumulating and transforming the pollutant to a less toxic methylated As species (i.e., MMAV and DMAV) [9]. Accordingly, M. aeruginosa can play a critical role in the absorption of As in aquatic ecosystems [6].
Phosphate (PO43−), a chemical analog of arsenate, has been documented to significantly influence the absorption and biotransformation of iAsV in algae [10]. Once inside the cell, iAsV has the capacity to act as a substitute for PO43− in various biochemical reactions, some of which lead to the toxic effects of As. For instance, iAsV substituted for PO43− interferes with ATP and nucleic acid synthesis. Phosphate, a crucial chemical known to limit growth in numerous eutrophic freshwater environments [11], has the potential to promote the proliferation of undesirable organisms, leading to ecological dominance. Simultaneously, phosphate serves as a phosphorus source for certain algae and cyanobacteria, supporting primary production [12].
Over the past few decades, there has been extensive research and tentative discussions regarding the effects and mechanisms of PO43− on iAsV metabolism in algae [13,14,15]. The chemical similarity between iAsV and PO43− has led to varying bioaccumulation and biotransformation changes in algae. These factors, in turn, affect the biogeochemical cycling of iAsV and algal potential for As absorption [16]. Despite the significant implications, only a limited number of studies on the effects of PO43− on iAsV metabolism in algae have been published to date. The presence of PO43− in the aquatic environment not only influences the iAsV metabolism of algae, but also impacts algal growth [17,18]. Therefore, it is imperative to investigate the iAsV metabolism in algae under different phosphate regimes in order to further advance iAsV absorption.
In this study, we propose a hypothesis that the iAsV metabolism of M. aeruginosa during different growth phases is influenced by extracellular concentrations of phosphate and arsenate. To test this hypothesis and gain a deeper understanding of the ecological risks associated with algal blooms and As metabolism, we conducted experiments focusing on changes in intracellular and extracellular As speciation, as well as absorption, bioaccumulation, transformation, and the release of As by algae at three growth phases (lag, exponential, and stationary growth phase) under varying phosphate and arsenate conditions. The primary objectives of these experiments were (1) to evaluate the impact of phosphate on the algal iAsV metabolism; (2) to evaluate the impact of arsenate on the algal iAsV metabolism; and (3) to provide additional insights into the biogeochemical cycle of As in freshwater systems.

2. Materials and Methods

2.1. Algae Culture and Pretreatment

A strain of M. aeruginosa (FACHB-1322) from the Freshwater Algae Culture Collection at the Institute of Hydrobiology, Chinese Academy of Sciences, was selected for this study. This strain is a widely prevalent algae species in freshwater lakes in China. Before initiating the experiments, algal cells of M. aeruginosa (FACHB-1322) with the optical cell density (OD680) of 0.10 were centrifuged for 15 min at 5000 r·min−1. Subsequently, the algal cells were washed twice with the same volume of sterile ultrapure water in order to minimize any residual As and P attached to cells. The washed M. aeruginosa cells were then transferred to a modified sterilized M11 growth medium [MgSO4·7H2O (11.25 mg), K2HPO4 (1.5 mg), NaNO3 (15 mg), CaCl2·2H2O (6 mg), Na2CO3 (3 mg), Na2·EDTA·2H2O (0.15 mg), all reagents were purchased from Sinopharm Chemical Reagent Co., Ltd., Shanghai, China] at 25 °C under a photon flux density of 40 μmol/m2/s, provided by cool white, fluorescent irradiation, with a 12 h:12 h light/dark interval orbital incubation (125 rpm). To ensure adequate gas exchange, the test flasks were manually rotated and shaken three times during each light cycle. Prior to use, all stock vessels and culture flasks were meticulously cleaned by being soaked in 10% HCl for at least 24 h, followed by rinsing with Milli-Q water, oven drying, autoclaving, and handling under sterile conditions.

2.2. Experimental Design

The algal cells of M. aeruginosa (FACHB-1322) under phosphorus-starved conditions were centrifuged and washed twice with sterile deionized water. Subsequently, they were divided equally into 36 portions (3 P treatments, each with 12 parallels, as shown in Table 1 [19]), and incubated in modified M11 media with KH2PO4 (Sinopharm Chemical Reagent Co., Ltd., Shanghai, China) as the phosphorus source for 96 h. The media contained 0.02, 0.1, and 0.5 mg/L of P in the form of PO43− to simulate As metabolism in freshwater algae, subject to the influence of varying P levels corresponding to different eutrophication statuses (low, medium, and high).
The AsV solution was prepared by dissolving Na3AsO4·12H2O (Sinopharm Chemical Reagent Co., Ltd., Shanghai, China) in deionized water. Subsequently, M. aeruginosa was exposed to 0.4, 0.6, 0.8, and 1 mg/L iAsV at specific As addition time points during each growth period [19] (lag, exponential, and stationary phases, as outlined in Table 2 [19]). The exposure took place in 250 mL Erlenmeyer flasks, containing 100 mL M11 medium with three different P levels, and each treatment was replicated three times (Table 1). After a 2-day exposure to As, 30 mL algal cells from each replicate were harvested via centrifugation (7000× g). Subsequently, the cells were cleaned three times with ice-cold 0.1 mol/L phosphate buffer (pH 7.0, 3.5% salinity to maintain the osmotic balance and cell integrity) for 2 min in order to eliminate any As bound onto the cell surface [15]. Duplicate samples were then freeze-dried, and stored in a desiccator before As speciation analyses.

2.3. Speciation and Content Analysis of Extracellular and Intracellular As

To explore the impact of different PO43− additions (0.02, 0.1 and 0.5 mg/L) on the metabolism of iAsV in M. aeruginosa across the lag, exponential, and stationary growth phases, we collected all algal solutions at the end of the experiments for the iAsV treatment groups (0.4, 0.6, 0.8, and 1 mg/L). The intra- and extracellular total As and As speciation were then assessed in both the media and algal cells. Approximately 0.005 g of freeze-dried algal samples underwent digestion with 2 mL HNO3 (Sinopharm Chemical Reagent Co. Ltd., Shanghai, China) at 120 °C [15]. Total As concentrations were determined using a hydride generation atomic fluorescence photometer (AFS-8230, Beijing Titan Co., Beijing, China). The actual concentration of the As stock solution was determined and verified using As quality control samples in drinking water, which was sourced from the China National Center for Standard Reference Materials. Any remaining As-contained wastes were collected in waste liquid barrels to be disposed of as hazardous waste by a qualified organization.
Arsenic speciation analysis in algal samples followed previously described methods [20]. In summary, freeze-dried cells were extracted with 1.75% HNO3 at 90 °C in three successive cycles. The supernatants were combined and filtered through 0.22 µm nylon syringe filters for As species determination (i.e., iAsIII, DMA, MMA, and iAsV), using high performance liquid chromatography coupled with HG–AFS (HPLC–HG–AFS, SA20, Beijing Titan Co., Beijing, China). The extraction method has demonstrated reliability, maintaining As speciation in M. aeruginosa within such treatments [21,22]. The recovery of As species ranged between 87% and 110% using 1.75% HNO3 extraction, indicating no significant loss or gain for iAsIII and iAsV during the extraction process.

2.4. The Principles and Computation Methods for Various Factors

The algal cell densities varied under different growth conditions. Therefore, in this study, unit cell As concentrations were employed to assess both intra- and extracellular As concentrations [20]. The intracellular As content was computed using Equation (1), while the extracellular As content was determined using Equation (2) [23].
A s i n = C A s i n × V f i x X i + 2 × V s e p
A s e x = C A s e x X i + 2
where
Asin (fg /cell) denotes the intracellular As content per unit cell;
CAs−in (fg/L) signifies the measured intracellular As content in the cells;
Vfix (mL) indicates the final fixed volume;
Vsep (mL) indicates the volume of separated algae;
Asex (fg /cell) indicates the extracellular As content per unit cell;
CAs−ex (f/L) is the concentration of dissolved As in the growing media;
Xi+2 (cells/mL) signifies the algal cell density after 2 days of interaction with iAsV.
However, the intra- and extracellular As concentrations are insufficient for evaluating the biological productivity of As through the use of algal cells [20]. This is because, after part of the exposed As was absorbed by the algae as iAsV, a portion of it might undergo conversion, primarily to iAsIII, and also, to a lesser extent, to DMA and MMA [24]. Therefore, the present study was to further calculate the bioproductivities of As absorption (Asab), bioaccumulation (BCF), transformation (Kt), and release (Kr) from algae through the use of the following equations:
A s a b = A s i n 0 + A s e x 2 + A s e x 3 + A s e x 4
B C F = A s i n 0 A s e x 1 + A s e x 2 + A s e x 3 + A s e x 4 × 100 %
K t = A s a b A s e x 1 A s a b × 100 %
K r = A s e x 2 + A s e x 3 + A s e x 4 A s a b × 100 %
where
Asab represents the As absorption per cell (fg/cell), encompassing both intra- and extracellular As, but excluding the iAsV form;
Kt denotes the transformation rate;
Kr denotes the releasing rate;
Asin-0, Asin-1, Asin-2, Asin-3, and Asin-4 denote the intracellular total As, iAsV, iAsIII, DMA, and MMA per unit cell concentration, respectively;
Asex-1, Asex-2, Asex-3, and Asex-4 represent the extracellular dissolved iAsV, iAsIII, DMA, and MMA per unit cell concentration, respectively.
Notably, the extracellular iAsV, designated as Asex-1, is not considered in Equation (5) since it can be viewed as the remaining unchanged As initially added to the growth media.

2.5. Statistical Analysis

Statistical analyses were conducted using IBM-SPSS 23 software. A one-way ANOVA with a Duncan test was employed to assess the inter and intra differences in the algae across various factors, i.e., intra- and extracellular As concentrations (Asin, Asex), as well as As absorption (Asab), bioaccumulation (BCF), transformation (Kt), and release (Kr). The results were expressed as mean ± standard deviation.

3. Results and Discussion

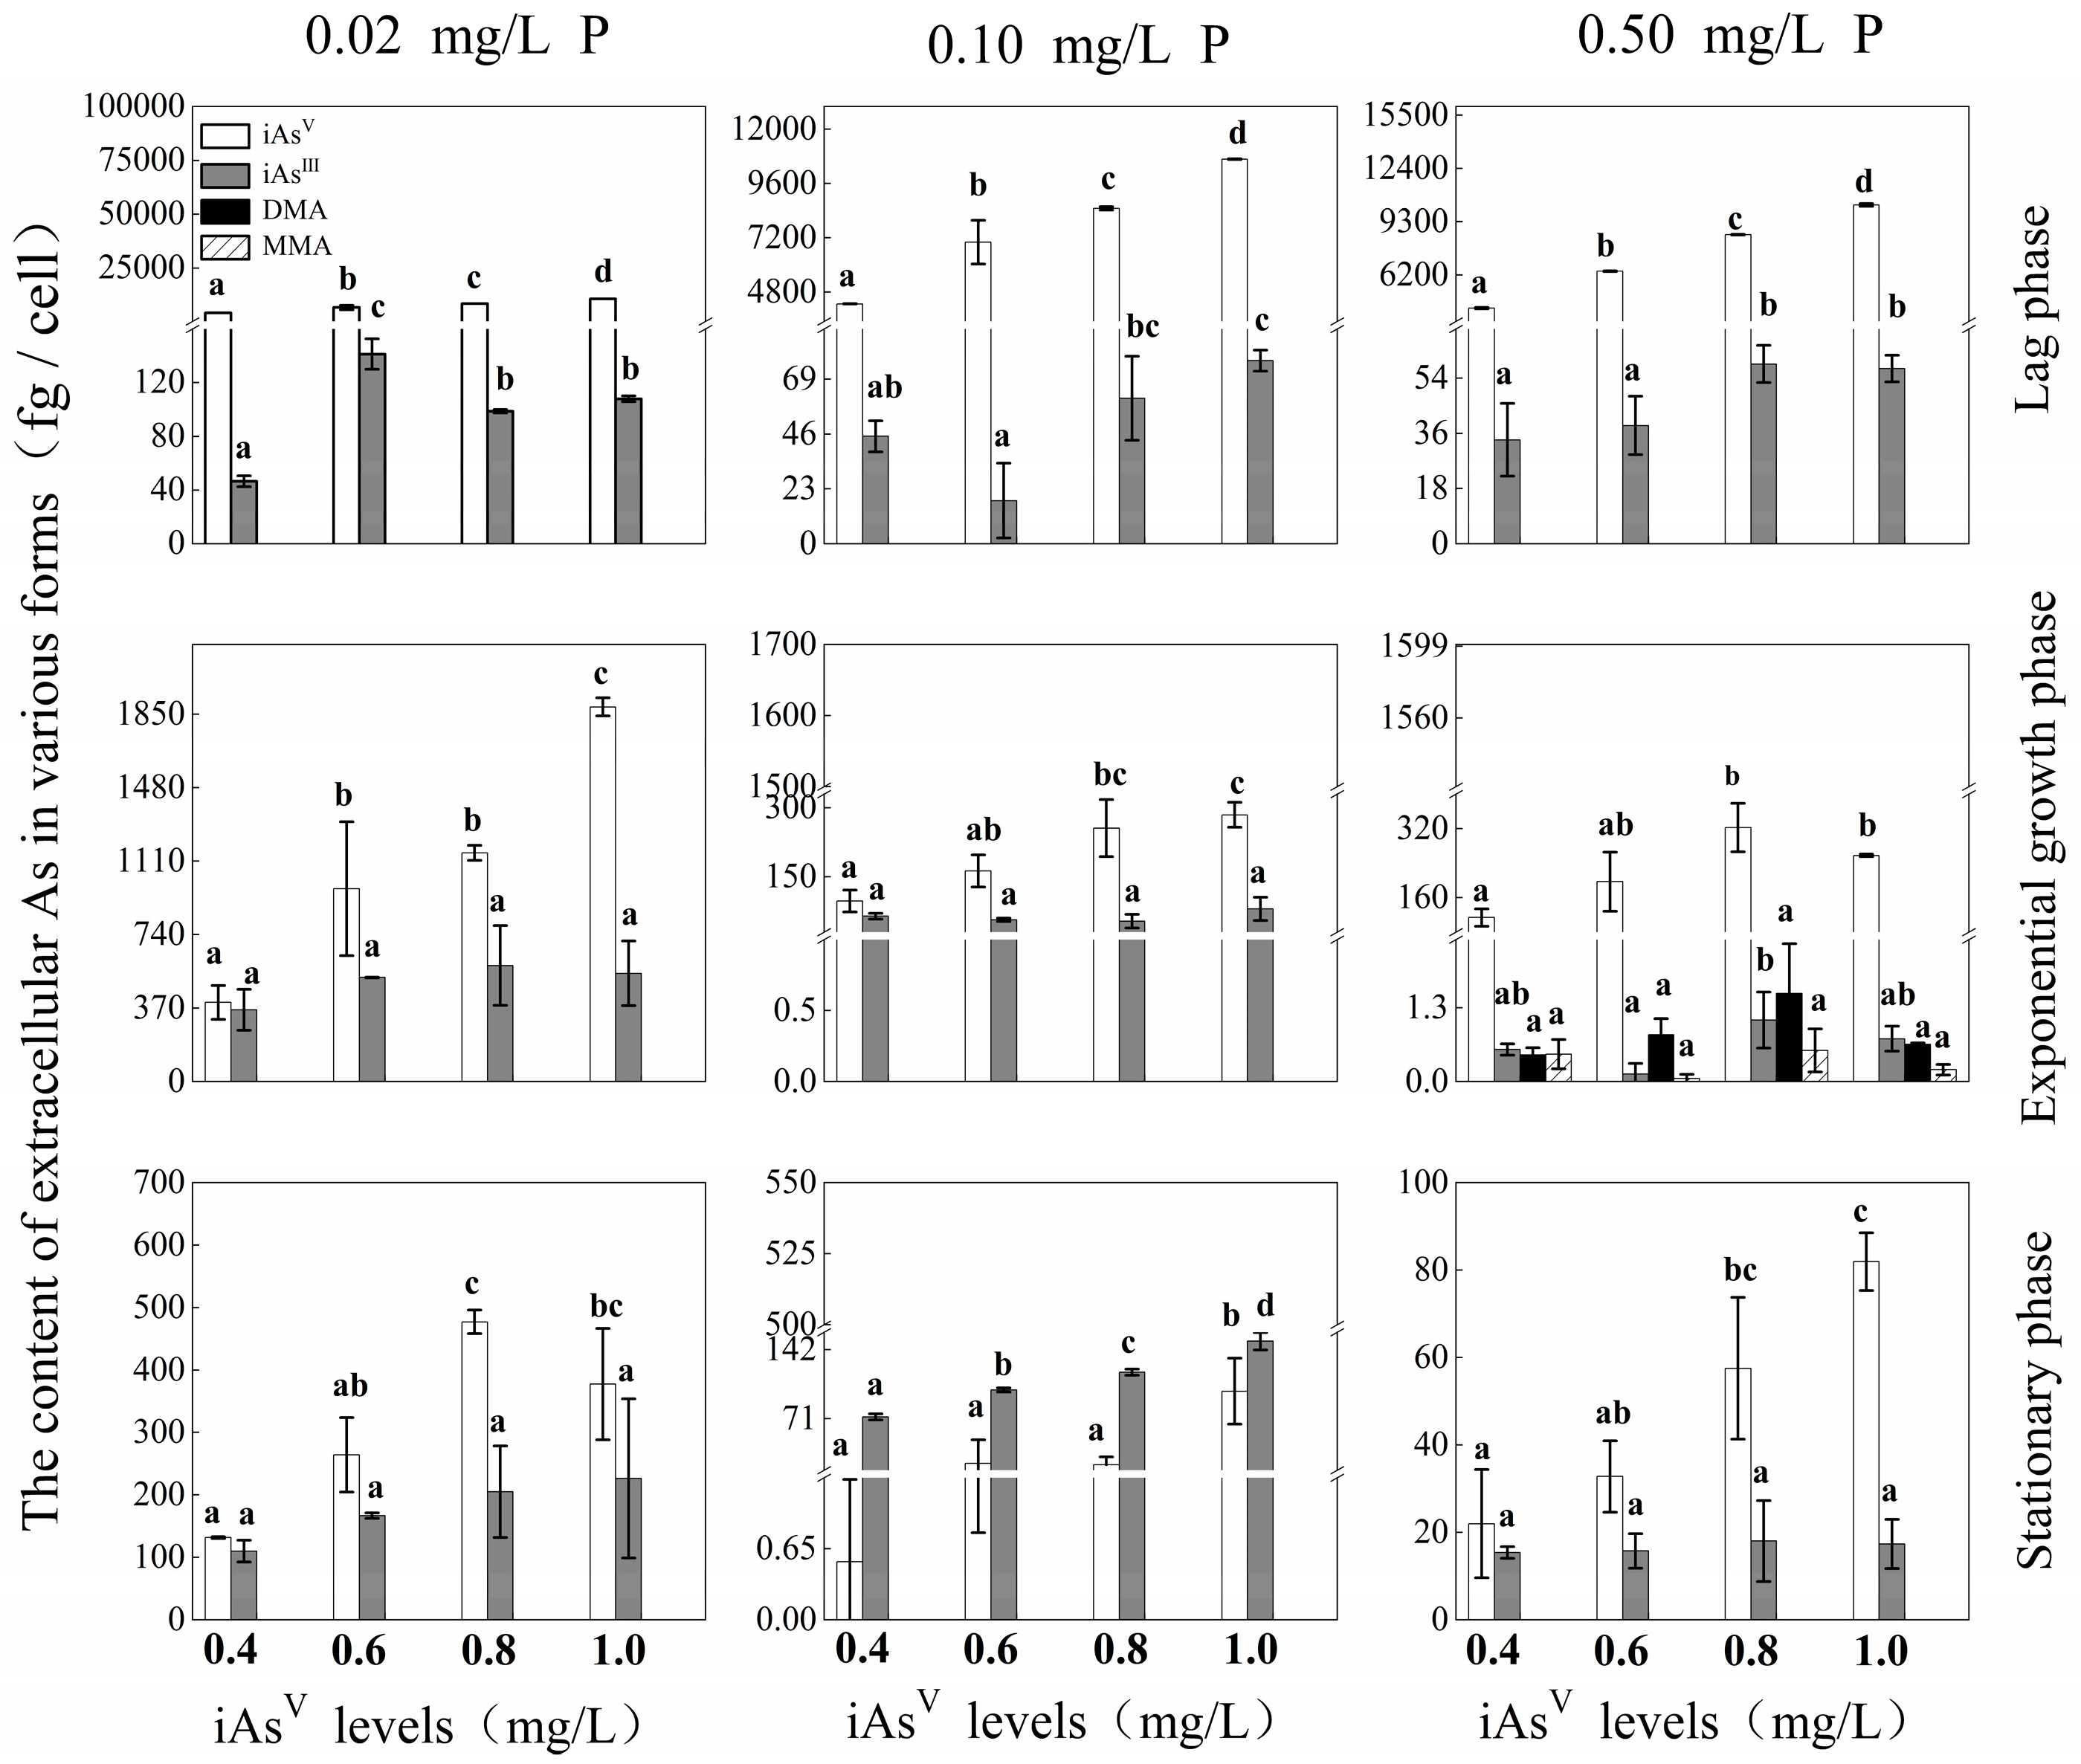
3.1. Effects of P and iAsV Additions on Extracellular As Species and Content at Different Growth Phases

iAsV maintained its dominance as the primary As species during the lag and exponential growth phases in the media (Figure 1). However, iAs III dominated during the stationary growth phase with 0.1 mg/L P, intensifying As-related ecological risks [25]. Additionally, the concentration of iAsIII in the media exhibited a significant negative correlation with the P level during the exponential growth phase, suggesting that P could inhibit extracellular iAsIII production to a certain extent, with this inhibitory effect tending to increase with higher P concentrations. This inhibition may be attributed to the crucial role of P as an essential nutrient for algal growth, influencing physiological metabolic processes such as the algal dissimilation reduction process [26,27]. Furthermore, trace amounts of organic As species, including DMA and MMA, were observed during the exponential growth phase with 0.5 mg/L P. This indicates that a high concentration of P could promote the transformation of DMA and MMA via M. aeruginosa. This finding was consistent with previous research, showing that As methylation induced by M. aeruginosa was influenced by different P levels and growth phases in the aquatic environment [28].

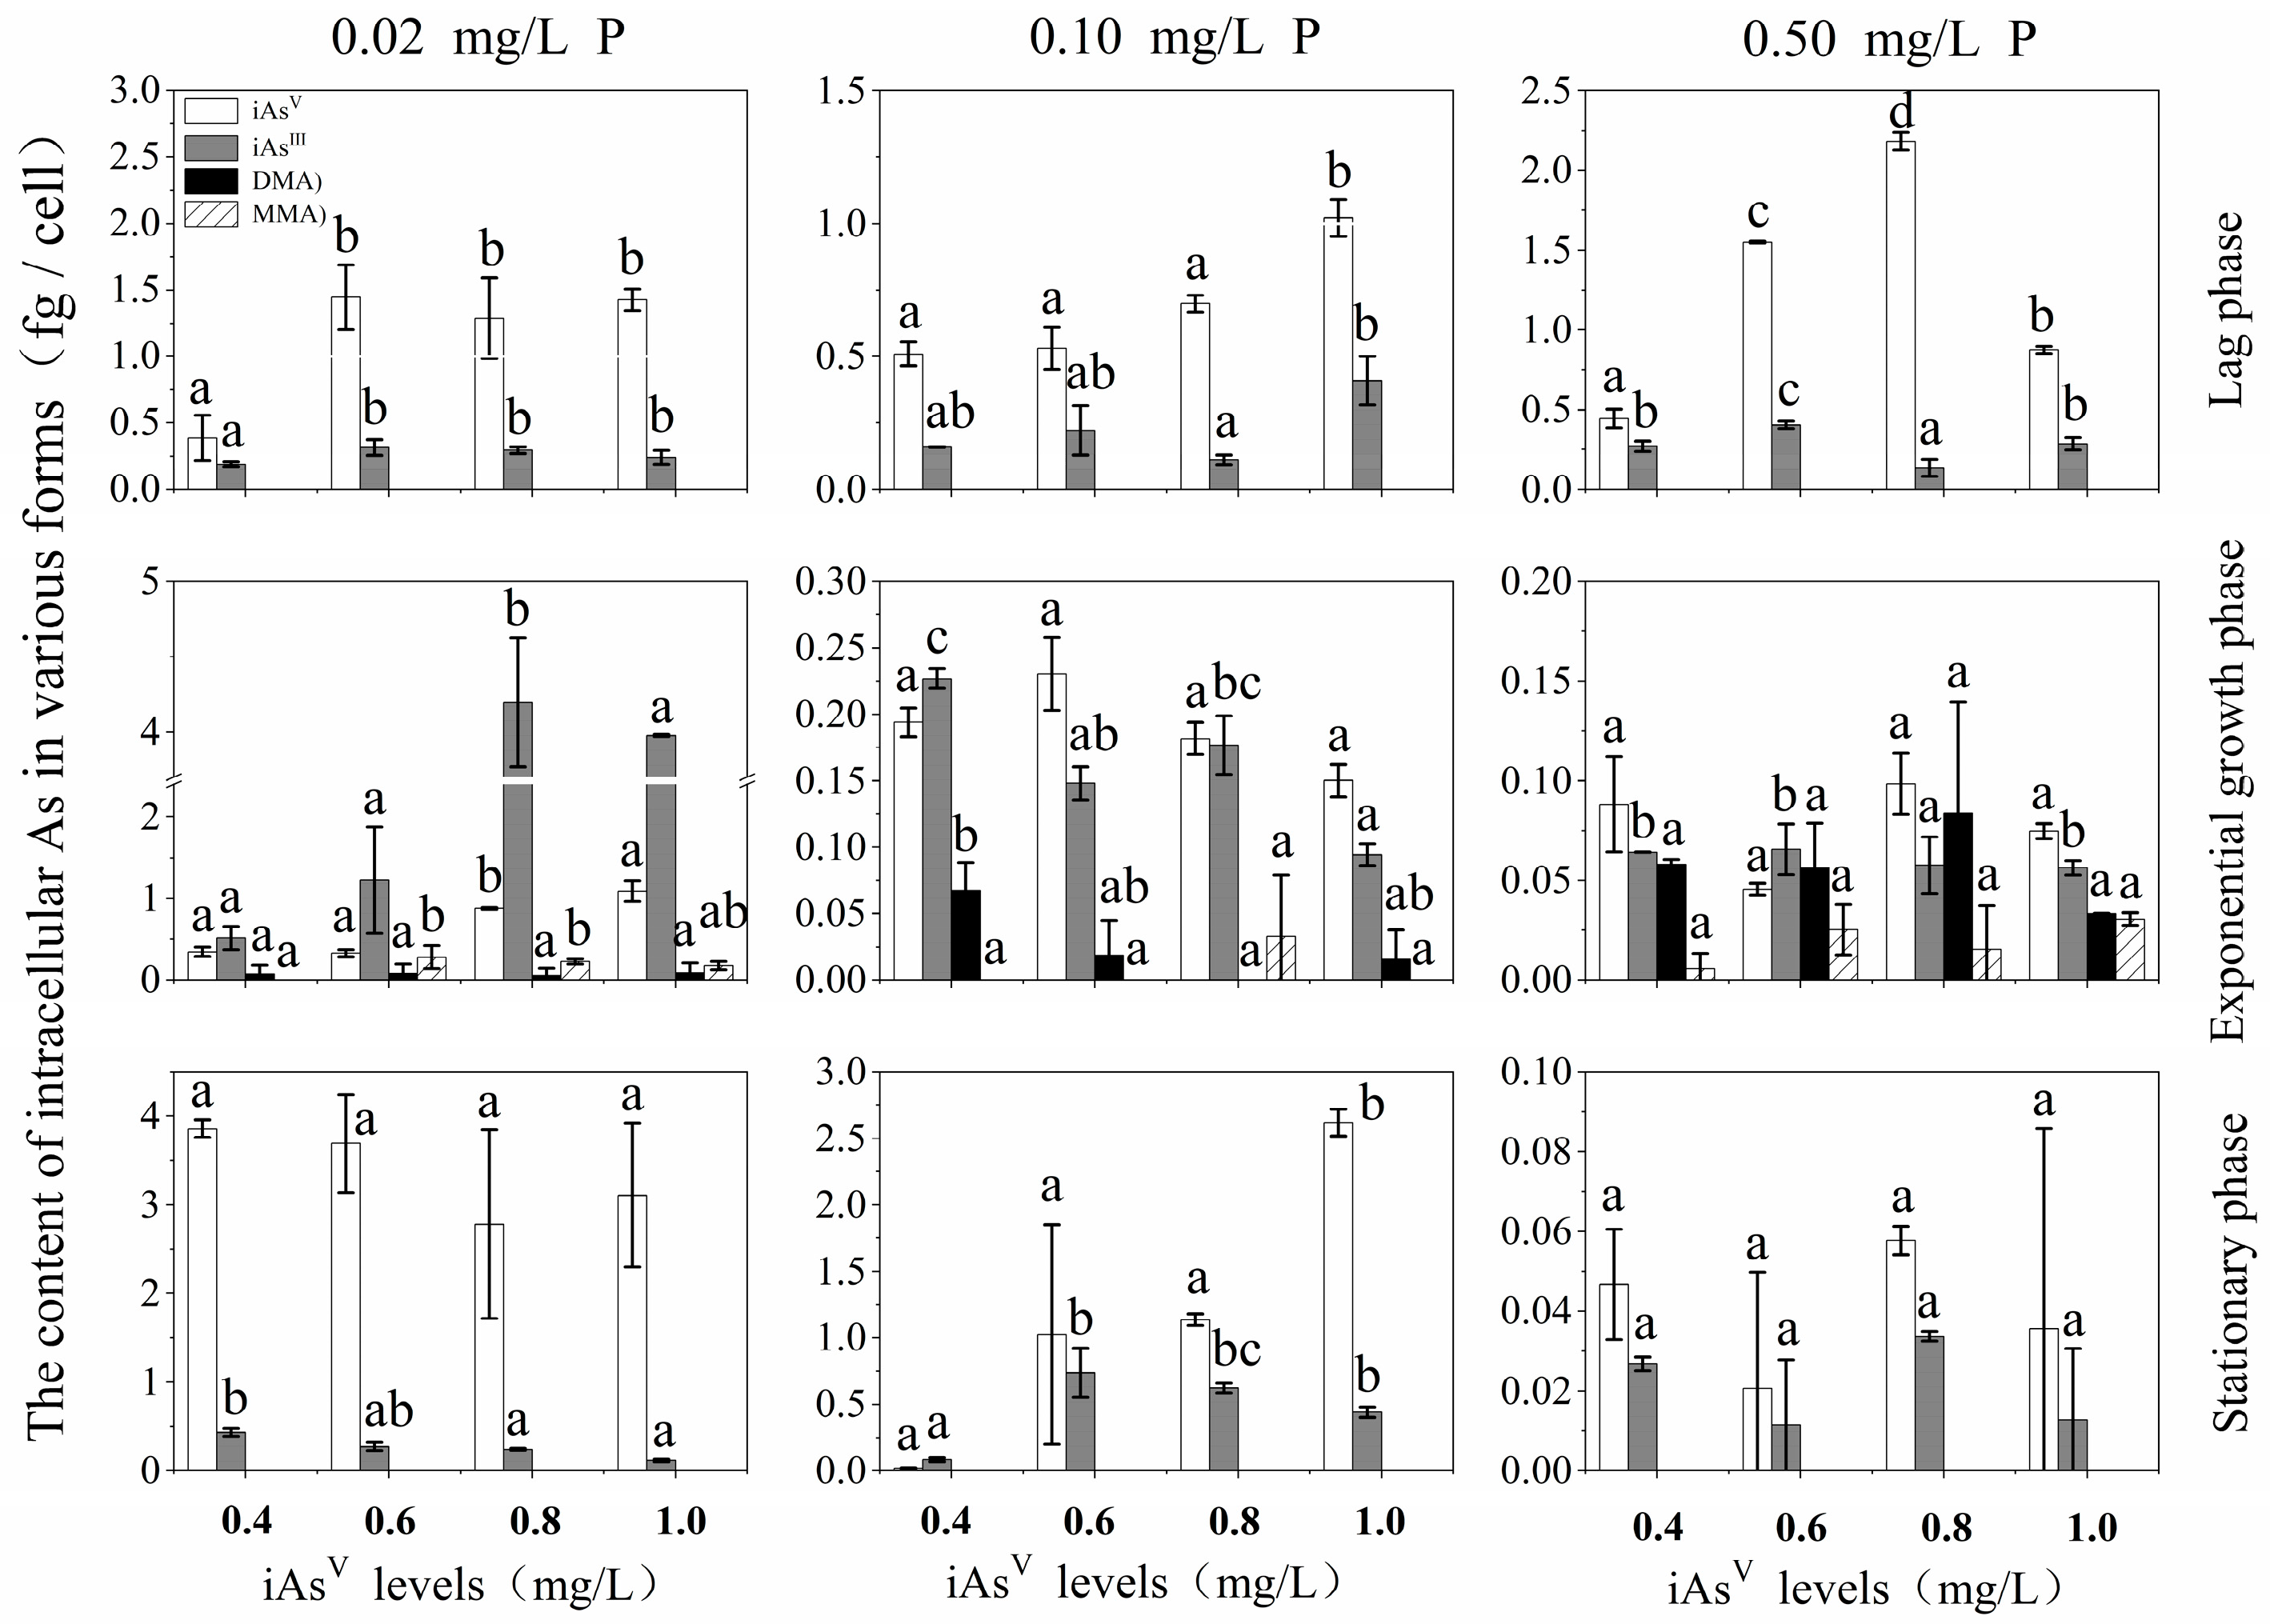
3.2. Effects of P and iAsV Additions on Intracellular As Species and Content at Different Growth Phases

Due to the structural resemblance between iAsV and P, their uptake in algal cells was believed to occur via similar transporters. Consequently, an increased trend of P levels was expected to result in a reduction in As accumulation in algal cells [29]. As depicted in Figure 2, the speciation and total content of As in algal cells after being exposed to iAsV exhibited significant differences across three P levels during various growth phases. At the lag phase with three P levels (0.02, 0.1, and 0.5 mg/L), the levels of intracellular iAsIII and iAsV showed no significant linear relationships with iAsV additions. During the exponential phase with a 0.02 mg/L P level, both intracellular iAsIII and iAsV exhibited significant positive linear relationships with iAsV additions (p < 0.05, R2 = 0.813 and 0.842); however, at 0.1 and 0.5 mg/L of P, intracellular iAsV remained unchanged with iAsV additions (p > 0.05), and intracellular iAsIII did not show any significant linear relationships with iAsV additions (p < 0.05, R2 = 0.648 and 0.282). Additionally, intracellular MMA and DMA showed no significant changes with varying iAsV levels (p > 0.05) at all P levels. At the stationary phase, intracellular iAsIII and iAsV exhibited a significant negative linear relationship with iAsV additions at 0.02 mg/L P (p < 0.05), but a positive relationship at 0.1 mg/L P (p < 0.05).
In this study, higher As content in M. aeruginosa was observed under 0.02 mg/L phosphate during the stationary growth phase. Wang et al. investigated the toxicity and bioaccumulation kinetics of arsenate in algae under phosphate-enriched (+P) and limited (−P) conditions, finding that algae exhibit maximum As uptake under low P conditions [30]. This is because there is no extracellular phosphate to compete with iAsV for phosphate transport systems. The content of iAsV in M. aeruginosa was higher than iAsIII during incubation following the algal exposure to iAsV during the lag and stationary growth phases, especially at the lower P addition (0.02 mg/L), indicating that P could influence the transformation of As species in M. aeruginosa. Ding et al. have also reported that a high concentration of intracellular iAsV, resulting from iAsV intake, was found in a reservoir with P restrictions [27].
Additionally, cellular iAsIII concentrations in lower P-treated M. aeruginosa, resulting from the reductive metabolism of algae following the intake of iAsV, were much higher than those in higher P-treated cells during the exponential growth phase, indicating that P could influence the transformation of As in M. aeruginosa. Studies have demonstrated that phosphate is a crucial environmental factor, influencing As metabolism in algae because of its structural similarity to iAsV, which allows it to compete with iAsV for uptake via the designated phosphate transporters in the cell membrane [31]. Our results revealed that the presence of phosphate could inhibit intracellular As content by decreasing the uptake of iAsIII or iAsV, thus mitigating As toxicity to M. aeruginosa. This finding aligns with other studies that reported a noticeable decrease in iAsV uptake by Chlorella salina and Chlamydomonas reinhardtii [32,33,34].

3.3. Effects of P and iAsV Additions on As Metabolism at Different Growth Phases

Significant variations in As absorption (Asab), bioaccumulation (BCF), and release metabolized by M. aeruginosa were observed at different P and iAsV additions across various growth phases (Table 3, Table 4 and Table 5). The As absorption (Asab) showed a positive relationship with iAsV levels only during the lag phase. In contrast to the lag phase, As absorption by M. aeruginosa was not markedly affected by iAsV additions during the exponential and stationary growth phases. As absorption (Asab) decreased with increased P addition; Asab was namely restricted by P. For instance, at the exponential growth phase, the absorption values of As were 5.065 × 10⁻⁷, 6.449 × 10⁻⁸, and 1.992 × 10⁻⁹ g/cell under low, medium, and high P levels, respectively. At the stationary phase, the corresponding absorption values were 1.804 × 10⁻⁷, 1.123 × 10⁻⁷, and 1.669 × 10⁻⁸ g/cell. The presence of P in the media potentially induced the increasing P demand and utilization of algal cells, leading to altered iAsV metabolism levels. iAsV was found to alter the photosynthetic apparatus and reduce the ability to retain P in M. aeruginosa under P limitation conditions [35], thus leading to higher As absorption.
The As bioaccumulation exhibited variation across different growth phases, with 0.04%, 0.3%, and 2% at the lag, exponential, and stationary phases, respectively. This suggests that the capacity of algal As enrichment positively correlates with algal reproduction. Simultaneously, both lower and higher levels of P (0.02 and 0.5 mg/L) were found to significantly decrease As accumulation in algae cells during the exponential and stationary growth phases (Table 4). This phenomenon can be explained by the differences of P consumption for the synthesis of various metabolites and P storage.
The biotransformation of total As did not show significant changes with increasing P additions from 0.02 mg/L to 5 mg/L under all iAsV levels (Table 6). This indicated that increasing P levels could not cause a difference in total As conversion, aligning with a previous study that found similar total iAsV biotransformation amounts per M. aeruginosa cell among different P conditions [28]. However, during the exponential growth phase, intra- and extracellular iAsIII content decreased with increasing P levels from 0.02 mg/L to 0.5 mg/L for cells, coupled with a slight increase in MMA and DMA biotransformation (Figure 1 and Figure 2). This indicated that increasing P could inhibit iAsIII transformation, while promoting methylated As transformation. This was partly attributed to the positive roles of P as one of the main elements of ATP or NADP, both important driving forces for facilitating the accumulation of metabolites [36].
The As release rate (Kr) surpassed 96% during the lag phase, exhibiting non-significant changes with varying As and P levels. In the exponential period, the release rate exceeded 85%, displaying a negative correlation with P, while in the stationary growth phase, the release rate exceeded 96%, indicating a positive correlation with P. These findings suggested that the changes of the release rate mirror those in the transformation rate, implying a relationship between As release and As transformation. Research had indicated that P indirectly influenced As release by affecting As transformation [9], establishing no direct relationship between As release and P levels. Consequently, P indirectly affected As release and promoted As efflux.

4. Conclusions

In this study, it was observed that iAsV addition significantly promoted the As metabolism of M. aeruginosa in media with 0.1 mg/L of P. Conversely, the metabolism of iAsV was inhibited in lower (0.02 mg/L) or higher P (0.5 mg/L) additions. The influence of P and iAsV additions on the absorption (Asab), bioaccumulation (BCF), transformation, and release of As from M. aeruginosa was evident, and this impact was contingent on the initial P status of the algal cells at various growth phases.
Moreover, iAsV emerged as the predominant species in algal cells in the M11 media under different P and iAsV additions, while DMA and MMA exhibited a significant increase during the exponential growth phase with 0.5 mg/L of P in media. The highest intracellular As content was observed at the 0.02 mg/L P addition for algal cells. The initial P status of algal cells played a crucial role in iAsV metabolism, leading to distinct fates, even under the same iAsV addition. Furthermore, the highest amount of iAsV metabolized by M. aeruginosa was observed under conditions of low levels of P during the stationary growth phase. A higher level of P in the media accelerated iAsV biotransformation into iAsIII, DMA, and MMA by M. aeruginosa during the exponential growth phase. Increasing iAsV levels in media under a lower P level promoted iAsV biotransformation for algal cells during the exponential growth phase, especially to iAsIII and MMA, but not to DMA. These findings provide insights into As metabolism under different iAsV and PO43− levels with algal blooms in freshwater ecosystems.

Author Contributions

P.Z.: Writing—original draft, review and editing. J.L.: Software, Experimental operation and data analysis, Methodology. F.Y.: Project administration, Writing—review and editing. S.X.: Writing—review and editing. C.W.: Writing—review and editing. All authors have discussed and reviewed the manuscript. All authors have read and agreed to the published version of the manuscript.

Funding

This study was financially supported by the National Natural Science Foundation of China (Grant No. 41271477) and Guangdong Basic and Applied Basic Research Foundation (Grant No. 2022A1515110930).

Data Availability Statement

All data generated or analyzed during this study are included in this article.

Conflicts of Interest

The authors declare that they have no known competing financial interests or personal relationships that could have appeared to influence the work reported in this paper.

References

  1. Rakhmania; Kamyab, H.; Yuzir, M.A.; Al-Qaim, F.F.; Purba, L.D.A.; Riyadi, F.A. Application of Box-Behnken design to mineralization and color removal of palm oil mill effluent by electrocoagulation process. Environ. Sci. Pollut. Res. 2023, 30, 71741–71753. [Google Scholar] [CrossRef]
  2. Filella, M.; Wey, S.; Matoušek, T.; Coster, M.; Rodríguez-Murillo, J.; Loizeau, J. Arsenic in Lake Geneva (Switzerland, France): Long term monitoring, and redox and methylation speciation in an As unpolluted, oligo-mesotrophic lake. Environ. Sci. Process. Impacts 2023, 25, 850–869. [Google Scholar] [CrossRef]
  3. Gao, Z.; Jiang, C.; Lyu, R.; Yang, Z.; Zhang, T. Optimization of the preparation of fungal-algal pellets for use in the remediation of arsenic-contaminated water. Environ. Sci. Pollut. Res. 2020, 27, 36789–36798. [Google Scholar] [CrossRef]
  4. Malsawmdawngzela, R.; Lalhmunsiama; Tiwari, D.; Lee, S. Synthesis of novel clay-based nanocomposite materials and its application in the remediation of arsenic contaminated water. Int. J. Environ. Sci. Technol. 2022, 20, 10285–10296. [Google Scholar] [CrossRef]
  5. Mahdavi, H.; Ulrich, A.C.; Liu, Y. Metal removal from oil sands tailings pond water by indigenous micro-alga. Chemosphere 2012, 89, 350–354. [Google Scholar] [CrossRef]
  6. Wang, Y.; Wang, S.; Xu, P.; Liu, C.; Liu, M.; Wang, Y.; Wang, C.; Zhang, C.; Ge, Y. Review of arsenic speciation, toxicity and metabolism in microalgae. Rev. Environ. Sci. Biotechnol. 2015, 14, 427–451. [Google Scholar] [CrossRef]
  7. Pal, A.; Paknikar, K.M. Microorganisms in Environmental Management; Springer: Dordrecht, The Netherlands, 2012; pp. 477–523. [Google Scholar]
  8. Wang, Z.; Gui, H.; Luo, Z.; Zhen, Z.; Yan, C.; Xing, B. Dissolved organic phosphorus enhances arsenate bioaccumulation and biotransformation in Microcystis aeruginosa. Environ. Pollut. 2019, 252, 1755–1763. [Google Scholar] [CrossRef]
  9. Wang, Z.; Luo, Z.; Yan, C.; Xing, B. Impacts of environmental factors on arsenate biotransformation and release in Microcystis aeruginosa using the Taguchi experimental design approach. Water Res. 2017, 118, 167–176. [Google Scholar] [CrossRef] [PubMed]
  10. Markley, C.T.; Herbert, B.E. Modeling phosphate pnfluence on arsenate reduction kinetics by a freshwater Cyanobacterium. Environ. Model. Assess. 2010, 15, 361–368. [Google Scholar] [CrossRef]
  11. Ashfaq, M.H.; Shahid, S.; Javed, M.; Iqbal, S.; Hakami, O.; Aljazzar, S.O.; Fatima, U.; Elkaeed, E.B.; Pashameah, R.A.; Alzahrani, E.; et al. Controlled growth of TiO2/Zeolite nanocomposites for simultaneous removal of ammonium and phosphate ions to prevent eutrophication. Front. Mater. 2022, 9, 1007485. [Google Scholar] [CrossRef]
  12. Qin, C.; Liu, H.; Liu, L.; Smith, S.; Sedlak, D.L.; Gu, A.Z. Bioavailability and characterization of dissolved organic nitrogen and dissolved organic phosphorus in wastewater effluents. Sci. Total Environ. 2015, 511, 47–53. [Google Scholar] [CrossRef]
  13. Davis, T.W.; Bullerjahn, G.S.; Tuttle, T.; McKay, R.M.; Watson, S.B. Effects of increasing nitrogen and phosphorus concentrations on phytoplankton community growth and toxicity during Planktothrix blooms in Sandusky Bay, Lake Erie. Environ. Sci. Technol. 2015, 49, 7197–7207. [Google Scholar] [CrossRef]
  14. Elias, M.; Wellner, A.; Goldin-Azulay, K.; Chabriere, E.; Vorholt, J.A.; Erb, T.J.; Tawfik, D.S. The molecular basis of phosphate discrimination in arsenate-rich environments. Nature 2012, 491, 134–137. [Google Scholar] [CrossRef]
  15. Wang, Y.; Zhang, C.H.; Lin, M.M.; Ge, Y. A symbiotic bacterium differentially influences arsenate absorption and transformation in Dunaliella salina under different phosphate regimes. J. Hazard. Mater. 2016, 318, 443–451. [Google Scholar] [CrossRef]
  16. Wang, Z.; Luo, Z.; Yan, C.; Che, F.; Yan, Y. Arsenic uptake and depuration kinetics in Microcystis aeruginosa under different phosphate regimes. J. Hazard. Mater. 2014, 276, 393–399. [Google Scholar] [CrossRef]
  17. Schoffelen, N.J.; Mohr, W.; Ferdelman, T.G.; Littmann, S.; Duerschlag, J.; Zubkov, M.V.; Ploug, H.; Kuypers, M.M.M. Single-cell imaging of phosphorus uptake shows that key harmful algae rely on different phosphorus sources for growth. Sci. Rep. 2018, 8, 17182. [Google Scholar] [CrossRef] [PubMed]
  18. Luo, Z.; Wang, Z.; Liu, A.; Yan, Y.; Wu, Y.; Zhang, X. New insights into toxic effects of arsenate on four Microcystis species under different phosphorus regimes. Environ. Sci. Pollut. Res. 2020, 27, 44460–44469. [Google Scholar] [CrossRef] [PubMed]
  19. Liu, J.; Xie, S.; Yang, F.; Wei, C. Effects of arsenate on the growth and arsenic uptake in Microcystis aeruginosa at different growth phases and phosphorus levels. Acta Sci. Circumstantiae 2017, 37, 2061–2068. (In Chinese) [Google Scholar]
  20. Xie, S.; Liu, J.; Yang, F.; Feng, H.; Wei, C.; Wu, F. Arsenic uptake, transformation, and release by three freshwater algae under conditions with and without growth stress. Environ. Sci. Pollut. Res. 2018, 25, 19413–19422. [Google Scholar] [CrossRef]
  21. Wang, Y.; Zheng, Y.; Liu, C.; Xu, P.; Li, H.; Lin, Q.; Zhang, C.; Ge, Y. Arsenate toxicity and metabolism in the halotolerant microalga Dunaliella salina under various phosphate regimes. Environ. Sci. Process. Impacts 2016, 18, 735–743. [Google Scholar] [CrossRef] [PubMed]
  22. Ge, Y.; Ning, Z.; Wang, Y.; Zheng, Y.; Zhang, C.; Figeys, D. Quantitative proteomic analysis of Dunaliella salina upon acute arsenate exposure. Chemosphere 2016, 145, 112–118. [Google Scholar] [CrossRef] [PubMed]
  23. Salvador, D.; Churro, C.; Valério, E. Evaluating the influence of light intensity in mcyA gene expression and microcystin production in toxic strains of Planktothrix agardhii and Microcystis aeruginosa. J. Microbiol. Methods 2016, 123, 4–12. [Google Scholar] [CrossRef]
  24. Baker, J.; Wallschläger, D. The role of phosphorus in the metabolism of arsenate by a freshwater green alga, Chlorella vulgaris. J. Environ. Sci. 2016, 49, 169–178. [Google Scholar] [CrossRef] [PubMed]
  25. Xu, F.; Wang, Z.; Chen, Y.; Luo, Y.; Luo, Z. Enhancing arsenate metabolism in Microcystis aeruginosa and relieving risks of arsenite and microcystins by nano-Fe2O3 under dissolved organic phosphorus conditions. Environ. Pollut. 2023, 330, 121801. [Google Scholar] [CrossRef] [PubMed]
  26. Kumari, N.; Jagadevan, S. Genetic identification of arsenate reductase and arsenite oxidase in redox transformations carried out by arsenic metabolising prokaryotes—A comprehensive review. Chemosphere 2016, 163, 400–412. [Google Scholar] [CrossRef] [PubMed]
  27. Ding, S.; Wang, Y.; Yang, M.; Shi, R.; Ma, T.; Cui, G.; Li, X. Distribution and speciation of arsenic in seasonally stratified reservoirs: Implications for biotransformation mechanisms governing interannual variability. Sci. Total Environ. 2022, 806, 150925. [Google Scholar] [CrossRef]
  28. Che, F.; Du, M.; Yan, C. Arsenate biotransformation by Microcystis aeruginosa under different nitrogen and phosphorus levels. J. Environ. Sci. 2018, 66, 41–49. [Google Scholar] [CrossRef]
  29. Guo, H.; Wen, D.; Liu, Z.; Jia, Y.; Guo, Q. A review of high arsenic groundwater in Mainland and Taiwan, China: Distribution, characteristics and geochemical processes. Appl. Geochem. 2014, 41, 196–217. [Google Scholar] [CrossRef]
  30. Wang, N.; Li, Y.; Deng, X.; Miao, A.; Ji, R.; Yang, L. Toxicity and bioaccumulation kinetics of arsenate in two freshwater green algae under different phosphate regimes. Water Res. 2013, 47, 2497–2506. [Google Scholar] [CrossRef]
  31. Rahman, M.A.; Hogan, B.; Duncan, E.; Doyle, C.; Krassoi, R.; Rahman, M.M.; Naidu, R.; Lim, R.P.; Maher, W.; Hassler, C. Toxicity of arsenic species to three freshwater organisms and biotransformation of inorganic arsenic by freshwater phytoplankton (Chlorella sp. CE-35). Ecotoxicol. Environ. Saf. 2014, 106, 126–135. [Google Scholar] [CrossRef]
  32. Amirnia, S.; Asaeda, T.; Takeuchi, C.; Kaneko, Y. Manganese-mediated immobilization of arsenic by calcifying macro-algae, Chara braunii. Sci. Total Environ. 2019, 646, 661–669. [Google Scholar] [CrossRef]
  33. Wang, N.; Huang, B.; Xu, S.; Wei, Z.; Miao, A.; Ji, R.; Yang, L. Effects of nitrogen and phosphorus on arsenite accumulation, oxidation, and toxicity in Chlamydomonas reinhardtii. Aquat. Toxicol. 2014, 157, 167–174. [Google Scholar] [CrossRef]
  34. Karadjova, I.B.; Slaveykova, V.I.; Tsalev, D.L. The biouptake and toxicity of arsenic species on the green microalga Chlorella salina in seawater. Aquat. Toxicol. 2008, 87, 264–271. [Google Scholar] [CrossRef] [PubMed]
  35. Rodriguez Castro, M.C.; Urrea, G.; Guasch, H. Influence of the interaction between phosphate and arsenate on periphyton’s growth and its nutrient uptake capacity. Sci. Total Environ. 2014, 503–504, 122–132. [Google Scholar] [CrossRef] [PubMed]
  36. Li, Y.; Han, F.; Xu, H.; Mu, J.; Chen, D.; Feng, B.; Zeng, H. Potential lipid accumulation and growth characteristic of the green alga Chlorella with combination cultivation mode of nitrogen (N) and phosphorus (P). Bioresour. Technol. 2014, 174, 24–32. [Google Scholar] [CrossRef] [PubMed]
Figure 1. The contents (1 fg = 10−15 g) and species of extracellular As in different growth periods with various P and iAsV levels. Note: different lowercase letters indicate that there was a significant difference in the content of the same form of As between different iAsV levels at same growth phase and P level (p < 0.05).
Water 16 00940 g001
Figure 2. The contents (1 fg = 10−15 g) and species of intracellular As in different growth periods with various P and iAsV levels. Note: different lowercase letters indicate that there is a significant difference in the content of the same iAsV forms between different iAsV levels at the same growth period and phosphorus level (p < 0.05).
Water 16 00940 g002
Table 1. Experimental design of the interaction between M. aeruginosa and iAsV.
Serial NumberiAsV Levels (mg/L)P Levels (mg/L)
10.40.02
20.1
30.5
40.60.02
50.1
60.5
70.80.02
80.1
90.5
1010.02
110.1
120.5
Table 2. iAsV addition time under different P levels.
P Levels (mg/L) iAsV Add Time Points
Lag PhaseExponential Growth PhaseStationary Phase
0.02Day 0Day 8Day 16
0.1Day 0Day 11Day 22
0.5Day 0Day 12Day 24
Table 3. The As absorption by cells in different growth phases; P and iAsV levels (fg/cell).
As Addition (mg/L)P Levels (mg/L)
Lag Growth PhaseExponential Growth PhaseStationary Growth Phase
0.020.10.50.020.10.50.020.10.5
0.446.98 ± 3.11 Ab49.33 ± 0.84 Aab34.46 ± 11.83 Aa362.07 ± 103.30 Ba65.47 ± 6.33 Aa1.70 ± 0.07 Aa113.95 ± 17.87 Ca72.96 ± 2.99 Ba15.43 ± 1.31 Aa
0.6143.23 ± 11.76 Bc18.64 ± 15.48 Aa40.28 ± 9.55 Aa525.42 ± 1.83 Ca57.06 ± 3.58 Ba1.15 ± 0.08 Aa170.54 ± 5.24 Ca102.26 ± 3.43 Bb15.82 ± 3.91 Aa
0.8100.12 ± 1.70 Bb64.43 ± 23.88 Ab60.64 ± 6.03 Ab589.50 ± 201.76 Ba54.63 ± 14.77 Aa3.36 ± 1.86 Aa207.91 ± 72.10 Ba120.52 ± 3.15 ABc18.10 ± 9.30 Aa
1109.43 ± 2.25 Bb70.34 ± 13.50 Ab57.94 ± 4.32 Ab549.20 ± 162.99 Ba80.82 ± 25.13 Aa1.76 ± 0.15 Aa229.32 ± 126.03 Aa153.61 ± 8.88 Ad17.43 ± 5.55 Aa
Note: Different lowercase letters indicate that there is a significant difference in the absorption of As at the same growth phase and P level (p < 0.05). Different capital letters indicate that there is a significant difference in the absorption of As between different P levels at the same growth phase and iAsV level (p < 0.05).
Table 4. The BCF of As by cells under different growth phases; P and iAsV levels (%).
As Addition (mg/L)P Levels (mg/L)
Lag Growth PhaseExponential Growth PhaseStationary Growth Phase
0.020.10.50.020.10.50.020.10.5
0.40.01 ± 0.01 Aa0.01 Ab0.01 Ab0.09 ± 0.02 Aa0.26 ± 0.04 Bc0.17 Ab1.68 ± 0.07 Bb0.13 Aa0.17 ± 0.01 Ab
0.60.03 Bb0.01 Aa0.03 Bd0.10 ± 0.04 Aa0.14 ± 0.04 Ab0.07 ± 0.01 Aa0.90 ± 0.35 Aa1.29 ± 0.73 Ab0.10 Aa
0.80.02 ± 0.01 ABa0.01 Aa0.02 Bc0.29 ± 0.01 Cc0.10 Bab0.05 ± 0.02 Aa0.41 ± 0.23 Aa1.21 ± 0.13 Bab0.10 ± 0.04 Aa
10.01 Ba0.01 Bb0.01 Aa0.21 ± 0.01 Bb0.05 ± 0.02 Aa0.05 Aa0.49 ± 0.22 Aa1.22 ± 0.18 Ab0.08 Aa
Note: Different lowercase letters indicate that there are significant differences in the enrichment coefficients of As between different iAsV levels at the same growth phase and P level (p < 0.05). Different capital letters indicate that there are significant differences in the enrichment coefficients of As between the same growth phase and different P treatment conditions at the same iAsV level (p < 0.05).
Table 5. The As transformation by cells under different growth phases; P and iAsV levels (%).
As Addition (mg/L)P Levels (mg/L)
Lag Growth PhaseExponential Growth PhaseStationary Growth Phase
0.020.10.50.020.10.50.020.10.5
0.499.43 ± 0.50 Aa99.14 ± 0.12 Aa98.83 ± 0.29 Ab99.94 ± 0.07 Aa99.77 Ab95.21 ± 2.80 Aa96.75 ± 0.43 Aa99.98 ± 0.03 Bb99.72 ± 0.15 Ba
0.698.86 ± 0.28 Aa74.58 ± 42.08 Aa96.30 ± 1.11 Aa99.97 ± 0.01 Aa99.69 ± 0.04 Aa98.40 ± 0.37 Aa97.93 ± 0.46 Aa99.06 ± 0.99 Aab99.72 Aa
0.898.84 ± 0.60 Ba98.97 ± 0.27 Ba96.64 ± 0.29 Aa99.87 ± 0.06 Ba99.76 ± 0.01 Bb98.16 ± 0.37 Aa98.55 ± 1.14 Aa99.08 ± 0.09 Aab99.71 ± 0.10 Aa
198.81 ± 0.27 Aa98.62 ± 0.29 Aa98.82 ± 0.05 Ab99.82 ± 0.11 Ba00.87 ± 0.03 Bc97.59 ± 0.42 Aa98.37 ± 1.41 Aa98.30 ± 0.04 Aa99.55 Aa
Note: different lowercase letters indicate that there is a significant difference in transformation rate between different iAsV levels at the same growth phase and P level (p < 0.05). Different capital letters indicate that there is a significant difference in the transformation rate of As between different P levels at the same growth phase and iAsV level (p < 0.05).
Table 6. The release rate of As by cells under different growth phases; P and iAsV levels (%).
As Addition (mg/L)P levels (mg/L)
Lag Growth PhaseExponential Growth PhaseStationary Growth Phase
0.020.10.50.020.10.50.020.10.5
0.499.11 ± 0.54 Aa98.81 ± 0.14 Aa98.13 ± 0.55 Ab99.81 ± 0.01 Bb99.37 ± 0.04 Ba88.76 ± 1.74 Aa96.41 ± 0.42 Aa99.87 Bb99.58 ± 0.18 Ba
0.698.67 ± 0.26 Aa65.58 ± 56.79 Aa95.50 ± 1.22 Aa99.70 ± 0.19 Ba99.46 ± 0.10 Bab88.22 ± 4.14 Aa97.80 ± 0.52 Aa98.35 ± 1.18 Aab99.61 Aa
0.898.57 ± 0.53 Ba98.84 ± 0.45 Ba96.58 ± 0.39 Aa99.10 ± 0.21 Ba99.40 ± 0.25 Bab94.73 ± 0.13 Aa98.47 ± 1.18 Aa98.58 ± 0.08 Aab99.58 ± 0.09 Aa
198.66 ± 0.26 Aa98.03 ± 0.69 Aa98.54 ± 0.10 Ab99.04 ± 0.32 Ba99.78 ± 0.01 Bb92.11 ± 0.90 Aa98.34 ± 1.41 Aa98.04 ± 0.06 Aa99.42 Aa
Note: different lowercase letters indicate that there is a significant difference in the release rate of As at the same growth phase and P level (p < 0.05). Different capital letters indicate that there is a significant difference in the release rate of As between P levels at the same growth phase and iAsV level (p < 0.05).
Disclaimer/Publisher’s Note: The statements, opinions and data contained in all publications are solely those of the individual author(s) and contributor(s) and not of MDPI and/or the editor(s). MDPI and/or the editor(s) disclaim responsibility for any injury to people or property resulting from any ideas, methods, instructions or products referred to in the content.

