Article

3D Characterization of Pore Structure and Pore Scale Seepage Simulation of Sandstone Based on Computational Tomography

1
CCTEG Xi’an Research Institute (Group) Co., Ltd., Xi’an 710077, China
2
State Key Laboratory of Coal Mine Disaster Prevention and Control, Xi’an 710077, China
3
Shaanxi Key Laboratory of Prevention and Control Technology for Coal Mine Water Hazard, Xi’an 710077, China
4
School of Mines, China University of Mining and Technology, Xuzhou 221116, China
5
Key Laboratory of Xinjiang Coal Resources Green Mining, Xinjiang Institute of Engineering, Ministry of Education, Urumqi 830023, China
6
Shaanxi Key Laboratory of Safety and Durability of Concrete Structures, Xijing University, Xi’an 710123, China
7
College of Civil and Architecture Engineering, Guilin University of Technology, Guilin 541004, China
*
Author to whom correspondence should be addressed.
Water 2024, 16(7), 1022; https://doi.org/10.3390/w16071022
Submission received: 7 February 2024 / Revised: 19 March 2024 / Accepted: 20 March 2024 / Published: 1 April 2024
(This article belongs to the Section Hydraulics and Hydrodynamics)

Abstract

:
The microscopic pore structure of sandstone determines its macroscopic permeability. Based on computer tomography (CT) technology, CT scans were performed on three different types of sandstone pore structures, namely coarse sandstone, medium sandstone, and fine sandstone. And the three-dimensional microscopic structure of sandstone pores was reconstructed. Furthermore, based on the Navier–Stokes equations, the fluid flow process in the pore structure of sandstone was simulated, and the effective permeability of sandstone was obtained. By extracting the pore structure from sandstone CT images, the average porosity of coarse sandstone, medium sandstone, and fine sandstone was 16.43%, 12.03%, and 11.64%, respectively. And the porosity of unconnected pores is less than 0.5%. The porosity and permeability of coarse sandstone are higher than those of medium sandstone and fine sandstone with an average value of 1.7 D. The porosity of medium sandstone and fine sandstone is relatively similar. However, the average pore radius and pore throat radius of medium sandstone are larger than those of fine sandstone. More importantly, although the permeability and porosity of sandstone are generally linearly related, when the porosity is low, the data show a large dispersion, and auxiliary indicators such as pore structure characteristic parameters such as pore throat radius should be adopted to evaluate the permeability of sandstone. The flow trajectory of fluid in the pore structure of sandstone is revealed through the streamline of fluid in the pore structure, revealing the mechanism of fluid flow.

Graphical Abstract

1. Introduction

Under the goal of “carbon neutrality”, the mining industry is facing new opportunities and challenges, such as geothermal extraction technology [1], safety and maintenance of underground reservoir dams in mines [2], and carbon dioxide capture, utilization, and storage technology. The mechanism of fluid seepage in sandstone is widely present in various problems mentioned above [3,4]. Both high permeability coarse sandstone with relatively high porosity and low permeability fine sandstone with relatively low porosity have complex three-dimensional pore structures [5,6]. Therefore, the investigation of fluid flow in the pore structure of sandstone is also a serious challenge [7,8,9].
With the rapid development of computer technologies and updating algorithms, numerical simulation has gradually become a scientific research method. The research of permeability prediction has been carried out using the Finite Difference Method [10], Finite Volume Method [11], Lattice Boltzmann Method [12] and Finite Element Method [13,14], which are based on the Navier–Stokes equation, with regard to seepage simulation tests. Compared with LBM, FEM has more commercial software and faster calculation speed, which is widely used to solve the problem of porous media seepage [15,16]. In recent years, to quantitatively characterize the flow mechanism of fluid in the pore structure of sandstone, researchers [6,17,18] have used various methods such as pore network models [19,20,21], lattice Boltzmann methods (LBMs) [17], or computational fluid dynamics (CFD) [22] based on digital rock cores to simulate fluid flow at the pore scale. Compared with traditional rock physics experiments [23], digital core technology has the advantages of low cost, repeatability, and high accuracy [24]. It can quantitatively characterize the pore structure characteristics of sandstone at the pore scale (pore radius, pore throat radius, coordination number, pore throat length) [25]. Furthermore, through statistical analysis of pore structure characteristics, a mathematical model is constructed to attempt to describe the distribution of sandstone pore structure characteristics [26,27]. More importantly, the pore structure characteristics of sandstone and its macroscopic physical properties, such as permeability and permeability coefficient, are modeled to evaluate and predict the permeability performance of sandstone [28,29]. For instance, medical and dental CT-scan techniques are applied for the porosity determination of 20 core samples collected from the Persian Gulf coastal zone and Zagros basin in order to compare with routine porosity measurement technique [30]. The results showed a considerable agreement between CT-scan techniques and average routine porosity method [31,32]. In addition, many scholars have reproduced the flow process of fluids in sandstone pore structures through numerical simulation methods, revealing the influence mechanism of pore structures on the macroscopic permeability of sandstone [33,34,35]. For instance, Xiao et al. [17] adopted the lattice Boltzmann method to construct a permeability model for sandstone at the pore scale and predict its permeability. Arash Rabbani et al. [19,20] used a pore network model to investigate the distribution of pore structure characteristics such as equivalent pore radius, pore throat radius, and pore throat length of sandstone at the pore scale, and they predicted the permeability of sandstone.
The above research indicates that digital core technology has outstanding advantages in constructing microstructure of sandstone pores and numerical simulation of fluid flow [36,37]. However, the core of studying the pore structure of sandstone based on digital core methods is the resolution of sandstone images [38,39]. The higher the resolution of sandstone images, the smaller the sample for CT testing, which increases the difficulty of sample preparation. However, the core issue in studying the pore structure of sandstone based on digital core methods is the resolution of sandstone images [40,41]. The higher the resolution of sandstone images, the smaller the sample for CT testing, which increases the difficulty of sample preparation.
The purpose of this paper is to obtain the porosity, pore size distribution, and three-dimensional pore structure of sandstone through CT testing, and to reveal the permeability mechanism of sandstone at the pore scale, providing a scientific basis for evaluating the permeability performance of sandstone in practical engineering. Based on digital core technology, this paper conducts CT scans on three different types of sandstones—coarse sandstone, medium sandstone, and fine sandstone—and constructs the three-dimensional pore structure of sandstones. Moreover, the variation patterns of sandstone pore structure characteristic parameters such as porosity, pore throat radius, pore radius, and coordination number are investigated. On this basis, the Navier–Stokes equation was used to simulate the fluid flow process in a sandstone pore structure, revealing the flow mechanism of fluid in the sandstone pore structure, and analyzing the relationship between permeability, porosity, and pore throat radius.

2. Three-Dimensional (3D) Microstructure of Sandstone Based on CT

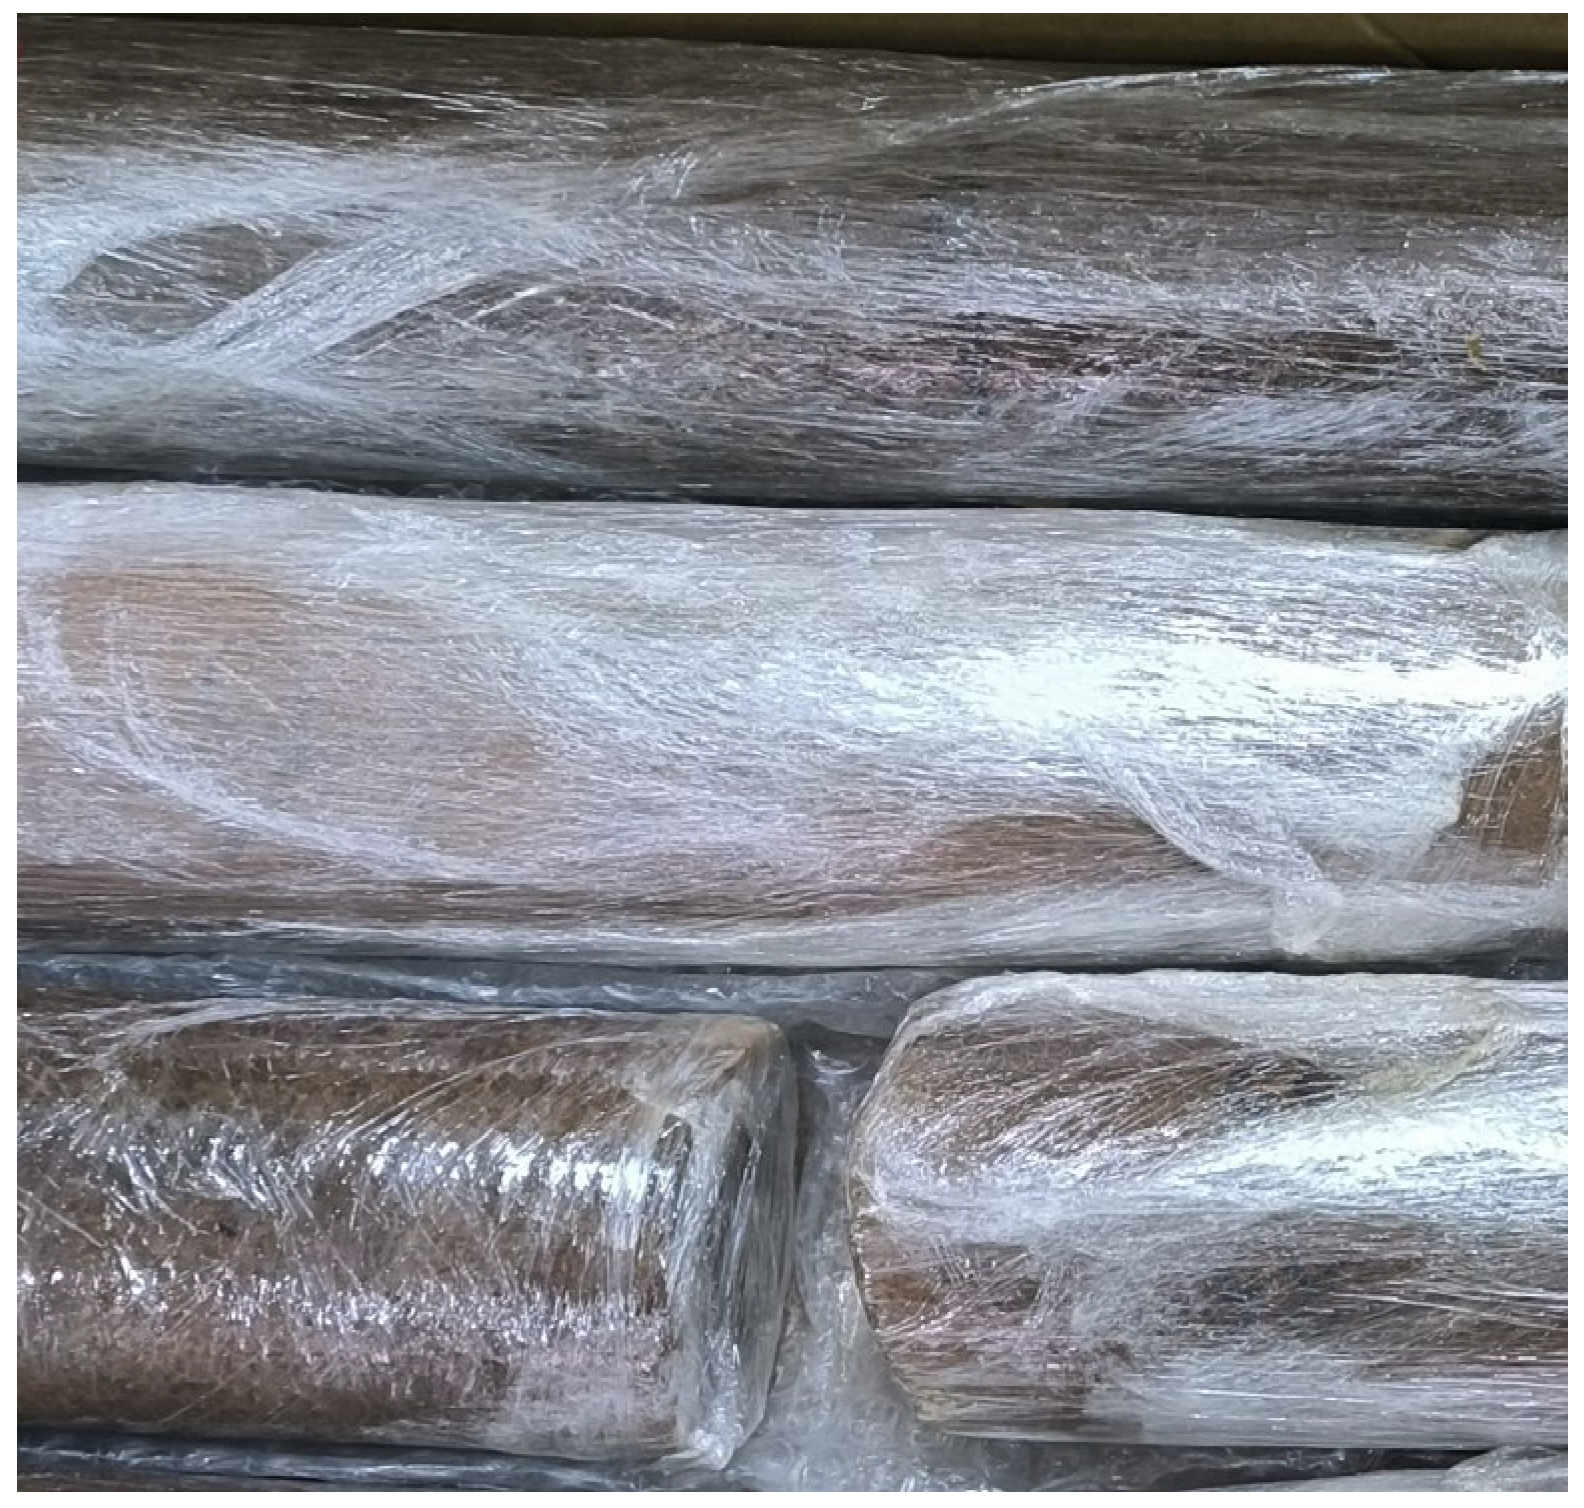
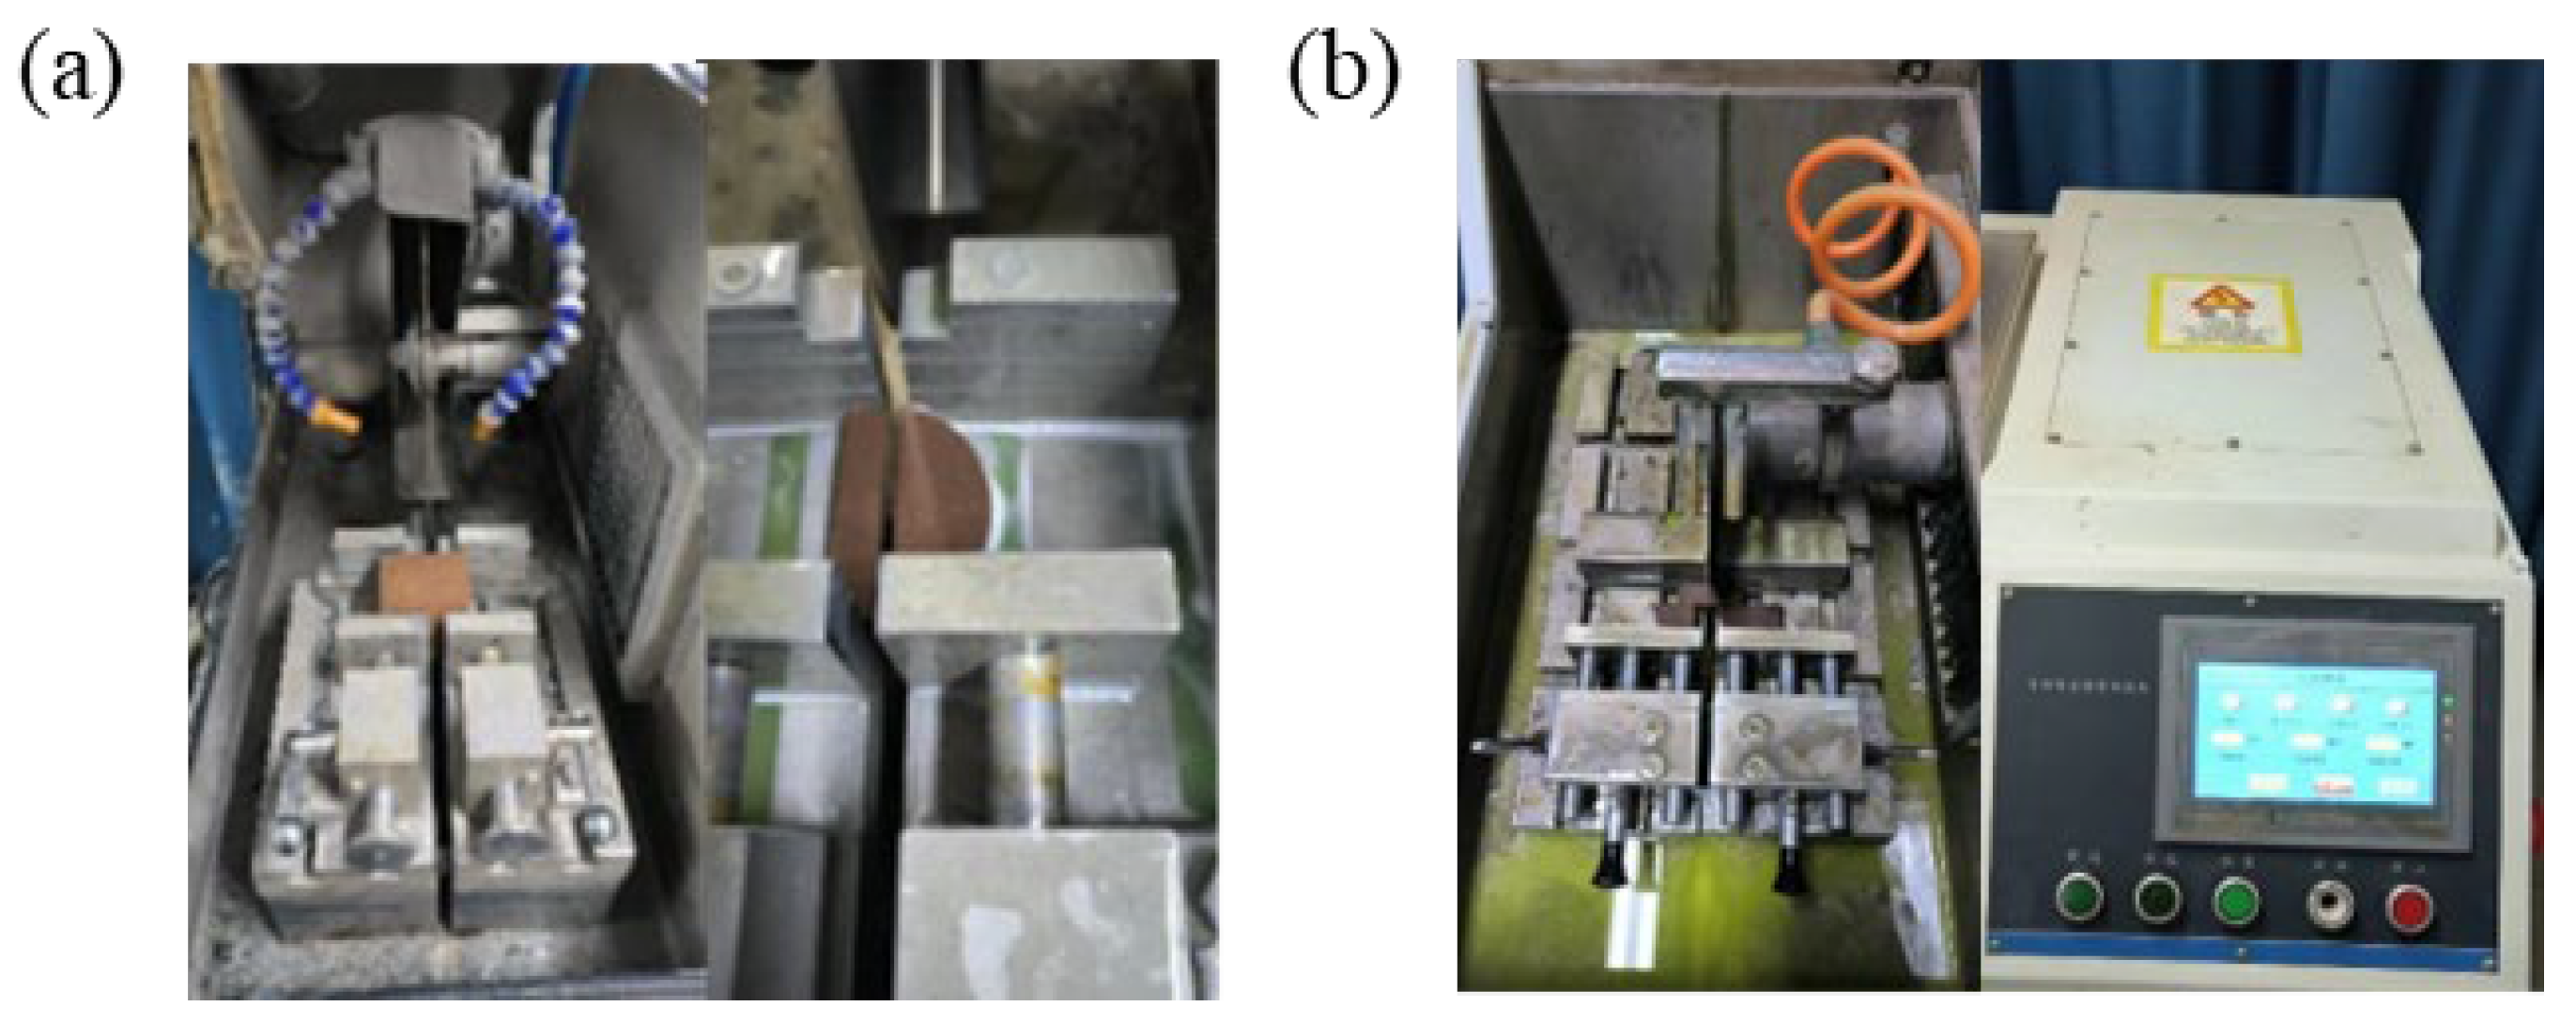
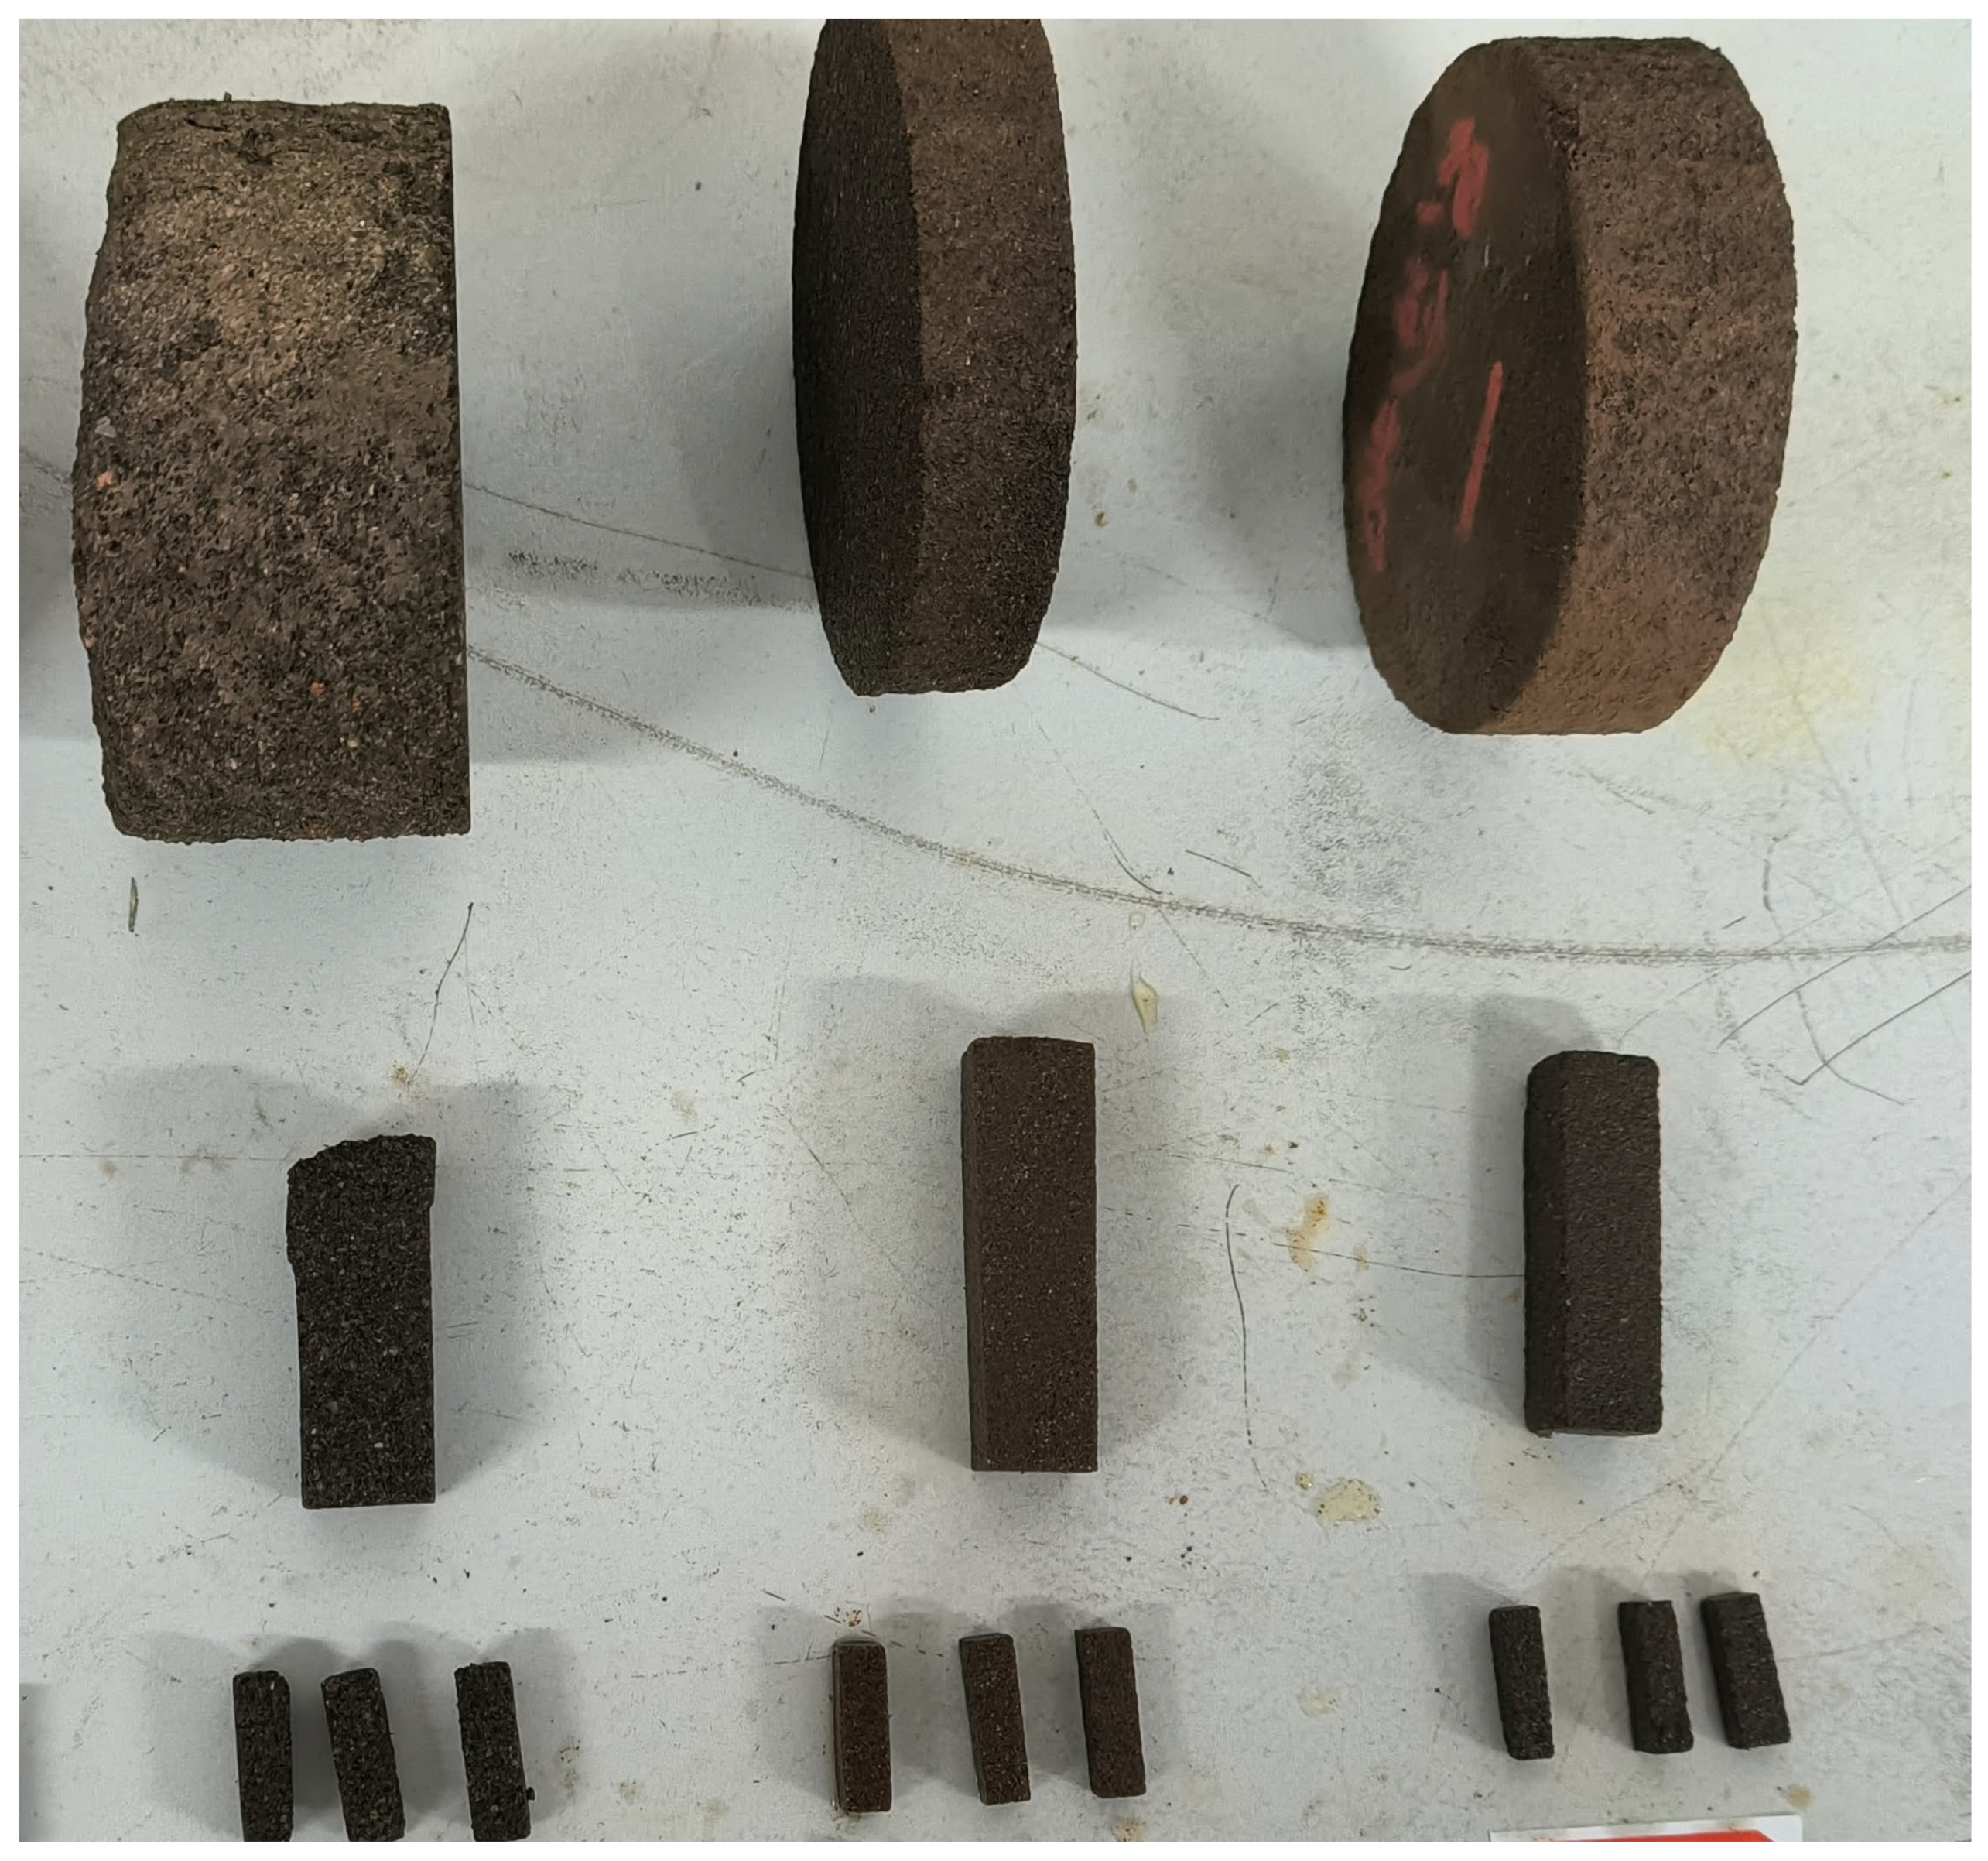
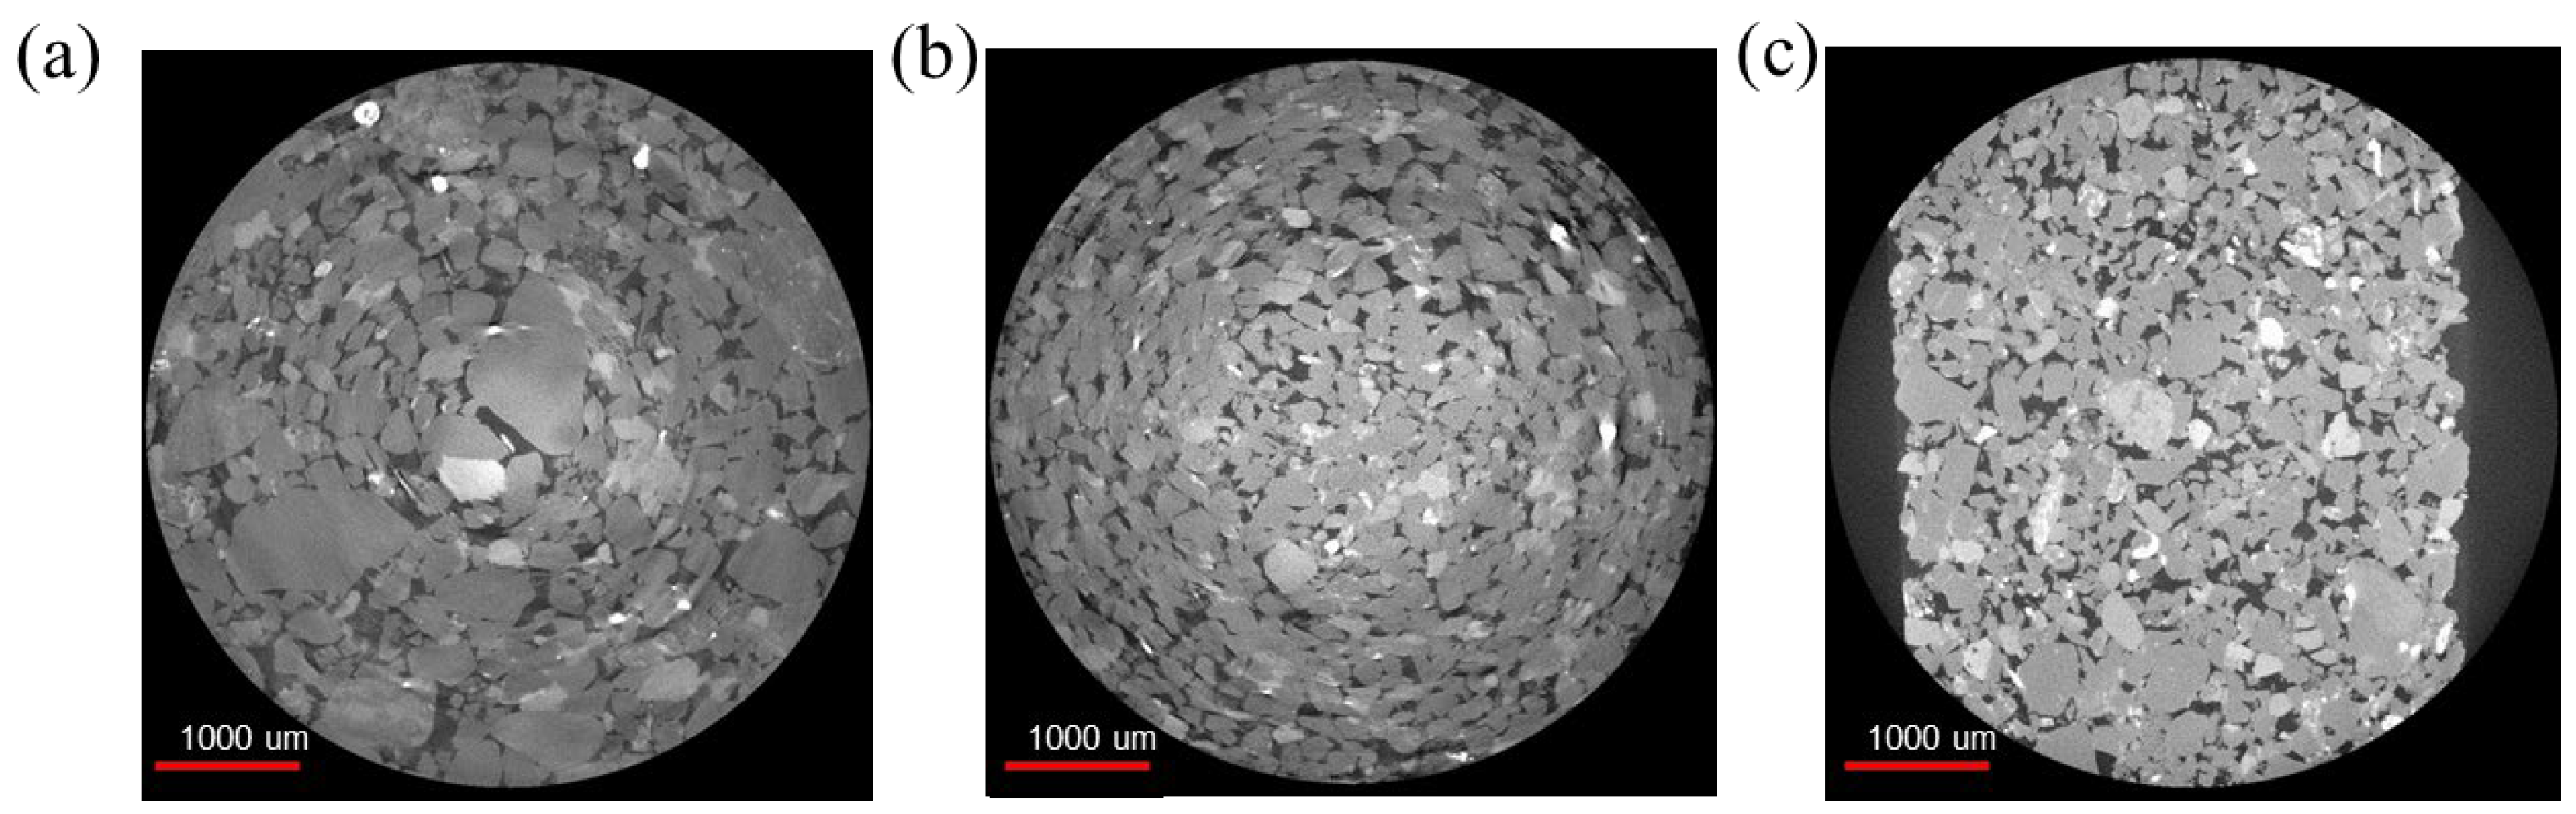
2.1. Preparation of Sandstone CT Samples

The sandstone samples are from the Binchang mining zone of the Huanglong Jurassic coal zone in Shaanxi Province, China. Xiao et al. [10] used sandstone CT data with a resolution of 5 μm to study the seepage problem of sandstone and achieved good seepage results. Therefore, we target a CT image resolution of 5 μm, which requires the sample size to not exceed 5 mm. Therefore, our sample size selection is 5 mm × 5 mm × 5 mm. Core drilling sampling was conducted on sandstone from the Jurassic coalfield in Huanglong, with a diameter of 100 mm, as shown in Figure 1. However, this size does not meet the specifications of the CT scan sample, and the sample needs to be processed to meet the size requirements of the CT scan. Due to the susceptibility of sandstone to damage and damage to its internal microstructure during cutting, it is necessary to use high-precision cutting machines for multiple cuts. Firstly, the original rock core samples were cut into cylindrical shapes with a height of 5 cm using a large water washing cutting machine for precise processing.
Furthermore, the 5 cm sandstone sample mentioned above was further finely processed using a concrete washing and cutting machine, and the sample was cut into a rectangular prism with a cross-sectional size of 2 cm, as shown in Figure 2a. Finally, the LC-200XP automatic high-speed precision cutting machine produced by Instrument Co., Ltd. where is from Ningbo, China was used to process the sample into a rectangular sample with a cross-sectional size of 5 mm (as shown in Figure 2b) for CT detection.
The morphology of sandstone samples under various processing techniques is shown in Figure 3. It can be seen from the figure that the morphology of the samples gradually decreases, and the difficulty of processing techniques gradually increases, ultimately achieving the sample accuracy required by 5 microns. This article processed three different types of sandstone: coarse sandstone, medium sandstone, and fine sandstone. Three samples were processed for each sandstone type to reduce the random error caused by the discrete sampling. A total of nine samples were processed, and the sample numbers are shown in Table 1.

2.2. CT Scanning of Sandstone Samples

Computer tomography (CT) technology involves the use of X-rays to scan specimens with thickness. Through the conversion of optical signals, electrical signals, and digital signals, the digital information is processed and converted into pixels, which are arranged in a matrix to form a CT sequence image. The high-resolution three-dimensional X-ray microscope from Guilin University of Technology was used to scan the microstructure of the sample to obtain the microstructural information of sandstone in this paper. Continuous cross-sectional scanning was performed on sandstone samples from different samples to obtain 1000 two-dimensional sequence images. The typical CT images of sandstone samples are shown in Figure 4.

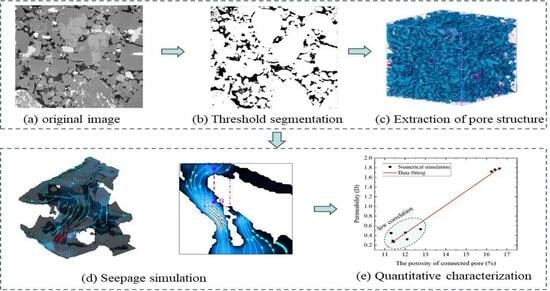
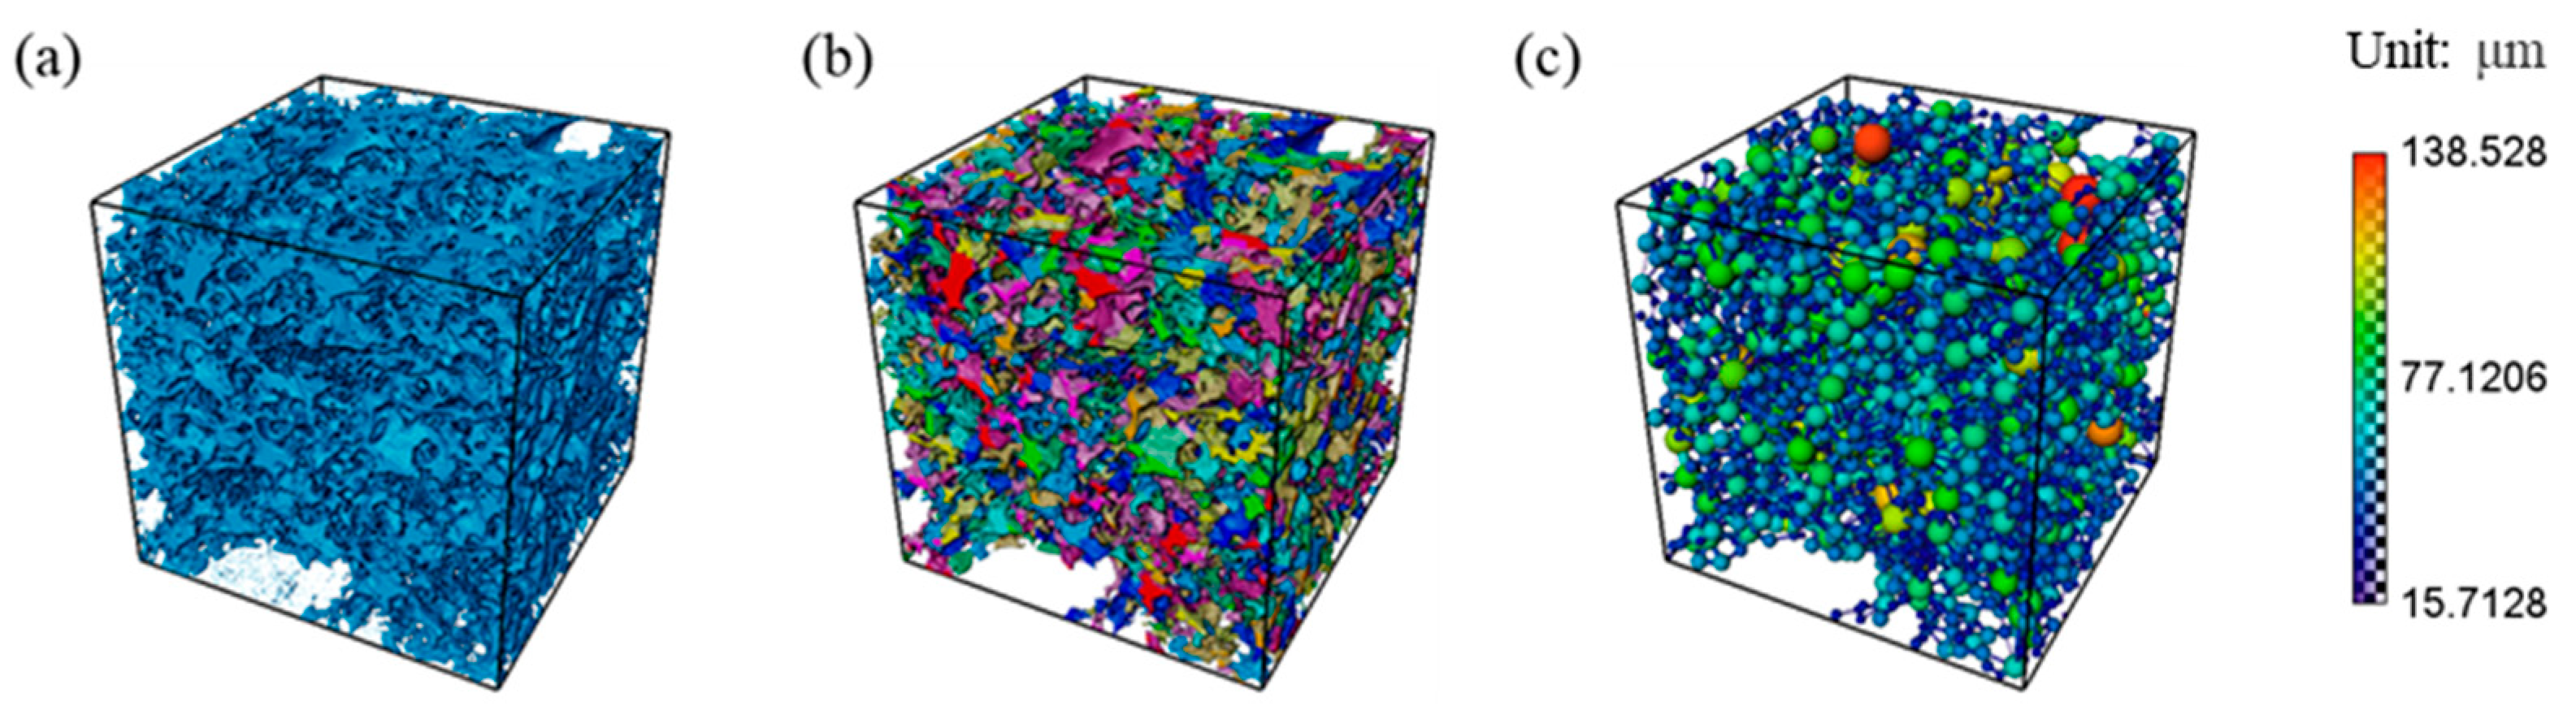
2.3. Sandstone CT Image Processing and 3D Reconstruction

The two-dimensional sequence images scanned by CT will have different types of system noise. Denoising and filtering can improve the quality of the scanned two-dimensional sequence images. At the same time, reducing image edge noise can highlight the pore characteristics of sandstone specimens, making it easier for subsequent image threshold segmentation and pore structure extraction. Digital image processing is a processing method that uses computers to denoise, filter, perform morphological processing, and enhance as well as segment sequence images. After obtaining sandstone sequence images through experiments, the pore structure in sandstone CT is extracted through machine learning in ImageJ software 3.0. In machine learning, the more samples that are trained, the lower the processing efficiency of the computer. By comparing the prediction results, a training sample size of 200 can achieve good prediction results. Therefore, this article uses a training sample size of 200, and the typical pore structure of sandstone is shown in Figure 5a,b. Finally, the sequence images of sandstone samples were machine learned to obtain pore structure images, and then the two-dimensional images were transformed into three-dimensional images to achieve a three-dimensional visualization of the internal structure of sandstone, as shown in Figure 5c.

3. Characteristics of Pore Structure in Sandstone
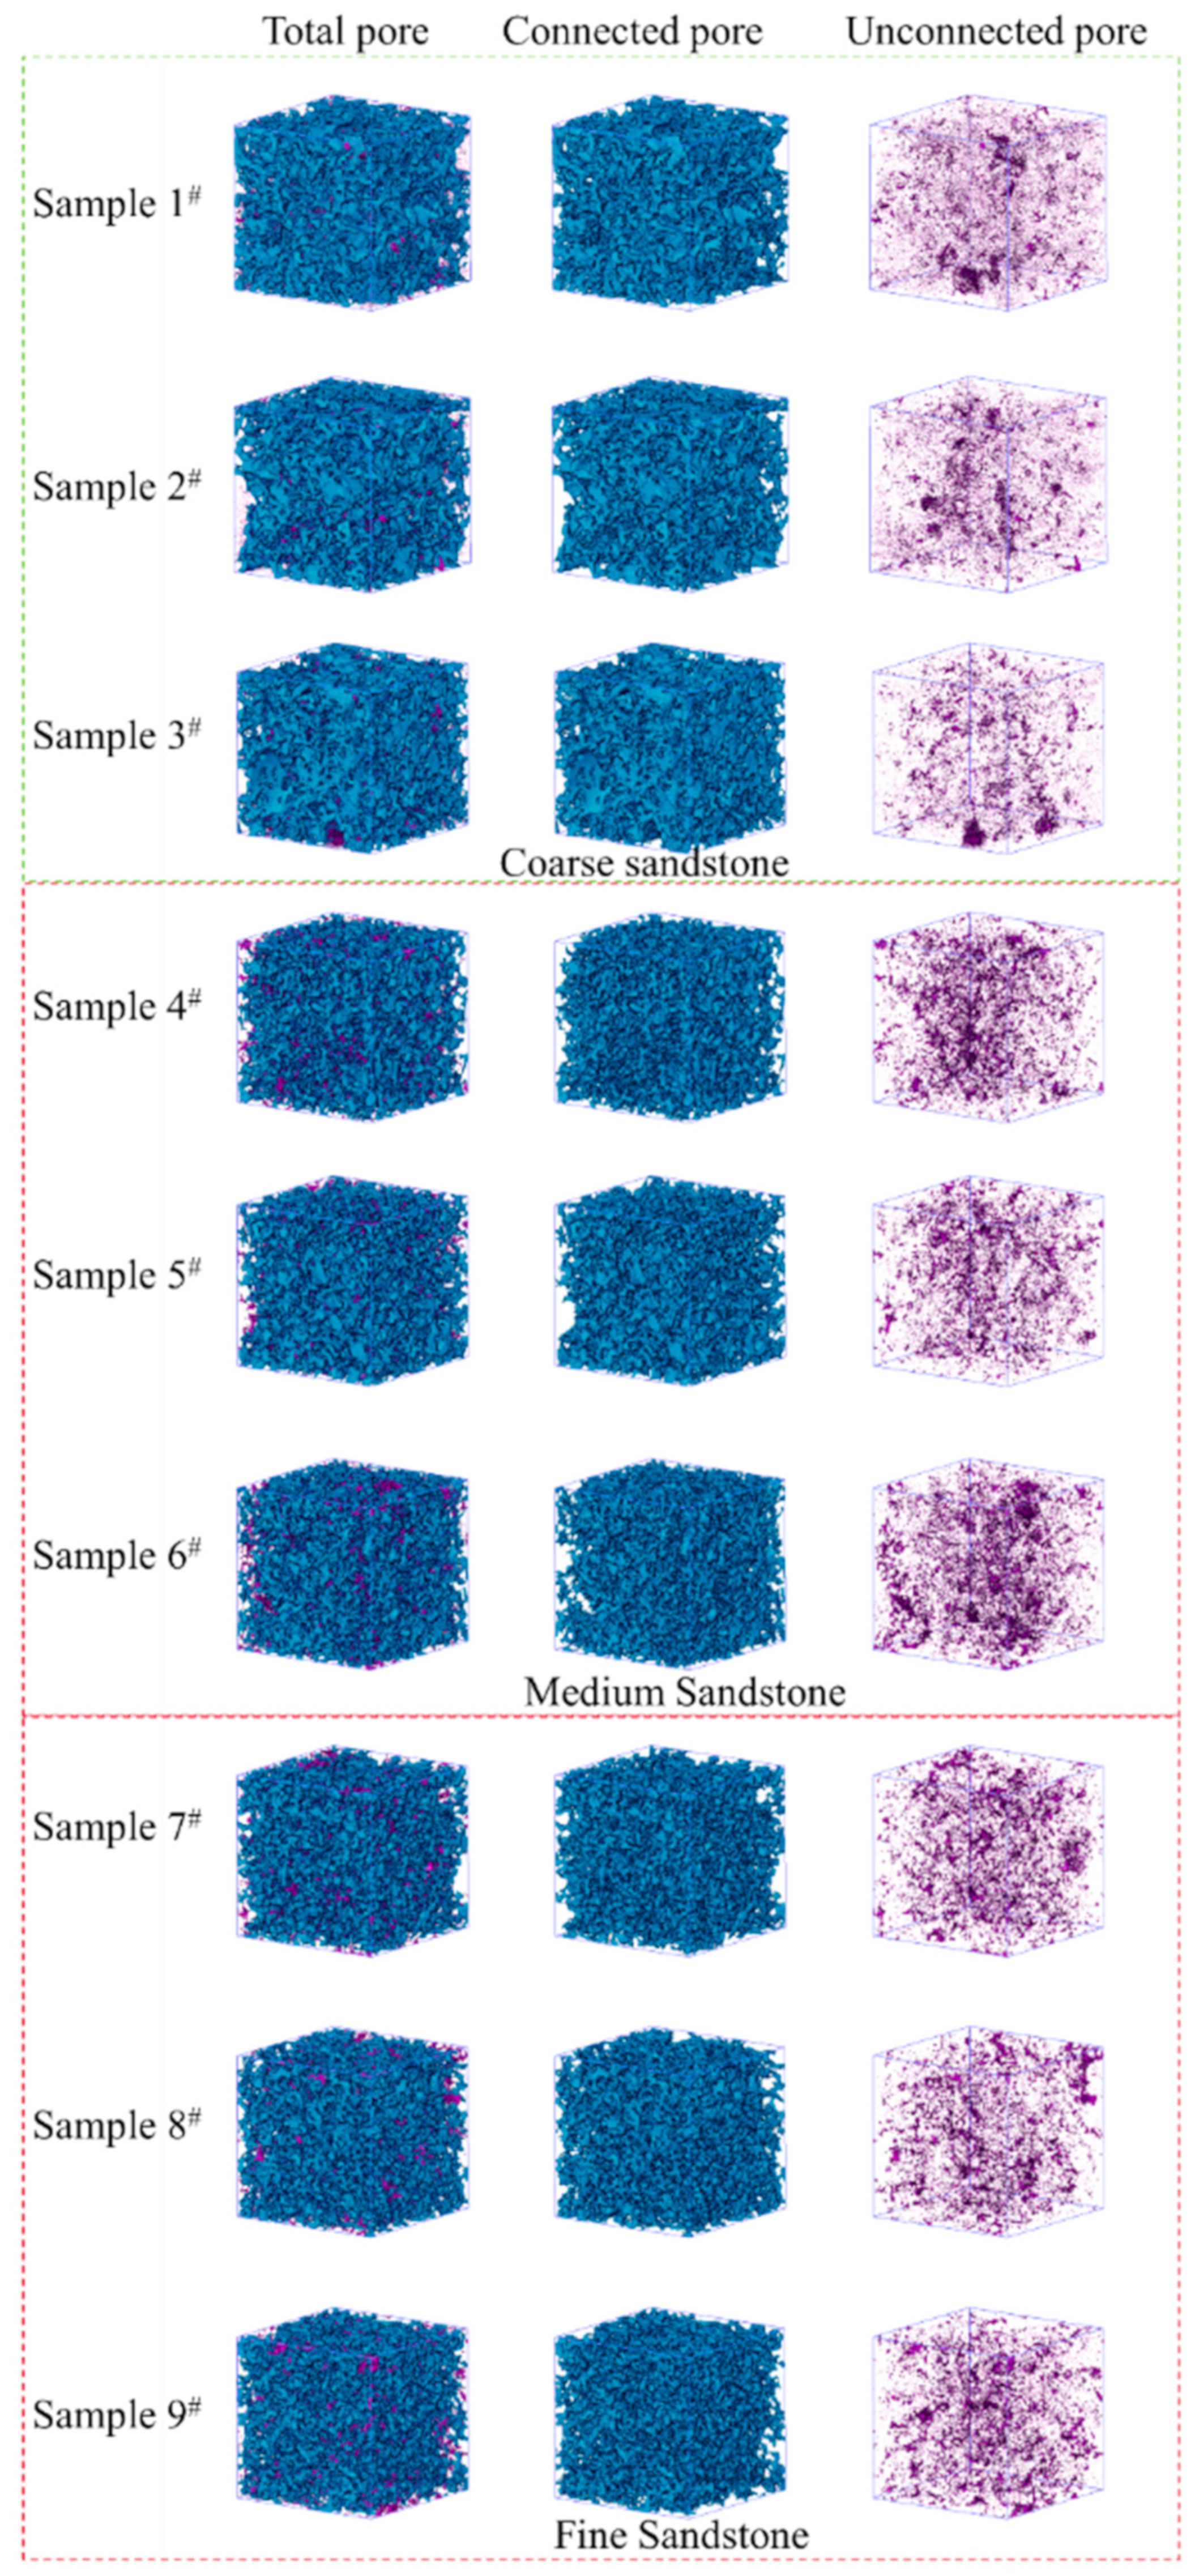
To quantitatively analyze the pore structure of sandstone samples (such as pore size, pore throat, and pore connectivity), the watered segmentation algorithm is used to segment the pore structure of sandstone. In order to better illustrate the process of using a watered segmentation algorithm for pore structure segmentation, this paper provides a detailed explanation using a two-dimensional image. Firstly, the watered segmentation algorithm was used to segment the binary sandstone pore structure (Figure 6). Secondly, based on the principle of equal volume, the radius of the equivalent sphere of the segmented sandstone pore structure is obtained as the radius of the pore. Then, based on the connectivity between the equivalent sphere and the surrounding spheres, the coordination number and pore network of the pore are obtained.

3.1. Porosity

Porosity is an important indicator for measuring the permeability and mechanical properties of sandstone. Usually, as the porosity increases, the permeability of sandstone becomes better, while the mechanical properties become worse. Through a CT image analysis of sandstone, it was found that there are two forms of pores in sandstone, namely connected pores and unconnected pores (as shown in Figure 7), where connected pores determine the permeability of sandstone. From Figure 7, it can be seen that connected pores play a dominant role in the three types of sandstones, and unconnected pores are mostly isolated pores with smaller pore sizes. Furthermore, Figure 8 presents bar charts of connected porosity and unconnected porosity for each of the nine samples. From the graph, it can be seen that the connected porosity of coarse sandstone is significantly higher than that of medium sandstone and fine sandstone, while the connected porosity of medium sandstone is relatively close to that of fine sandstone. Therefore, it is difficult to determine the permeability between medium sandstone and fine sandstone through porosity. In addition, the porosity of unconnected pores in nine sandstone samples is less than 0.5%, indicating that the unconnected porosity of sandstone is very small and can be ignored. Furthermore, the unconnected porosity of coarse sandstone is lower than that of medium sandstone and fine sandstone.

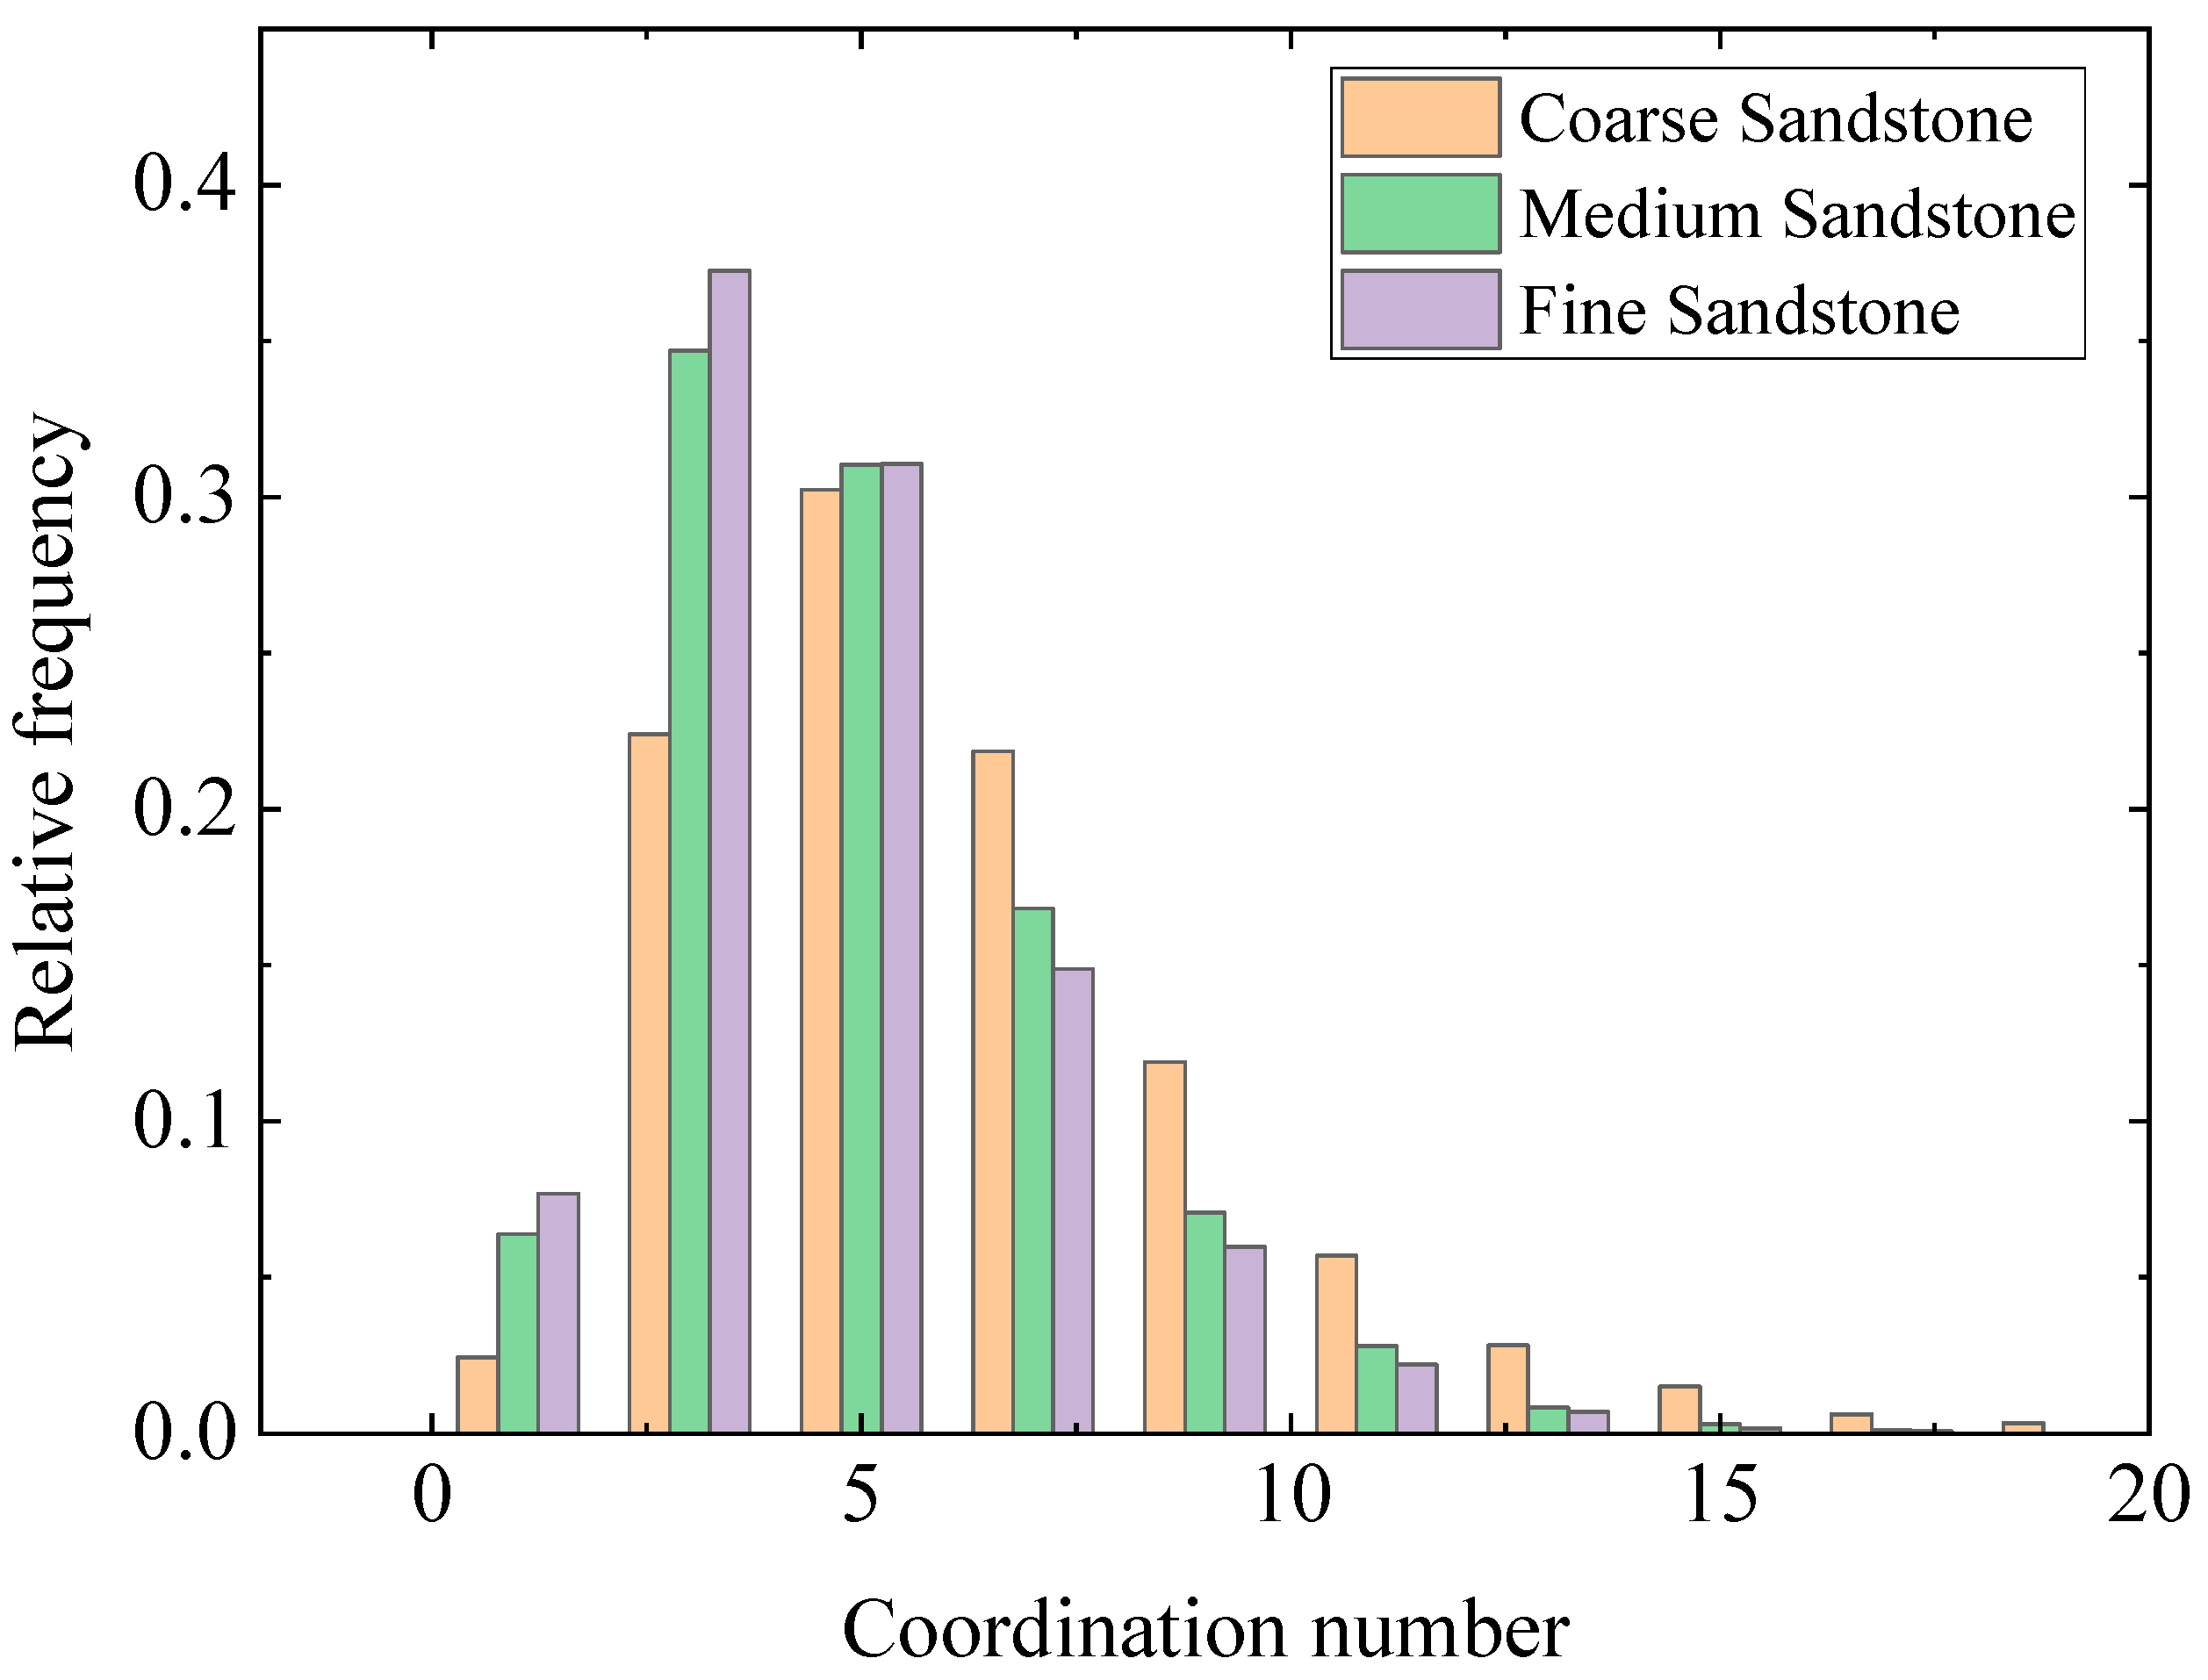
3.2. Coordination Number, Pore Size, and Pore Throat Radius Distribution

Coordination number refers to the number of equivalent pore spheres interconnected in the network model of sandstone, and a larger coordination number indicates better connectivity between pores. Figure 9 shows the histogram of coordination number statistical analysis for three types of sandstones. It can be seen from the graph that the distribution pattern of coordination numbers for the three types of sandstones is consistent. The coordination number of coarse sandstone is significantly higher than that of medium sandstone and fine sandstone, and the coordination number of medium sandstone is slightly higher than that of fine sandstone. This indicates that the good pore connectivity of coarse sandstone is beneficial for fluid flow. Although the porosity of medium sandstone and fine sandstone is relatively close, the coordination number of medium sandstone is slightly higher than that of fine sandstone. Therefore, the permeability of medium sandstone is due to the permeability of fine sandstone. Furthermore, the average coordination numbers of coarse sandstone, medium sand salt, and fine sandstone are 5.7, 4.4, and 4.2, respectively.
Figure 10 shows the statistical distribution of pore size and pore throats for three types of sandstones. It can be seen from the figure that the distribution of pore size follows a logarithmic exponential distribution, while the distribution of pore throats follows a Weibull distribution. The average pore size of coarse sandstone, medium sandstone, and fine sandstone is 56.57 μm, 51.52 μm and 49.81 μm, respectively. The average pore size of coarse sandstone, medium sandstone, and fine sandstone is 18.8 μm, 16.12 μm and 16.09 μm, respectively. For sandstone, the average pore throat radius is about one third of the average pore radius.

4. Numerical Simulation of Fluid Flow

4.1. Model Description

In the pore structure of sandstone, connected pores are the main channels for fluid migration and play a crucial role in the permeability of sandstone. It is difficult to obtain the flow pattern of fluids in pore structures through experimental methods; therefore, numerical simulation methods are used to simulate the flow mechanism of fluids in pore structures. Due to the fact that the simulation in this study only focuses on the internal flow of water in the microstructure of sandstone, the most basic control equations were used for simulation. Ignoring the changes in water density during the flow process, the flow of water in sandstone microstructures can be regarded as incompressible viscous flow, which follows three physical conservation laws (mass conservation, momentum conservation, and energy conservation). Therefore, flow can be described directly using Navier–Stokes equations. The same method was also used in references [1,2,3,4,5,6] to simulate the flow of fluids in pore structures.
· u = 0
μ 2 u p + ρ g = 0
where u is the velocity vector (m/s), p is the fluid pressure (Pa), ρ is the density of the fluid ( kg / m 3 ), μ is the fluid viscosity, and g is the gravitational acceleration vector.
It is worth noting that in order to simplify the simulation and analysis process, the following assumptions are made: (a) water only flows within the pores and will not penetrate into the framework matrix of residual sandstone soil; (b) water is an incompressible Newtonian fluid and its temperature remains constant during pore flow; (c) water flows continuously; (d) water is only affected by gravity and pressure.
The Representative Volume Element (RVE) selected for the typical sandstone pore structure in this article is, 250 μm × 250 μm × 250 μm, as shown in Figure 11a. Furthermore, during the simulation process, the inlet velocity was 0.01 m/s and a free tetrahedral mesh was used, as shown in Figure 11. Table 2 lists the basic parameters for numerical simulation. The convergence criterion for numerical simulation is a relative tolerance of less than 0.001. The mesh adopts a free hexahedral mesh, as shown in Figure 11b. The total number of elements (FEM) used to obtain the solution is 133,129. The numerical model is solved using the commercial finite element software COMSOL 6.1.

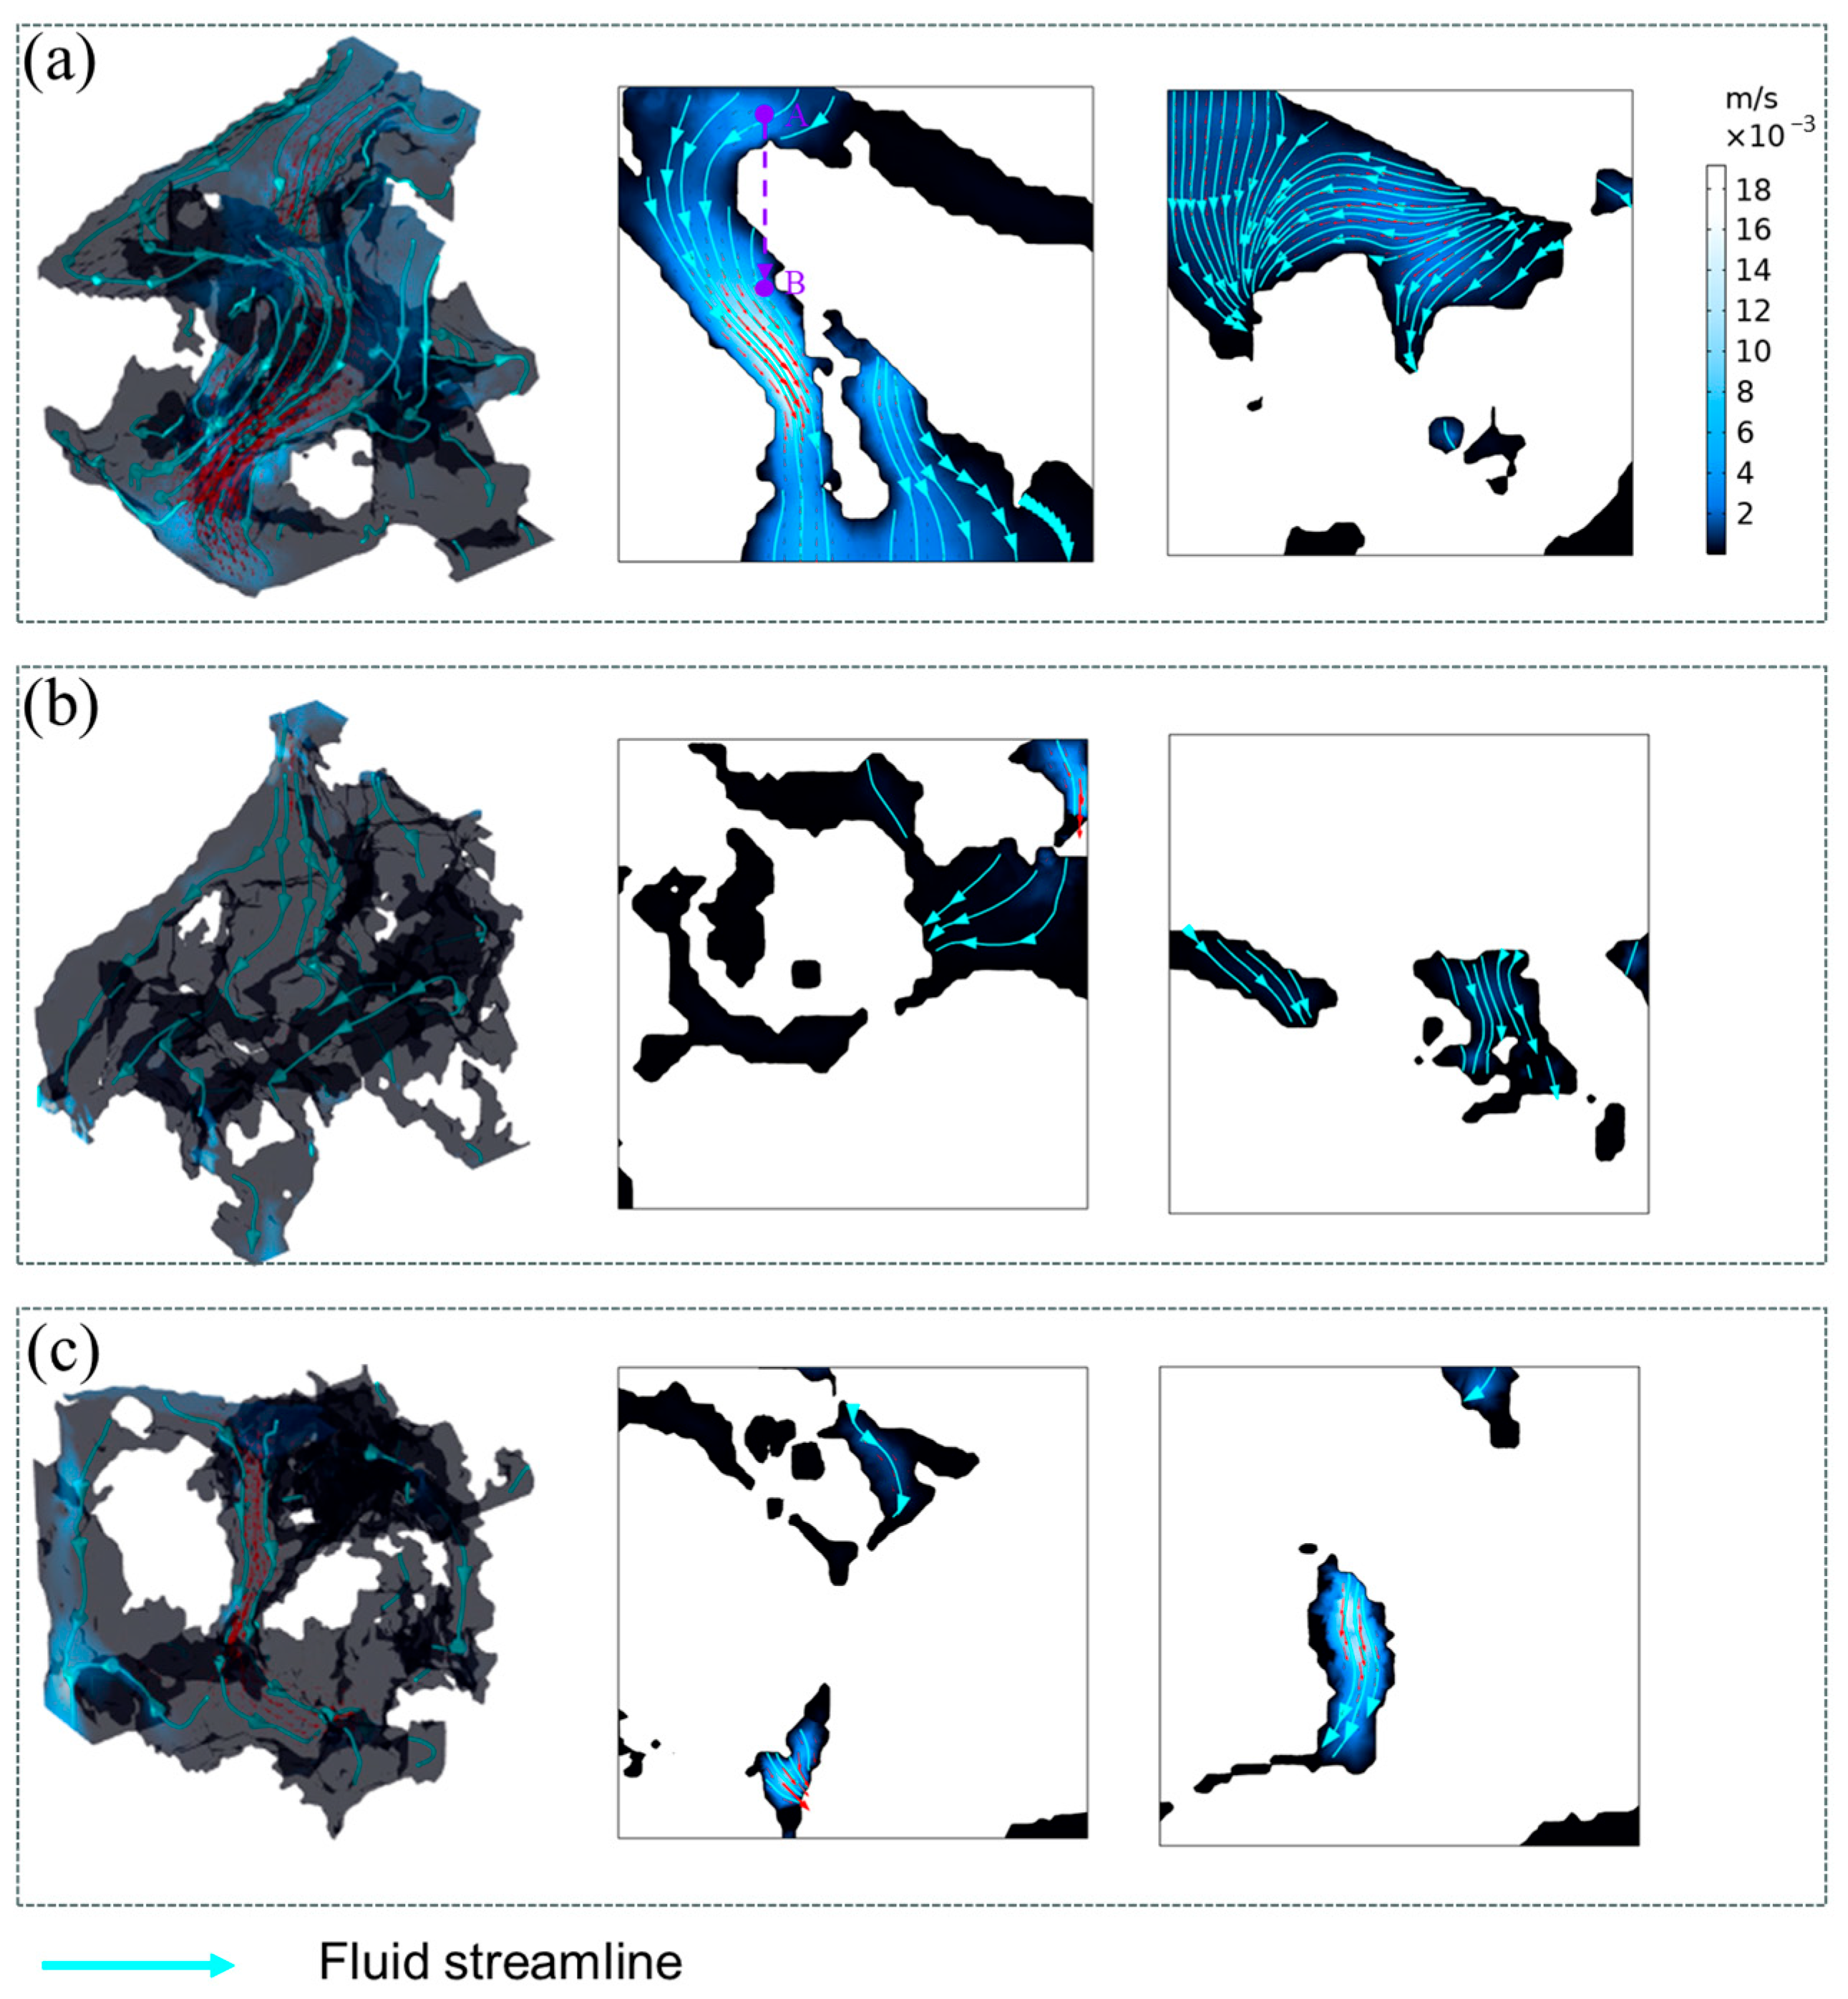
4.2. Seepage Velocity and Streamline Distribution

Figure 12 shows the flow velocity and streamline distribution of three typical representative sandstone elements. It can be seen that although the flow velocity at the entrance of the three typical representative sandstone elements is 0.001 m/s, the distribution of flow velocity in the sandstone pore structure is not uniform. At the pore throat, due to the reduction in fluid flow channels, the flow velocity increases. Furthermore, the complexity of sandstone pores leads to a tortuous streamline, which increases the flow path of fluids and reduces the permeability of sandstone. For example, in homogeneous materials, the fluid moves along a straight line from point A to point B, while considering pore structure, the fluid needs to move along the pore structure to point B.

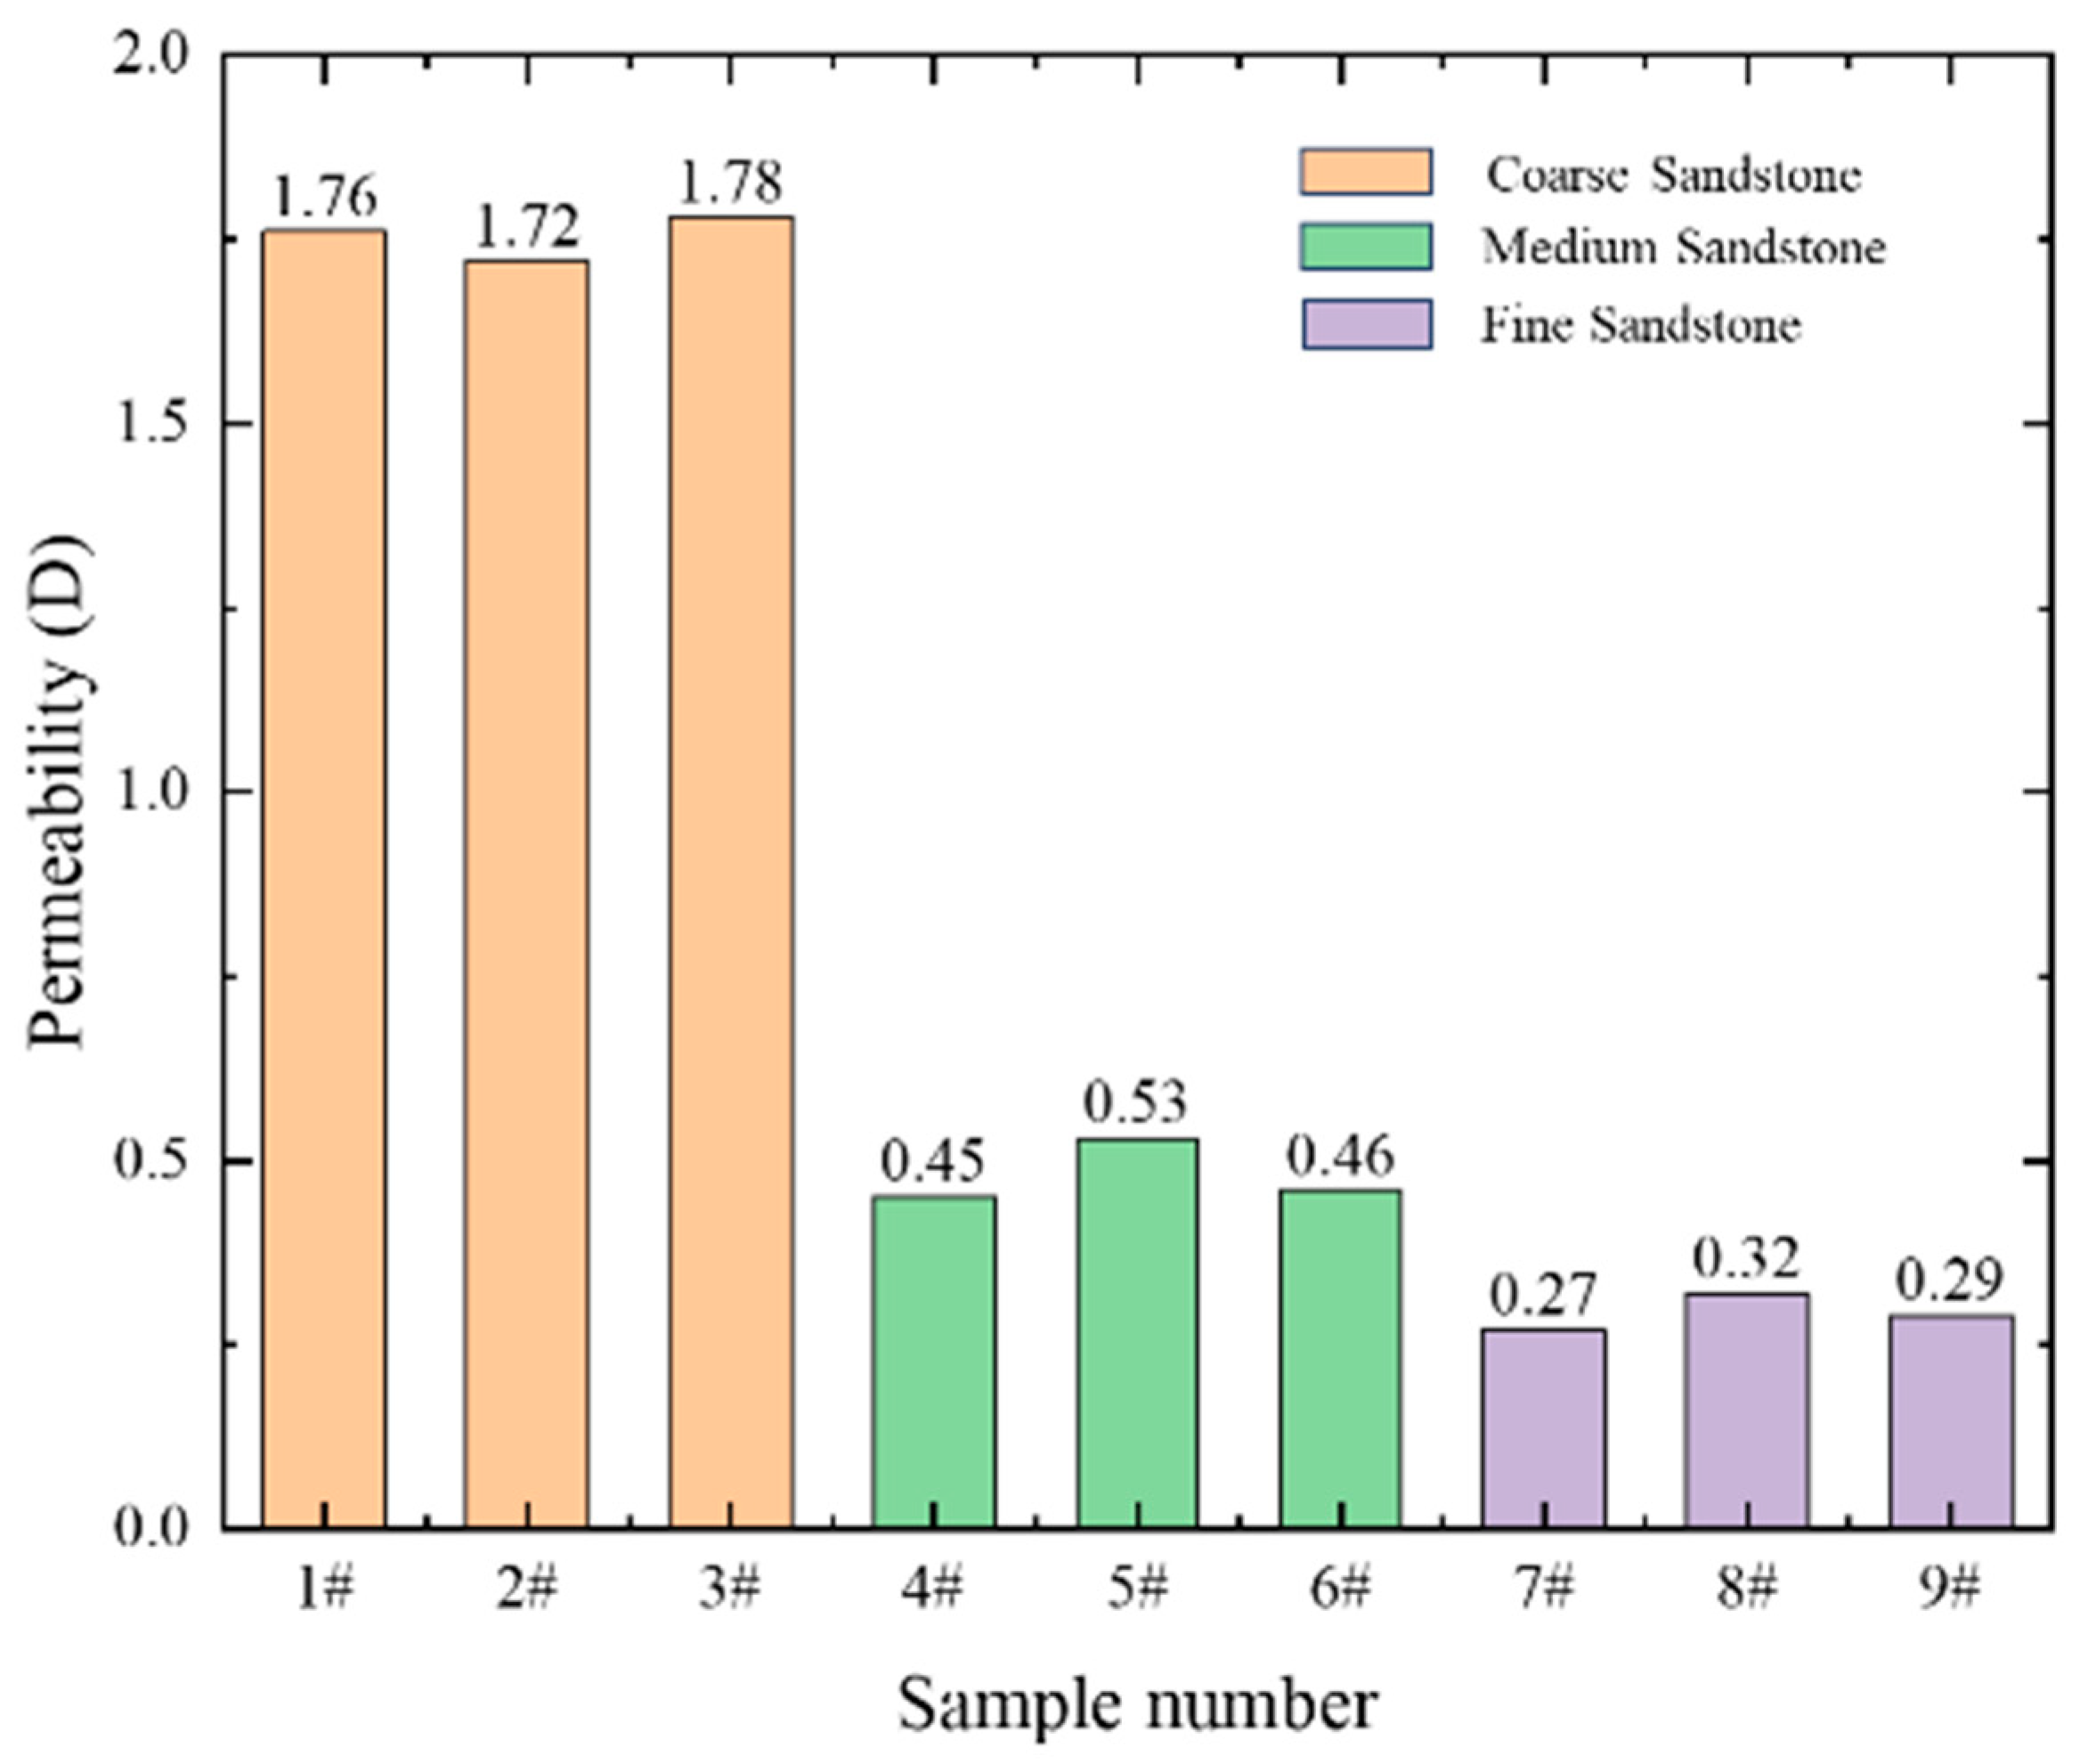
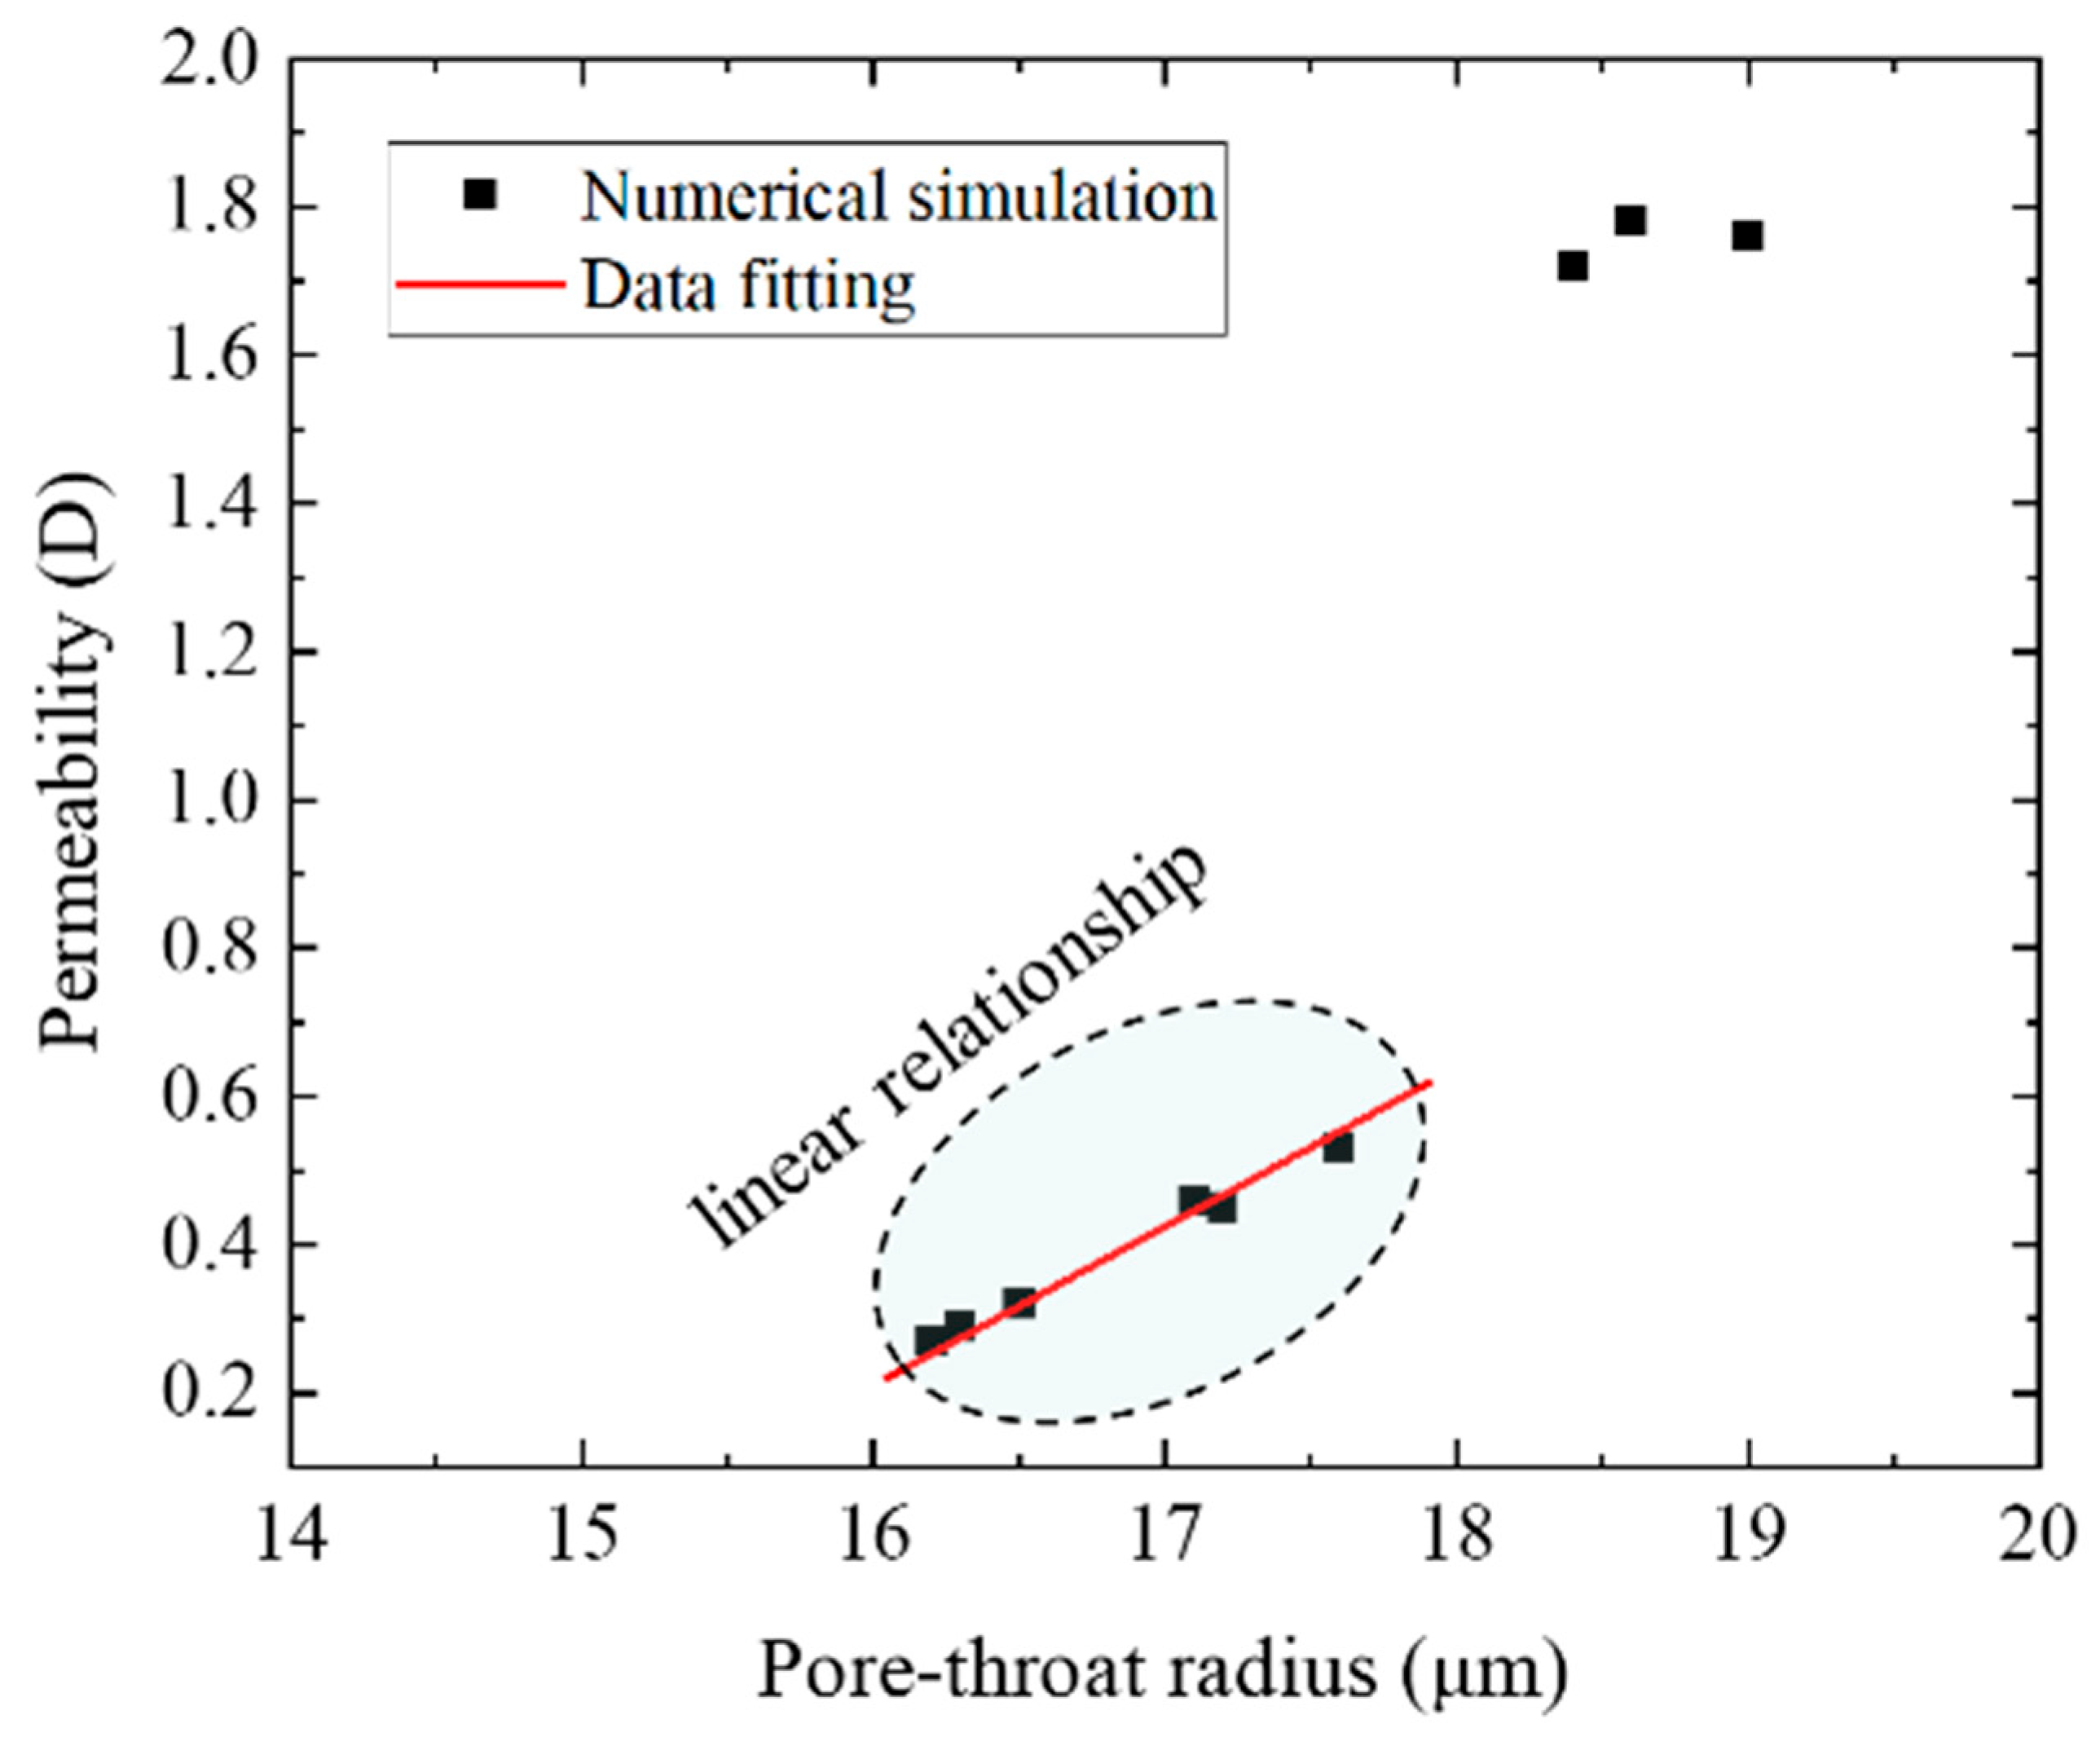
4.3. Permeability of Sandstone

According to Darcy’s law, the effective permeability coefficient of representative volume elements of sandstone can be expressed as shown below:
k e f f = u o u t μ L Δ p
where k e f f is the effective permeability of representative sandstone elements (D = 1 μm2), L is the distance between the inlet and outlet, and Δ p is the pressure gradient.
Figure 13 shows the permeability bar charts of RVE for nine samples. It can be seen from the graph that the permeability of coarse sandstone is higher, while that of medium sandstone and fine sandstone is lower. Figure 14 shows the relationship between permeability and porosity. It can be seen that although there is a linear relationship between permeability and porosity as a whole, its correlation coefficient is 0.96.
However, in a low-permeability zone, the variability of permeability is significant, and the reliability of using a single porosity index to evaluate sandstone permeability is relatively low. Figure 15 shows the relationship between permeability and pore throat radius. It can be seen from the figure that in the low permeability region, there is a good linear relationship between permeability and pore throat radius. Therefore, for low-permeability medium sandstone and fine sandstone, two or more pore structure characteristic parameters should be used to evaluate the permeability of sandstone.

5. Conclusions

This paper reconstructed the pore structure of sandstone by CT and numerically simulated the fluid flow process in sandstone. The following conclusions can be drawn.
(a)
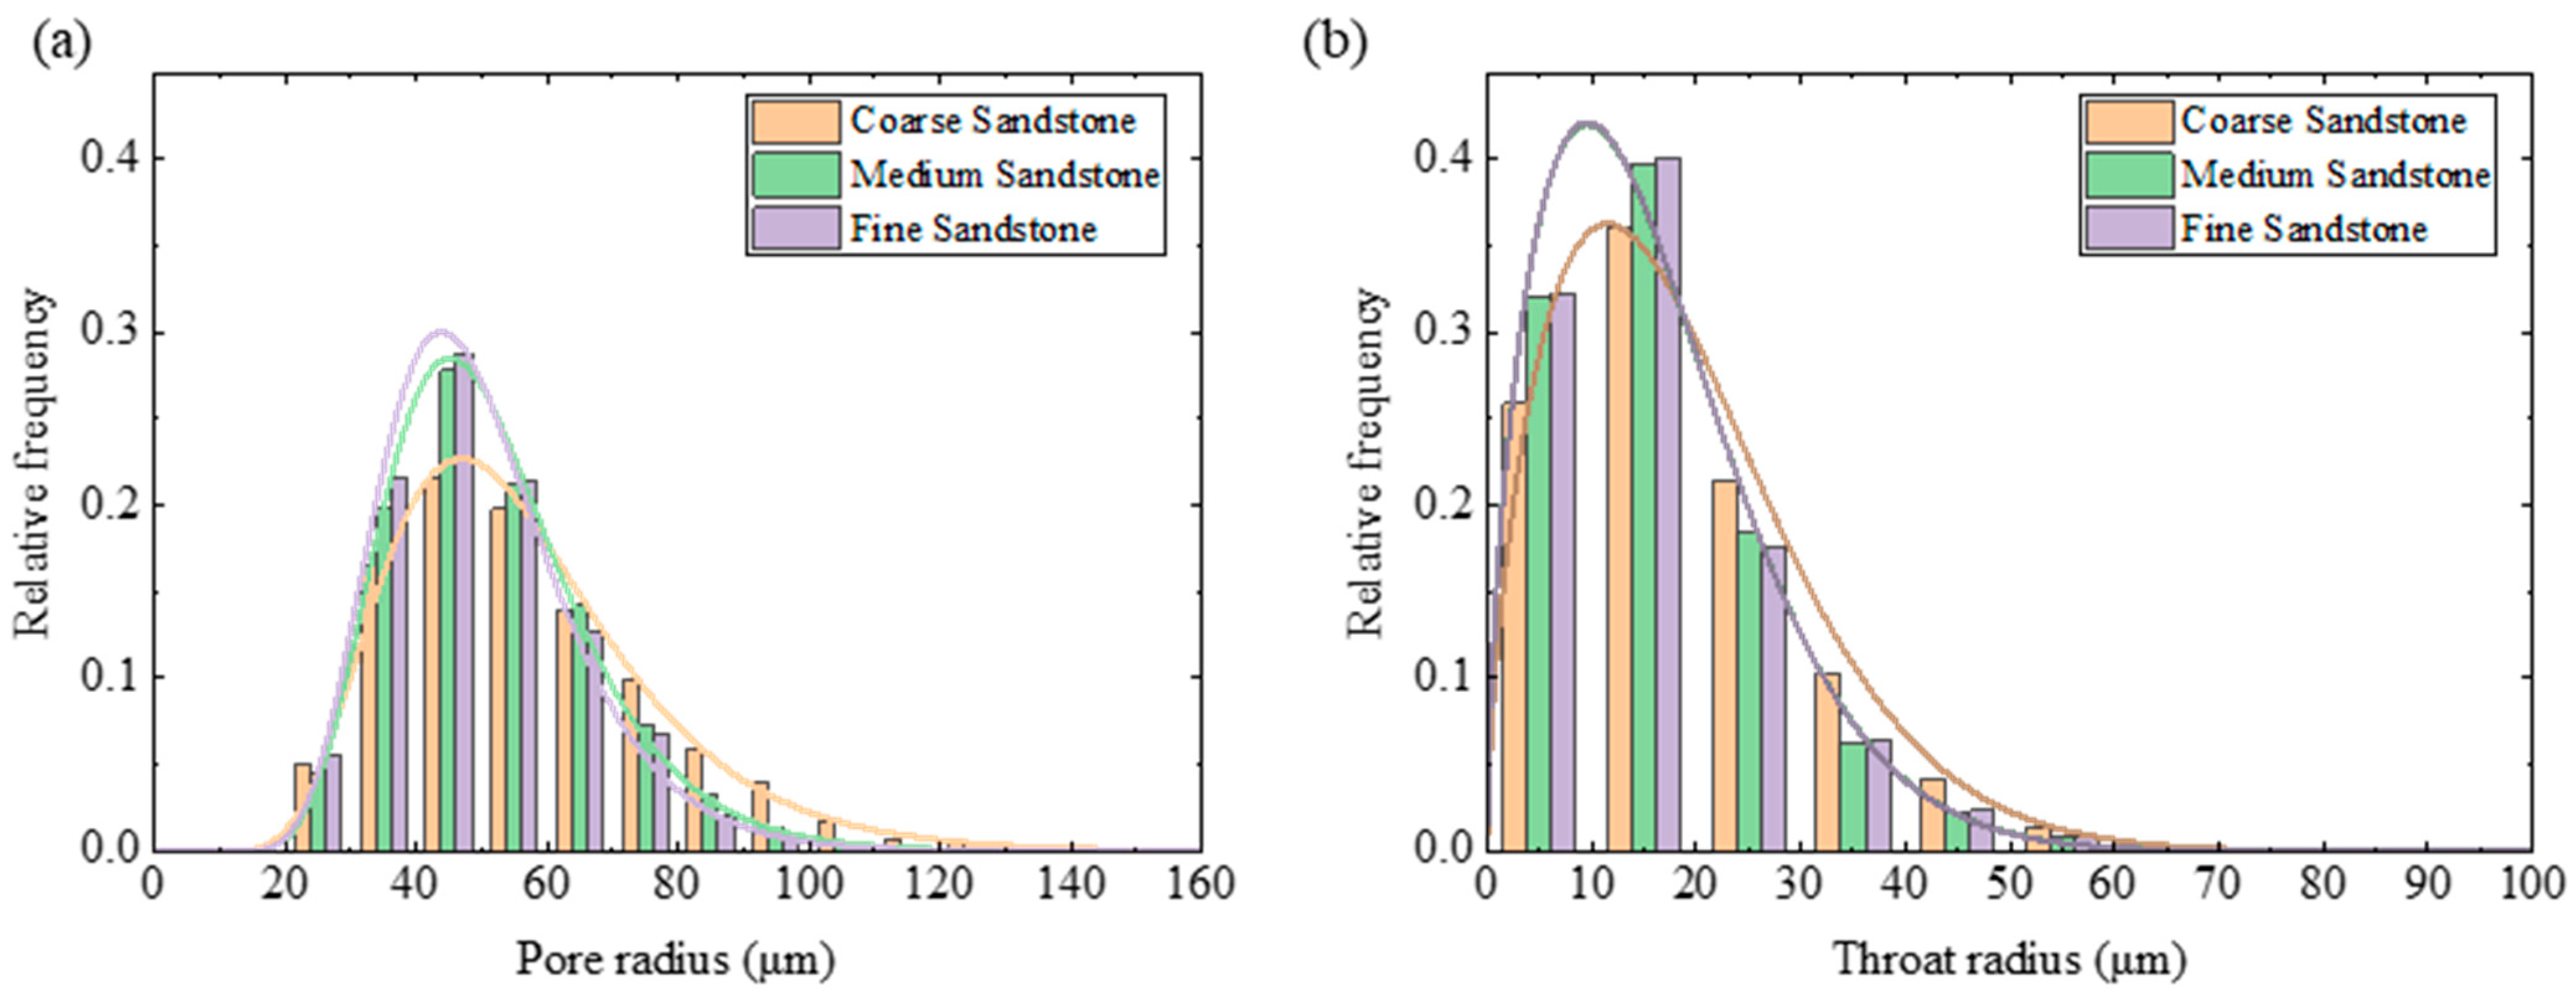
The porosity of coarse sandstone, medium sandstone, and fine sandstone are 16.43%, 12.03%, and 11.64%, respectively. The porosity of medium sandstone and fine sandstone is relatively similar, but the average pore radius, pore throat radius, and coordination number of medium sandstone are slightly larger than those of fine sandstone, which is conducive to fluid flow in fine sandstone.
(b)
The distribution pattern of pore structure characteristics in coarse sandstone, medium sandstone, and fine sandstone is consistent with pore size following a lognormal distribution and pore throat radius following a Weibull distribution. And the unconnected pores of the three types of sandstones are all less than 0.5%, indicating that the unconnected pores of sandstones can be ignored.
(c)
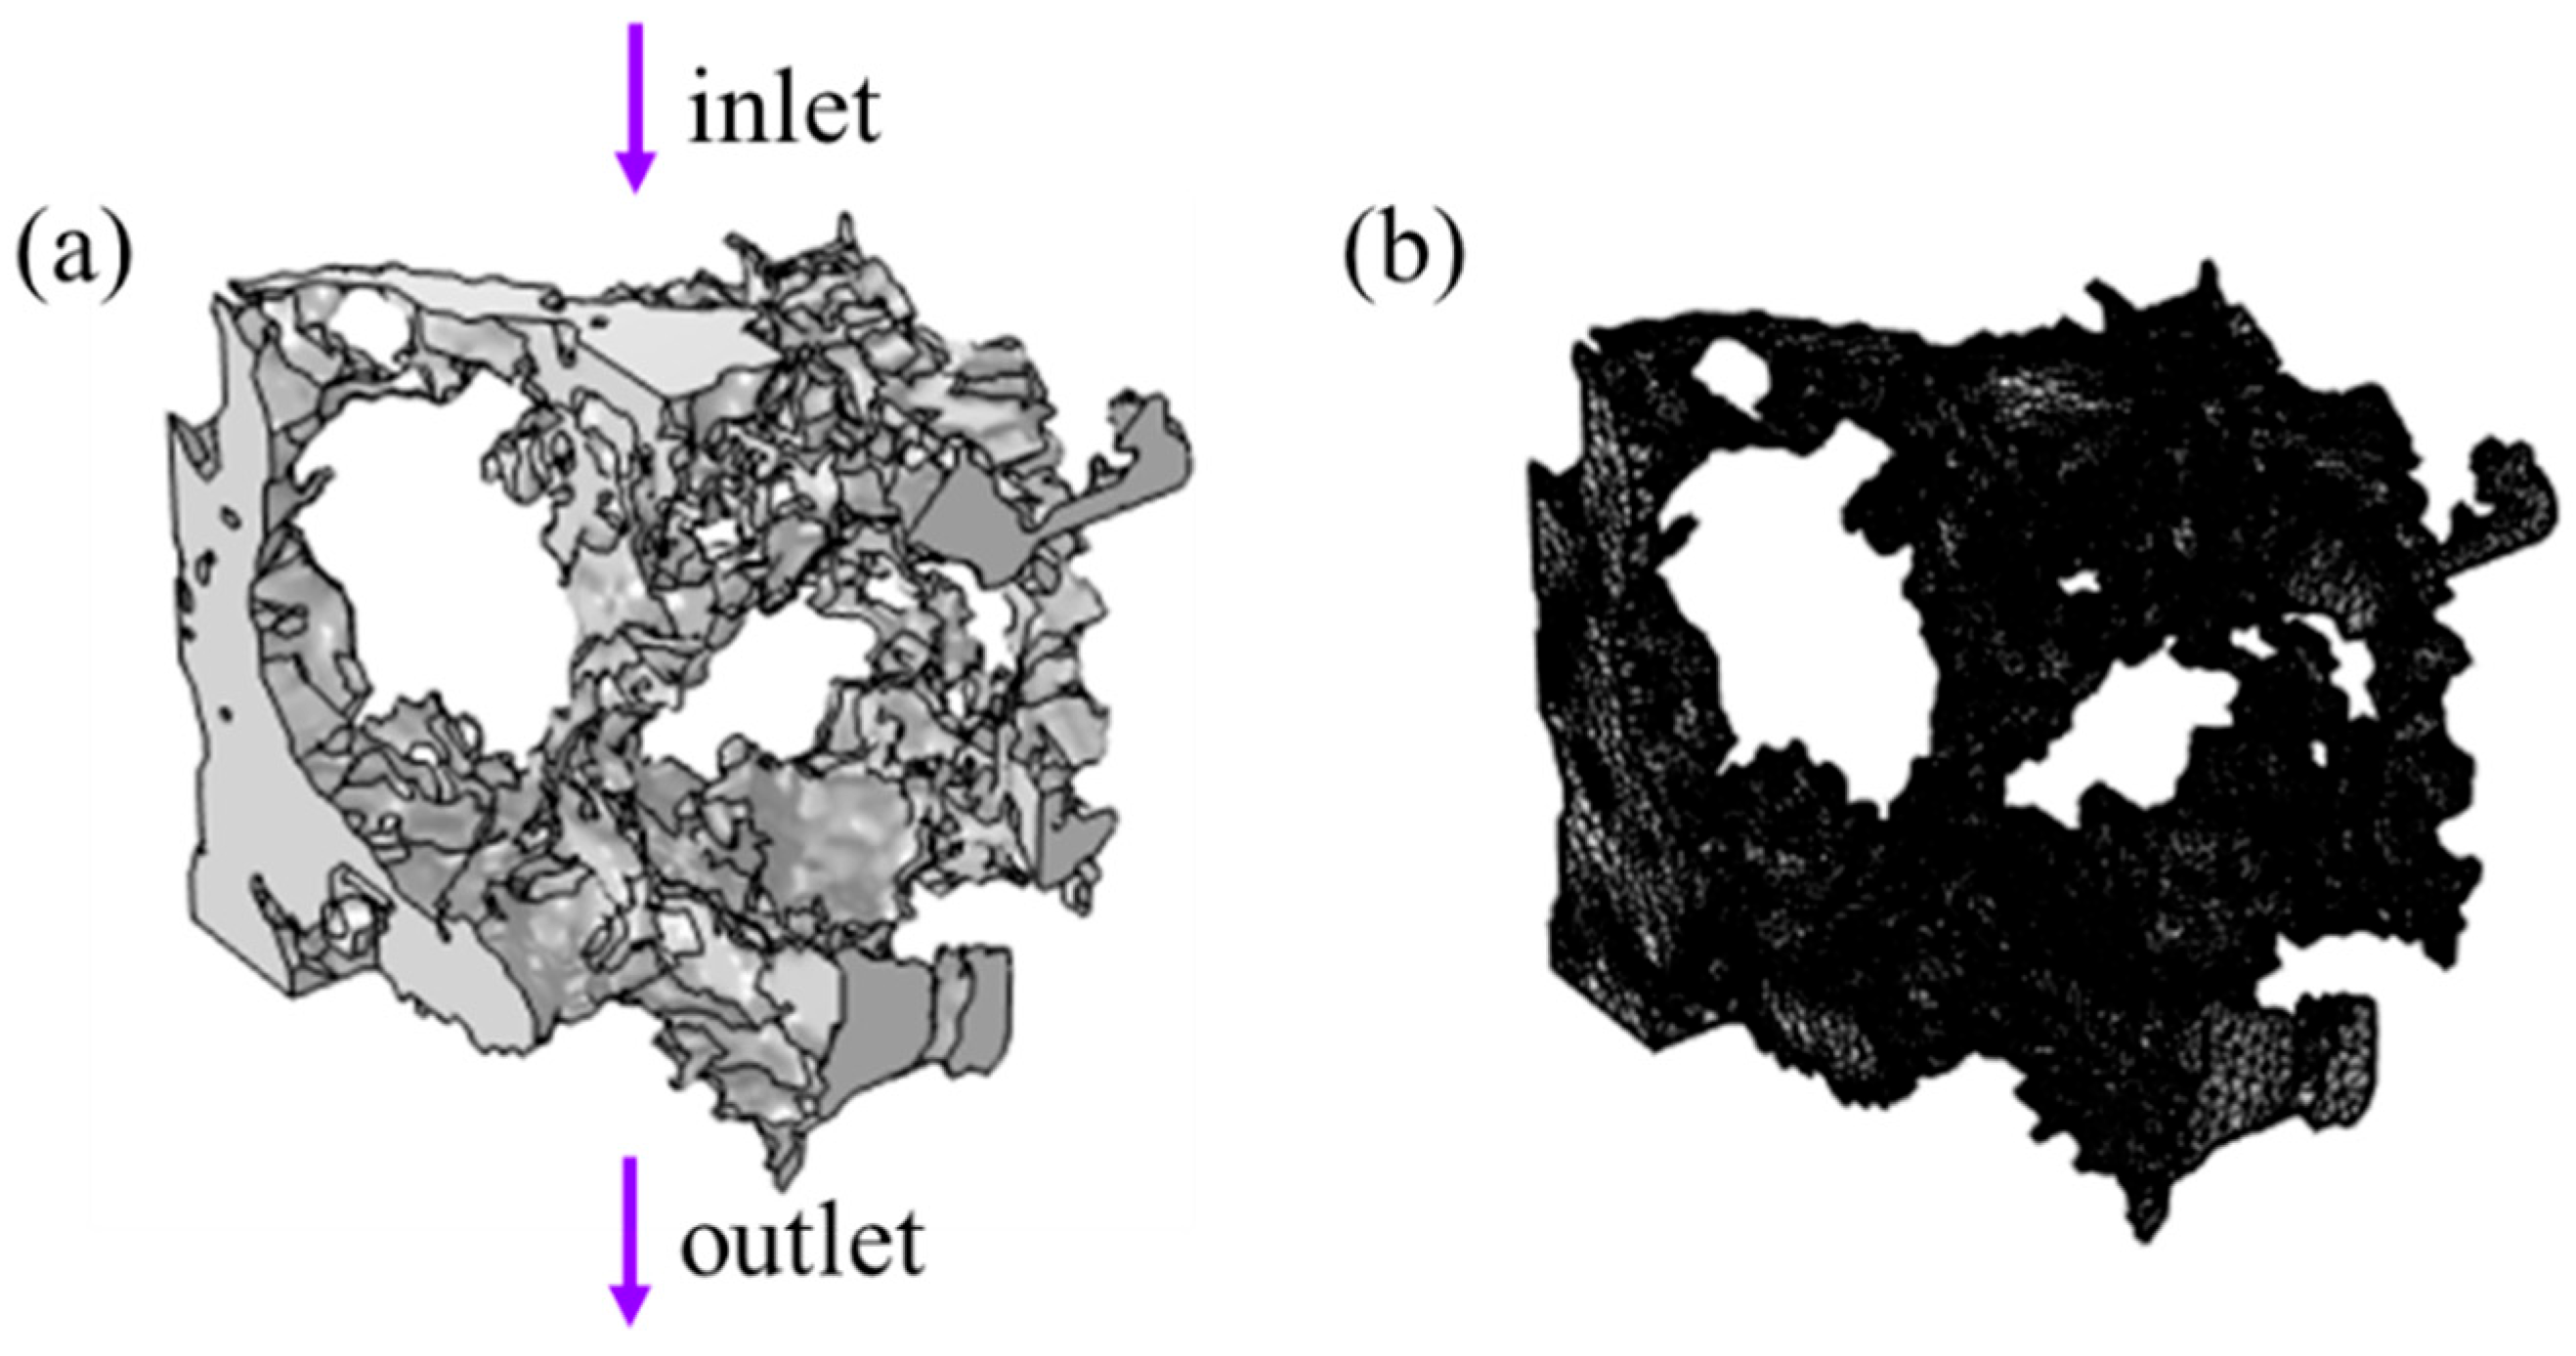
The fluid flow process in sandstone was reproduced through numerical simulation, and the flow velocity significantly increased at the pore throat. And the complexity of the pore structure increased the path of fluid flow and reduced the permeability of sandstone.
(d)
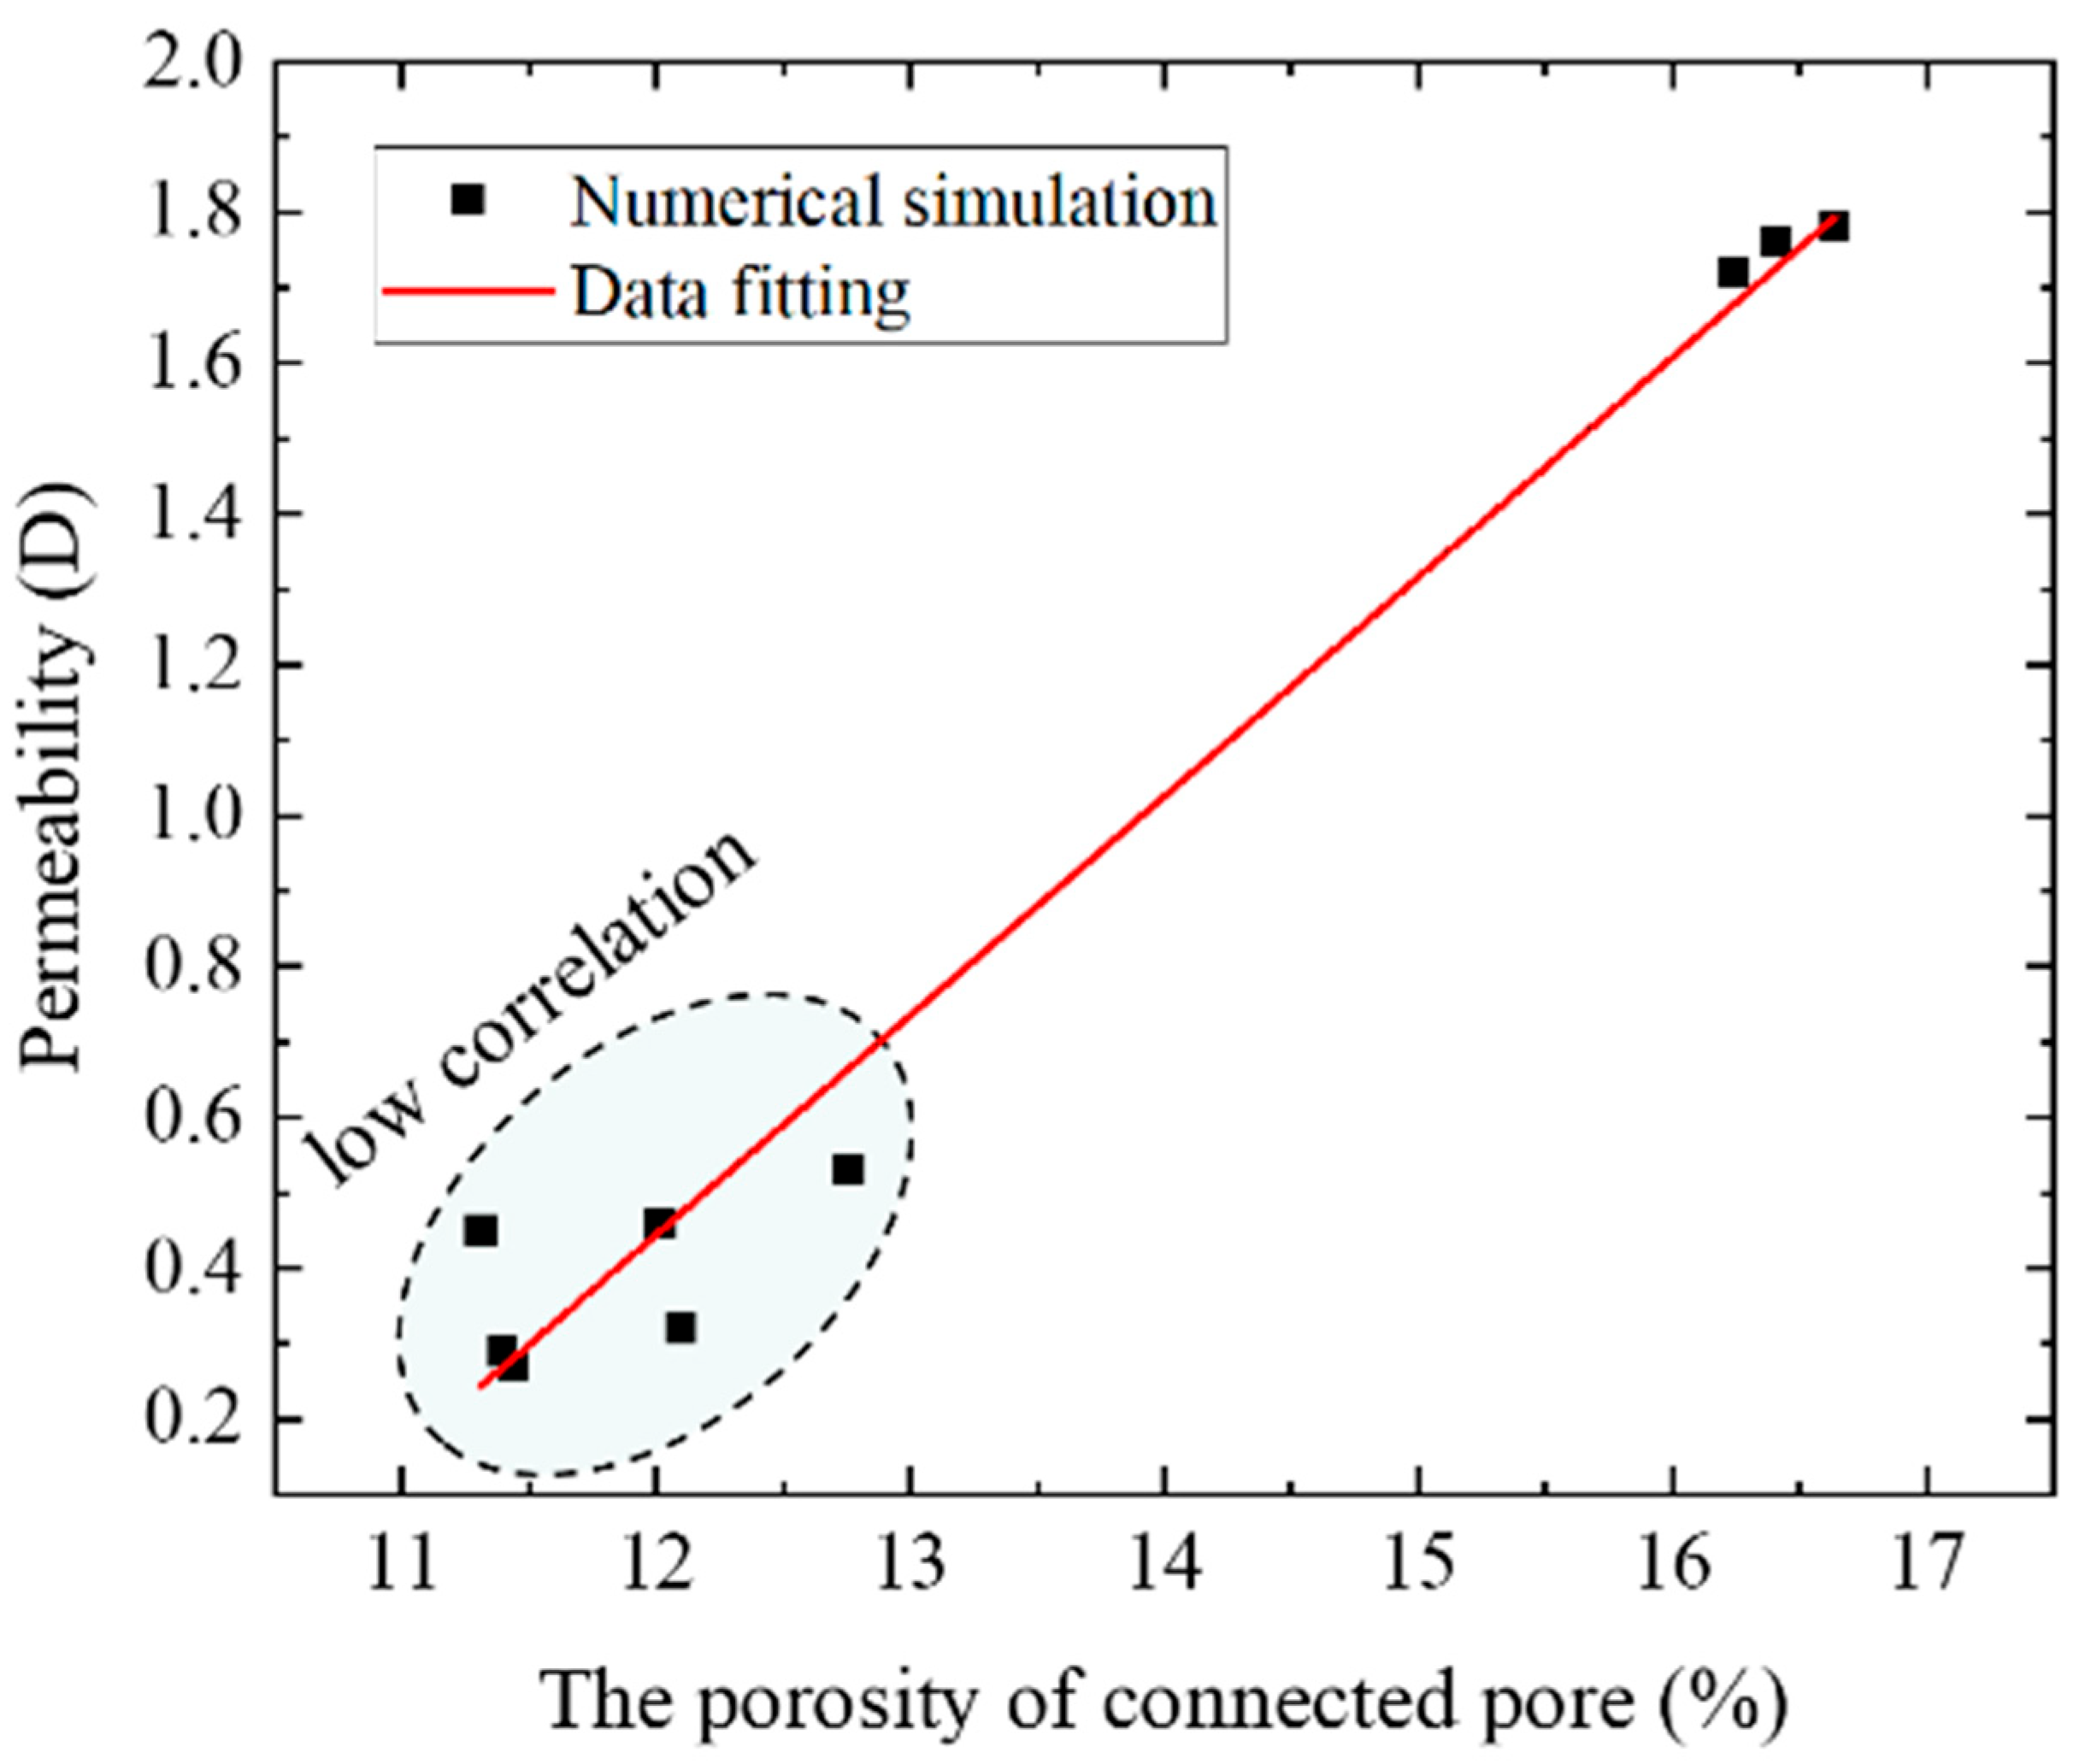
The permeability and porosity of sandstone are generally linearly related and have a high correlation. However, there is a significant difference in permeability and porosity in low-permeability sandstone samples, and pore structure characteristic parameters are needed to assist in determining the permeability of pores.

Author Contributions

K.Z.: Conceptualization, Writing—review and editing, Writing—original draft. K.L. (Kai Li): Supervision, Software, Writing—review and editing, Validation. Y.J.: Writing—review and editing, Investigation, Data curation. X.L. (Xiaolong Li): Investigation, Writing—review and editing, Software. X.L. (Xuan Liu): Investigation, Writing—review and editing, Software. K.L. (Kaide Liu): Investigation, Writing—review and editing, Software. X.C.: Investigation, Writing—review and editing, Software. All authors have read and agreed to the published version of the manuscript.

Funding

This study was financially supported by the Shaanxi Provincial Natural Science Foundation (Grant No. 2019JM-182) and China Coal Science and Technology Innovation Fund (Grant No. 2023-TD-MS016).

Data Availability Statement

Data are contained within the article.

Conflicts of Interest

Authors Kaipeng Zhu, Kai Li, Yadong Ji, Xiaolong Li, Xuan Liu were employed by the company CCTEG Xi’an Research Institute (Group) Co., Ltd. The remaining authors declare that the research was conducted in the absence of any commercial or financial relationships that could be construed as a potential conflict of interest.

References

  1. Chi, P.; Sun, J.; Yan, W.; Luo, X. Multiscale fusion of tight sandstone digital rocks using attention-guided generative adversarial network. Mar. Pet. Geol. 2024, 160, 106647. [Google Scholar] [CrossRef]
  2. Zhao, Y.; Qin, W.; Jin, A.; Wu, H.; Chen, Z. Research and analysis of the impact of the pore structure on the mechanical properties and fracture mechanism of sandstone. Mater. Today Commun. 2024, 38, 107753. [Google Scholar] [CrossRef]
  3. Wu, B.; Xie, R.; Wang, X.; Wang, T.; Yue, W. Characterization of pore structure of tight sandstone reservoirs based on fractal analysis of NMR echo data. J. Nat. Gas Sci. Eng. 2020, 81, 103483. [Google Scholar] [CrossRef]
  4. Xie, Y.; Luo, Z.; Cheng, L.; Zhao, L.; Chen, X.; Zhang, N.; Ren, D.; Cao, Y. Numerical modeling and analysis of the matrix acidizing process in fractured sandstone rocks with the Extended–FEM. J. Pet. Sci. Eng. 2023, 220, 111215. [Google Scholar] [CrossRef]
  5. Qin, X.; Xia, Y.; Qiao, J.; Chen, J.; Zeng, J.; Cai, J. Modeling of multiphase flow in low permeability porous media: Effect of wettability and pore structure properties. J. Rock Mech. Geotech. Eng. 2023. [Google Scholar] [CrossRef]
  6. Yang, Y.; Zhang, W.; Gao, Y.; Wan, Y.; Su, Y.; An, S.; Sun, H.; Zhang, L.; Zhao, J.; Liu, L.; et al. Influence of stress sensitivity on microscopic pore structure and fluid flow in porous media. J. Nat. Gas Sci. Eng. 2016, 36, 20–31. [Google Scholar] [CrossRef]
  7. Song, J.; Liu, J.; Song, R.; Song, Y. Study on Permeability Stress-Sensitivity in Seepage-Geomechanical Coupling of Fractured Deep Tight Sandstone Gas Reservoirs. Appl. Sci. 2022, 12, 11672. [Google Scholar] [CrossRef]
  8. Ban, S.; Liu, H.; Mao, H.; Shi, X.; Qiu, X.; Liu, M.; Min, Z.; Song, Y.; Wei, X. Numerical Tracking of Natural Gas Migration in Underground Gas Storage with Multilayered Sandstone and Fault-Bearing Caprocks. Energies 2023, 16, 4936. [Google Scholar] [CrossRef]
  9. Jiang, Z.; Tang, H.; Wang, J.; Zhang, L.; Wang, X. Characterization of Extra Low-Permeability Conglomerate Reservoir and Analysis of Three-Phase Seepage Law. Processes 2023, 11, 2054. [Google Scholar] [CrossRef]
  10. Manwart, C.; Aaltosalmi, U.; Koponen, A.; Hilfer, R.; Timonen, J. Lattice-Boltzmann and finite-difference simulations for the permeability for three-dimensional porous media. Phys. Rev. E 2002, 66, 016702. [Google Scholar] [CrossRef]
  11. Da Wang, Y.; Chung, T.; Armstrong, R.T.; McClure, J.E.; Mostaghimi, P. Computations of permeability of large rock images by dual grid domain decomposition. Adv. Water Resour. 2019, 126, 1–14. [Google Scholar] [CrossRef]
  12. Kristinof, R.; Ranjith, P.G.; Choi, S.K. Finite element simulation of fluid flow in fractured rock media. Environ. Earth Sci. 2010, 60, 765–773. [Google Scholar] [CrossRef]
  13. Navas, P.; López-Querol, S. Generalized unconfined seepage flow model using displacement-based formulation. Eng. Geol. 2013, 166, 140–151. [Google Scholar] [CrossRef]
  14. Gardner, L.R.; Wilson, A.M. Comparison of four numerical models for simulating seepage from salt marsh sediments. Estuar. Coast. Shelf Sci. 2006, 69, 427–437. [Google Scholar] [CrossRef]
  15. Borujeni, A.T.; Lane, N.M.; Thompson, K.; Tyagi, M. Effects of image resolution and numerical resolution on computed permeability of consolidated packing using LB and FEM pore-scale simulations. Comput. Fluids 2013, 88, 753–763. [Google Scholar] [CrossRef]
  16. Karimi, M.; Ayatollahi, S. A new wormhole mechanistic model for radial acid flow geometry using novel 3D flow correlations. Geoenergy Sci. Eng. 2023, 230, 212176. [Google Scholar] [CrossRef]
  17. Xiao, H.; He, L.; Li, J.; Zou, C.; Shao, C. Permeability prediction for porous sandstone using digital twin modeling technology and Lattice Boltzmann method. Int. J. Rock Mech. Min. Sci. 2021, 142, 104695. [Google Scholar] [CrossRef]
  18. Liu, X.; Wang, J.; Ge, L.; Hu, F.; Li, C.; Li, X.; Yu, J.; Xu, H.; Lu, S.; Xue, Q. Pore-scale characterization of tight sandstone in Yanchang Formation Ordos Basin China using micro-CT and SEM imaging from nm- to cm-scale. Fuel 2017, 209, 254–264. [Google Scholar] [CrossRef]
  19. Rabbani, A.; Ayatollahi, S.; Kharrat, R.; Dashti, N. Estimation of 3-D pore network coordination number of rocks from watershed segmentation of a single 2-D image. Adv. Water Resour. 2016, 94, 264–277. [Google Scholar] [CrossRef]
  20. Rabbani, A.; Jamshidi, S.; Salehi, S. An automated simple algorithm for realistic pore network extraction from micro-tomography images. J. Pet. Sci. Eng. 2014, 123, 164–171. [Google Scholar] [CrossRef]
  21. Chamani, H.; Rabbani, A.; Russell, K.P.; Zydney, A.L.; Gomez, E.D.; Hattrick-Simpers, J.; Werber, J.R. Data-science-based reconstruction of 3-D membrane pore structure using a single 2-D micrograph. J. Memb. Sci. 2023, 678, 121673. [Google Scholar] [CrossRef]
  22. Durr, N.; Sauer, M.; Hiermaier, S. A numerical study on mesoscale simulation of quartzite and sandstone under shock loading. Int. J. Impact Eng. 2017, 108, 73–88. [Google Scholar] [CrossRef]
  23. Zakirov, T.R.; Varfolomeev, M.A.; Yuan, C. Characterization of dynamic adsorption regimes in synthetic and natural porous structures using lattice Boltzmann simulations. Chem. Eng. Res. Des. 2023, 189, 14–29. [Google Scholar] [CrossRef]
  24. Zhao, T.; Zhao, H.; Ning, Z.; Li, X.; Wang, Q. Permeability prediction of numerical reconstructed multiscale tight porous media using the representative elementary volume scale lattice Boltzmann method. Int. J. Heat Mass Transf. 2018, 118, 368–377. [Google Scholar] [CrossRef]
  25. Zhang, Q.; Dong, Y.; Deng, H.; Elsworth, D. High-resolution characterization of nanoparticle transport in heterogeneous porous media via low-field nuclear magnetic resonance. J. Hydrol. 2020, 583, 124558. [Google Scholar] [CrossRef]
  26. Cao, D.; Hou, Z.; Liu, Q.; Fu, F. Reconstruction of three-dimension digital rock guided by prior information with a combination of InfoGAN and style-based GAN. J. Pet. Sci. Eng. 2022, 208, 109590. [Google Scholar] [CrossRef]
  27. Huang, H.; Sun, W.; Ji, W.; Zhang, R.; Du, K.; Zhang, S.; Ren, D.; Wang, Y.; Chen, L.; Zhang, X. Effects of pore-throat structure on gas permeability in the tight sandstone reservoirs of the Upper Triassic Yanchang formation in the Western Ordos Basin, China. J. Pet. Sci. Eng. 2018, 162, 602–616. [Google Scholar] [CrossRef]
  28. Yang, X.; Kuru, E.; Gingras, M.; Iremonger, S. CT-CFD integrated investigation into porosity and permeability of neat early-age well cement at downhole condition. Constr. Build. Mater. 2019, 205, 73–86. [Google Scholar] [CrossRef]
  29. Rabbani, A. Superpixels pore network extraction for geological tomography images. Adv. Water Resour. 2023, 182, 104582. [Google Scholar] [CrossRef]
  30. Farokhian, D.; Azin, R.; Ranjbar, A. Application of medical and dental CT-Scan technologies for determining porosity distribution of the Persian Gulf coastal zone and Zagros basin core samples. J. Afr. Earth Sci. 2019, 150, 96–106. [Google Scholar] [CrossRef]
  31. Liu, S.; Zhang, L.; Su, X.; Zhao, L.; Wang, Y. Micro-CT characterization on pore structure evolution of low-permeability sandstone under acid treatment. Appl. Geochem. 2023, 152, 105633. [Google Scholar] [CrossRef]
  32. Bera, B.; Mitra, S.K.; Vick, D. Understanding the micro structure of Berea Sandstone by the simultaneous use of micro-computed tomography (micro-CT) and focused ion beam-scanning electron microscopy (FIB-SEM). Micron 2011, 42, 412–418. [Google Scholar] [CrossRef] [PubMed]
  33. Zhang, Y.; Kogure, T.; Nishizawa, O.; Xue, Z. Different flow behavior between 1-to-1 displacement and co-injection of CO2 and brine in Berea sandstone: Insights from laboratory experiments with X-ray CT imaging. Int. J. Greenh. Gas Control 2017, 66, 76–84. [Google Scholar] [CrossRef]
  34. Li, T.; Li, M.; Jing, X.; Xiao, W.; Cui, Q. Influence mechanism of pore-scale anisotropy and pore distribution heterogeneity on permeability of porous media. Pet. Explor. Dev. 2019, 46, 594–604. [Google Scholar] [CrossRef]
  35. Khishvand, M.; Akbarabadi, M.; Piri, M. Micro-scale experimental investigation of the effect of flow rate on trapping in sandstone and carbonate rock samples. Adv. Water Resour. 2016, 94, 379–399. [Google Scholar] [CrossRef]
  36. Chen, L.; Zhang, D.; Zhang, W.; Guo, J.; Yao, N.; Fan, G.; Zhang, S.; Wang, X.; Wu, P. Experimental Investigation on Post-Peak Permeability Evolution Law of Saturated Sandstone under Various Cyclic Loading–Unloading and Confining Pressure. Water 2022, 14, 1773. [Google Scholar] [CrossRef]
  37. Tang, P.; Zhang, W.; Wang, H.; Zhou, J.; Dang, Y.; Chao, Z. Analysis of the Hydromechanical Properties of Compact Sandstone and Engineering Application. Water 2023, 15, 2011. [Google Scholar] [CrossRef]
  38. Ju, X.; Niu, F.; Liu, M.; Luo, J. Evolution characteristics of freeze–thaw-induced sandstone damage under water immersion conditions in Changdu, Tibet, China. Cold Reg. Sci. Technol. 2024, 217, 104013. [Google Scholar] [CrossRef]
  39. Zhang, K.; Lai, J.; Bai, G.; Pang, X.; Ma, X.; Qin, Z.; Zhang, X.; Fan, X. Comparison of fractal models using NMR and CT analysis in low permeability sandstones. Mar. Pet. Geol. 2020, 112, 104069. [Google Scholar] [CrossRef]
  40. Qin, Y.; Yao, S.; Xiao, H.; Cao, J.; Hu, W.; Sun, L.; Tao, K.; Liu, X. Pore structure and connectivity of tight sandstone reservoirs in petroleum basins: A review and application of new methodologies to the Late Triassic Ordos Basin, China. Mar. Pet. Geol. 2021, 129, 105084. [Google Scholar] [CrossRef]
  41. Andrews, E.; Muggeridge, A.; Jones, A.; Krevor, S. Pore structure and wetting alteration combine to produce the low salinity effect on oil production. Fuel 2023, 332, 126155. [Google Scholar] [CrossRef]
Figure 1. Sandstone samples obtained from drilling.
Water 16 01022 g001
Figure 2. Fine processing of sandstone samples: (a) concrete water wash cutting machine and (b) automatic high-speed precision cutting machine.
Water 16 01022 g002
Figure 3. Morphology of samples at different scales.
Water 16 01022 g003
Figure 4. Typical CT scan images of sandstone: (a) coarse sandstone, (b) medium sandstone, and (c) fine sandstone, respectively.
Water 16 01022 g004
Figure 5. Typical pore structure of sandstone, (a) original image, (b) 3D reconstruction of sandstone pore structure based on machine learning, (c) pore structure, respectively.
Water 16 01022 g005
Figure 6. Extraction process of sandstone pore information, (a) binarized pore structure, (b) pore segmentation, and (c) pore network, respectively.
Water 16 01022 g006
Figure 7. Sandstone pore structure.
Water 16 01022 g007
Figure 8. Sandstone porosity, (a) connected pores and (b) unconnected pores, respectively.
Water 16 01022 g008
Figure 9. Coordination number bar chart of sandstone.
Water 16 01022 g009
Figure 10. Statistical distribution of pore size and pore throat in sandstone, (a) pore size and (b) pore throat, respectively.
Water 16 01022 g010
Figure 11. Representative Volume Elements of typical sandstone pore structure, (a) FEM geometric and (b) FEM mesh, respectively.
Water 16 01022 g011
Figure 12. Fluid seepage in sandstone pore structure, (a) coarse sandstone, (b) medium sandstone and (c) fine sandstone, respectively.
Water 16 01022 g012
Figure 13. Sandstone permeability bar chart.
Water 16 01022 g013
Figure 14. Relationship between sandstone permeability and porosity.
Water 16 01022 g014
Figure 15. Relationship between sandstone permeability and pore throat.
Water 16 01022 g015
Table 1. Sandstone sample numbers.
Nos.Sandstone TypesSample Specifications
1#coarse sandstone 5   mm   ×   5   mm   ×   5   mm
2#coarse sandstone 5   mm   ×   5   mm   ×   5   mm
3#coarse sandstone 5   mm   ×   5   mm   ×   5   mm
4#middle sandstone 5   mm   ×   5   mm   ×   5   mm
5#middle sandstone 5   mm   ×   5   mm   ×   5   mm
6#middle sandstone 5   mm   ×   5   mm   ×   5   mm
7#fine sandstone 5   mm   ×   5   mm   ×   5   mm
8#fine sandstone 5   mm   ×   5   mm   ×   5   mm
9#fine sandstone 5   mm   ×   5   mm   ×   5   mm
Table 2. Basic parameters of numerical simulation.
Nos.SymbolValueUnitPhysical Meaning
1# ρ 1000 kg / m 3 density
2# μ 0.001 Pa · s viscosity
3# u in 0.01 m / s inlet velocity
Disclaimer/Publisher’s Note: The statements, opinions and data contained in all publications are solely those of the individual author(s) and contributor(s) and not of MDPI and/or the editor(s). MDPI and/or the editor(s) disclaim responsibility for any injury to people or property resulting from any ideas, methods, instructions or products referred to in the content.

