Article

Spatial Variations in Microplastics in the Largest Shallow Lake of Central Europe and Its Protecting Wetland Area

1
Institute of Aquaculture and Environmental Safety, Hungarian University of Agriculture and Life Sciences, 2100 Gödöllő, Hungary
2
Eurofins Analytical Services Hungary Ltd., 1045 Budapest, Hungary
3
Ecophysiological and Environmental Toxicological Research Group, HUN-REN Balaton Limnological Research Institute, 8237 Tihany, Hungary
4
Western Transdanubia Water Directorate, 9700 Szombathely, Hungary
*
Author to whom correspondence should be addressed.
These authors contributed equally to this work.
Water 2024, 16(7), 1014; https://doi.org/10.3390/w16071014
Submission received: 9 February 2024 / Revised: 25 March 2024 / Accepted: 26 March 2024 / Published: 31 March 2024
(This article belongs to the Special Issue Contaminants in the Water Environment)

Abstract

:
The concentration of microplastics (MPs) in two important Hungarian freshwater habitats was determined in the size range of 50 μm–1 mm. Lake Balaton (LB) is the largest shallow lake in Central Europe, with a significant role in recreation and tourism. Its main inflow, the Zala River, enters the lake through an artificially constructed wetland, the Kis-Balaton Water Protection System and its catchment area (KB), which helps preserve the water quality of the lake. From these two areas, 15 samples were taken with an in situ filtration sampling method. After preparation, the samples were analyzed automatically by FT-IR microscopy. All samples, from both areas, contained MPs; the dominant microplastic (MP) shape was the fragment, while the most frequently polymer types were polyethylene, polypropylene and alkyd. Small MPs were dominant in both areas; around 90% of the MPs were smaller than 500 μm. On average, LB contained more MPs (21.0 ± 12.5 MPs/m3) compared to the KB, which presented an average concentration of MPs of 7.8 ± 5.9 MPs/m3. In the examined areas, two potential MP sources were determined, i.e., treated wastewater and road traffic. The importance of tourism should also be further investigated.

Graphical Abstract

1. Introduction

In recent years, the issue of microplastics (MPs), synthetic polymers within the size range of 1 μm–5 mm, has become an increasing environmental concern [1]. According to the ISO standard, two sub-categories of MPs can be differentiated: small MPs (1–1000 μm) and large MPs (1–5 mm) [2]. The establishment of these sub-categories was necessary because, in this wide range of sizes, it is not possible to use only one sample preparation and detection method, because this can lead to errors during quantification [3].
Studies focusing on the identification and quantification of MPs started in the marine environment, but in recent years, freshwater ecosystems have also come to the fore [4]. The presence of MPs has since been confirmed in various water bodies, such as rivers and lakes, across Asia, Europe and North America. Nonetheless, there are still less data available about the abundance of MPs in freshwater ecosystems than in the marine environment [1,5]. In the case of the freshwater environment, some direct microplastic (MP) sources can be identified, and the majority of these sources can be linked to anthropogenic factors. Consequently, MPs are present in higher concentrations in regions that are highly populated, have more wastewater treatment plants (WWTPs), have higher levels of urbanization or have intensive tourist activity [6]. MPs have become omnipresent pollutants that are observed not only near their sources but also at large distances. According to their material types, the most frequently detected MPs in freshwater are polyethylene (PE), polypropylene (PP), polystyrene (PS) and polyethylene terephthalate (PET), which correlates with the production and utilization data of plastics [5,6,7]. MPs, especially in the small size range, pose an environmental risk, as they can be consumed by aquatic organisms [8] and can enter the food chain. Furthermore, MPs can adsorb various hazardous substances (e.g., organic pollutants and heavy metals) and can act as abiotic surfaces for biofilm formation, which facilitates the spread of pathogenic and antibiotic-resistant microorganisms in the environment [9].
The largest shallow lake of Central Europe, Lake Balaton (LB), is an important summer holiday destination visited by millions of tourists every year [10,11]. Therefore, the preservation of the good water quality and biodiversity of the lake is of strategic importance from both economic and ecological aspects. Based on the intricate findings of our current survey, our research team previously published an article focusing on the concentration of MPs in LB. However, that publication exclusively presented the concentration results for MPs within the range of 50–100 μm, as this size range is crucial for conducting toxicology tests on Daphnia spp. [8]. A larger-scale study investigating MPs in a wider size range and involving the catchment area is still needed to obtain a more complete picture of the possible threats caused by MPs to the ecosystem of LB. Keeping this in mind, the present study aimed to gain comprehensive knowledge of the presence of and spatial variations in MPs in the size range of 50–1000 μm in two connected freshwater ecosystems: (1) LB; (2) the Kis-Balaton Water Protection System and its catchment area (KB), an artificially constructed wetland that helps preserve the water quality of LB.

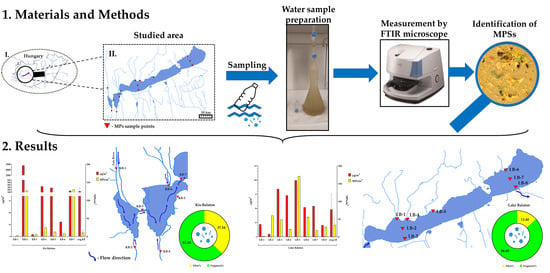
2. Material and Methods

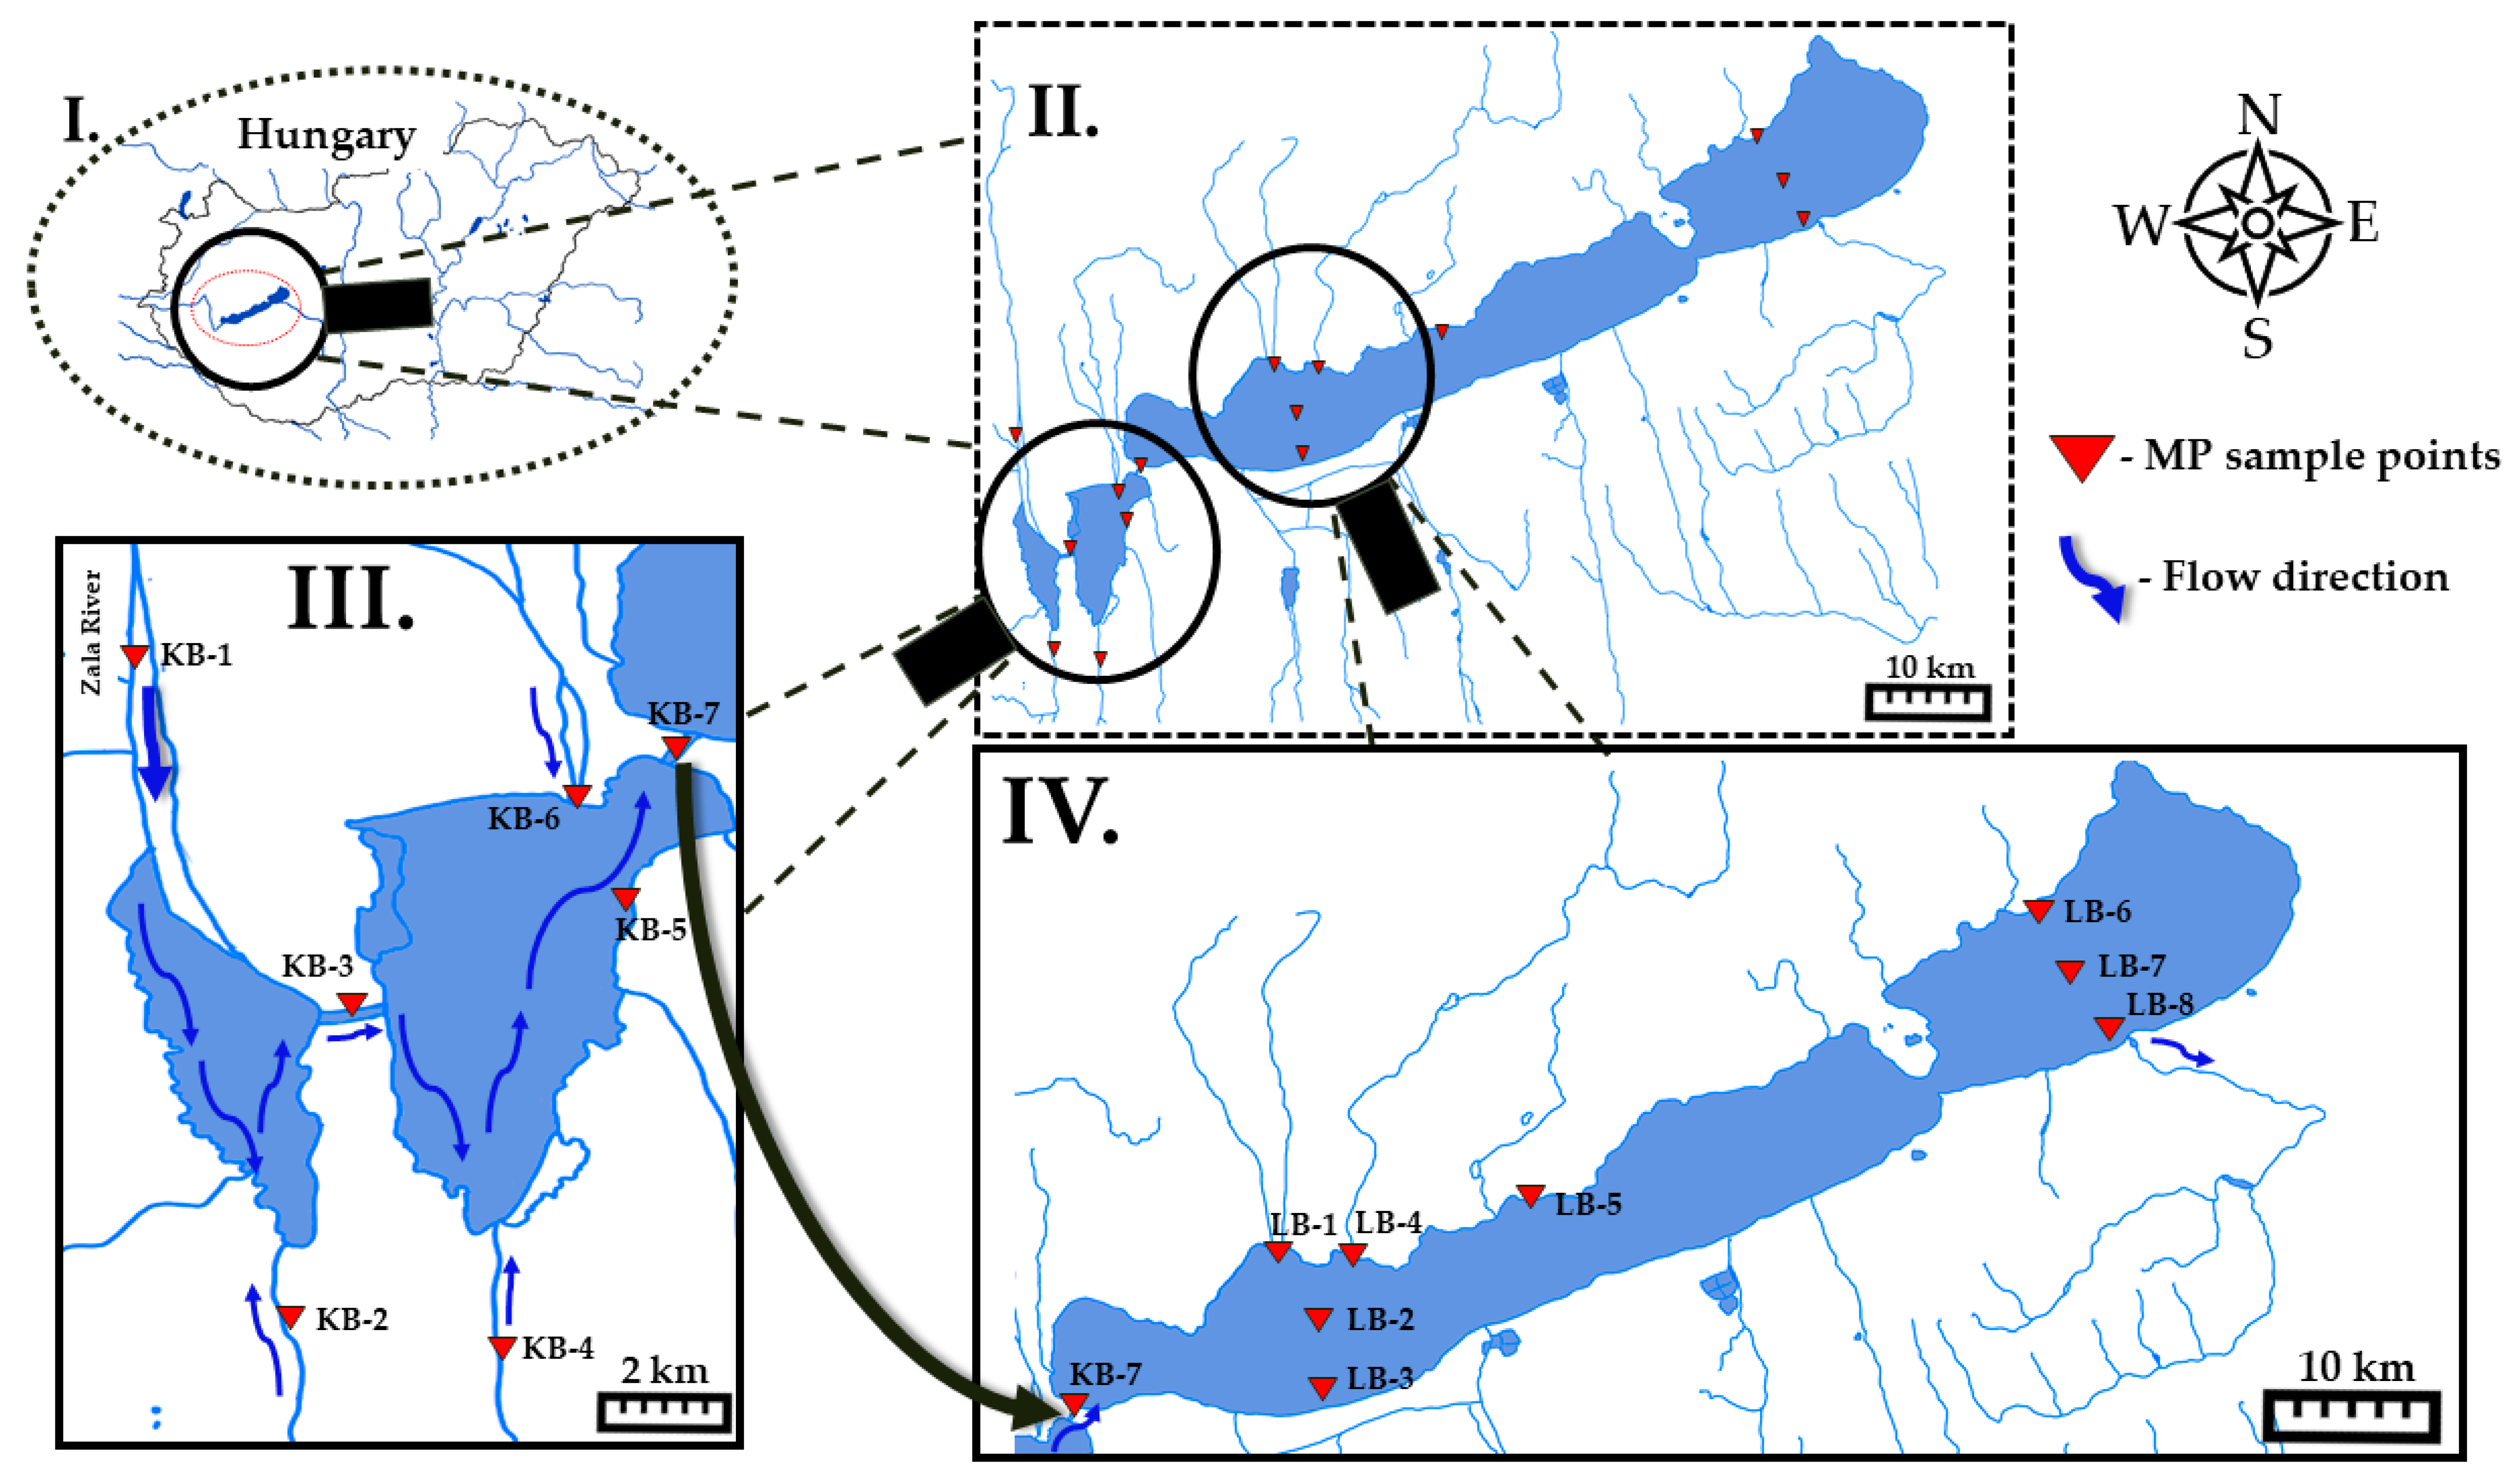
2.1. Study Area and Sampling

With a surface area of more than 590 km2, a mean depth of 3.25 m, and a volume of 1.8 km3, LB is the largest freshwater shallow lake in Central Europe [12,13]. LB has 20 permanent water inflows (Figure 1), with its main inflow, the Zala river, having a considerable impact on the lake’s water quality. The Zala river reaches the lake through the KB (Figure 1) [14], which is an extensive, artificially constructed wetland region that acts as a natural filter of organic pollutants to improve the water quality of LB [12,15]. The KB was built in two phases and plays a crucial role in the water management system of the region. During phase one, the Hídvégi Pond was created, which increased the water retention time by 30 days. During phase two, the Fenéki Pond was constructed, which additionally increased the water retention time by another 90 days. From the Zala river, the first pond retains 60% of the suspended solids, while the second pond retrains 75% of the remaining solids before they enter the lake [16]. Even though KB is a built environment, it is a valuable, protected wetland ecosystem known for its biodiversity and listed as a Wetland of International Importance under the Ramsar Convention (https://rsis.ramsar.org/ris/185, accessed on 27 March 2024).
Nowadays, more than 40 WWTPs with varying capacities (2–50,000 m3/day) are operating in the catchment area of LB (Figure 1) [10]; the largest one is located in the city of Zalaegerszeg. To reduce the direct discharge of treated sewage into the lake, a sewage transfer duct system was implemented in the southern and eastern coastal regions. This system effectively gathers and diverts a significant portion of treated communal sewage from the catchment area. However, the WWTPs located away from the lake release their effluent into the tributaries of LB.
To reveal MP concentrations in the KB and LB, 15 sampling points were marked out: seven sampling locations were chosen in the KB, while eight sampling locations were designated in LB, with the aid of the Western Transdanubia Water Directorate. The designated monitoring points represent locations where substantial anthropogenic impact presumably affects the water quality (shown in Figure 1). In KB, sampling was carried out from 15 to 20 June 2022, while LB was sampled from 27 to 29 July 2022. Sampling was performed with a previously described in situ filtration method [17]. The applied sampling device starts the filtration process with a pre-filter (pore size 1 mm), which prevents larger particles from entering the device. Filtration was driven by a jet pump through three stainless-steel in-line filters (pore sizes: 300, 100, 50 µm) (Infiltec GmbH, Speyer, Germany). Thus, the tested particles fell into the range from 50 µm to 1 mm. This technique allowed us to acquire a representative amount of water (one to two cubic meters per sample).

2.2. Microplastic Extraction and Analysis

The samples were prepared and examined as described previously [8]. Briefly, to remove the organic matter from the samples, two oxidation steps were applied: a hydrogen peroxide-based pre-oxidation step and a Fenton reaction to eliminate any residual organic materials. After oxidation, a density separation step was carried out. The samples were put into small-volume glass separators (SVGSs) filled with a zinc chloride brine solution (1.7 g/cm3) to separate the microplastics. The sample preparation method with SVGSs was previously described and validated by our research group [18]. Anodisc filters (Ø = 25 mm; pore = 0.2 µm) were used for the final filtration, and the concentrated samples on the filter were directly placed under a Fourier Transform Infrared imaging microscope (FTIR) (NicoletTM In10 MX; Thermo Fisher Scientific, Waltham, MA, USA).
The complete surface of the filter underwent scanning using the FTIR microscope, outfitted with a linear array detector capable of achieving a spatial resolution of 25 µm in transmission mode, along with a spectral resolution of 8 cm−1, and employing 4 scans. The collected data were then analyzed automatically with the siMPle software (https://simple-plastics.eu/, accessed on 27 March 2024), developed by Primpke et al., 2020, and applied by other research groups extensively [19,20], as demonstrated in Supplementary Figure S1. In order to accept the collected spectra as representing MPs, in comparison to the database, a hit quality index of 70% was determined. With this method, the smallest identified particle size was 50 µm, as the software is programmed to require at least two positive neighboring pixels to produce a credible result during MP identification [8]. The estimated mass concentration of MPs was also determined using the same software based on the predicted volume of each particle, assuming an ellipsoid shape and considering the specific density of its polymer type [21]. As the toxicity of MPs also depends on their shape [22], the distribution of fragments or fibers was also determined in the samples. MPs with a calculated length-to-width ratio greater than 3:1 (based on the length and width dimensions of the identified MPs measured by the software) were considered fibers [23,24].

2.3. Contamination Prevention and Quality Control

During sample preparation, precautions were taken to prevent sample contamination. Beakers and any glassware were rinsed before usage with ultra-pure water (UPW), which was produced as deionized water and was filtered through a 5 µm metal filter and a 0.7 µm glass fiber filter. During sample preparation, beakers and any glassware were covered with aluminum foil, and the laboratory staff wore cotton lab coats. Most sample preparation steps were conducted under a laminar flow hood, but due to work safety reasons, the oxidation steps were carried out in a fume hood.
To increase the reliability of MP quantification, it was necessary to run process blank samples (i.e., conduct background measurement) alongside the environmental samples to calculate the limit of detection (LOD) and the limit of quantification (LOQ) values. To accomplish this task, four blank samples were generated using UPW. The blank samples were prepared with the previously described procedure (for both preparation and analysis) [8]. From the results of the blanks, the LOD and LOQ values were calculated as follows: the LOD was determined as 3.3 times the standard deviation plus the mean values of the blanks; similarly, the LOQ was established as 10 times the standard deviation of the blanks plus their mean values. Although these values were different between the polymer types, they were calculated for the total quantity of MPs in accordance with the guidance provided by previous research articles [19,25]. Of note, following the suggestion of a previous research article [26], we did not adjust our results using the mean of the blanks.
For every sample, the concentrations of MPs were computed per cubic meter using the recorded sample volume during the sampling process. When determining the mean concentrations of MPs for KB and LB, outlier data points were excluded from the calculations.

3. Results

3.1. LOD and LOQ Values

To guarantee the reliability of our results about the MP contamination of KB and LB surface water samples, the background contamination level was assessed, and the LOD and LOQ values were calculated in all cases. In four of the process blanks, altogether eight MP particles were found that were distributed among four polymer groups as follows: three of them were PE; other three were PP; one of them was PS; and one was cellulose acetate (CA). The defined LOD value was 7.22, while the LOQ was 17.81.

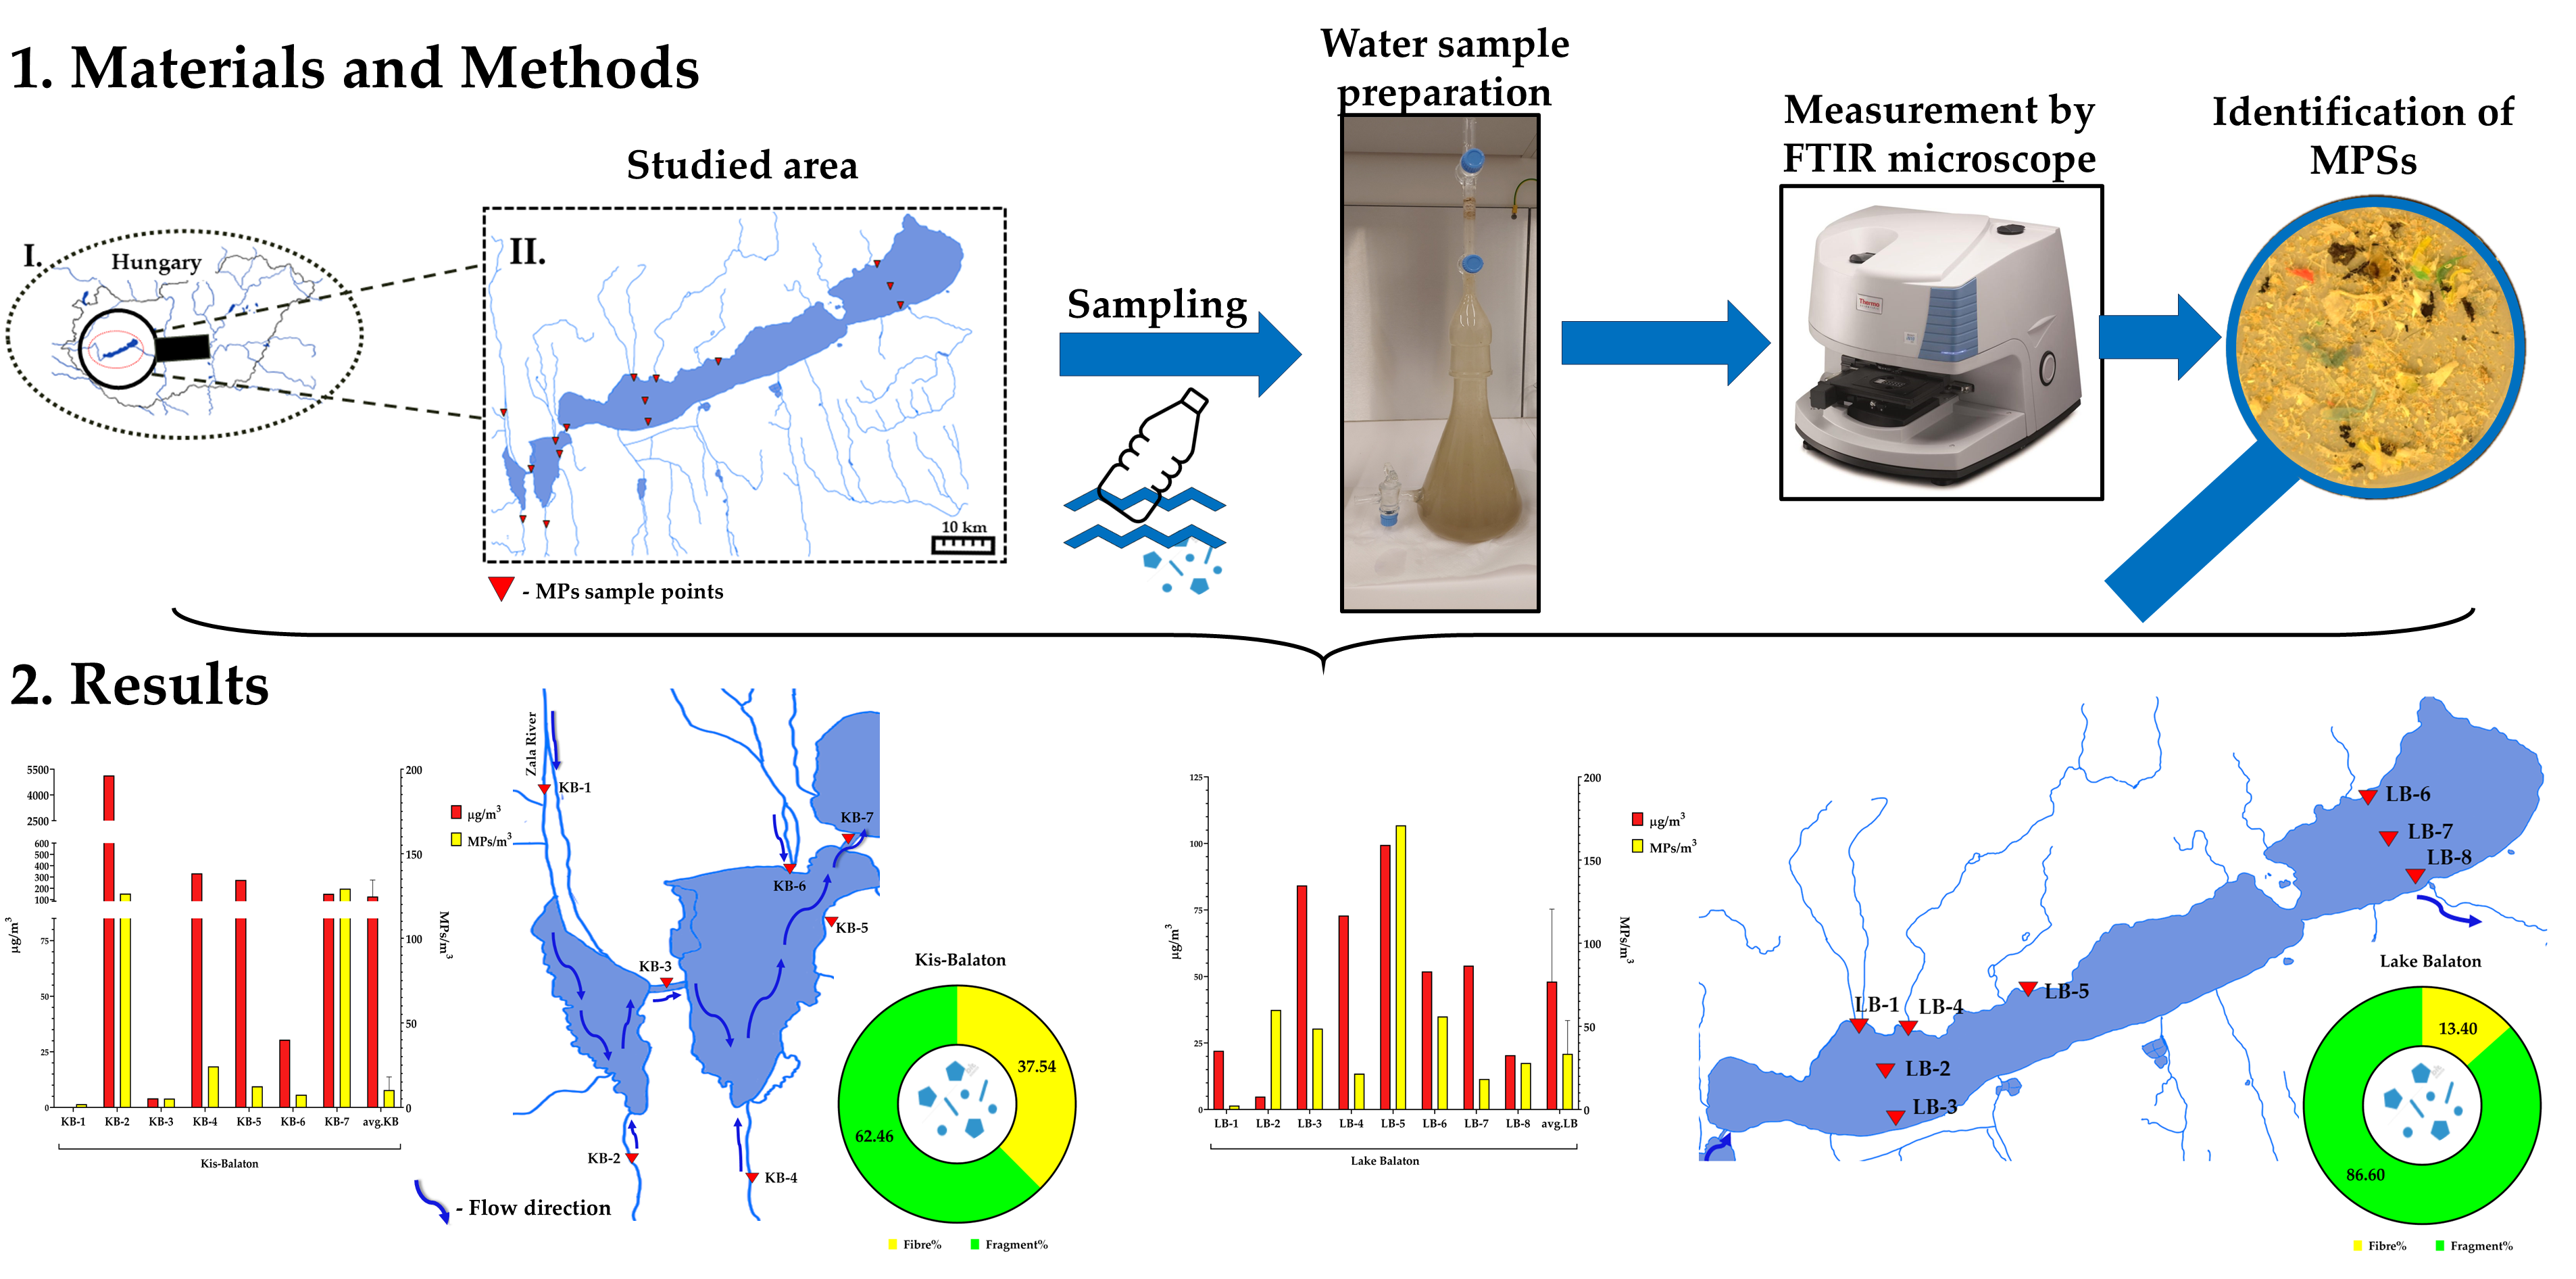
3.2. MP Abundance in KB and Lake Balaton

Figure 2 shows the determined abundance of MPs in KB and LB. In LB, the MP concentrations fell into the range from 1.50 to 106.84 MPs/m3, and the average abundance of MPs was 21.0 ± 12.5 MPs/m3. In KB, the concentrations of MPs were between 1.51 and 196.85 MPs/m3, averagely 7.8 ± 5.9 MPs/m3. Of the 15 examined surface water samples, two were not above the LOD value. Moreover, although another two samples reached the LOD value, they did not reach the LOQ value (shown in Supplementary Table S1). The estimated mass concentration of MPs in LB was in the range from 4.89 to 99.46 µg/m3, with an average value of 44.4 ± 27.2 µg/m3. In contrast, the calculated mass concentrations in KB were between 0.10 and 5140.98 µg/m3 and, averagely, 128.2 ± 144.4 µg/m3.

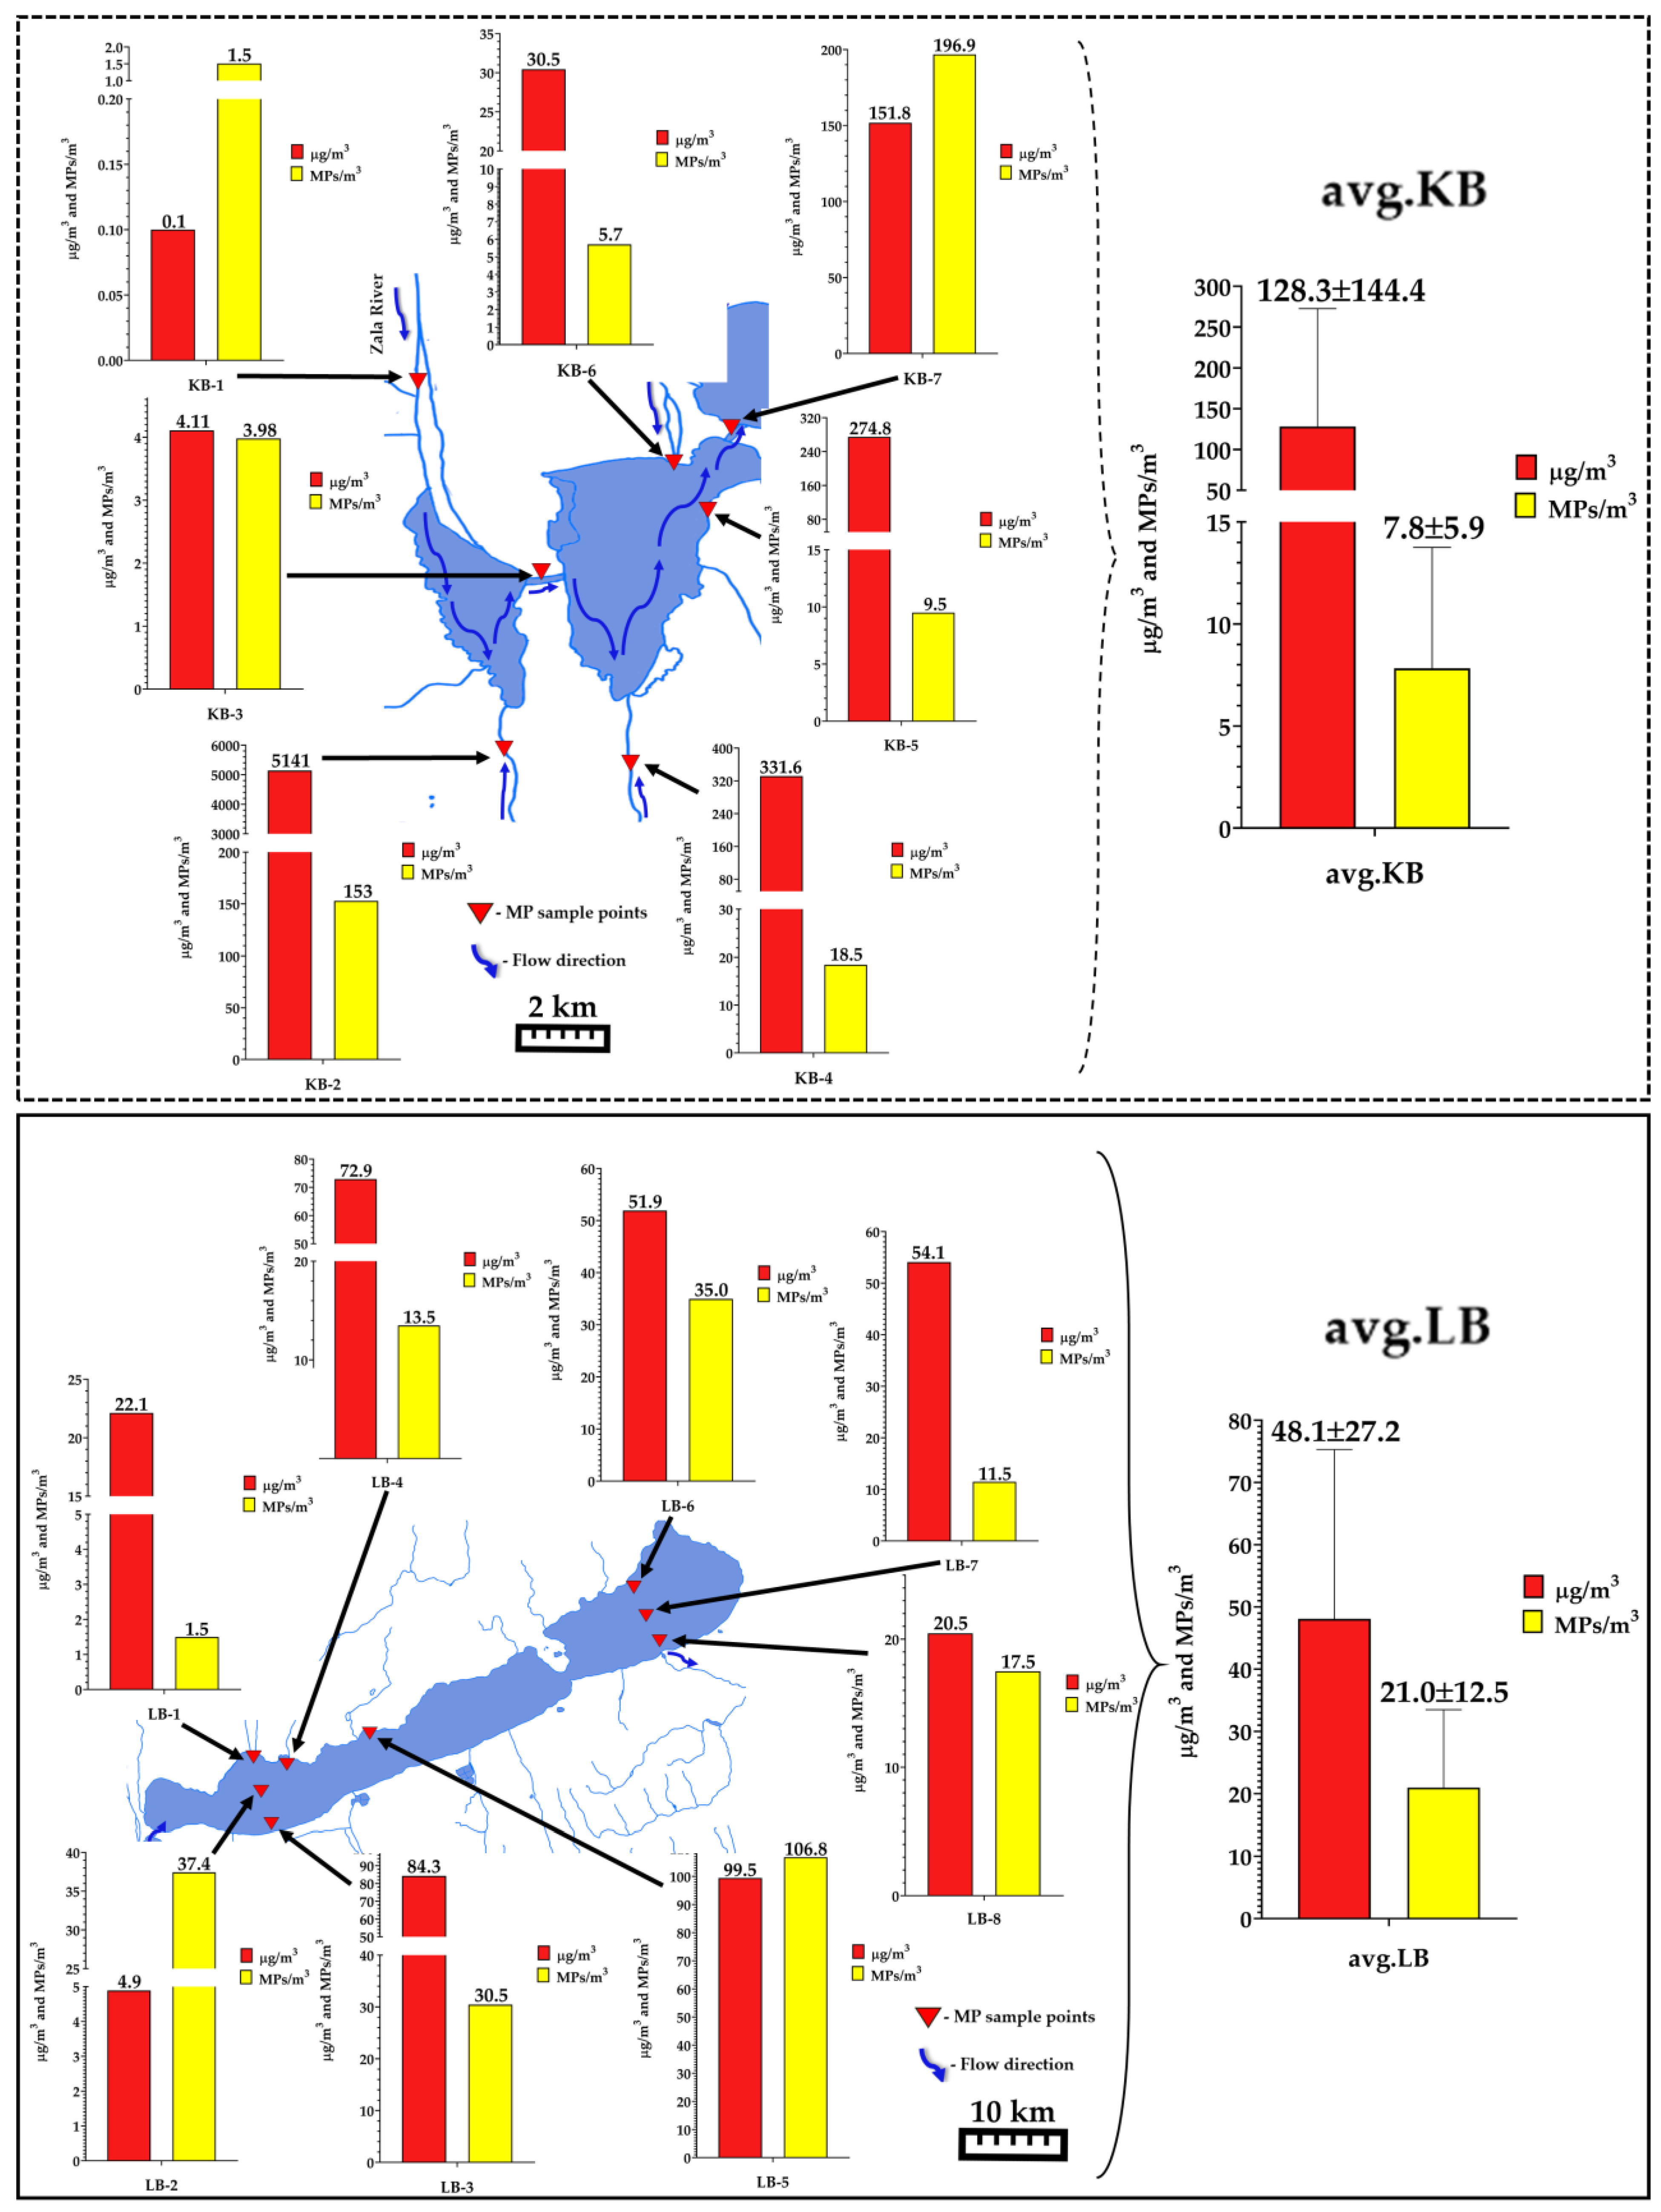
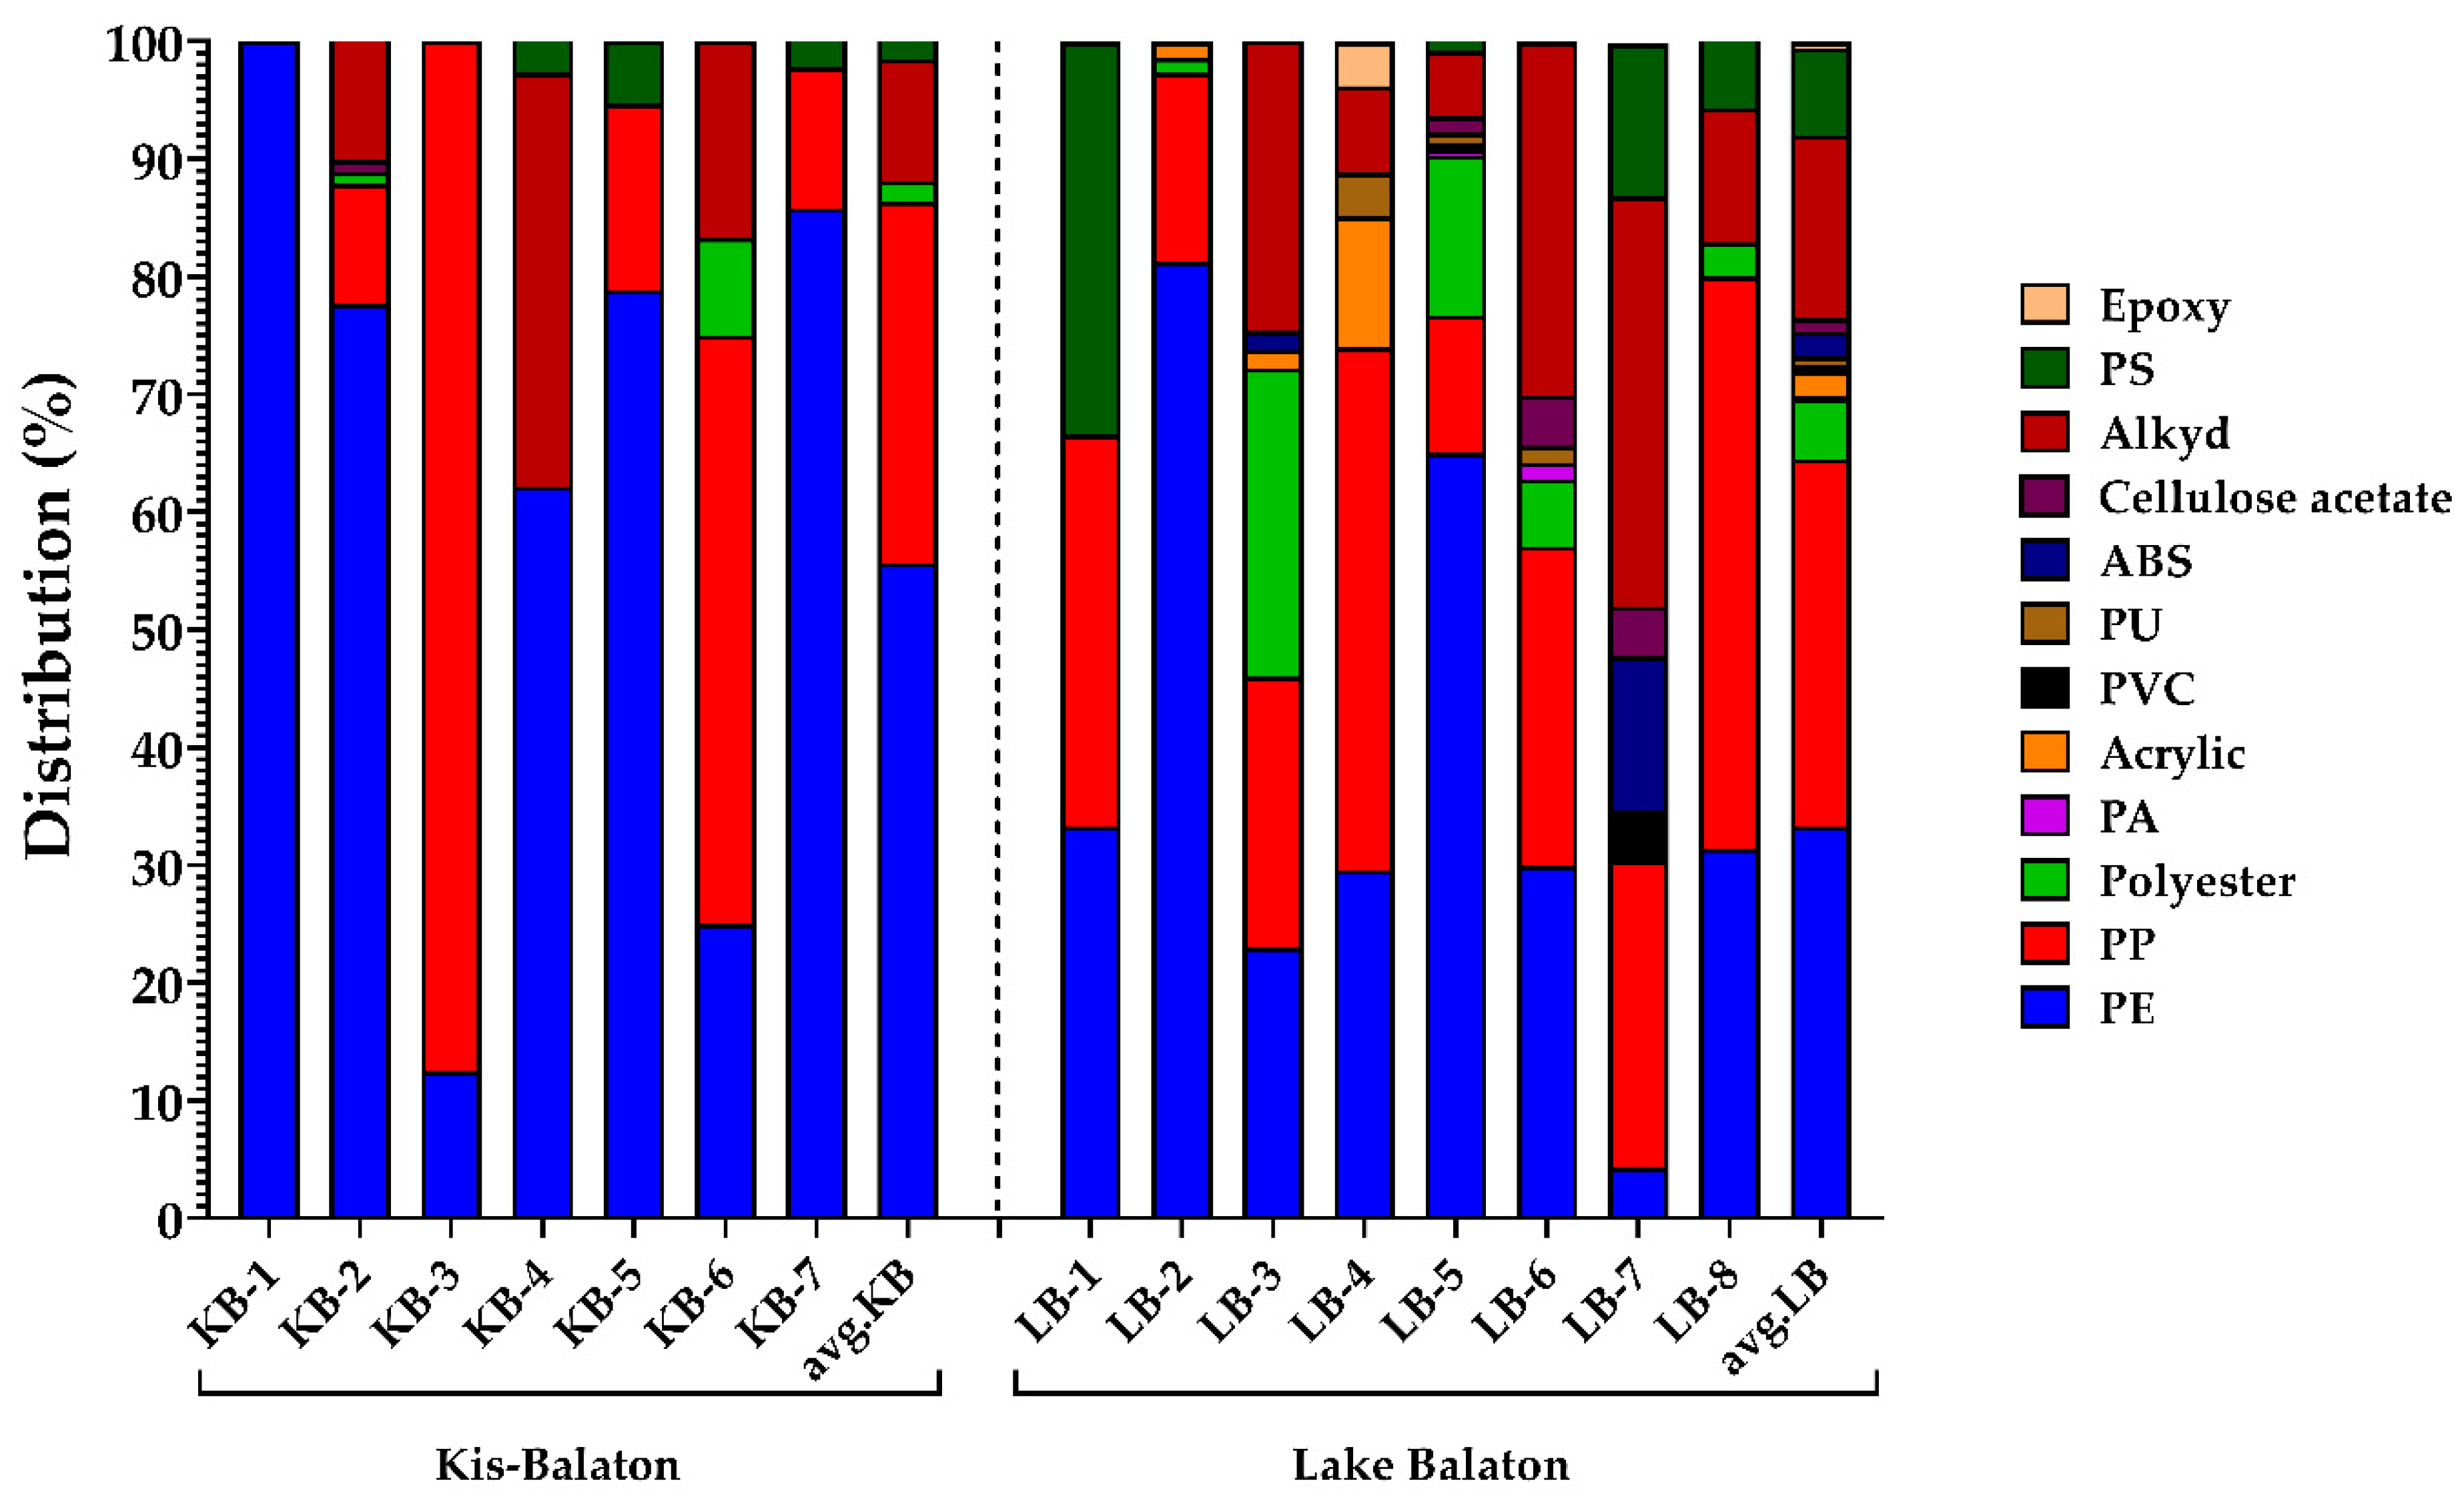
3.3. Polymer Types of the Identified MPs

In terms of average particle numbers, the MPs detected in LB fell into 12 polymer groups, while the MPs in KB were classified in only 5 polymer groups. In both areas, PE was the most abundant (in the case of LB, 33.29% of MPs were PE; in the case of KB, 55.72% of MPs were PE), followed by PP (LB: 31.22%; KB: 30.66%) and alkyd (LB: 15.46%; KB: 10.36%). In KB, other polymer types (polyester (POS) and PS) represented only 3.26% of the total MPs (Figure 3). In contrast, in LB, other polymer types such as POS, PS, CA, epoxy, acrylic, polyvinyl chloride (PVC), polyurethane (PU), polyamide (PA) and acrylonitrile butadiene styrene (ABS) represented 20.00% (Figure 3).

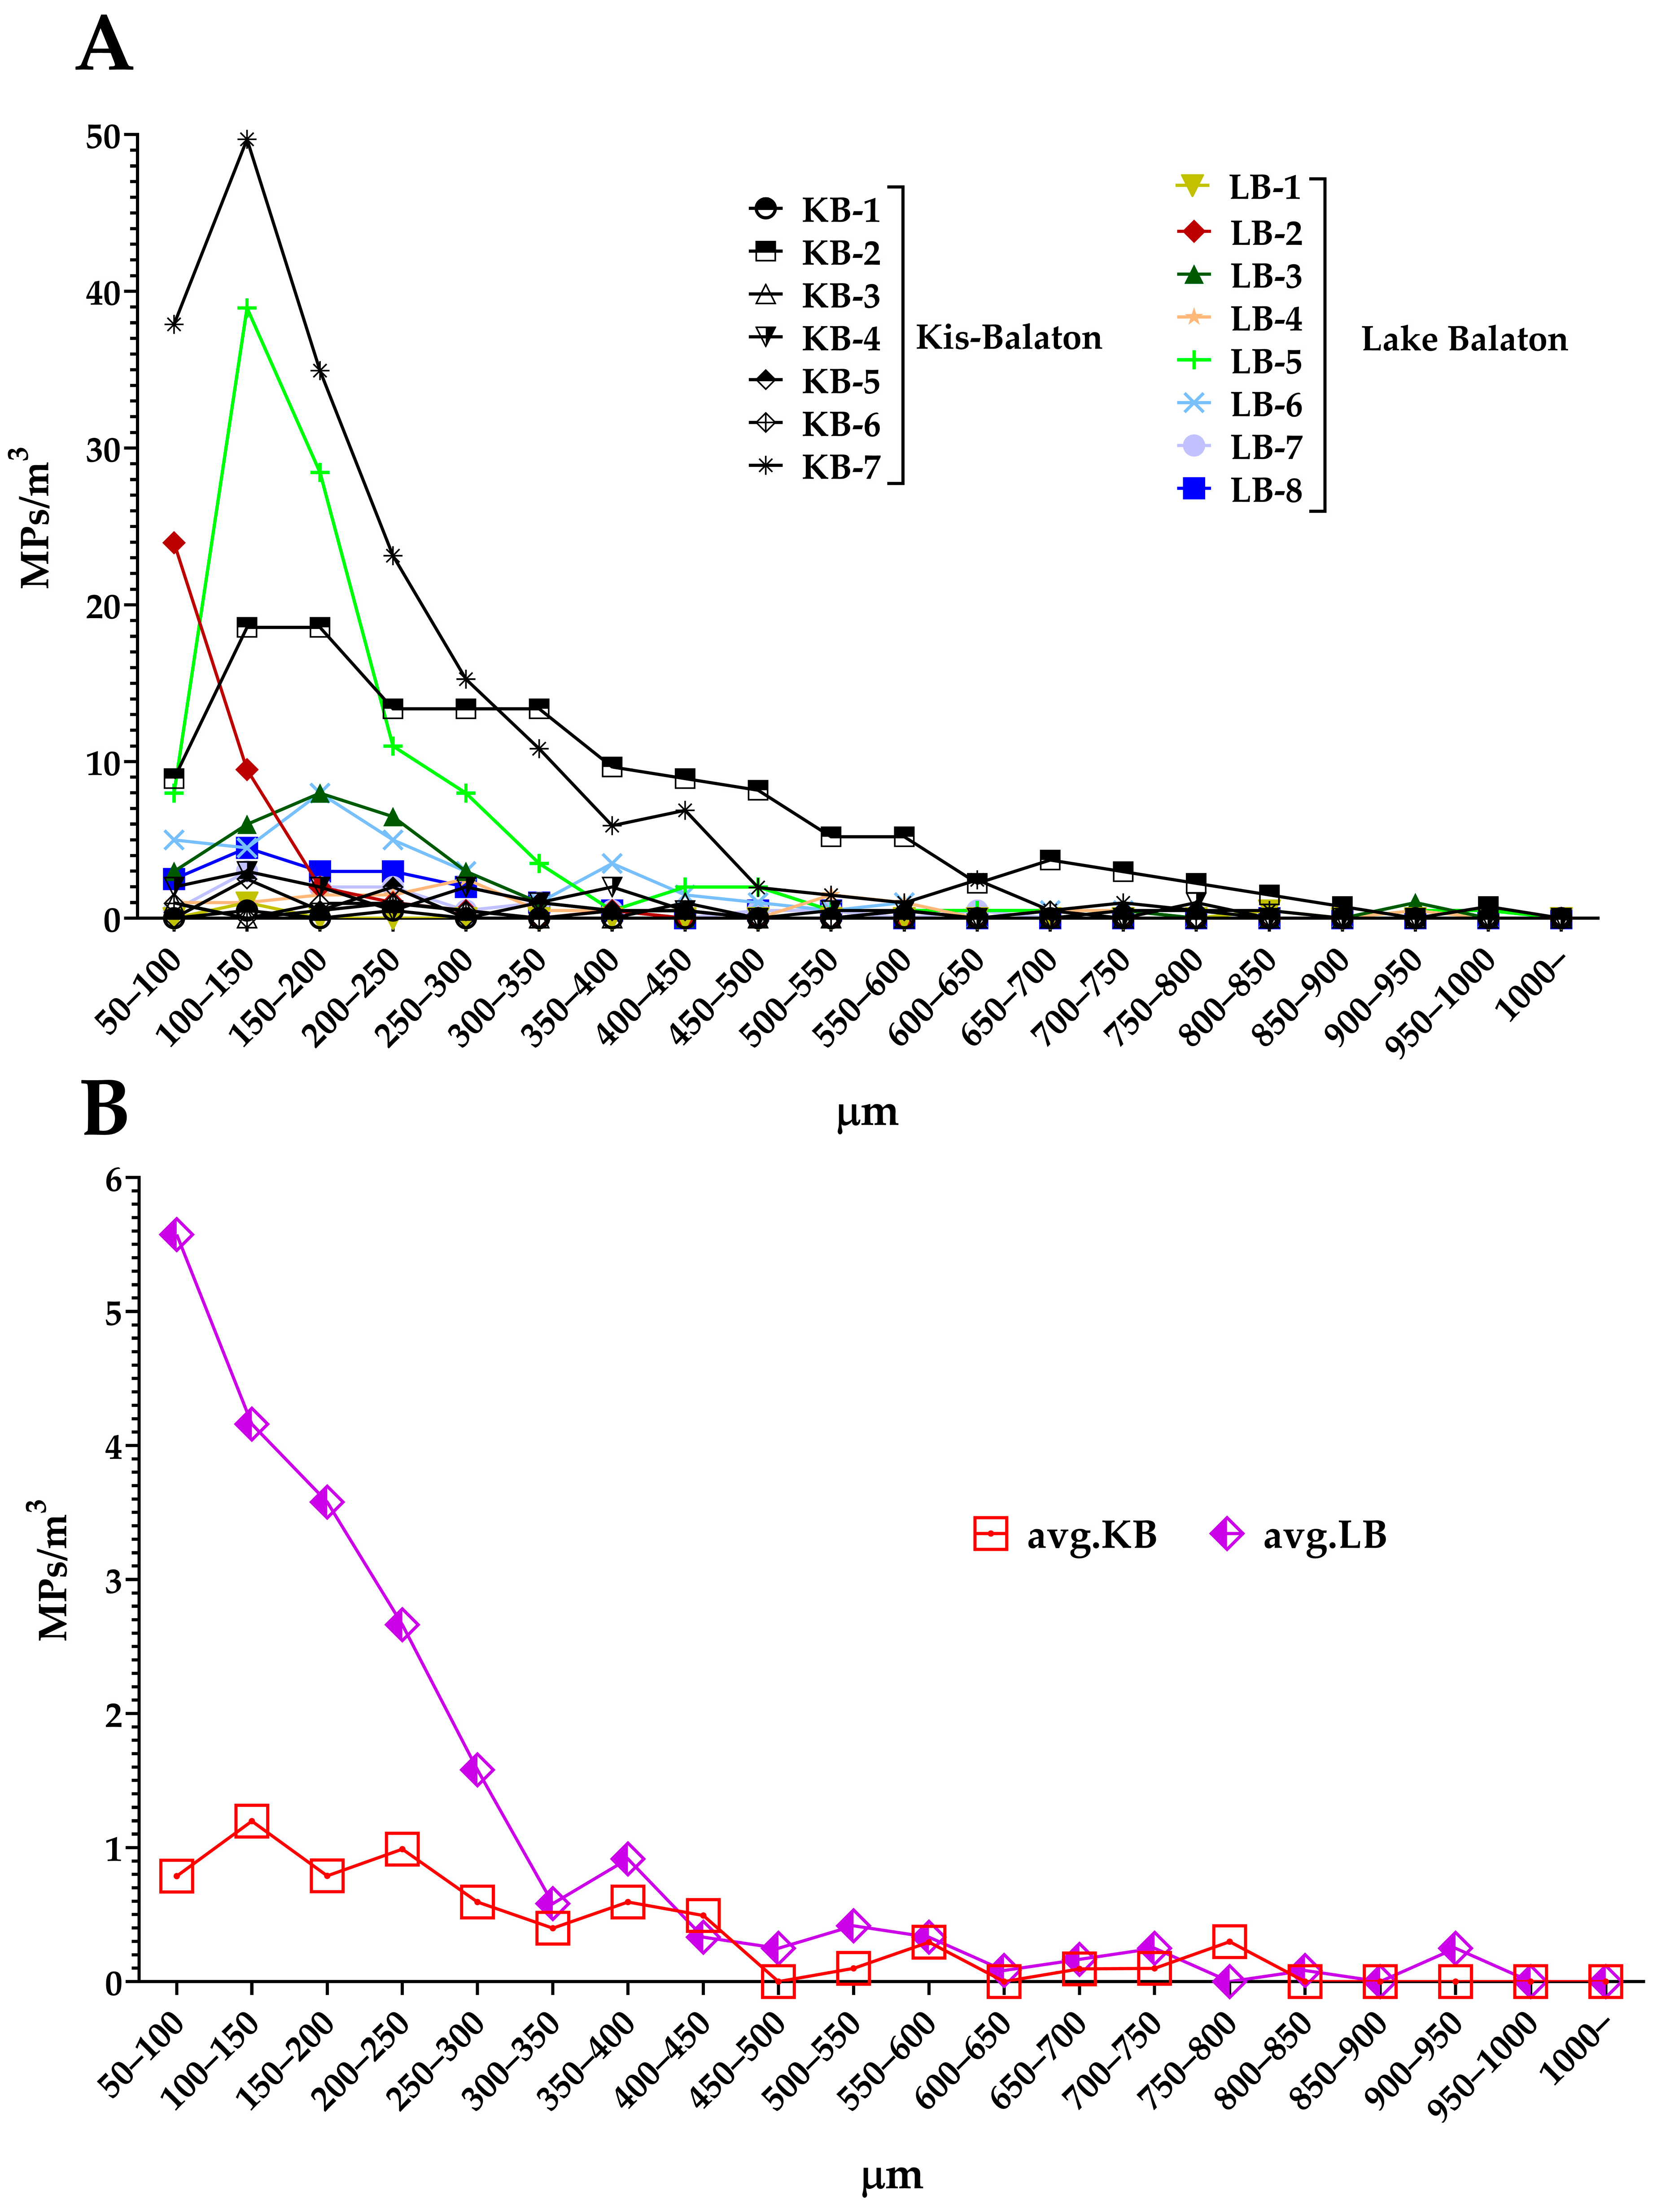
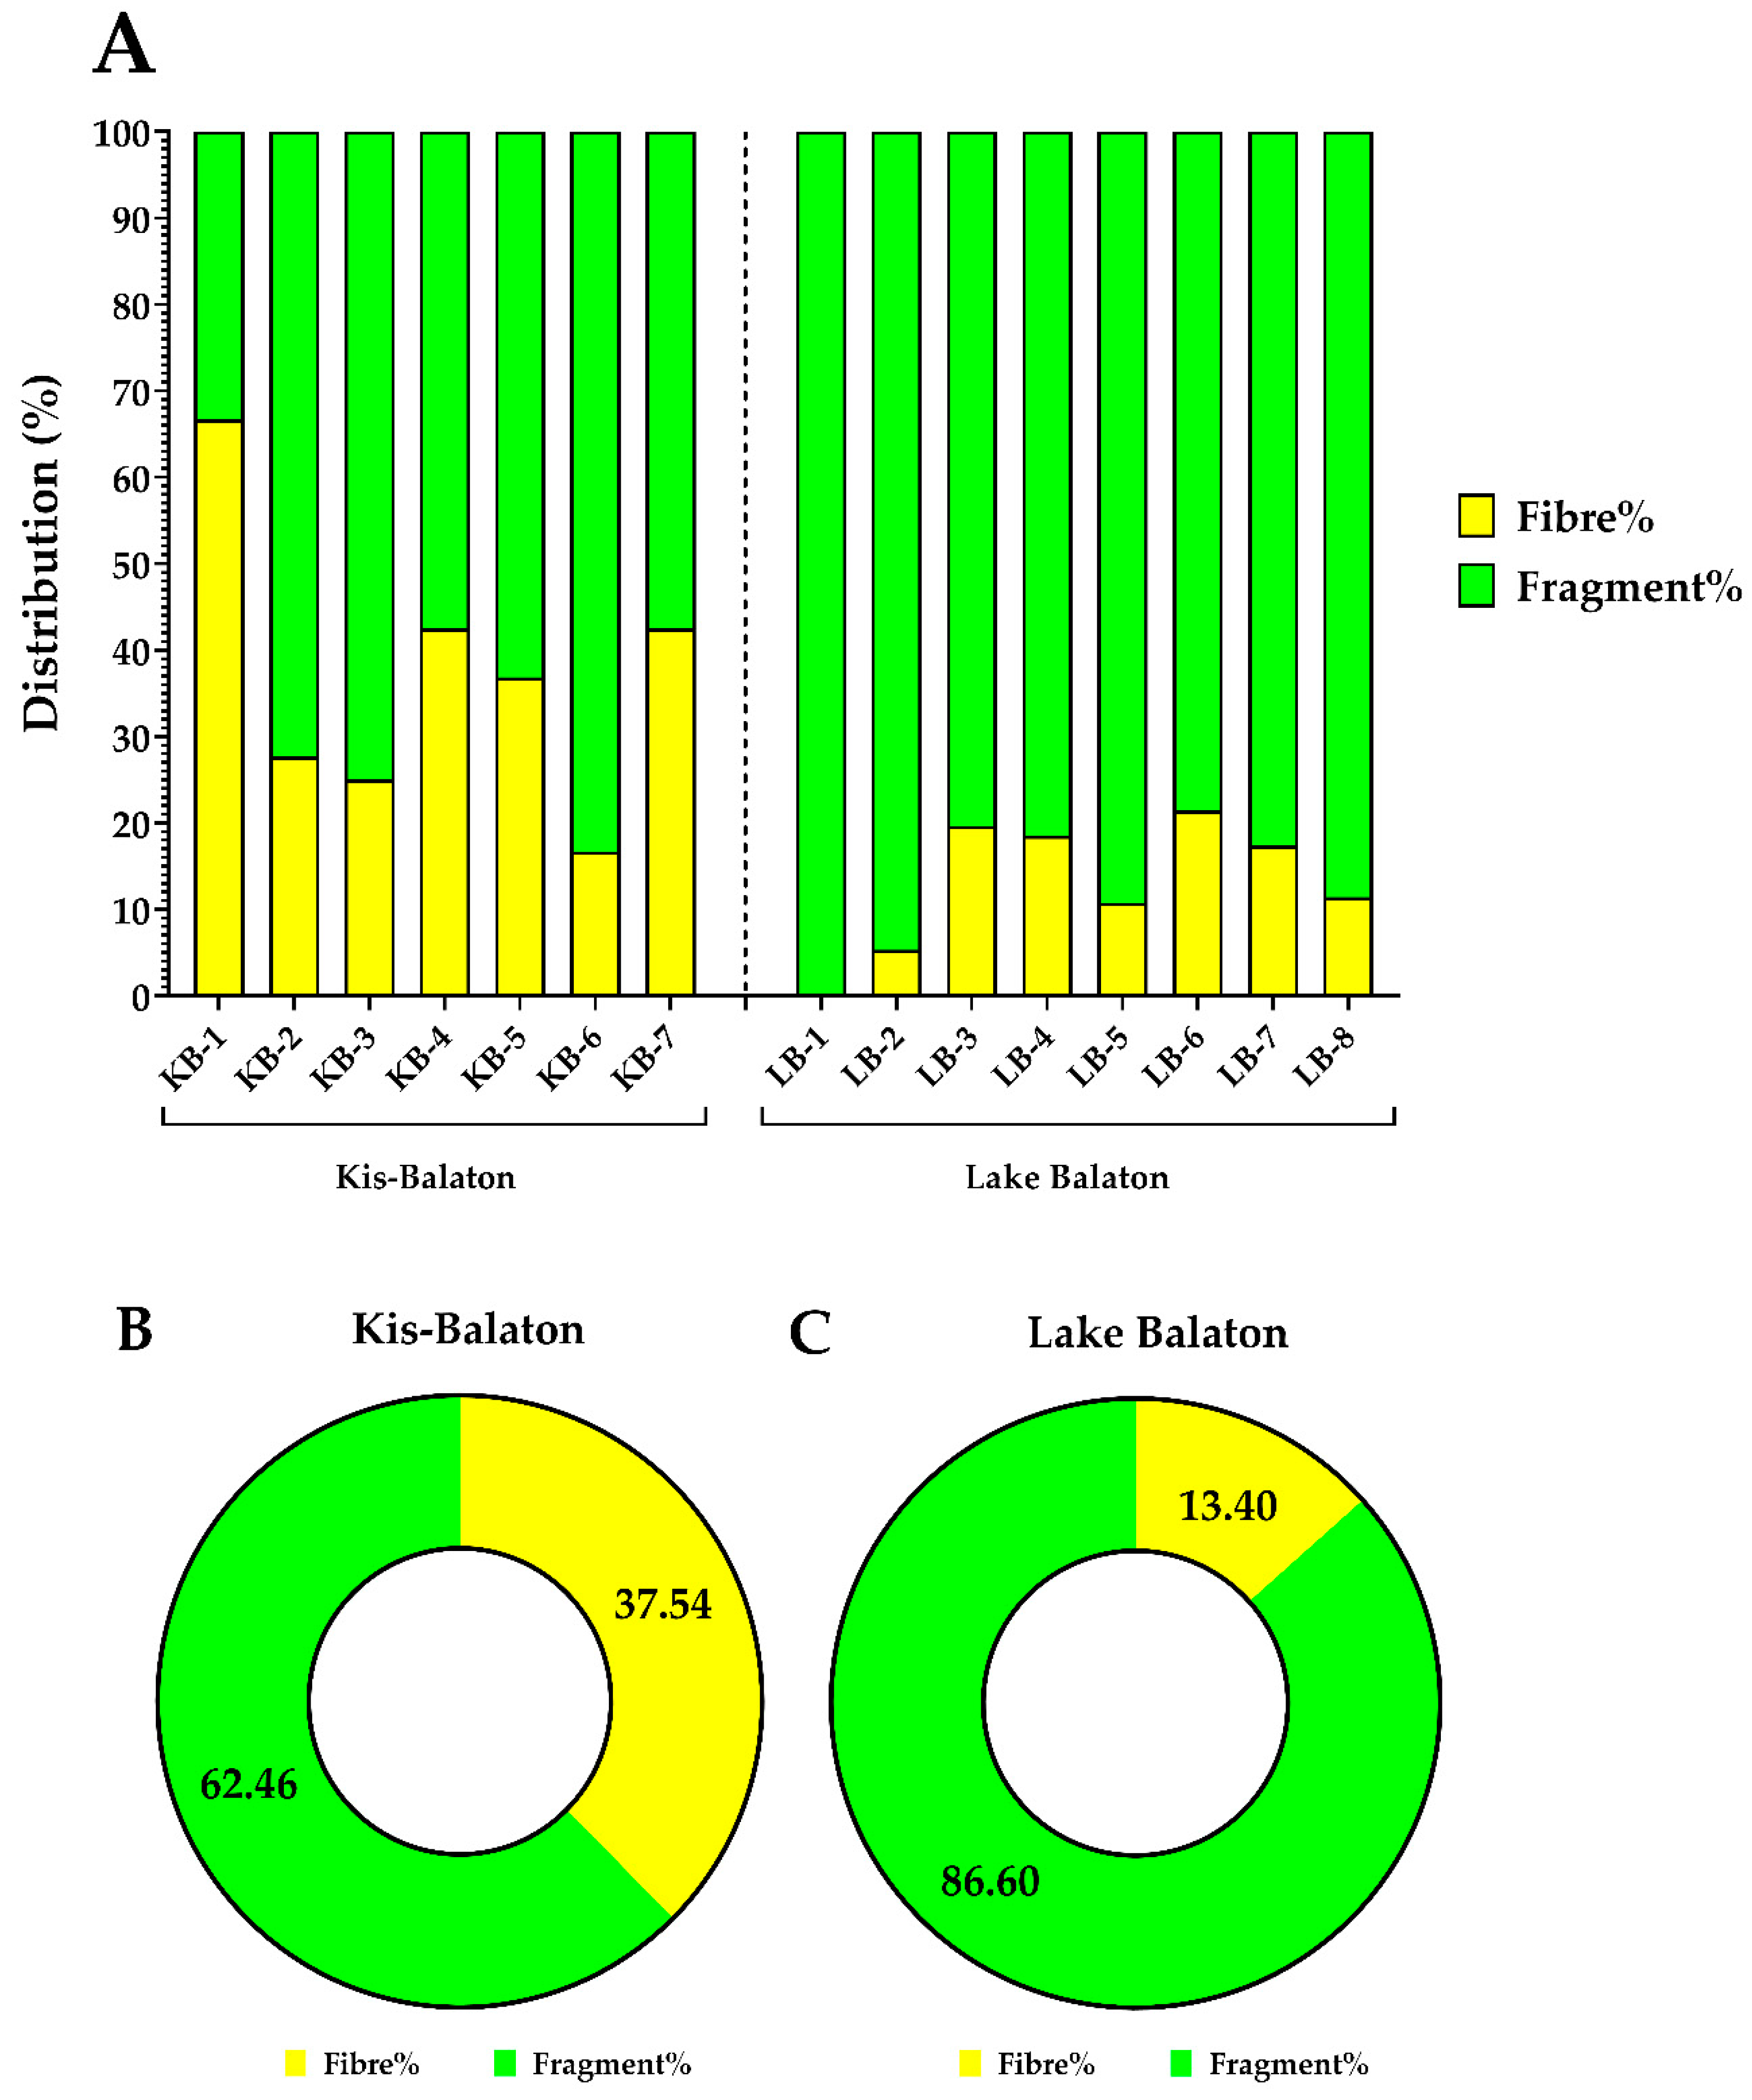
3.4. MP Distribution according to Their Shapes and Sizes

For size determination, major size dimensions of the particles were used. In LB, the most frequent size category was the smallest one, with particles between 50 and 100 µm; 26.27% of the total MPs belonged to this category. In KB, this smallest MP category was just the third most abundant (11.70% of all MPs), while the most common category was that containing particles between 100 and 150 µm, representing 17.80% of all MPs. In general, our results suggest that the smaller-size category represented the greater number of the identified MPs. In both sampling areas, around 90% of all MPs were under 500 µm (shown in Figure 4).
Regarding the shape of the identified MPs (Figure 5), the fragment shape proved to be dominant in both sampling sites: in LB, 86.60% of the MPs were identified as fragments, while their abundance was 62.46% in KB.

4. Discussion

At the time of our research, only one study had been conducted in LB dealing with the concentration and composition of MPs and investigating their potential top–down effects on the water flea (Daphnia magna) [8], and no study was available about the KB region. In that study, MPs were only investigated within a narrow size range (50–100 μm), as specimens of D. magna are capable of ingesting MPs in this size range due to potential food confusion. To extend our current understanding, the present study offers the first comprehensive determination of MP concentrations for both regions, which gives a basis for the evaluation of MP spread and distribution in the area. In this study, the concentration of MPs in LB ranged from 1.50 to 106.84 MPs/m3, and the average MP abundance was 21.0 ± 12.5 MPs/m3. In KB, the MP concentrations were between 1.51 and 196.85 MPs/m3, averagely, 7.8 ± 5.9 MPs/m3. According to these results, on average, KB contained a smaller concentration of MPs than LB; however, two KB samples had the highest concentration among all examined samples. Our results show marginally elevated MP concentrations in contrast to the previously determined values for 67 European lakes, which indicated an average of 0–7.3 particles/m3 (median = 0.28) in the size range of 310–5000 μm [27]. This disparity can potentially be attributed to divergent methodological approaches.
It is known that the smaller the size range one can investigate, the more particles can be found [28]. As we could operate within smaller size ranges than those considered in previous studies, it was anticipated that more particles would be identified. Furthermore, the automation of MP identification contributed to a reduction in human bias, and the imaging μFTIR technique is more likely to perform better at analyzing smaller particles. The sampling technique, sample preparation protocol and identification method are known to influence the final reported MP concentrations; hence, it is worth comparing new research findings with those derived by analogous techniques [29]. Compared to another study that was conducted in Finland [30], an in situ pump filtration method similar to our sampling device was applied. Our results are close to their findings, determining the number of MPs as 12 ± 17 MPs/m3 in a size range of 100–300 μm. The outcomes of our current study exhibit a significant resemblance to the results of our prior research conducted in Hungarian aquatic environments: the concentration of MPs in the previous study was 13.8 ± 9.3 MPs/m3. Nevertheless, it is important to note that the MP size range examined in the prior study was between 100 µm and 2 mm, and the MP identification method was different from the one we used in our present study [31]. MP pollution is less studied in wetlands compared to other aquatic ecosystems. Significant differences can be observed among the existing studies regarding MP concentrations, ranging from 1.44 to 101,60 MPs/m3. As indicated before, the comparison of MP abundances from different studies is difficult due to the variation in sampling methods, sample preparation and identification practices [32]. As expected, our results fall into the wide range indicated by previous studies.
The estimated mass concentration was determined in LB as 44.4 ± 27.2 µg/m3 and in KB as 128.2 ± 144.4 µg/m3. To the best of our knowledge, there is only one study dealing with the estimated MP mass in freshwater lakes in Poland. In that case, the highest value was determined as 4.7 µg/m2, which indicated about 25 g of MPs in the studied lake to a depth of 0.2 m [33]. If we extrapolate our results, assuming that our pump sucked water from the upper 0.2 m layer of water and calculating the surface area (590 km2) of the lake, LB contains 5.23 kg of MPs. This is a much higher value, which can also be explained by the different sampling and detection techniques. It is also obvious that a direct connection cannot be established between the mass and the particle number concentration of MPs: a small number of larger MPs can significantly contribute to the total mass, while having a limited impact on the particle number, and conversely, a multitude of small MPs will influence the particle number, while having a low impact on the total mass. In our study, the highest mass was measured at the KB-2 point (5140.98 µg/m3), while the highest particle number was recorded at the KB-7 point (196.85 MPs/m3). Also, in light of the current knowledge on risk assessment of MPs, it is recommended that the concentrations in toxicity tests be calculated as both mass and particle number [34]; this is why we reported both values.
In both areas, the most commonly found polymer types were PE and PP. Their abundance is not surprising, because these materials possess low-density characteristics (density below 1 g/cm3), which results in their floating on the water surface. Also, these two polymer types cover 60% of the global plastic production [35]. Alkyd, which was also a commonly found polymer type, is a commonly used painting material, including in coatings for roads and buildings as well as boat painting [36,37]. Alkyd is also commonly found in WWTP effluent water [38]. Our sampling period coincided with the main peak of the tourist season, with increased recreational activity (e.g., swimming, fishing, sailing), which could have influenced our results in the case of the lake [11]. Furthermore, the abundant presence of other polymer types, among which PS (7.44%) and POS (5.16%) were the two dominant ones, supports the hypothesis that tourism influences the MP load in the lake. The presence of both polymer types can clearly be connected with the increased human activity during the summer period. PS is commonly used in microbeads in personal care products and could enter the ecosystem, for example, through WWTPs [39], while POS is a commonly used synthetic fiber (e.g., in swimming suits) [40]. Also, the polymer type distribution indicate the possibility that most of the MP load in the lake did not originate from the KB area. Not only the polymer type distribution supports this theory, but also the MP concentration data. Our results revealed that, though the lake receives water from the KB, the average MP concentration in the lake was around three times higher than the KB average value. It is therefore conceivable that some MPs present in the lake did not enter the lake in conjunction with the KB water. Thus, a portion of the MPs present in the lake can likely be associated with tourism, entering the lake either directly from tourists or indirectly through wastewater treatment plants due to the increased population around the lake [11,40,41].
This is the first study to report the MP size distribution in these areas. As previously mentioned, our study also supports the notion that if we examine a smaller size range, more particles can be found. In our investigation, the prevailing size categories of MPs were found to be below 150 µm, indicating that they are susceptible to ingestion by aquatic organisms, including various zooplankton species such as Daphnia spp. [8]. As Daphnia spp. are prey for other aquatic organisms, MPs can enter and accumulate alongside the food chain [9]. The determination of the MP shapes is important, as the shape can influence the particles’ toxicity [22]. In both examined areas, fragment-shaped MPs were dominant: of the total MPs identified, they represented 86.60% in LB and 62.46% in KB. A higher prevalence of fragments among smaller MPs can be anticipated, as fragments can originate from both the degradation of larger particles and the disintegration of larger fibers [42].
According to the analysis of the MP concentrations at the sampling points, outlier values were determined in several cases: the number of MP particles in the KB-2, KB-7 and LB-5 samples was significantly higher compared to the average values. These sampling locations were marked out to further investigate the possible origin of MPs. At the LB-5 sampling point, the concentration of MPs was determined to be 106.84 MPs/m3; this value was approximately five times higher than the average concentration of MPs in the lake. Notably, this site is situated close to a treated wastewater inlet. In line with the literature, our result also supports the hypothesis that treated wastewater can be considered the major source of MPs in the case of freshwater ecosystems [43]. In the case of the other sampling points from the KB territory (KB-2, KB-7), KB-7 showed 196.85 MPs/m3, which is around 25 times higher than the average value for this region (7.8 ± 5.9 MPs/m3). As an explanation, KB-7 was situated under a newly built highway overpass; hence, an increased concentration of MPs at this sampling point was most probably due to road traffic, as supported by the scientific literature [44,45]. KB-2 was also situated close to a heavily congested road; furthermore, near this site, a highway rainwater drainage channel is connected to the location of the sampled surface water.

5. Conclusions

The present study, for the first time, dealt with the concentration of MPs in two unique aquatic ecosystems (Lake Balaton and the Kis-Balaton Water Protection System and its catchment area). The concentrations of MPs were expressed not only in particle number but also in estimated mass (the average particle number was 21.0 ± 12.5 MPs/m3 in LB and 7.8 ± 5.9 MPs/m3 in KB, while the average mass concentration was 44.4 ± 27.2 µg/m3 in LB and was 128.2 ± 144.4 µg/m3 in KB). Given the current scarcity of data concerning the presence of MPs in European lakes and an even more limited dataset regarding the MP levels within wetlands, our results definitely mitigate a void in knowledge. Our findings revealed that the presence of MPs could be detected at all sampling points, and the most abundant polymer types were PE, PP and alkyd. The MPs were mostly fragments in shape. In the lower size ranges, more MPs could be detected, and most of the MPs (≈90%) were below 500 µm. In our study, we defined two MP sources, i.e., WWTPs and traffic. Furthermore, the lake apparently receives most of the MPs not from its biggest water supplier but from different sources. Tourism is likely to be an additional source of MPs in the case of the lake; however, further (seasonal) investigations are necessary to prove this idea. Our study can contribute to future research that aims to determine the origin and fate of MPs in freshwater ecosystems.

Supplementary Materials

The following supporting information can be downloaded at: https://www.mdpi.com/article/10.3390/w16071014/s1, Figure S1: (A) The digital picture from the LB-4 sample presented by Dino-Lite Edge AM4115TL; (B) The collected spectra intensity of LB-4 are represented in the false color intensity map generated by siMPle software (Version 1.1.β), after the data collection by the FTIR microscope (NicoletTM In10 MX; Thermo Fisher Scientific, USA); (C) The data evaluation for LB-4 sample was done automatically by the by siMPle software (Version 1.1.β), where all individual spectra were compared to library spectrum in the software, orange spectrum represents, the spectrum coming from the sample, while blue spectrum represents, spectrum coming from the library; (D) A false color microplastic map of LB-4 sample created by the software, where each color represents other kind of polymers. Table S1: (A) The ascertainable limits of detection (LOD) and quantification (LOQ) are determinable through the examination of blank samples, enabling the computation of these values concerning the overall amount of microplastics (MPs); (B) Total microplastic concentrations of samples and sampling volumes can be seen; also, colors indicate how samples relate to the LOD and LOQ values (PE: polyethylene; PP: polypropylene; PS: polystyrene; ABS: acrylonitrile butadiene styrene; PA: polyamide; PU: polyurethane; PVC: polyvinyl chloride; LB: Lake Balaton; KB: Kis-Balaton Water Protection System and its catchment area).

Author Contributions

Conceptualization, B.P. and S.S.; Methodology, B.P., G.B., Z.L. and S.S.; Formal analysis, R.S.; Investigation, B.P., R.S., J.H., P.H., I.F., G.B., B.N.-F., Z.L. and S.S.; Resources, B.K., I.S., A.M., Z.P. (Zoltán Palotai) and S.S.; Writing—original draft, B.P., R.S., G.T. and S.S.; Writing—review & editing, J.H., E.K., G.B. and Z.P. (Zsolt Pirger); Visualization, B.P., J.H., G.T. and S.S.; Supervision, E.K., Z.C., A.M., Z.P. (Zoltán Palotai), Z.P. (Zsolt Pirger) and S.S.; Project administration, B.K., I.S., A.M., B.N.-F., Z.P. (Zoltán Palotai), Z.L., Z.P. (Zsolt Pirger) and S.S.; Funding acquisition, B.K. and I.S. All authors have read and agreed to the published version of the manuscript.

Funding

Project no. 2020-1.1.2-PIACI-KFI-2021-00239 was implemented with the support provided by the Ministry of Innovation and Technology of Hungary with the National Research, Development, and Innovation Fund, financed under the PIACI KFI funding scheme, the National Laboratory for Water Science and Water Security (#RRF 2.3.1-21-2022-00008, HUN-REN BLRI) and the Sustainable Development and Technologies National Program of the Hungarian Academy of Sciences (#NP2022-II3/2022, HUN-REN BLRI). This research was also supported by the Ministry of Innovation and Technology within the framework of the Thematic Excellence Program 2021, National Defense and Security sub-program (TKP2021-NVA-22, Hungarian University of Agriculture and Life Science). Project NO. C2270802 was implemented with the support provided by the Ministry of Culture and Innovation of Hungary with the National Research, Development and Innovation Fund, financed under the KDP-2023. This project was supported by the Research Excellence Program 2024 of the Hungarian University of Agriculture and Life Sciences (Z.C.). The APC was funded by the Hungarian University of Agriculture and Life Sciences.

Data Availability Statement

Further data available on request from the corresponding author.

Conflicts of Interest

Authors Bence Prikler, Gábor Bordós, Adrienn Micsinai, Brigitta Nyírő-Fekete, Zoltán Palotai were employed by the company Eurofins Analytical Services Hungary Ltd. The remaining authors declare that the research was conducted in the absence of any commercial or financial relationships that could be construed as a potential conflict of interest.

References

  1. Eerkes-Medrano, D.; Thompson, R.C.; Aldridge, D.C. Microplastics in Freshwater Systems: A Review of the Emerging Threats, Identification of Knowledge Gaps and Prioritisation of Research Needs. Water Res. 2015, 75, 63–82. [Google Scholar] [CrossRef] [PubMed]
  2. Plastics—Environmental Aspects—State of Knowledge and Methodologies. Available online: https://cdn.standards.iteh.ai/samples/72300/65b73cb6030f442aa1bd7eaa97386292/ISO-TR-21960-2020.pdf (accessed on 27 March 2024).
  3. Adhikari, S.; Kelkar, V.; Kumar, R.; Halden, R.U. Methods and Challenges in the Detection of Microplastics and Nanoplastics: A Mini-Review. Polym. Int. 2022, 71, 543–551. [Google Scholar] [CrossRef]
  4. Scherer, C.; Weber, A.; Stock, F.; Vurusic, S.; Egerci, H.; Kochleus, C.; Arendt, N.; Foeldi, C.; Dierkes, G.; Wagner, M.; et al. Comparative Assessment of Microplastics in Water and Sediment of a Large European River. Sci. Total Environ. 2020, 738, 139866. [Google Scholar] [CrossRef] [PubMed]
  5. Li, C.; Busquets, R.; Campos, L.C. Assessment of Microplastics in Freshwater Systems: A Review. Sci. Total Environ. 2020, 707, 135578. [Google Scholar] [CrossRef] [PubMed]
  6. Talbot, R.; Chang, H. Microplastics in Freshwater: A Global Review of Factors Affecting Spatial and Temporal Variations. Environ. Pollut. 2022, 292, 118393. [Google Scholar] [CrossRef] [PubMed]
  7. Bhagat, J.; Zang, L.; Nishimura, N.; Shimada, Y. Zebrafish: An Emerging Model to Study Microplastic and Nanoplastic Toxicity. Sci. Total Environ. 2020, 728, 138707. [Google Scholar] [CrossRef] [PubMed]
  8. Svigruha, R.; Prikler, B.; Farkas, A.; Ács, A.; Fodor, I.; Tapolczai, K.; Schmidt, J.; Bordós, G.; Háhn, J.; Harkai, P.; et al. Presence, Variation, and Potential Ecological Impact of Microplastics in the Largest Shallow Lake of Central Europe. Sci. Total Environ. 2023, 883, 163537. [Google Scholar] [CrossRef] [PubMed]
  9. Bowley, J.; Baker-Austin, C.; Porter, A.; Hartnell, R.; Lewis, C. Oceanic Hitchhikers—Assessing Pathogen Risks from Marine Microplastic. Trends Microbiol. 2021, 29, 107–116. [Google Scholar] [CrossRef] [PubMed]
  10. Maasz, G.; Mayer, M.; Zrinyi, Z.; Molnar, E.; Kuzma, M.; Fodor, I.; Pirger, Z.; Takács, P. Spatiotemporal Variations of Pharmacologically Active Compounds in Surface Waters of a Summer Holiday Destination. Sci. Total Environ. 2019, 677, 545–555. [Google Scholar] [CrossRef]
  11. Molnar, E.; Maasz, G.; Pirger, Z. Environmental Risk Assessment of Pharmaceuticals at a Seasonal Holiday Destination in the Largest Freshwater Shallow Lake in Central Europe. Environ. Sci. Pollut. Res. 2021, 28, 59233–59243. [Google Scholar] [CrossRef]
  12. Kovács, J.; Hatvani, I.G.; Korponai, J.; Kovács, I.S. Morlet Wavelet and Autocorrelation Analysis of Long-Term Data Series of the Kis-Balaton Water Protection System (KBWPS). Ecol. Eng. 2010, 36, 1469–1477. [Google Scholar] [CrossRef]
  13. Istvánovics, V.; Clement, A.; Somlyódy, L.; Specziár, A.; G.-Tóth, L.; Padisák, J. Updating Water Quality Targets for Shallow Lake Balaton (Hungary), Recovering from Eutrophication. Hydrobiologia 2007, 581, 305–318. [Google Scholar] [CrossRef]
  14. Farkas, M.; Szoboszlay, S.; Vörös, L.; Lovász, Z.; Méhes, N.; Mátyás, K.; Sebők, R.; Kaszab, E.; Háhn, J.; Tóth, G.; et al. Bacterial Community Dynamics along a River-Wetland-Lake System. Water 2022, 14, 3519. [Google Scholar] [CrossRef]
  15. Dömötörfy, Z.; Reeder, D.; Pomogyi, P. Changes in the Macro-Vegetation of the Kis-Balaton Wetlands over the Last Two Centuries: A GIS Perspective. Hydrobiologia 2003, 506, 671–679. [Google Scholar] [CrossRef]
  16. Marinović, Z.; Tokodi, N.; Backović, D.D.; Šćekić, I.; Kitanović, N.; Simić, S.B.; Đorđević, N.B.; Ferincz, Á.; Staszny, Á.; Dulić, T.; et al. Does the Kis-balaton Water Protection System (Kbwps) Effectively Safeguard Lake Balaton from Toxic Cyanobacterial Blooms? Microorganisms 2021, 9, 960. [Google Scholar] [CrossRef] [PubMed]
  17. Bordós, G.; Gergely, S.; Háhn, J.; Palotai, Z.; Szabó, É.; Besenyő, G.; Salgó, A.; Harkai, P.; Kriszt, B.; Szoboszlay, S. Validation of Pressurized Fractionated Filtration Microplastic Sampling in Controlled Test Environment. Water Res. 2021, 189, 116572. [Google Scholar] [CrossRef] [PubMed]
  18. Mári, Á.; Bordós, G.; Gergely, S.; Büki, M.; Háhn, J.; Palotai, Z.; Besenyő, G.; Szabó, É.; Salgó, A.; Kriszt, B.; et al. Validation of Microplastic Sample Preparation Method for Freshwater Samples. Water Res. 2021, 202, 117409. [Google Scholar] [CrossRef] [PubMed]
  19. Liu, Y.; Lorenz, C.; Vianello, A.; Syberg, K.; Nielsen, A.H.; Nielsen, T.G.; Vollertsen, J. Exploration of Occurrence and Sources of Microplastics (>10 Μm) in Danish Marine Waters. Sci. Total Environ. 2023, 865, 161255. [Google Scholar] [CrossRef]
  20. Primpke, S.; Cross, R.K.; Mintenig, S.M.; Simon, M.; Vianello, A.; Gerdts, G.; Vollertsen, J. Toward the Systematic Identification of Microplastics in the Environment: Evaluation of a New Independent Software Tool (SiMPle) for Spectroscopic Analysis. Appl. Spectrosc. 2020, 74, 1127–1138. [Google Scholar] [CrossRef]
  21. Simon, M.; van Alst, N.; Vollertsen, J. Quantification of Microplastic Mass and Removal Rates at Wastewater Treatment Plants Applying Focal Plane Array (FPA)-Based Fourier Transform Infrared (FT-IR) Imaging. Water Res. 2018, 142, 1–9. [Google Scholar] [CrossRef]
  22. Bostan, N.; Ilyas, N.; Akhtar, N.; Mehmood, S.; Saman, R.U.; Sayyed, R.Z.; Shatid, A.A.; Alfaifi, M.Y.; Elbehairi, S.E.I.; Pandiaraj, S. Toxicity Assessment of Microplastic (MPs); a Threat to the Ecosystem. Environ. Res. 2023, 234, 116523. [Google Scholar] [CrossRef] [PubMed]
  23. Vianello, A.; Jensen, R.L.; Liu, L.; Vollertsen, J. Simulating Human Exposure to Indoor Airborne Microplastics Using a Breathing Thermal Manikin. Sci. Rep. 2019, 9, 8670. [Google Scholar] [CrossRef] [PubMed]
  24. Cole, M. A Novel Method for Preparing Microplastic Fibers. Sci. Rep. 2016, 6, 34519. [Google Scholar] [CrossRef] [PubMed]
  25. Horton, A.A.; Cross, R.K.; Read, D.S.; Jürgens, M.D.; Ball, H.L.; Svendsen, C.; Vollertsen, J.; Johnson, A.C. Semi-Automated Analysis of Microplastics in Complex Wastewater Samples. Environ. Pollut. 2021, 268, 115841. [Google Scholar] [CrossRef] [PubMed]
  26. Miller, E.; Sedlak, M.; Lin, D.; Box, C.; Holleman, C.; Rochman, C.M.; Sutton, R. Recommended Best Practices for Collecting, Analyzing, and Reporting Microplastics in Environmental Media: Lessons Learned from Comprehensive Monitoring of San Francisco Bay. J. Hazard. Mater. 2021, 409, 124770. [Google Scholar] [CrossRef] [PubMed]
  27. Tanentzap, A.J.; Cottingham, S.; Fonvielle, J.; Riley, I.; Walker, L.M.; Woodman, S.G.; Kontou, D.; Pichler, C.M.; Reisner, E.; Lebreton, L. Microplastics and Anthropogenic Fibre Concentrations in Lakes Reflect Surrounding Land Use. PLoS Biol. 2021, 19, e3001389. [Google Scholar] [CrossRef] [PubMed]
  28. Zheng, Y.; Li, J.; Sun, C.; Cao, W.; Wang, M.; Jiang, F.; Ju, P. Comparative Study of Three Sampling Methods for Microplastics Analysis in Seawater. Sci. Total Environ. 2021, 765, 144495. [Google Scholar] [CrossRef] [PubMed]
  29. Liu, Y.; Prikler, B.; Bordós, G.; Lorenz, C.; Vollertsen, J. Does Microplastic Analysis Method Affect Our Understanding of Microplastics in the Environment? Sci. Total Environ. 2023, 902, 166513. [Google Scholar] [CrossRef] [PubMed]
  30. Uurasjärvi, E.; Hartikainen, S.; Setälä, O.; Lehtiniemi, M.; Koistinen, A. Microplastic Concentrations, Size Distribution, and Polymer Types in the Surface Waters of a Northern European Lake. Water Environ. Res. 2020, 92, 149–156. [Google Scholar] [CrossRef]
  31. Bordós, G.; Urbányi, B.; Micsinai, A.; Kriszt, B.; Palotai, Z.; Szabó, I.; Hantosi, Z.; Szoboszlay, S. Identification of Microplastics in Fish Ponds and Natural Freshwater Environments of the Carpathian Basin, Europe. Chemosphere 2019, 216, 110–116. [Google Scholar] [CrossRef]
  32. Dalvand, M.; Hamidian, A.H. Occurrence and Distribution of Microplastics in Wetlands. Sci. Total Environ. 2023, 862, 160740. [Google Scholar] [CrossRef] [PubMed]
  33. Kaliszewicz, A.; Winczek, M.; Karaban, K.; Kurzydłowski, D.; Górska, M.; Koselak, W.; Romanowski, J. The Contamination of Inland Waters by Microplastic Fibres under Different Anthropogenic Pressure: Preliminary Study in Central Europe (Poland). Waste Manag. Res. 2020, 38, 1231–1238. [Google Scholar] [CrossRef] [PubMed]
  34. Thornton Hampton, L.M.; Brander, S.M.; Coffin, S.; Cole, M.; Hermabessiere, L.; Koelmans, A.A.; Rochman, C.M. Characterizing Microplastic Hazards: Which Concentration Metrics and Particle Characteristics Are Most Informative for Understanding Toxicity in Aquatic Organisms? Microplastics Nanoplastics 2022, 2, 20. [Google Scholar] [CrossRef]
  35. Kye, H.; Kim, J.; Ju, S.; Lee, J.; Lim, C.; Yoon, Y. Microplastics in Water Systems: A Review of Their Impacts on the Environment and Their Potential Hazards. Heliyon 2023, 9, e14359. [Google Scholar] [CrossRef]
  36. Gaylarde, C.C.; Neto, J.A.B.; da Fonseca, E.M. Paint Fragments as Polluting Microplastics: A Brief Review. Mar. Pollut. Bull. 2021, 162, 111847. [Google Scholar] [CrossRef]
  37. Turner, A. Paint Particles in the Marine Environment: An Overlooked Component of Microplastics. Water Res. X 2021, 12, 100110. [Google Scholar] [CrossRef]
  38. Kameda, Y.; Yamada, N.; Fujita, E. Source- and Polymer-Specific Size Distributions of Fine Microplastics in Surface Water in an Urban River. Environ. Pollut. 2021, 284, 117516. [Google Scholar] [CrossRef] [PubMed]
  39. Habib, R.Z.; Al Kendi, R.; Thiemann, T. The Effect of Wastewater Treatment Plants on Retainment of Plastic Microparticles to Enhance Water Quality—A Review. J. Environ. Prot. 2021, 12, 161–195. [Google Scholar] [CrossRef]
  40. Ronda, A.C.; Menéndez, M.C.; Tombesi, N.; Álvarez, M.; Tomba, J.P.; Silva, L.I.; Arias, A.H. Microplastic Levels on Sandy Beaches: Are the Effects of Tourism and Coastal Recreation Really Important? Chemosphere 2023, 316, 137842. [Google Scholar] [CrossRef]
  41. Franco, A.A.; Iglesias-Arroyo, D.; Egea-Corbacho, Á.; Martín-García, A.P.; Quiroga, J.M.; Coello, M.D. Influence of Tourism on Microplastic Contamination at Wastewater Treatment Plants in the Coastal Municipality of Chiclana de La Frontera. Sci. Total Environ. 2023, 900, 165573. [Google Scholar] [CrossRef]
  42. Li, C.; Wang, X.; Liu, K.; Zhu, L.; Wei, N.; Zong, C.; Li, D. Pelagic Microplastics in Surface Water of the Eastern Indian Ocean during Monsoon Transition Period: Abundance, Distribution, and Characteristics. Sci. Total Environ. 2021, 755, 142629. [Google Scholar] [CrossRef] [PubMed]
  43. Wu, X.; Zhao, X.; Chen, R.; Liu, P.; Liang, W.; Wang, J.; Teng, M.; Wang, X.; Gao, S. Wastewater Treatment Plants Act as Essential Sources of Microplastic Formation in Aquatic Environments: A Critical Review. Water Res. 2022, 221, 118825. [Google Scholar] [CrossRef] [PubMed]
  44. Chen, G.; Feng, Q.; Wang, J. Mini-Review of Microplastics in the Atmosphere and Their Risks to Humans. Sci. Total Environ. 2020, 703, 135504. [Google Scholar] [CrossRef] [PubMed]
  45. Järlskog, I.; Strömvall, A.M.; Magnusson, K.; Galfi, H.; Björklund, K.; Polukarova, M.; Garção, R.; Markiewicz, A.; Aronsson, M.; Gustafsson, M.; et al. Traffic-Related Microplastic Particles, Metals, and Organic Pollutants in an Urban Area under Reconstruction. Sci. Total Environ. 2021, 774, 145503. [Google Scholar] [CrossRef]
Figure 1. Subfigure (I) shows the geographical location of the studied area in Hungary, and subfigure (II) indicates the magnified area with the sampling points. The location and designation of the MP sample points in the Kis-Balaton Water Protection System and its catchment area (KB) are presented in subfigure (III), and the Lake Balaton’s (LB) sample points are figured in Subfigure (IV) with the main water flow directions.
Water 16 01014 g001
Figure 2. The determined abundance of MPs and their estimated mass in the areas of Kis-Balaton and its catchment area and Lake Balaton, Hungary. Bar graphs indicate average MP concentrations in MPs/m3 and estimated mass concentrations in µg/m3 in the two examined regions. Error bars indicate the standard deviation between the sampling points per region. (LB: Lake Balaton; KB: Kis-Balaton Water Protection System and its catchment area; bold straight arrows link the bar charts to their respective sampling points).
Water 16 01014 g002
Figure 3. The abundance of different polymer types in Kis-Balaton and its catchment area and Lake Balaton water samples. Average microplastic distribution by polymer type in the two examined regions in percentage. (PE: polyethylene; PP: polypropylene; PS: polystyrene; ABS: acrylonitrile butadiene styrene; PA: polyamide; PU: polyurethane; PVC: polyvinyl chloride; LB: Lake Balaton; KB: Kis-Balaton Water Protection System and its catchment area).
Water 16 01014 g003
Figure 4. MP distribution in the area of Kis-Balaton and its catchment area (KB) and Lake Balaton (LB). (A) size distribution of MPs in the 15 sampling points, (B) average size distribution of MPs in the two examined regions.
Water 16 01014 g004
Figure 5. (A) Percentages of MP fibers and fragments in the area of Kis-Balaton and its catchment area (KB) and Lake Balaton (LB) in individual sampling points, (B,C) proportions of fibers and fragments within the entire set of examined samples from KB and LB.
Water 16 01014 g005
Disclaimer/Publisher’s Note: The statements, opinions and data contained in all publications are solely those of the individual author(s) and contributor(s) and not of MDPI and/or the editor(s). MDPI and/or the editor(s) disclaim responsibility for any injury to people or property resulting from any ideas, methods, instructions or products referred to in the content.

