1. Introduction
Morphological and sediment transport processes in fluvial systems play important roles in the sustainable management of riverine ecosystems, hydraulic structures, and other infrastructure in the riverine environment. With a better understanding of channel-forming processes and patterns, improved decisions can be made surrounding the management of river systems through better consideration of their morphological evolution over time. Laboratory flumes are commonly used to study various aspects of river development under controlled conditions. Many studies also simplify the river channel with a confined (or fixed) bed, bank, or both to investigate flow conditions, sediment transport processes, temporal development, or armoring effects in gravel-bed channels [
1,
2,
3,
4] and in sand-bed channels [
5,
6,
7,
8]. Confined bank flumes have also been used to investigate the effects of river sinuosity on flow patterns [
9].
With advancements in the understanding of fluvial processes, increasingly complex experiments have been conducted in unconfined bed and bank conditions, allowing the simulated river channel to deform vertically and laterally. Studies in these types of flumes have investigated topics such as requirements to sustain river meandering [
10]; effects of perturbations in sustaining meanders or developing cutoffs [
11,
12]; and effects of sinuosity, channel width, and flow rate on morphological development [
13]. Some studies have also focused on braided river channel development [
14,
15], but limited knowledge is available on the effect of irregular single-channel planform geometries on flow patterns and morphological processes in alluvial streams.
One type of irregular single-channel planform geometry is the skewed meandering channel, in which the meander apex is shifted either up- or down-valley from the meander centroid. Lanzoni and Seminara [
16] suggested that the width-to-depth ratio of a river channel relative to the resonant condition given by Blondeaux and Seminara [
17] affected the direction of migration for planform changes, which would translate to dominantly up-valley skewed bends in sub-resonant conditions (width-to-depth ratio smaller than resonant) and dominantly down-valley skewed bends in super-resonant conditions.
However, many river channels show both directions of skewness, which may be from the effects of vegetation [
18]. Abad and Garcia [
19,
20] investigated the effects of bend orientation in a skewed meandering channel on flow dynamics and bedform developments using a narrow, confined bank flume. The authors found that the down-valley skew scenario had more developed secondary flow patterns and more energy dissipation when compared to the up-valley skew direction.
When sediment was introduced, the down-valley skewed geometry had more developed and stable bedforms with a more apparent progression over time. The down-valley skewed case also had a deeper scour region (located downstream of the apex) when compared to the up-valley skewed case. The same flume has since been further used to study alluvial cover and bedrock erosion in skewed meanders [
21].
To date, no experiments have investigated whether the patterns seen in the work performed by Abad and Garcia [
19,
20] would appear in a fully unconfined flume system where the banks also deform, not just the bed. The channel used in those experiments was also narrow but had a deeper flow; thus, a wider river channel with a relatively shallower flow may show different results due to differences in how secondary currents form.
In this research, a new flume system was constructed to investigate how skewness orientation impacts an unconfined alluvial stream that is considered to be relatively wide in comparison to flow depth. The results from this research will give new insights into the morphological processes in alluvial streams and provide engineers and hydrologists with better tools to assess stream erosion risks and to plan effective mitigation measures.
3. Results
3.1. Erosion Rates and Amounts
In all experiments, stable and steady bedforms and planform geometries formed within the experiment runtime. Morphological changes occurred quickly within the first few time steps of each run and stabilized as armoring effects took place. Sediment continued to be transported throughout all time steps, but the rates declined until only a few individual sediment grains could be observed being moved. Initially, two methods of assessing sediment transport were used: the mass of sediment collected in the sedimentation basin and sediment trap and the calculated volume of eroded sediment between DEMs. However, the mass of collected sediment was determined to be strongly influenced by material eroded from the inlet and outlet regions and was thus not used for further analysis. The calculated volume method was not prone to this influence since those regions could be excluded from the calculations.
The volume of eroded sediment only had significant erosion rates in the first 10 min (the first time step), with further changes approaching the equilibrium point of zero erosion (since there was no sediment feed). Some time steps had higher-than-desired flow rates, up to 20% higher in time step #7 of the up-valley experiment and up to 42% and 54% higher in time steps #5 and #8 of the non-skewed experiment, but no significant corresponding increase in sediment erosion was observed. The lack of calculated erosion in response to the fluctuations in flow rate suggests that they did not significantly affect overall morphological development. Further, the analyses focus on overall changes to the channel rather than rates of change between time steps, helping to mute the effects of short-term fluctuations in flow rates. The up-valley skewed experiment had the largest amount of total eroded sediment, while the down-valley skewed experiment had the least. However, this result was partially attributed to differences in initial slope conditions between the experiments, and a more significant conclusion could not be drawn based on these data alone.
3.2. Bank Erosion and Effects of Initial Slope
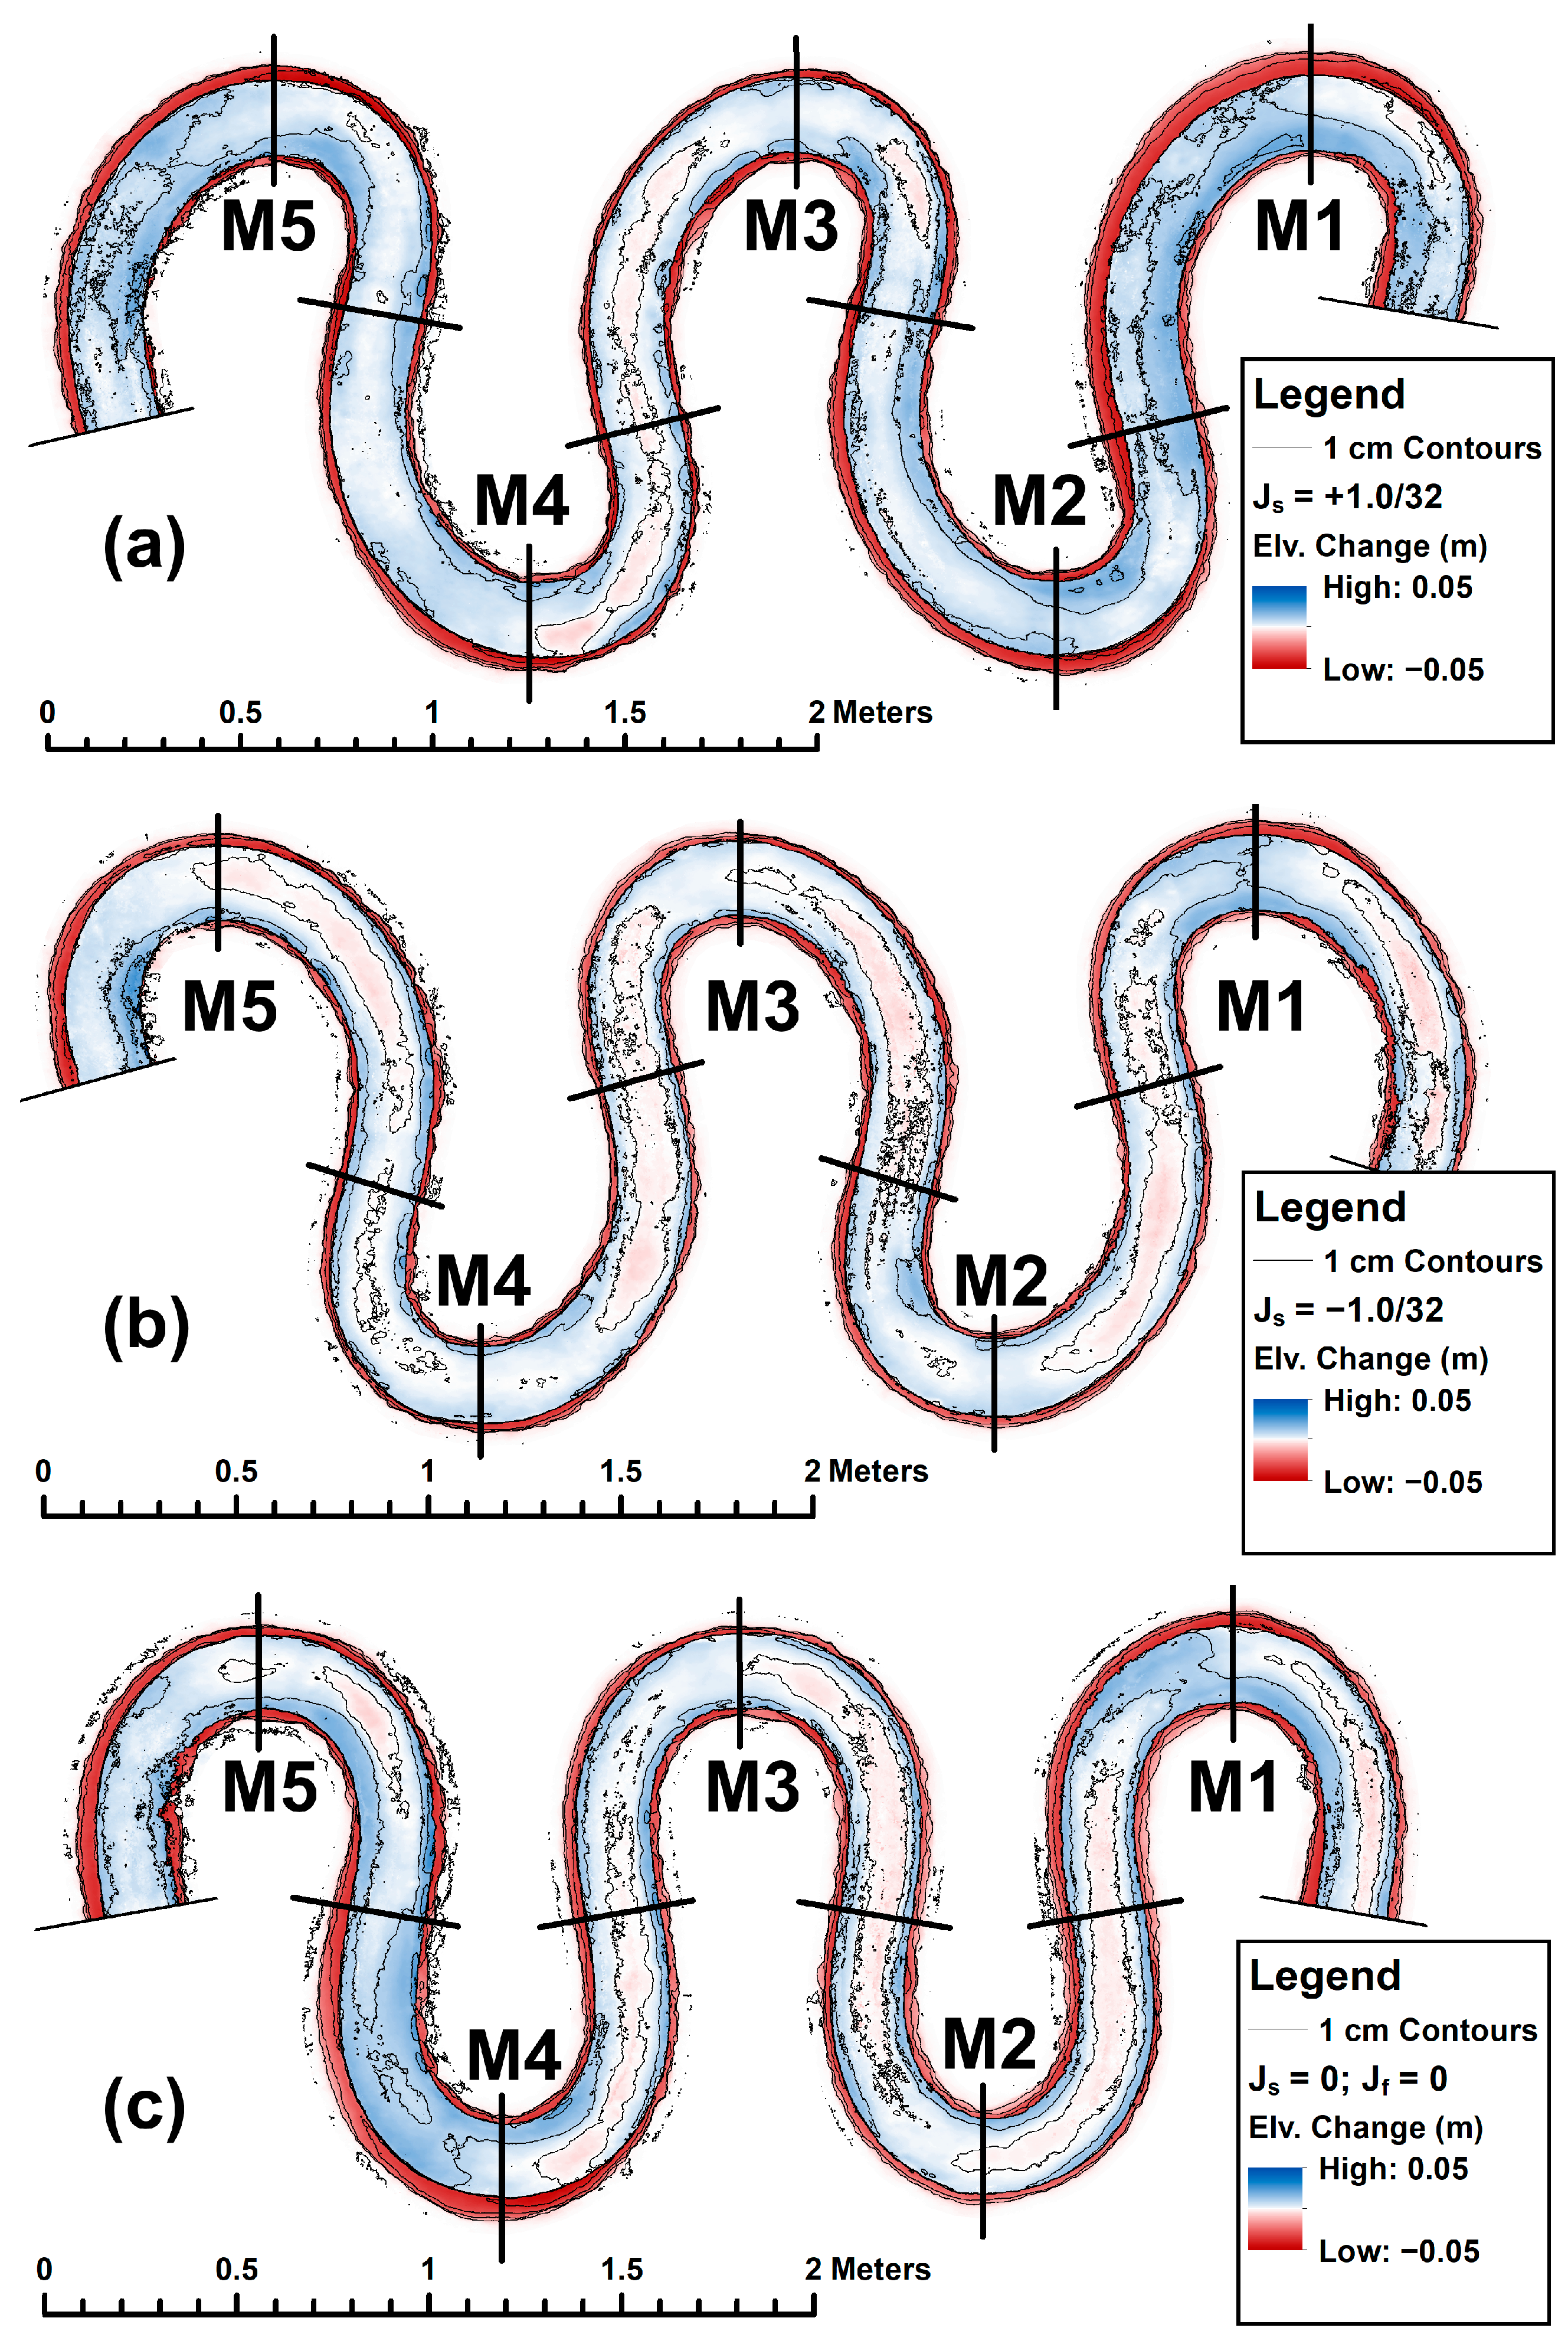
Rapid erosion in the first few minutes of each experiment matched with the observed morphological development, which also primarily occurred in the first 10 min of each experiment. Elevation differences between the initial and final topographies of each experiment are shown in
Figure 2, with labels for each meander, from M1 through to M5. Meanders were defined to start at the upstream inflection point and end at the downstream inflection. Red areas correspond to regions of erosion, while blue areas indicate regions of net sediment deposition. The first meander (M1) of each experimental channel had more pronounced morphological development, especially in the up-valley skewed and non-skewed experiments. The increased development in M1 was attributed to inlet effects of flow accelerating through the straight inlet section, with effects diminishing in later meanders. Outlet effects were also noticeable, especially in the non-skewed experiment, but were considered to minimally affect the meandering region of interest and primarily only impacted the collected sediment data. Elevation differences showed erosion on both sides of the channel due to the initially vertical banks slumping into the channel. The slumping of the banks likely contributed to more rapid development in morphological features and a larger initial rate of sediment erosion.
Aside from the increased bank erosion in M1, differing levels of erosion are also present in other meanders. In the up-valley skewed experiment, increased erosion was observed in M2, M4, and M5. In the down-valley skewed experiment, minimal bank erosion occurred in most meanders, although M5 had slightly increased erosion. Lastly, the non-skewed experiment had increased bank erosion in M4 and M5. In all experiments, erosion primarily occurred along the outer bank, as expected, where flow was expected to exert the most force against the banks. Differences in the extent of bank erosion between meanders were attributed to minor inconsistencies in the initially carved channel slope.
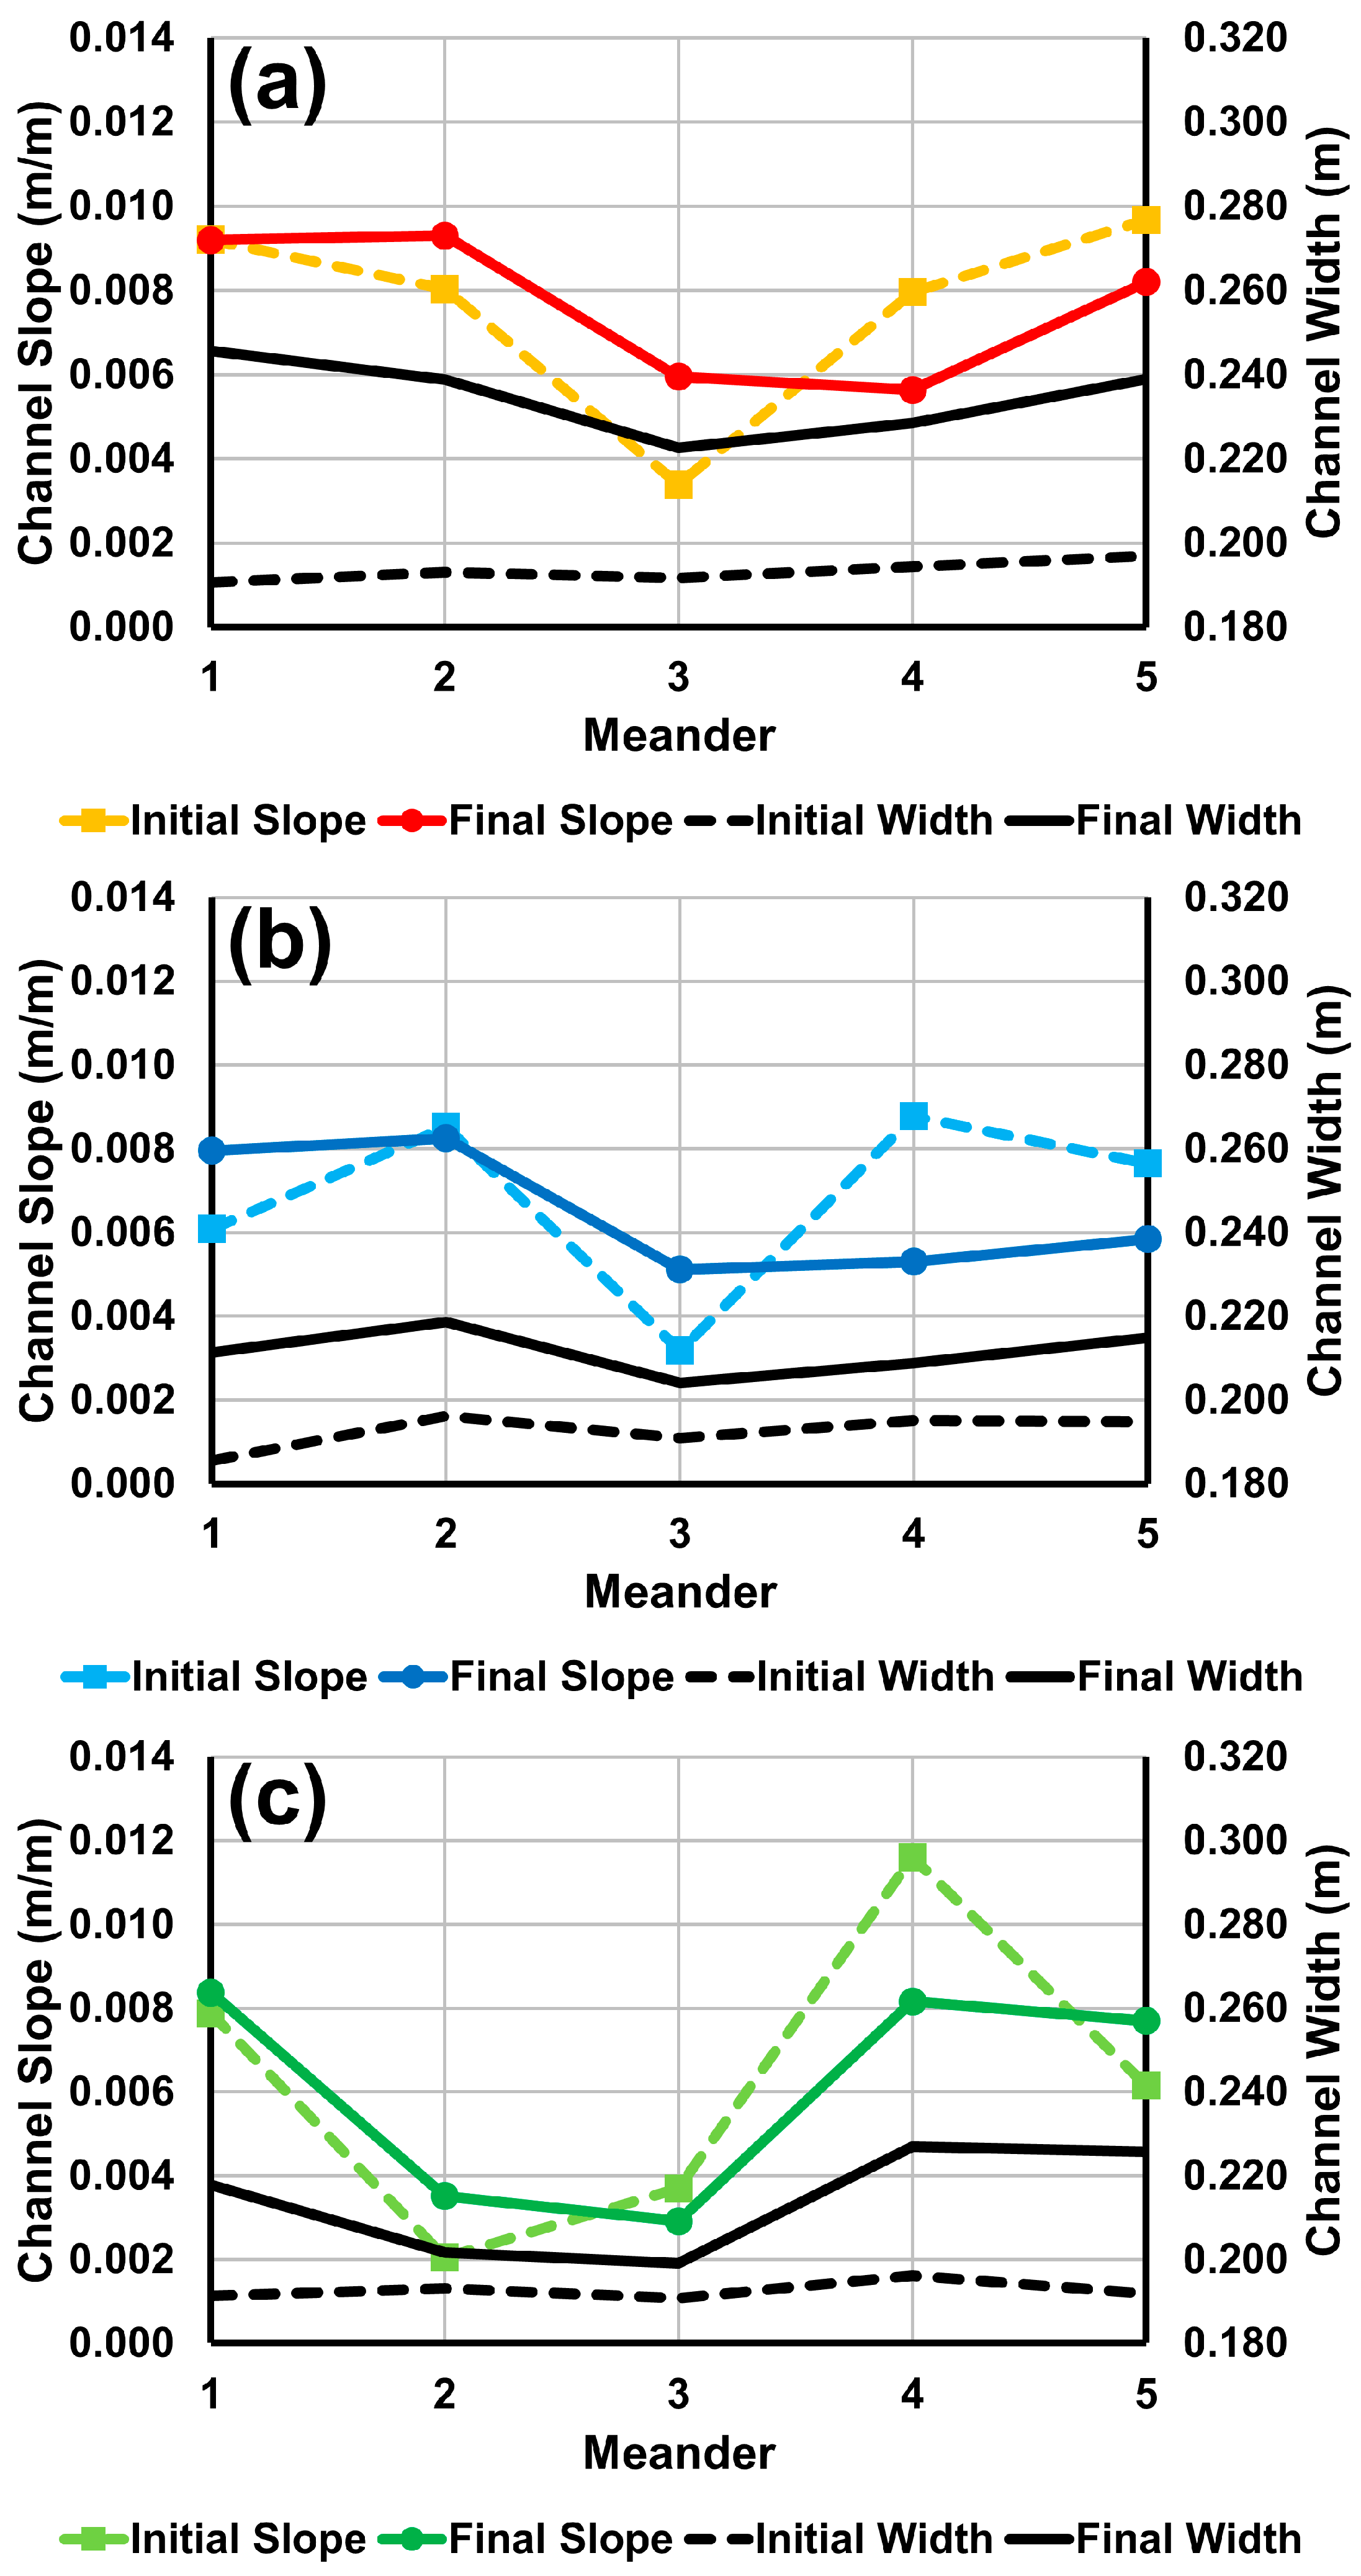
Comparisons were made between channel widths (B) in each meander to both initial and final meander slopes in
Figure 3 to assess the effects of slope inconsistencies on the results. Channel width was measured by generating perpendicular cross-sections along the initial centerline at 0.05 m intervals and clipping them to the extent of the banks. Each cross-section in a meander was averaged for the representative width of that meander. Slope was measured using the elevation drop between inflection points and the streamwise meander length. Elevation at the point of inflection was determined using the nearest cross-section, sampling elevations at 0.01 m intervals, and averaging for a representative value. Overall, the up-valley skewed channel had the steepest overall slope at S = 1/131, while the down-valley skewed channel had S = 1/147, and the non-skewed channel had the shallowest slope at S = 1/159.
The comparison between channel width and slope showed correlations between them, as expected, indicating that slope affected the magnitude of development in each meander. Meanders with greater slopes generally had greater widening from bank erosion. The greater overall slope in the up-valley skewed experiment likely also contributed to its faster approach to equilibrium in sediment transport rates, as well as the greater overall volume of eroded sediment. The non-skewed experiment had the smallest overall slope but showed greater development than the down-valley skewed experiment. This result was likely due to greater local variabilities in meander slope, leading to larger developments in individual meanders despite a shallower average slope across the entire channel. The relative contributions from those meanders likely overshadowed the shallower overall average slope of the entire channel.
3.3. Normalized Morphological Development
To suppress the effects of initial channel slopes and isolate the impacts of skewness orientation on morphological development, the digital elevation models were detrended and normalized. Detrending was achieved by subtracting out an artificial DEM created by extrapolating the initial channel bed elevations to cover the required width extents in the final channel. The detrended DEM could then be normalized between 0 and −1, where 0 corresponded to the initial bankfull flow elevation (assumed at the theoretical bankfull flow depth at 0.05 m, the size of the carving tool), and −1 corresponded to the initial bed elevation. The resulting detrended and normalized DEMs are shown in
Figure 4.
The method was successful in suppressing differences in channel slope between individual meanders, allowing for easier comparisons between them and highlighting the locations of bars and pools. Bar formations appear in the yellow and orange color ranges, while pools appear in the dark green and blue color ranges. The magnitudes of these bed features were still affected by the initial slopes, but interesting patterns emerged in the locations of the bedforms. In the up-valley skewed experiment, bars formed upstream of the meander apex and extended along the inner bank until the downstream inflection point. In M2 through to M5, a pool formed upstream of the apex next to the bar. In the down-valley skewed experiment, features were less visible due to the smaller amount of morphological development, but a bar can still be observed forming upstream of the apex and extending slightly past the apex, especially in M1 and M2.
Pools are more difficult to observe, but two can be identified in each meander: one upstream of the apex and one downstream of the apex. In the non-skewed experiment, bars form upstream of the apex points and end near the apex, especially in M1, M4, and M5. Where a pronounced bar is formed, a corresponding pool is also formed next to it, upstream of the apex. Deeper regions were present in M2, but those were attributed to insufficient morphological development to fully eliminate initial conditions (where that section was deeper, to begin with), especially since slopes through M2 and M3 were milder than intended. The greater slopes in M1, M4, and M5 indicate that the features present there were more likely to be formed by flow structure.
4. Discussion
While the absolute magnitudes and development rates were influenced by the initial slope conditions of the carved channel, the locations of bedform formation and patterns in the erosion–deposition zones were considered to be minimally affected. In the up-valley skewed channel, the development patterns were comparable to those observed by Abad and Garcia [
20], with a similar bar forming upstream of the apex and extending up to or just past the downstream inflection point.
However, in their fixed bank flume, the pool did not form; instead, the deepest point in the channel bed was scouring at the outer bank. In these experiments, a pool formed instead, albeit at the same location. The down-valley skewed experiment also showed similar bar formation locations; however, they are harder to discern due to the lower magnitude of development. Once again, the deeper pool regions form in similar locations to the results of Abad and Garcia [
20] upstream and downstream of the apex. However, one key difference was that the downstream pool location was not noticeably deeper than the upstream. In the non-skewed channel, the results were most comparable to the up-valley skewed experiment, where the bar formed upstream of the apex with a single corresponding pool.
Another key difference in results was that these experiments all formed stable morphological features, while the Abad and Garcia [
20] experiments continued to have fluctuations over time (particularly in the up-valley skewed experiment). The difference is likely attributable to those experiments having a sediment supply and a fixed-bank narrow channel, which would likely have stronger turbulence and secondary currents. The current experiments did not have a sediment supply to support ongoing changes, and with erodible banks, the channel widened and led to greater stability in morphological features.
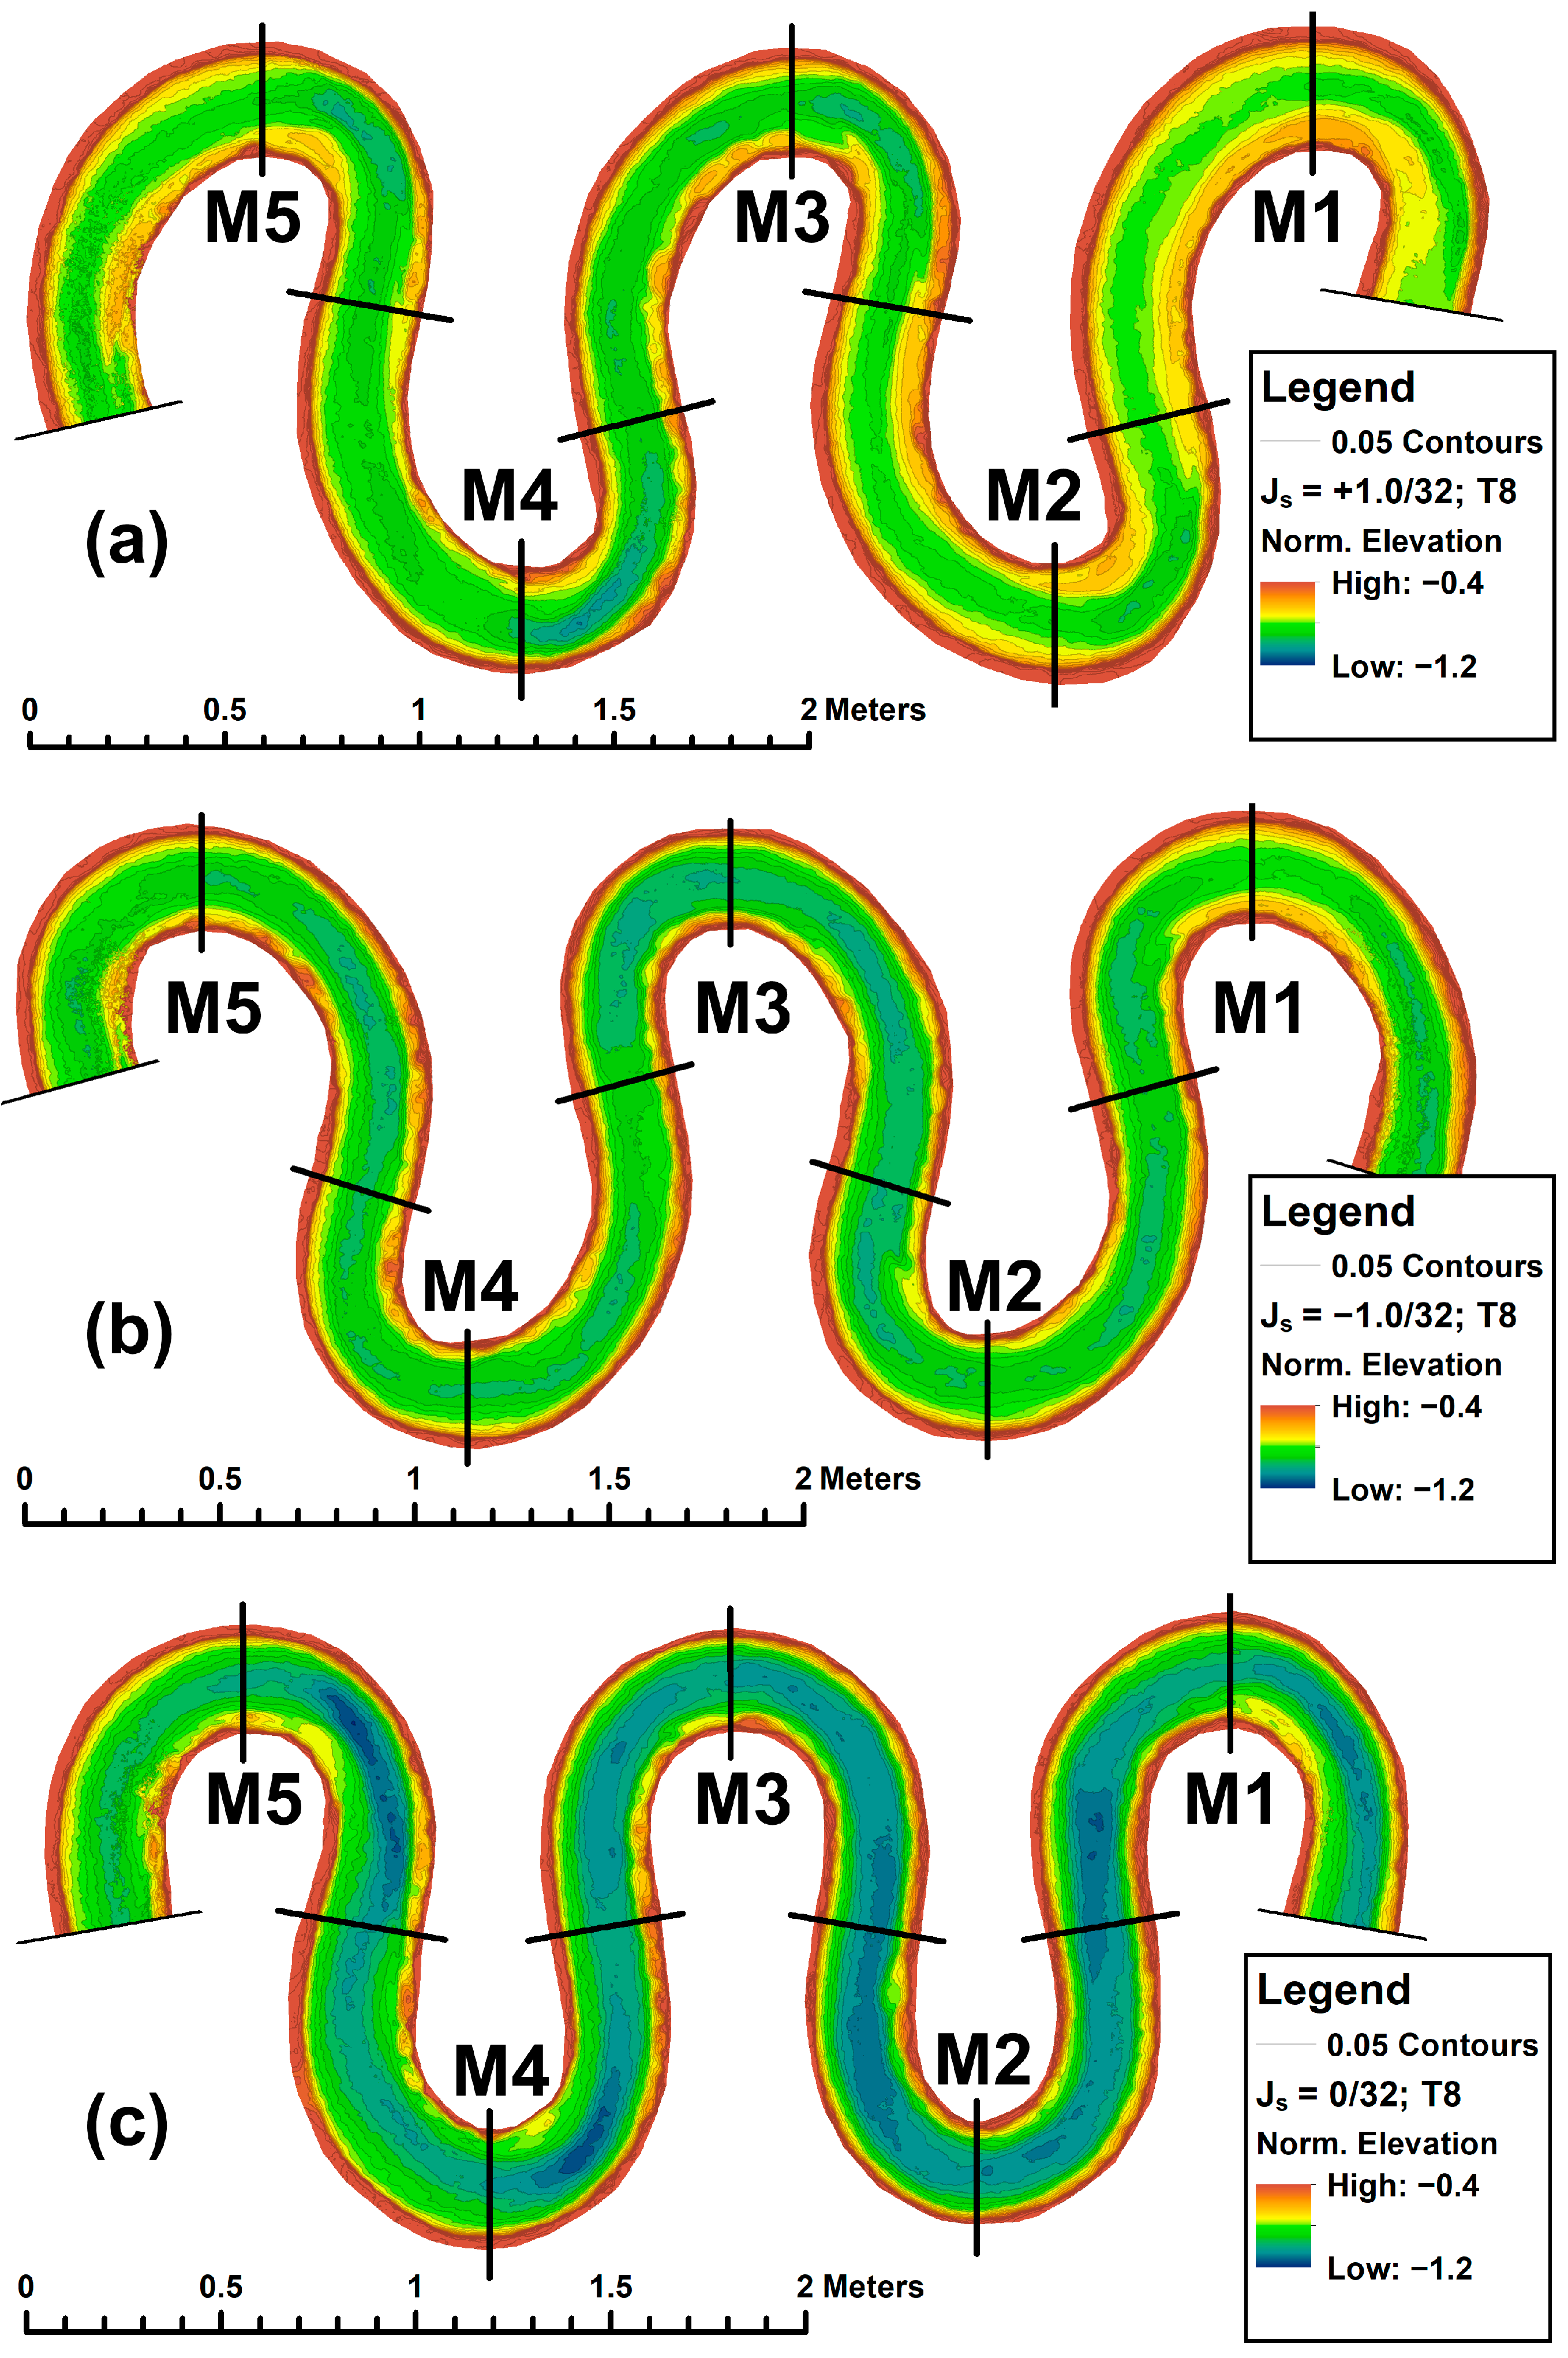
At the end of each experiment run (i.e., after time step #8), an extra 10 min time step was completed at an elevated flow rate to see if the morphological development patterns would change under a larger flow regime. The data from this time step were not included with the main results due to less controlled flow conditions leading to larger variances in the flow rate throughout this time step. The average flow rate for the up-valley skewed channel was Q = 0.953 L/s, that of the down-valley skewed channel was Q = 0.973 L/s, and that of the non-skewed channel was Q = 0.967 L/s. The detrended and normalized DEMs from this time step are shown in
Figure 5.
Similar to the low flow conditions, the initially carved slope conditions continued to affect magnitudes of development in each meander bend, but the same patterns of morphological development occurred in comparison to the lower flow rate results. Even meander bends that previously had too mild a slope to have meaningful development began to exhibit the same developmental patterns, suggesting that slope and flow rate mainly influenced magnitudes of development in these experiments, while the morphological development patterns were driven by the channel geometry and sediment substrate.
However, it should be noted that conditions did not meet a new equilibrium point yet, and the channel would have likely developed further if the flow was sustained for a longer time. Despite that limitation, it is believed that the underlying flow structures would have already developed, and the bedforms here still provide information on the final, stable morphological state.
Interestingly, under the larger flow rate, the deepest pool always formed in all channel planform geometries upstream of the apex, contrasting the deeper scour region noted by Abad and Garcia [
20] in the down-valley skewed condition. This result also contrasted expectations that greater erosion would occur at the location of greatest change in velocity direction (i.e., the tightest radius of curvature), where flow would most directly impact the banks. This expectation only held true in the up-valley skewed channel, where the tightest portion of the meander bend occurred upstream of the apex. Furthermore, the scour region in Abad and Garcia [
20] was near the bank, as opposed to the pools nearer to the centerline in these experiments, which is attributed to the mobile banks being able to adjust during the early stages of the experiments, allowing for channel widening. These differences in morphological development location suggest that the stable morphological state and geometry of a skewed meandering river channel may also depend on the width-to-depth ratio and having erodible banks.
Influences from bank erodibility affecting how the channel forms in the lab would align with the noted potential effects of vegetation [
18] and bank erodibility [
26,
27,
28] on planform geometry changes. However, quantifying these influences from these experiments is difficult due to additional differences in the flume system setup and the sediment-starved conditions used. The sizes of the flume systems were different, with necessary changes in scaling for a smaller river channel. The lack of sediment supply likely meant that the bedforms did not grow to their largest extent. Any migrating features or ongoing changes would not be possible without a sustained sediment supply. However, many of the results seen in these experiments were comparable to those of the Abad and Garcia [
20] experiments, where recirculating sediment was used.
Overall, the experiments completed were limited in providing data on rates of change and magnitude of morphological developments due to initial conditions in bank slope and channel slope, but useful insights were gained when examining the locations of bedforms in the final, stable channel. The results contrasted with the expectations from past experiments for the location of the deepest scour (in the form of a pool at the riverbed) and suggested that the relative width-to-depth ratio and the ability for banks to erode will impact how the river channel evolves.
Future research in this flume should improve upon the methodologies used to ensure more consistent slopes and mitigate the initial slumping of the banks. Further work should also explore isolating and quantifying the effects of having an erodible bank as well as having a relatively shallower flow depth that is more representative of naturally occurring streams. Quantifying the effects will be a strong basis to validate future modelling efforts to predict the morphological evolution and hydraulic conditions within these types of skewed meandering river channels.
5. Conclusions
To date, this study has been the first to perform experiments on skewed meandering channels in an unconfined alluvial laboratory flume. Issues with initial slope conditions and initial bank stability led to more rapid development and differing magnitudes of development across different meander bends. Still, the overall patterns produced in the final, stable morphological state were not considered to be impacted.
The results showed that skewness orientation influenced the positioning of where the bar formed in meander bends, with some effect on pools, but the deepest pool always formed upstream of the apex regardless of skewness orientation. The qualitative analysis of a brief higher flow rate showed that the same morphological features formed but with larger magnitudes, suggesting a reduced slope and flow rate impact on bedform locations, with larger impacts from the channel geometry and sediment type.
The location of the deepest pool contrasted with past studies showing deeper scours should occur downstream of the apex, but the bar formation locations were more comparable. The findings suggest that skewed meandering planform geometries can produce different morphological features depending on the relative width of a river channel to its flow depth and whether the channel banks are erodible or not.
Further research should seek to isolate these factors and quantify the specific effect of each on the resulting morphological development of a river system. In addition, the results from this research suggest that further investigation into the morphological adjustments of skewed meandering streams in response to discharge events having larger magnitude and longer duration, as well as the role of vegetation in protecting streambanks from erosion, is necessary. Quantifying these effects can yield further insights into river morphological behaviors and be applicable in predicting their future geometries and their implications for sediment transport and river engineering projects.


