
Evaluating the Effectiveness of Rainwater Storage Tanks Based on Different Enabling Rules


Abstract
1. Introduction
2. Methodology
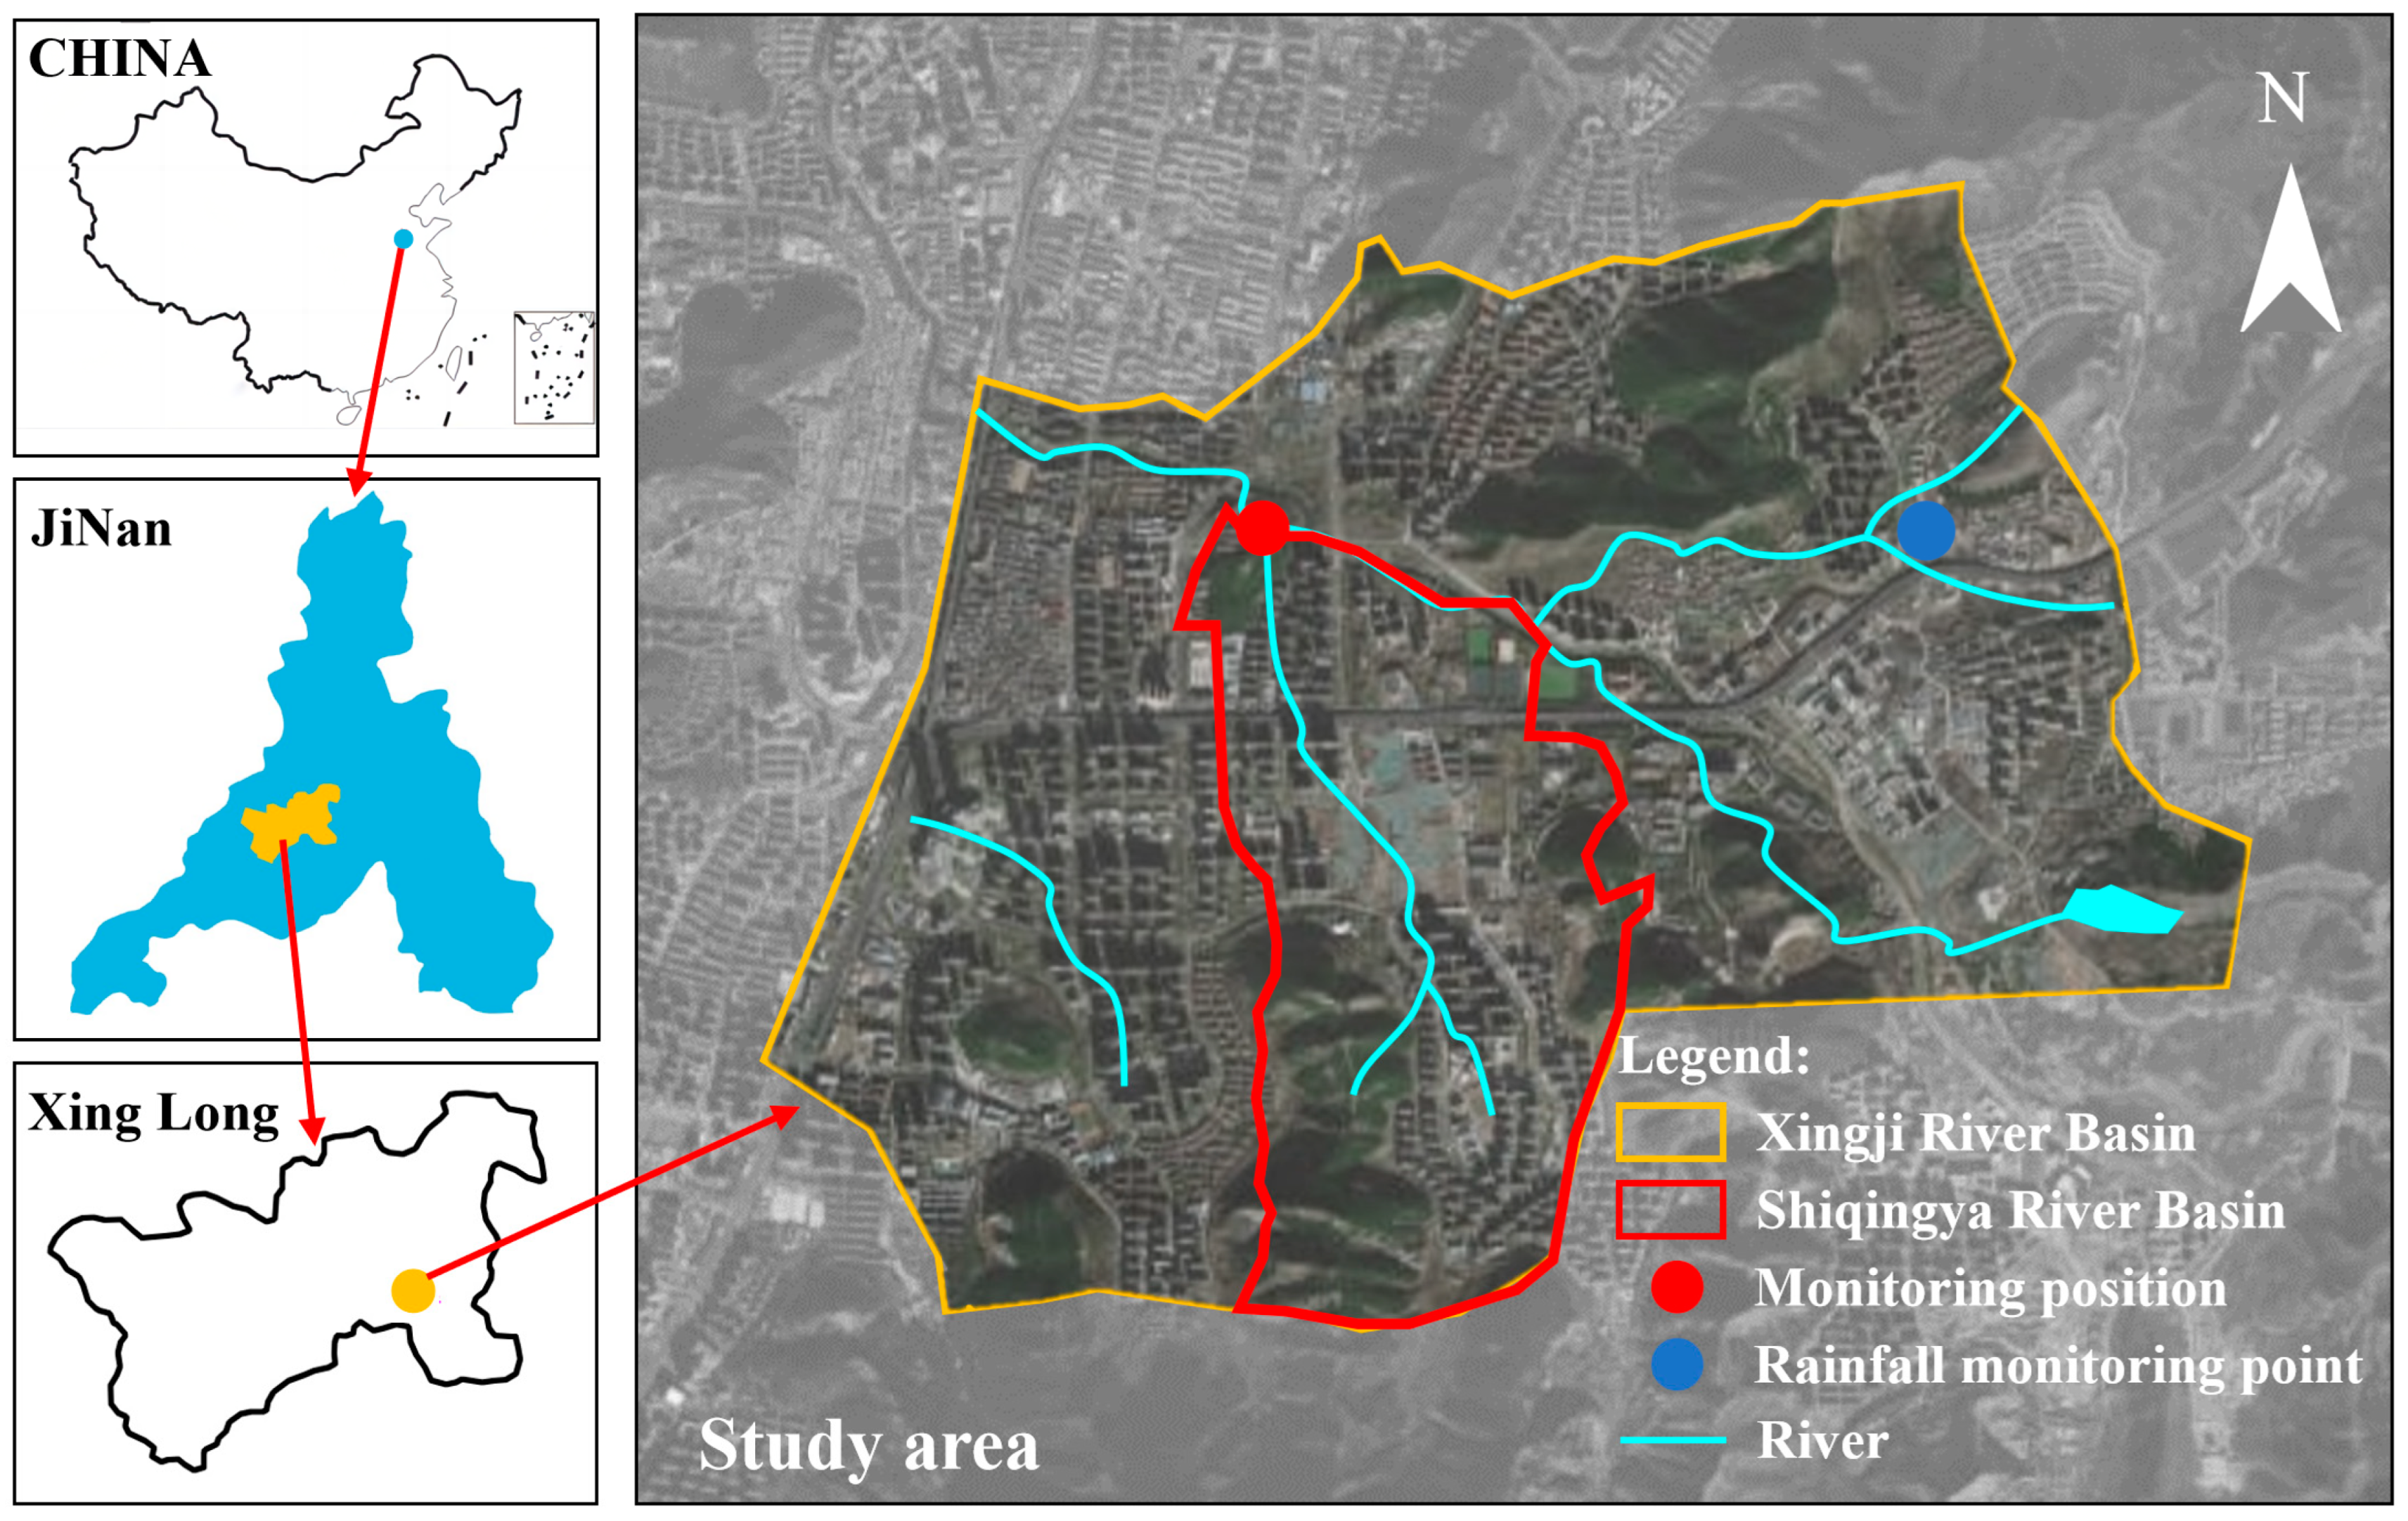
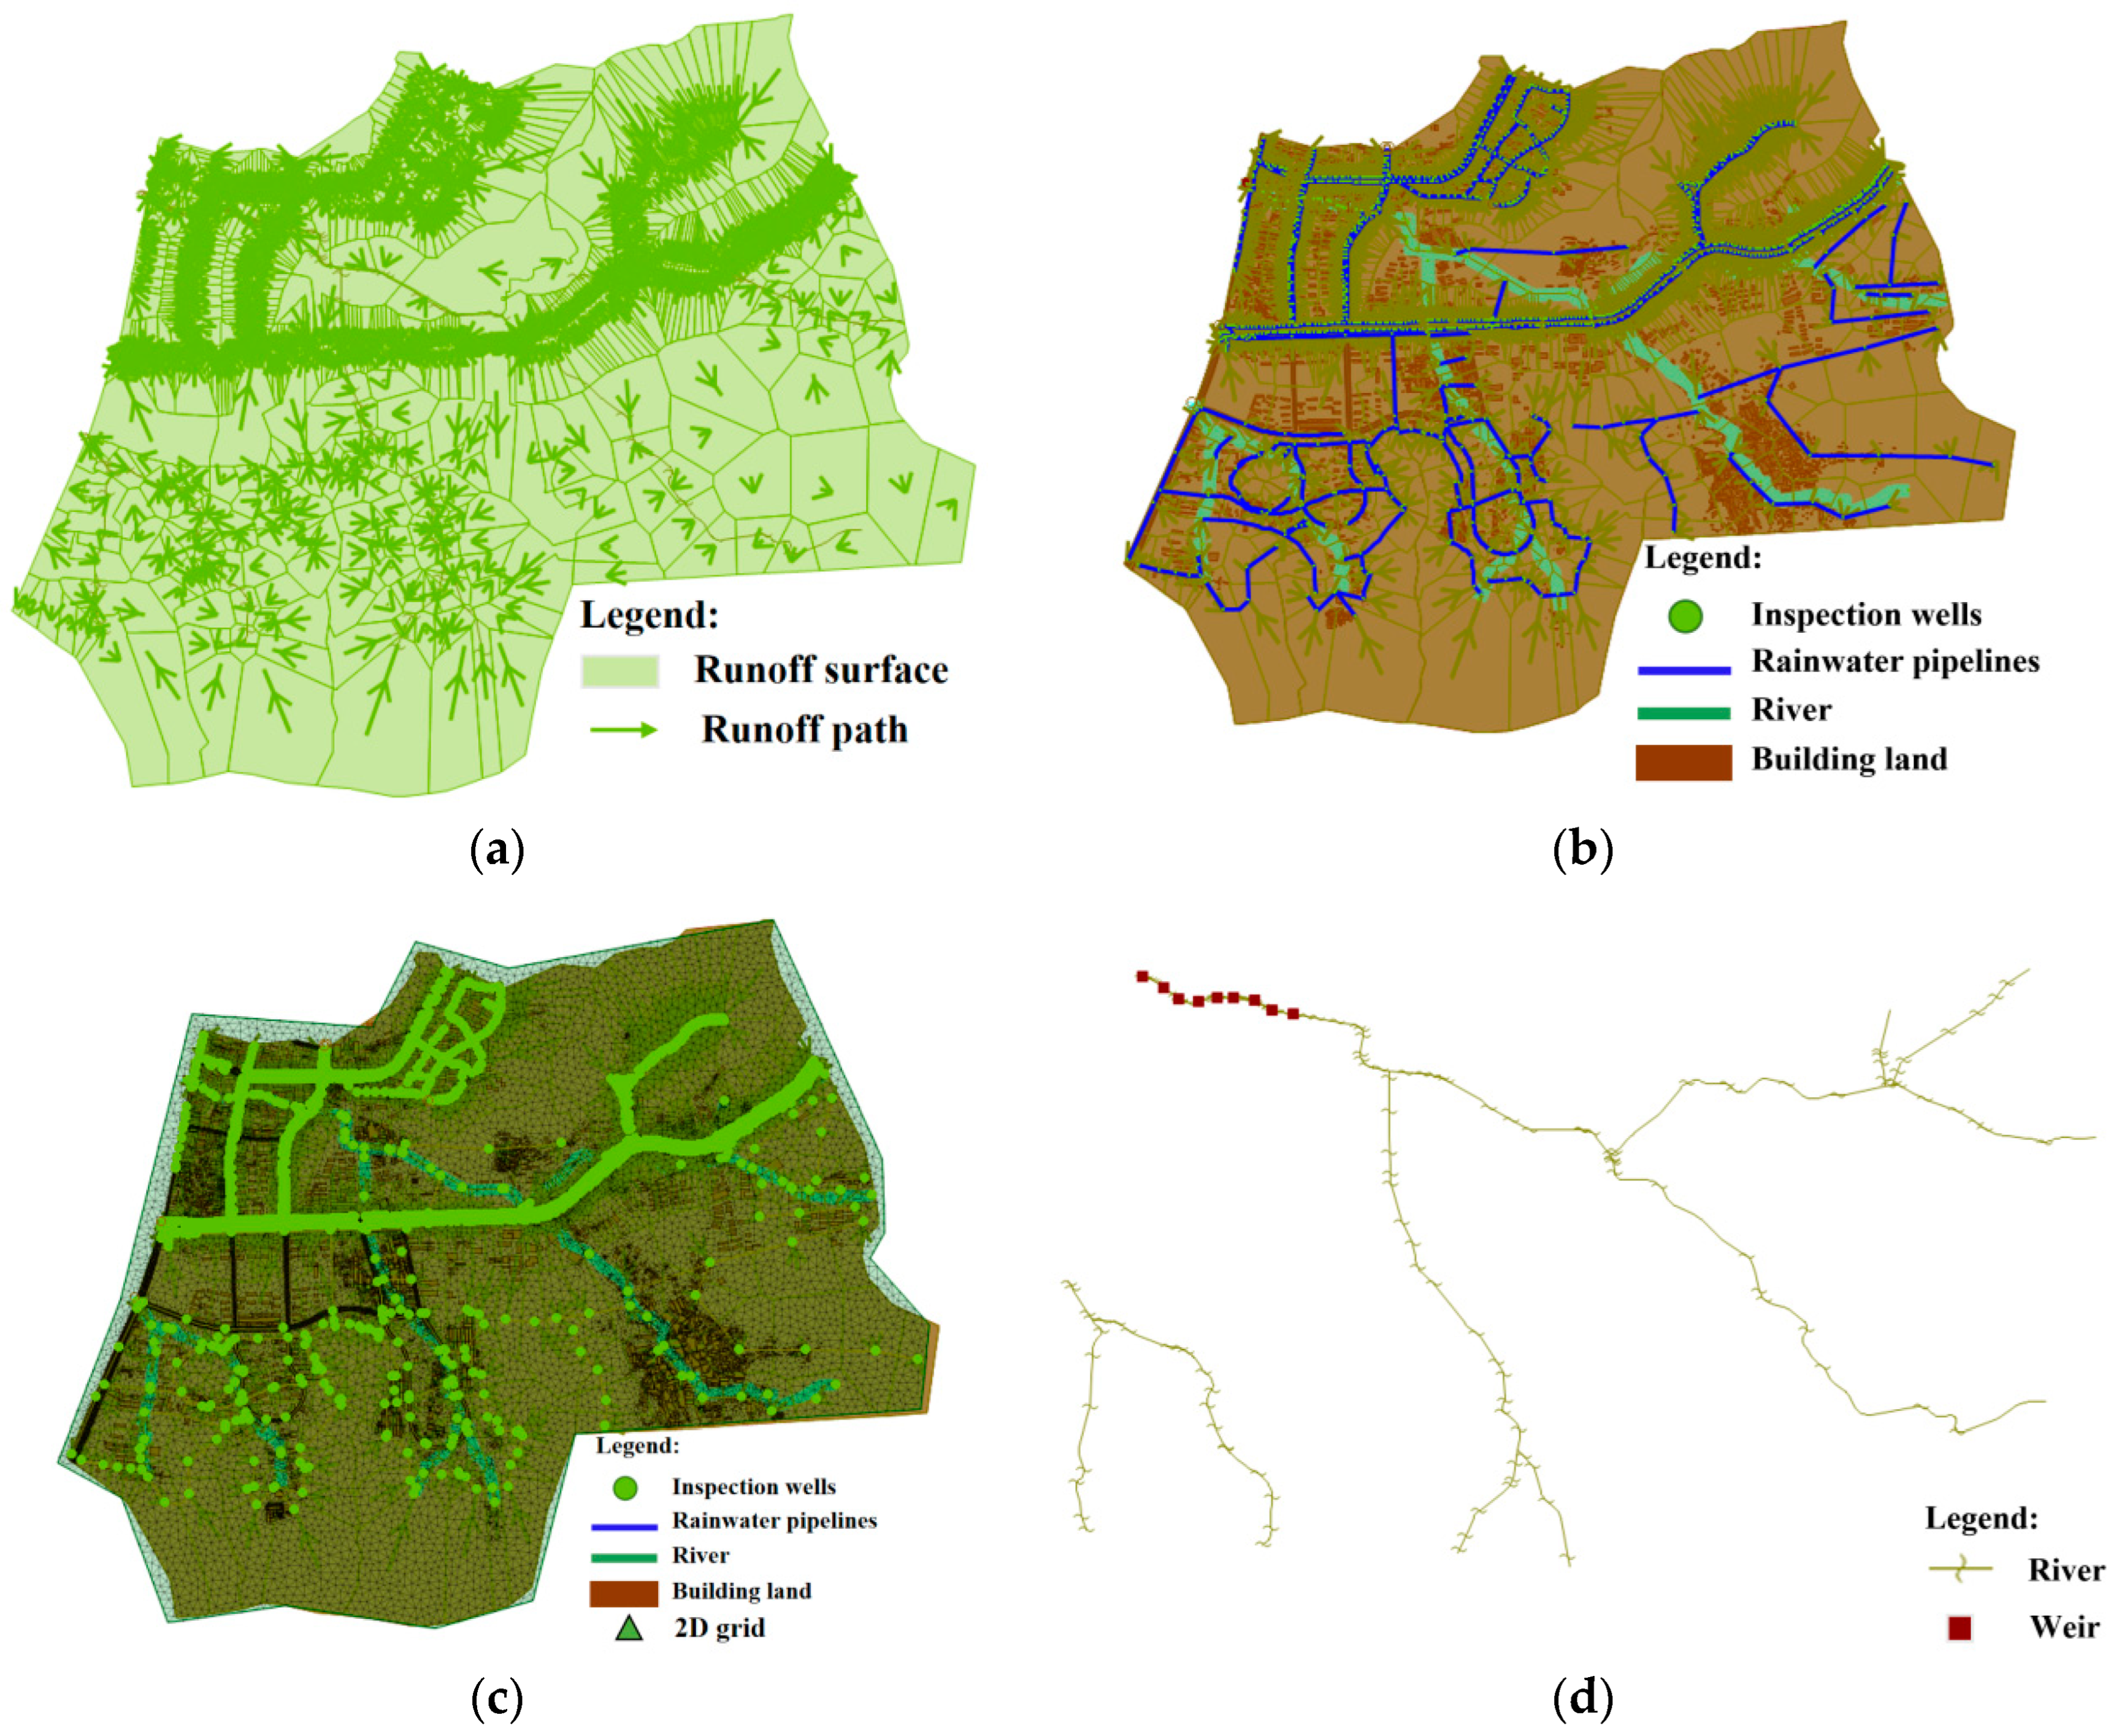
2.1. Study Area
2.2. Model Building
2.2.1. Multi Model Coupling
2.2.2. Design Scheme for the Enabling Rule of RWSTs
- (1)
- Enabling rule I: Initiate activation promptly upon the start of rainfall.
- (2)
- Enabling rule II: Rainfall intensity reaches threshold.
- (3)
- Enabling rule III: Cumulative rainfall reaches threshold.
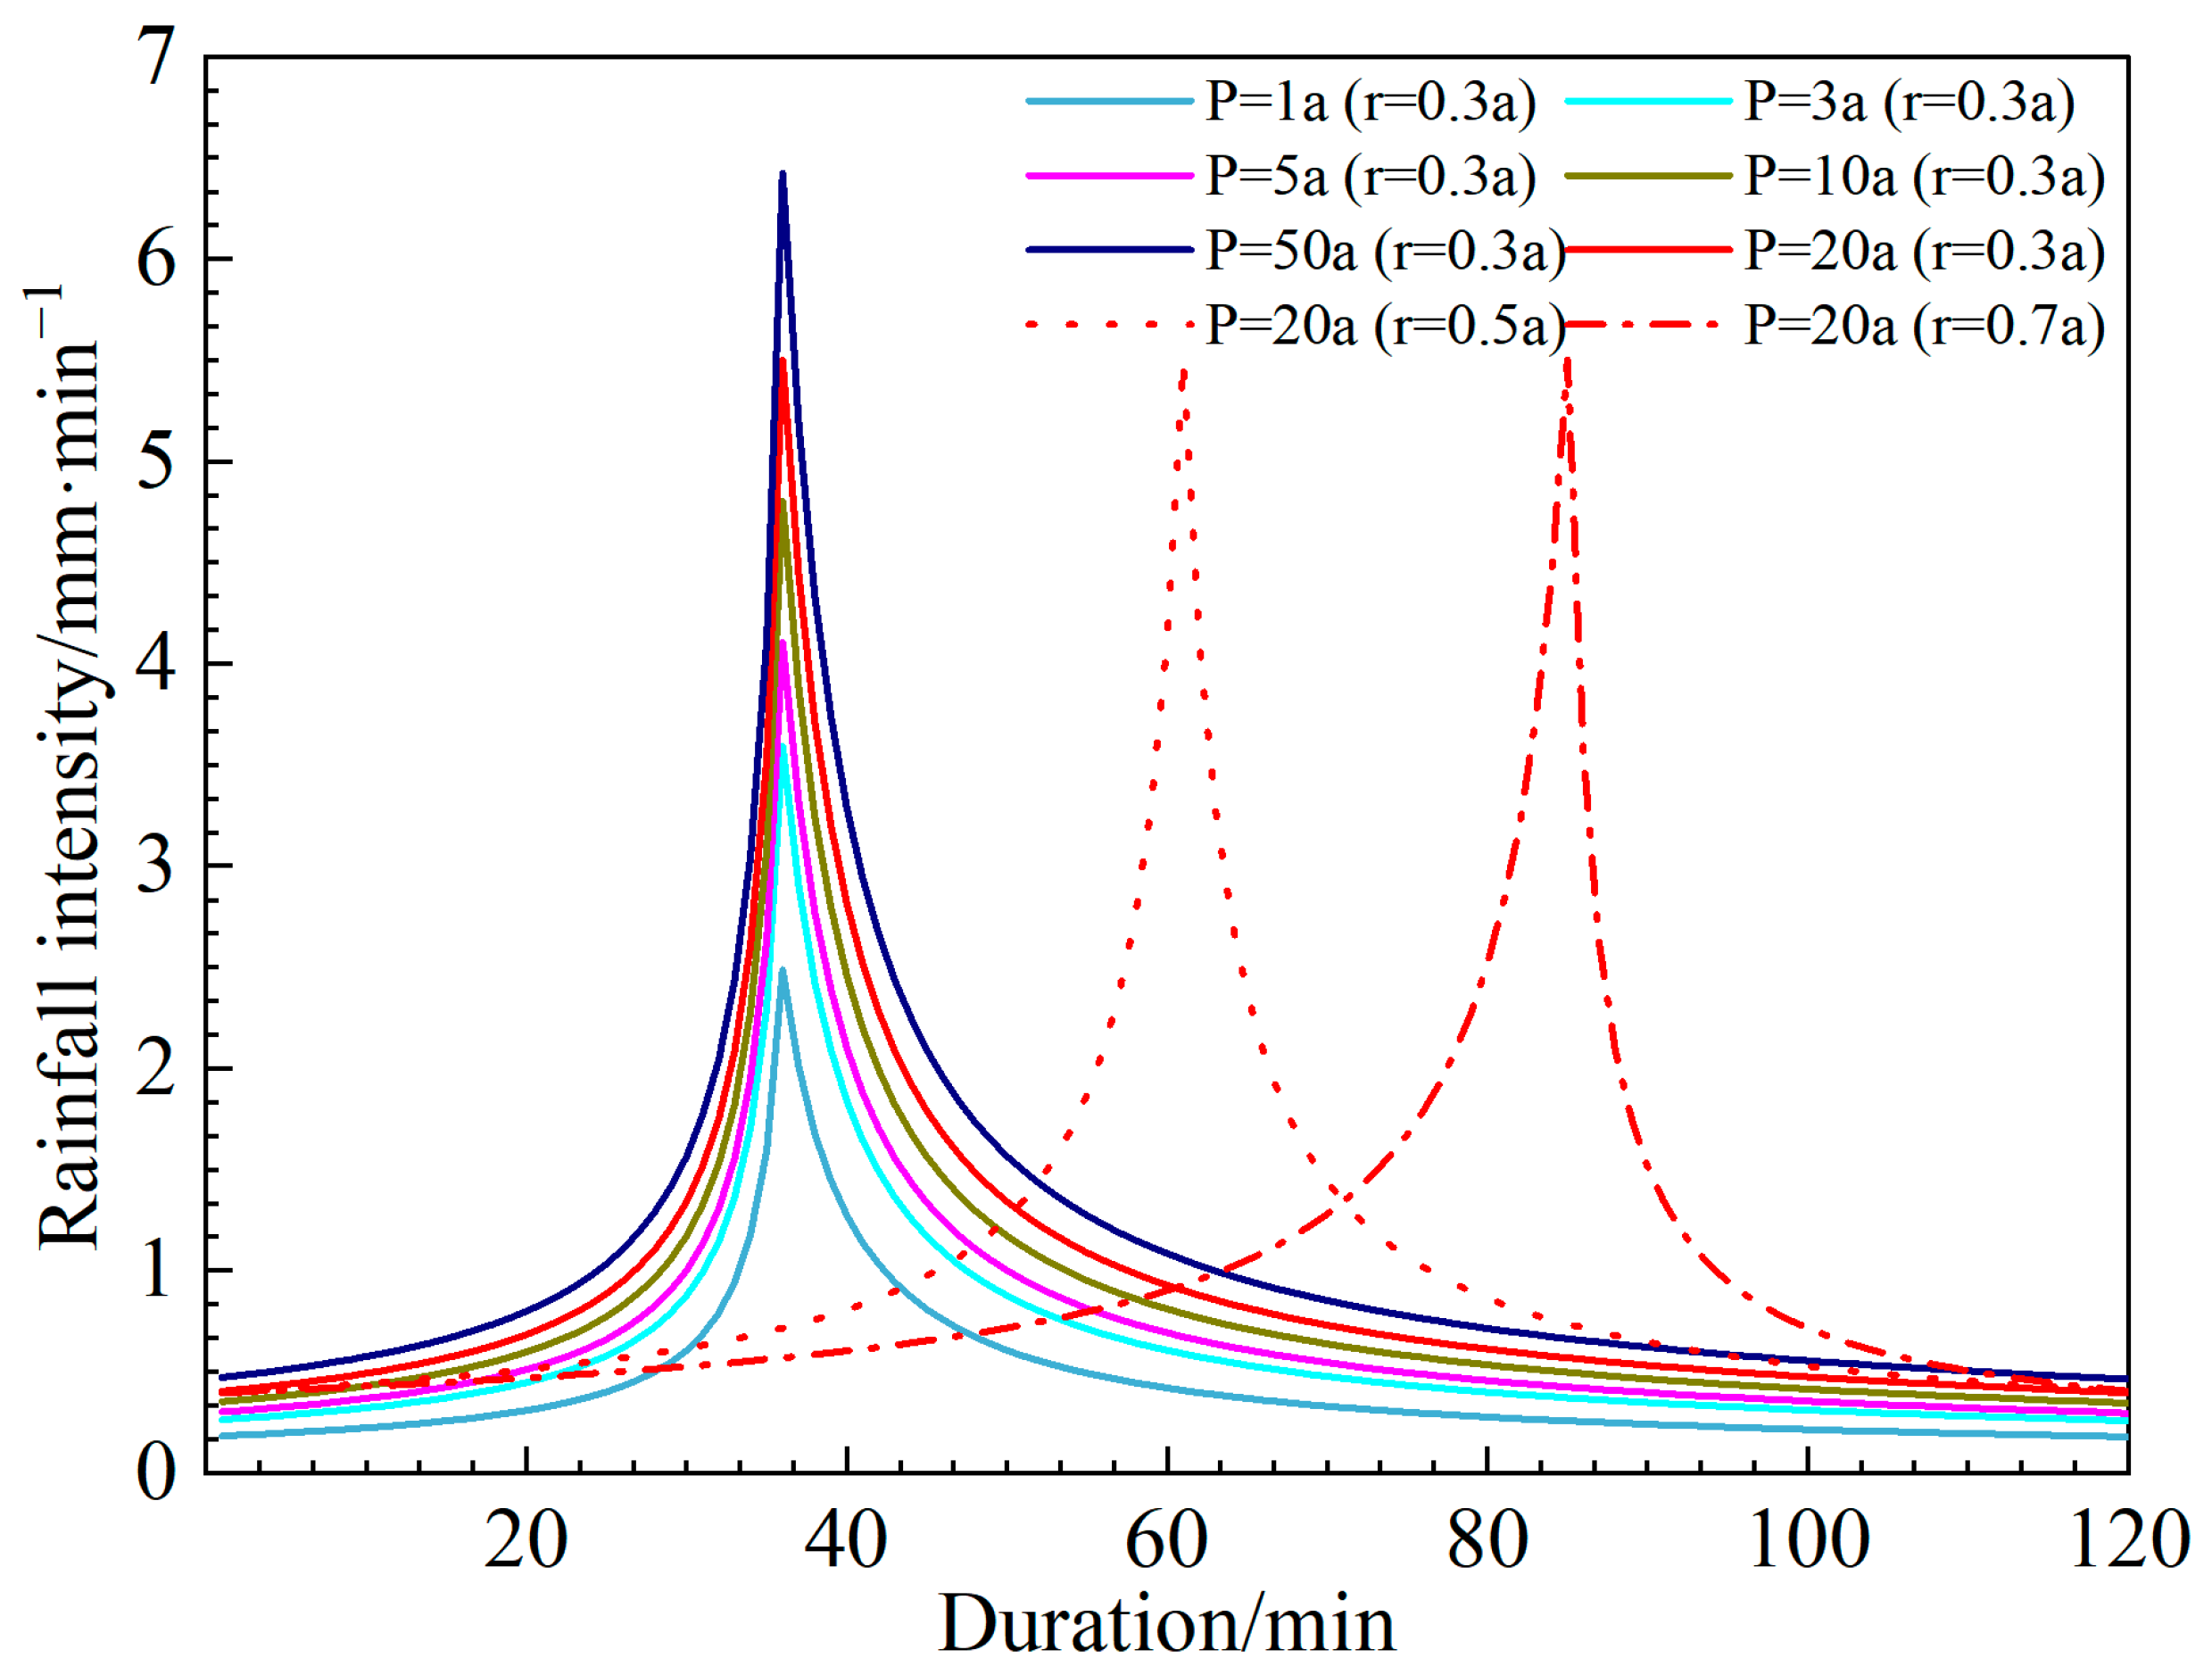
2.3. Rainfall Parameters
2.4. Calibration and Validation
3. Results and Discussion
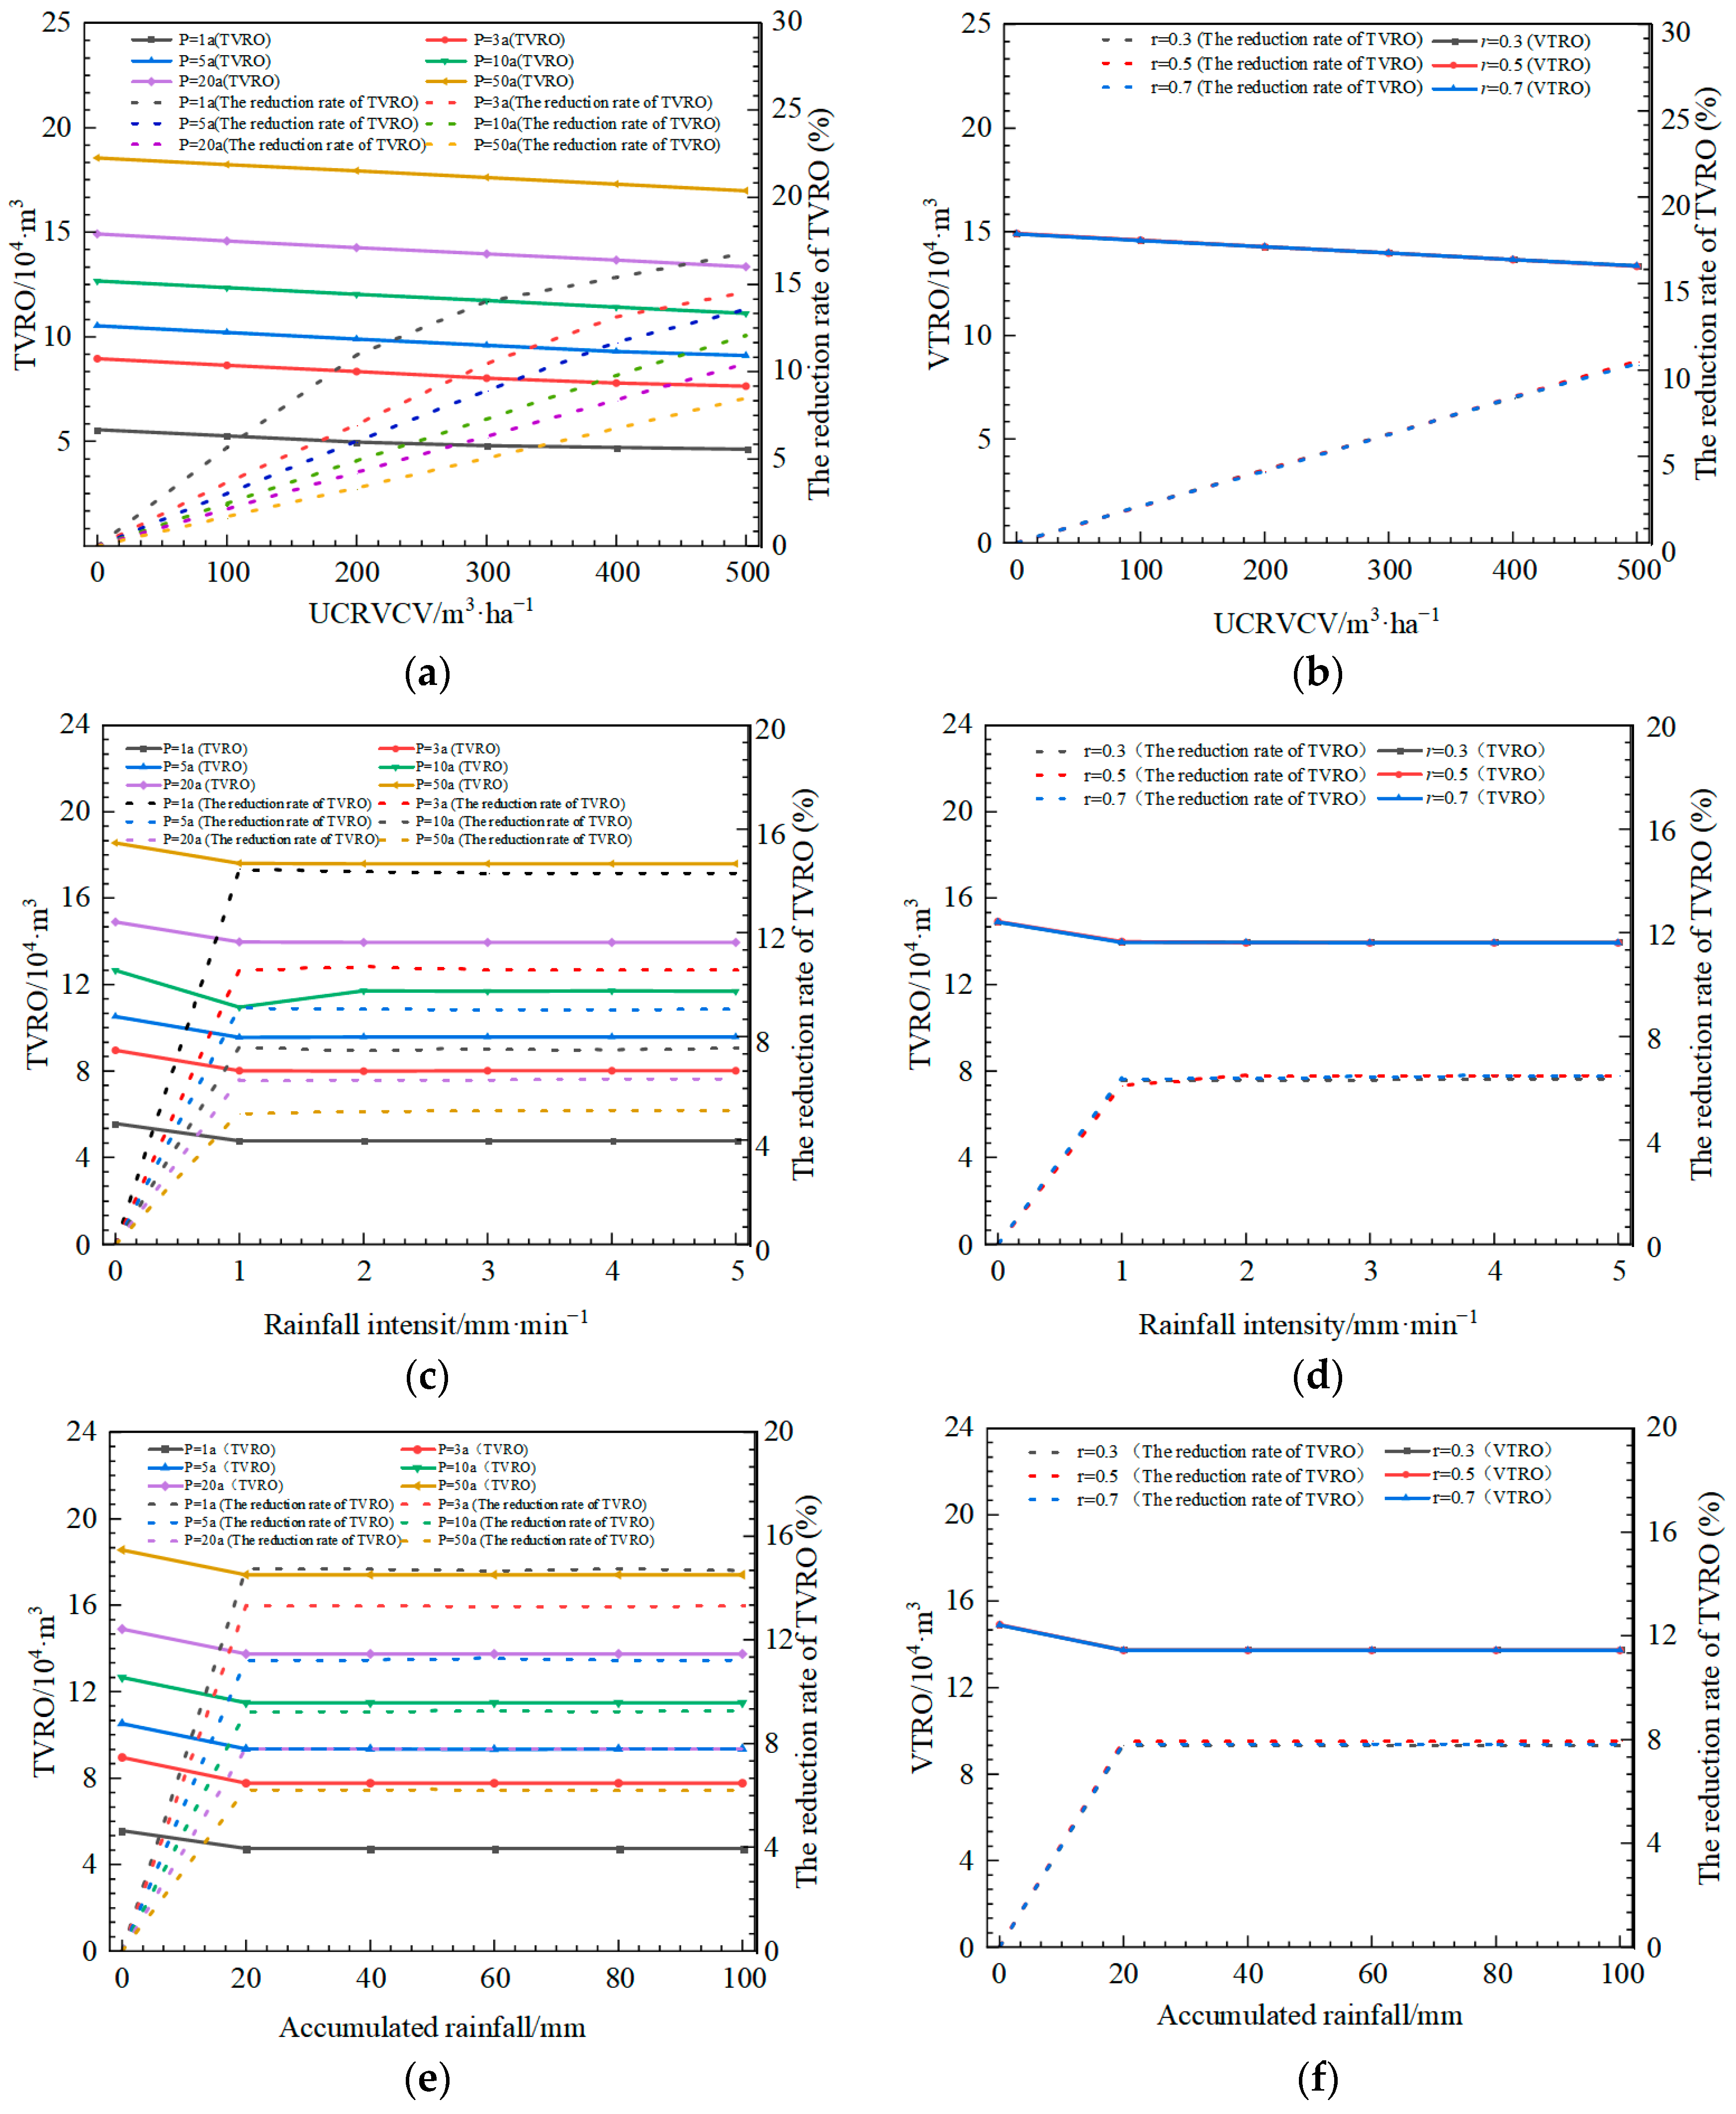
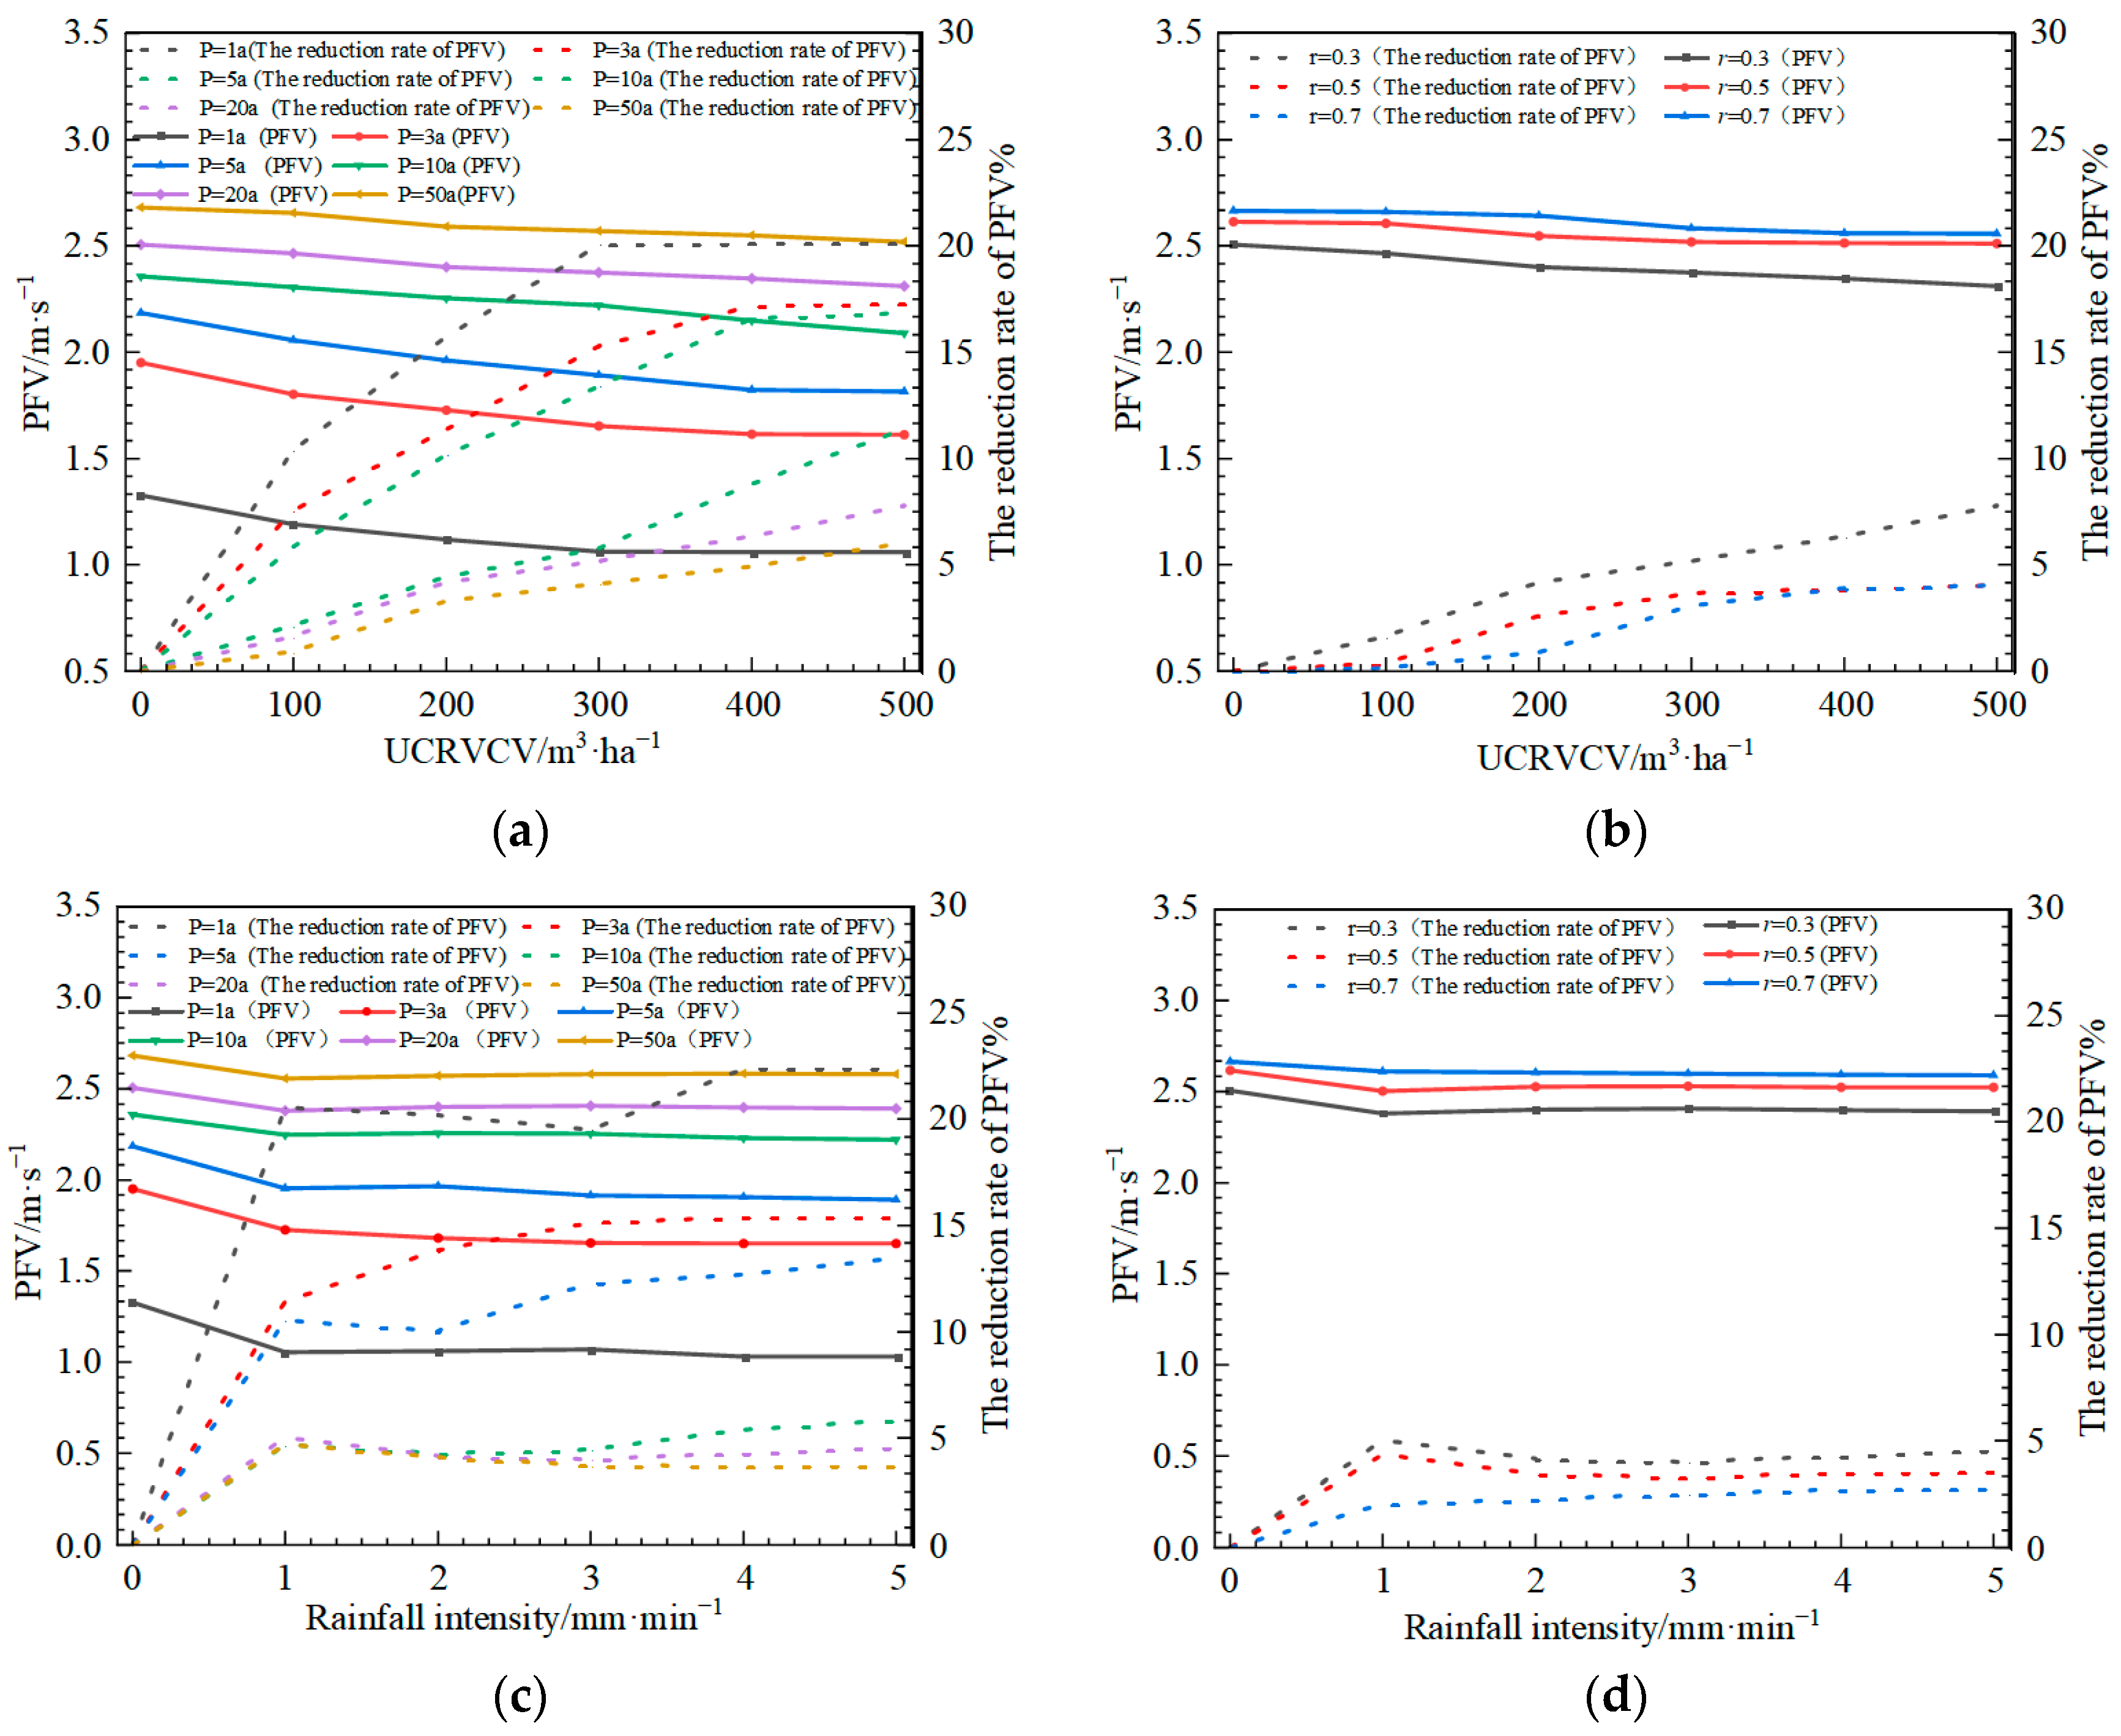
3.1. Analysis of Stormwater Runoff Reduction Effect in RWSTs under Different Enabling Rules Scenarios
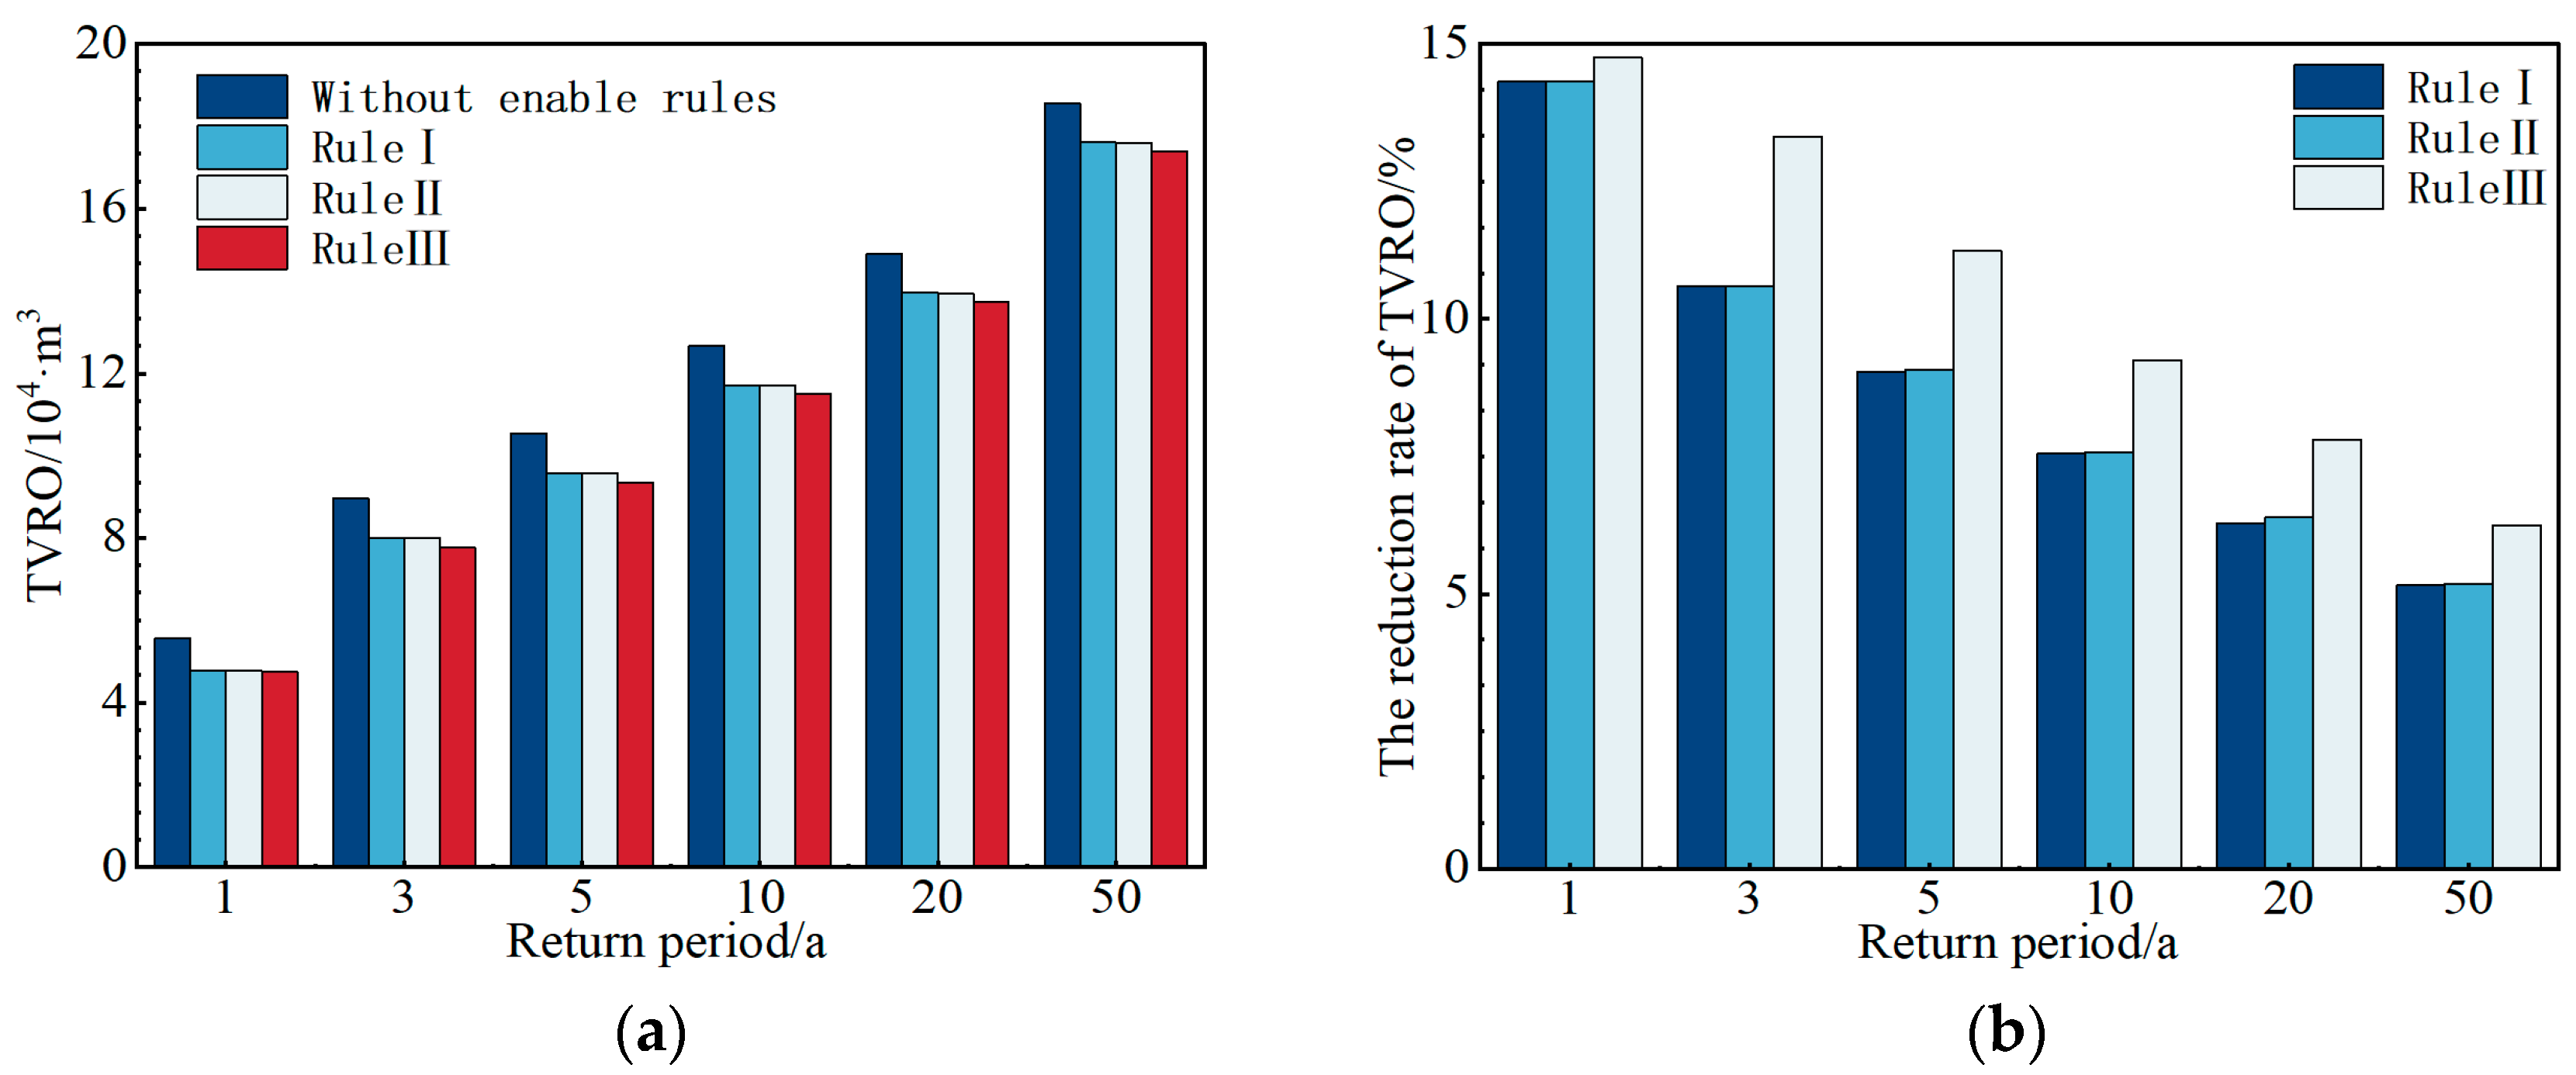
3.1.1. Analysis of the TVRO Control Effect
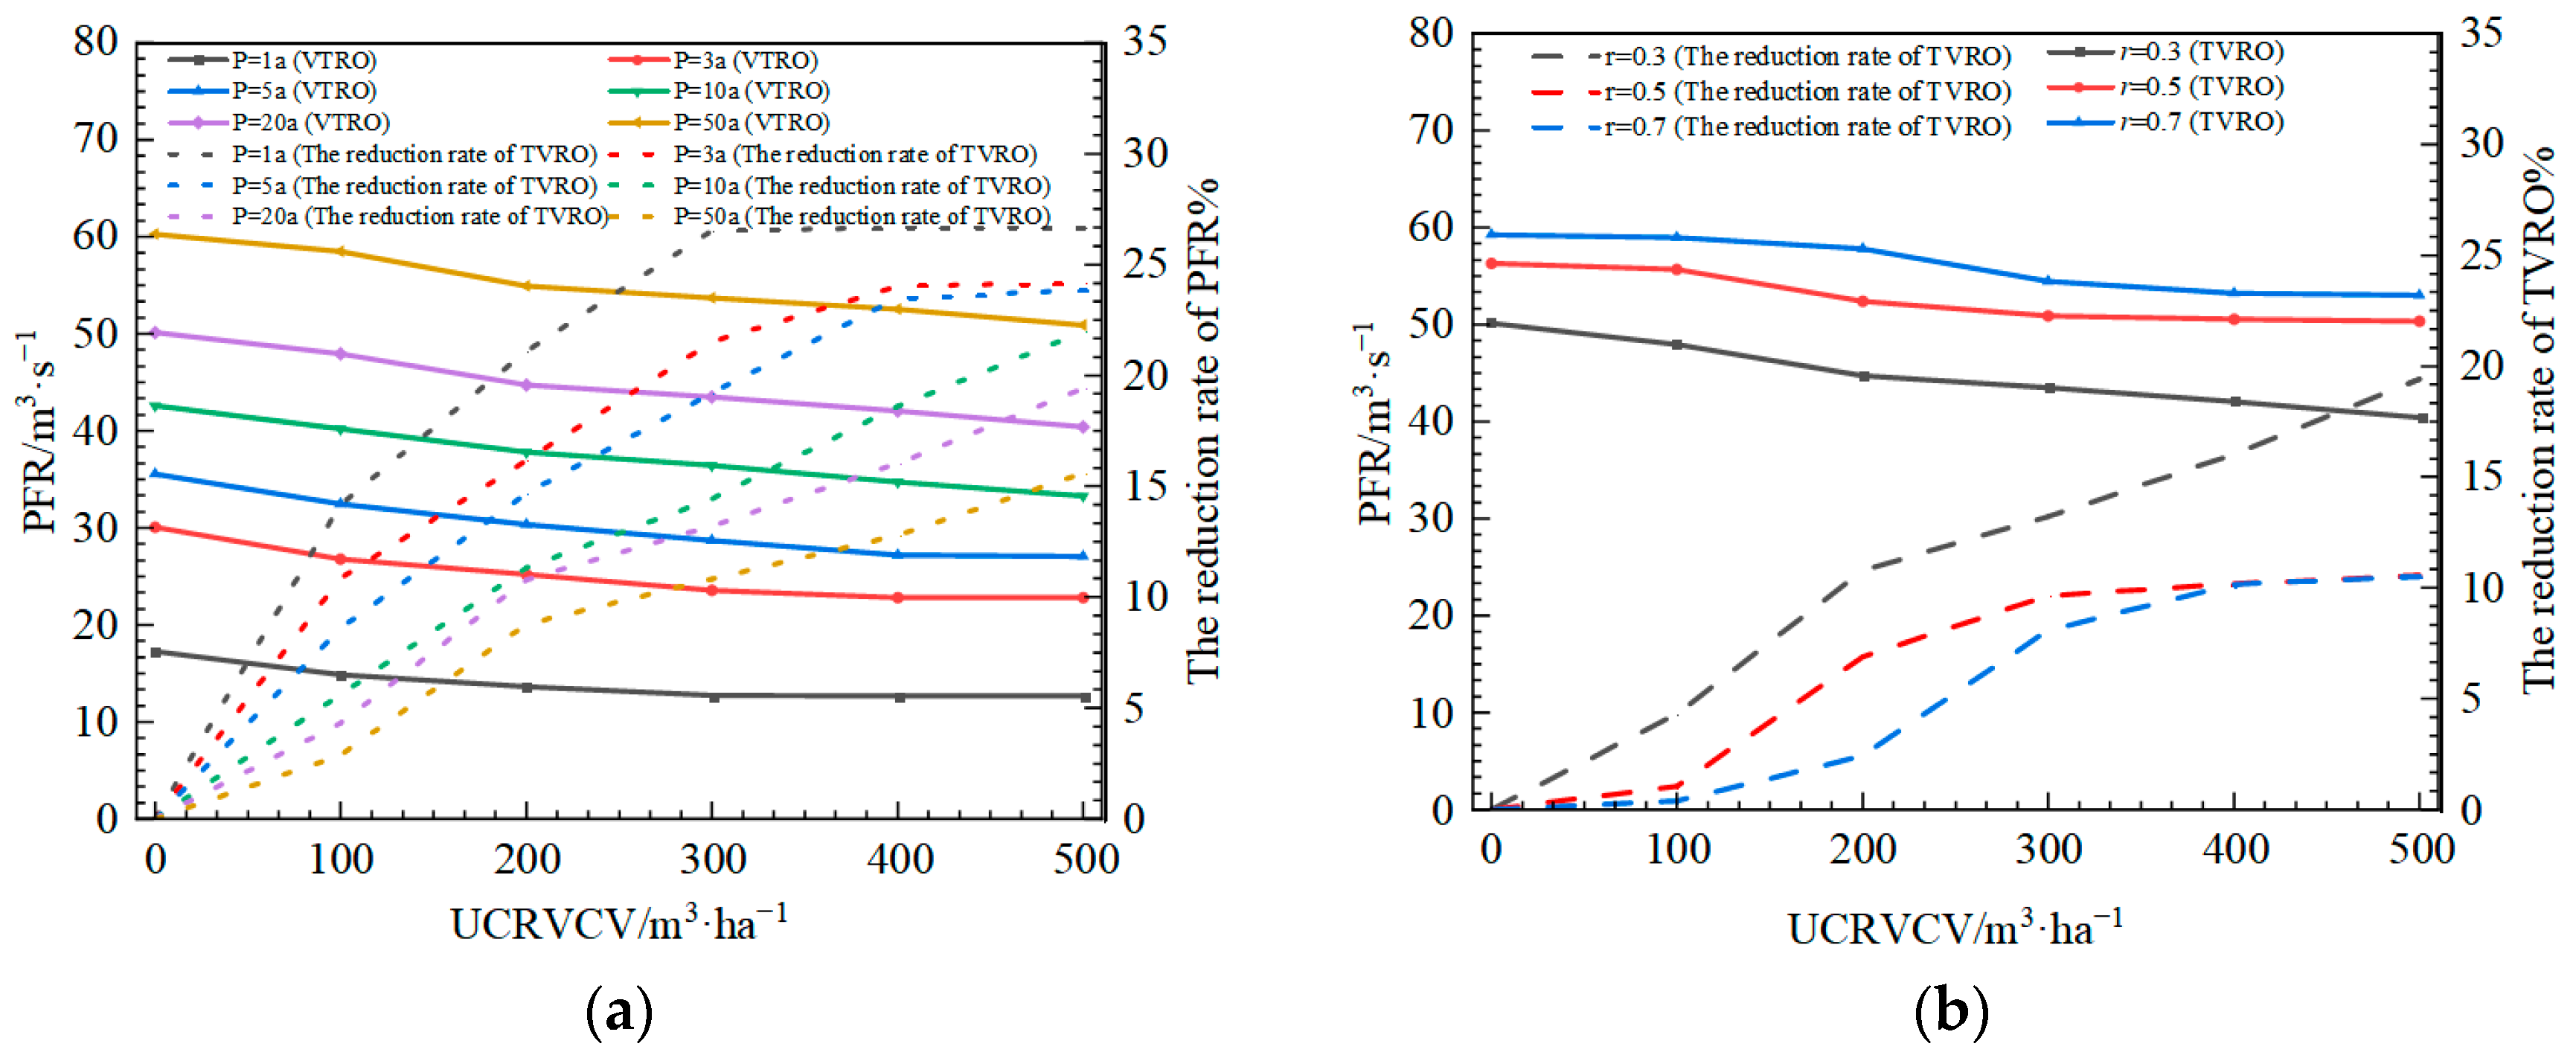
3.1.2. Analysis of the PFR Control Effect
3.1.3. Analysis of the PFV Control Effect
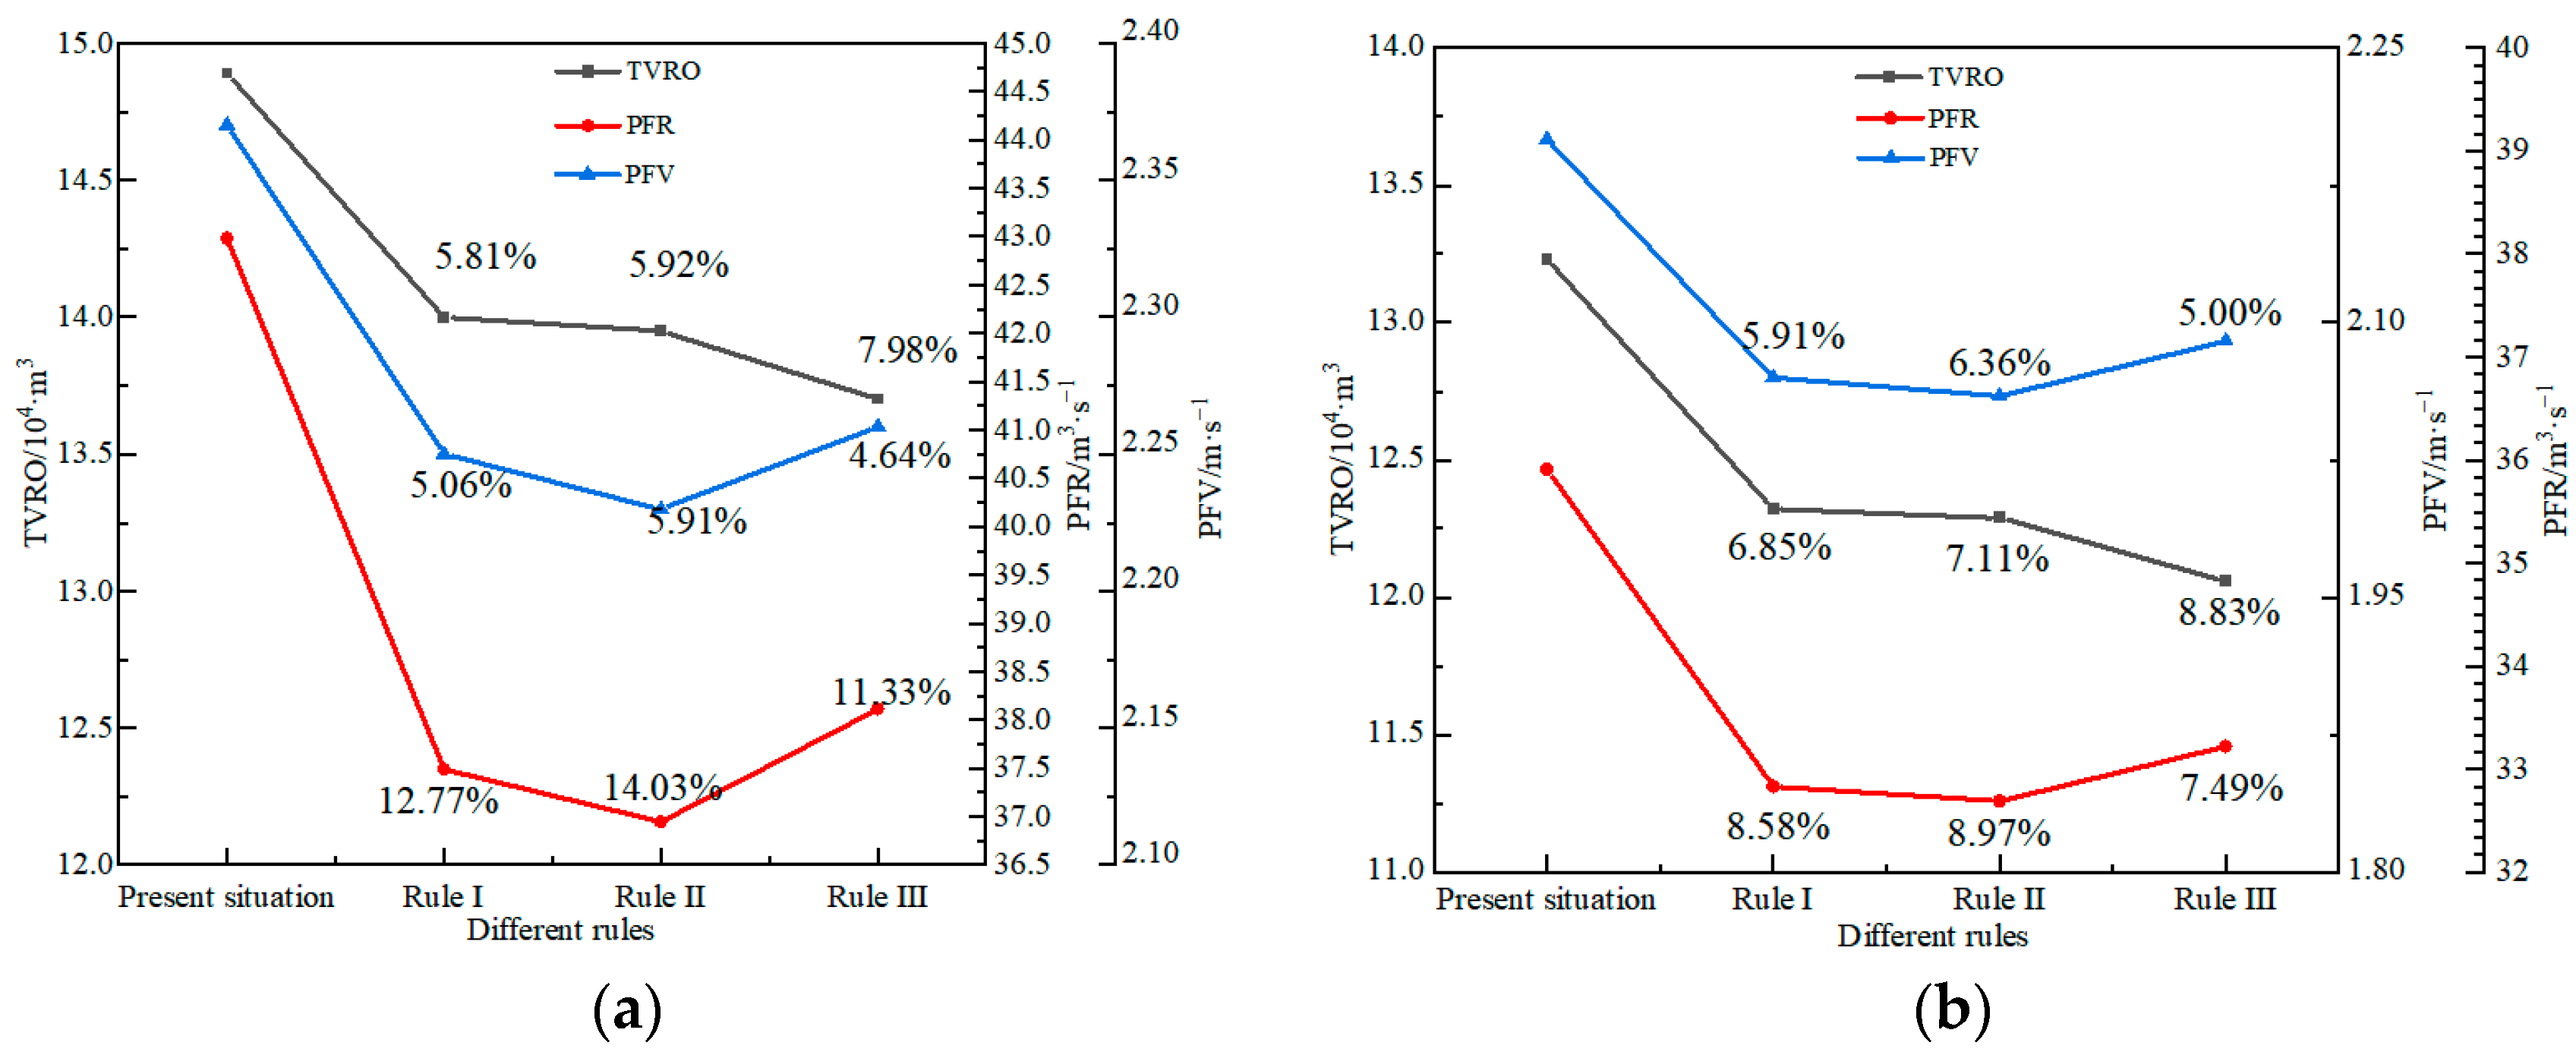
3.2. Optimization of Enabling Rule for Different RWSTs
4. Conclusions
Author Contributions
Funding
Data Availability Statement
Conflicts of Interest
References
- Booth, D.B.; Roy, A.H.; Smith, B.; Capps, K.A. Global perspectives on the urban stream syndrome. Freshw. Sci. 2016, 35, 412–420. [Google Scholar] [CrossRef]
- Wang, Q.; Ma, Z.; Yuan, X.; Wang, J.; Mu, Z.; Zuo, J.; Zhang, J.; Hong, J.; Wang, S. Is cement pavement more sustainable than permeable brick pavement? A case study for Jinan, China. J. Clean. Prod. 2019, 226, 306–315. [Google Scholar] [CrossRef]
- Hadidi, A.; Holzbecher, E.; Molenaar, R.E. Flood mapping in face of rapid urbanization: A case study of Wadi Majraf-Manumah, Muscat, Sultanate of Oman. Urban Water J. 2020, 17, 407–415. [Google Scholar] [CrossRef]
- Kam, P.M.; Aznar, G.; Schewe, J.; Milano, L.; Ginnetti, J.; Willner, S.; McCaughey, J.W.; Bresch, D.N. Global warming and population change both heighten future risk of human displacement due to river floods. Environ. Res. Lett. 2021, 16, 044026. [Google Scholar] [CrossRef]
- Breinl, K.; Lun, D.; Müller-Thomy, H.; Blöschl, G. Understanding the relationship between rainfall and flood probabilities through combined intensity-duration-frequency analysis. J. Hydrol. 2021, 602, 126759. [Google Scholar] [CrossRef]
- Trigg, M.A.; Birch, C.E.; Neal, J.C.; Bates, P.D.; Smith, A.; Sampson, C.C.; Yamazaki, D.; Hirabayashi, Y.; Pappenberger, F.; Dutra, E.; et al. The credibility challenge for global fluvial flood risk analysis. Environ. Res. Lett. 2016, 11, 094014. [Google Scholar] [CrossRef]
- Centre for Research on the Epidemiology of Disasters; UN Office for Disaster Risk Reduction. The Human Cost of Disasters: An Overview of the Last 20 Years (2000–2019); Centre for Research on the Epidemiology of Disasters: Brussels, Belgium; UN Office for Disaster Risk Reduction: Geneva, Switzerland, 2020. [Google Scholar]
- Willner, S.N.; Levermann, A.; Zhao, F.; Frieler, K. Adaptation required to preserve future high-end river flood risk at present levels. Sci. Adv. 2018, 4, eaao1914. [Google Scholar] [CrossRef] [PubMed]
- Hu, J.; Zhao, B.; Liu, X.; Cao, D.; Guo, X.; Xu, X.; Xu, T. Assessment of Drainage Capacity and Waterlogging Risk in Central Zone of Zhenjiang City. China Water Wastewater 2015, 31, 100–108. [Google Scholar]
- Ministry of Water Resources of the People’s Republic of China. China Flood and Drought Disaster Prevention Bulletin 2022; China Water & Power Press: Beijing, China, 2022; Volume 25.
- Cheng, T.; Huang, B.; Yang, Z.; Qiu, J.; Zhao, B.; Xu, Z. On the effects of flood reduction for green and grey sponge city measures and their synergistic relationship—Case study in Jinan sponge city pilot area. Urban Clim. 2022, 42, 101058. [Google Scholar] [CrossRef]
- Chen, T.; Lin, Z. Planning for climate change: Evaluating the changing patterns of flood vulnerability in a case study in New Taipei City, Taiwan. Stoch. Environ. Res. Risk Assess 2021, 35, 1161–1174. [Google Scholar] [CrossRef]
- Ali, R.; Kuriqi, A.; Kisi, O. Human–Environment Natural Disasters Interconnection in China: A Review. Climate 2020, 8, 48. [Google Scholar] [CrossRef]
- Xia, J.; Zhang, Y.; Xiong, L.; He, S.; Wang, L.; Yu, Z. Opportunities and challenges of the Sponge City construction related to urban water issues in China. Sci. China Earth Sci. 2017, 60, 652–658. [Google Scholar] [CrossRef]
- Li, Q.; Wang, F.; Yu, Y.; Huang, Z.; Li, M.; Guan, Y. Comprehensive performance evaluation of LID practices for the sponge city construction: A case study in Guangxi, China. J. Environ. Manag. 2019, 231, 10–20. [Google Scholar] [CrossRef]
- Leng, L.; Mao, X.; Jia, H.; Xu, T.; Chen, A.S.; Yin, D.; Fu, G. Performance assessment of coupled green-grey-blue systems for Sponge City construction. Sci. Total Environ. 2020, 728, 138608. [Google Scholar] [CrossRef]
- Rizzo, A. Hybrid Approach for Excess Stormwater Management: Combining Decentralized and Centralized Strategies for the Enhancement of Urban Flooding Resilience. Water 2021, 13, 3635. [Google Scholar]
- Zhang, J.; Gao, X.; Zhang, P.; Wang, Y.; Huang, S.; Lin, G. Field tests on Fiber-Reinforced Plastic (FRP) stormwater storage tank under road pavement for “Spong City” development. Case Stud. Constr. Mater. 2023, 18, e02097. [Google Scholar] [CrossRef]
- Dąbrowski, W.; Nowak, M. Potential of storm water storage tank outflow construction in the prevention of sewerage overload. Appl. Water Sci. 2022, 12, 205. [Google Scholar] [CrossRef]
- Wang, M.; Sun, Y.; Sweetapple, C. Optimization of storage tank locations in an urban stormwater drainage system using a two-stage approach. J. Environ. Manag. 2017, 204, 31–38. [Google Scholar] [CrossRef] [PubMed]
- Wang, M.; Li, M.; Sweetapple, C. A new framework for distributed storage tanks placement based on a resilience characteristic metric and reduced modelling. J. Environ. Manag. 2023, 342, 118098. [Google Scholar] [CrossRef] [PubMed]
- Wang, S.; Wang, J.; Xue, C.; Qiu, R.; Sun, S.; Yang, Z.; Qiao, Y. Assessing the effectiveness of a residential-scale detention tank operated in a multi-objective approach using SWMM. Water Sci. Technol. 2023, 89, 54–70. [Google Scholar] [CrossRef] [PubMed]
- Liang, R.; Di Matteo, M.; Maier, H.R.; Thyer, M.A. Real-Time, Smart Rainwater Storage Systems: Potential Solution to Mitigate Urban Flooding. Water 2019, 11, 2428. [Google Scholar] [CrossRef]
- Matteo, M.D.; Liang, R.; Maier, H.R.; Thyer, M.A.; Simpson, A.R.; Dandy, G.C.; Ernst, B. Controlling rainwater storage as a system: An opportunity to reduce urban flood peaks for rare, long duration storms. Environ. Model. Softw. 2019, 111, 34–41. [Google Scholar] [CrossRef]
- Jinan Municipal Engineering Design & Research Institute (Group) Co., Ltd.; Jinan Layout Design Research Institute. The Comprehensive Planning of Urban Drainage (Rainwater) and Waterlogging Prevention in Jinan. 2019; Unpublished work. [Google Scholar]
- Al-Safi, H.I.J.; Sarukkalige, P.R. The application of conceptual modelling to assess the impacts of future climate change on the hydrological response of the Harvey River catchment. J. Hydro-Environ. Res. 2020, 28, 22–33. [Google Scholar] [CrossRef]
- Schubert, J.E.; Burns, M.J.; Fletcher, T.D.; Sanders, B.F. A framework for the case-specific assessment of Green Infrastructure in mitigating urban flood hazards. Adv. Water Resour. 2017, 108, 55–68. [Google Scholar] [CrossRef]
- Snir, O.; Friedler, E.; Ostfeld, A. Optimizing the Control of Decentralized Rainwater Harvesting Systems for Reducing Urban Drainage Flows. Water 2022, 14, 571. [Google Scholar] [CrossRef]
- Chen, W.; Huang, G.; Zhang, H.; Wang, W. Urban inundation response to rainstorm patterns with a coupled hydrodynamic model: A case study in Haidian Island, China. J. Hydrol. 2018, 564, 1022–1035. [Google Scholar] [CrossRef]
- Xu, W.D.; Fletcher, T.D.; Duncan, H.P.; Bergmann, D.J.; Breman, J.; Burns, M.J. Improving the Multi-Objective Performance of Rainwater Harvesting Systems Using Real-Time Control Technology. Water 2018, 10, 147. [Google Scholar] [CrossRef]


| Return Period/a | Rainfall Depth/mm | Return Period/a | Rainfall Depth/mm |
|---|---|---|---|
| 1 | 51.7 | 10 | 99.8 |
| 3 | 74.7 | 20 | 114.3 |
| 5 | 85.3 | 50 | 133.4 |
| Type | Parameter | Rating Results |
|---|---|---|
| Production and convergence model | SWMM | SWMM |
| Runoff coefficient | Roof runoff coefficient | 0.75 |
| Road runoff coefficient | 0.80 | |
| Confluence parameters (Manning coefficient) | Roof convergence parameters | 0.015 |
| Road confluence parameters | 0.015 | |
| Road confluence parameters green space | 0.03 | |
| Initial losses/m | Initial loss of roof | 0.01 |
| Initial road losses | 0.01 | |
| Initial loss of green space | 0.015 | |
| Horton permeability coefficient | Initial infiltration rate/mm·h−1 | 100 |
| steady infiltration rate/mm·h−1 | 15 | |
| Attenuation rate/1·h−1 | 2 |
Disclaimer/Publisher’s Note: The statements, opinions and data contained in all publications are solely those of the individual author(s) and contributor(s) and not of MDPI and/or the editor(s). MDPI and/or the editor(s) disclaim responsibility for any injury to people or property resulting from any ideas, methods, instructions or products referred to in the content. |
© 2024 by the authors. Licensee MDPI, Basel, Switzerland. This article is an open access article distributed under the terms and conditions of the Creative Commons Attribution (CC BY) license (https://creativecommons.org/licenses/by/4.0/).
Share and Cite
Gong, Y.; Meng, G.; Tian, K.; Li, Z. Evaluating the Effectiveness of Rainwater Storage Tanks Based on Different Enabling Rules. Water 2024, 16, 787. https://doi.org/10.3390/w16050787
Gong Y, Meng G, Tian K, Li Z. Evaluating the Effectiveness of Rainwater Storage Tanks Based on Different Enabling Rules. Water. 2024; 16(5):787. https://doi.org/10.3390/w16050787
Chicago/Turabian StyleGong, Yongwei, Ge Meng, Kun Tian, and Zhuolun Li. 2024. "Evaluating the Effectiveness of Rainwater Storage Tanks Based on Different Enabling Rules" Water 16, no. 5: 787. https://doi.org/10.3390/w16050787
APA StyleGong, Y., Meng, G., Tian, K., & Li, Z. (2024). Evaluating the Effectiveness of Rainwater Storage Tanks Based on Different Enabling Rules. Water, 16(5), 787. https://doi.org/10.3390/w16050787