Article

Response of Land Surface Temperature to Heatwave-Induced Bio-Geophysical Changes in Tropical Forests on Hainan Island from 2010 to 2022

1
School of Ecology and Environment, Hainan University, Haikou 570228, China
2
Hainan Danzhou Tropical Agro-Ecosystem National Observation and Research Station, Danzhou 571737, China
3
Sanya Tropical Ecosystem Carbon Source and Sink Field Scientific Observation and Research Station, Sanya 572022, China
4
Rubber Research Institute, Chinese Academy of Tropical Agricultural Sciences (CATAS), Haikou 571101, China
5
Haikou Center of Marine Geological Survey, China Geological Survey, Haikou 571127, China
6
Key Laboratory of Natural Resource Coupling Process and Effects, Beijing 100055, China
*
Authors to whom correspondence should be addressed.
Water 2024, 16(5), 752; https://doi.org/10.3390/w16050752
Submission received: 25 January 2024 / Revised: 25 February 2024 / Accepted: 27 February 2024 / Published: 1 March 2024
(This article belongs to the Special Issue Assessment of Extreme Meteorological and Hydrological Events)

Abstract

:
Land surface temperature plays an important role in the water cycle and surface energy balance. Using data collected by a vorticity covariance tower from 2010 to 2022, the relative threshold method and TRM method were employed to study the land–atmosphere exchange of water and the heat flux of rubber forest ecosystems under heatwave and non-heatwave conditions. The results show that the latent heat flux, sensible heat flux, and incoming and outgoing radiation increase from non-heatwave to heatwave conditions. In addition, the multi-year average LST was 6.7 °C higher under HW conditions than under non-HW conditions at the 99% confidence level. Further attribution analysis demonstrates that heatwave-induced land surface temperature change is mainly governed by atmospheric factors rather than by land surface factors. Specifically, radiative forcing shows the largest positive contribution, which is partly offset by the negative contributions of air temperature and relative humidity. In particular, the contributions of radiative forcing, air temperature, relative humidity, and atmospheric pressure to LST were 14.70 K, −4.76 K, −5.86 K, and −0.04 K, respectively. Moreover, surface resistance contributed to LST by 2.42 K, aerodynamic resistance by −0.23 K, and soil heat flux by −0.91 K.

1. Introduction

In terrestrial climatology, land surface temperature (LST) is defined as the thermal state of the Earth’s surface [1]. This thermodynamic variable arises from the interplay between solar irradiance absorption and albedo-induced reflection at the lithospheric interface. LST is not an isolated metric but a critical determinant in the modulation of regional and global bio-geophysical processes; it underpins the empirical quantification of water transfer and energy fluxes between the surface and boundary layers, necessitating its precise measurement and modeling [2]. LST’s wide range of applications in scientific endeavors includes predicting forest fires [3] and monitoring vegetation health [4]. Furthermore, the incorporation of LST data into global circulation models and regional climate simulations is indispensable for accurate climate forecasting [5,6]. A recent report from the IPCC of the United Nations underscores a sustained increase in LST across a majority of land-based biomes, indicating an alarming trend that is likely to perpetuate over the ensuing seven decades (roughly from 2021 to 2091) [7]. This can be seen in previous studies, such as the overall increase in the LST in China, which has led to intense and extensive warming [8], or the significant increase in the LST in the Spanish Peninsula between 1982 and 2014 [9]. Consequently, temporal analysis of LST emerges as a paramount focus in climatological research essential to the advancement of predictive models and to devising informed climate resilience strategies.
Heatwave events (HWs), characterized by prolonged periods of temperatures surpassing climatological norms [10,11], represent a critical facet of current climatic shifts. Moreover, increasing global warming has led to significant changes in the frequency and intensity of extreme events such as heatwaves, floods, and droughts [12,13]. According to the Sixth Assessment Report (AR6) of the Intergovernmental Panel on Climate Change (IPCC), globally, there is a significant trend toward an increase in the intensity and duration of heatwaves as well as in the number of heatwave days (frequency) [14]. This finding is consistent with the fact that previous studies have observed an increase in the frequency and intensity of HW events in regions such as Africa [15], South America [16], India [17], and China [18]. This trend is confirmed by the latest CMIP6 climate projections, which predict a worsening of these conditions under the current global warming scenarios [19,20,21]. In addition, rapid urbanization in developing nations is exacerbating urban warming due to the urban heat island effect, which in turn intensifies the occurrence of HWs [22,23,24]. With the acceleration in urbanization and the increase in extreme weather events due to global climate change, high-temperature heatwaves have been found to have significant impacts on natural ecosystems, agricultural production, economic development, and human health [25]. Such events pose significant threats to plant growth and survival [26], underscoring the urgency of investigating heatwave patterns and the related land surface temperature shifts in ecosystems such as rubber forests during both heatwave and non-heatwave periods. In recent years, extreme heat events have occurred frequently, especially concentrated in temperate regions, such as the 2019 European heatwave, the 2020 Australian heatwave, and the 2021 heatwave in western North America. Researchers have generally focused on high-temperature heatwave events in temperate regions, investigating their causes, durations, and impacts on the environment and society [27]. Meanwhile, relatively little research has been conducted on high-temperature heatwave events in the tropics, where high temperatures and significant rainy seasons are common year-round. This unbalanced research attention may lead to a lack of comprehensive understanding of high-temperature extremes on a global scale, and thus greater attention and research delving deeper into high-temperature heatwave events and their potential impacts in the tropics is needed.
The rubber tree (Hevea brasiliensis) is a perennial deciduous species indigenous to the Amazon River Basin in Brazil that exemplifies typical tropical rainforest flora. The production of natural rubber using this tree species represents a crucial economic resource in tropical regions [28]. Since China introduced rubber plantations in the early 20th century, industrialized plantations have formed after years of development [29]. On Hainan Island, tropical rubber forests cover approximately a quarter of the total vegetation, positioning them as not only the predominant vegetation type on the island but also as a vital component of forest ecosystems in China’s tropical region. Beyond their direct economic value as artificial economic forests, rubber forests are increasingly recognized for their multifaceted ecological benefits, including soil and water conservation, carbon sequestration, biodiversity maintenance, and soil fertility enhancement [30]. Perturbations in LST, particularly under the stress of high-temperature heatwaves, present profound challenges to these plant ecosystems. Rubber plantations, due to their dependency on specific growth cycles and yield parameters, are notably susceptible to heatwave events [31]. However, current studies on the response of rubber forest ecosystems to climate change are mainly qualitative in nature, with limited understanding of the mechanisms by which tropical vegetation responds to global climate change [32]. For example, a study on the impacts of climate change and rubber plantation expansion on reference evapotranspiration [33] was conducted to assess the future impacts of climate change on rubber in Peninsular Malaysia by analyzing three salient features, namely, drought, flooding, and sea-level rise [34]. Although qualitative studies provide important insights revealing the response of rubber forest ecosystems to climate change, quantitative studies are also necessary to more accurately quantify the changes in rubber forest ecosystems and to provide a scientific basis for developing effective management and conservation measures. Therefore, in this paper, we focus on quantitative studies of LST changes induced by HWs. By analyzing the changes in LST, the response mechanism of rubber forest ecosystems to climate change can be better understood. This can help to predict the impacts of future climate change on this ecosystem and develop adaptation strategies accordingly. Meanwhile, it can provide important data and references for assessing the ecological integrity of the rubber forest ecosystem and formulating sustainable economic and social development strategies [35,36]. In addition, understanding the drivers of surface temperature change can help guide ecosystem management and conservation, and also has great potential for practical applications involving environmental protection, energy management, disaster prevention, regional economic development, etc. [37,38].
Given the specific ecological attributes of rubber plantations in tropical environments, this study aims to achieve two key goals: (1) to capture the variations in land surface temperature (LST) during heatwave and non-heatwave periods and (2) to identify the dominant factors driving these LST changes in various periods, utilizing sophisticated attribution analysis techniques.

2. Data and Methods

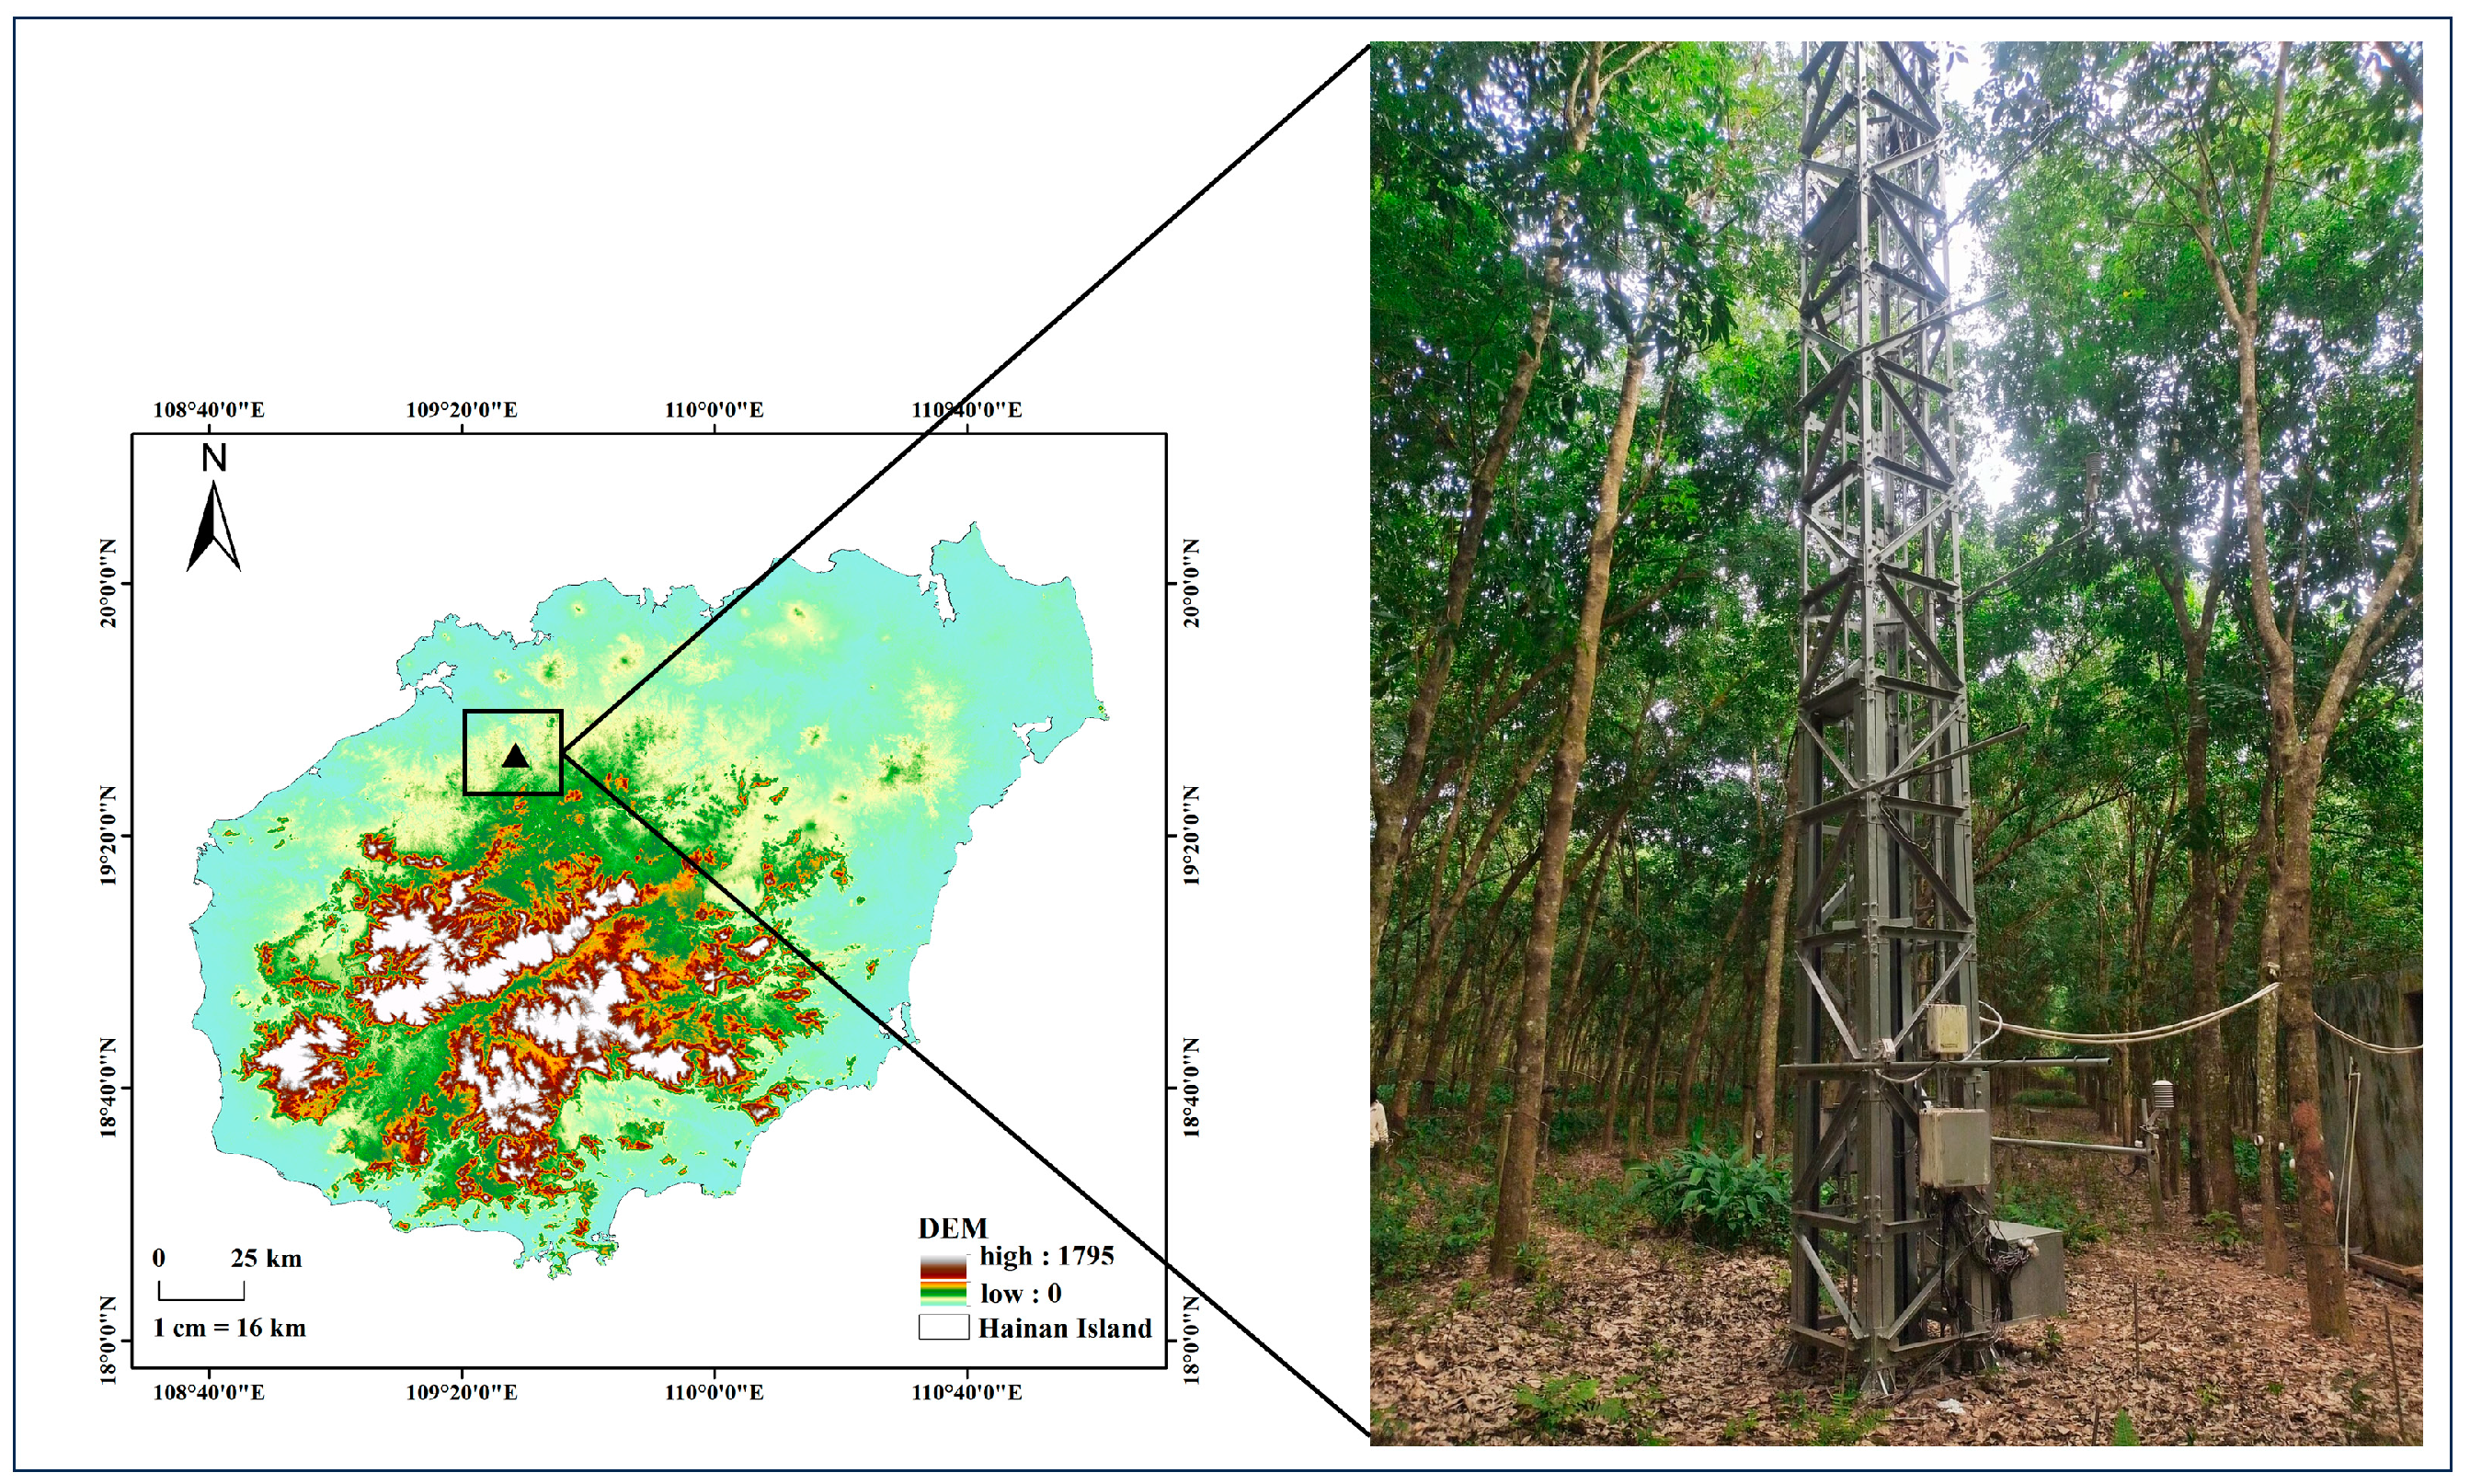
2.1. Observational Data

We obtained eddy covariance and meteorological data from Hainan Danzhou Tropical Agro-ecosystems of the National Observation and Research Station (DZ for short, Figure 1) from 2010 to 2022. The vorticity flux system at this study site has been recording near-surface fluxes since November 2009, taking measurements of wind speed, temperature and humidity, wind direction, rainfall, incident longwave and shortwave radiation, outgoing longwave and shortwave radiation, CO2 and water vapor fluxes, latent and sensible heat fluxes, soil temperature and humidity, and soil heat fluxes. For specific measuring instruments and devices, please refer to the Supplementary Materials (Table S1 in the Supplementary Materials). DZ is located in zone No.3 of the experimental farm of the Chinese Academy of Tropical Agricultural Sciences (19°32′16″ N, 109°28′06″ E; 114 m a.s.l), Danzhou, Hainan Province, China. In DZ, the climate is predominantly influenced by intense solar radiation, and distinct seasonal cycles are observed with pronounced monsoon and drought periods. Annual precipitation averages 1504.7 mm, with a significant 80% of this precipitation being concentrated between July and September, reflecting a marked seasonal distribution. In DZ, the forest canopy reaches an average height of approximately 20 m, a reflection of the area’s vigorous and well-developed vegetation.

2.2. Identification of Heatwave Events

The existing methodologies for defining heatwaves in climatological research yield varying results. Commonly, studies deploy either absolute thresholds [13] or relative thresholds [39,40] to identify days of elevated temperatures. HWs identified based on relative thresholds can reflect abnormally high temperatures in different seasons, can better characterize local anomalies, and are more widely used in the study of the variability in and mechanisms of heatwaves. Thus, in this paper, we apply the relative threshold method to define the occurrence of a heatwave [38,41], using the daily maximum temperature as the primary metric. Specifically, the threshold for heatwave events in this study is defined as follows: based on the daily maximum temperature data from 2010 to 2022 at the DZ station, the daily maximum temperature of one day during the study period as well as the seven days before and after it (i.e., a 15-day window) is used as the dataset determining the heatwave threshold for that day. Following that, the daily maximum temperatures within the 15-day dataset are sorted in ascending order, and the 90th percentile value is taken as the high-temperature heatwave threshold for the chosen day. This process is repeated to obtain the HW threshold for each day of the year. In this study, a heatwave event was defined as three or more consecutive days of daily maximum temperatures exceeding a specific threshold from March to November during the study period (2010–2022) [41,42]. Figure 2 shows the daily maximum temperatures and corresponding thresholds for the period from 1 to 15 July 2010, where the shaded portion (i.e., the dates corresponding to the daily maximum temperature above the threshold) indicates the occurrence of an HW event. For more information on HW and non-HW events, see Appendix A (Table A1 in Appendix A). Thus, for a number of given days, d, the threshold is the 90th percentile of the dataset, A d , defined by the following equation [39]:
A d = y = 2010 2022 i = d 7 d + 7 T y , i ,
where U is the union of sets, and T y , i is the daily maximum temperature on the i-th day in the y-th year.

2.3. The Attribution Framework

In this paper, we employ a recently proposed two-resistance mechanism (TRM) attribution method [7,20,25] to attribute changes in land surface temperature during heatwaves to driving factors. The TRM method is based on the surface energy balance equation:
R n = S in 1   α + ε L in   ε σ T s 4 = H + LE + G ,
where R n is the net radiation, S in is the incident shortwave radiation, α is the albedo, ε is the emissivity, L in is the incident longwave radiation, σ is a Boltzmann constant of 5.672 × 10⁻⁸, Ts is the surface temperature, H is the sensible heat flux, LE is the latent heat flux, and G is the ground heat flux.
By introducing the concept of resistance, the sensible and latent heat fluxes are parameterized as follows [10]:
H = ρ c p r a ( T s T a ) ,
LE = ρ L v r a + r s ( q s * T s q a ) ,
where ρ is the air density, c p is the specific heat of air at constant pressure, r a is the aerodynamic resistance, T a is the air temperature, L v is the latent heat of vaporization, q s * is the saturated specific humidity at T s , q a is the atmospheric specific humidity, and r s is the surface or resistance.
Substituting Equations (3) and (4) into Equation (2), we obtain:
S in 1     α + ε L in   ε σ T s 4 = ρ c p r a ( T s T a ) + ρ L v r a + r s ( q s * T s q a ) + G ,
linearizing the outgoing longwave radiation and the saturation-specific humidity term at the air temperature yields:
T s = R n *   G   ρ L v r a + r s [ q a * T a q a ] 1 4 ε σ T a 3 + ρ c p r a + ρ L v r a + r s q * T | T a + T a ,
where the radiative forcing, R n * is expressed as R n * = S i n 1 α + ε L i n ε σ T a 4 , which is subject to the combined effect of incident shortwave radiation, incident longwave radiation, albedo, and air temperature.
By employing the derived analytical formula for LST, as delineated in Equation (6), we can make a quantitative assessment of LST’s sensitivity to variations in key influencing factors. The LST change can be attributed to changes in the radiative forcing ( R n * ), aerodynamic resistance ( r a ), surface resistance ( r s ), ground heat flux ( G ), relative humidity ( RH ), and air temperature ( Ta ):
T s = Ts R n * R n * + Ts r a r a + Ts r s r s + Ts G G + Ts RH RH + Ts T a T a ,
where refers to the change in each variable over time (e.g., G = G HW G non - HW ) and the partial derivatives represent the sensitivity of T s to changes in driving factors. In Equation (7), each term on the right-hand side is designated as a ‘contribution’. These contributions are bifurcated into two distinct components: the ‘partial derivative’, representing the rate of change, and the ‘change’ itself, quantifying the magnitude of the variation.

2.4. Implementing Attribution Method on Observational Data

In this paper, we focus on daytime variations occurring between 7:30 and 17:30 (local time). To ensure the representativeness of the observational data, we only consider calculation days where at least 50% of the daytime data is available. To estimate the LST from observational data, we assume that the rubber plantation’s emissivity value is 0.92.
Given that the TRM method relies on a first-order Taylor expansion, it neglects the higher-order and cross-order terms. Generally, this method’s error remains acceptable when the variation in imputed variables is minimal. However, the high variability of driving factors can lead to significant errors, particularly when estimating partial derivatives in a non-heatwave (non-HW) reference state. Therefore, we used the weighted average method proposed in a previous study to optimize the results [43]. This method can effectively reduce the error of LST estimation:
X = X before + m X after 1 + m ,
where X is the final partial derivative in the model; m is the optimized weight; and X before and X after are the partial derivatives calculated using data from the non-HW and HW conditions, respectively.

3. Results

3.1. Response of LST in Tropical Rubber Forest Ecosystem to Heatwaves

In this paper, we examine how land surface temperature (LST) in tropical rubber forests responds to heatwave (HW) conditions. Our analysis, covering the transition from non-heatwave (non-HW) to HW conditions, reveals a distinct pattern in LST throughout the year. This pattern shows a gradual increase in LST to a peak around the middle of the year, then a decrease toward the end (Figure 3a). Figure 3b shows the distribution of HW vs. non-HW days at the monthly scale in terms of LST. We observe that between March and November, the LST under HW conditions shows a trend of increasing first, reaching a maximum, and then decreasing. Similarly, the same is true for the non-HW condition, which coincides with the intra-year variation in LST illustrated in Figure 3a. The month with the highest LST in the HW period was May, with a peak temperature of 36.48 °C, while the highest LST in the non-HW period appeared in June, with a peak temperature of 31.82 °C. Moreover, the lowest LST in both the HW period and non-HW periods appeared in November, with temperatures of 29.79 °C and 24.76 °C, respectively. In addition, we found that the most significant difference in LST between the HW and non-HW periods was between March and May when it was in the spring–early summer period and the temperature began to gradually increase; compared to the HW period, the non-HW period may have had a more stable temperature during this time, which may be one reason for the significant difference in LST during this period. Figure 3c compares the average daily LST across multiple years. In this figure, it can be seen that the LST during HW periods is significantly higher than during non-HW periods. Specifically, the average daily LST during the HW period is 33.9 °C, while it is 27.2 °C during the non-HW period, representing an increase of 6.7 °C. Statistical analysis of these values shows a p-value less than 0.01, indicating a significant difference in LST between the HW and non-HW periods in these ecosystems.

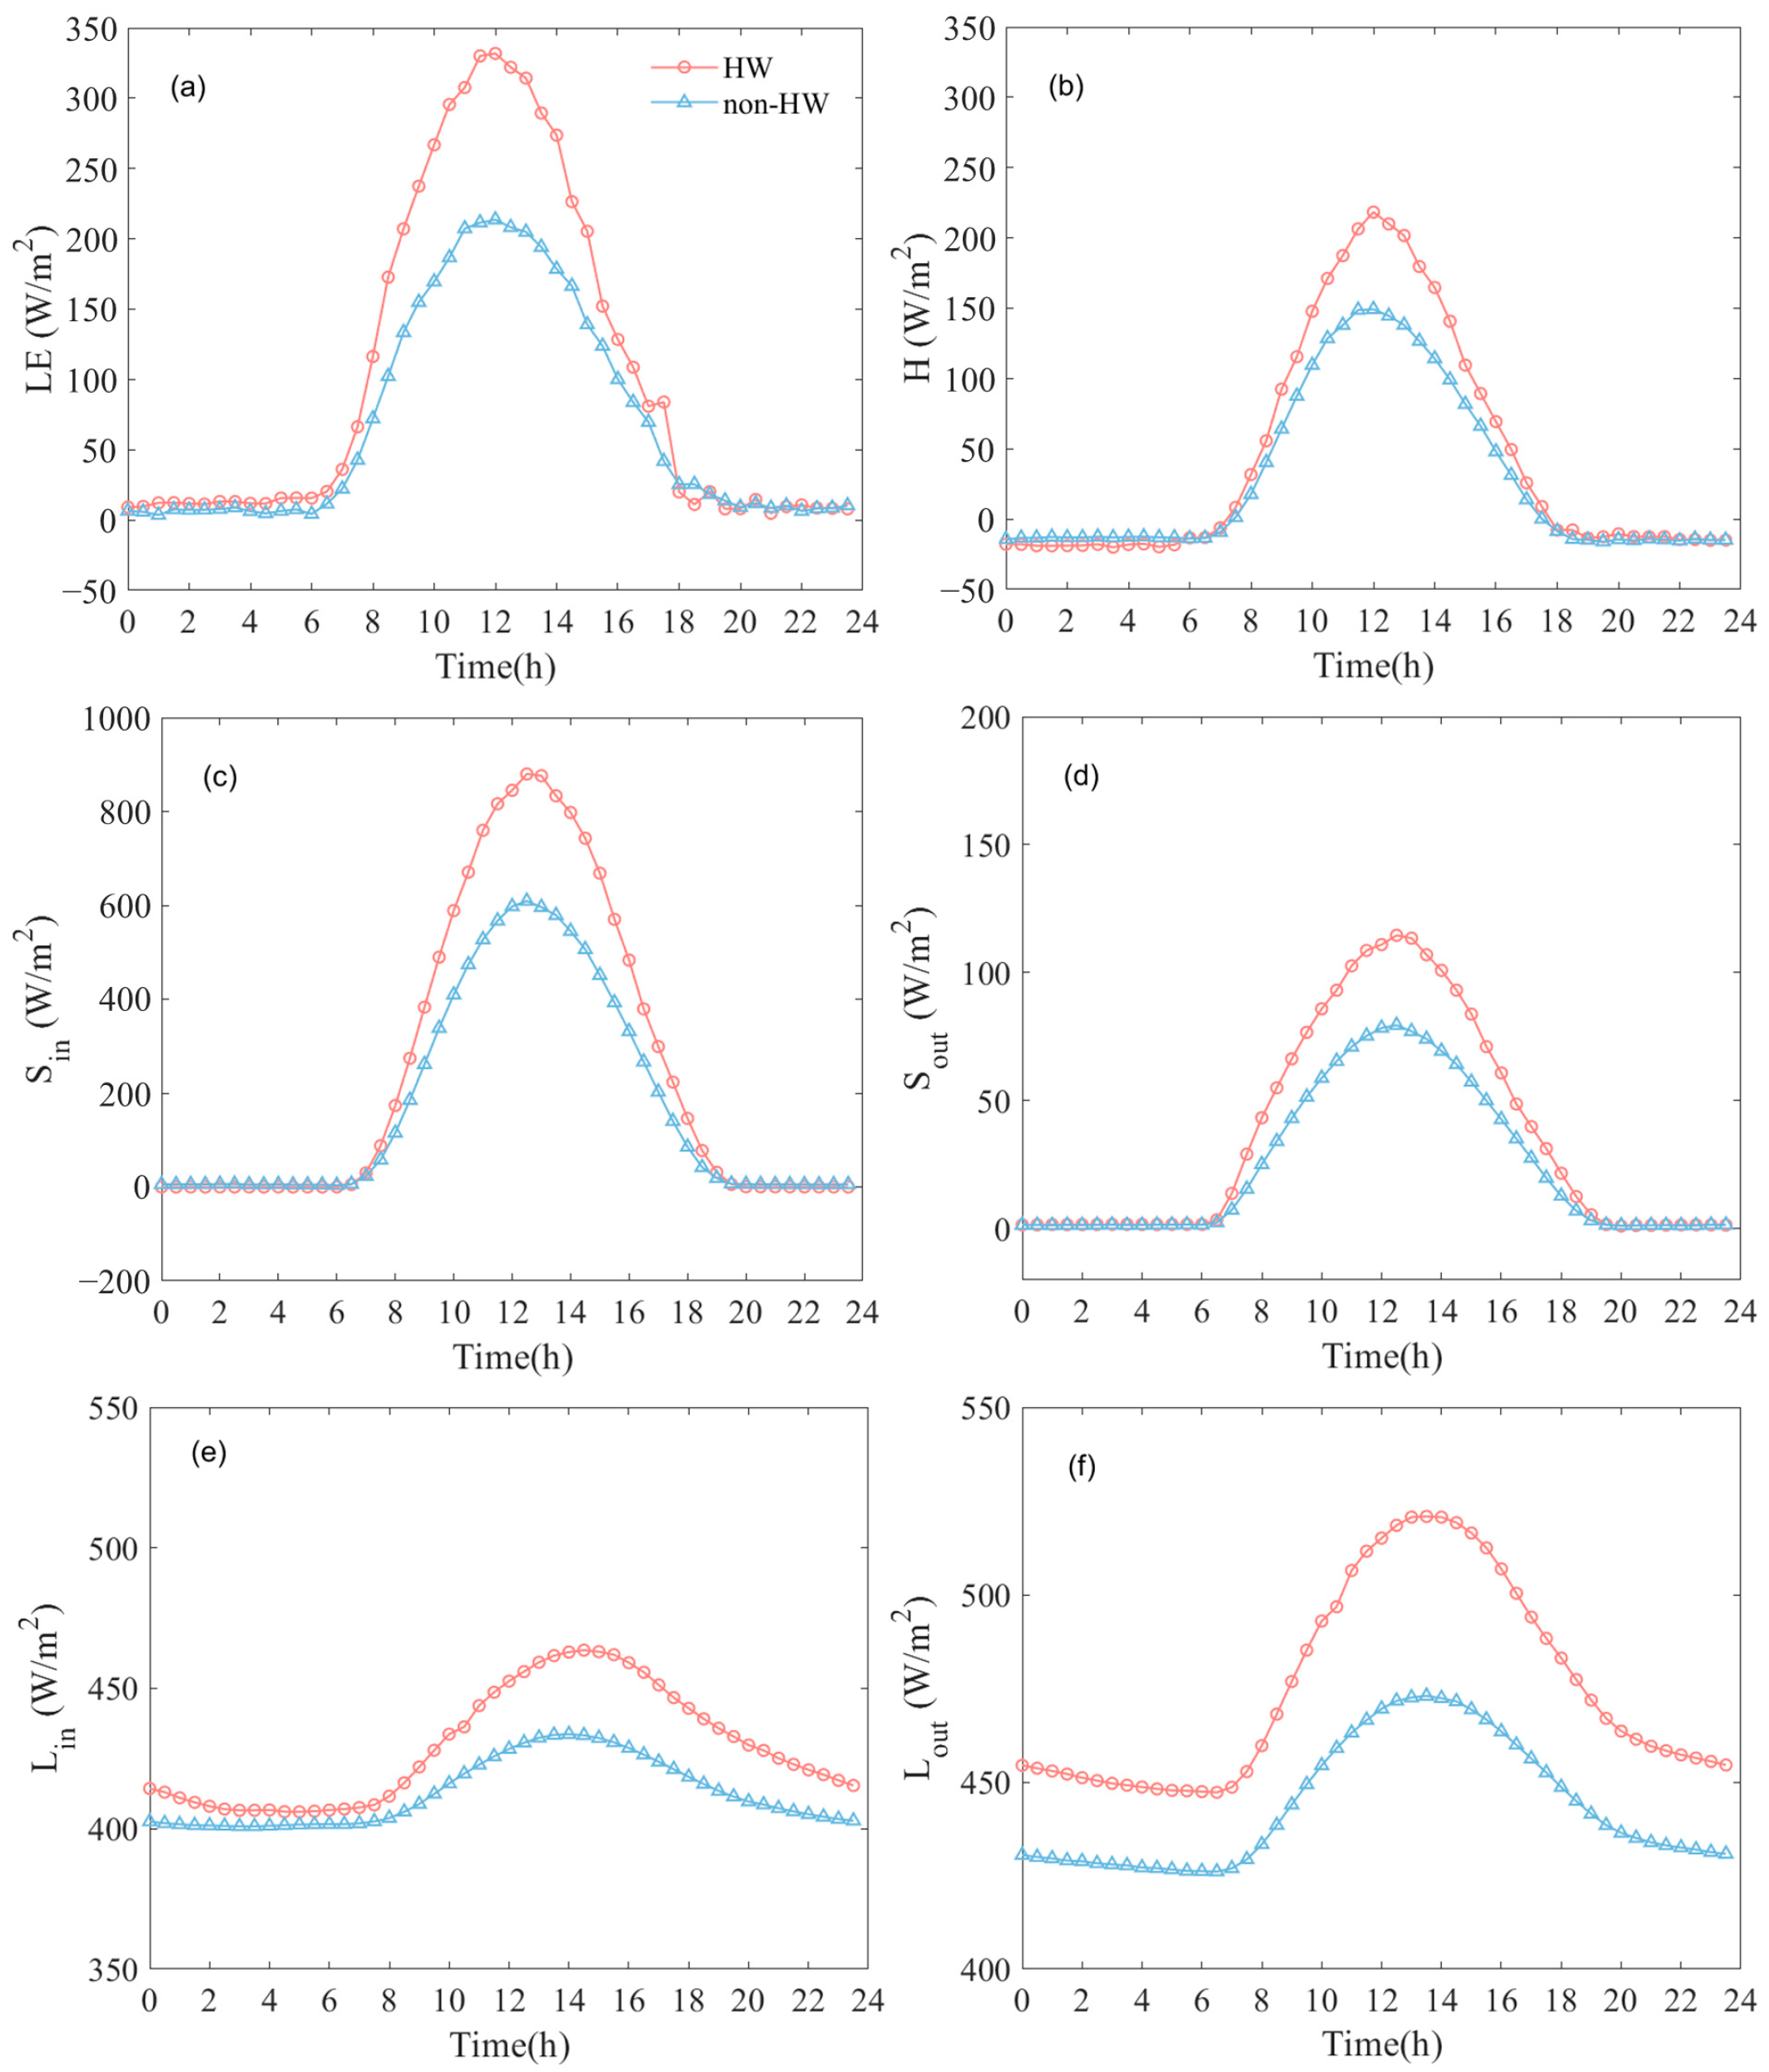
3.2. The Impacts of Heatwaves on Radiation and Surface Fluxes

Figure 4 presents the diurnal changes in environmental factors related to the surface energy balance within tropical rubber forest ecosystems, comparing conditions during HW and non-HW periods. These variables include latent heat flux (LE), sensible heat flux (H), incoming shortwave radiation ( S i n ) and outgoing shortwave radiation ( S o u t ), and incoming ( L i n ) and outgoing ( L o u t ) longwave radiation. For studies of short-term events (e.g., heatwaves), there is great variability in the changes in radiative and turbulent energy over the course of a day. The Earth’s radiation balance is strongly influenced by clouds [44]. In general, the thickness of clouds affects the incoming shortwave radiation and outgoing longwave radiation, which in turn causes changes in temperature [45,46]. There is greater cloud cover in the tropics [47], but heatwaves are usually accompanied by high temperatures, which may result in fewer clouds [48] and less aerosols [49] during heatwaves, and thus more radiation during heatwaves than during non-heatwaves. In addition, changes in surface properties (e.g., soil moisture, vegetation cover, heat storage, surface roughness, etc.) under HW conditions may also affect the turbulent processes of energy generation and transport [50], in turn leading to changes in LST. For a more detailed study, we have investigated the intraday variability in radiative and turbulent energy on an hourly scale to better understand the formation mechanisms and evolution of heatwave events.
In Figure 4a, LE demonstrates a significant midday peak under HW, implying increased evapotranspiration rates compared to non-HW conditions. This suggests that as transpiration increases due to increased vegetation and soil temperatures during heatwaves, more water is transported from the soil to the atmosphere, leading to an increase in LE. Figure 4b indicates that the sensible heat flux similarly shows higher values during HW, signifying enhanced heat dissipation from the forest canopy to the atmosphere. This is due to the fact that the atmosphere is usually hotter and drier during heatwaves, which can potentially increase the temperature difference between the surface and the atmosphere, leading to a faster transfer of heat from the surface to the atmosphere and an increase in H. This is because the LE and H fluxes represent the evaporation of water vapor from the surface and the heat exchange at the surface, respectively.
Figure 4c illustrates the incoming shortwave radiation, which shows heightened levels during HWs, reflective of the intense solar irradiance that is characteristic of these periods. Figure 4d presents the outgoing shortwave radiation, illustrating a distinct rise during HW periods, consistent with the increased solar radiation observed in Figure 4c.
The longwave radiation trends, depicted in Figure 4e,f, display an inverted “U” shape, with both incoming and outgoing longwave radiation experiencing elevated levels during HW periods. This indicates not only a more pronounced thermal emission from the surface but also a significant retention of radiative heat, suggesting an intensified greenhouse effect during HW events. It has been shown that periods of heatwaves are usually accompanied by clearer, cloudless weather and more intense solar radiation [51], resulting in more shortwave radiation being received at the surface. This increases the energy input to the surface [52,53], which in turn increases the surface temperature. However, higher surface temperatures result in more thermal energy being released into the atmosphere in the form of longwave radiation [54].
These observations underscore significant differences in the diurnal patterns of these variables between HW and non-HW periods. Specifically, the average daily incoming shortwave radiation during an HW is substantially higher than during a non-HW, with values of 432.8 W/m2 for HWs and 278.9 W/m2 for non-HWs, indicating a notable increase in solar energy received by the ecosystem during HW periods. The observed diurnal patterns and differences contribute to our understanding of the effects of HW on the energy balance of these forest ecosystems, leading to a deeper understanding of the mechanisms by which heatwaves affect surface temperature changes in rubber forests.

3.3. Attribution of LST Response to Heatwave

In this paper, we employed the TRM method to analyze the variations in LST induced by heatwave events. As presented in Figure 5, the changes in LST from non-HW to HW conditions were decomposed into variations influenced by several driving factors, including (1) atmospheric factors such as air temperature, radiative forcing, relative humidity, atmospheric pressure; and (2) land surface factors such as ground heat flux, surface resistance, and aerodynamic resistance.
As shown in Figure 5 Part I, the modeled LST (red bars) closely matches the observed LST (yellow bars). Following this, we focus on quantifying the total contributions of atmospheric and land surface factors to LST. In Part II, the total atmospheric and land surface contributions are positive, suggesting they jointly amplify LST when transitioning into HW conditions. Importantly, our results show that the total contributions from atmospheric factors are more significant compared to those from land surface factors.
Among the atmospheric factors (third part in Figure 5, blue bars), air temperature and relative humidity both negatively contribute to LST, while radiative forcing shows the largest positive contribution. As illustrated in Table 1, the sensitivity of LST to changes in relative humidity and radiative forcing is positive. Therefore, an increase in radiative forcing during a heatwave leads to a higher LST during this period, which accounts for the positive contribution of radiative forcing. Conversely, a decrease in relative humidity leads to a negative contribution. Consequently, the sensitivity of LST to air temperature is negative; thus, an increase in air temperature under HW conditions results in a decrease in LST at this time of year. The positive contribution of radiative forcing is partly offset by the negative contributions of air temperature and relative humidity. Thus, radiative forcing plays a dominant role in modulating the response of the LST to HWs, while the effect of atmospheric pressure is minimal.
Among the land surface factors (third part in Figure 5, purple bars), the land surface resistance makes the strongest positive contribution (i.e., increases in the surface resistance tend to increase the LST). This finding is consistent with previous research that suggests that in response to high temperatures and a lack of water, plants generally close their stomata, thereby elevating surface resistance [55,56]. The minor contributions from ground heat flux and aerodynamic resistance are attributed to their minimal variations during HWs, as seen in Table 2.
Overall, changes in surface temperature due to heatwaves are controlled by atmospheric factors, mainly radiative forcing, air temperature, and relative humidity. In terms of the contributions of these factors, radiative forcing is usually the most dominant positive contributor, while the air temperature and relative humidity are offset by negative contributions. From the LST attribution results in Figure 5, it can be seen that the contribution of radiative forcing is 14.70 K, that of air temperature is −4.76 K, that of relative humidity is −5.86 K, and that of atmospheric pressure is −0.04 K. Moreover, the contribution of surface resistance is 2.42 K, that of aerodynamic resistance is −0.23 K, and that of soil heat flux is −0.91 K.

4. Discussion

In previous studies seeking to understand changes in rubber forest ecosystem characteristics, researchers have focused on changes in water use efficiency between the monsoon and drought seasons and the dominant factors behind such changes [57]. The impacts on rubber forest ecosystems under extreme climatic conditions are still under study. Located at the edge of the tropics, rubber forest ecosystems have environmental characteristics such as high temperatures and high humidity. In addition to this, according to previous studies, evapotranspiration from rubber plantations during the rainy season is greater than that from tropical rainforests, and the idea that rubber plantations act as a “Water suction pump” has been confirmed [58]. However, as a “Water suction pump”, the larger evapotranspiration from rubber plantations may have implications for changes in LST during HWs. Therefore, to further investigate how climate change causes changes in rubber plantations’ LST, this paper aims to reveal changes in rubber plantations’ LST during heatwaves and to analyze the mechanisms producing such changes.
The results of the attribution analysis indicate that during HWs, both radiative forcing and surface resistance are driving factors that tend to increase LST. When only the effects of atmospheric factors are considered, radiative forcing is the main influence, followed by temperature and relative humidity. In addition, it is worth noting that radiative forcing provides a positive influence, and temperature and relative humidity provide a negative influence; these forces cancel each other out to some extent. Previous studies have shown that solar radiation directly heats the surface under clear and cloudless conditions, implying that changes in LST are mainly influenced by radiation [59]. Moreover, compared to grasslands, forests are more likely to contribute heat to the atmosphere, leading to higher air temperatures [60]. Concerning the negative contributions of temperature, we argue that transpiration from vegetation is enhanced during HWs. This is because high temperatures usually increase the transpiration rate of plants, as the plants allow water to evaporate faster to prevent overheating. This results in plants requiring more water to meet their transpiration demands. However, this process can have a cooling effect on the ground surface, which can negatively affect the increase in surface temperature to some extent. Previous studies have found that rubber forests have strong evapotranspiration, and this has been further confirmed [58]. In addition, their study showed that evapotranspiration from rubber forests was spatially significant and positively correlated with net radiation [61]. The negative contribution of relative humidity can be explained by the fact that high relative humidity usually leads to more water vapor being present in the air, which in turn promotes the process of evapotranspiration. The evaporation of water vapor consumes surface heat, resulting in lower surface temperatures. When considering the effect of land surface factors, surface resistance is the main influence. Under high temperatures and water deficits, plants usually close their stomata, thus increasing surface resistance [55,56]. The opening and closing of the stomata affect plant transpiration. When transpiration is reduced, plants are unable to dissipate heat efficiently, thus reducing the cooling effect on the ground and leading to higher surface temperatures.
Under HW conditions, the soil moisture often decreases due to increased evaporation and lack of rainfall. However, DZ is located at the northern edge of the tropical region and has an average annual rainfall of 1504.7 mm. This means the rubber plantations in this region generally receive sufficient rainfall. Therefore, in the attribution analysis, although changes in r s during HWs tend to elevate the LST, their impact is smaller than that of radiative forcing. The attribution results show that radiative forcing plays a central role in determining changes in LST.
For further analysis, we decomposed the contribution of radiative forcing into the sum of atmospheric (Ta, S i n , L i n ) and land surface (albedo) factors, as shown in Figure 6. Figure 6a reveals that the negative contribution of Ta is stronger than before, S i n and L i n exhibit relatively high positive contributions, and albedo contributes almost nothing. Considering the contributions of each decomposed element of radiative forcing (as indicated in Figure 6b), S i n , representing the shortwave radiation that reaches the Earth’s surface, holds the largest share. Air temperature (Ta) comes next, followed by longwave radiation ( L i n ), and albedo has the smallest proportion.
In this study, the attribution analysis of surface temperature changes in rubber forest ecosystems under heatwave conditions only explores the changes and the driving mechanisms behind them from a temporal perspective. Thus, future studies should further consider the spatial variability in surface temperature changes in tropical forest ecosystems in order to reveal the differences between different regions and tropical forest ecosystems.

5. Conclusions

In this study, utilizing data collected at the DZ site, we employed the relative threshold method to identify heatwaves in the region and investigated their impact on land surface temperature (LST) using the TRM approach. The results indicate that it is atmospheric rather than surface factors that dominate heatwave-induced changes in daytime LST in tropical rubber plantation ecosystems, a result that is consistent with the conclusions reached in previous studies [52]. It was found that radiative forcing and surface resistance are the most important atmospheric and surface factors controlling the LST changes under HW conditions, respectively. The increase in LST during a heatwave is mainly influenced by radiative forcing (which depends mainly on the incident shortwave and longwave radiation), which is partially offset by the contributions of air temperature and relative humidity.

Supplementary Materials

The following supporting information can be downloaded at: https://www.mdpi.com/article/10.3390/w16050752/s1, Table S1: Installation of measurement instruments of eddy flux observation system at DZ Experimental Station of Tropical Crop Science Observation, Ministry of Agriculture, DZ City, Hainan.

Author Contributions

Writing—original draft preparation, Y.L. and P.W.; Data analysis, attribution model optimization: X.S. and Z.S.; Collecting data, Z.W.; Paper revision and suggestions: M.L., L.J., Y.X. and P.W. All authors have read and agreed to the published version of the manuscript.

Funding

Y.L. and P.W. acknowledge financial support from the Youth Foundation of the Natural Science Foundation of Hainan Province of China (Grant No. 421QN197); X.S. and Z.S. acknowledge financial support from the Fund for Less Developed Regions of the National Natural Science Foundation of China (Grant No. 32160320) and the Youth Foundation of the National Natural Science Foundation of China (Grant No. 42101101); M.L., L.J., and Y.X. acknowledge financial support from the Science and Technology Innovation Foundation of Command Center of Integrated Natural Resources Survey Center (Grant No. KC20230018).

Data Availability Statement

The original contributions presented in the study are included in the article and Supplementary Materials; further inquiries can be directed to [email protected]; [email protected].

Acknowledgments

We would like to thank reviewers and the editor for their valuable time on the article. We would also like to flux data support by Z.W. for his contribution. And we are grateful to all the foundations that support us.

Conflicts of Interest

The authors declare no conflicts of interest.

Appendix A

Table A1 shows heatwave information for the DZ region from January 2010 through December 2022, including heatwave start date, end date, number of days of duration, and the number of heatwave days and non-heatwave days summarized on an annual scale.
Table A1. High-temperature heatwave events from January 2010 to December 2022 in DZ.
YearStart Date of HWEnd Date of HWDuration of HW DaysNumber of HW DaysNumber of Non-HW Days
201003–0103–06625340
04–1104–133
07–0407–129
07–2608–017
201105–0905–1133362
2012----365
2013----365
201406–0206–05410355
09–2710–026
201503–1503–19541324
03–3104–045
04–1804–203
06–3007–045
08–1508–195
09–0409–085
09–2209–265
11–1111–133
11–1511–195
201605–0505–08422343
06–1306–153
07–1507–195
08–0708–093
10–2210–287
201704–0904–1139356
08–0808–103
08–1208–143
201803–0303–0533362
201903–2003–22316349
04–0904–113
04–1904–257
05–1805–203
202005–0505–09513352
06–0606–094
06–2106–244
202108–0808–1036359
08–2208–243
202203–2003–2239356
04–2504–273
11–2711–293
Total---1574588

References

  1. Schwaab, J.; Meier, R.; Mussetti, G.; Seneviratne, S.; Bürgi, C.; Davin, E.L. The Role of Urban Trees in Reducing Land Surface Temperatures in European Cities. Nat. Commun. 2021, 12, 6763. [Google Scholar] [CrossRef]
  2. Hu, Y.; Jia, G.; Gao, H.; Li, Y.; Hou, M.; Li, J.; Miao, C. Spatial Characterization of Global Heat Waves Using Satellite-Based Land Surface Temperature. Int. J. Appl. Earth Obs. Geoinform. 2023, 125, 103604. [Google Scholar] [CrossRef]
  3. Digavinti, J.; Manikiam, B. Satellite Monitoring of Forest Fire Impact and Regeneration Using NDVI and LST. J. Appl. Remote Sens. 2021, 15, 042412-1. [Google Scholar] [CrossRef]
  4. Li, Y.; Wang, X.; Chen, Y.; Wang, M. The Correlation Analysis of Land Surface Temperature and Fractional Vegetation Coverage in Fujian Province. J. Geo-Inf. Sci. 2019, 21, 03000445. [Google Scholar] [CrossRef]
  5. Liu, W.; Jia, B.; Li, T.; Zhang, Q.; Ma, J. Correlation Analysis between Urban Green Space and Land Surface Temperature from the Perspective of Spatial Heterogeneity: A Case Study within the Sixth Ring Road of Beijing. Sustainability 2022, 14, 13492. [Google Scholar] [CrossRef]
  6. Khan, M.; Qasim, M.; Tahir, A.A.; Farooqi, A. Machine Learning-Based Assessment and Simulation of Land Use Modification Effects on Seasonal and Annual Land Surface Temperature Variations. Heliyon 2023, 9, e23043. [Google Scholar] [CrossRef] [PubMed]
  7. Masson-Delmotte, V.; Zhai, P.; Pirani, A.; Connors, S.L.; Péan, C.; Berger, S.; Caud, N.; Chen, Y.; Goldfarb, L.; Gomis, M.I.; et al. (Eds.) Climate Change 2021: The Physical Science Basis. Contribution of Working Group I to the Sixth Assessment Report of the Intergovernmental Panel on Climate Change; Cambridge University Press: Cambridge, UK; New York, NY, USA, 2021. [Google Scholar] [CrossRef]
  8. Hao, T.; Lin, L.; Zhengyong, Z.; Hongjin, C.; Xueying, Z.; Tongxia, W.; Ziwei, K. Spatiotemporal diversity and attribution analysis of land surface temperature in China from 2001 to 2020. Acta Geogr. Sin. 2022, 77, 1713–1729. [Google Scholar] [CrossRef]
  9. Khorchani, M.; Vicente-Serrano, S.; Azorin-Molina, C.; Garcia, M.; Martín-Hernández, N.; Peña-Gallardo, M.; Kenawy, A.; Domínguez-Castro, F. Trends in LST over the Peninsular Spain as Derived from the AVHRR Imagery Data. Glob. Planet. Change 2018, 166, 75–93. [Google Scholar] [CrossRef]
  10. Zheng, Z.; Zhao, L.; Oleson, K.W. Large Model Structural Uncertainty in Global Projections of Urban Heat Waves. Nat. Commun. 2021, 12, 3736. [Google Scholar] [CrossRef] [PubMed]
  11. Bian, Y.; Sun, P.; Zhang, Q.; Luo, M.; Liu, R. Amplification of Non-Stationary Drought to Heatwave Duration and Intensity in Eastern China: Spatiotemporal Pattern and Causes. J. Hydrol. 2022, 612, 128154. [Google Scholar] [CrossRef]
  12. AghaKouchak, A.; Chiang, F.; Huning, L.S.; Love, C.A.; Mallakpour, I.; Mazdiyasni, O.; Moftakhari, H.; Papalexiou, S.M.; Ragno, E.; Sadegh, M. Climate Extremes and Compound Hazards in a Warming World. Annu. Rev. Earth Planet. Sci. 2020, 48, 519–548. [Google Scholar] [CrossRef]
  13. Meehl, G.; Tebaldi, C. More Intense, More Frequent, and Longer Lasting Heat Waves in the 21st Century. Science 2004, 305, 994–997. [Google Scholar] [CrossRef] [PubMed]
  14. Wang, W.; Wang, J.; Shao, J.; Wu, B.; Lin, H. The Spatiotemporal Variation Characteristics and Impacts of Summer Heatwaves, Droughts, and Compound Drought and Heatwave Events in Jiangsu Province, China. Water 2024, 16, 89. [Google Scholar] [CrossRef]
  15. Ceccherini, G.; Russo, S.; Ameztoy, I.; Marchese, A.; Carmona-Moreno, C. Heat Waves in Africa 1981–2015, Observations and Reanalysis. Nat. Hazards Earth Syst. Sci. 2017, 17, 115–125. [Google Scholar] [CrossRef]
  16. Ceccherini, G.; Russo, S.; Ameztoy, I.; Hernandez, C.; Carmona-Moreno, C. Magnitude and Frequency of Heat and Cold Waves in Recent Decades: The Case of South America. Nat. Hazards Earth Syst. Sci. 2016, 3, 821–831. [Google Scholar] [CrossRef]
  17. Ratnam, J.V.; Behera, S.K.; Ratna, S.B.; Rajeevan, M.; Yamagata, T. Anatomy of Indian Heatwaves. Sci. Rep. 2016, 6, 24395. [Google Scholar] [CrossRef] [PubMed]
  18. Luo, M.; Lau, N.-C. Heat Waves in Southern China: Synoptic Behavior, Long-Term Change, and Urbanization Effects. J. Clim. 2017, 30, 703–720. [Google Scholar] [CrossRef]
  19. Singh, S.; Yadav, A.; Kumar Goyal, M. Univariate and Bivariate Spatiotemporal Characteristics of Heat Waves and Relative Influence of Large-Scale Climate Oscillations over India. J. Hydrol. 2024, 628, 130596. [Google Scholar] [CrossRef]
  20. Keellings, D.; Moradkhani, H. Spatiotemporal Evolution of Heat Wave Severity and Coverage Across the United States. Geophys. Res. Lett. 2020, 47, e2020GL087097. [Google Scholar] [CrossRef]
  21. Brown, S. Future Changes in Heatwave Severity, Duration and Frequency Due to Climate Change for the Most Populous Cities. Weather Clim. Extrem. 2020, 30, 100278. [Google Scholar] [CrossRef]
  22. He, B.-J.; Wang, J.; Liu, H.; Ulpiani, G. Localized Synergies between Heat Waves and Urban Heat Islands: Implications on Human Thermal Comfort and Urban Heat Management. Environ. Res. 2021, 193, 110584. [Google Scholar] [CrossRef]
  23. Deng, K.; Yang, S.; Ting, M.; Lin, A.; Wang, Z. An Intensified Mode of Variability Modulating the Summer Heat Waves in Eastern Europe and Northern China. Geophys. Res. Lett. 2018, 45, 11361–11369. [Google Scholar] [CrossRef]
  24. Dong, Z.; Wang, L.; Sun, Y.; Hu, T.; Limsakul, A.; Singhruck, P.; Pimonsree, S. Heatwaves in Southeast Asia and Their Changes in a Warmer World. Earths Future 2021, 9, e2021EF001992. [Google Scholar] [CrossRef]
  25. Anderson, G.B.; Oleson, K.W.; Jones, B.; Peng, R.D. Classifying Heatwaves: Developing Health-Based Models to Predict High-Mortality versus Moderate United States Heatwaves. Clim. Change 2018, 146, 439–453. [Google Scholar] [CrossRef]
  26. Brás, T.A.; Seixas, J.; Carvalhais, N.; Jägermeyr, J. Severity of Drought and Heatwave Crop Losses Tripled over the Last Five Decades in Europe. Environ. Res. Lett. 2021, 16, 065012. [Google Scholar] [CrossRef]
  27. Vautard, R.; Aalst, M.; Boucher, O.; Drouin, A.; Haustein, K.; Kreienkamp, F.; Van Oldenborgh, G.J.; Otto, F.; Ribes, A.; Robin, Y.; et al. Human Contribution to the Record-Breaking June and July 2019 Heat Waves in Western Europe. Environ. Res. Lett. 2020, 15, 094077. [Google Scholar] [CrossRef]
  28. Chiarelli, D.; Passera, C.; Rulli, M.C.; Rosa, L.; Ciraolo, G.; D’Odorico, P. Hydrological Consequences of Natural Rubber Plantations in Southeast Asia. Land Degrad. Dev. 2020, 31, 2060–2073. [Google Scholar] [CrossRef]
  29. Cao, X.; Xu, X.; Che, H.; West, J.S.; Luo, D. Effects of Temperature and Leaf Age on Conidial Germination and Disease Development of Powdery Mildew on Rubber Tree. Plant Pathol. 2021, 70, 484–491. [Google Scholar] [CrossRef]
  30. Qi, D.; Yang, C.; Yun, T.; Wu, Z. The Main Service Functions and Driving Forces of Rubber (Hevea brasiliensis) Plantation Ecosystem in China. J. Rubber Res. 2023, 26, 155–164. [Google Scholar] [CrossRef]
  31. Lai, H.; Chen, B.; Yin, X.; Wang, G.; Wang, X.; Yun, T.; Lan, G.; Wu, Z.; Yang, C.; Kou, W. Dry Season Temperature and Rainy Season Precipitation Significantly Affect the Spatio-Temporal Pattern of Rubber Plantation Phenology in Yunnan Province. Front. Plant Sci. 2023, 14, 1283315. [Google Scholar] [CrossRef]
  32. Qian, S.; Chen, X.; Lang, W.; Schwartz, M. Examining Spring Phenological Responses to Temperature Variations during Different Periods in Subtropical and Tropical China. Int. J. Climatol. 2020, 41, E3208–E3218. [Google Scholar] [CrossRef]
  33. Ling, Z.; Shi, Z.; Gu, S.; Wang, T.; Zhu, W.; Feng, G. Impact of Climate Change and Rubber (Hevea brasiliensis) Plantation Expansion on Reference Evapotranspiration in Xishuangbanna, Southwest China. Front. Plant Sci. 2023, 13, 830519. [Google Scholar] [CrossRef]
  34. Hazir, M.; Kadir, R.; Karim, Y. Projections on Future Impact and Vulnerability of Climate Change towards Rubber Areas in Peninsular Malaysia. IOP Conf. Ser. Earth Environ. Sci. 2018, 169, 012053. [Google Scholar] [CrossRef]
  35. Mazdiyasni, O.; AghaKouchak, A. Substantial Increase in Concurrent Droughts and Heatwaves in the United States. Proc. Natl. Acad. Sci. USA 2015, 112, 11484–11489. [Google Scholar] [CrossRef] [PubMed]
  36. Mazdiyasni, O.; Sadegh, M.; Chiang, F.; AghaKouchak, A. Heat Wave Intensity Duration Frequency Curve: A Multivariate Approach for Hazard and Attribution Analysis. Sci. Rep. 2019, 9, 14117. [Google Scholar] [CrossRef]
  37. Xu, P.; Wang, Y.; Fu, X.; Singh, V.P.; Qiu, J. Detection and Attribution of Urbanization Impact on Summer Extreme Heat Based on Nonstationary Models in the Yangtze River Delta, China. Urban Clim. 2023, 47, 101376. [Google Scholar] [CrossRef]
  38. Yang, J.; Yin, P.; Sun, J.; Wang, B.; Zhou, M.; Li, M.; Tong, S.; Meng, B.; Guo, Y.; Liu, Q. Heatwave and Mortality in 31 Major Chinese Cities: Definition, Vulnerability and Implications. Sci. Total Environ. 2019, 649, 695–702. [Google Scholar] [CrossRef]
  39. Russo, S.; Sillmann, J.; Fischer, E.M. Top Ten European Heatwaves since 1950 and Their Occurrence in the Coming Decades. Environ. Res. Lett. 2015, 10, 124003. [Google Scholar] [CrossRef]
  40. Wang, N.; Chen, J.; He, T.; Xu, X.; Liu, L.; Sun, Z.; Qiao, Z.; Han, D. Understanding the Differences in the Effect of Urbanization on Land Surface Temperature and Air Temperature in China: Insights from Heatwave and Non-Heatwave Conditions. Environ. Res. Lett. 2023, 18, 104038. [Google Scholar] [CrossRef]
  41. Xie, W.; Zhou, B.; You, Q.; Zhang, Y.; Ullah, S. Observed Changes in Heat Waves with Different Severities in China during 1961-2015. Theor. Appl. Climatol. 2020, 141, 1529–1540. [Google Scholar] [CrossRef]
  42. Russo, S.; Dosio, A.; Graversen, R.G.; Sillmann, J.; Carrao, H.; Dunbar, M.B.; Singleton, A.; Montagna, P.; Barbola, P.; Vogt, J.V. Magnitude of Extreme Heat Waves in Present Climate and Their Projection in a Warming World. J. Geophys. Res. Atmos. 2014, 119, 12500–12512. [Google Scholar] [CrossRef]
  43. Liao, W.; Rigden, A.J.; Li, D. Attribution of Local Temperature Response to Deforestation. J. Geophys. Res. Biogeosci. 2018, 123, 1572–1587. [Google Scholar] [CrossRef]
  44. Alexander, L.; Allen, S.; Bindoff, N.; Breon, F.-M.; Church, J.; Cubasch, U.; Emori, S.; Forster, P.; Friedlingstein, P.; Gillett, N.; et al. (Eds.) Climate Change 2013: The Physical Science Basis: Working Group I Contribution to the Fifth Assessment Report of the Intergovernmental Panel on Climate Change; Cambridge University Press: Cambridge, UK; New York, NY, USA, 2013. [Google Scholar] [CrossRef]
  45. Hartmann, D.; Ockert-Bell, M.; Michelsen, M. The Effect of Cloud Type on Earth’s Energy Balance: Global Analysis. J. Clim. 1992, 5, 1281–1304. [Google Scholar] [CrossRef]
  46. Chen, T.; Rossow, W.; Zhang, Y. Radiative Effects of Cloud-Type Variations. J. Clim. 2000, 13, 264–286. [Google Scholar] [CrossRef]
  47. Bourgeois, Q.; Ekman, A.; Igel, M.; Krejci, R. Ubiquity and Impact of Thin Mid-Level Clouds in the Tropics. Nat. Commun. 2016, 7, 12432. [Google Scholar] [CrossRef]
  48. Wu, S.; Luo, M.; Zhao, R.; Li, J.; Sun, P.; Liu, Z.; Wang, X.; Wang, P.; Zhang, H. Local Mechanisms for Global Daytime, Nighttime, and Compound Heatwaves. Npj Clim. Atmos. Sci. 2023, 6, 36. [Google Scholar] [CrossRef]
  49. Wang, P.; Yang, Y.; Xue, D.; Ren, L.; Tang, J.; Leung, L.R.; Liao, H. Aerosols Overtake Greenhouse Gases Causing a Warmer Climate and More Weather Extremes toward Carbon Neutrality. Nat. Commun. 2023, 14, 7257. [Google Scholar] [CrossRef]
  50. Rigden, A.J.; Li, D. Attribution of Surface Temperature Anomalies Induced by Land Use and Land Cover Changes. Geophys. Res. Lett. 2017, 44, 6814–6822. [Google Scholar] [CrossRef]
  51. Perkins, S.E. A Review on the Scientific Understanding of Heatwaves—Their Measurement, Driving Mechanisms, and Changes at the Global Scale. Atmos. Res. 2015, 164–165, 242–267. [Google Scholar] [CrossRef]
  52. Freychet, N.; Tett, S.; Wang, J.; Hegerl, G. Summer Heat Waves over Eastern China: Dynamical Processes and Trend Attribution. Environ. Res. Lett. 2017, 12, 024015. [Google Scholar] [CrossRef]
  53. Deng, K.; Ting, M.; Yang, S.; Tan, Y. Increased Frequency of Summer Extreme Heat Waves over Texas Area Tied to the Amplification of Pacific Zonal SST Gradient. J. Clim. 2018, 31, 5629–5647. [Google Scholar] [CrossRef]
  54. Wang, K.; Wan, Z.; Wang, P.; Sparrow, M.; Liu, J.; Zhou, X.; Haginoya, S.; Wang, C. Estimation of Surface Long Wave Radiation and Broadband Emissivity Using Moderate Resolution Imaging Spectroradiometer (MODIS) Land Surface Temperature//Emissivity Products. J. Geophys. Res. 2005, 110, D11109. [Google Scholar] [CrossRef]
  55. Damour, G.; Simonneau, T.; Cochard, H.; Urban, L. An Overview of Models of Stomatal Conductance at the Leaf Level. Plant Cell Environ. 2010, 33, 1419–1438. [Google Scholar] [CrossRef]
  56. Jones, H.G. Plants and Microclimate: A Quantitative Approach to Environmental Plant Physiology, 3rd ed.; Cambridge University Press: Cambridge, UK, 2013; p. 407. [Google Scholar]
  57. Guo, S.; Zhixiang, W.; Liu, W.; Sun, Z.; Wu, L.; Fang, M.; Peng, W. Attribution Analysis of Water Use Efficiency in Tropical Rubber Plantations during Drought-Monsoon Season Transition. Front. For. Glob. Change 2023, 6, 1208595. [Google Scholar] [CrossRef]
  58. Tan, Z.; Zhang, Y.; Song, Q.; Liu, W.-J.; Deng, X.-B.; Tang, J.-W.; Deng, Y.; Zhou, W.; Yang, L.-Y.; Yu, G.-R.; et al. Rubber Plantations Act as Water Pumps in Tropical China. Geophys. Res. Lett. 2011, 38, 24406. [Google Scholar] [CrossRef]
  59. Ghausi, S.A.; Tian, Y.; Zehe, E.; Kleidon, A. Radiative Controls by Clouds and Thermodynamics Shape Surface Temperatures and Turbulent Fluxes over Land. Proc. Natl. Acad. Sci. USA 2023, 120, e2220400120. [Google Scholar] [CrossRef]
  60. Teuling, A.J.; Seneviratne, S.I.; Stöckli, R.; Reichstein, M.; Moors, E.; Ciais, P.; Luyssaert, S.; van den Hurk, B.; Ammann, C.; Bernhofer, C.; et al. Contrasting Response of European Forest and Grassland Energy Exchange to Heatwaves. Nat. Geosci. 2010, 3, 722–727. [Google Scholar] [CrossRef]
  61. Giambelluca, T.W.; Mudd, R.G.; Liu, W.; Ziegler, A.D.; Kobayashi, N.; Kumagai, T.; Miyazawa, Y.; Lim, T.K.; Huang, M.; Fox, J.; et al. Evapotranspiration of Rubber (Hevea brasiliensis) Cultivated at Two Plantation Sites in Southeast Asia. Water Resour. Res. 2016, 52, 660–679. [Google Scholar] [CrossRef]
Figure 1. Location of DZ sites.
Water 16 00752 g001
Figure 2. Division of HW for the 1–15 July 2010, period.
Water 16 00752 g002
Figure 3. The (a) annual and (b) monthly distribution of HW and non-HW LSTs in DZ; (c) difference between HW and non-HW LST in DZ.
Water 16 00752 g003
Figure 4. The diurnal cycles of (a) latent heat flux (LE), (b) sensible heat flux, (c) incoming shortwave radiation, (d) outgoing shortwave radiation, (e) incoming longwave radiation, and (f) outgoing longwave radiation under HW and non-HW conditions.
Water 16 00752 g004
Figure 5. Attribution results for LST changes between HW and non-HW periods over DZ sites. Part I: Comparison of observed and modeled T s changes. Δ T s and Δ T s m represents the observed and modeled land surface temperature changes from non-HW to HW. Part II: Comparison of the total contribution of atmospheric ( f a ) and land surface factors ( f b ). Part III: Contribution from each atmospheric (blue bar) and land surface (purple bar) factor. T a , R H , R n * , Press , G , r s , r a represent the contributions of air temperature, relative humidity, radiation, atmospheric pressure, soil heat flux, surface resistance, and aerodynamic resistance, respectively.
Water 16 00752 g005
Figure 6. (a) Same as in Figure 5 but decomposing Rn* into incoming shortwave radiation (Sin), incoming longwave radiation (Lin), albedo (α), and air temperature (Ta). (b) The contribution of Rn* and its decomposed variable to LST change.
Water 16 00752 g006
Table 1. Sensitivities of LST to changes in driving factors.
Ts T a
( K 1 )
Ts RH
( % 1 )
Ts R n *
( m 2 /W)
Ts Press
( kPa 1 )
Ts G
( m 2 /W)
Ts r s
(m/s)
Ts r a
(m/s)
−0.77990.54670.17030.2199−0.17030.0811−0.1929
Table 2. Changes in driving factors from non-HW to HW periods.
T a
(K)
RH
(%)
R n *
( W / m 2 )
Press
(kPa)
G
( W / m 2 )
r s
(s/m)
r a
(s/m)
6.1082−10.718686.3368−0.17985.331929.85811.1844
Disclaimer/Publisher’s Note: The statements, opinions and data contained in all publications are solely those of the individual author(s) and contributor(s) and not of MDPI and/or the editor(s). MDPI and/or the editor(s) disclaim responsibility for any injury to people or property resulting from any ideas, methods, instructions or products referred to in the content.

