
Dynamic Simulation of Land Use and Habitat Quality Assessment in Baiyangdian Basin Using the SD-PLUS Coupled Model

 ,
, 
Abstract
1. Introduction
2. Data and Methods
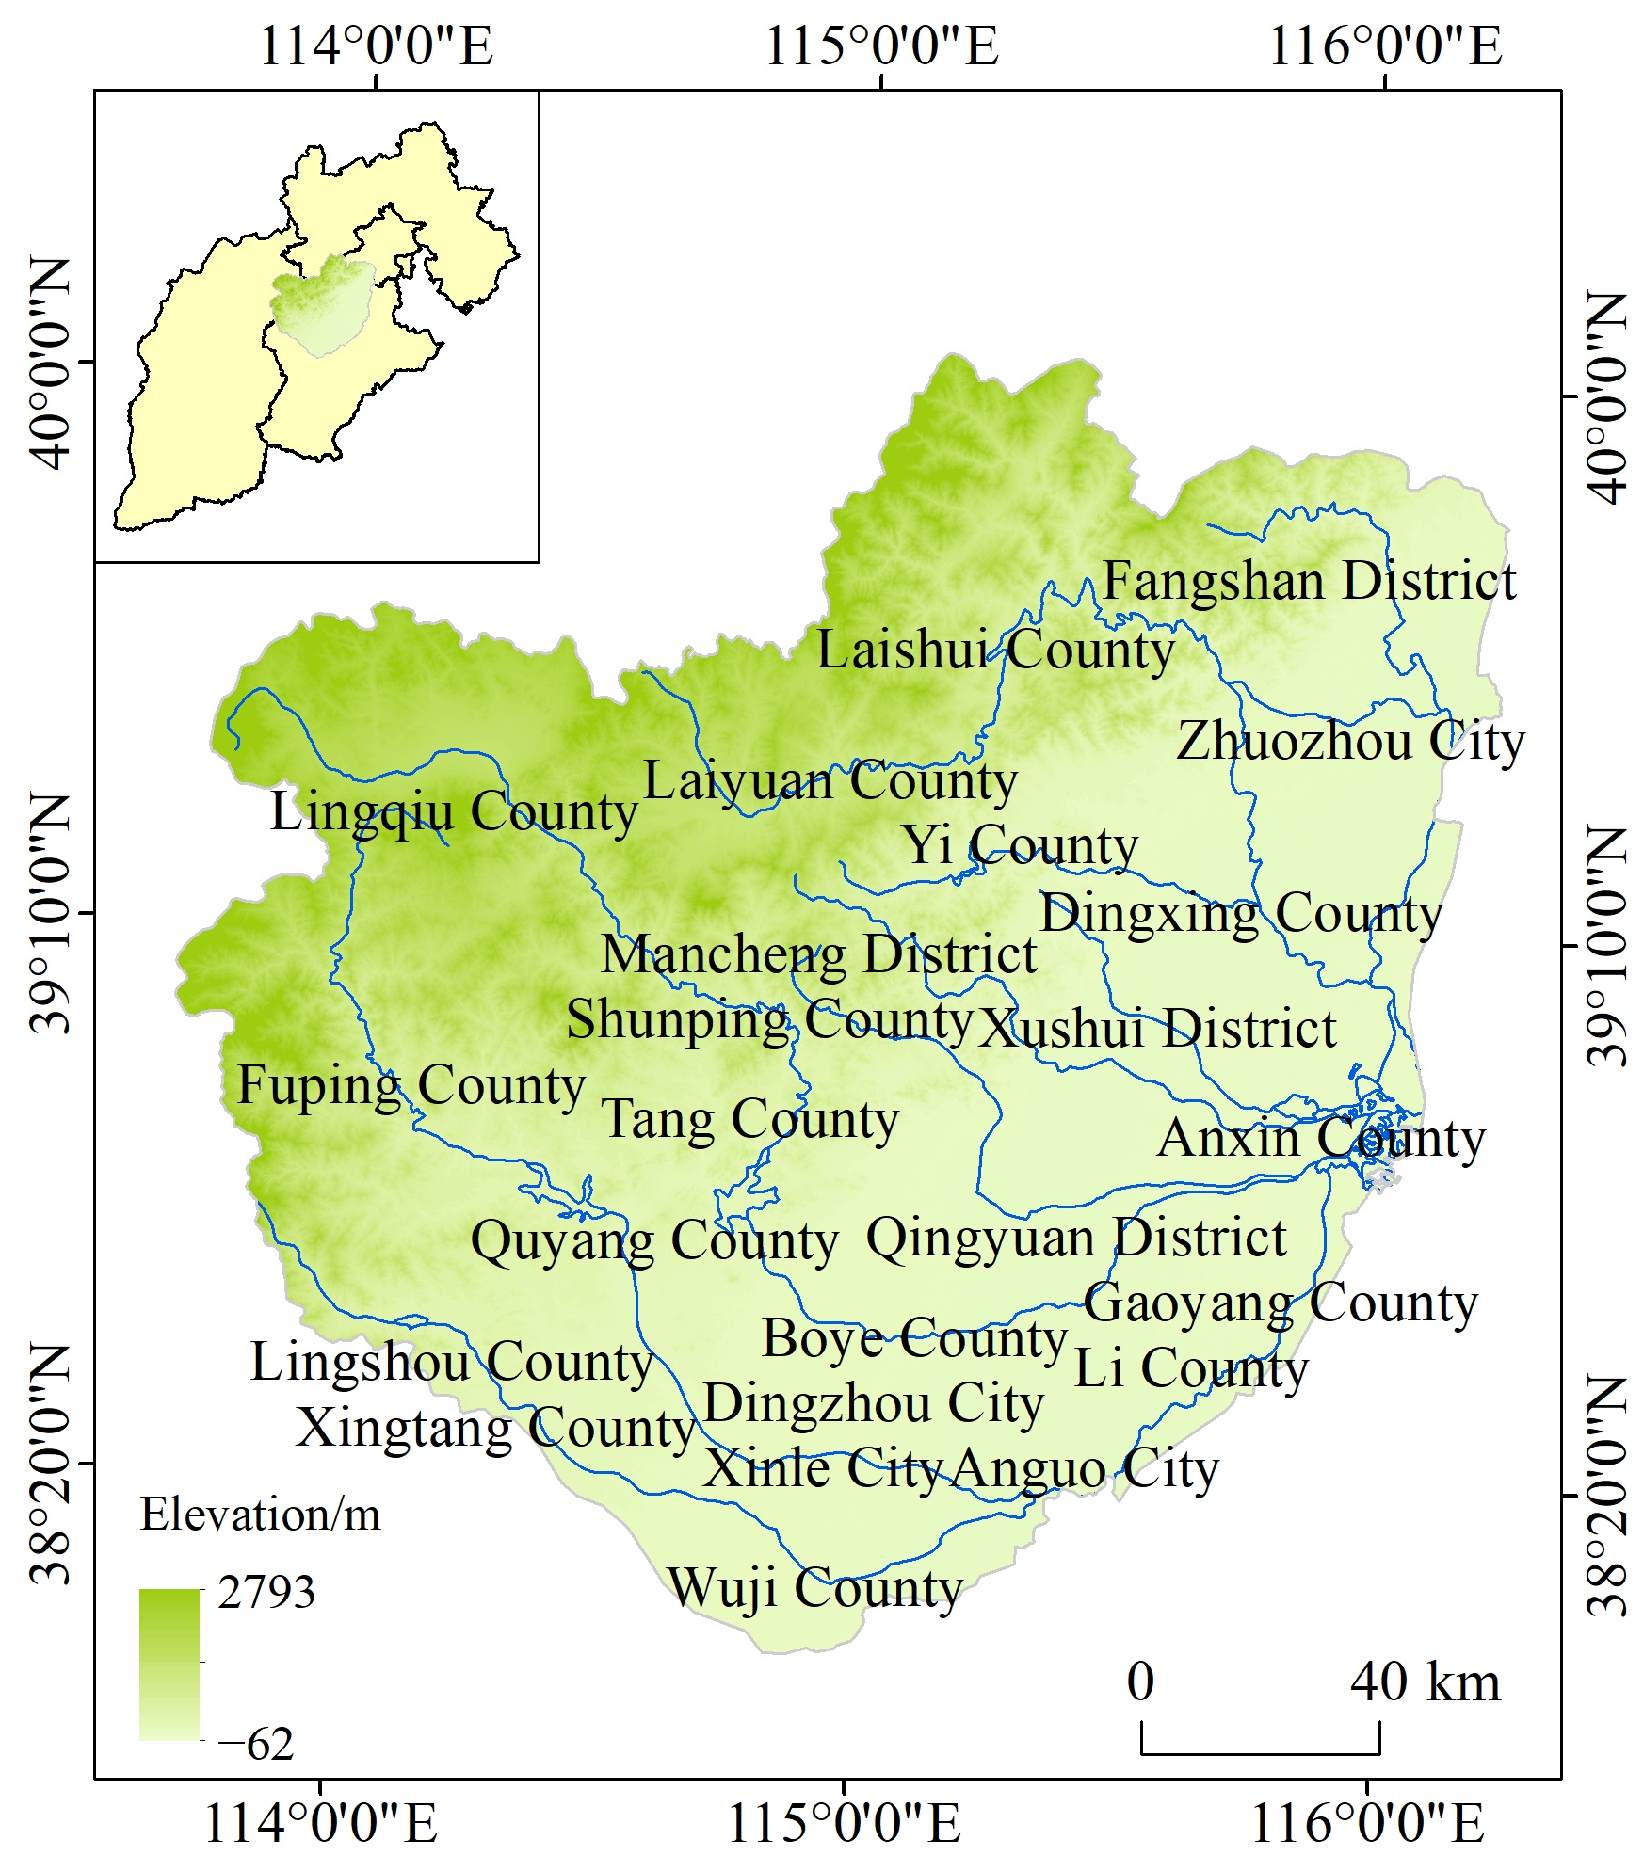
2.1. Study Area
2.2. Data Sources
2.3. Models and Methods
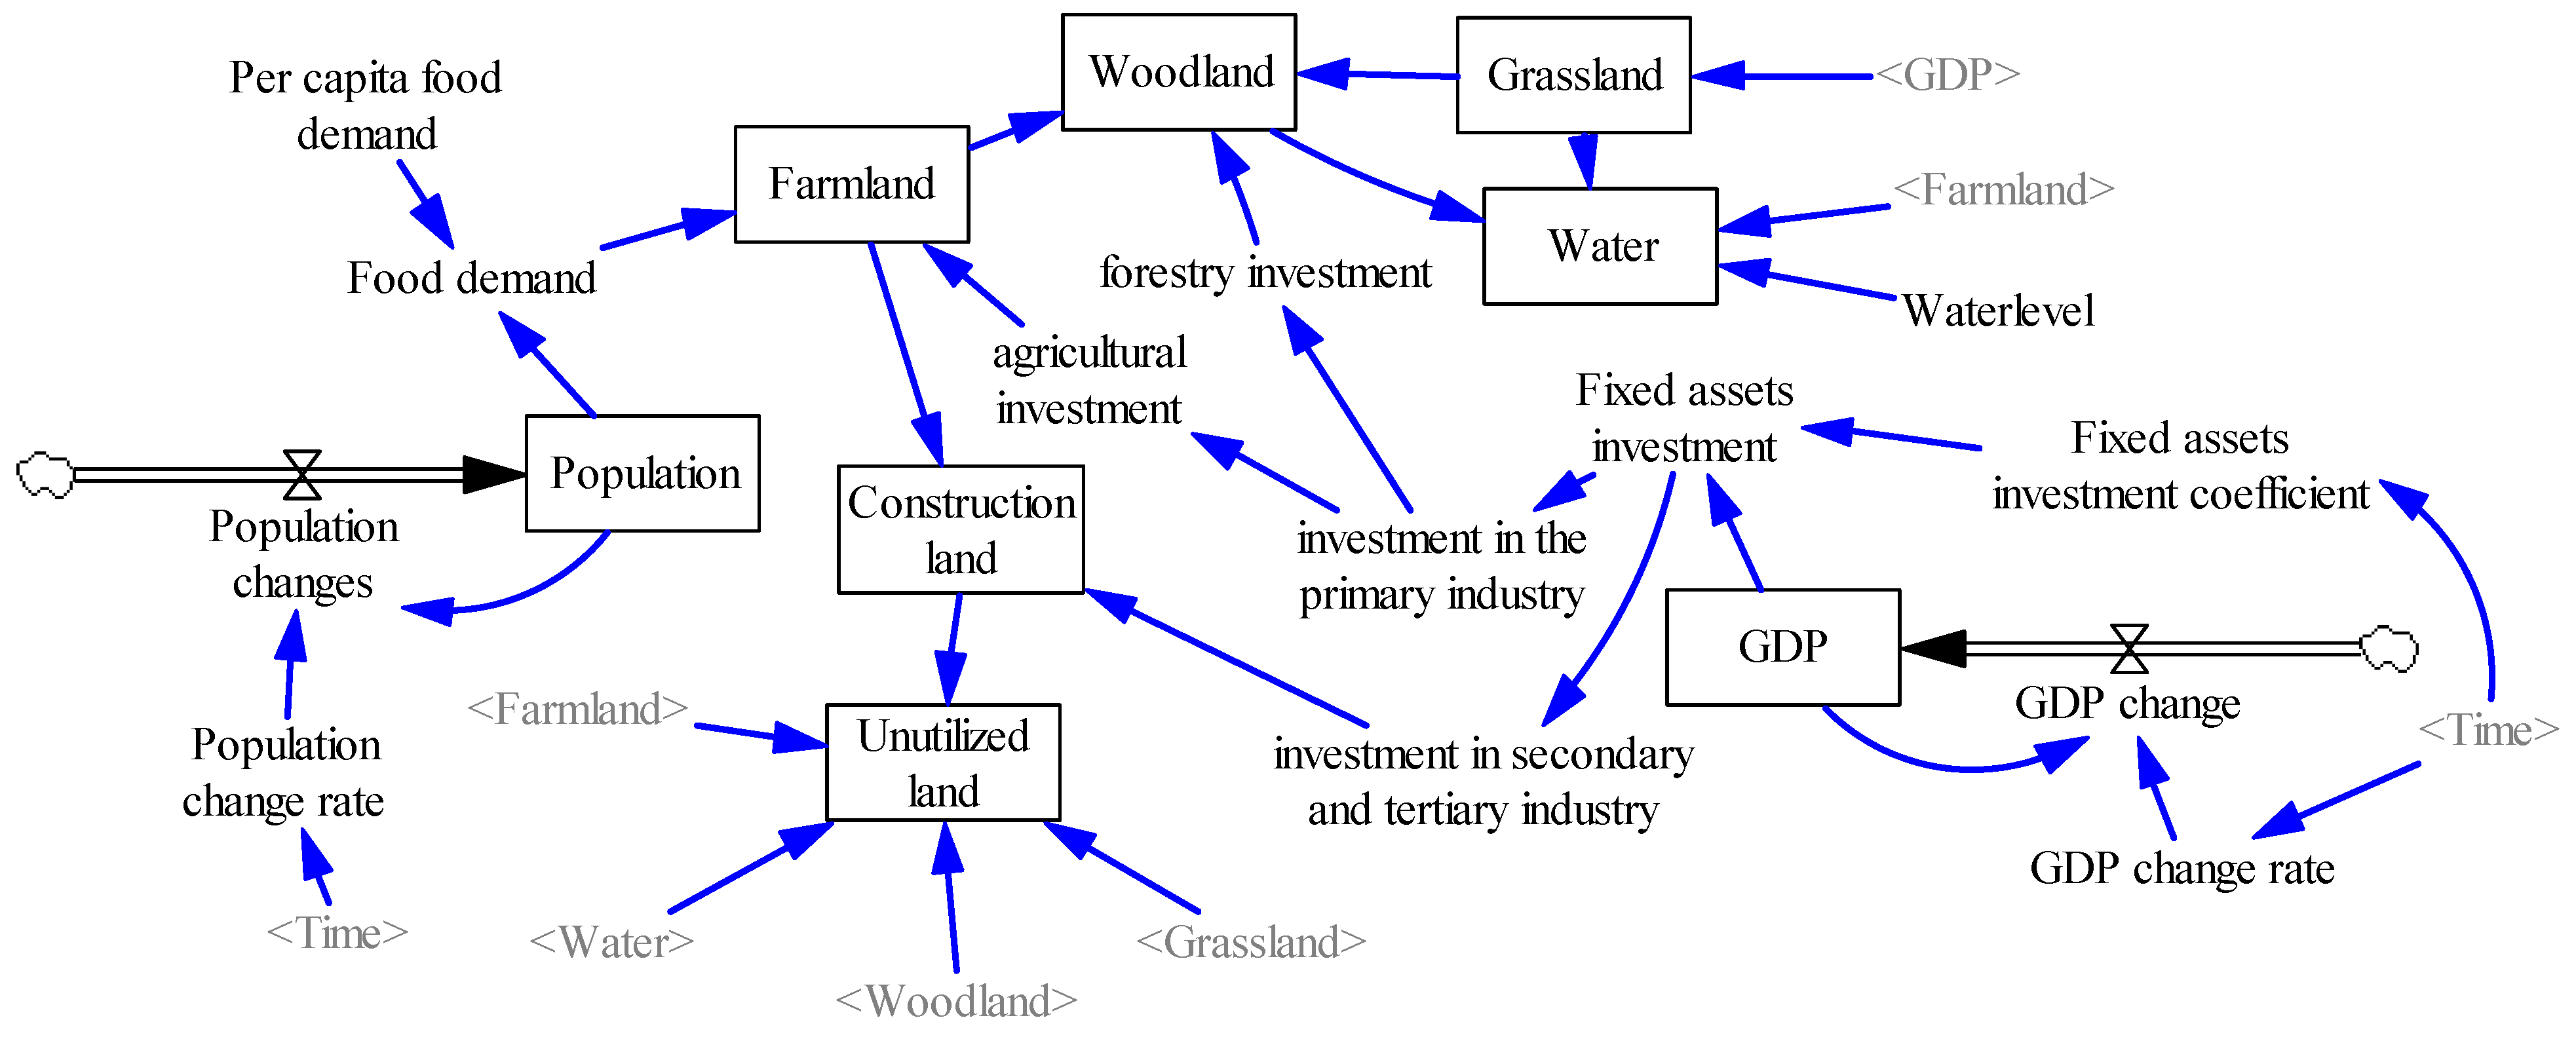
2.3.1. LUCC Future Scenario Demand Prediction Based on SD Model
2.3.2. Introduction of InVEST Model
3. Results
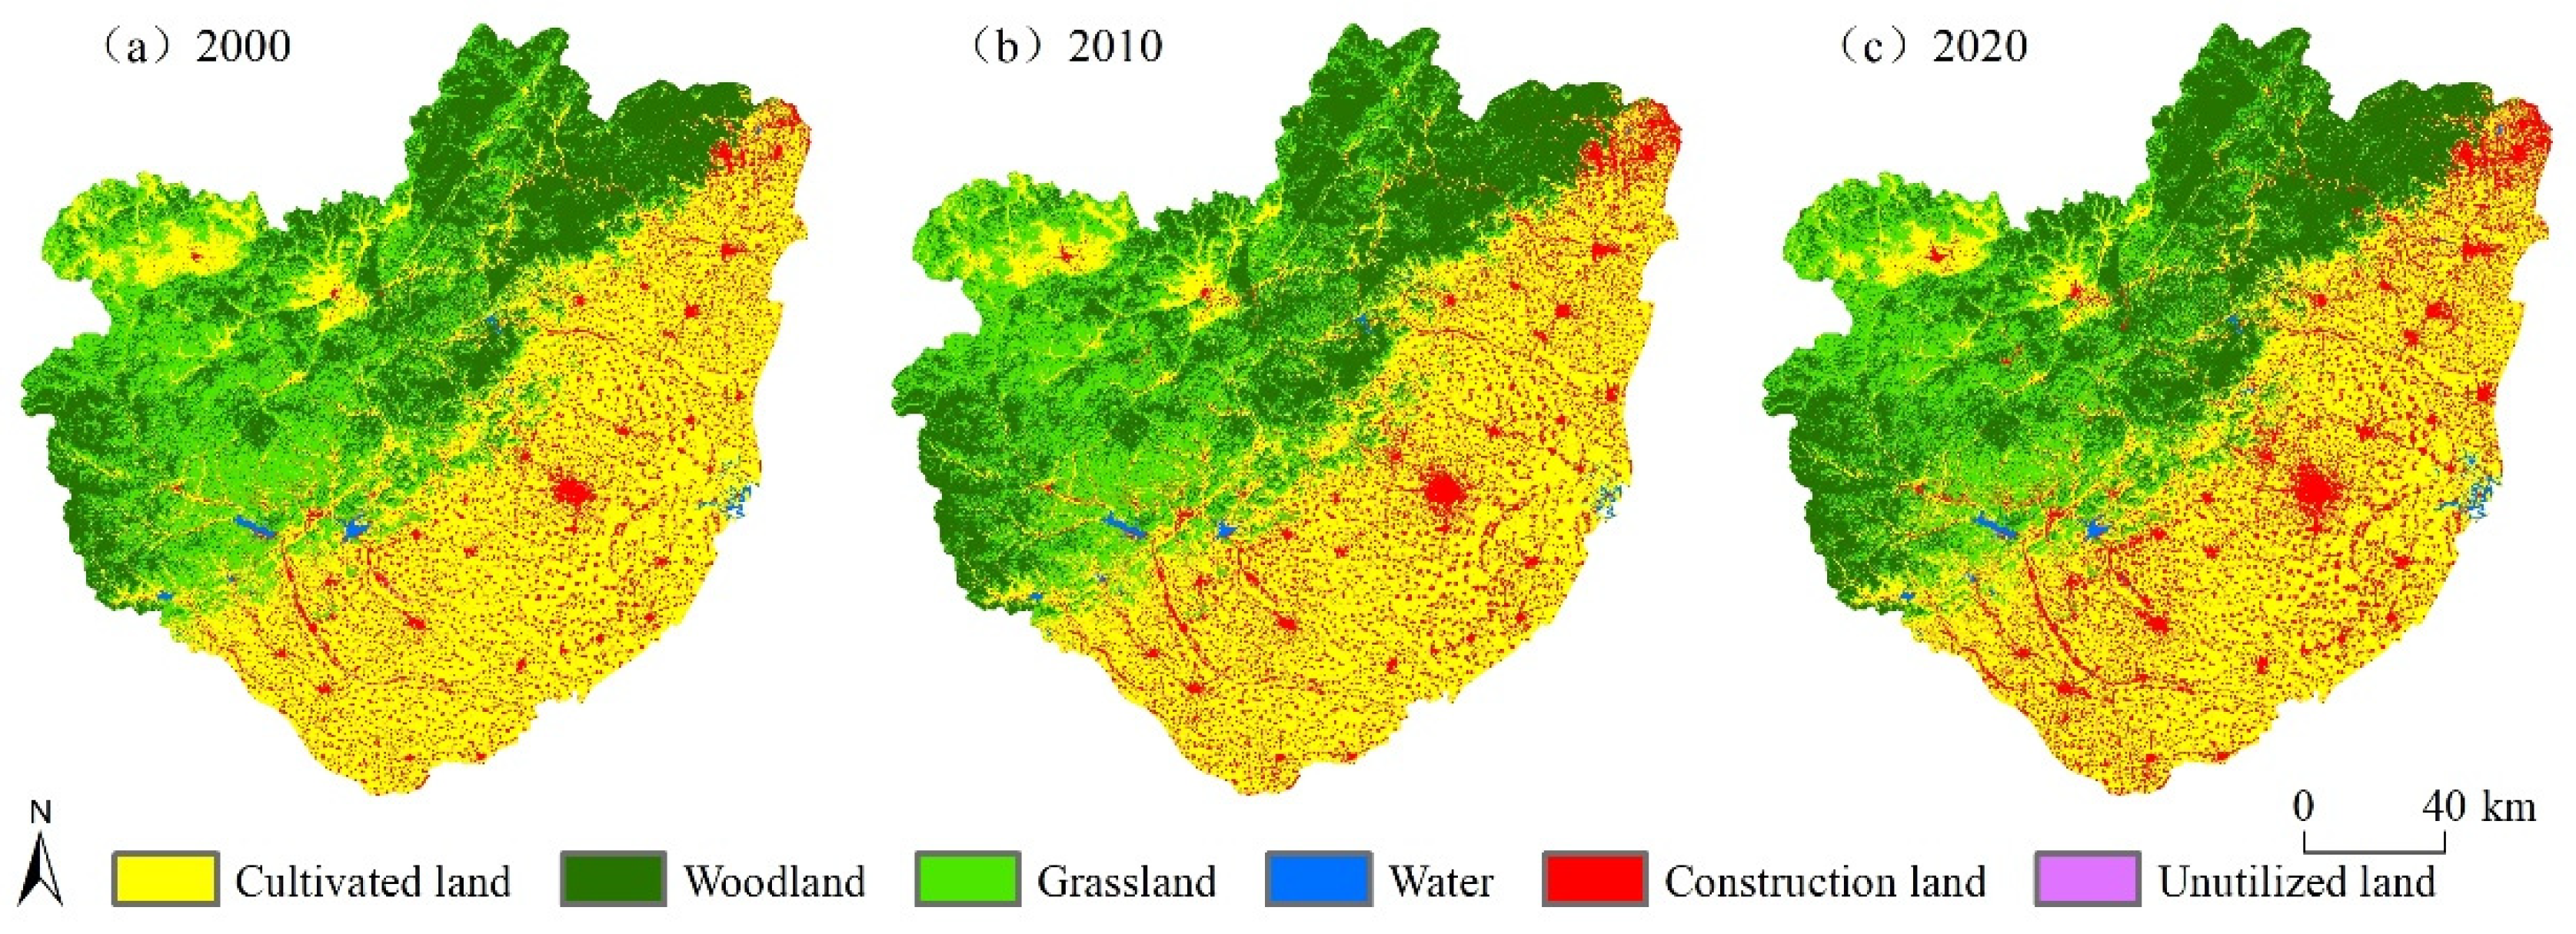
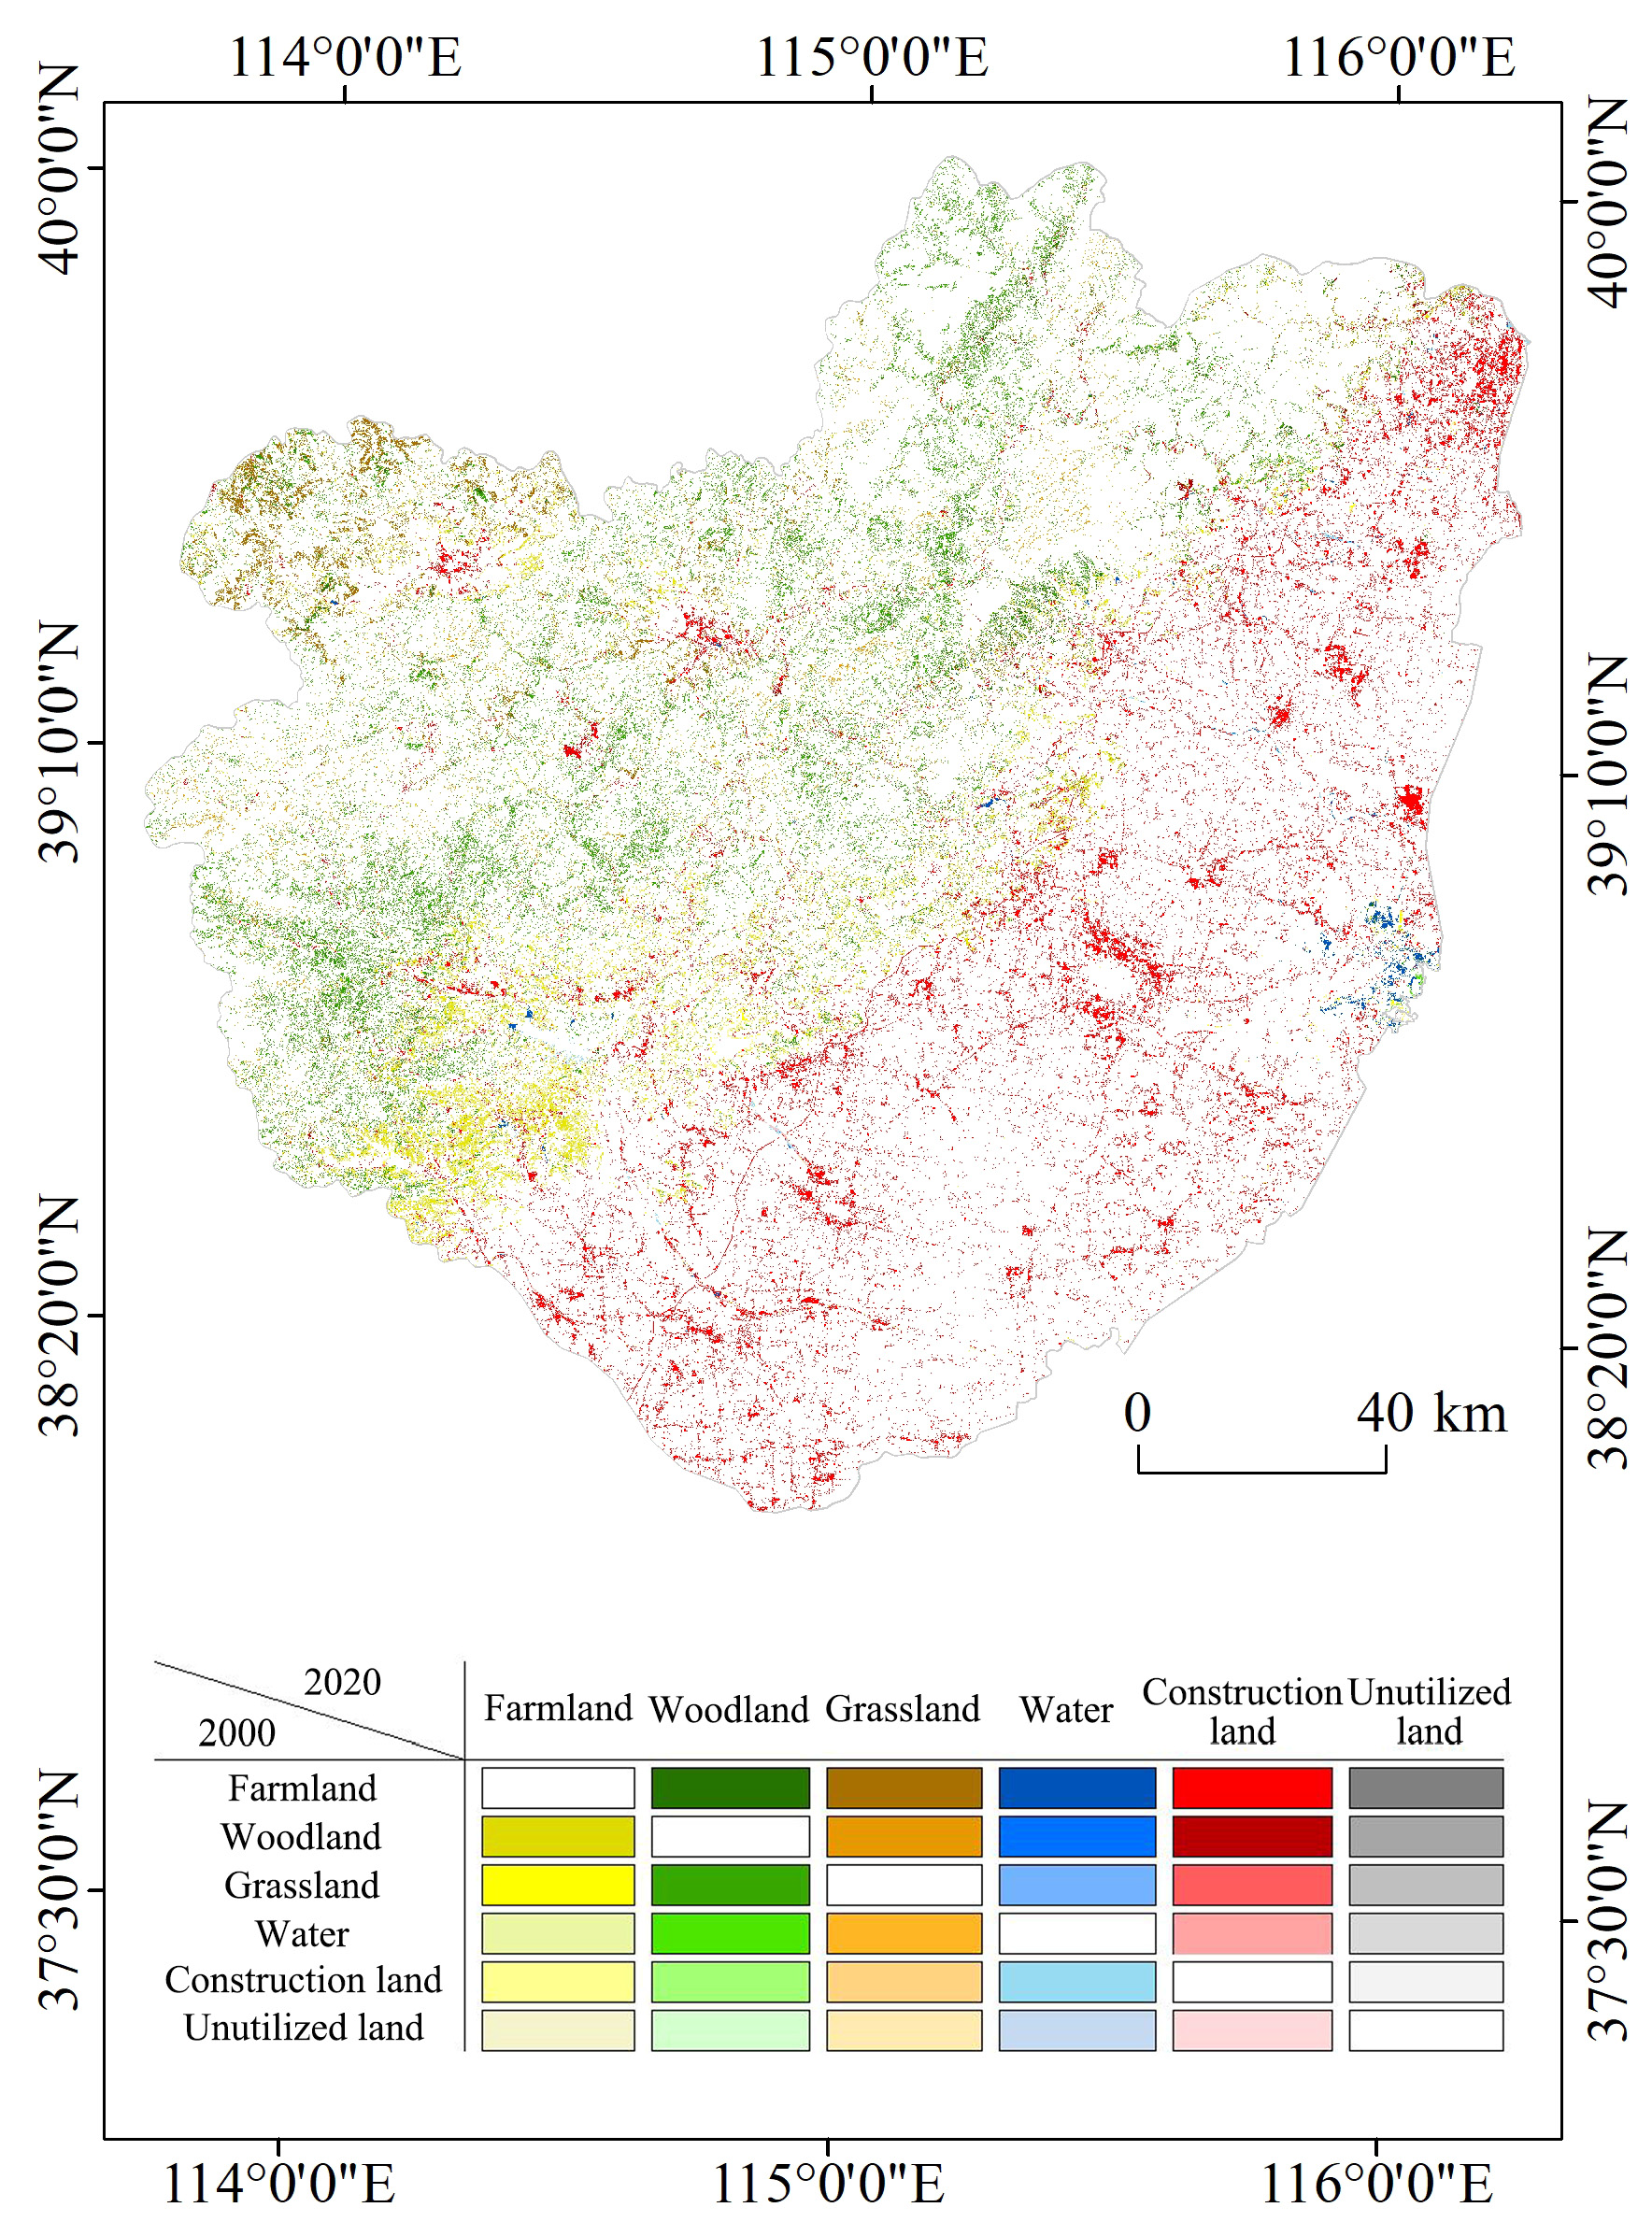
3.1. Spatial and Temporal Changes of Land Use from 2000 to 2020
3.2. Spatial and Temporal Characteristics of Habitat Quality from 2000 to 2020
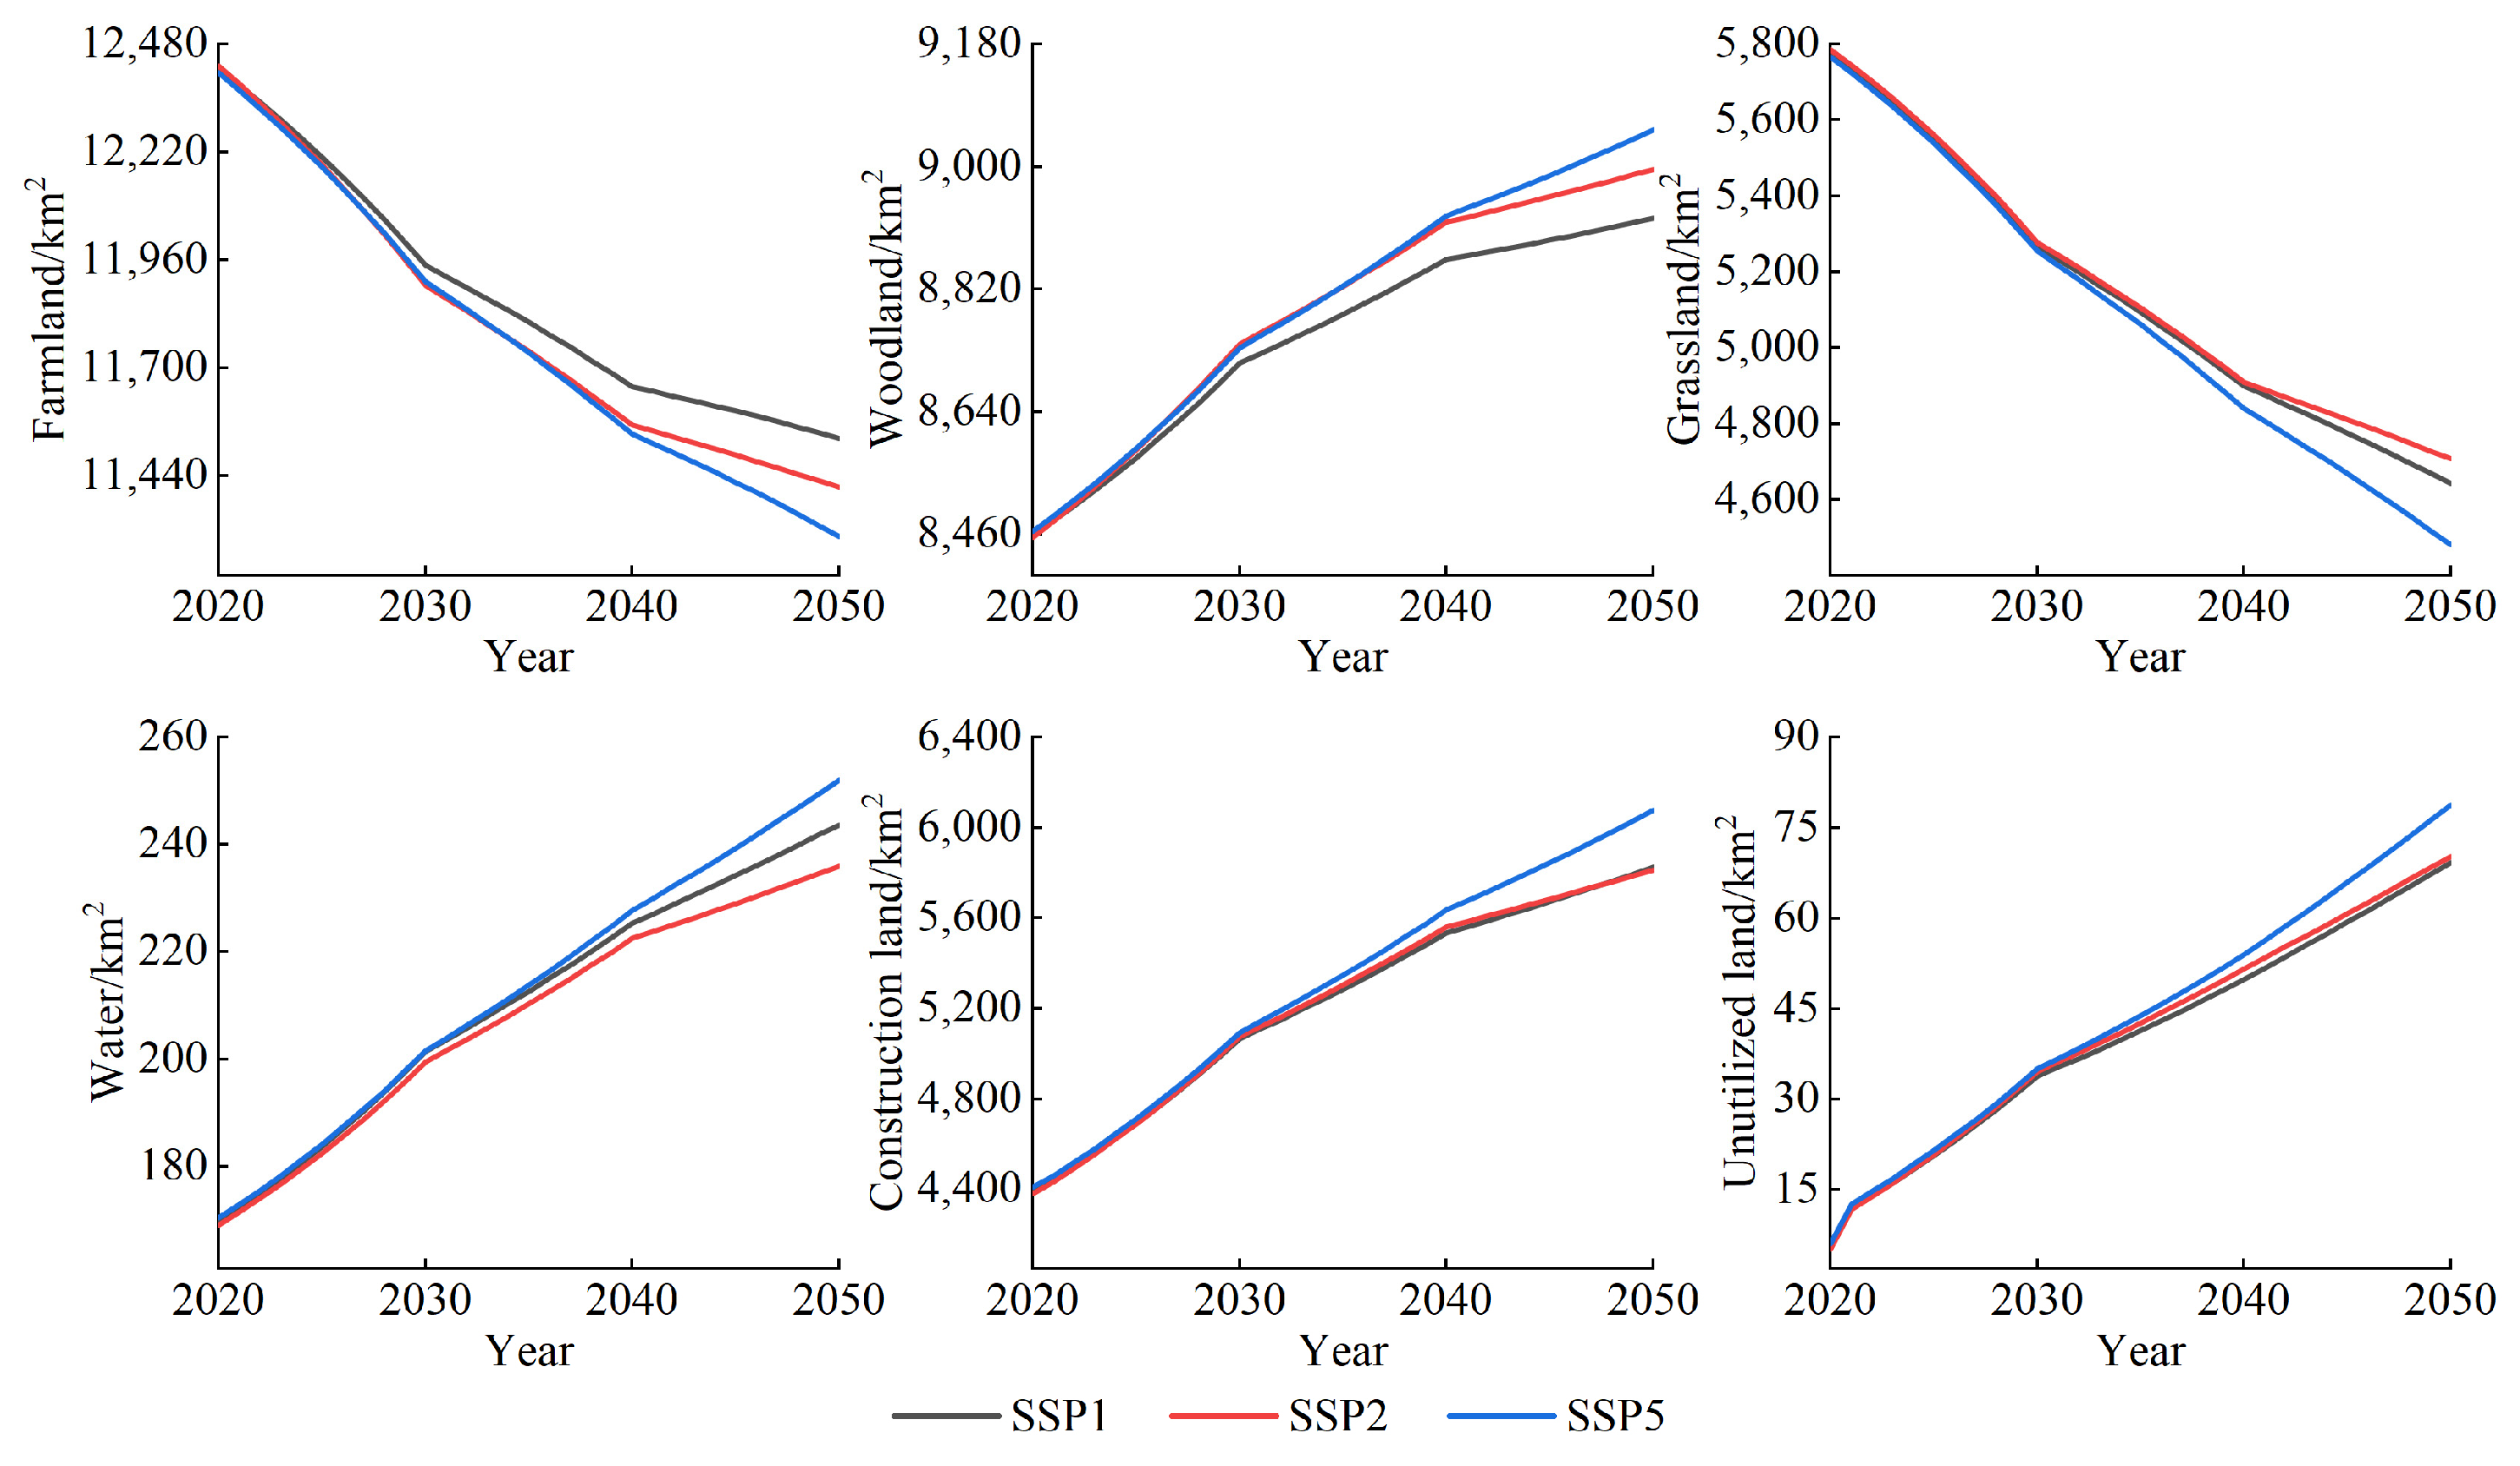
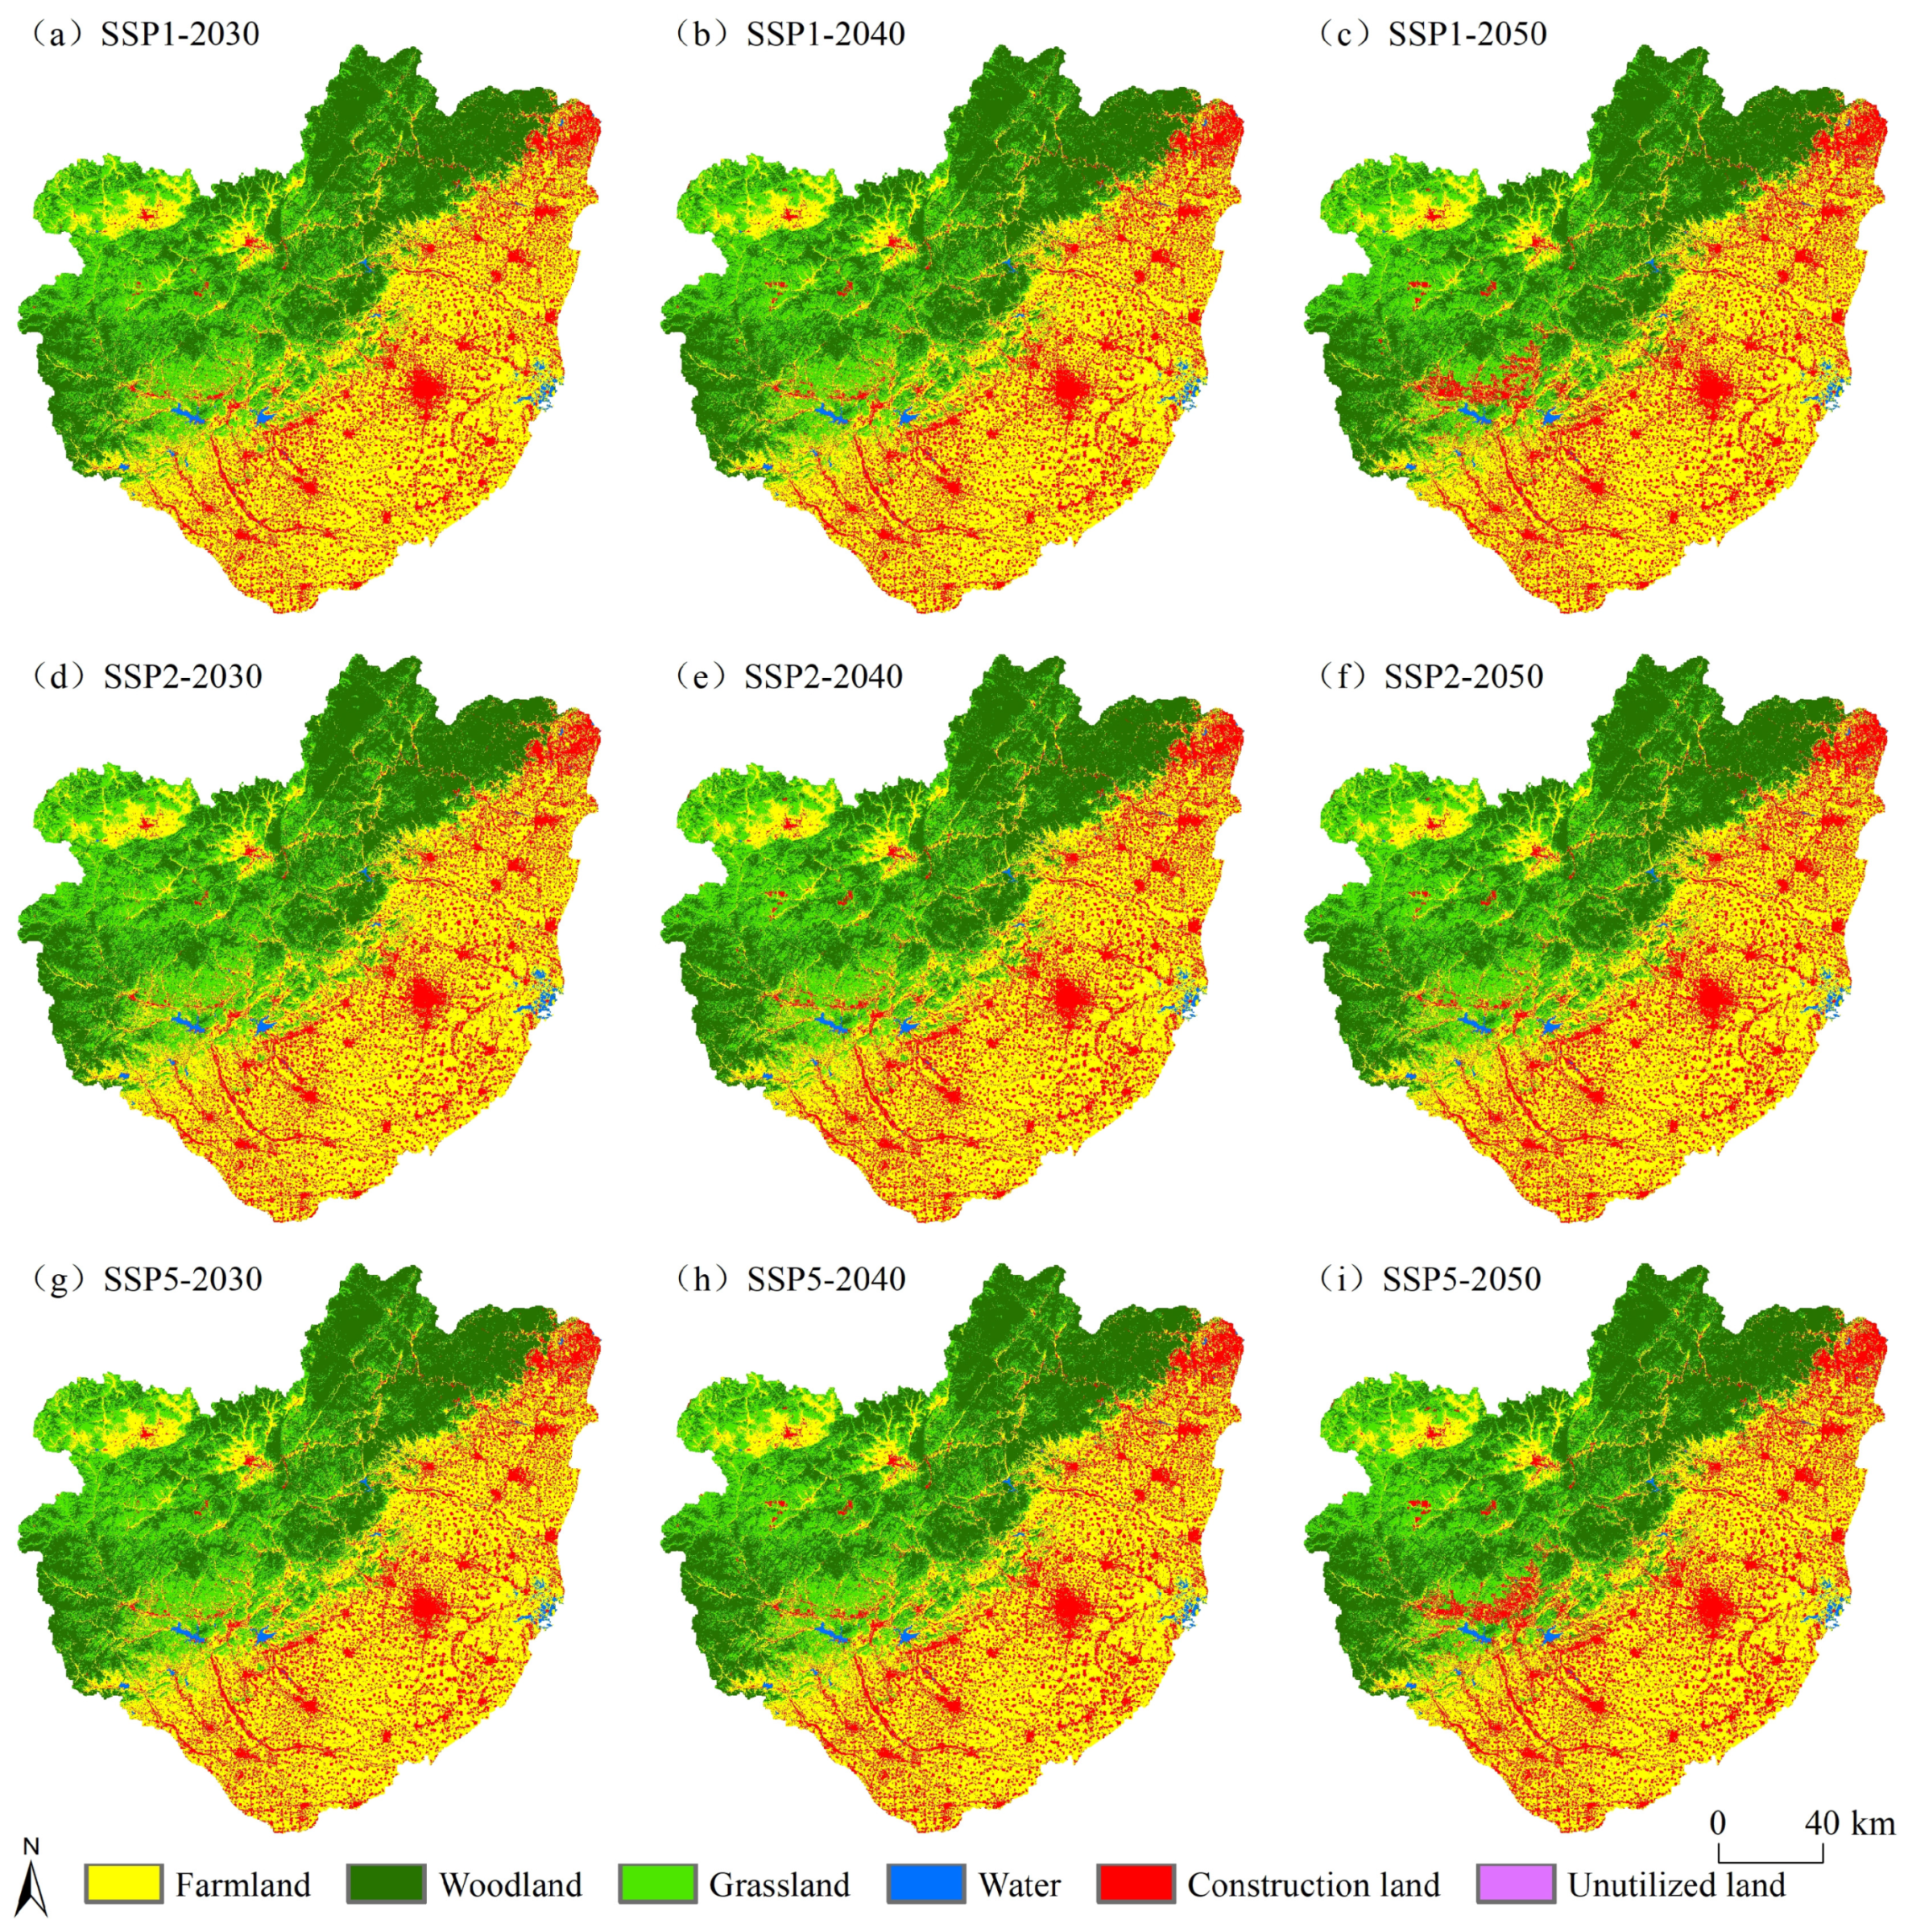
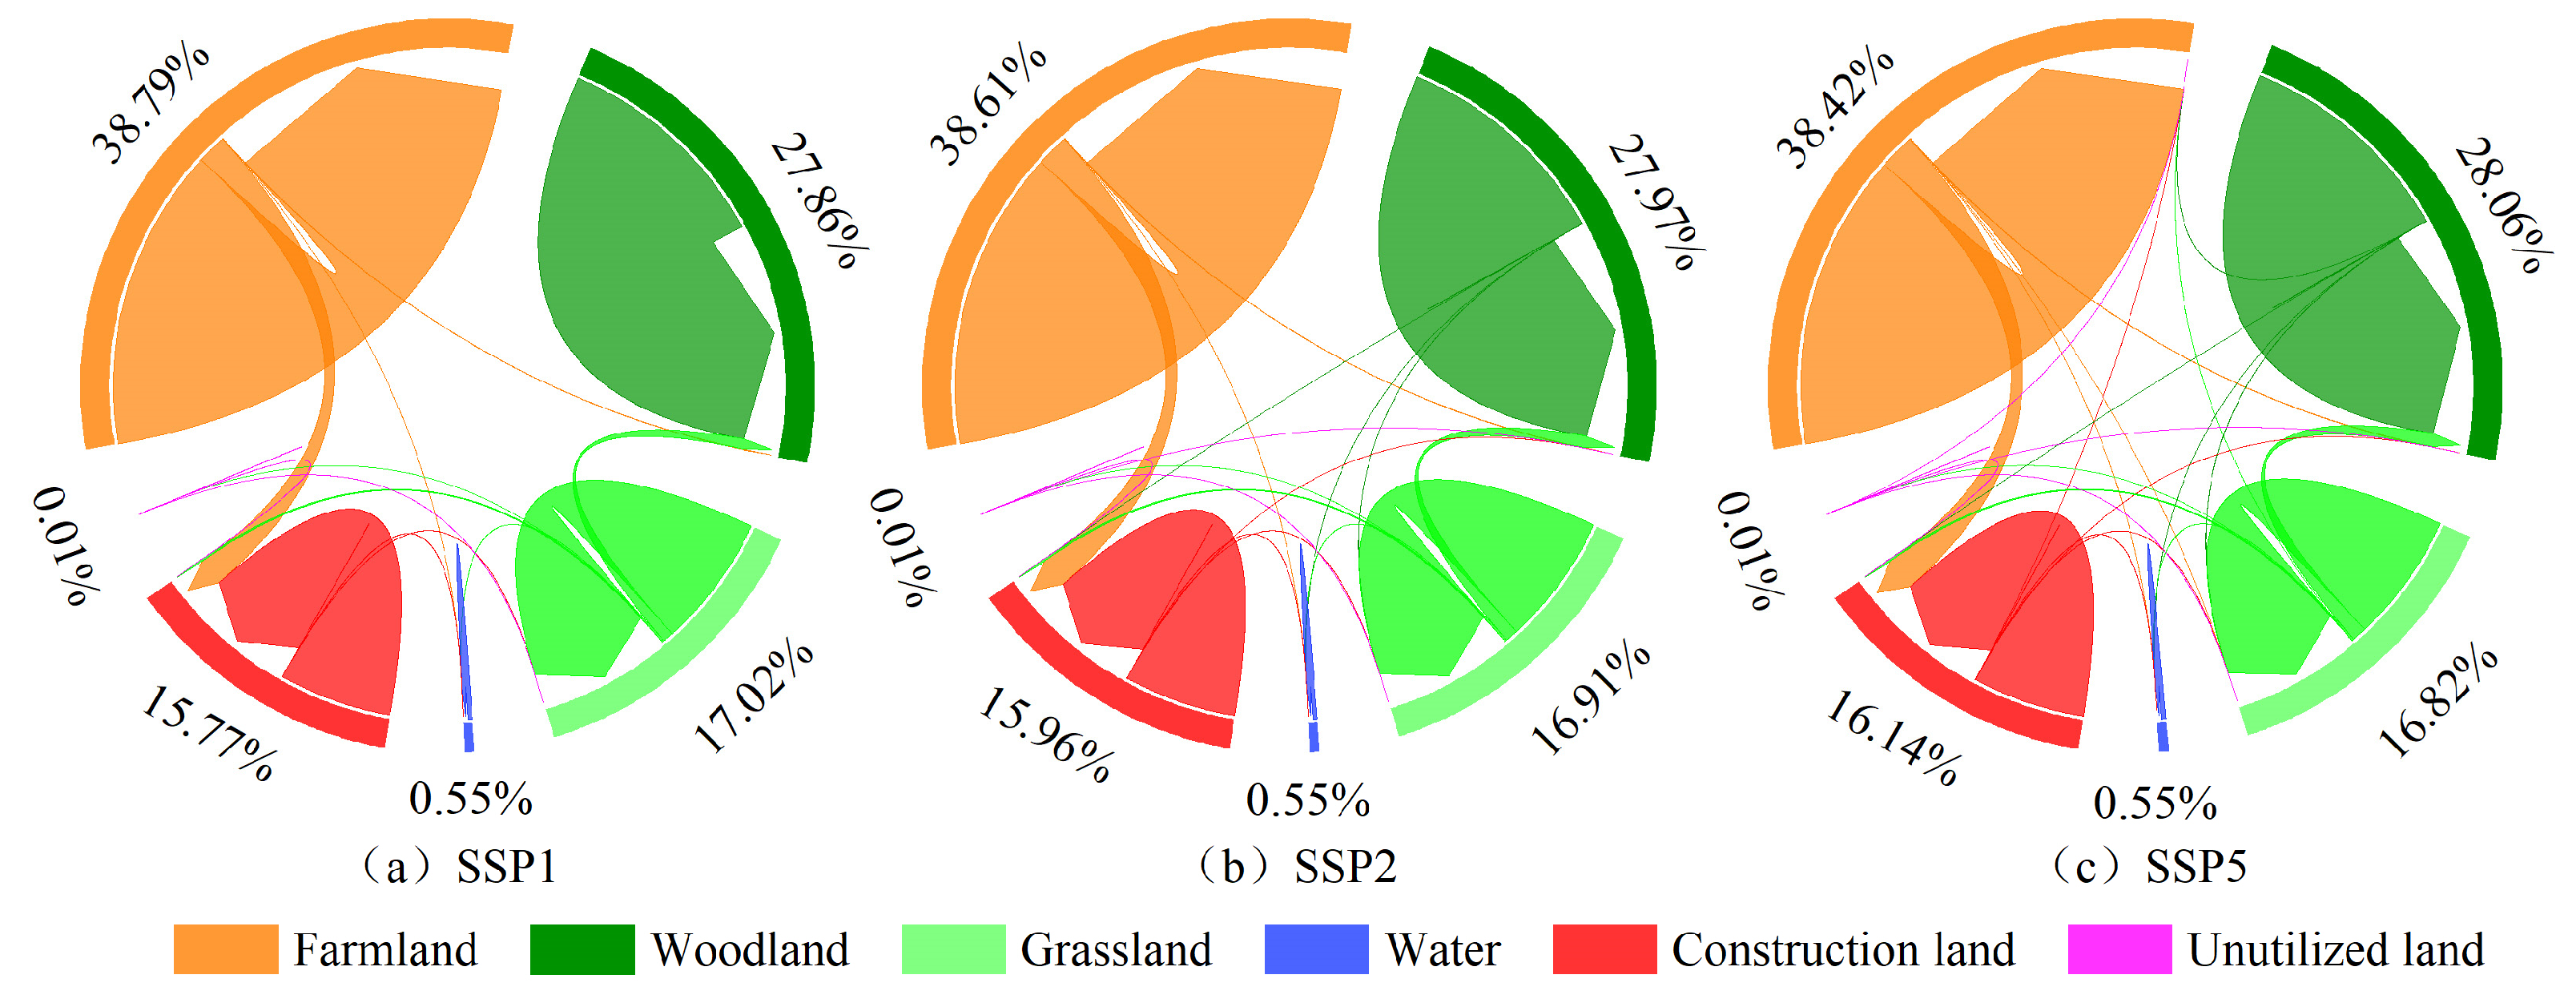
3.3. LUCC Prediction under SSPs Scenario Based on SD-PLUS Coupling Model
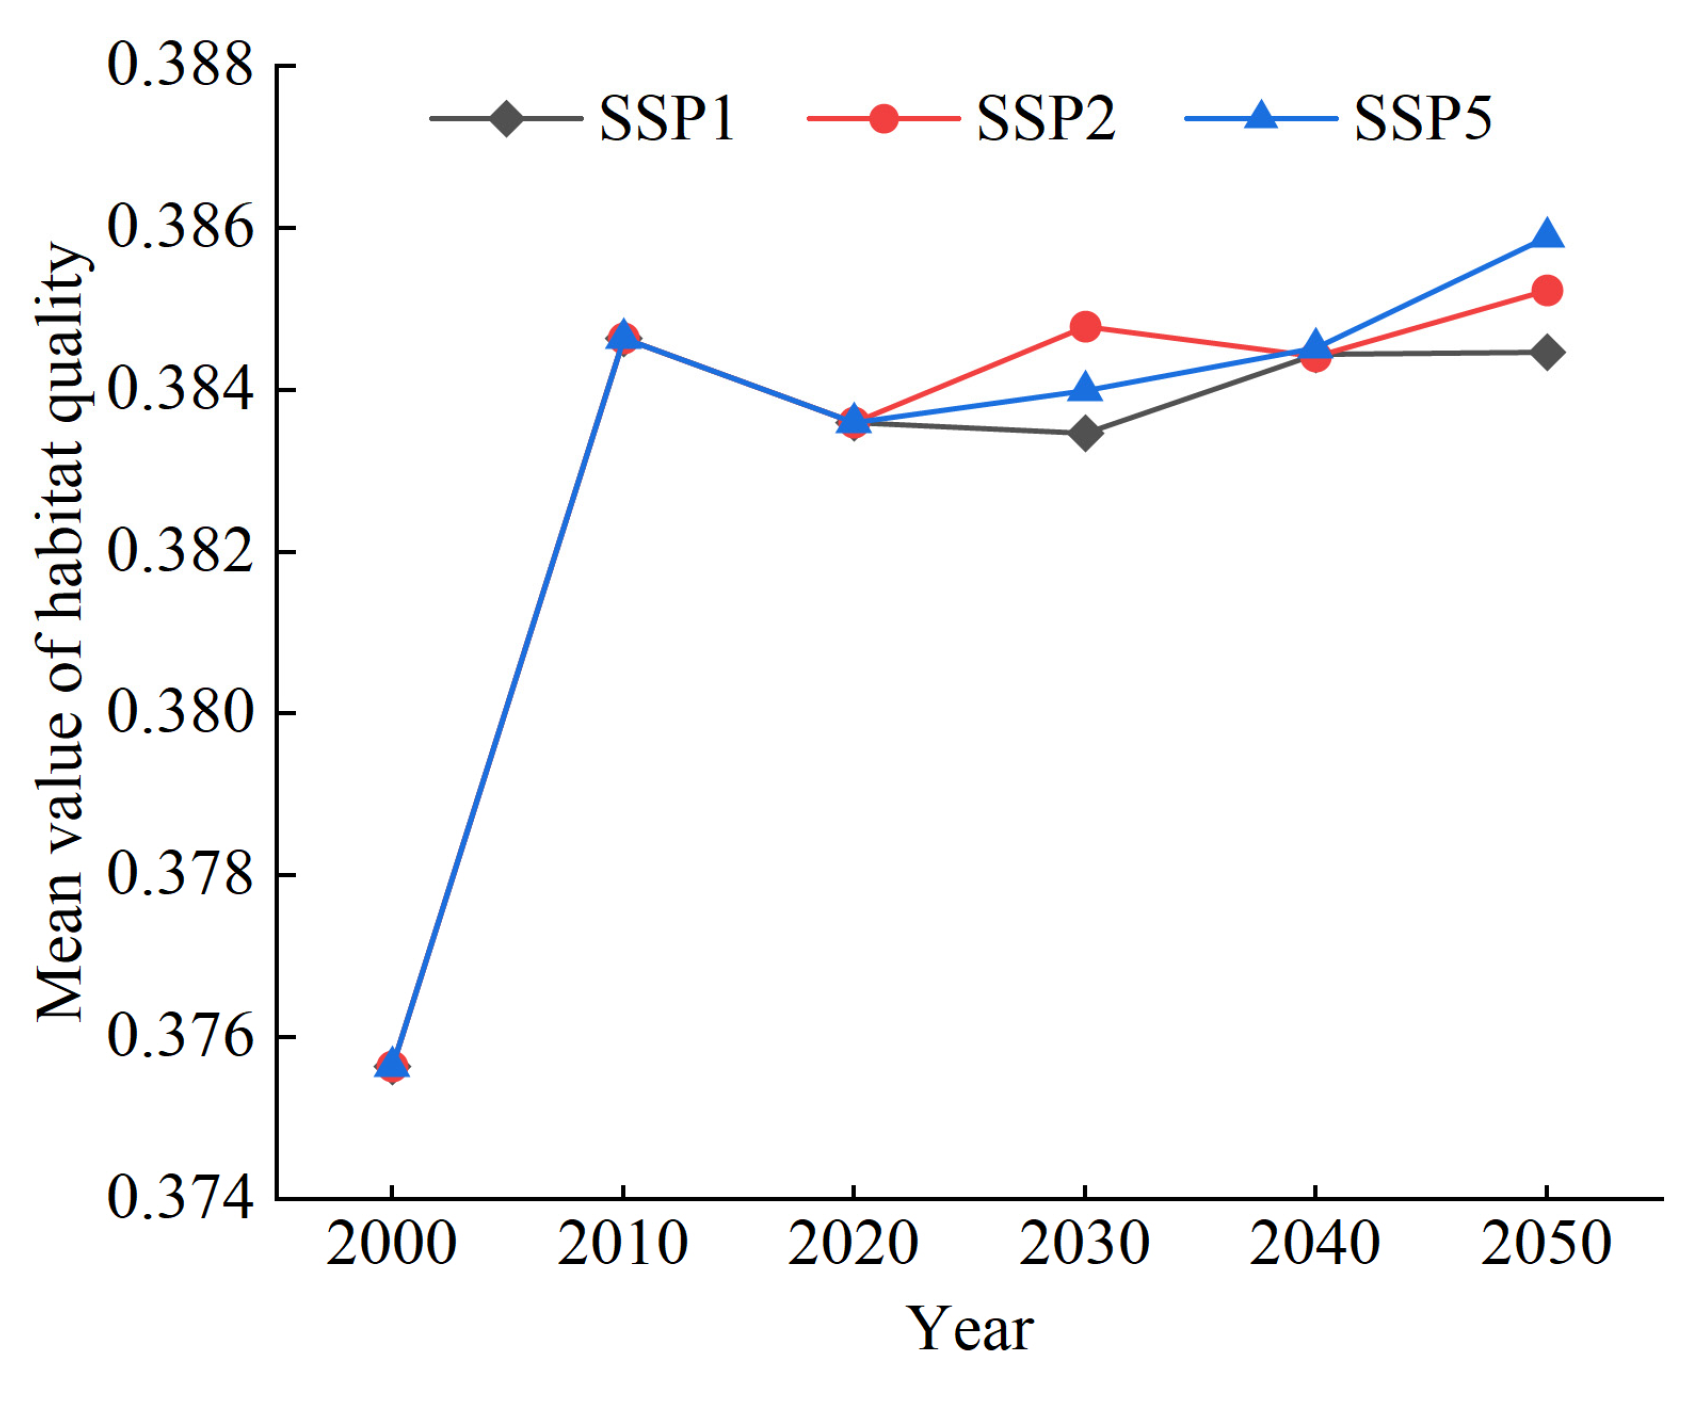
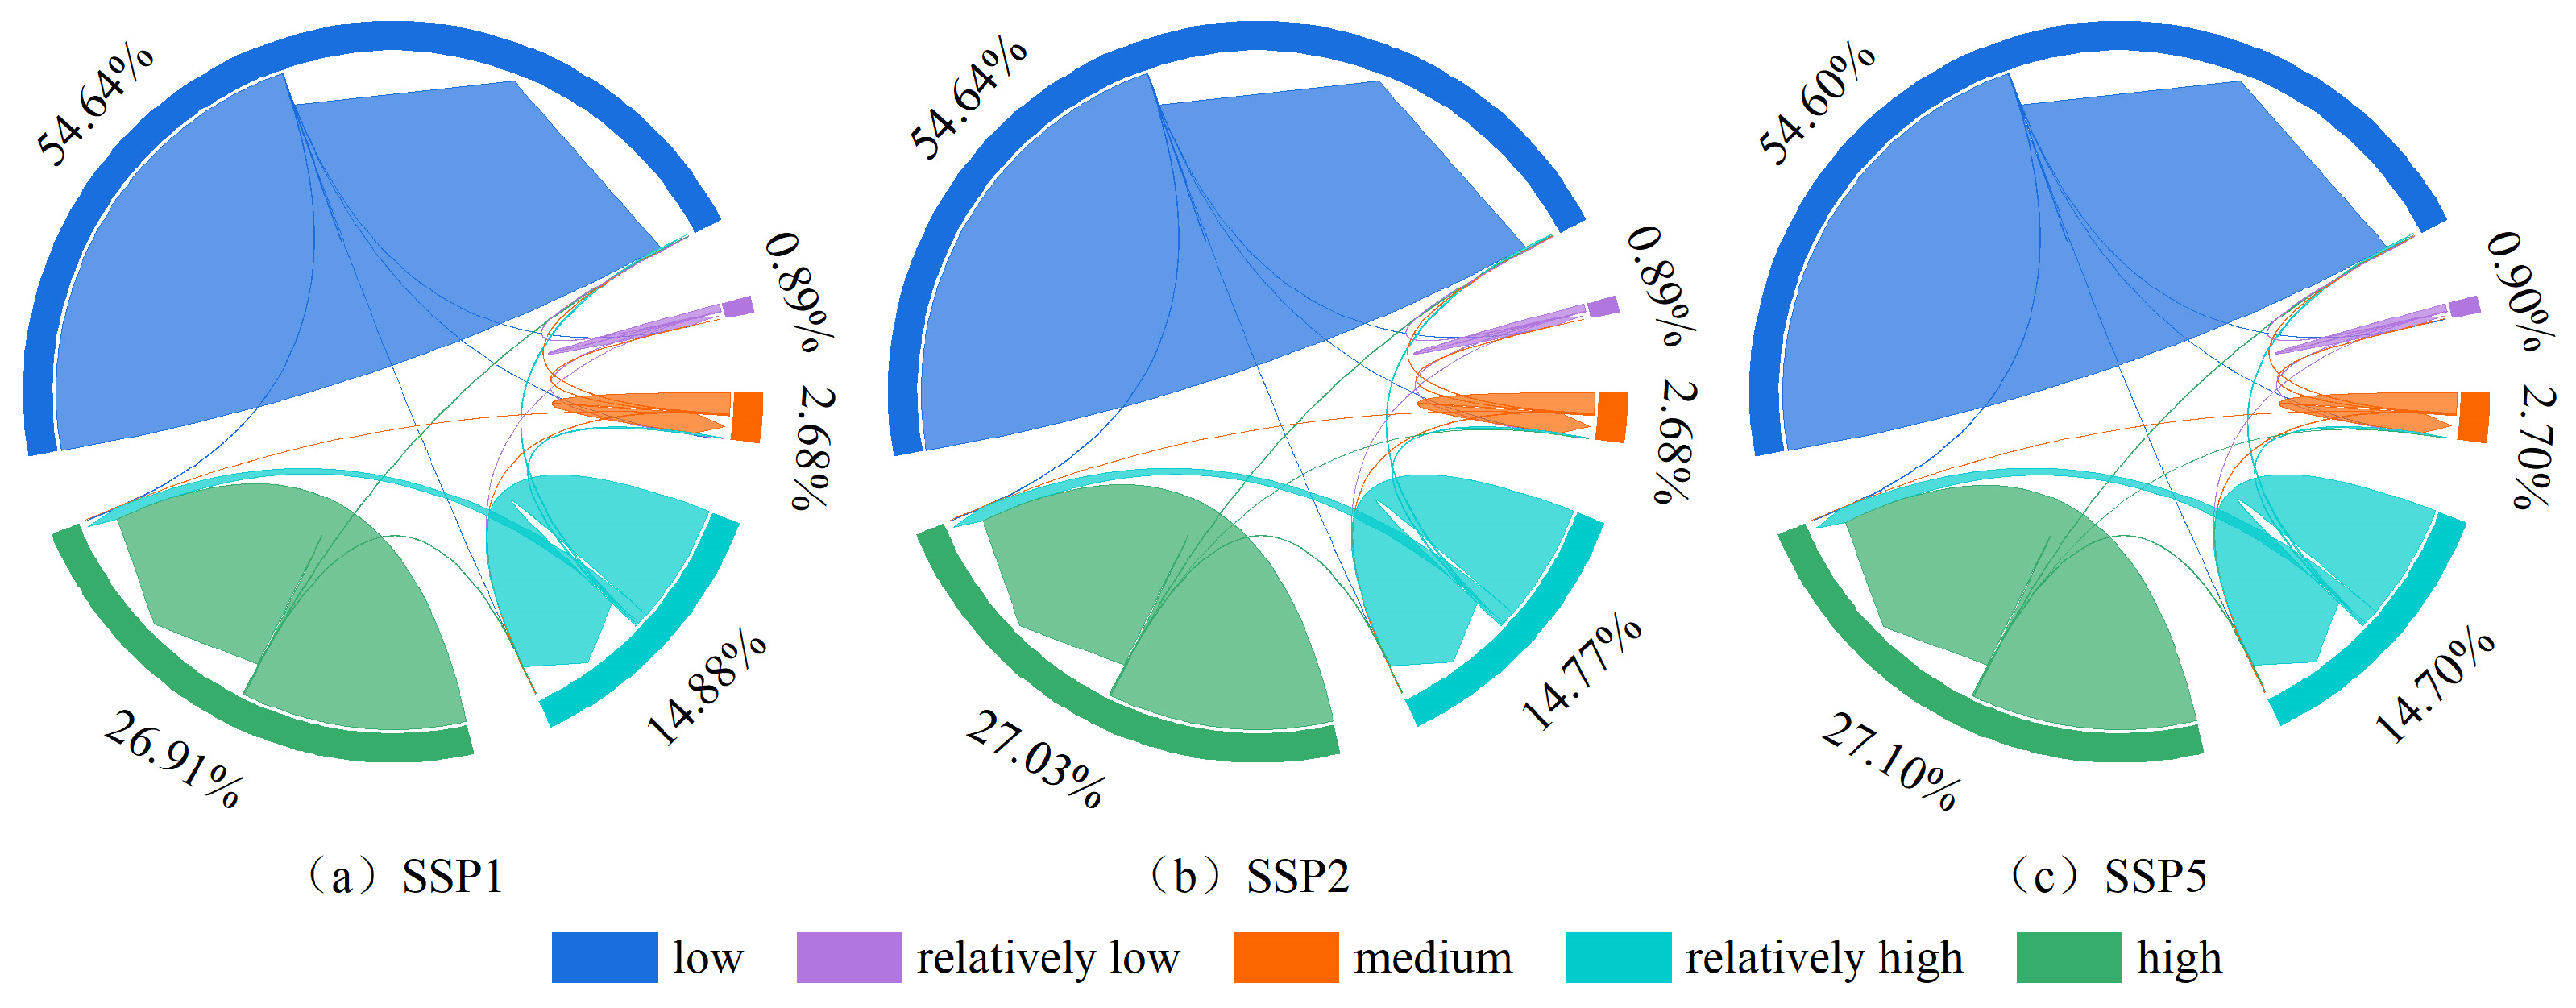
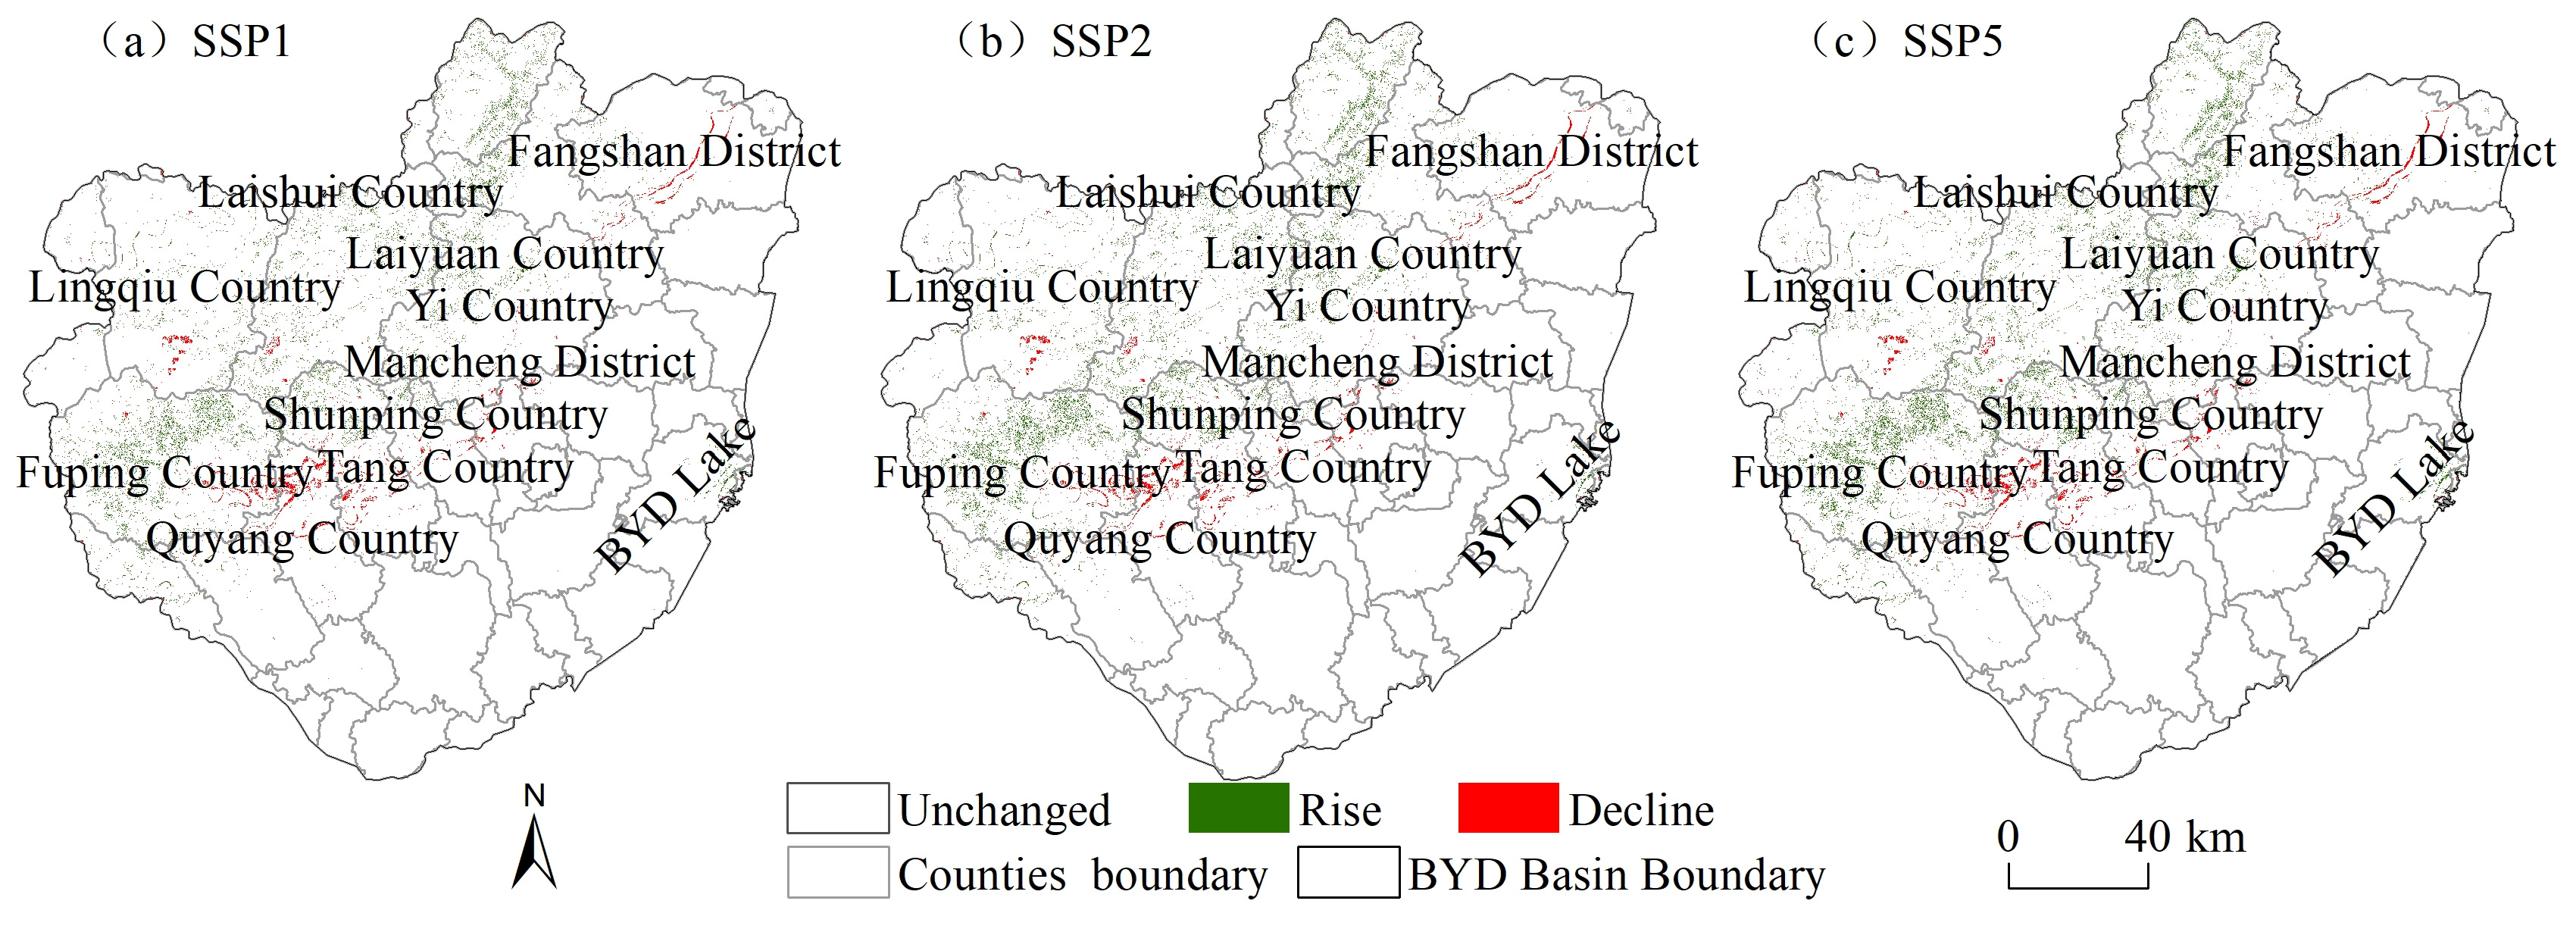
3.4. Habitat Quality Prediction Based on SSPs Scenarios
4. Discussion
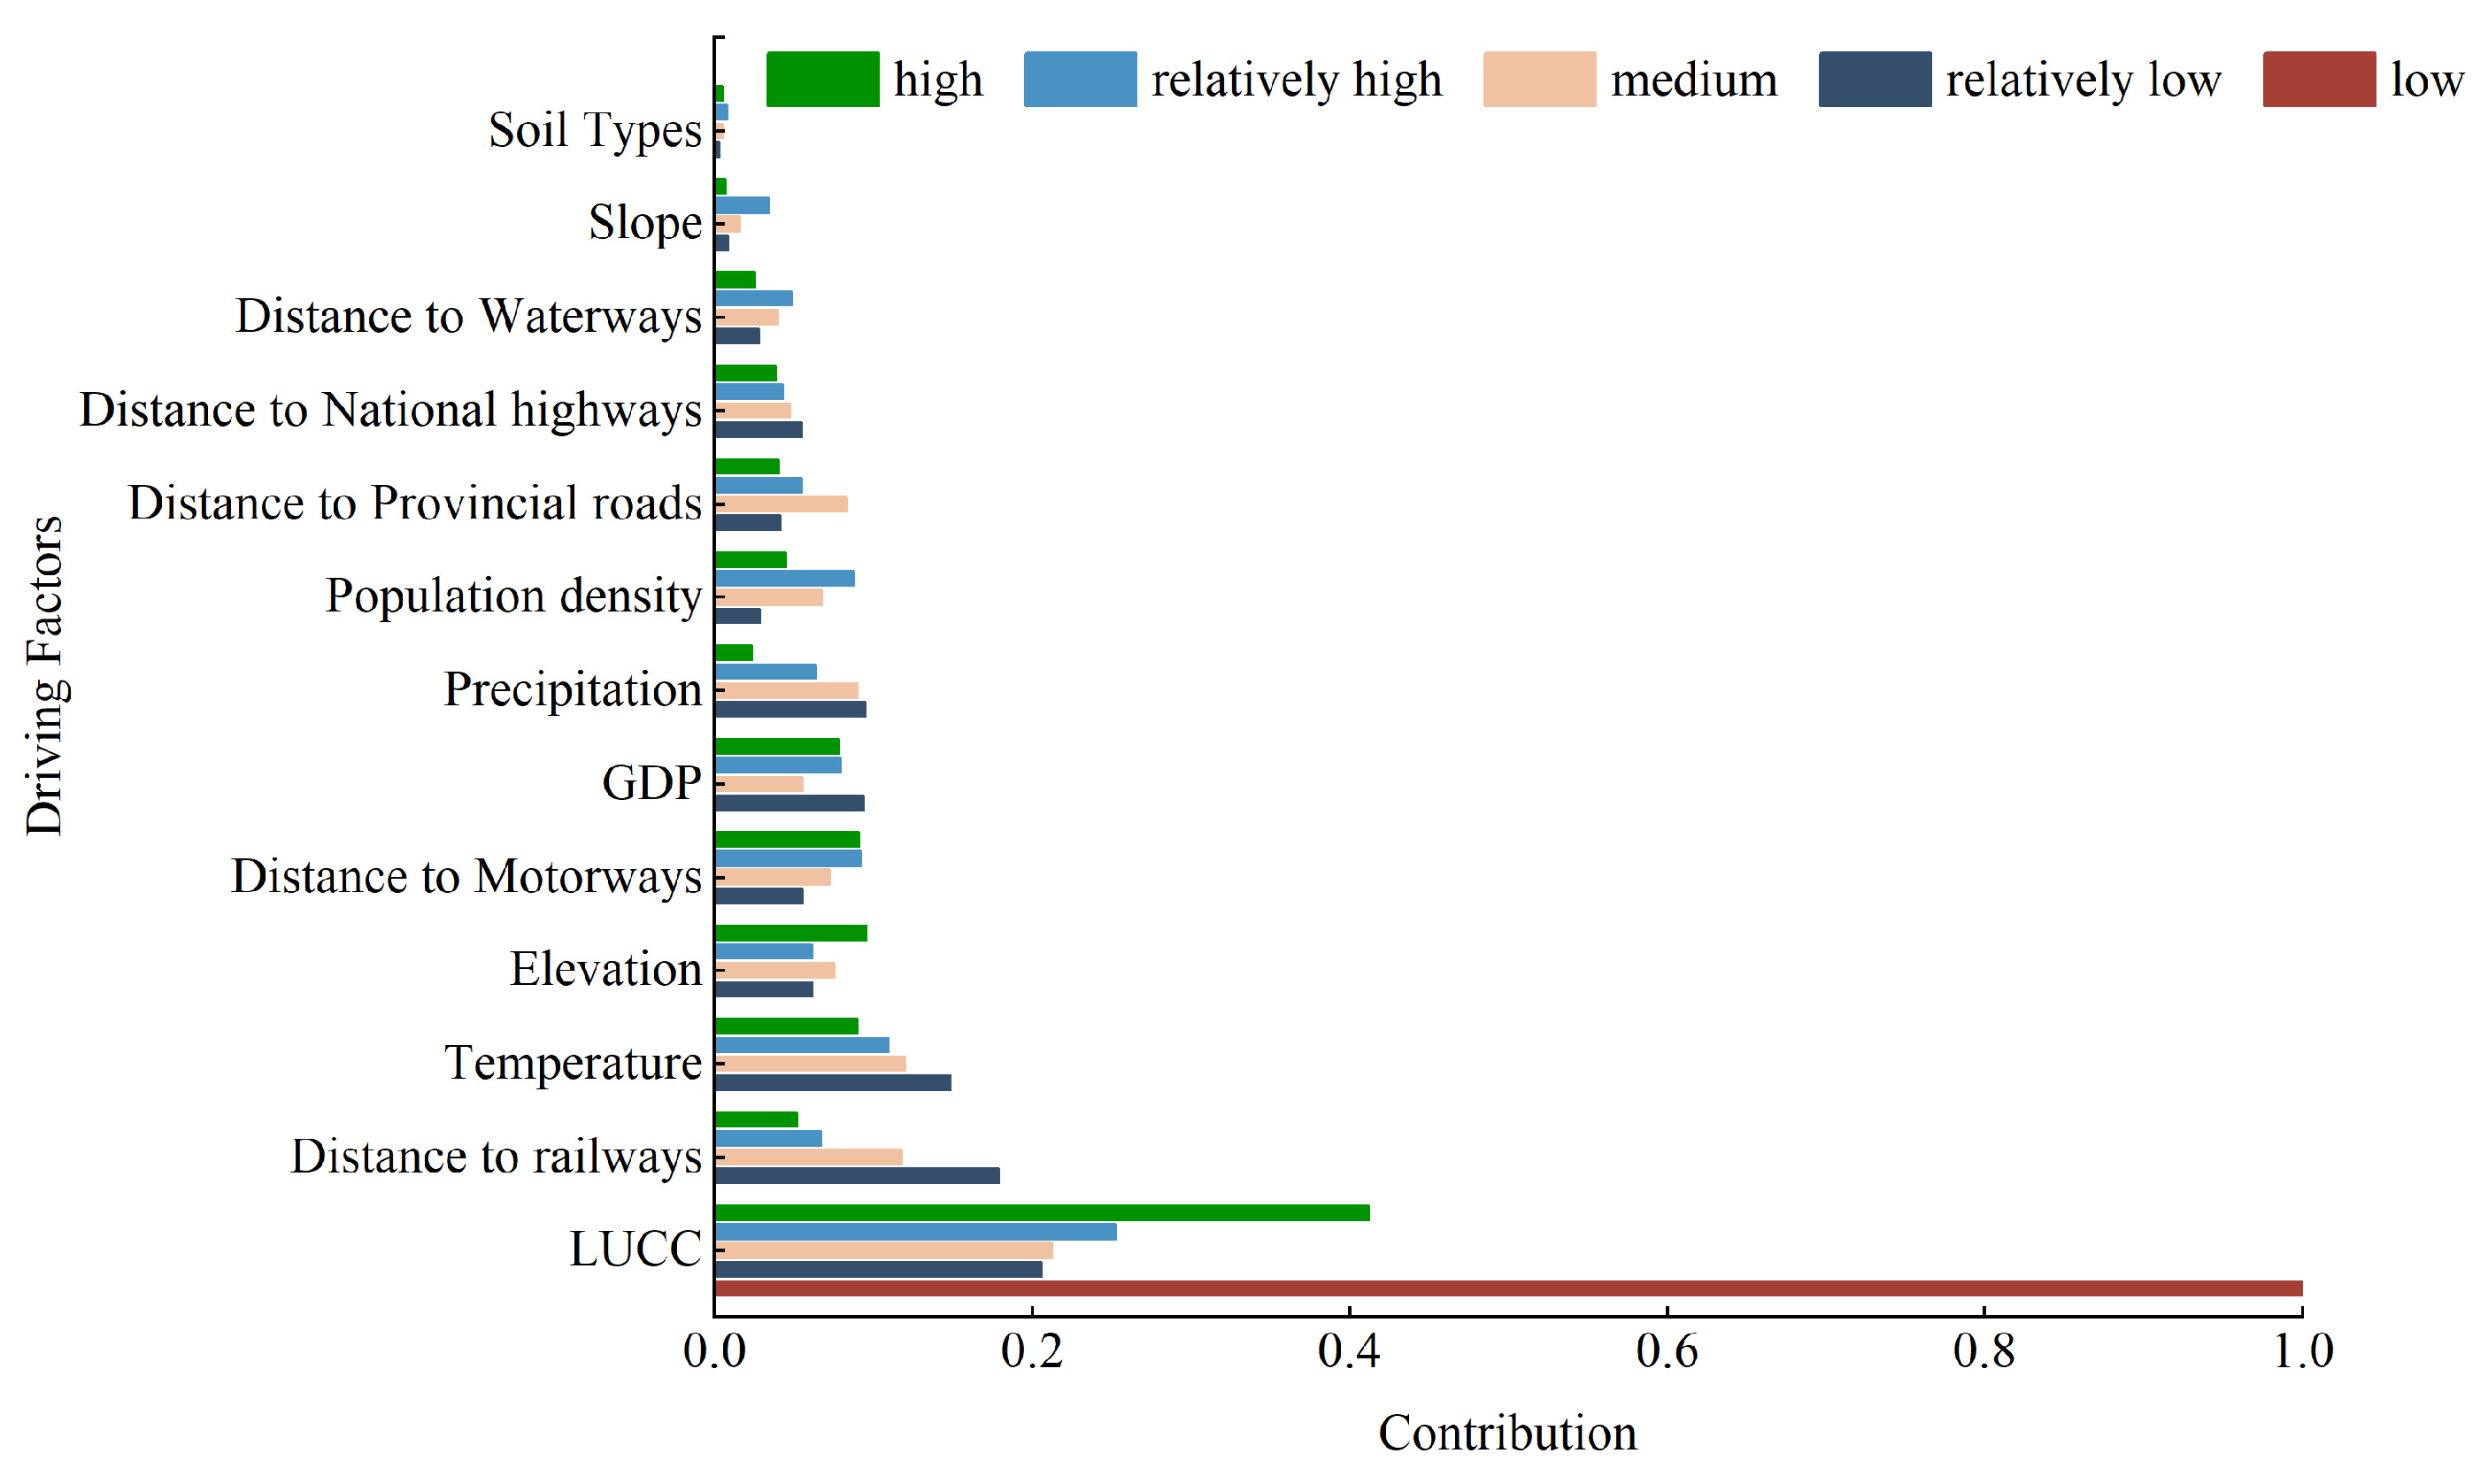
4.1. Land Use Change Driving Mechanisms
4.2. Causes Analysis of Habitat Quality
4.3. Uncertainties and Implications
5. Conclusions
Author Contributions
Funding
Data Availability Statement
Conflicts of Interest
References
- Zhong, L.N.; Wang, J. Assessing the impact of land consolidation on habitat quality based on InVEST model. Trans. Chin. Soc. Agric. Eng. 2017, 33, 250–255. [Google Scholar]
- Fellman, J.B.; Hood, E.; Dryer, W.; Pyare, S. Stream Physical Characteristics Impact Habitat Quality for Pacific Salmon in Two Temperate Coastal Basins. PLoS ONE 2015, 10, e0132652. [Google Scholar] [CrossRef]
- Wu, J.S.; Cao, Q.W.; Shi, S.Q.; Huang, X.L.; Lu, Z.Q. Spatiotemporal evolution of habitat quality in Beijing-Tianjin-Hebei based on land use change. Chin. J. Appl. Ecol. 2015, 26, 3457–3466. [Google Scholar]
- Newbold, T.; Hudson, L.N.; Hill, S.L.L.; Contu, S.; Lysenko, I.; Senior, R.A.; Brger, L.; Bennett, D.J.; Choimes, A.; Collen, B.; et al. Global effects of land use on local terrestrial biodiversity. Nature 2015, 520, 45–50. [Google Scholar] [CrossRef] [PubMed]
- Wu, L.N.; Yang, S.T.; Liu, X.Y.; Luo Ya Zhou, X.; Zhao, H.G. Response of land use change to human activity in Beiluo River Basin since 1976. Acta Geogr. Sin. 2014, 69, 54–63. [Google Scholar]
- Zhang, X.R.; Zhou, J.; Li, M.M. Spatial and temporal variation of regional habitat quality based on land use pattern reconstruction. Acta Geogr. Sin. 2020, 75, 160–178. [Google Scholar]
- Kang, J.; Fang, L.; Li, S.; Wang, X. Parallel Cellular Automata Markov Model for Land Use Change Prediction over MapReduce Framework. ISPRS Int. J. Geo-Inf. 2019, 8, 454. [Google Scholar] [CrossRef]
- Shirmohammadi, B.; Malekian, A.; Salajegheh, A.; Taheri, A.; Azarnivand, H.; Malek, Z.; Verburg, P.H. Scenario analysis for integrated water resources management under future land use change in the Urmia Lake region, Iran. Land Use Policy 2020, 90, 104299. [Google Scholar] [CrossRef]
- Liu, X.P.; Liang, X.; Li, X.; Li, X.; Xu, X.C.; Ou, J.P.; Chen, Y.M.; LIS, Y.; Wang, S.J.; Pei, F.S. A future land use simulation model (FLUS) for simulating multiple land use scenarios by coupling human and natural effects. Landsc. Urban Plan. 2017, 168, 94–116. [Google Scholar] [CrossRef]
- Zhang, S.; Zhong, Q.; Cheng, D.; Xu, C.; Chang, Y.; Lin, Y.; Li, B. Landscape ecological risk projection based on the PLUS model under the localized shared socioeconomic pathways in the Fujian Delta region. Ecol. Indic. 2022, 136, 108642. [Google Scholar] [CrossRef]
- Lin, Q. Dynamic simulation of land use change and assessment of carbon storage based on climate change scenarios at the city level: A case study of Bortala, China. Ecol. Indic. 2022, 134, 108499. [Google Scholar]
- He, C.Y.; Shi, P.J.; Li, J.G.; Pan, Y.Z.; Chen, J. Scenario simulation of future land use change in northern China. Acta Geogr. Sin. 2004, 59, 599–607. [Google Scholar]
- Jiang, X.F.; Duan, H.C.; Liao, J.; Song, X.; Xue, X. Land use in Ganlingao area of Middle Heihe River Basin based on PLUS-SD coupling model. J. Arid Zone Res. 2022, 4, 1246–1258. [Google Scholar]
- Liang, X.; Guan, Q.F.; Clarke, K.C.; Liu, S.S.; Wang, B.Y.; Yao, Y. Understanding the drivers of sustainable land expansion using a patch-generating land use simulation (PLUS) model: A case study in Wuhan, China. Comput. Environ. Urban Syst. 2021, 85, 101569. [Google Scholar] [CrossRef]
- Wang, J.; Zhang, J.; Xiong, N.; Liang, B.; Wang, Z.; Cressey, E.L. Spatial and Temporal Variation, Simulation and Prediction of Land Use in Ecological Conservation Area of Western Beijing. Remote Sens. 2022, 14, 1452. [Google Scholar] [CrossRef]
- He, N.; Guo, W.; Wang, H.; Yu, L.; Cheng, S.; Huang, L.; Jiao, X.; Chen, W.; Zhou, H. Temporal and Spatial Variations in Landscape Habitat Quality under Multiple Land-Use/Land-Cover Scenarios Based on the PLUS-InVEST Model in the Yangtze River Basin, China. Land 2023, 12, 1338. [Google Scholar] [CrossRef]
- Huang, M.Y.; Yue, W.Z.; Feng, S.R.; Zhang, J. Spatial-temporal evolution of habitat quality and analysis of landscape patterns in Dabie Mountain area of west Anhui province based on InVEST model. Acta Ecol. Sin. 2020, 40, 2895–2906. [Google Scholar]
- Sallustio, L.; De Toni, A.; Strollo, A.; Di Febbraro, M.; Gissi, E.; Casella, L.; Geneletti, D.; Munafò, M.; Vizzarri, M.; Marchetti, M. Assessing habitat quality in relation to the spatial distribution of protected areas in Italy. J. Environ. Manag. 2017, 201, 129–137. [Google Scholar] [CrossRef] [PubMed]
- Moreira, M.; Fonseca, C.; Vergílio, M.; Calado, H.; Gil, A. Spatial assessment of habitat conservation status in a Macaronesian island based on the InVEST model: A case study of Pico Island (Azores, Portugal). Land Use Policy 2018, 78, 637–649. [Google Scholar] [CrossRef]
- Li, X.; Liu, Z.; Li, S.; Li, Y. Multi-scenario simulation analysis of land use impacts on habitat quality in Tianjin based on the PLUS model coupled with the InVEST model. Sustainability 2022, 14, 6923. [Google Scholar] [CrossRef]
- Wang, R.Y.; Zhao, J.S.; Chen, G.P.; Lin, Y.L.; Yang, A.R.; Chen, J.Q. Coupling PLUS–InVEST Model for Ecosystem Service Research in Yunnan Province, China. Sustainability 2023, 15, 271. [Google Scholar] [CrossRef]
- Babbar, D.; Areendran, G.; Sahana, M.; Sarma, K.; Raj, K.; Sivadas, A. Assessment and prediction of carbon sequestration using Markov chain and InVEST model in Sariska Tiger Reserve, India. J. Clean. Prod. 2021, 278, 123333. [Google Scholar] [CrossRef]
- Jing, C.; Jiang, T.; Su, B.D.; Wang, G.J.; Luo, Y.; Zhai, J.Q.; Huang, J.L.; Jing, C.; Gao, M.N.; Lin, Q.G.; et al. Application of shared socioeconomic pathways in land use, energy and carbon emission research. Chin. J. Atmos. Sci. 2022, 45, 397–413. [Google Scholar]
- Jiang, T.; Su, B.D.; Wang, Y.J.; Wang, R.; Zhao, J.; Jing, C.; Cao, L.G.; Sun, H.M.; Wang, A.Q.; Huang, J.L. Shared Socioeconomic Pathways (SSPs) population and Economy lattice dataset. Adv. Clim. Chang. Res. 2022, 18, 381–383. [Google Scholar]
- Tang, Q.; Yu, P.H.; Chen, Z.Y.; Bai, S.Y.; Chen, Y.Y. Simulation of land use change under shared socioeconomic path. Res. Soil Water Conserv. 2022, 29, 301–310. [Google Scholar]
- Meiyappan, P.; Dalton, M.; O’Neill, B.C.; Jain, A.K. Spatial modeling of agricultural land use change at global scale. Ecol. Model. 2014, 291, 152–174. [Google Scholar] [CrossRef]
- Ma, Z.; Wang, W.; Hou, X.; Wang, J.; Duan, L.; Wang, Y.; Zhao, M.; Li, J.; Jing, J.; Li, L. Examining the change in groundwater flow patterns: A case study from the plain area of the Baiyangdian Lake Basin, North China. J. Hydrol. 2023, 625, 130160. [Google Scholar] [CrossRef]
- Cai, Y.; Zhang, P.; Wang, Q.; Wu, Y.; Ding, Y.; Nabi, M.; Fu, C.; Wang, H. How does water diversion affect land use change and ecosystem service: A case study of Baiyangdian wetland, China. J. Environ. Manag. 2023, 344, 118558. [Google Scholar] [CrossRef]
- Yang, J.; Huang, X. The 30 m annual land cover dataset and its dynamics in China from 1990 to 2019. Earth Syst. Sci. Data 2021, 13, 3907–3925. [Google Scholar] [CrossRef]
- Li, F.X.; Liu, D.F.; Kong, X.S.; Liu, Y.L. Multi-scenario county sustainable development potential evaluation based on dynamic simulation perspective and shared socio-economic path. J. Geoinf. Sci. 2022, 24, 684–697. [Google Scholar]
- Sharp, R. Natural Capital Project. In InVEST 3.14.1 User’s Guide; Stanford University, University of Minnesota, Chinese Academy of Sciences, The Nature Conservancy, World Wildlife Fund, and Stockholm Resilience Centre: Morges, Switzerland, 2022. [Google Scholar]
- Liao, Z.M.; Yang, W.; CAIX, P.; Wang, X.; Xiong, W.S. Ecological function evaluation and zoning of Daqinghe-Baiyangdian Basin. Chin. J. Environ. Sci. 2022, 42, 131–140. [Google Scholar]
- Zhang, D.Z.; Sun, X.Y.; Yuan, X.Z.; Liu, F.; Guo, H.W.; Xu, Y.; Li, B.F. Land use change and its impact on habitat quality in Nansi Lake Basin, 1980–2015. J. Lake Sci. 2018, 30, 349–357. [Google Scholar]
- He, J.; Huang, J.; Li, C. The evaluation for the impact of land use change on habitat quality: A joint contribution of cellular automata scenario simulation and habitat quality assessment model. Ecol. Model. 2017, 366, 58–67. [Google Scholar] [CrossRef]
- Fan, Z.M. Simulation of land cover change in Beijing-Tianjin-Hebei region based on different scenarios of SSP-RCP. Acta Geogr. Sin. 2022, 77, 228–244. [Google Scholar]
- Xu, Z.T.; Chen, P.F.; Zhou, S.J.; Zhu, Y.Q.; Shi, Y.J. Land cover change and its ecological service value evaluation in Baiyangdian Basin. Ecol. Sci. 2018, 37, 83–90. [Google Scholar]
- Wen, J.; Huang, D.Z. Spatial and temporal variation of landscape structure and pattern in Baiyangdian Basin and its relationship with topographic factors. J. Agric. Univ. Hebei 2020, 43, 86–95. [Google Scholar]
- Zhang, M.Y.; Wang, K.L.; He, P.; Xie, Z.R.; Gao, J.X. Study on landscape spatial pattern change in Baiyangdian Basin. Resour. Sci. 2005, 27, 134–140. [Google Scholar]
- Wang, J.; YANY, L.; Wang, J.M.; Ying, L.X.; Tang, Q. Spatial and temporal characteristics and prediction of habitat quality in Minjiang River Basin. Acta Ecol. Sin. 2021, 41, 5837–5848. [Google Scholar]
- Guo, M.; Shu, S.; Ma, S.; Wang, L.J. Using high-resolution remote sensing images to explore the spatial relationship between landscape patterns and ecosystem service values in regions of urbanization. Environ. Sci. Pollut. Res. 2021, 28, 56139–56151. [Google Scholar] [CrossRef] [PubMed]
- Zhang, X.M.; Wang, J.; Yue, C.L.; Ma, S.; Wang, L.J. Exploring the spatiotemporal changes in carbon storage under different development scenarios in Jiangsu Province, China. PeerJ 2022, 10, e13411. [Google Scholar] [CrossRef] [PubMed]
- Chen, X.; Zhang, H.; Chen, W.; Huang, G. Urbanization and climate change impacts on future flood risk in the Pearl River Delta under shared socioeconomic pathways. Sci. Total Environ. 2021, 762, 143144. [Google Scholar] [CrossRef] [PubMed]


| Data Type | Name | Time | Attribute | Sources |
|---|---|---|---|---|
| Scenario | SSPs | 2010–2050. | Cell point/0.5° | Jiang Tong et al. [24] |
| Land Use | CLCD | 2000–2020. | Raster/30 m | Yang and Huang [29] |
| Socio-Economic | GDP | 2019 | Grid/1 km | Resources and Environmental Science and Data Center (https://www.resdc.cn) |
| Population density | 2020 | Grid/1 km | ||
| Statistical Yearbook | 2000–2020. | Statistics | China City Statistical Yearbook, Annual Bulletin of Baoding City | |
| Climatic Environmental | Average annual temperature | 2000–2015. | Grid/1 km | Resources and Environmental Science and Data Center (https://www.resdc.cn) |
| Average annual precipitation | 2000–2015. | Grid/1 km | ||
| Soil type | 1995 | Grid/1 km | ||
| Water Level | 2006–2019. | Statistics | Yearbook of Haihe River Basin Hydrological Data | |
| Elevation | / | Grid/30 m | Geospatial data Cloud platform (https://www.gscloud.cn) | |
| Slope | / | Raster/30 m | Extracted from elevation data | |
| Road, Water System | Road network | 2016 | Vector | National Center for Basic Geographic Information (https://www.webmap.cn) |
| Water System | 2015 | Vector |
| Landscape Type | Actual Area in 2020/km2 | Simulated Area in 2020/km2 | Relative Error/% |
|---|---|---|---|
| Farmland | 12,675.08 | 12,428.31 | −1.95 |
| Woodland | 8484.29 | 8456.03 | −0.33 |
| Grassland | 5574.27 | 5786.59 | 3.81 |
| Water | 169.67 | 171.00 | 0.78 |
| Construction land | 4322.14 | 4378.33 | 1.30 |
| Variables | 2020–2030. | 2030–2040. | 2040–2050. | ||||||
|---|---|---|---|---|---|---|---|---|---|
| SSP1 | SSP2 | SSP5 | SSP1 | SSP2 | SSP5 | SSP1 | SSP2 | SSP5 | |
| GDP change rate/% | 4.64 | 4.67 | 4.59 | 2.36 | 2.38 | 2.61 | 1.36 | 1.10 | 1.81 |
| Population change rate/‰ | 0.91 | 2.24 | 1.59 | −0.49 | 0.53 | 0.31 | −2.25 | −0.52 | −1.41 |
| Threat Factor | Maximum Impact Distance/km | Weights | Type of Decline |
|---|---|---|---|
| Farmland | 4 | 0.7 | Linear |
| Construction land | 8 | 1 | Index |
| Railways | 5 | 0.6 | Linear |
| Expressways | 3 | 0.6 | Linear |
| National highways | 3 | 0.6 | Linear |
| Provincial roads | 2 | 0.5 | Linear |
| Landscape Types | Habitat Suitability | Susceptibility | |||||
|---|---|---|---|---|---|---|---|
| Farmland | Construction Land | Railway | Expressways | National Highways | Provincial Roads | ||
| Farmland | 0 | 0 | 0 | 0 | 0 | 0 | 0 |
| Woodland | 1 | 0.5 | 0.7 | 0.75 | 0.7 | 0.7 | 0.6 |
| Grassland | 0.7 | 0.6 | 0.65 | 0.5 | 0.3 | 0.3 | 0.2 |
| Water | 1 | 0.75 | 0.7 | 0.75 | 0.7 | 0.7 | 0.6 |
| Construction land | 0 | 0 | 0 | 0 | 0 | 0 | 0 |
| Unutilized land | 0 | 0 | 0 | 0 | 0 | 0 | 0 |
Disclaimer/Publisher’s Note: The statements, opinions and data contained in all publications are solely those of the individual author(s) and contributor(s) and not of MDPI and/or the editor(s). MDPI and/or the editor(s) disclaim responsibility for any injury to people or property resulting from any ideas, methods, instructions or products referred to in the content. |
© 2024 by the authors. Licensee MDPI, Basel, Switzerland. This article is an open access article distributed under the terms and conditions of the Creative Commons Attribution (CC BY) license (https://creativecommons.org/licenses/by/4.0/).
Share and Cite
Han, Z.; Li, B.; Han, Z.; Wang, S.; Peng, W.; Liu, X.; Benson, D. Dynamic Simulation of Land Use and Habitat Quality Assessment in Baiyangdian Basin Using the SD-PLUS Coupled Model. Water 2024, 16, 678. https://doi.org/10.3390/w16050678
Han Z, Li B, Han Z, Wang S, Peng W, Liu X, Benson D. Dynamic Simulation of Land Use and Habitat Quality Assessment in Baiyangdian Basin Using the SD-PLUS Coupled Model. Water. 2024; 16(5):678. https://doi.org/10.3390/w16050678
Chicago/Turabian StyleHan, Zhen, Budong Li, Zepeng Han, Shiyan Wang, Wenqi Peng, Xiaobo Liu, and David Benson. 2024. "Dynamic Simulation of Land Use and Habitat Quality Assessment in Baiyangdian Basin Using the SD-PLUS Coupled Model" Water 16, no. 5: 678. https://doi.org/10.3390/w16050678
APA StyleHan, Z., Li, B., Han, Z., Wang, S., Peng, W., Liu, X., & Benson, D. (2024). Dynamic Simulation of Land Use and Habitat Quality Assessment in Baiyangdian Basin Using the SD-PLUS Coupled Model. Water, 16(5), 678. https://doi.org/10.3390/w16050678