Article

Assessing Changes in Exceptional Rainfall in Portugal Using ERA5-Land Reanalysis Data (1981/1982–2022/2023)

by
Luis Angel Espinosa
1,*,
Maria Manuela Portela
2 and
Salem Gharbia
3
1
Associação do Instituto Superior Técnico para a Investigação e Desenvolvimento (IST-ID), Civil Engineering Research and Innovation for Sustainability (CERIS), Avenida António José de Almeida, No. 12, 1000-043 Lisbon, Portugal
2
Instituto Superior Técnico (IST), CERIS, Av. Rovisco Pais 1, 1049-001 Lisbon, Portugal
3
Department of Environmental Science, Atlantic Technological University (ATU), F91 YW50 Sligo, Ireland
*
Author to whom correspondence should be addressed.
Water 2024, 16(5), 628; https://doi.org/10.3390/w16050628
Submission received: 19 January 2024 / Revised: 8 February 2024 / Accepted: 16 February 2024 / Published: 20 February 2024

Abstract

:
This research examines the intricate changes in the number of occurrences and cumulative rainfall of exceptional events in Portugal spanning 42 hydrological years (from 1981/1982 to 2022/2023). The study has two primary objectives: assessing the hydrological spatial dynamics of a region susceptible to climate-induced variations in exceptional rainfall and evaluating the proficiency of a ERA5-Land reanalysis rainfall dataset in capturing exceptional rainfall. Confronting methodological and data-related challenges (e.g., incomplete record series), the investigation uses continuous daily ERA5-Land rainfall series. Validation against the Sistema Nacional de Informação de Recursos Hídricos (SNIRH) and the Portuguese Institute for Sea and Atmosphere (IPMA) ensures the reliability of ERA5-Land data. Empirical non-exceedance probability curves reveal a broad consensus between reanalysis data and observational records, establishing the dataset’s suitability for subsequent analysis. Spatial representations of occurrences, cumulative rainfall, and rainfall intensity of events above thresholds throughout the overall 42-year period and two subperiods (late: 1981/1982–2001/2002; and recent: 2002/2003–2022/2023) are presented, illustrating spatial and temporal variations. A noteworthy shift in the spatial distribution of intense events from south to north is observed, emphasising the dynamism of such hydrological processes. The study introduces a novel dimension with a severity heat map, combining some key findings from the occurrences and cumulative rainfall through subperiods. This study significantly contributes to the understanding of hydrological dynamics in Portugal, providing valuable insights for risk management and the development of sustainable strategies tailored to the evolving patterns of exceptional rainfall.

1. Introduction

The assessment of changes in exceptional or extreme rainfall is integral to the comprehension of hydrological dynamics, particularly in regions such as Portugal, characterised by diverse topography (Figure 1a) and climatic nuances that amplify the impact of extreme weather events [1]. The current increased frequency and severity of intense rainfall, often linked to climate change, highlight the urgent need for in-depth studies [2]. These investigations are crucial for understanding the characteristics and trends of such occurrences. As climate change continues to impact weather patterns, gaining insights into exceptional rainfall becomes essential [3,4]. This understanding is key due to the potential effects of these events on hydrological systems, water management, infrastructure resilience, and environmental sustainability. Portugal, a region spanning approximately 92,000 km 2 in the southwest of Europe and at the confluence of various climatic influences, emerges as a pertinent locale for an in-depth investigation into the hydrological implications of exceptional rainfall [5,6].
Numerous investigations have been conducted to delineate exceptional rainfall in Portugal, employing diverse datasets and methodological frameworks. Some of these inquiries have concentrated on appraising anticipated future alterations in exceptional rainfall across Portugal [1]. Others have proposed comprehensive methodologies for evaluating rainfall thresholds linked to landslide initiation, drawing insights from a centenary landslide database alongside a corresponding centenary daily rainfall dataset [7]. Furthermore, particular investigations have examined the apparent substantial impact of the North Atlantic Oscillation (NAO) mode on the inter-annual variability of intense and short-duration rainfall observed in Portugal and Spain [8]. The existing body of research highlights the intricate nature of investigating these abnormal events and emphasises the need for robust methodologies to overcome the associated challenges. Several of these challenges are inherent in the examination of exceptional rainfall. For instance, discerning trends and attributing these events to specific causes becomes more intricate due to elevated noise levels and the influence of non-climatic factors. These factors contribute to the complexity of conducting meaningful studies [9]. Additionally, climate change can disrupt long-term rainfall patterns, leading to increased flooding or prolonged droughts. This underscores the necessity for a careful delineation of the impacts of climate change on short-term exceptional events [10]. Furthermore, the limitations ingrained in traditional meteorological station records, characterised by incomplete datasets and uneven spatial distribution, pose constraints on the comprehensive analysis of exceptional rainfall [11]. To overcome these limitations, alternative datasets have also been employed in the examination of exceptional rainfall in Portugal. For instance, Ramos et al. [12] made use of rainfall data from climate reanalysis, including the Twentieth Century Reanalysis (20thCR) and the NCEP Climate Forecast System (CFS) version 2, to examine variations in rainfall extremes across Portugal. More recently, Araújo et al. [1] employed the IB02 Dataset, a high-density daily rainfall gridded dataset covering the Portuguese and Spanish domains from 1950 to 2008 at a spatial resolution of 0 . 2 × 0 . 2 . This dataset was collaboratively developed by Portuguese and Spanish meteorological offices by merging daily rainfall data for Portugal (PT02) with that for Spain (SPAIN02). These datasets offer valuable insights into exceptional rainfall in Portugal, contributing to various studies exploring spatial and temporal patterns as well as the potential impacts of climate change on these events. Nonetheless, there remain alternative datasets, such as the ERA5-Land reanalysis dataset [13], that have not yet been explored comprehensively to elucidate the exceptionality of rainfall in Portugal.
In response to the previous methodological and data-related challenges, this investigation employs the ERA5-Land reanalysis dataset. This dataset, developed by the European Centre for Medium-Range Weather Forecasts (ECMWF), is publicly accessible through the Copernicus Climate Data Store (https://cds.climate.copernicus.eu/cdsapp#!/home accessed on 10 October 2023). The ERA5-Land dataset stands out due to its noteworthy spatial resolution and consistent temporal coverage. The adoption of ERA5-Land not only rectifies the shortcomings associated with traditional meteorological datasets but also provides a more uniform, extensive, and continuous time series of daily rainfall data, encompassing Portugal.
This research study, spanning an overall period from 1 October 1981 to 30 September 2023 (42 hydrological years, 1981/1982–2022/2023), within the confines of Portugal, outlines two overarching objectives. Firstly, it aims to scrutinise the hydrological spatial dynamics of a region susceptible to climate-induced variations in exceptional rainfall. Secondly, the research aims to enhance the understanding of exceptional rainfall by utilising the open access and continuously updated ERA5-Land reanalysis dataset. In other words, it seeks to answer the research question, "Is the ERA5-Land reanalysis dataset able to replicate exceptional events close to those from meteorological station records?". The multifaceted objectives encompass the evaluation of the representativeness of ERA5-Land data, addressing the issue of incomplete records in rainfall series and assessing spatiotemporal patterns of exceptional rainfall over the study period.
An integral part of the methodology involves validating ERA5-Land daily rainfall data against records from the Sistema Nacional de Informação de Recursos Hídricos (SNIRH) and the Portuguese Institute for Sea and Atmosphere (IPMA). This validation process acts as a crucial assessment of the reliability of ERA5-Land data, addressing the persistent challenge posed by incomplete daily rainfall records and ensuring a representative picture of Portugal’s climatology. Furthermore, drawing upon existing scientific literature, the ERA5-Land dataset has been featured in several studies assessing exceptional rainfall across diverse regions. For instance, Lavers et al. [14] scrutinised the efficacy of ERA5 rainfall for climate monitoring and observed broad agreement between rainfall patterns in ERA5 and observations during extreme events. Additionally, another study appraised the ERA5-Land reanalysis rainfall dataset over Spain, concluding that ERA5 performs commendably in analysing extreme rainfall in that region [15]. Although ERA5-Land has been extensively employed in broader climate analyses, its capability to faithfully represent exceptional rainfall in Portugal remains unexplored. This study aims to fill this gap in the current scientific literature by examining ERA5-Land’s ability to capture or reproduce exceptional rainfall over the past four decades.
The subsequent sections of this scientific manuscript will delve into the intricacies of the methodology, present ERA5-Land dataset validation results, and provide a comprehensive exploration of the spatiotemporal changes of the exceptional rainfall, including its occurrence, cumulative rainfall, and intensity. By embedding this research within the evolving discourse on exceptional rainfall in Portugal, the study addresses broader implications for sustainable water resource management. This involves discussing the combinations of occurrences and cumulative rainfall over adopted thresholds during both the late (1981/1982–2001/2002) and recent (2002/2003–2022/2023) subperiods.

2. Data and Methodology

The study employed the ERA5-Land reanalysis dataset, initially validated against SNIRH (https://snirh.apambiente.pt/ accessed on 1 September 2023) and IPMA (https://www.ipma.pt 1 September 2023) records. Representative ERA5-Land grid points were meticulously chosen for validation. The methodology involved setting thresholds for exceptional rainfall and constructing distribution maps of the changes in these events. In constructing the maps, the analysis explored spatiotemporal variations in occurrences, cumulative rainfall, and intensity over a threshold, contributing to a nuanced understanding of exceptional rainfall patterns in Portugal.

2.1. Data Collection

The primary data resource consists of continuous daily rainfall data series (addressing data completeness issues) at 1012 ERA5-Land grid points, evenly distributed as depicted in Figure 1a. These data cover Portugal for an overall period of 42 hydrological years, from 1 October 1981 to 30 September 2023, making them compatible with records from meteorological stations. The ERA5-Land dataset has a horizontal resolution of 0 . 1 × 0 . 1 , a native resolution of ca. 9 km, and a vertical coverage from 2 m above the surface level to a soil depth of 289 cm [13,16].
To assess the suitability of the ERA5-Land data for analysing exceptional daily rainfall in Portugal, a validation process was undertaken. Therefore, nine ERA5-Land grid points were strategically chosen to validate the reanalysis dataset — as highlighted in Figure 1. The selection of these grid points is mirrored by the methodological insights from Espinosa et al. [17], who validated an ERA-Land dataset but focused on daily temperature instead. The nine grid points were assumed to represent Portugal’s rainfall variability. In contrast, rainfall records from the five selected nearest meteorological stations (SNIRH and IPMA) for each of the nine grid points displayed variable series lengths, ranging from 20% to 95% of the complete daily record series. These SNIRH and IPMA meteorological stations are located within 1 to 5 km of the validation grid point. This validation process entailed a meticulous comparison of the non-exceedance curves derived from ERA5-Land daily rainfall data with empirical probability against those constructed from forty-four record series obtained from SNIRH and one series from IPMA, i.e., from the Lisboa/Instituto Geofísico (535) meteorological station. The comparison spanned a common recording period from 1 January 1980 to 31 December 2021 (1980–2021). This thorough validation ensures the robustness and reliability of the ERA5-Land dataset for subsequent analyses, establishing a solid foundation for investigating and understanding the spatiotemporal dynamics of rainfall in Portugal with an emphasis on exceptional events.

2.2. Empirical Non-Exceedance Probability Curves of Daily Rainfall

To validate the suitability of the ERA5-Land dataset for analysing exceptional daily rainfall in Portugal, empirical non-exceedance probability curves were obtained using data from the validation grid points and records from the selected meteorological stations. These curves were then systematically constructed, following the steps proposed by Faulkner [18]. The high-quality of the recorded daily rainfall data for the aforementioned locations and the long time window (1980–2021) aimed at testing the reliability of the ERA5-Land dataset. For each series, the long-term average, representing the benchmark for comparing and ranking daily rainfall values, was quantified. Subsequently, the daily rainfall values were ranked in descending order, normalised by dividing them by their respective long-term average, resulting in a rank-ordered series of normalised rainfall values. The empirical non-exceedance probability for each rainfall value in the ranked series was computed according to the Weibull formula [19,20]. This calculation provided a measure of the probability of a rainfall value not being exceeded. The empirical non-exceedance probabilities were graphically represented—regarding the ground-based series, exclusively for those with data availability surpassing 50%—by plotting them against the corresponding daily rainfall values normalised by their respective long-term averages. This characterisation facilitated visualising the relationship between exceptional rainfall and their respective non-exceedance probabilities of occurrence. Given that exceptionality is the focal point of this research, only probabilities exceeding 0.80 were graphically represented.

2.3. Thresholds for Exceptional Rainfall

Following the ERA5-Land rainfall data validation, the approach only considered the reanalysis dataset. Four upper quantiles commonly used by statisticians and hydrologists (e.g., [14,21]), namely Q95, Q99, Q99.5, and Q99.9, were utilised to identify exceptional rainfall [22], calculated from the overall period of 42 hydrological years across the 1012 ERA5-Land grid points. Q95, the 95th percentile, signifies the value that is exceeded only 5% of the time, commonly used for moderately exceptional rainfall. Q99, the 99th percentile, indicates the value that is exceeded only 1% of the time, identifying more exceptional rainfall with higher rarity. Q99.5, the 99.5th percentile, signifies the value that is exceeded only 0.5% of the time and is used to identify even more exceptional rainfall, denoting a higher level of rarity. Q99.9, the 99.9th percentile, indicates the value that is exceeded only 0.1% of the time, employed to identify exceptionally rare and severe events often associated with extreme weather conditions and potential hazards. The selection of these quantiles enables the assessment of the probability of specific rainfall values occurring within a given period, providing insights into the characteristics and frequency distribution of exceptional events.

2.4. Mapping Spatiotemporal Changes in Exceptional Rainfall

Spatial distribution maps were generated to illustrate exceptional events, specifically daily rainfall above each of the four thresholds (Q95, Q99, Q99.5, and Q99.9). This was based on the average number of daily events per grid point above the respective threshold, representing annual occurrence (days/year), cumulative annual average rainfall (mm/year) of the exceptional events, and average rainfall intensity (mm/day). These maps cover the overall period spanning 42 hydrological years (1981/1982–2022/2023) as well as two distinct subperiods aiming at assessing temporal changes in the exceptional rainfall: the late subperiod (1981/1982–2001/2002) and the recent subperiod (2002/2003–2022/2023). The maps also provide insights into their spatial changes.

2.5. T-Test for Statistical Significance of Temporal Changes

To assess whether the values of the three variables associated with exceptional rainfall (occurrence, cumulative rainfall, and rainfall intensity) have statistically significantly increased from the late subperiod to the recent subperiod (21 hydrological years each), a two-sample t-test [23] was employed. The t-test was specifically applied to the ERA5-Land grid-point locations, with overall values higher in the recent subperiod than in the late one. The t-test determines if the difference between the means of two groups of n elements is statistically significant at a significance level of α . The null hypothesis ( H 0 ) posits that there is no significant difference between the means of the two groups, while the alternative hypothesis ( H 1 ) suggests a significant difference. The t-test formula [23] is given by
t = x ¯ 1 x ¯ 2 s 1 2 n 1 + s 2 2 n 2
where x ¯ 1 and x ¯ 2 represent the sample means of the two groups, s 1 2 and s 2 2 are the sample variances, and n 1 and n 2 denote the sample sizes of the groups. In the current context, group one refers to the values in the late subperiod, group two refers to those from the recent subperiod ( n 1 = n 2 = 21 ), and α is set at 10 % . The absolute calculated t-value is then compared with the critical t-value for the probability of 1 α / 2 = 0.95 and n 1 + n 2 2 degrees of freedom to evaluate the statistical significance of the difference. If the calculated t-value is greater than the critical t-value, the null hypothesis is rejected, indicating a statistically significant increase for a given variable in the recent subperiod.
The formula for the t-test was applied, taking into consideration the critical criterion that sample sizes for each paired group needed to surpass 20. This benchmark, rooted in statistical best practices [24], safeguards the robustness and representativeness of the t-test outcomes.

3. Results

As mentioned, the spatiotemporal dynamics of exceptional rainfall in Portugal were examined using the ERA5-Land reanalysis dataset. Throughout the overall period of 42 hydrological years (1981/1982–2022/2023) and the two 21-hydrological-year subperiods, i.e., late and recent subperiods, the spatial distribution and temporal changes of occurrences, cumulative rainfall, and intensity for these exceptional events were investigated. The analysis, based on a validated ERA5-Land dataset against established meteorological records (1980–2021), provides insights into the hydrological impacts of climate-induced variations in exceptional rainfall across Portugal.

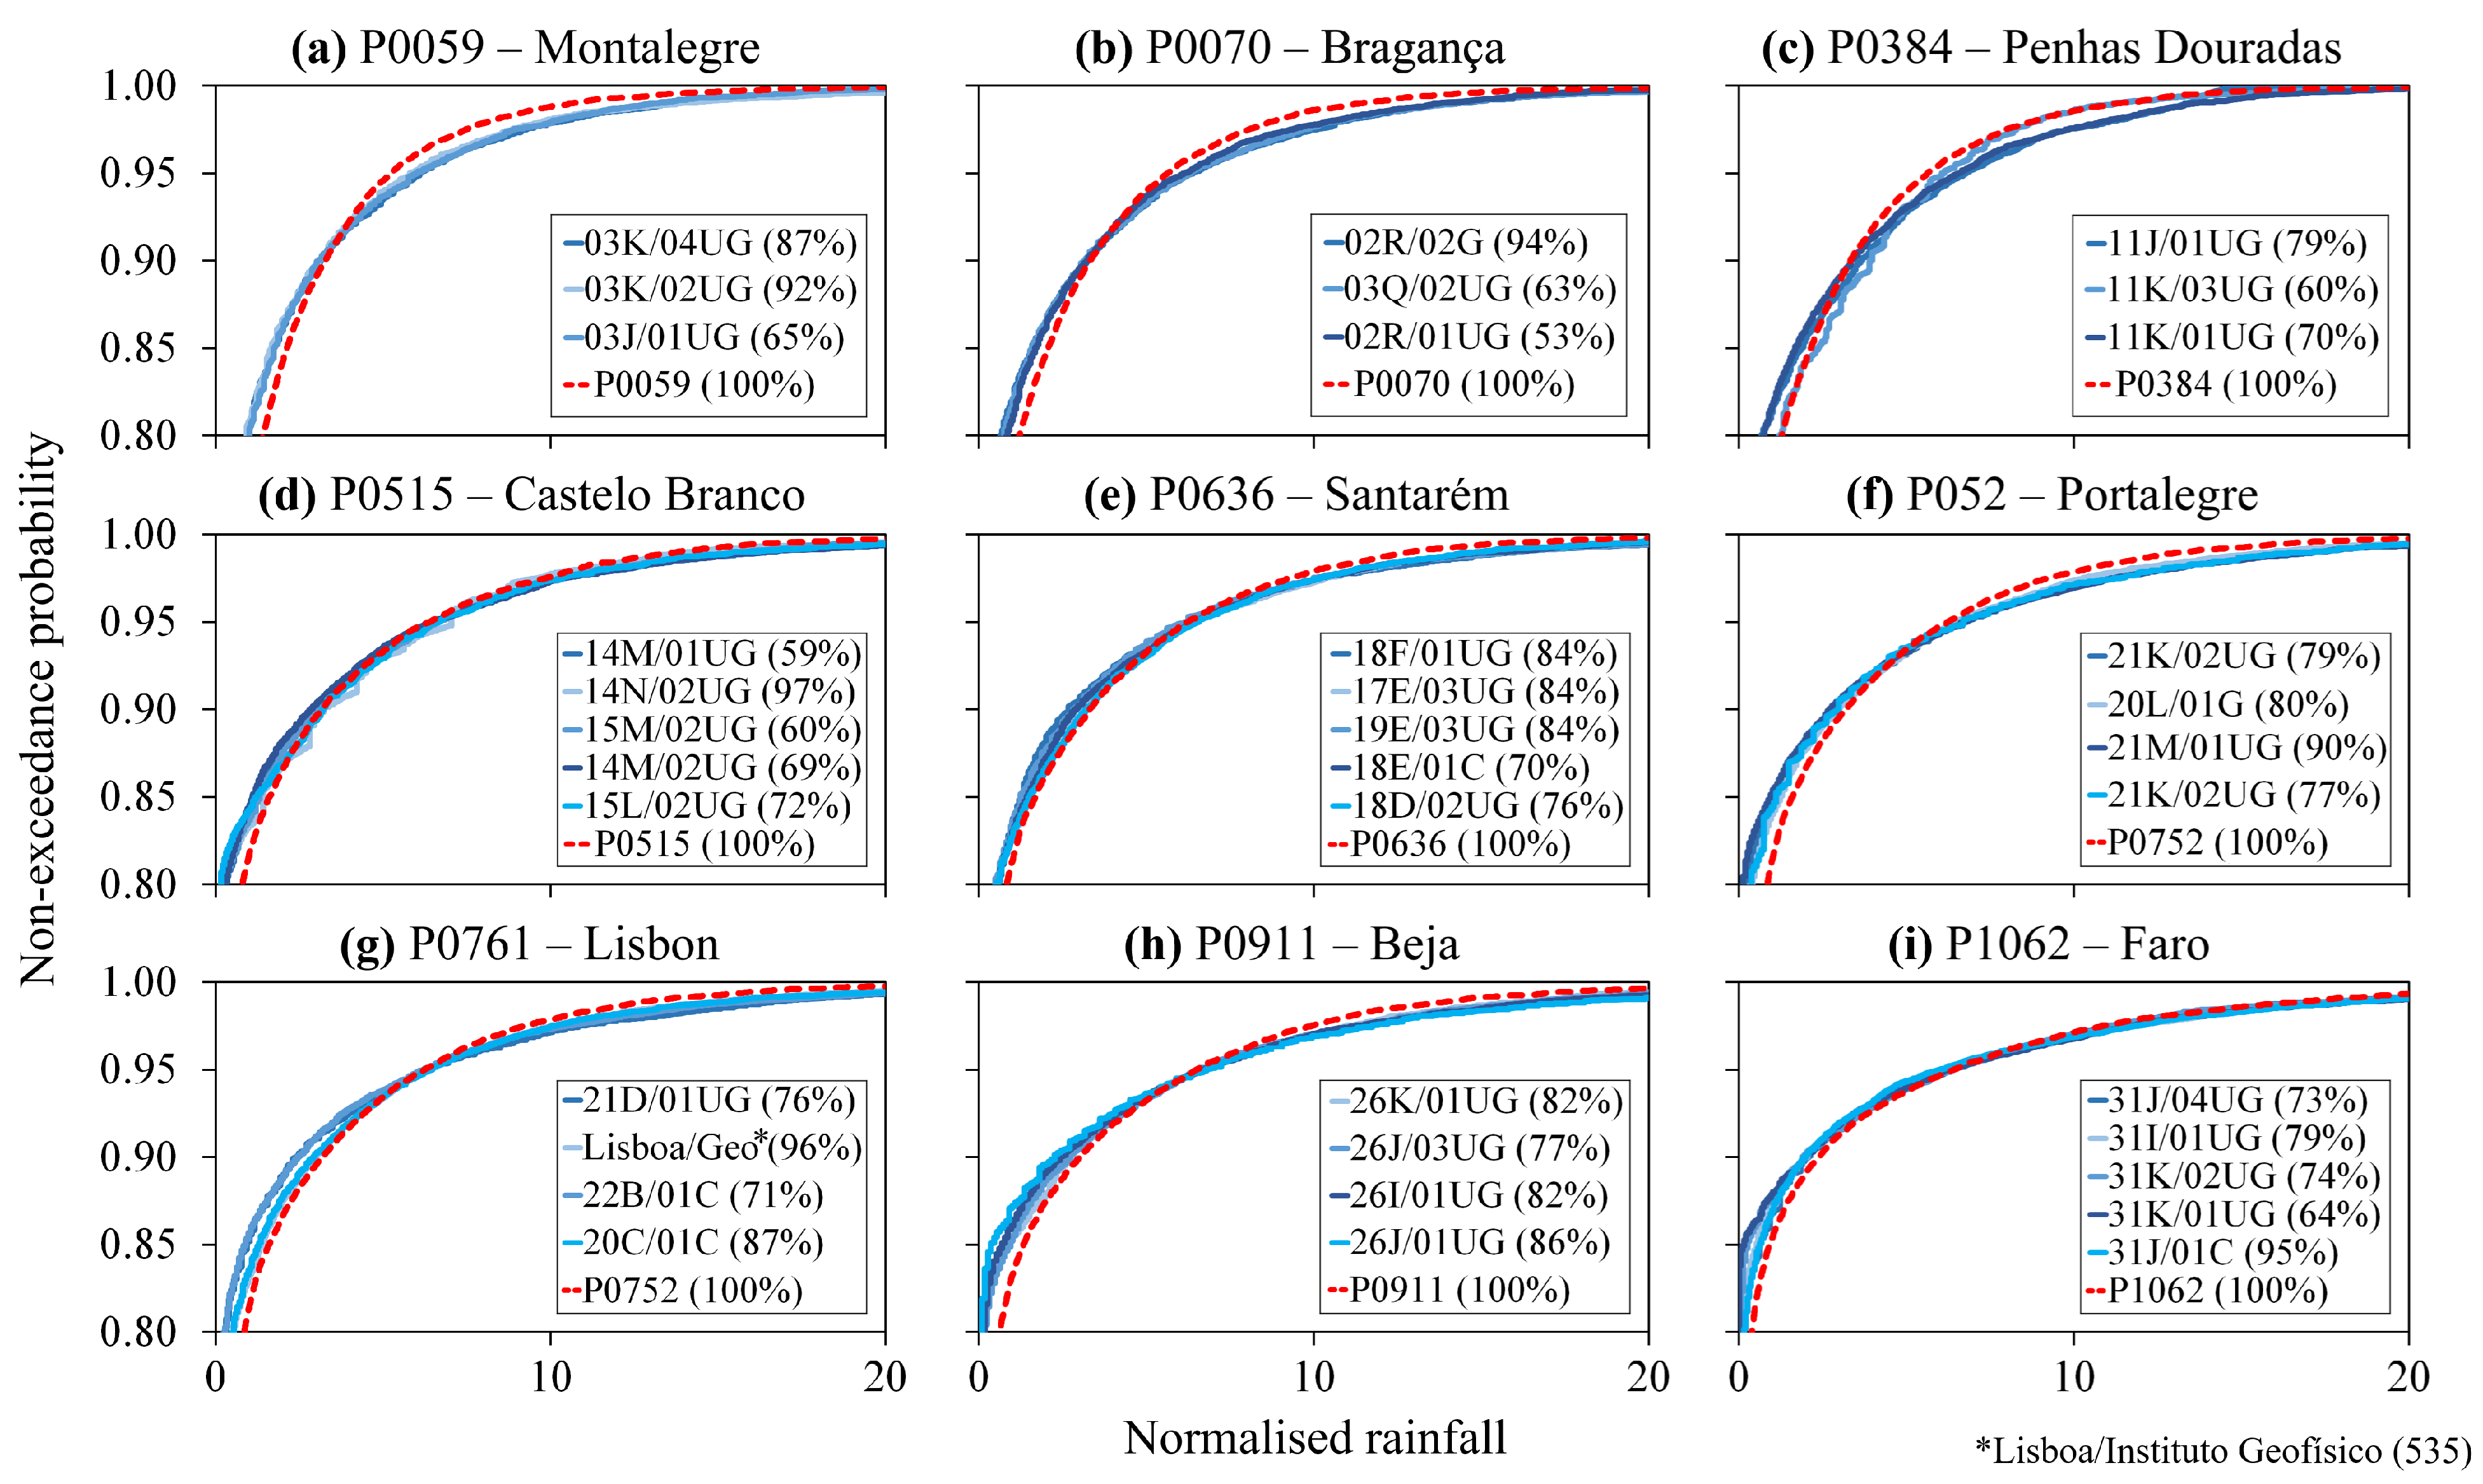
3.1. Empirical Non-Exceedance Probability Curves for Validation of the ERA5-Land Dataset

Normalised rainfall–non-exceedance probability (NR-NEP) plots were generated for the nine reanalysis datasets and forty-five observational record series within selected regions or urban areas—Motalegre, Bragança, Penhas Douradas, Castelo Branco, Santarém, Portalegre, Lisbon, Beja, and Faro—as illustrated in Figure 1. The NR-NEP plots, known as empirical non-exceedance probability curves, represent the non-exceedance probabilities of normalised rainfall values (daily rainfall/long-term average daily rainfall). The curves depicted in Figure 2 enabled a comparative evaluation between the reanalysis data and observational records at specific geographic locations for higher probabilities (≥0.80), assumed in this case to represent the range of exceptional daily rainfall.
The long-term average of daily rainfall, considering 15,330 values excluding leap year days, was calculated for each of the nine grid points from 1 January 1980 to 31 December 2021: P0059, 3.36 mm; P0070, 2.48 mm; P0384, 2.79 mm; P0515, 1.75 mm; P0636, 1.62 mm; P0752, 1.55 mm; P0761, 1.55 mm; P0911, 1.28 mm; and P1062, 1.38 mm. These values distinctly highlight the heterogeneity in rainfall distribution, revealing a wetter pattern in the north compared to the south. This variability in rainfall distribution is an important aspect to consider in the analysis of regional hydrological dynamics.
In Figure 2, only meteorological stations with data availability exceeding 50% are displayed among the five closest stations to each reanalysis grid point (P). The northernmost locations (Portalegre, Bragança, and Penhas Douradas) displayed the lowest number of rainfall record series, with each having only three stations that met this criterion. This was followed by the most interior location, Penhas Douradas, and Lisbon, each having four rainfall record series (with an overall record availability of 82%). The remaining locations had rainfall series meeting the record availability threshold, with an average of 73% complete records, and while some record series had an acceptable number of records, none of them achieved completeness comparable to the reanalysis series. This underscores the superior completeness of the reanalysis series compared to the observational records.
The shapes of the non-exceedance curves were examined to evaluate the ERA5-Land’s capability to replicate the characteristics of exceptional events from rainfall records. Overall, as depicted in Figure 2, there is a notable agreement between the curves derived from the reanalysis data and rainfall records. However, in certain northern locations (e.g., Montalegre, Figure 2a), the ERA5-Land dataset slightly overestimates the exceptionality of rainfall. Nevertheless, the overall consistency of the non-exceedance curves was taken into account to affirm the reliability of the ERA5-Land dataset for the subsequent analysis of exceptional events. Following validation, four thresholds for identifying exceptional events were established from the 1012 gridded daily rainfall dataset (1981/1982–2022/2023), yielding a Q95 of 12.77 mm, Q99 of 27.79 mm, Q99.5 of 35.03 mm, and Q99.9 of 53.59 mm.

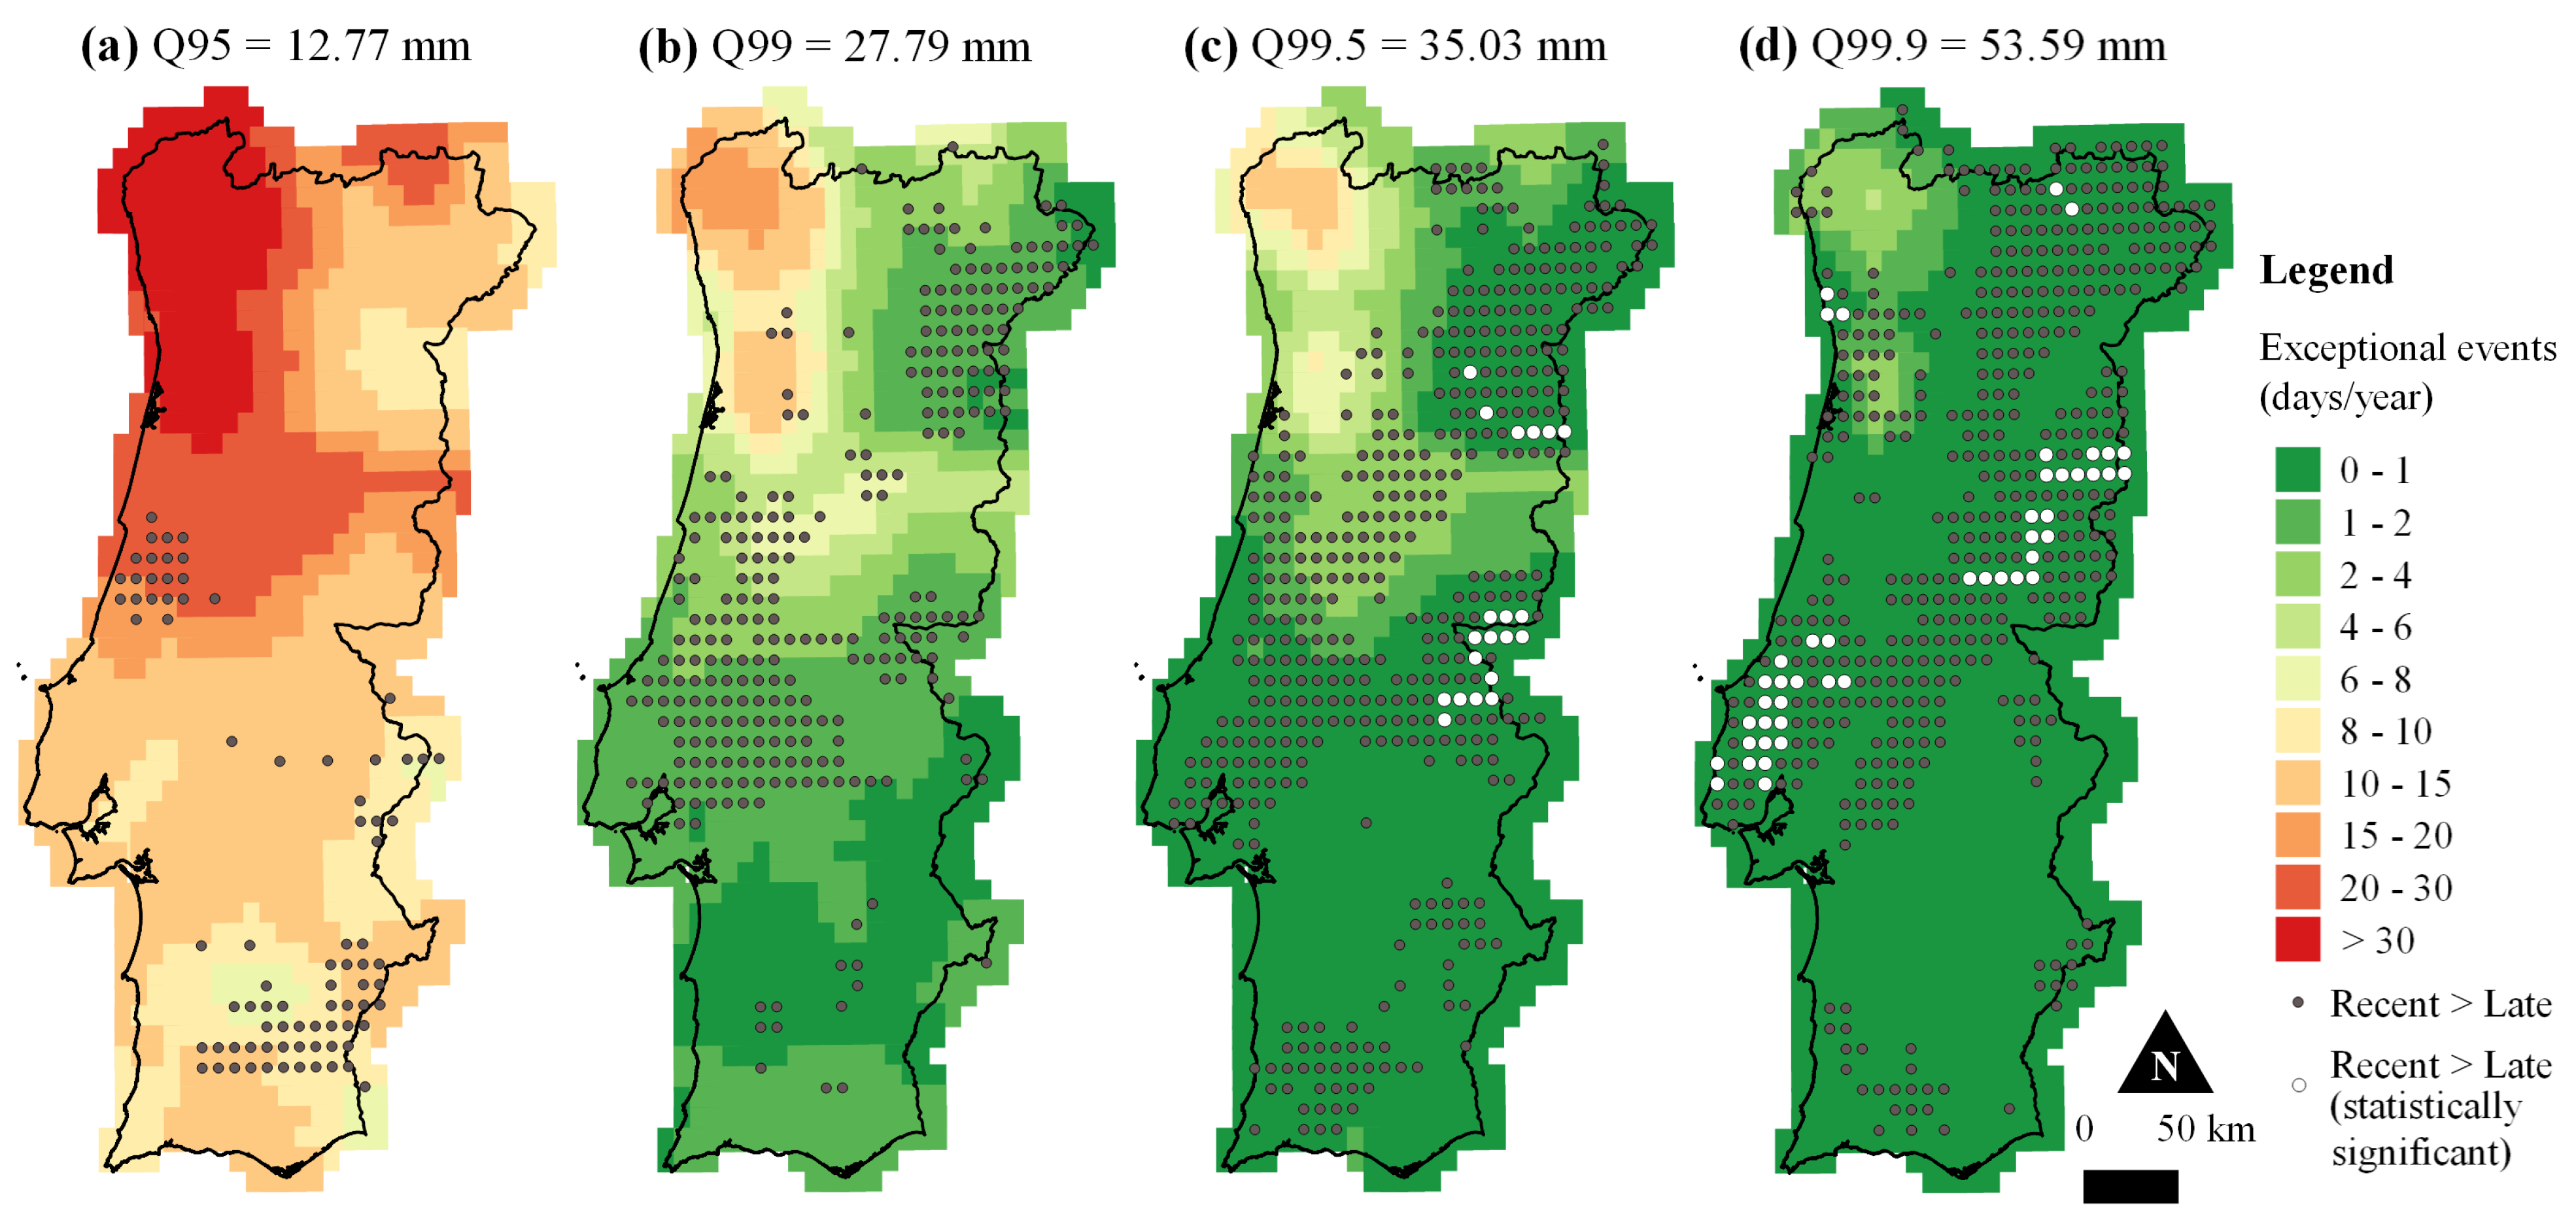
3.2. Occurrences of Exceptional Rainfall

A pixelated spatial representation of results pertaining to the occurrences of exceptional rainfall across different thresholds—for the overall period (Figure 3) and the two subperiods (Figure 4 and Figure 5)—played a crucial role in acquiring comprehensive insights into the spatial distribution and frequency of exceptional episodes, each identified by specific rarity levels. Through the examination of the mean annual number of daily occurrences above the four quantile thresholds (Q95, Q99, Q99.5, and Q99.9), patterns ranging from moderately rare to highly exceptional events were discerned, elucidating the nuances of their temporal evolution. The differentiation between the late and recent subperiods enabled a temporal assessment of changes in these occurrences, providing insights into potential shifts or intensifications in exceptional rainfall over the past four decades.
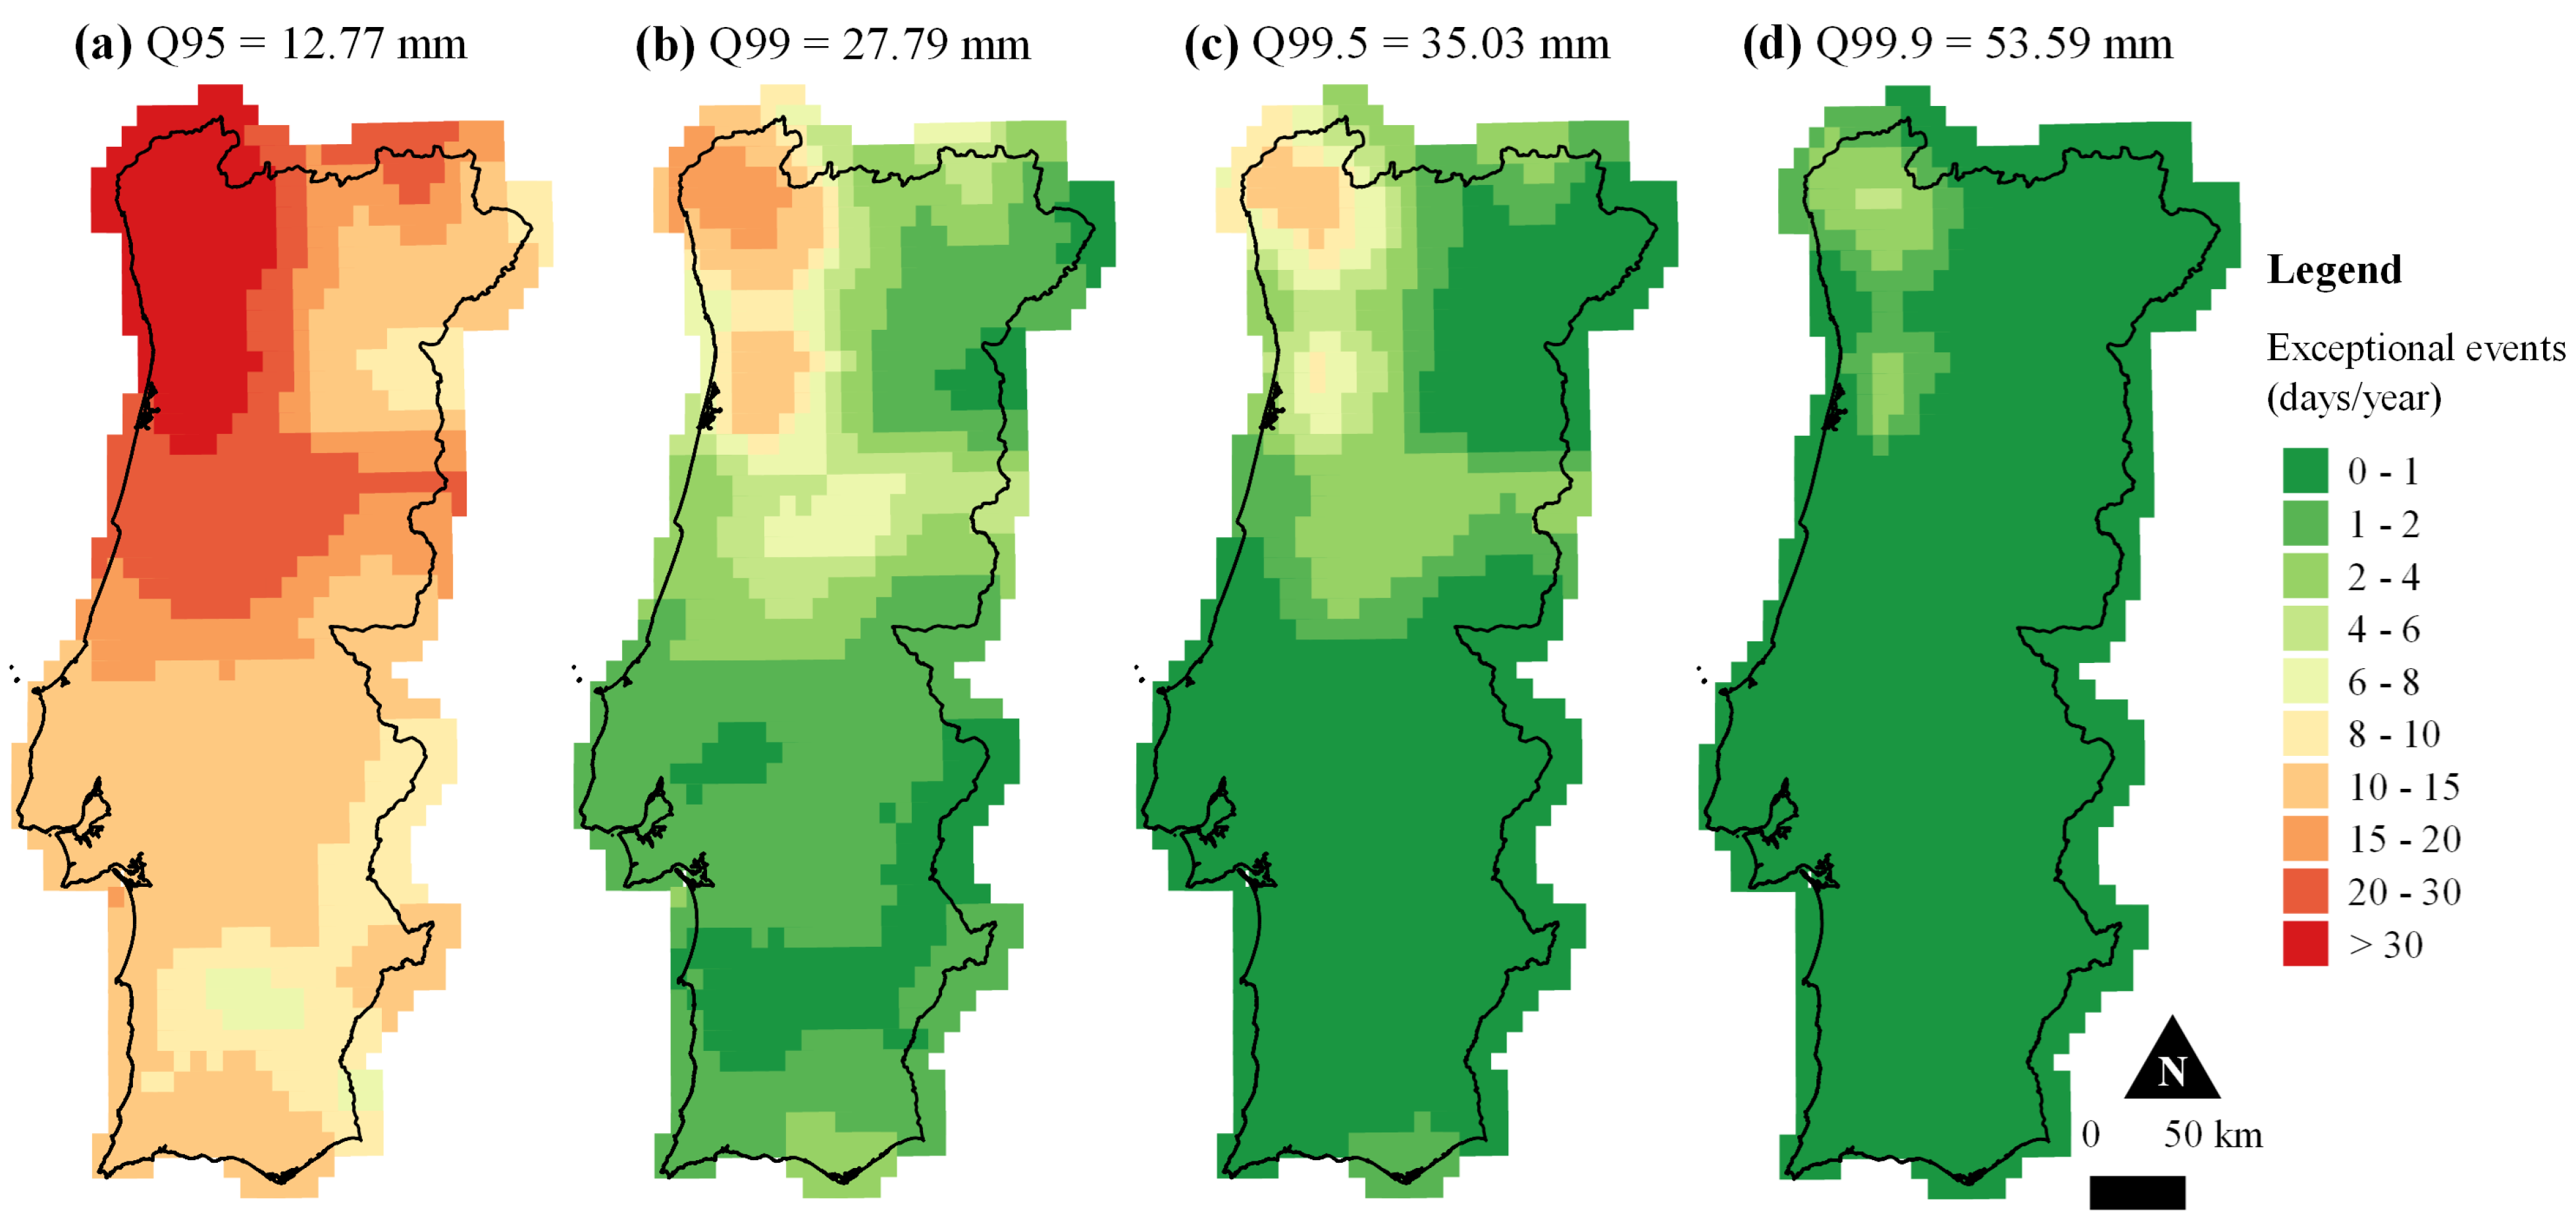
In Figure 3a, it is evident that the occurrence of exceptional events (with an average of 18.25 days/year) for the lowest quantile threshold, namely Q95, is higher in the northwestern coastal regions. Conversely, the northeastern and interior regions, as well as the central part of Beja (P0911) in the south, depict the lowest occurrences of exceptional rainfall. This differentiated behaviour indicates that the spatial development of the phenomenon does not follow a straightforward north–south pattern. This heterogeneous behaviour is also observed for the other thresholds (Figure 3b–d), albeit with a lower number of occurrences, sometimes even fewer than one exceptional event per year—for example, an average of 0.36 days/year for the Q99.9 threshold.
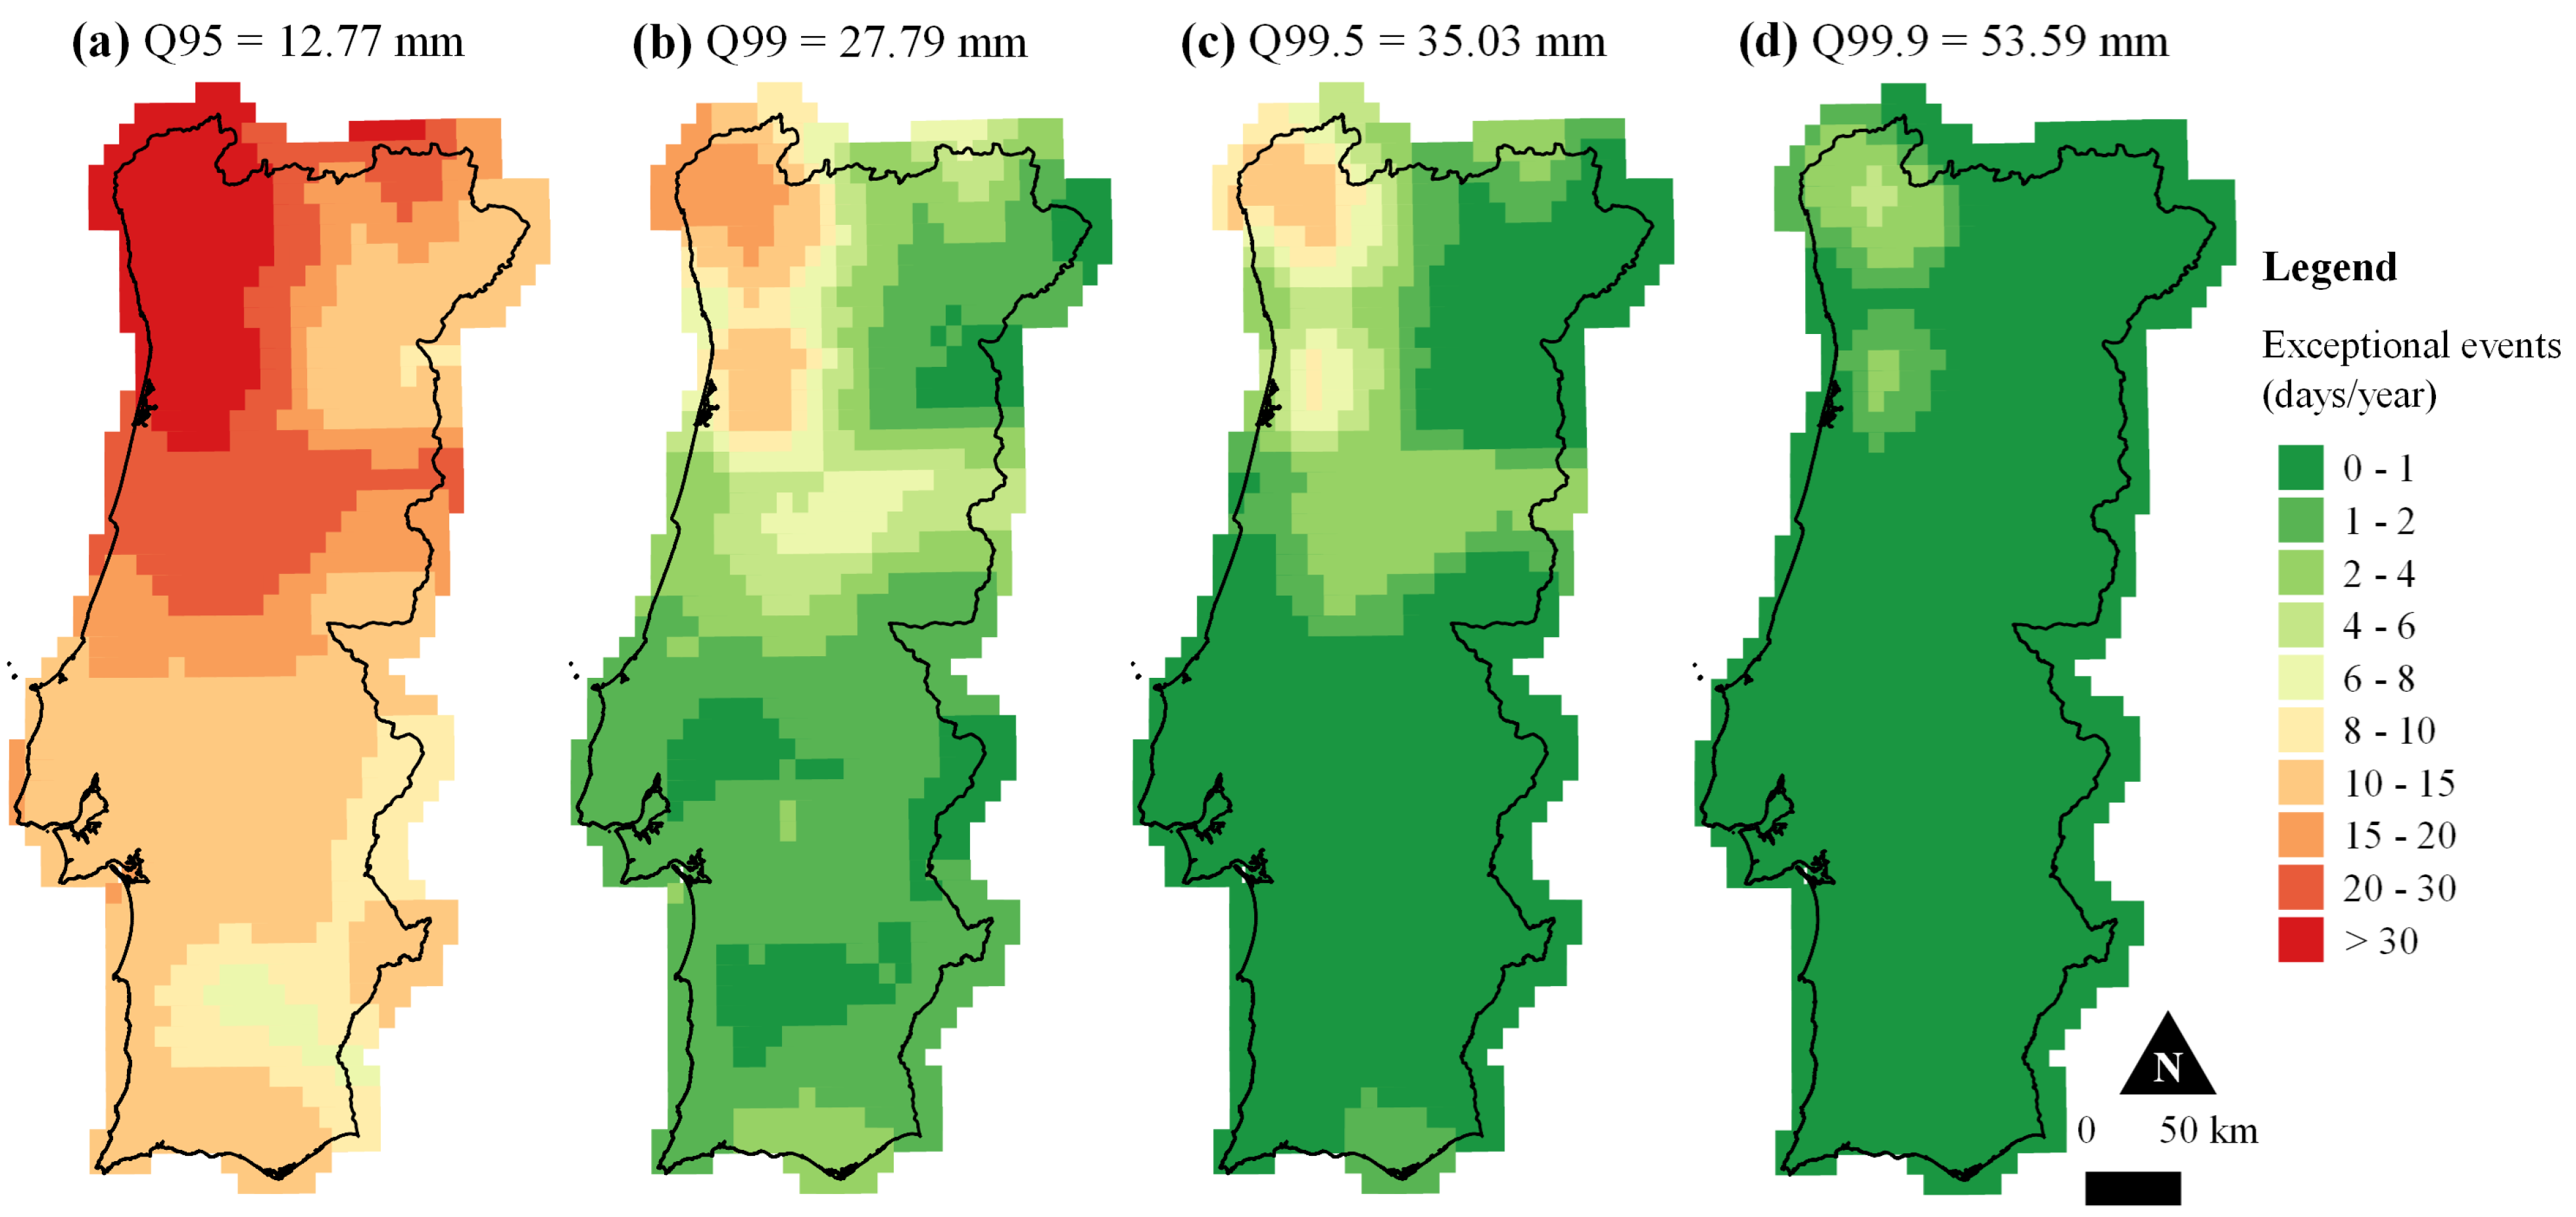
The accompanying maps for the previous results, as illustrated in Figure 4 for the late subperiod and Figure 5 for the recent subperiod, show similar patterns in the geographical distribution of exceptional events compared to the overall period. However, a more detailed comparison of the results from the two subperiods offers insights into temporal changes in the occurrence of exceptional rainfall. In Figure 5, by simply examining the number of points with higher occurrences in the recent subperiod than in the late subperiod, it can be observed that the number of points out of the 1012 (100%) grid points increases as the threshold increases, i.e., 82 (8.3%) for Q95, 277 (27.4%) for Q99, 435 (43.0%) for Q99.5, and 483 (47.7%) for Q99.5. Following the application of the t-test (Equation (1)), statistically significant changes in the number of occurrences between the two subperiods were observed solely for the highest thresholds, Q99.5 and Q99.9, at 20 and 46 grid points, respectively, (see Figure 5). Furthermore, the number of occurrences for the recent subperiod was divided by those for the late subperiod. The resulting values were weighted by the relative percentage of points with higher values in the recent subperiod and those with higher values in the late subperiod. This analysis revealed a decrease in occurrences of −5.8% for Q95 and −2.7% for Q99, in contrast to increases for higher thresholds, specifically, 1.4% for Q99.5 and 10.6% for Q99.9. These findings highlight shifts in the number of occurrences of exceptional events in the recent subperiod compared to the late one.

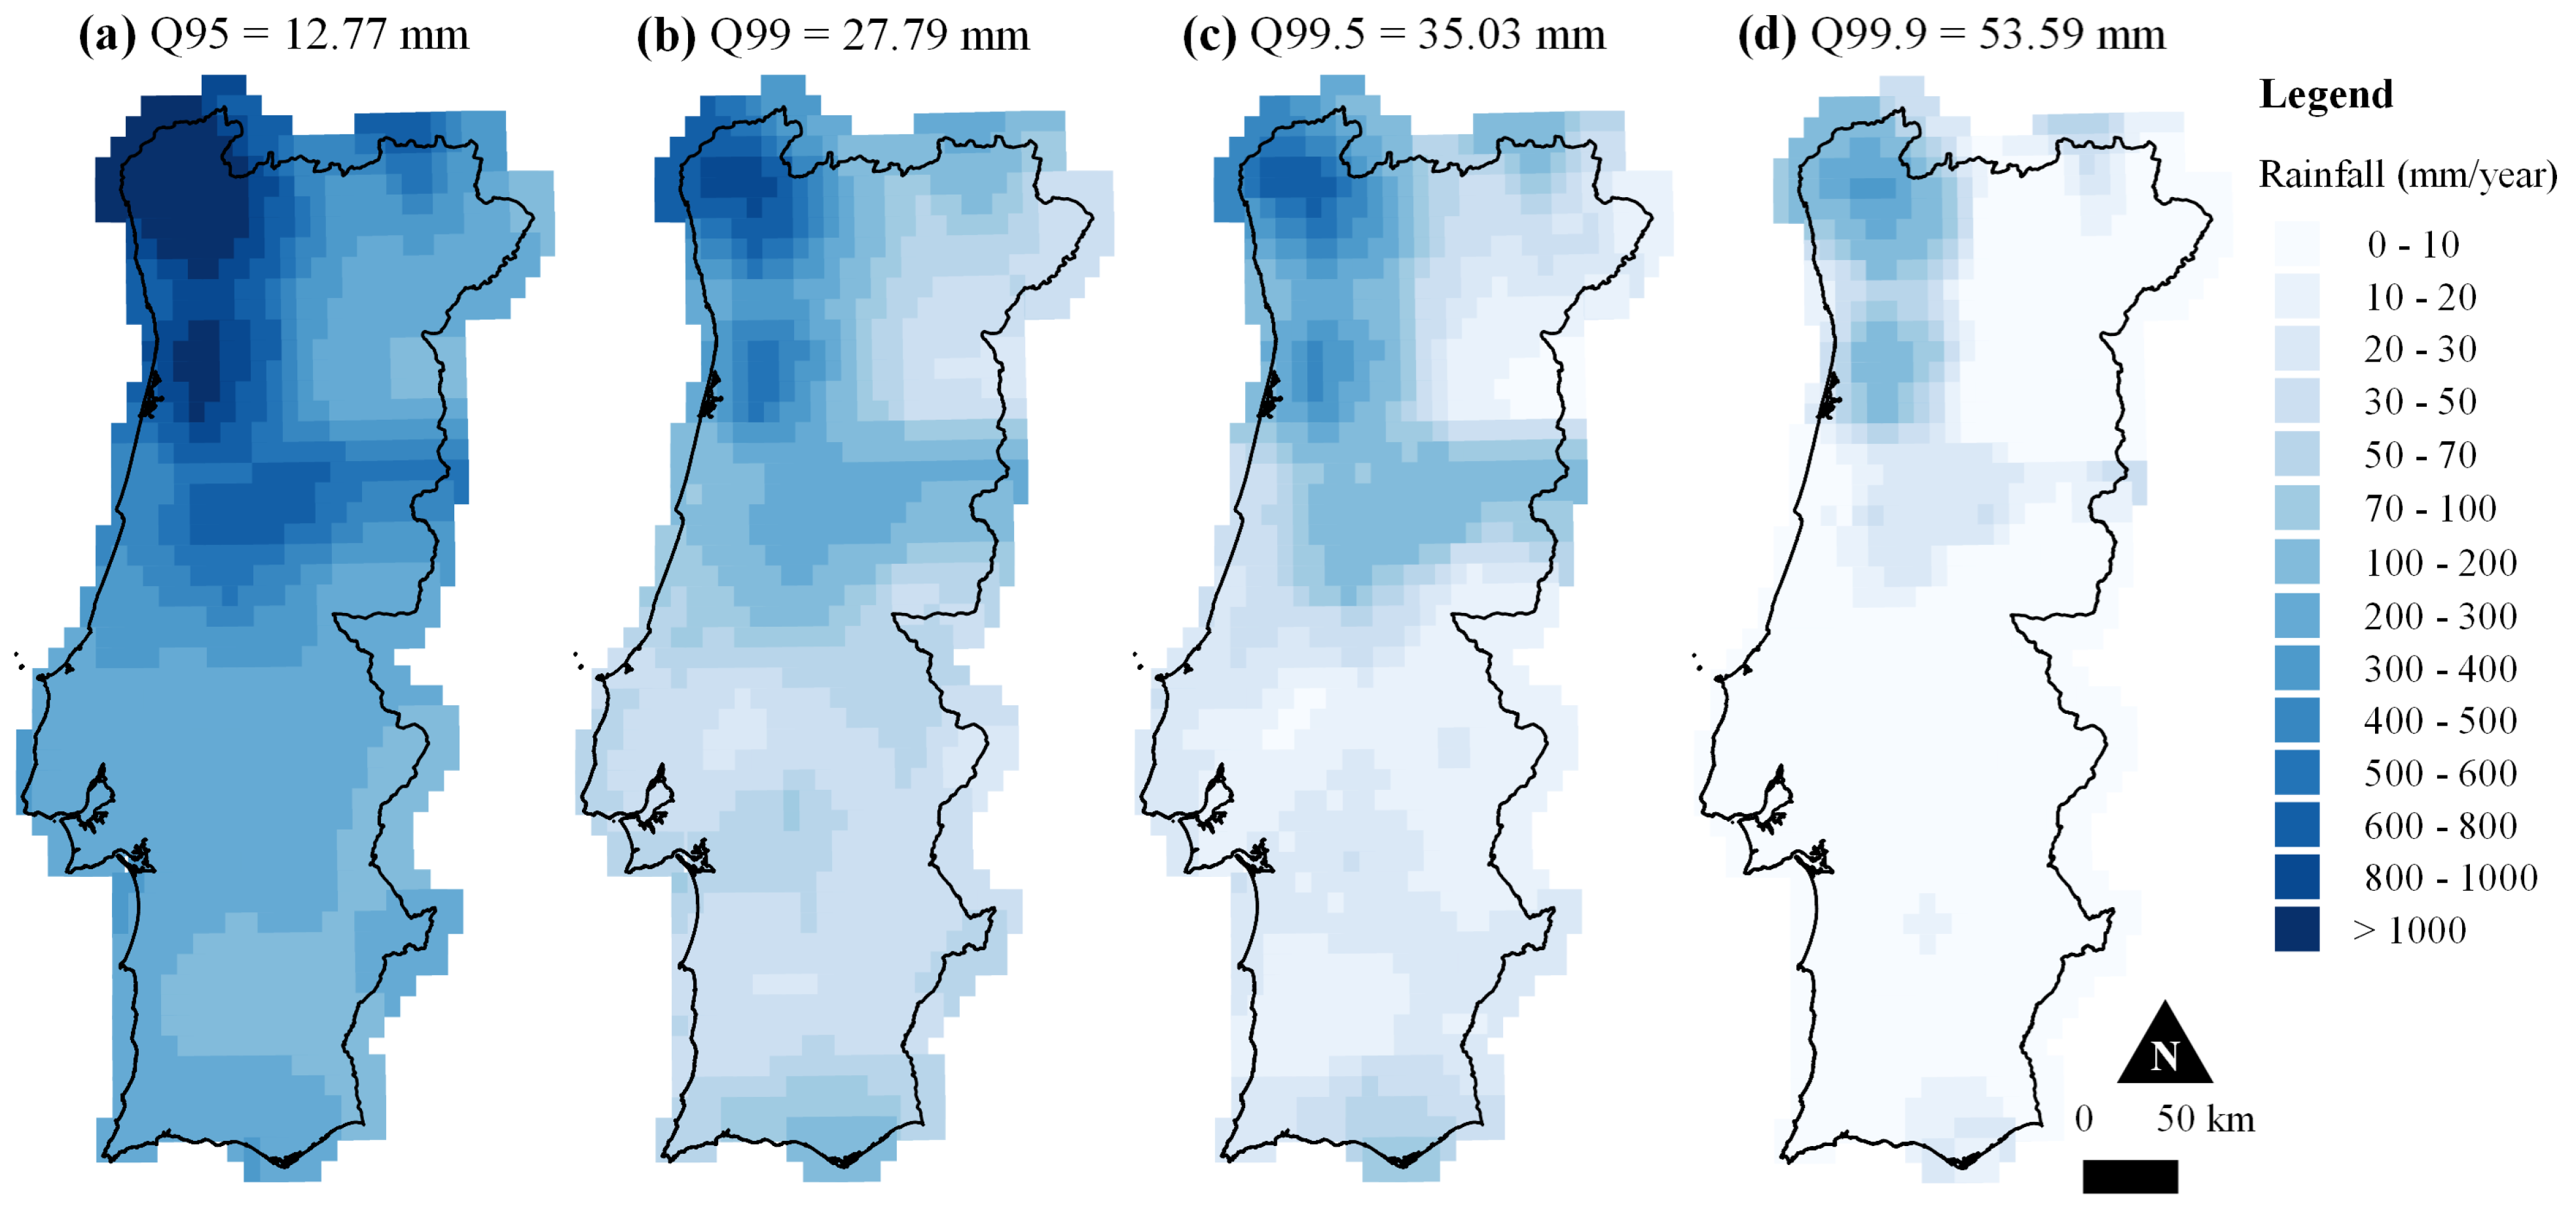
3.3. Cumulative Rainfall above the Threshold

The investigation into cumulative impacts, specifically in terms of cumulative rainfall resulting from exceptional rainfall and analysed across distinct thresholds using the ERA5-Land dataset, is delineated for the overall period (Figure 6) and the two subperiods (Figure 7 and Figure 8). This part of the analysis delves into the mean annual cumulative rainfall above the same four quantile thresholds (Q95, Q99, Q99.5, and Q99.9), offering enhanced insights into the spatial and temporal evolution of cumulative impacts.
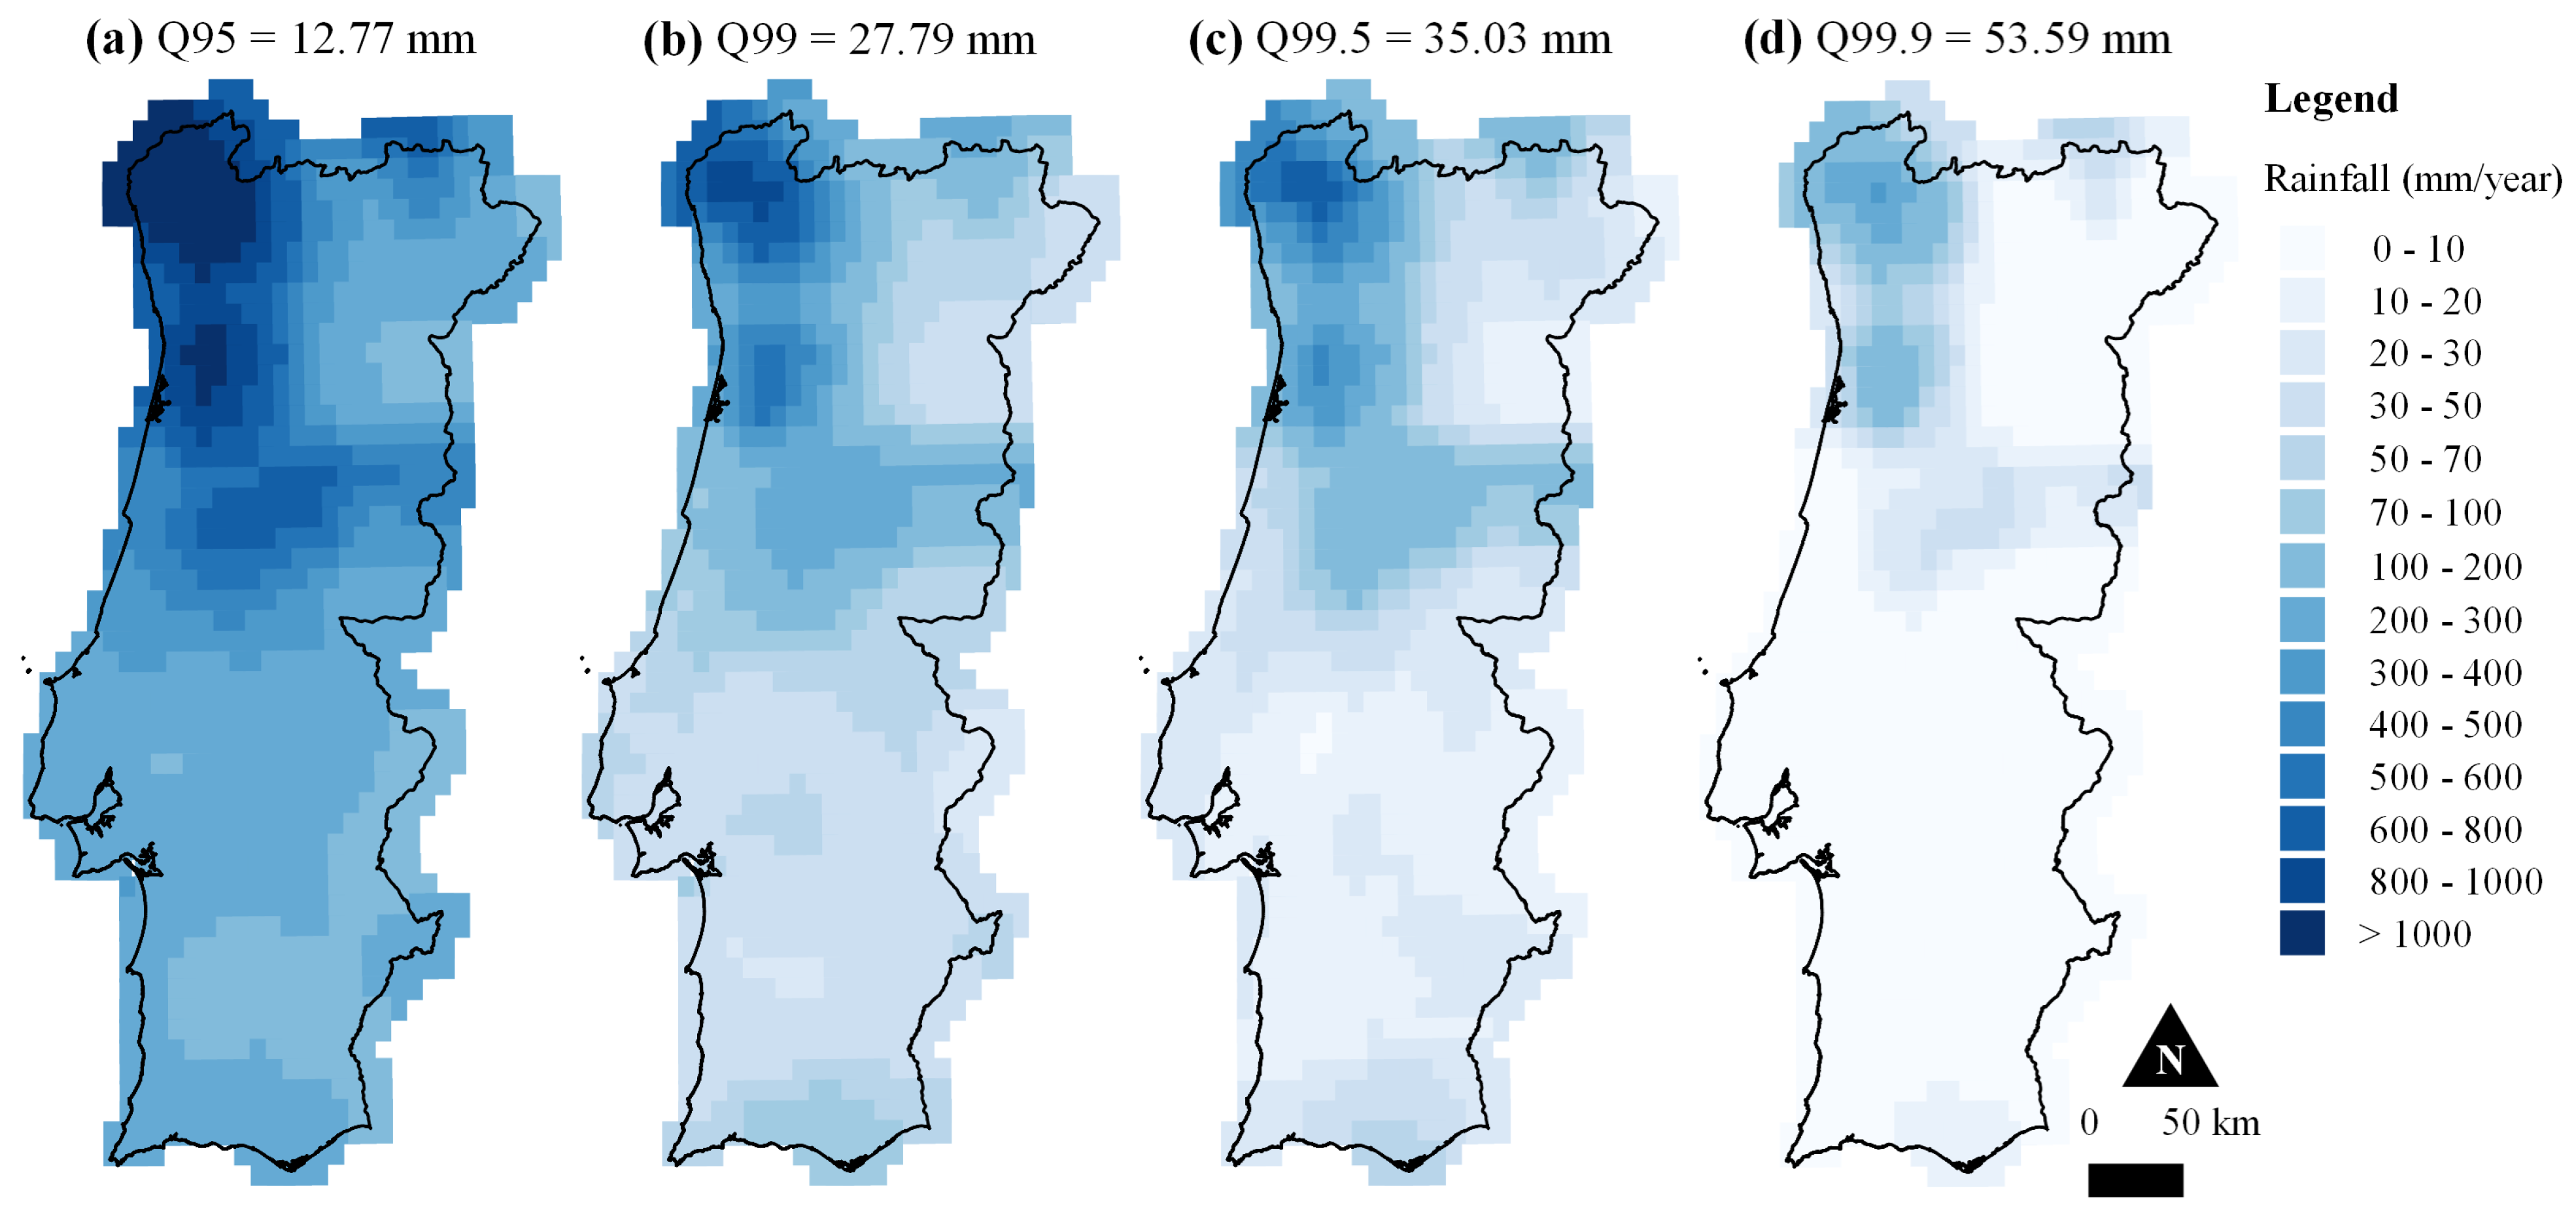
According to Figure 1b, the mean annual rainfall throughout the 42 hydrological years of the overall period is 787.0 mm/year, with a pronounced concentration in the northwestern part of Portugal, where locations exceed 1200.0 mm/year (e.g., P0059 grid point in the Montalegre vicinity with 1238.9 mm/year). The highest mean annual rainfall is situated in the north, specifically in the region of Braga (P0079 with 1934.3 mm/year), while the lowest is in the south in Faro (P1045 with 411.3 mm/year). From Figure 6, the contribution of the cumulative rainfall to the previous mean annual rainfall values, on average for each of the thresholds, is 51.7% for Q95 (407.1 mm/year), 18.0% for Q99 (141.3 mm/year), 10.8% for Q99.5 (84.8 mm/year), and 3.0% for Q99.9 (23.9 mm/year).This comparison provides insights into the distribution and magnitude of cumulative impacts resulting from exceptional rainfall across various thresholds. It is evident that Q95 significantly contributes to cumulative rainfall, whereas higher rarity thresholds, such as Q99.5 and Q99.9, make comparatively smaller contributions, as expected.
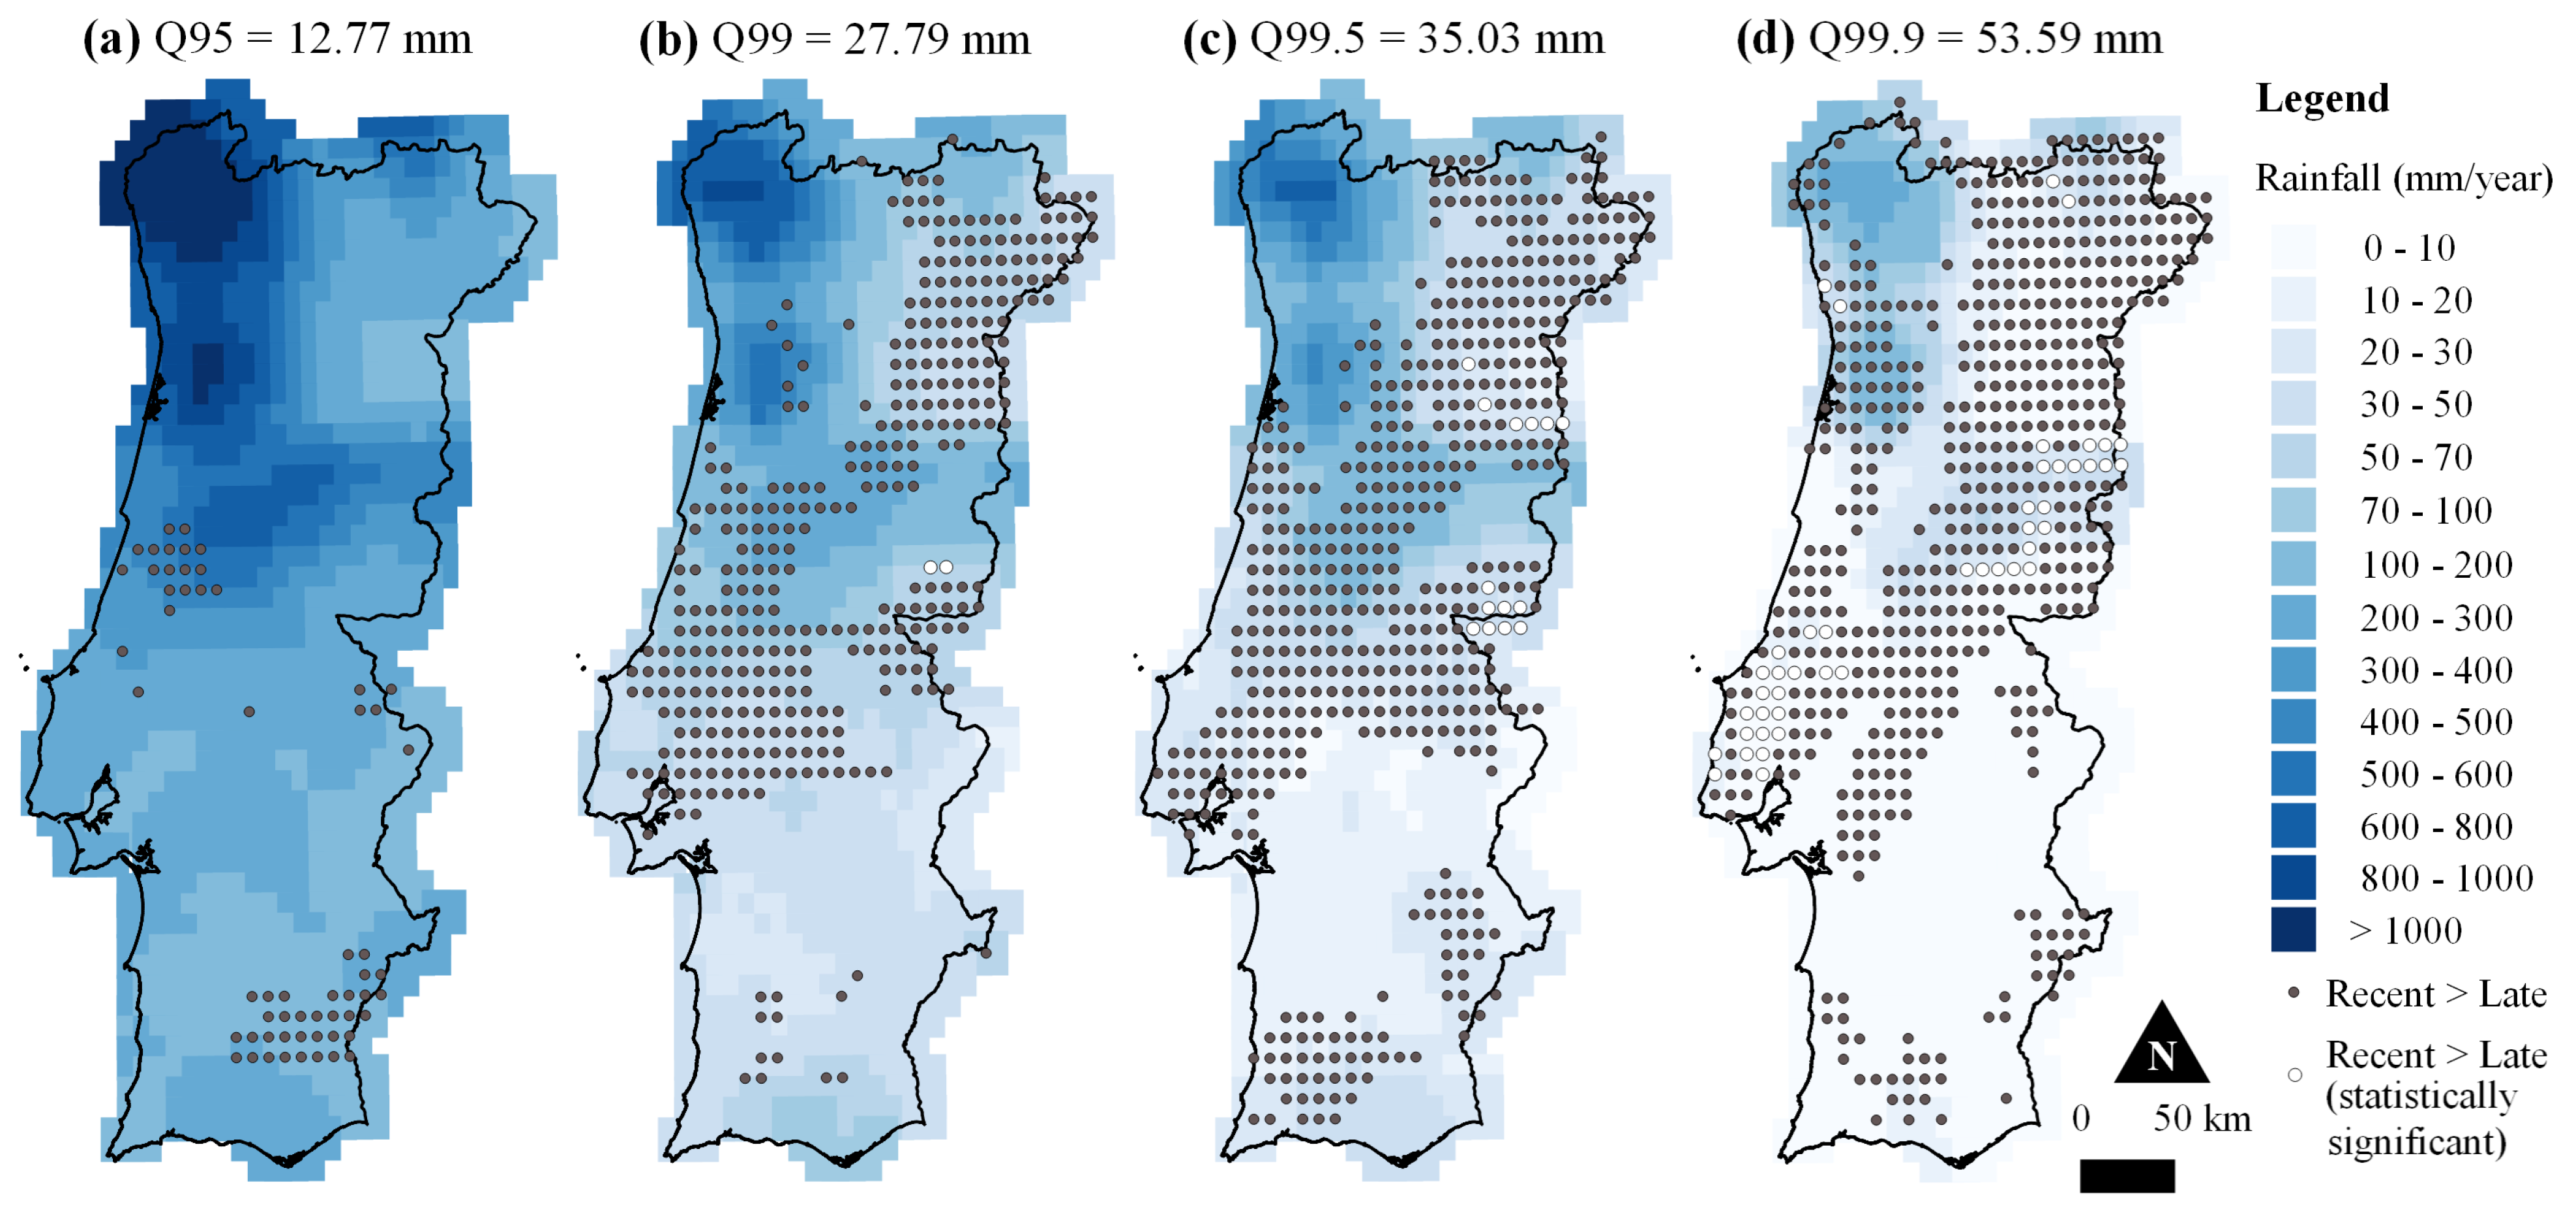
In the late subperiod (Figure 7a–d), the mean annual values of cumulative rainfall are 419.8 mm/year for Q95, 144.8 mm/year for Q99, 86.1 mm/year for Q99.5, and 23.9 mm/year for Q99.9. Conversely, during the recent subperiod (Figure 8a–d), the corresponding figures are marginally lower for the first three thresholds, with values of 394.4 mm/year, 137.9 mm/year, 83.6 mm/year, and 24.6 mm/year, respectively. This observation suggests an overall decrease in cumulative rainfall from the late subperiod to the most recent one, with the exception of Q99.9, which experienced an approximate 6% increase. Upon comparing Figure 7 and Figure 8, substantial intensifications of the phenomenon become apparent. The number of locations with higher cumulative rainfall in the recent subperiod has increased in more than half of the grid for the most rare threshold (Figure 8d), occurring in 59 grid points (5.8%) for Q95, 348 grid points (34.4%) for Q99, 504 grid points (49.8%) for Q99.5, and 580 grid points (57.3%) for Q99.9, with the latter two showing 14 and 45 statistically significant results (rejecting H 0 and accepting H 1 ), respectively. Accordingly, the increase in these grid points from one subperiod to the next has been 2.5%, 9.5%, 8.0%, and 42.9%. This evidence indicates that despite the decrease in cumulative rainfall totals, the most rare and exceptional events have somewhat intensified.
The cumulative impacts are significant contributors to extreme weather events, including floods and landslides, which have substantial implications for environmental systems, infrastructure, and communities [25,26]. A detailed understanding of cumulative impacts is instrumental for improved risk assessment and management, particularly in regions susceptible to such occurrences [27,28]. Building upon the insights gained from the occurrences of exceptional rainfall, this exploration into cumulative impacts adds a layer of depth to the comprehension of hydrological dynamics in Portugal, aimed at providing a foundation for strategies in infrastructure planning, climate change adaptation, and overall resilience.

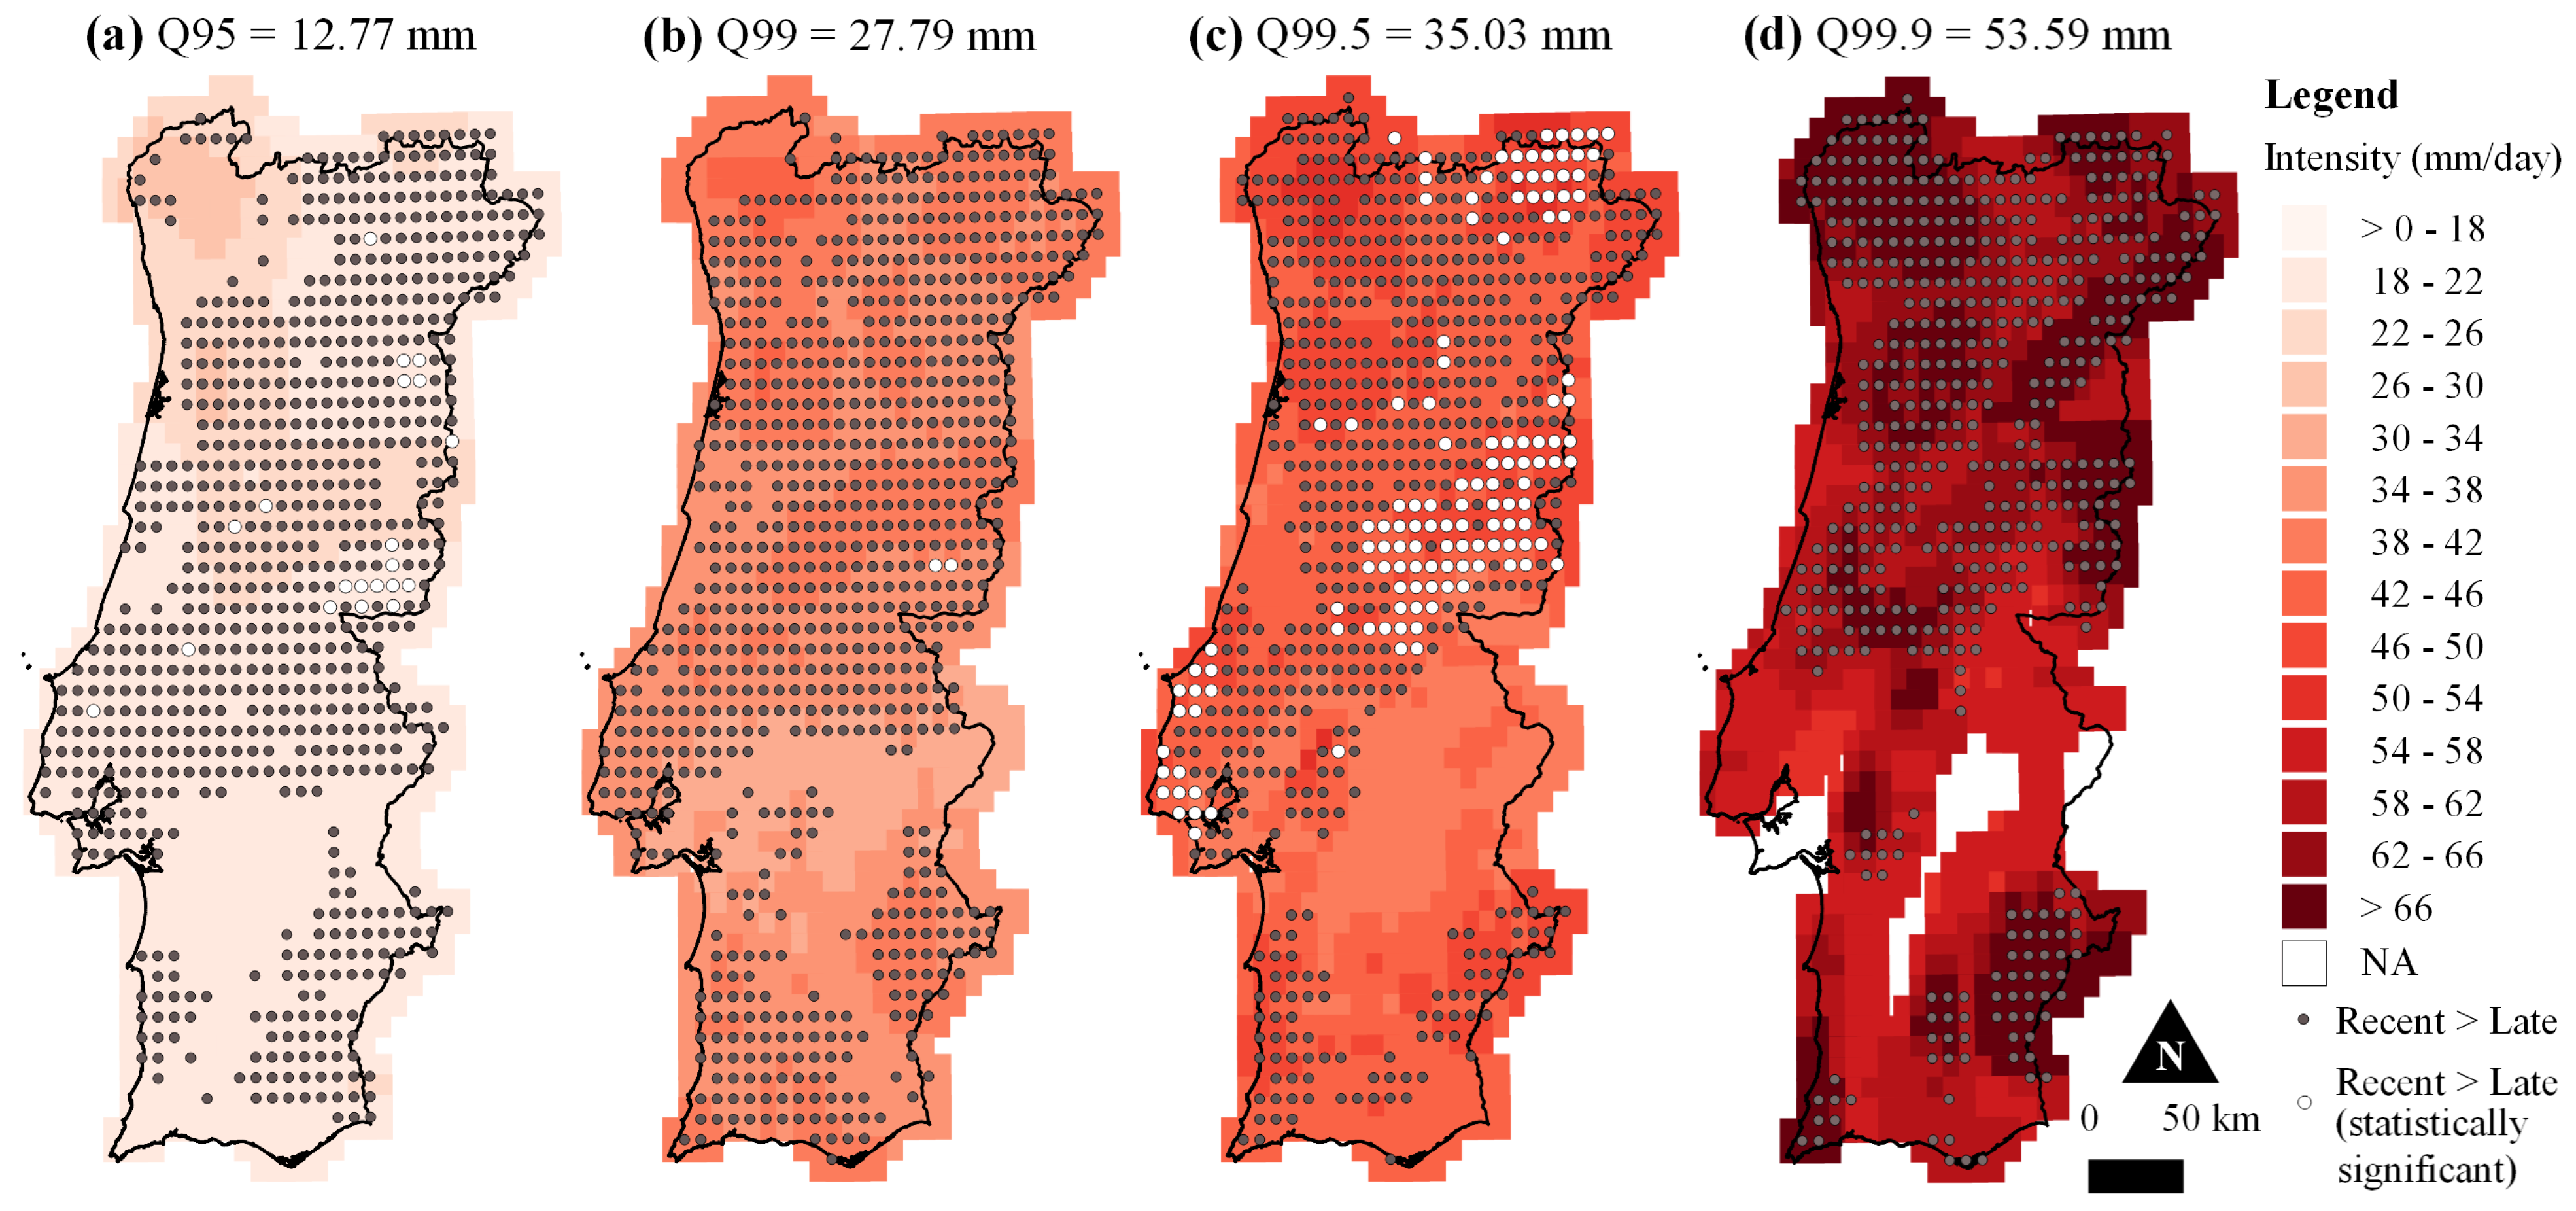
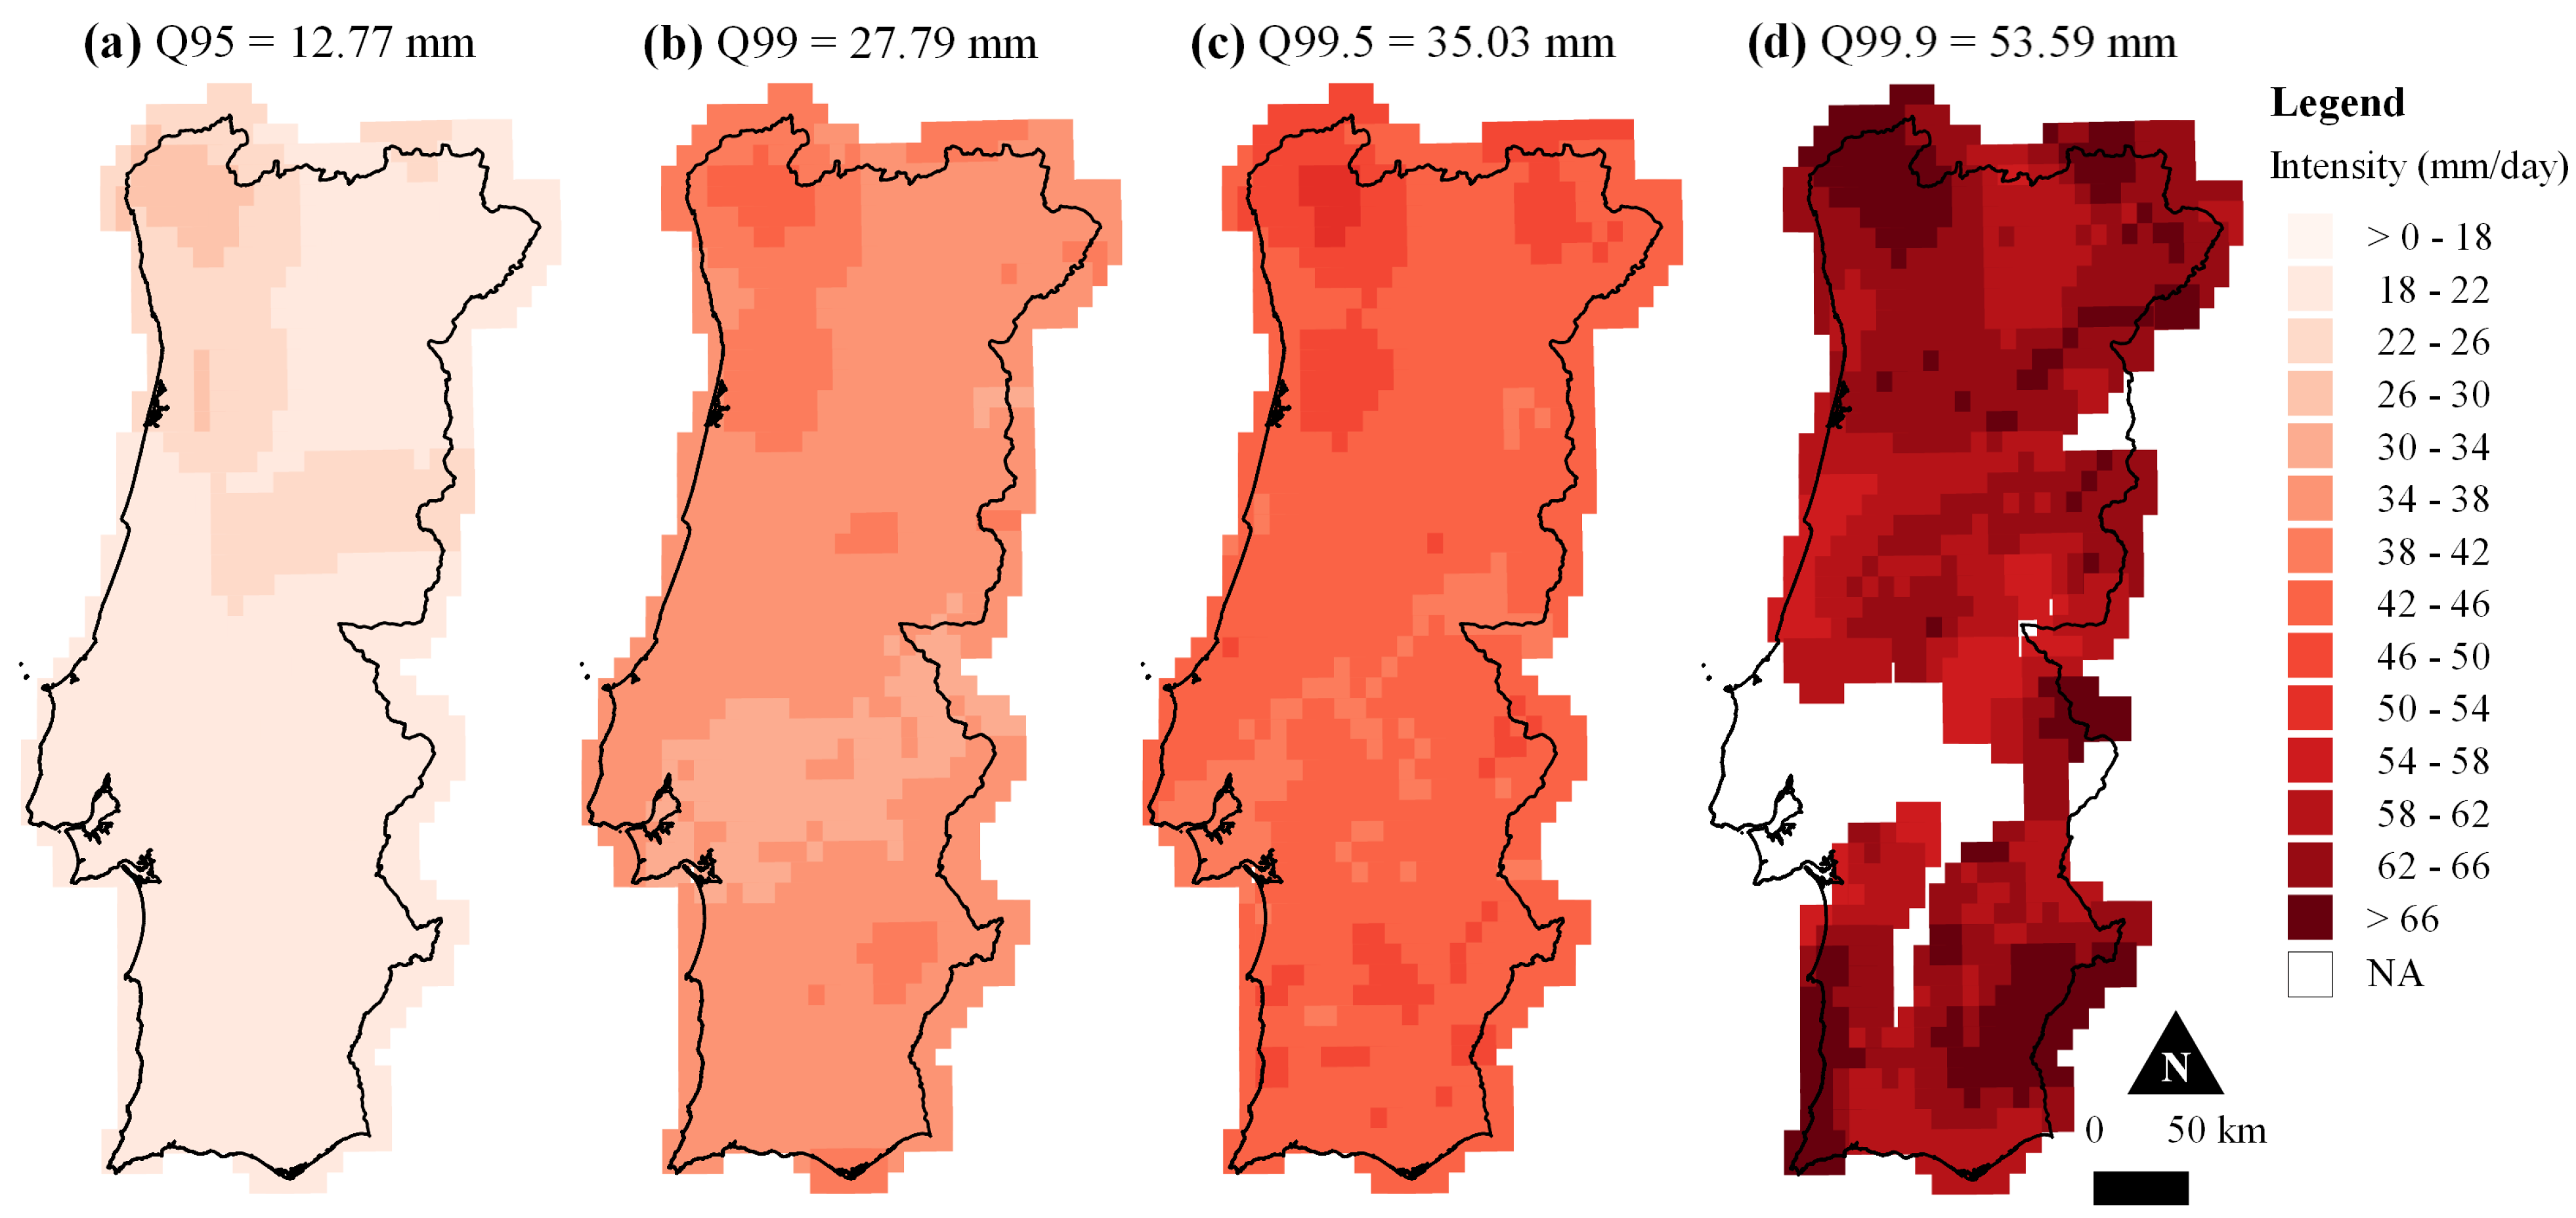
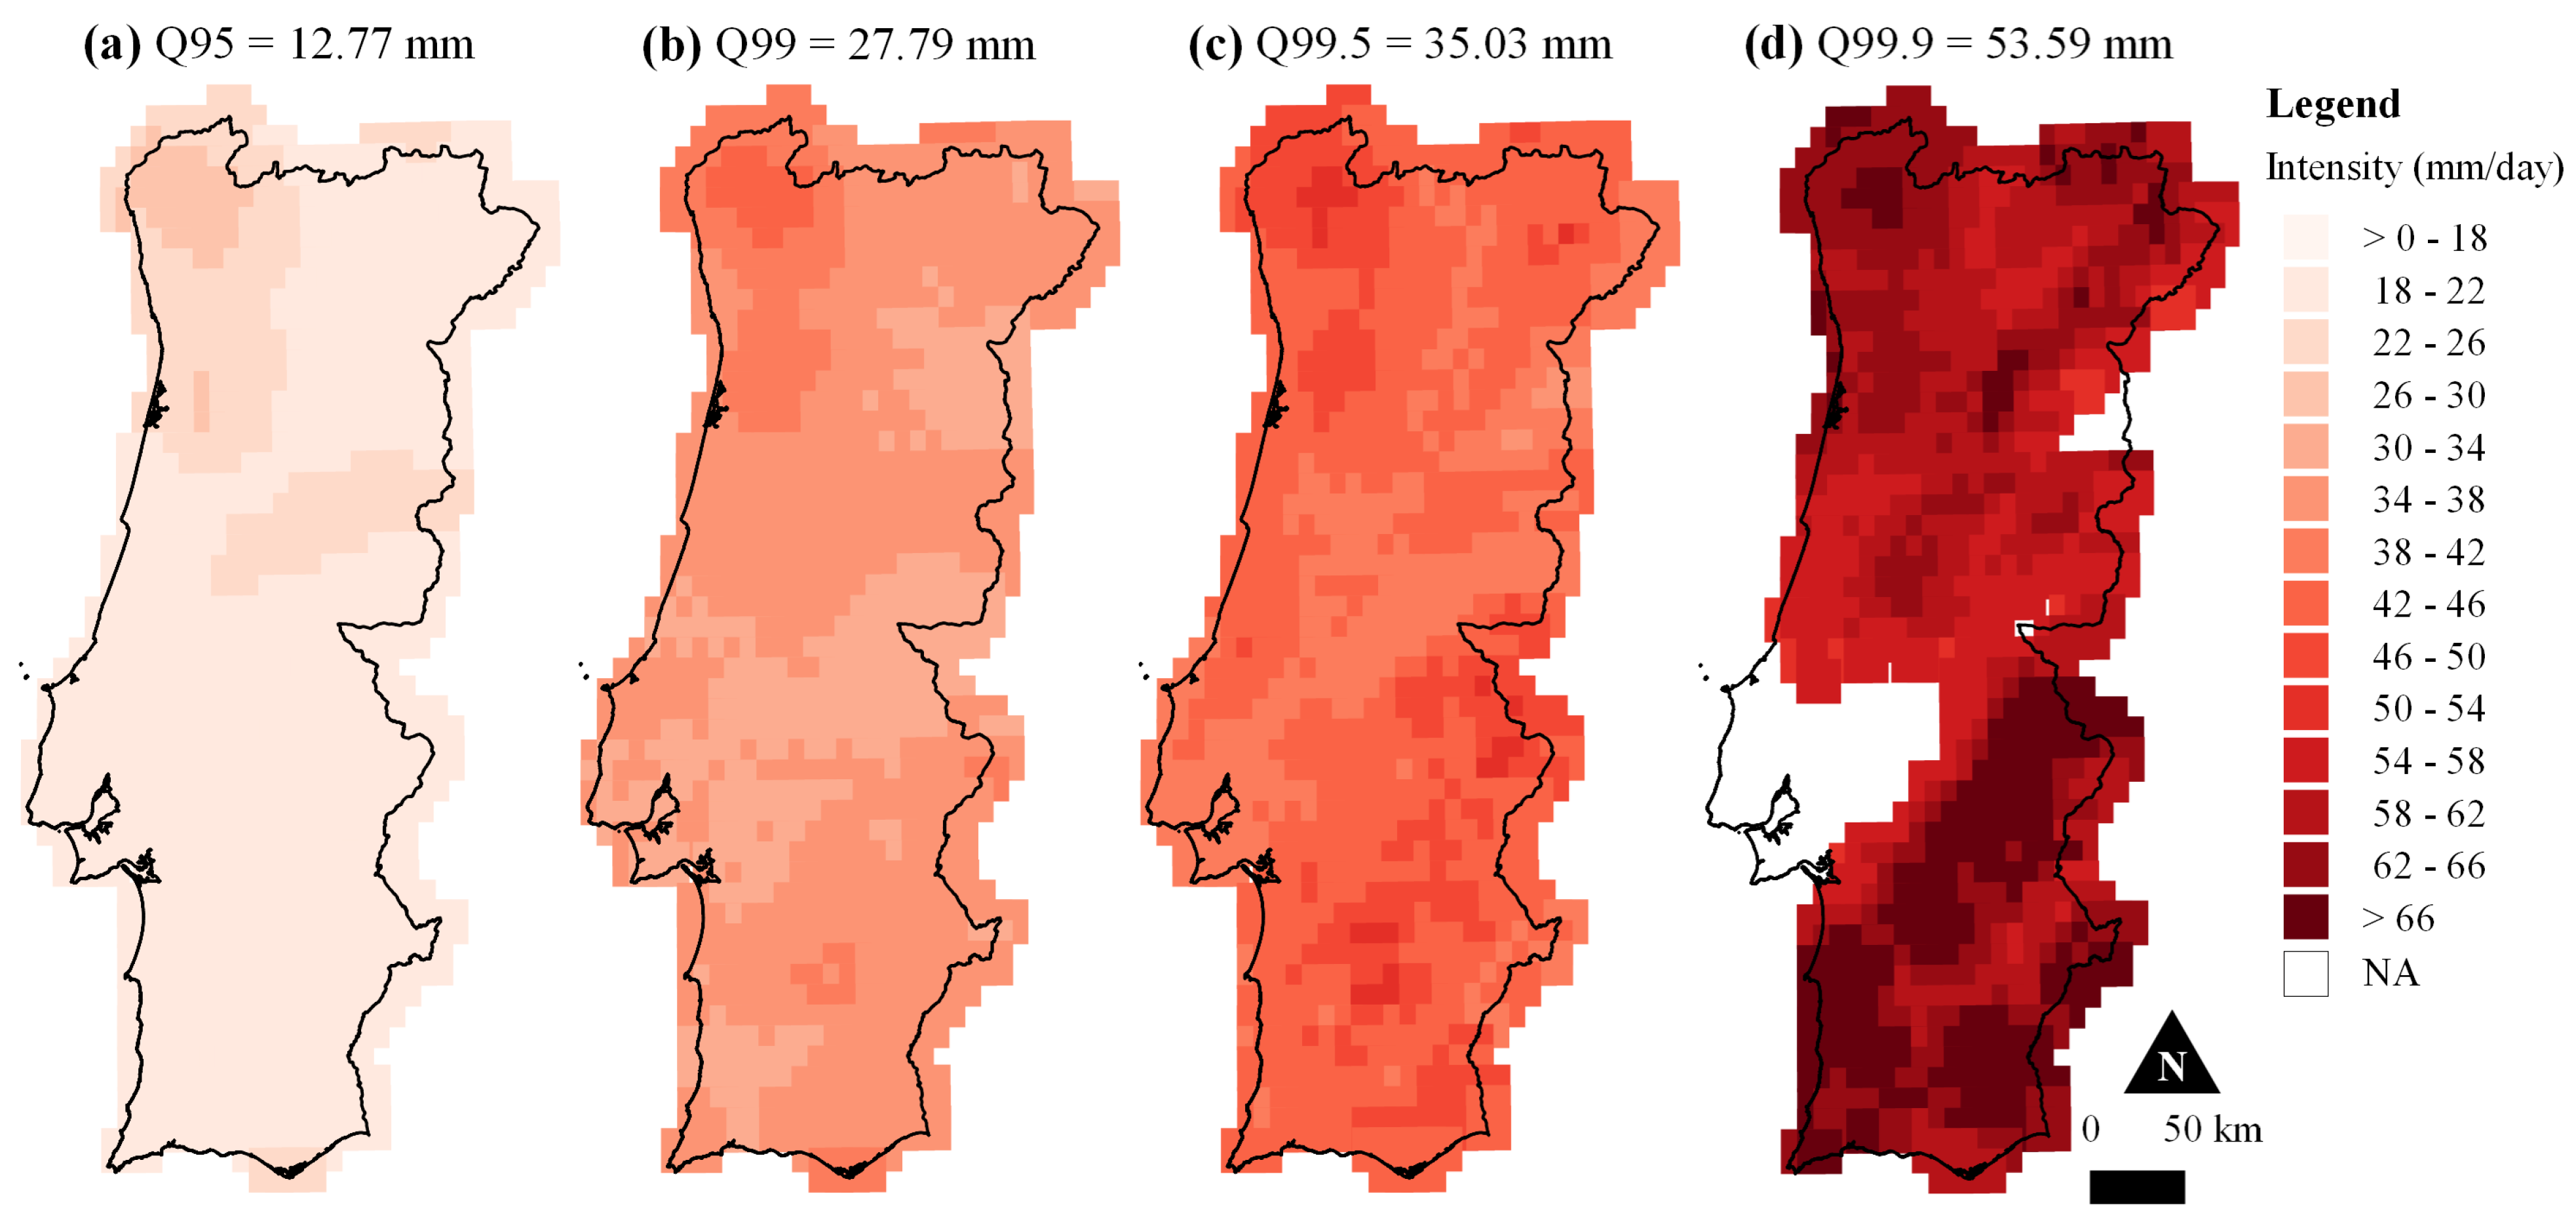
3.4. Rainfall Intensity of Exceptional Events

The investigation into rainfall intensity emerged from a coupled analysis of the number of occurrences and cumulative rainfall. Rainfall intensity, defined in this application as the annual cumulative rainfall divided by the annual number of occurrences of daily rainfall surpassing the threshold, furnishes a focused perspective on the concentration and vigour of exceptional events. This facilitates the discernment of whether changes in occurrences and cumulative impacts are mirrored by alterations in the intensity of exceptional rainfall. This metric also offers valuable insights into the efficiency with which such events contribute to cumulative impacts, including factors such as floods and landslides, as mentioned at the end of the previous subsection. The spatial representation of the mean annual values of the rainfall intensity of exceptional events is illustrated in Figure 9 for the 42-hydrological-year overall period, Figure 10 for the late 21-hydrological-year subperiod, and Figure 11 for the recent 21-hydrological-year subperiod. The examination of how the intensity of these events varies across quantile thresholds and subperiods contributes to a more comprehensive assessment of hydrological trends.
The spatial distribution of the mean annual rainfall intensity of exceptional events across Portugal during the overall period, presented in Figure 9, highlights regional variations. Areas with heightened rainfall intensity are evident for Q95 in the northern coastal regions and Castelo Branco (P0515) in the interior. As the threshold increases, the distribution of rainfall intensity shows more heterogeneous behaviour (e.g., for Q99 and Q99.5). However, for the highest threshold (Figure 9d), the distribution of more intense events shifts, compared to the lowest quantile, and is focused on the interior region of Portalegre (P0752), at the same latitude as Lisbon (P0761), and in the south of the country, such as in the western coast and the centre of Beja (P0911). This demonstrates that despite these locations having the lowest mean annual cumulative rainfall (Figure 6d), they denote the highest intensity, underscoring the significant role of the interaction of occurrences and cumulative impacts.
In the 42-hydrological-year overall period (1981/1982–2022/2023), it is noteworthy that 37 reanalysis locations reported no occurrences whatsoever of events above the Q99.9 threshold, resulting in no cumulative rainfall above the threshold and, consequently, no intensity. However, Figure 9d has been constructed with only 753 grid points that have occurrences in both the late and recent subperiods, omitting 259 grid points denoted as “Not Applicable” (NA). In the 1981/1982–2001/2002 subperiod (Figure 10d), 160 grid points have no occurrences (i.e., 160 NAs), whereas in the 2002/2003–2022/2023 subperiod (Figure 11d), there are 136 NAs. This reflects a decrease in the number of locations without exceptional events from the late to the most recent 21 years, also highlighting areas presenting quite rare events, such as southern Santarém (P0636) and the Lisbon (P0761) district. Concerning rainfall intensity, it has increased in more than half of the grid points, regardless of the threshold. Categorically, out of the 1012 grid points, 724 points (71.5%) exhibit higher mean annual rainfall intensity in the recent subperiod in comparison to the late one for Q95 (Figure 11a), 776 points (76.7%) for Q99 (Figure 11b), 678 points (67.0%) for Q99.5 (Figure 11c), and 602 points (59.5%) for Q99.9 (Figure 11d). In the previous figures, 20 grid points denoted statistically significant results for Q95, 2 grid points for Q99, and 132 grid points for Q99.5. For Q99.9, the t-test could not be applied due to the high number of NAs in some cases, i.e., the number of elements failed to ensure the representativeness of the compared samples (less than 20 elements). The notorious reduction in locations without exceptional events and the heightened intensity across various thresholds underscore the dynamic nature of hydrological processes in Portugal. This changing scenario emphasises the necessity for continuous monitoring and adaptive strategies to address the evolving risks associated with exceptional rainfall.
The intricate interplay between occurrences and cumulative rainfall (i.e., rainfall intensity) contributes to a comprehensive understanding of the patterns governing exceptional rainfall across different regions and quantile thresholds. This insight carries implications for targeted risk mitigation and adaptation strategies, particularly in regions with lower cumulative rainfall that may still face heightened intensity, posing a unique set of challenges. This detailed examination highlights the evolving pattern of exceptional rainfall, exemplified by the shift of the most intense events from south to north, as observed by comparing Figure 10d to Figure 11d. These shifts indicate changes in occurrence patterns and an overall increase in rainfall intensity.
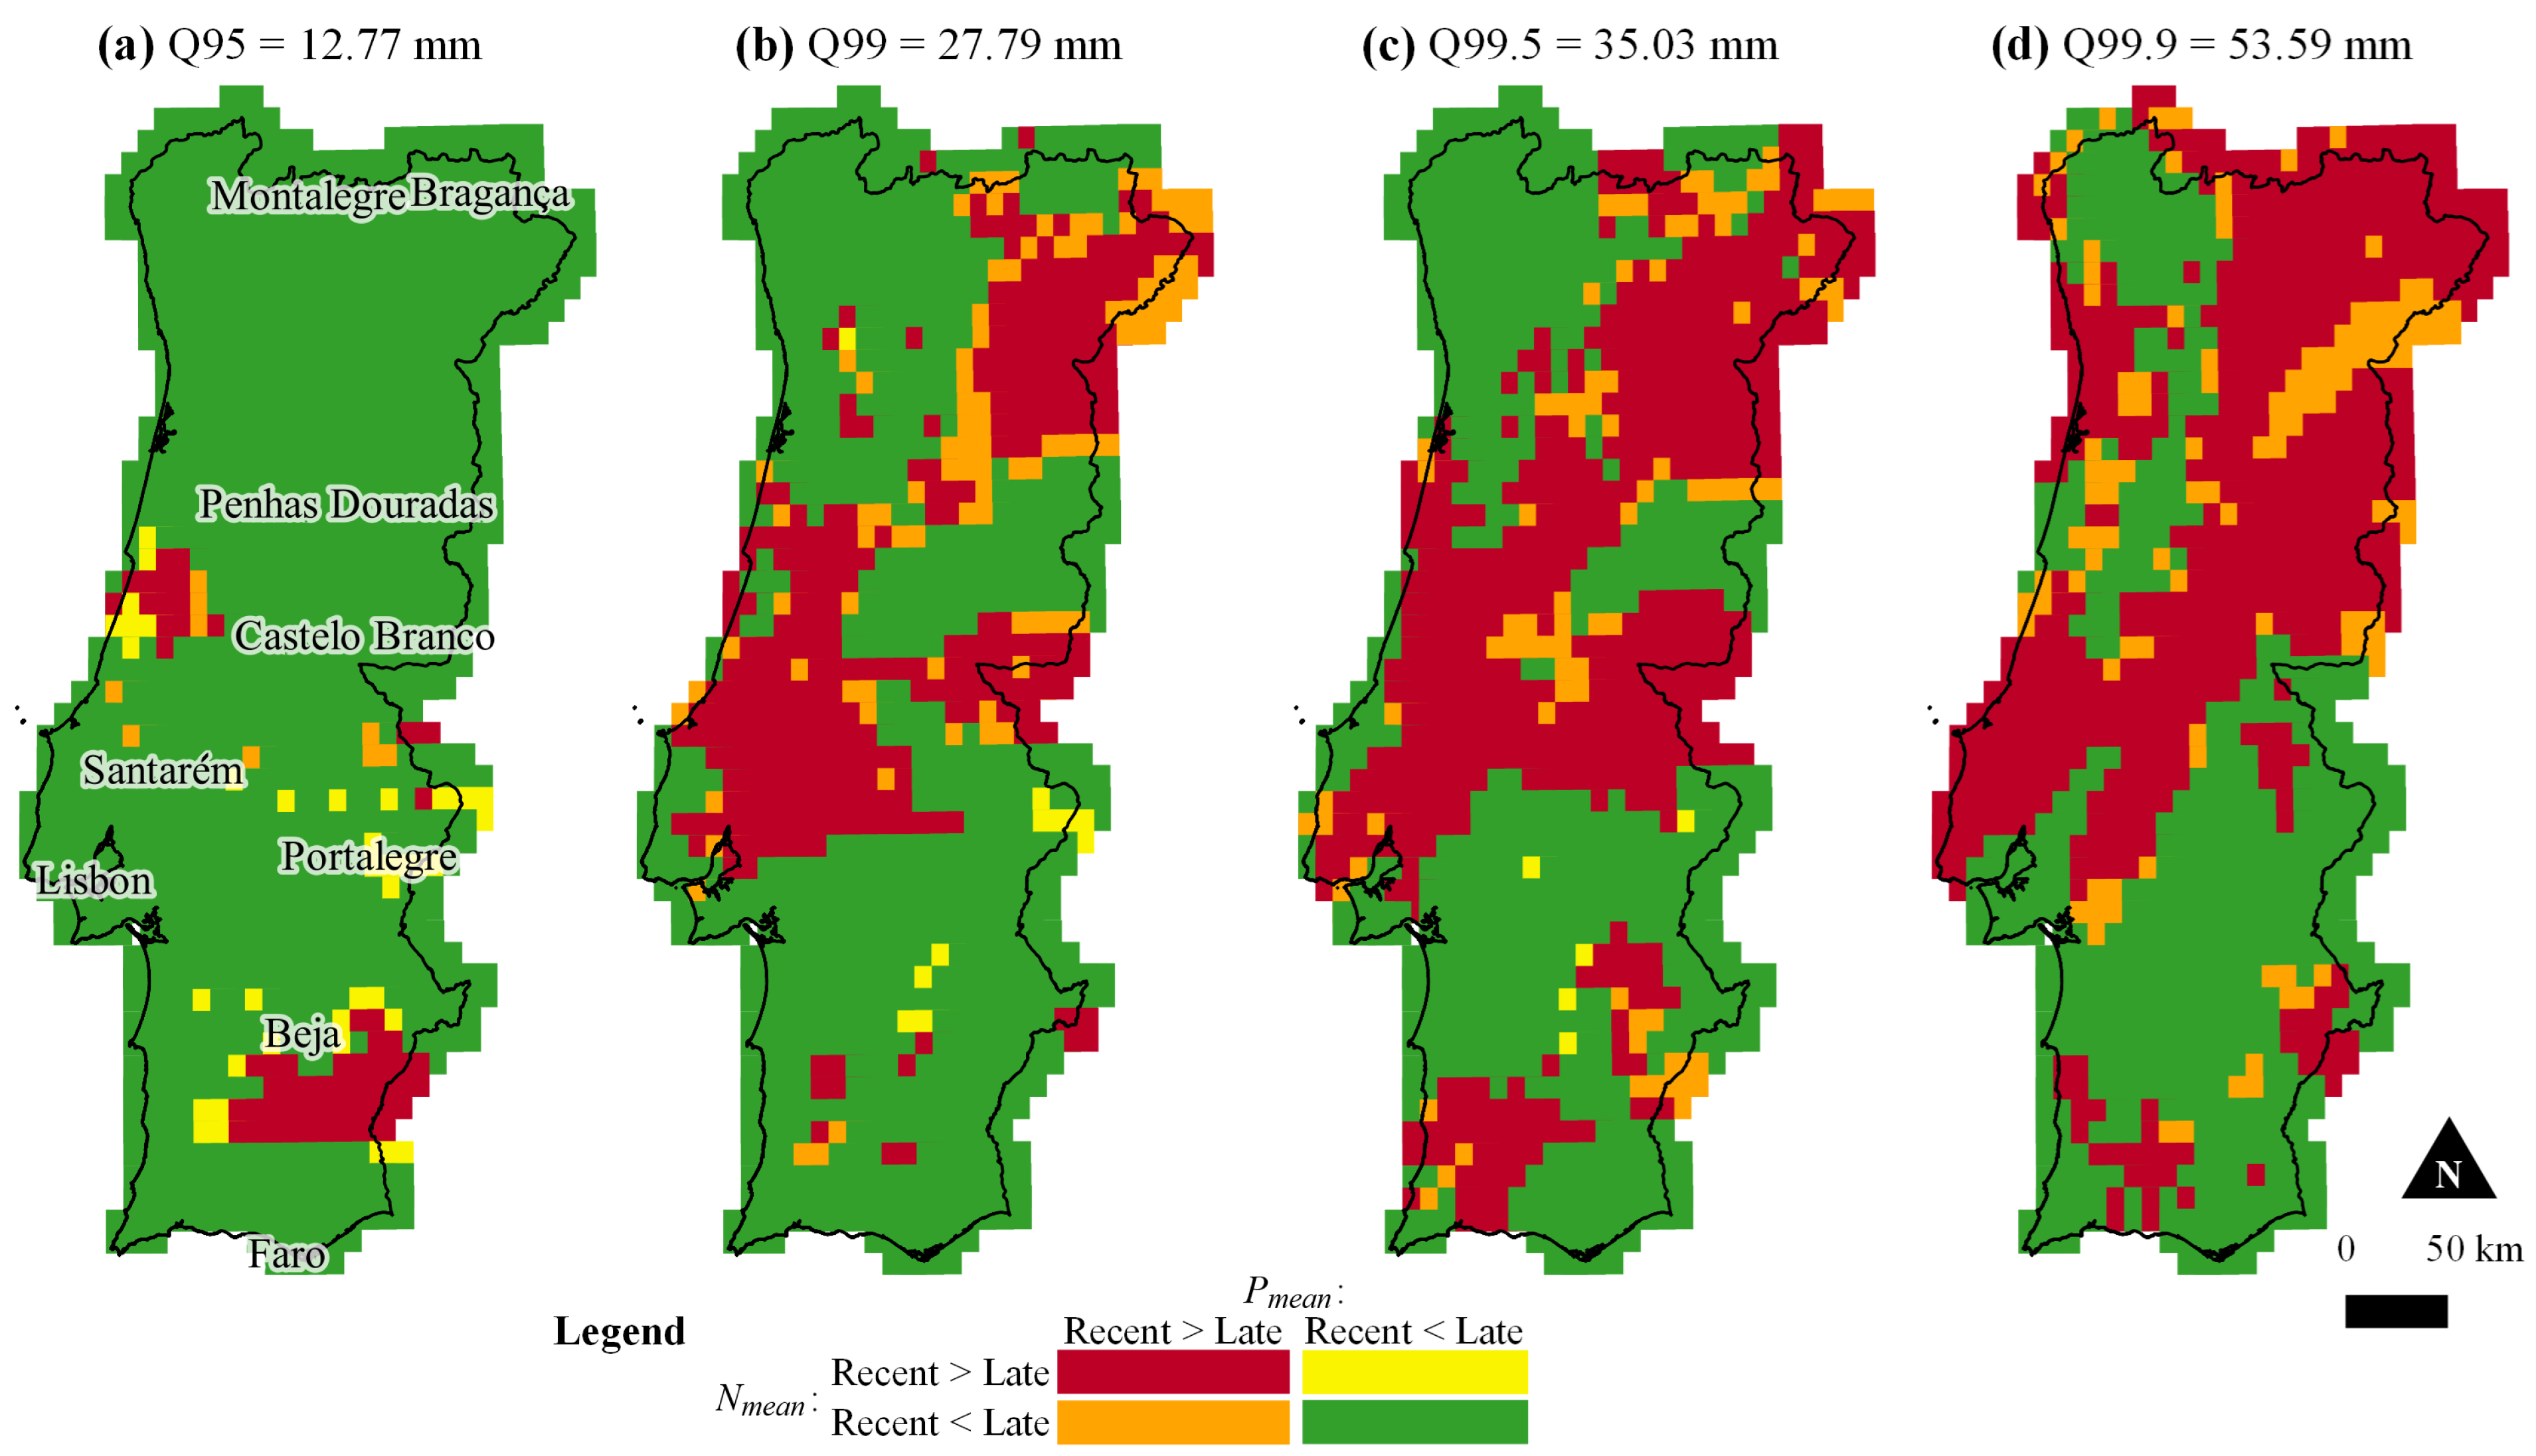
4. Discussion

The intricate interplay between occurrences and cumulative impacts of exceptional events in Portugal has been addressed through a comprehensive investigation spanning 42 hydrological years from 1981/1982 to 2022/2023. This interplay, recognised as rainfall intensity, has facilitated a nuanced understanding of the patterns governing exceptional rainfall across various regions and quantile thresholds relevant for extreme rainfall modelling. Valuable insights into the changes in exceptional rainfall across Portugal have been contributed by the analysis, which relies on the validated ERA5-Land dataset benchmarked against well-established meteorological records from SNIRH and IPMA (1980–2021). In total, the findings in this study contribute to advancing the understanding of hydrological dynamics, offering valuable insights for informed decision-making in risk management and sustainable development strategies tailored to the changing patterns of exceptional rainfall in the country.

4.1. ERA5-Land’s Reliability in Analysing Global Rainfall

The evaluation of ERA5-Land’s ability to replicate exceptional rainfall in Portugal through empirical non-exceedance probability curves (NR-NEP) presented insightful findings in this study. Temporal considerations, as emphasised by Muñoz-Sabater et al. [13], accentuate the historical nature of ERA5-Land data, distinct from real-time data. This aligns seamlessly with the study’s approach, where the dataset’s historical context proves indispensable for conducting comprehensive, exceptional rainfall analyses. The NR-NEP curves, depicted in Figure 2, played a pivotal role in the comparative evaluation between ERA5-Land and meteorological station records. These curves, portraying non-exceedance probabilities of normalised rainfall, facilitated a robust assessment of the reanalysis dataset’s ability to replicate exceptional rainfall characteristics. The general consensus depicted in the curves showcased a reliable adjustment, signifying ERA5-Land’s suitability for analysing such events, despite minor overestimations in specific northern locations.
Vitart et al. [29] discussed the transition from ERA-Interim to ERA5, highlighting improvements in forecast skill and anomaly prediction; while the context differed, the overarching theme of advancements in reanalysis datasets, evident in the transition to ERA5-Land, aligns with the broader trend in the field. Muñoz-Sabater et al. [13] introduced ERA5-Land as an enhanced dataset, a choice resonating with the present study. The improved resolution and extended period contribute to its added value for hydrological studies, affirming positive outcomes. Xu et al. [30], in their comprehensive evaluation of precipitation products over China, including ERA5 and ERA5-Land, reinforced the study’s emphasis on understanding the performance characteristics of model-based precipitation datasets. Despite geographical disparities, the shared focus on performance evaluation reinforces the broader applicability of the findings. Gomis-Cebolla et al. [15], evaluating ERA5 and ERA5-Land in Spain, echoed the study’s geographical focus on Portugal. The agreement between reanalysis precipitation estimates and high-resolution observations in Spain parallels the findings of general agreement in this study. Bližňák et al. [31] evaluated three reanalysis products in Central Europe, including ERA-5 Land, against radar-derived rainfall totals. The emphasis on assessing the reanalyses’ ability to reproduce rainfall characteristics aligns seamlessly with the methodology employed here, underscoring the importance of accurate representation. Wu et al. [32] and Alexopoulos et al. [33] underscored the significance of high temporal resolution in rainfall data, a principle adhered to in this study by employing complete daily ERA5-Land rainfall series to overcome the already mentioned lack of complete rainfall record series. The emphasis on temporal resolution aligns with the need for accurate characterisation of exceptional events, which is crucial for understanding their impact. Additionally, Hu and Franzke [34] discussed the evaluation of gridded data sets in representing daily precipitation extremes, aligning with the goals of the study, and while the evaluation methods differed, the shared focus on assessing the accuracy of reanalysis data, especially in extreme precipitation events, resonated with the study’s objectives.
Overall, the positive outcomes of this study align with the broader trends and findings in the referenced literature. ERA5-Land’s reliability for analysing exceptional rainfall in Portugal finds consistent support in diverse studies, both geographically and methodologically. This open access dataset emerges as a valuable tool for hydrological analyses, providing essential insights for decision making in the context of evolving rainfall patterns. The agreement between the study’s findings and the referenced literature strengthens the robustness and wider relevance of the study’s outcomes.

4.2. Regional Perspectives on Rainfall Intensity Trends

The examination of the rainfall intensity of exceptional events in Portugal, as depicted in Figure 9, Figure 10 and Figure 11, provides insights into hydrological trends over different subperiods and quantile thresholds. The spatial distribution of rainfall intensity, particularly evident for quantile Q95, showcases regional variations, aligning with the climatic classifications of mainland Portugal outlined by Sands [35]. Heightened rainfall intensity is observed in northern coastal regions. According to Sands [35], this concurs with the Mediterranean influence leading to rainy winters in these areas. As the threshold increases, the distribution becomes more heterogeneous, in line with the findings of Mónica and Santos [36], who observed variability in daily extreme precipitation indices across Portugal. The research work from the same authors, focusing on long-term trends, supports the observation of decreasing trends in intense rainfall in recent years. The pronounced decrease in occurrences above the Q99.9 threshold, resulting in no cumulative rainfall or intensity in 37 locations (Figure 9d), is also in accordance with the trends identified by Portela et al. [37]. The declining trend presents challenges, particularly in regions such as southern Santarém and the Lisbon district, which have been identified as areas prone to flash floods [35]. The introduction of sub-daily rainfall indices by Whitford et al. [38], complementing the focus on daily intensity, aligns with the approach of this study.
The analysis of extreme precipitation by Santos et al. [39] supports the findings of this research, stressing the mountainous regions in northern and central Portugal as highly susceptible areas to abnormal rainfall. Their regionalisation through principal component analysis echoes the spatial representation in Figure 9, Figure 10 and Figure 11, highlighting the importance of considering regional differences in extreme precipitation susceptibility. Espinosa et al. [40], examining climate change trends, support the observation of an overall increase in rainfall intensity. The study’s identification of more frequent and intense extreme rainfall aligns with the findings, emphasising the changing pattern of exceptional events and the need for adaptive strategies. Considering the demographic and economic factors outlined by Sands [35], the concentration of the population along the coast emphasises the vulnerability to extreme weather events. The observed shifts, based on a visual comparison between Figure 10 and Figure 11, from the most intense rainfall occurring in the south during the late subperiod to the north in the recent one, raise concerns regarding the potential impact on more densely populated coastal areas.

4.3. Severity Heat Map of Exceptional Rainfall in Portugal

Expanding the scope of this investigation introduces a novel dimension through the integration of a severity heat map. The map is generated from a 2 × 2 matrix considering two variables: the mean annual number of occurrences of exceptional rainfall, denoted as N mean , and the mean annual cumulative rainfall above the threshold, denoted as P mean . This consolidation incorporates key findings from earlier analyses of exceptional events in both the late and recent subperiods, illustrated in Figure 12. For this purpose, two classes were considered for each variable when transitioning from the late to the recent period: higher values in the recent period compared to the late subperiod ( Recent > Late ) , and lower values in the recent period compared to the late subperiod ( Recent < Late ) . The greatest induced severity was considered when both variables exhibited their highest values in the more recent time—red areas in Figure 12—whereas the lowest severity was assigned when the highest values occurred in the past (green areas in the same figure). In between, an increase in cumulative rainfall—orange areas in Figure 12—was considered potentially more damaging than an increase in the number of occurrences (yellow areas in the same figure) because it more closely mirrors the expected results from climate change, suggesting exceptional rainfall is becoming less frequent but more intense in certain regions, with the rainfall intensity approximately doubling due to factors such as climate change and natural phenomena [41,42].
In evaluating the impacts of climate change, it is crucial to acknowledge that changes in the occurrence and cumulative rainfall of exceptional events can lead to compounding effects. However, specific vulnerabilities and risks associated with these changes depend on regional characteristics, land use patterns, and existing infrastructure. The concern over the intensity of rainfall events in Portugal arises from projections indicating a decrease in annual rainfall coupled with an increase in the concentration of exceptional or extreme events [43,44]. Shifts in rainfall patterns, evident in the heterogeneous distribution of coloured cells in Figure 12, amplify the country’s susceptibility to more frequent and intense river flooding [45]. Moreover, the last two decades have seen a noticeable rise in the severity of exceptional rainfall, particularly evident in highly urbanised areas like Lisbon. The figure illustrates that extreme rainfall exhibits more potentially harmful combined characteristics, with an expanding spatial extent corresponding to the heightened rarity of these events. This innovative approach, showcased through the comprehensive visualisation of exceptional rainfall severity, plays a crucial role in deciphering the evolving landscape of such events in Portugal amid changing climate conditions.
The observed changes in exceptional rainfall patterns in Portugal, as delineated in the study spanning the late (1981/1982–2001/2002) and recent (2002/2003–2022/2023) subperiods, align with the projected decrease in average annual rainfall reported in previous research. For instance, in the trend analysis conducted, a projected decrease in average annual rainfall over the last 42 years is indicated, with a reduction of roughly 25 mm per decade since 1970 [46]. This anticipated decrease in rainfall, coupled with the clustering of precipitation into extreme events [37], underscores the growing vulnerability of the Portuguese water cycle to global warming. These findings complement these projections by providing empirical evidence of the changing characteristics of exceptional rainfall events, which are becoming less frequent but more intense, thus exacerbating the challenges posed by climate change to Portugal’s water resource management and resilience efforts. Moreover, it remains uncertain whether this behaviour represents a cyclic pattern, given the limitations of the time series lengths.

5. Conclusions

The examination of exceptional rainfall dynamics in Portugal over 42 hydrological years has yielded specific conclusions with significant implications. Firstly, the reliability of the ERA5-Land dataset for analysing exceptional rainfall was underscored by its validation against daily observational records, despite minor discrepancies observed in certain northern regions. This validation provides a robust foundation for upcoming investigations. Secondly, regional variations in occurrences, cumulative rainfall, and rainfall intensity were highlighted, emphasising the heterogeneous nature of exceptional rainfall patterns across Portugal. The observed shifts in intense events from south to north over the last twenty years underscored the dynamic hydrological processes that have shaped the country’s landscape. Thirdly, the integration of a severity heat map introduced a novel approach to visualising the combined characteristics of exceptional rainfall, revealing increasing severity and spatial extent at higher thresholds (e.g., Q99.5 and Q99.9), particularly in coastal cities. This innovative visualisation tool enhances the understanding of the evolving risks associated with exceptional rainfall events. Overall, these findings emphasise the importance of continuous monitoring and adaptive strategies to address the changing hydrological dynamics in Portugal, informing more effective risk management and sustainable development initiatives tailored to the country’s evolving rainfall patterns and climate conditions. Future work should explore shorter timescales (e.g., subdaily), evaluate climate change impacts, and consider detailed land-use patterns for a more comprehensive risk assessment.

Author Contributions

Conceptualisation, L.A.E. and M.M.P.; methodology, L.A.E. and M.M.P.; software, L.A.E.; validation, L.A.E.; formal analysis, L.A.E.; investigation, L.A.E.; resources, L.A.E.; data curation, L.A.E.; writing—original draft preparation, L.A.E.; writing—review and editing, L.A.E., M.M.P. and S.G.; visualisation, L.A.E.; supervision, M.M.P. All authors have read and agreed to the published version of the manuscript.

Funding

This research received no external funding.

Data Availability Statement

The data presented in this study are available on request from the corresponding author L.A.E. The data are not publicly available due to restrictions related to ongoing collaborative research projects and commitments to maintain the confidentiality of certain datasets.

Acknowledgments

This research was supported by the Foundation for Science and Technology (FCT) through funding UIDB/04625/2020 from the research unit CERIS and by the European Union’s Horizon 2020 research and innovation programme SCORE under grant agreement No. 101003534. The authors would like to give special thanks to José Pedro Matos from the IST for providing relevant data for the analysis.

Conflicts of Interest

The authors declare no conflicts of interest.

References

  1. Araújo, J.R.; Ramos, A.M.; Soares, P.M.; Melo, R.; Oliveira, S.C.; Trigo, R.M. Impact of extreme rainfall events on landslide activity in Portugal under climate change scenarios. Landslides 2022, 19, 2279–2293. [Google Scholar] [CrossRef]
  2. Westra, S.; Fowler, H.J.; Evans, J.P.; Alexander, L.V.; Berg, P.; Johnson, F.; Kendon, E.J.; Lenderink, G.; Roberts, N. Future changes to the intensity and frequency of short-duration extreme rainfall. Rev. Geophys. 2014, 52, 522–555. [Google Scholar] [CrossRef]
  3. Trenberth, K.E. Changes in precipitation with climate change. Clim. Res. 2011, 47, 123–138. [Google Scholar]
  4. Letcher, T. Climate Change: Observed Impacts on Planet EARTH; Elsevier: Amsterdam, The Netherlands, 2021. [Google Scholar]
  5. Teotónio, C.; Fortes, P.; Roebeling, P.; Rodriguez, M.; Robaina-Alves, M. Assessing the impacts of climate change on hydropower generation and the power sector in Portugal: A partial equilibrium approach. Renew. Sustain. Energy Rev. 2017, 74, 788–799. [Google Scholar] [CrossRef]
  6. Mora, C.; Vieira, G. The climate of Portugal. In Landscapes and Landforms of Portugal; Springer: Cham, Switzerland, 2020; pp. 33–46. [Google Scholar]
  7. Vaz, T.; Zêzere, J.L.; Pereira, S.; Oliveira, S.C.; Garcia, R.A.; Quaresma, I. Regional rainfall thresholds for landslide occurrence using a centenary database. Nat. Hazards Earth Syst. Sci. 2018, 18, 1037–1054. [Google Scholar] [CrossRef]
  8. Zêzere, J.L.; Trigo, R.M.; Trigo, I.F. Shallow and deep landslides induced by rainfall in the Lisbon region (Portugal): Assessment of relationships with the North Atlantic Oscillation. Nat. Hazards Earth Syst. Sci. 2005, 5, 331–344. [Google Scholar] [CrossRef]
  9. Otto, F.E.; Harrington, L.; Schmitt, K.; Philip, S.; Kew, S.; van Oldenborgh, G.J.; Singh, R.; Kimutai, J.; Wolski, P. Challenges to understanding extreme weather changes in lower income countries. Bull. Am. Meteorol. Soc. 2020, 101, E1851–E1860. [Google Scholar] [CrossRef]
  10. Ummenhofer, C.C.; Meehl, G.A. Extreme weather and climate events with ecological relevance: A review. Philos. Trans. R. Soc. Biol. Sci. 2017, 372, 20160135. [Google Scholar] [CrossRef]
  11. Johnson, K.; Smithers, J. Methods for the estimation of extreme rainfall events. Water SA 2019, 45, 501–512. [Google Scholar] [CrossRef]
  12. Ramos, A.M.; Martins, M.J.; Tomé, R.; Trigo, R.M. Extreme precipitation events in summer in the Iberian Peninsula and its relationship with atmospheric rivers. Front. Earth Sci. 2018, 6, 110. [Google Scholar]
  13. Muñoz-Sabater, J.; Dutra, E.; Agustí-Panareda, A.; Albergel, C. ERA5-Land: A state-of-the-art global reanalysis dataset for land applications. Earth Syst. Sci. Data 2021, 13, 4349–4383. [Google Scholar] [CrossRef]
  14. Lavers, D.A.; Simmons, A.; Vamborg, F.; Rodwell, M.J. An evaluation of ERA5 precipitation for climate monitoring. Q. J. R. Meteorol. Soc. 2022, 148, 3152–3165. [Google Scholar] [CrossRef]
  15. Gomis-Cebolla, J.; Rattayova, V.; Salazar-Galán, S.; Francés, F. Evaluation of ERA5 and ERA5-Land reanalysis precipitation datasets over Spain (1951–2020). Atmos. Res. 2023, 284, 106606. [Google Scholar] [CrossRef]
  16. Sabater, J.M. ERA5-Land: A new state-of-the-art global land surface reanalysis dataset. Earth Syst. Sci. Data 2017, 13, 4349–4383. [Google Scholar] [CrossRef]
  17. Espinosa, L.A.; Portela, M.M.; Moreira Freitas, L.M.; Gharbia, S. Addressing the Spatiotemporal Patterns of Heatwaves in Portugal with a Validated ERA5-Land Dataset (1980–2021). Water 2023, 15, 3102. [Google Scholar] [CrossRef]
  18. Faulkner, D. Flood Estimation Handbook: Rainfall Frequency Estimation; Centre for Ecology & Hydrology: Edinburgh, UK, 2008. [Google Scholar]
  19. Weibull, W. A Statistical Distribution Function of Wide Applicability. J. Appl. Mech. 1951, 18, 293–297. [Google Scholar] [CrossRef]
  20. Makkonen, L. Bringing closure to the plotting position controversy. Commun. Stat.—Theory Methods 2008, 37, 460–467. [Google Scholar] [CrossRef]
  21. Jones, M. Characterising and Modelling Time-Varying Rainfall Extremes and Their Climatic Drivers. Ph.D. Thesis, Newcastle University, Newcastle upon Tyne, UK, 2012. [Google Scholar]
  22. Te Chow, V.; Maidment, D.R.; Mays, L.W. Applied Hydrology; McGraw-Hill: New York, NY, USA, 1988. [Google Scholar]
  23. Student. The probable error of a mean. Biometrika 1908, 6, 1–25. [Google Scholar] [CrossRef]
  24. Kim, T.K. T test as a parametric statistic. Korean J. Anesthesiol. 2015, 68, 540–546. [Google Scholar] [CrossRef]
  25. Stott, P.A.; Christidis, N.; Otto, F.E.; Sun, Y.; Vanderlinden, J.P.; van Oldenborgh, G.J.; Vautard, R.; von Storch, H.; Walton, P.; Yiou, P. Attribution of extreme weather and climate-related events. Wiley Interdiscip. Rev. Clim. Chang. 2016, 7, 23–41. [Google Scholar] [CrossRef]
  26. Liu, G.; Xiang, A.; Wan, Z.; Zhou, Y.; Wu, J.; Wang, Y.; Lin, S. Variations of extreme precipitation events with sub-daily data: A case study in the Ganjiang River basin. Nat. Hazards Earth Syst. Sci. 2023, 23, 1139–1155. [Google Scholar] [CrossRef]
  27. Jones, R.; Boer, R.; Magezi, S.; Mearns, L. Assessing current climate risks. In Adaptation Policy Framework for Climate Change: Developing Strategies, Policies and Measures; UNDP, Cambridge University Press: Cambridge, UK, 2004; pp. 91–117. [Google Scholar]
  28. Masson-Delmotte, V.; Zhai, P.; Pirani, S.; Connors, C.; Péan, S.; Berger, N.; Caud, Y.; Chen, L.; Goldfarb, M.; Scheel Monteiro, P.M. IPCC, 2021: Summary for Policymakers. In Climate Change 2021: The Physical Science Basis. Contribution of Working Group I to the Sixth Assessment Report of the Intergovernmental Panel on Climate Change; IPCC: Geneva, Switzerland, 2021. [Google Scholar]
  29. Vitart, F.; Balsamo, G.; Bidlot, J.; Lang, S.; Tsonevsky, I.; Richardson, D.; Balmaseda, M. Use of ERA5 reanalysis to initialise re-forecasts proves beneficial. ECMWF Newsl. 2009, 161, 26–31. [Google Scholar]
  30. Xu, J.; Ma, Z.; Yan, S.; Peng, J. Do ERA5 and ERA5-land precipitation estimates outperform satellite-based precipitation products? A comprehensive comparison between state-of-the-art model-based and satellite-based precipitation products over mainland China. J. Hydrol. 2022, 605, 127353. [Google Scholar] [CrossRef]
  31. Bližňák, V.; Pokorná, L.; Rulfová, Z. Assessment of the capability of modern reanalyses to simulate precipitation in warm months using adjusted radar precipitation. J. Hydrol. Reg. Stud. 2022, 42, 101121. [Google Scholar] [CrossRef]
  32. Wu, G.; Qin, S.; Mao, Y.; Ma, Z.; Shi, C. Validation of precipitation events in ERA5 to gauge observations during warm seasons over eastern China. J. Hydrometeorol. 2022, 23, 807–822. [Google Scholar] [CrossRef]
  33. Alexopoulos, M.J.; Müller-Thomy, H.; Nistahl, P.; Šraj, M.; Bezak, N. Validation of precipitation reanalysis products for rainfall-runoff modelling in Slovenia. EGUsphere 2022, 2022, 1–24. [Google Scholar] [CrossRef]
  34. Hu, G.; Franzke, C.L. Evaluation of daily precipitation extremes in reanalysis and gridded observation-based data sets over Germany. Geophys. Res. Lett. 2020, 47, e2020GL089624. [Google Scholar] [CrossRef]
  35. Sands, P. The United Nations framework convention on climate change. Rev. Eur. Comp. Int. Environ. Law 1992, 1, 270. [Google Scholar] [CrossRef]
  36. Mónica, S.; Santos, F. Trends in extreme daily precipitation indices in Northern of Portugal. In Geophysical Research Abstracts; EGU: Munich, Germany, 2011; Volume 13. [Google Scholar]
  37. Portela, M.M.; Espinosa, L.A.; Zelenakova, M. Long-term rainfall trends and their variability in mainland Portugal in the last 106 years. Climate 2020, 8, 146. [Google Scholar] [CrossRef]
  38. Whitford, A.C.; Blenkinsop, S.; Pritchard, D.; Fowler, H.J. A gauge-based sub-daily extreme rainfall climatology for western Europe. Weather. Clim. Extrem. 2023, 41, 100585. [Google Scholar] [CrossRef]
  39. Santos, M.; Fragoso, M.; Santos, J.A. Regionalization and susceptibility assessment to daily precipitation extremes in mainland Portugal. Appl. Geogr. 2017, 86, 128–138. [Google Scholar] [CrossRef]
  40. Espinosa, L.A.; Portela, M.M.; Matos, J.P.; Gharbia, S. Climate Change Trends in a European Coastal Metropolitan Area: Rainfall, Temperature, and Extreme Events (1864–2021). Atmosphere 2022, 13, 1995. [Google Scholar] [CrossRef]
  41. Tabari, H. Climate change impact on flood and extreme precipitation increases with water availability. Sci. Rep. 2020, 10, 13768. [Google Scholar] [CrossRef] [PubMed]
  42. Luong, T.M.; Dasari, H.P.; Hoteit, I. Extreme precipitation events are becoming less frequent but more intense over Jeddah, Saudi Arabia. Are shifting weather regimes the cause? Atmos. Sci. Lett. 2020, 21, e981. [Google Scholar] [CrossRef]
  43. De Lima, M.I.P.; Santo, F.E.; Ramos, A.M.; Trigo, R.M. Trends and correlations in annual extreme precipitation indices for mainland Portugal, 1941–2007. Theor. Appl. Climatol. 2015, 119, 55–75. [Google Scholar] [CrossRef]
  44. Santos, M.; Fonseca, A.; Fragoso, M.; Santos, J.A. Recent and future changes of precipitation extremes in mainland Portugal. Theor. Appl. Climatol. 2019, 137, 1305–1319. [Google Scholar] [CrossRef]
  45. Schleussner, C.; Menke, I.; Theokritoff, E.; van Maanen, N.; Lanson, A. Climate Impacts in Portugal; Climate Analytics: Berlin, Germany, 2020. [Google Scholar]
  46. Nunes, A.; Lourenço, L. Precipitation variability in Portugal from 1960 to 2011. J. Geogr. Sci. 2015, 25, 784–800. [Google Scholar] [CrossRef]
Figure 1. Geographical features of Portugal. (a) Elevation map in metres above sea level (masl), displaying the spatial distribution of the 1012 ERA5-Land grid points represented by bullets, with stars indicating the nine selected validation grid points. The validation points are identified by their codes (P), followed by the names of the regions or urban areas they are located in. (b) Annual average rainfall for the overall period (1981/1982–2022/2023) based on the 1012 ERA5-Land rainfall series.
Water 16 00628 g001
Figure 2. Empirical non-exceedance probability curves corresponding to daily rainfall values from the ERA5-Land reanalysis dataset (dashed lines) and the SNIRH and IPMA meteorological stations (solid lines) during the validation period from 1 January 1980 to 31 December 2021—accounting for complete reanalysis data series and variable record availability in the meteorological station series.
Water 16 00628 g002
Figure 3. Mean annual number of daily rainfall occurrences above the threshold (based on ERA5-Land data), in days per year, for the overall period from 1 October 1981 to 30 September 2023.
Water 16 00628 g003
Figure 4. Mean annual number of daily rainfall occurrences above the threshold (based on ERA5-Land data), in days per year, for the late subperiod from 1 October 1981 to 30 September 2002.
Water 16 00628 g004
Figure 5. Mean annual number of daily rainfall occurrences above the threshold (based on ERA5-Land data), in days per year, for the recent subperiod from 1 October 2002 to 30 September 2023.
Water 16 00628 g005
Figure 6. Mean annual cumulative rainfall above the threshold (based on ERA5-Land data), in millimetres per year, for the overall period from 1 October 1981 to 30 September 2023.
Water 16 00628 g006
Figure 7. Mean annual cumulative rainfall above the threshold (based on ERA5-Land data), in millimetres per year, for the late subperiod from 1 October 1981 to 30 September 2002.
Water 16 00628 g007
Figure 8. Mean annual cumulative rainfall above the threshold (based on ERA5-Land data), in millimetres per year, for the recent subperiod from 1 October 2002 to 30 September 2023.
Water 16 00628 g008
Figure 9. Mean annual rainfall intensity of events above threshold (based on ERA5-Land data), in millimetres per day, for the overall period from 1 October 1981 to 30 September 2023.
Water 16 00628 g009
Figure 10. Mean annual rainfall intensity of events above threshold (based on ERA5-Land data), in millimetres per day, for the late subperiod from 1 October 1981 to 30 September 2002.
Water 16 00628 g010
Figure 11. Mean annual rainfall intensity of events above threshold (based on ERA5-Land data), in millimetres per day, for the recent subperiod from 1 October 2002 to 30 September 2023.
Water 16 00628 g011
Figure 12. Severity heat map of exceptional rainfall at different thresholds. The severity 2 × 2 matrix relates to the mean annual number of occurrences of exceptional rainfall, N m e a n , and the mean annual cumulative rainfall above the threshold, P m e a n . The matrix intends to quantify the relative changes in the potential harmfulness of the exceptional events from the late subperiod (1981/1982–2001/2002) and the recent subperiod (2002/2003–2022/2023).
Water 16 00628 g012
Disclaimer/Publisher’s Note: The statements, opinions and data contained in all publications are solely those of the individual author(s) and contributor(s) and not of MDPI and/or the editor(s). MDPI and/or the editor(s) disclaim responsibility for any injury to people or property resulting from any ideas, methods, instructions or products referred to in the content.

