1. Introduction
The Soil-Water Characteristic Curve (SWCC) is an essential tool for characterizing unsaturated soil properties. The primary application of the soil-water characteristic curve (SWCC) is to evaluate the performance of unsaturated soil properties for a range of geotechnical engineering applications [
1]. One common application of SWCCs in geotechnical engineering is to assess the hydraulic properties necessary to simulate water flow through unsaturated soils [
2,
3,
4,
5,
6]. The SWCC shape reflects the soil’s water retention capacity and porosity characteristics, enabling the estimation of various engineering properties such as hydraulic conductivity, shear strength, and diffusion coefficient [
7,
8].
Various direct and indirect methods are available for measuring soil suction, including the Tensiometer method [
9], pressure apparatus [
10,
11], and electrical resistance blocks [
12], as well as the filter paper method [
13]. In recent decades, several empirical models have been developed to predict SWCC, such as Gardner [
14], Brooks Corey [
15], Van Genuchten [
16], and Fredlund and Xing [
17], among others. Researchers have also compared and evaluated the applicability and consistency of different empirical models [
18,
19]. Van Genuchten [
16] and Fredlund and Xing [
17] devised a three-parameter SWCC model for a suction range of 0 to 10
6 kPa. Leong and Rahardjo [
19] found that these equations outperformed other models across diverse soils. This study employs Van Genuchten and Fredlund and Xing models to fit experimental SWCC data.
The soil structure, initial water content, void ratio (dry unit weight), soil type, mineralogy, and compaction method are among the primary factors that could have a significant impact on the characteristics of the soil-water characteristic curve (SWCC) [
20,
21].
Studies have investigated the SWCC of various soils, including clay [
22], sand [
23], and expansive soils [
11,
24,
25]. The influence of factors such as dry unit weight and the void ratio [
25,
26,
27,
28], gradation [
28,
29,
30], and temperature [
28,
31] on SWCC have also been studied. Even small changes in soil density are known to have a significant impact on the hydro-mechanical properties of the soil. However, significant variations in soil density can be introduced by external factors and stress conditions of the soils. This intricacy highlights how crucial it is to investigate how density affects the SWCC, making it an engaging and extensively researched topic of broad interest [
32,
33,
34,
35,
36]. Chen et al. [
29] found that higher initial dry density led to increased water retention capacity. The maximum slope of the SWCC decreased linearly with increasing density, whereas the air entry value and residual water content increased linearly. Increasing fine content resulted in a linear rise in both air entry value and residual moisture content. Zhou and Yu [
37] stated that the initial water content and stress state have a greater impact than other variables (like void ratio and high suction). But when suction levels rise, their effect tends to decrease. Limited research has been conducted to investigate the effect of sand content on the Soil-Water Characteristic Curve (SWCC) in expansive soils. The impact of sand on expansive soil behavior is significant [
38]. Studies conducted by Elkady et al. [
24] and Jiang et al. [
11] focused on examining the effect of clay content on the soil-water retention curve (SWCC) in soil mixtures. They reported that the composition of sand and clay significantly affects the shape of the SWCC. Elkady [
24] discovered that as the clay content in sand-natural clay mixtures increased from 0% to 60%, so did their water retention capacity. The addition of micropores via clay was identified as a contributing factor to the increased water retention capacity. Thus, it is critical to assess the impact of these main factors on the curve to analyze the stability and behavior of unsaturated expansive soil.
In the realm of soil-water characteristic curve (SWCC) investigations spanning diverse soils, a noticeable gap exists as none have concentrated on scrutinizing the interplay between sand content, initial moisture, and dry unit weight concerning SWCC, particularly within expansive soils. Given the inherent variability in sand proportions within expansive soils, their influence on dry unit weight values is pivotal. Past studies have underscored the pronounced impact of sand content, initial degree of saturation, and initial dry unit weight on SWCC. Consequently, this study aims to elucidate the complex dynamics of sand content, initial degree of saturation, and initial dry unit weight in shaping the soil-water characteristic curve (SWCC) of expansive clay soils. To corroborate the experimental findings, the study integrates the widely employed Fredlund Xing’s and Van Genuchten’s models, recognized for their effectiveness in fitting SWCC, thereby fortifying the validation of the outcomes.
2. Materials and Methods
2.1. Methodology Overview
This study uses an experimental approach to conduct a thorough parametric investigation into the effect of initial dry unit weight, initial degree of saturation, and sand content on the Soil-Water Characteristic Curve. Because of the complexities of these interactions, a systematic examination is required to understand the behavior of expansive soil. The experimental design entails preparing multiple samples, each with a different sand content (ranging from 0% to 50%), initial dry unit weight (four different values), and initial degree of saturation.
Laboratory-based sample preparation is chosen due to the challenges associated with obtaining samples with diverse initial conditions from the field. The laboratory environment facilitates precise control over the initial parameters, ensuring a systematic and replicable approach to the study. Fine sand and expansive clay are the chosen soil components for this study, with detailed properties and classification outlined in the subsequent section.
The experiment begins with the meticulous preparation of samples, each representing a distinct combination of sand content, initial dry unit weight, and initial degree of saturation. These variables are systematically changed to generate a matrix of conditions for a thorough parametric analysis. The sand content, initial dry unit weight, and initial degree of saturation are strategically chosen to cover a wide range of scenarios that are representative of real-world conditions.
2.2. Experimental Materials
Expansive clayey soil was collected from a depth of 3 m in Damserkhu, Lattakia, while fine sea sand was obtained from the site of Shuqayfat Jibla. The sand was washed to ensure it was free from any extraneous materials and fully purified.
Table 1 provides a summary of the physical properties.
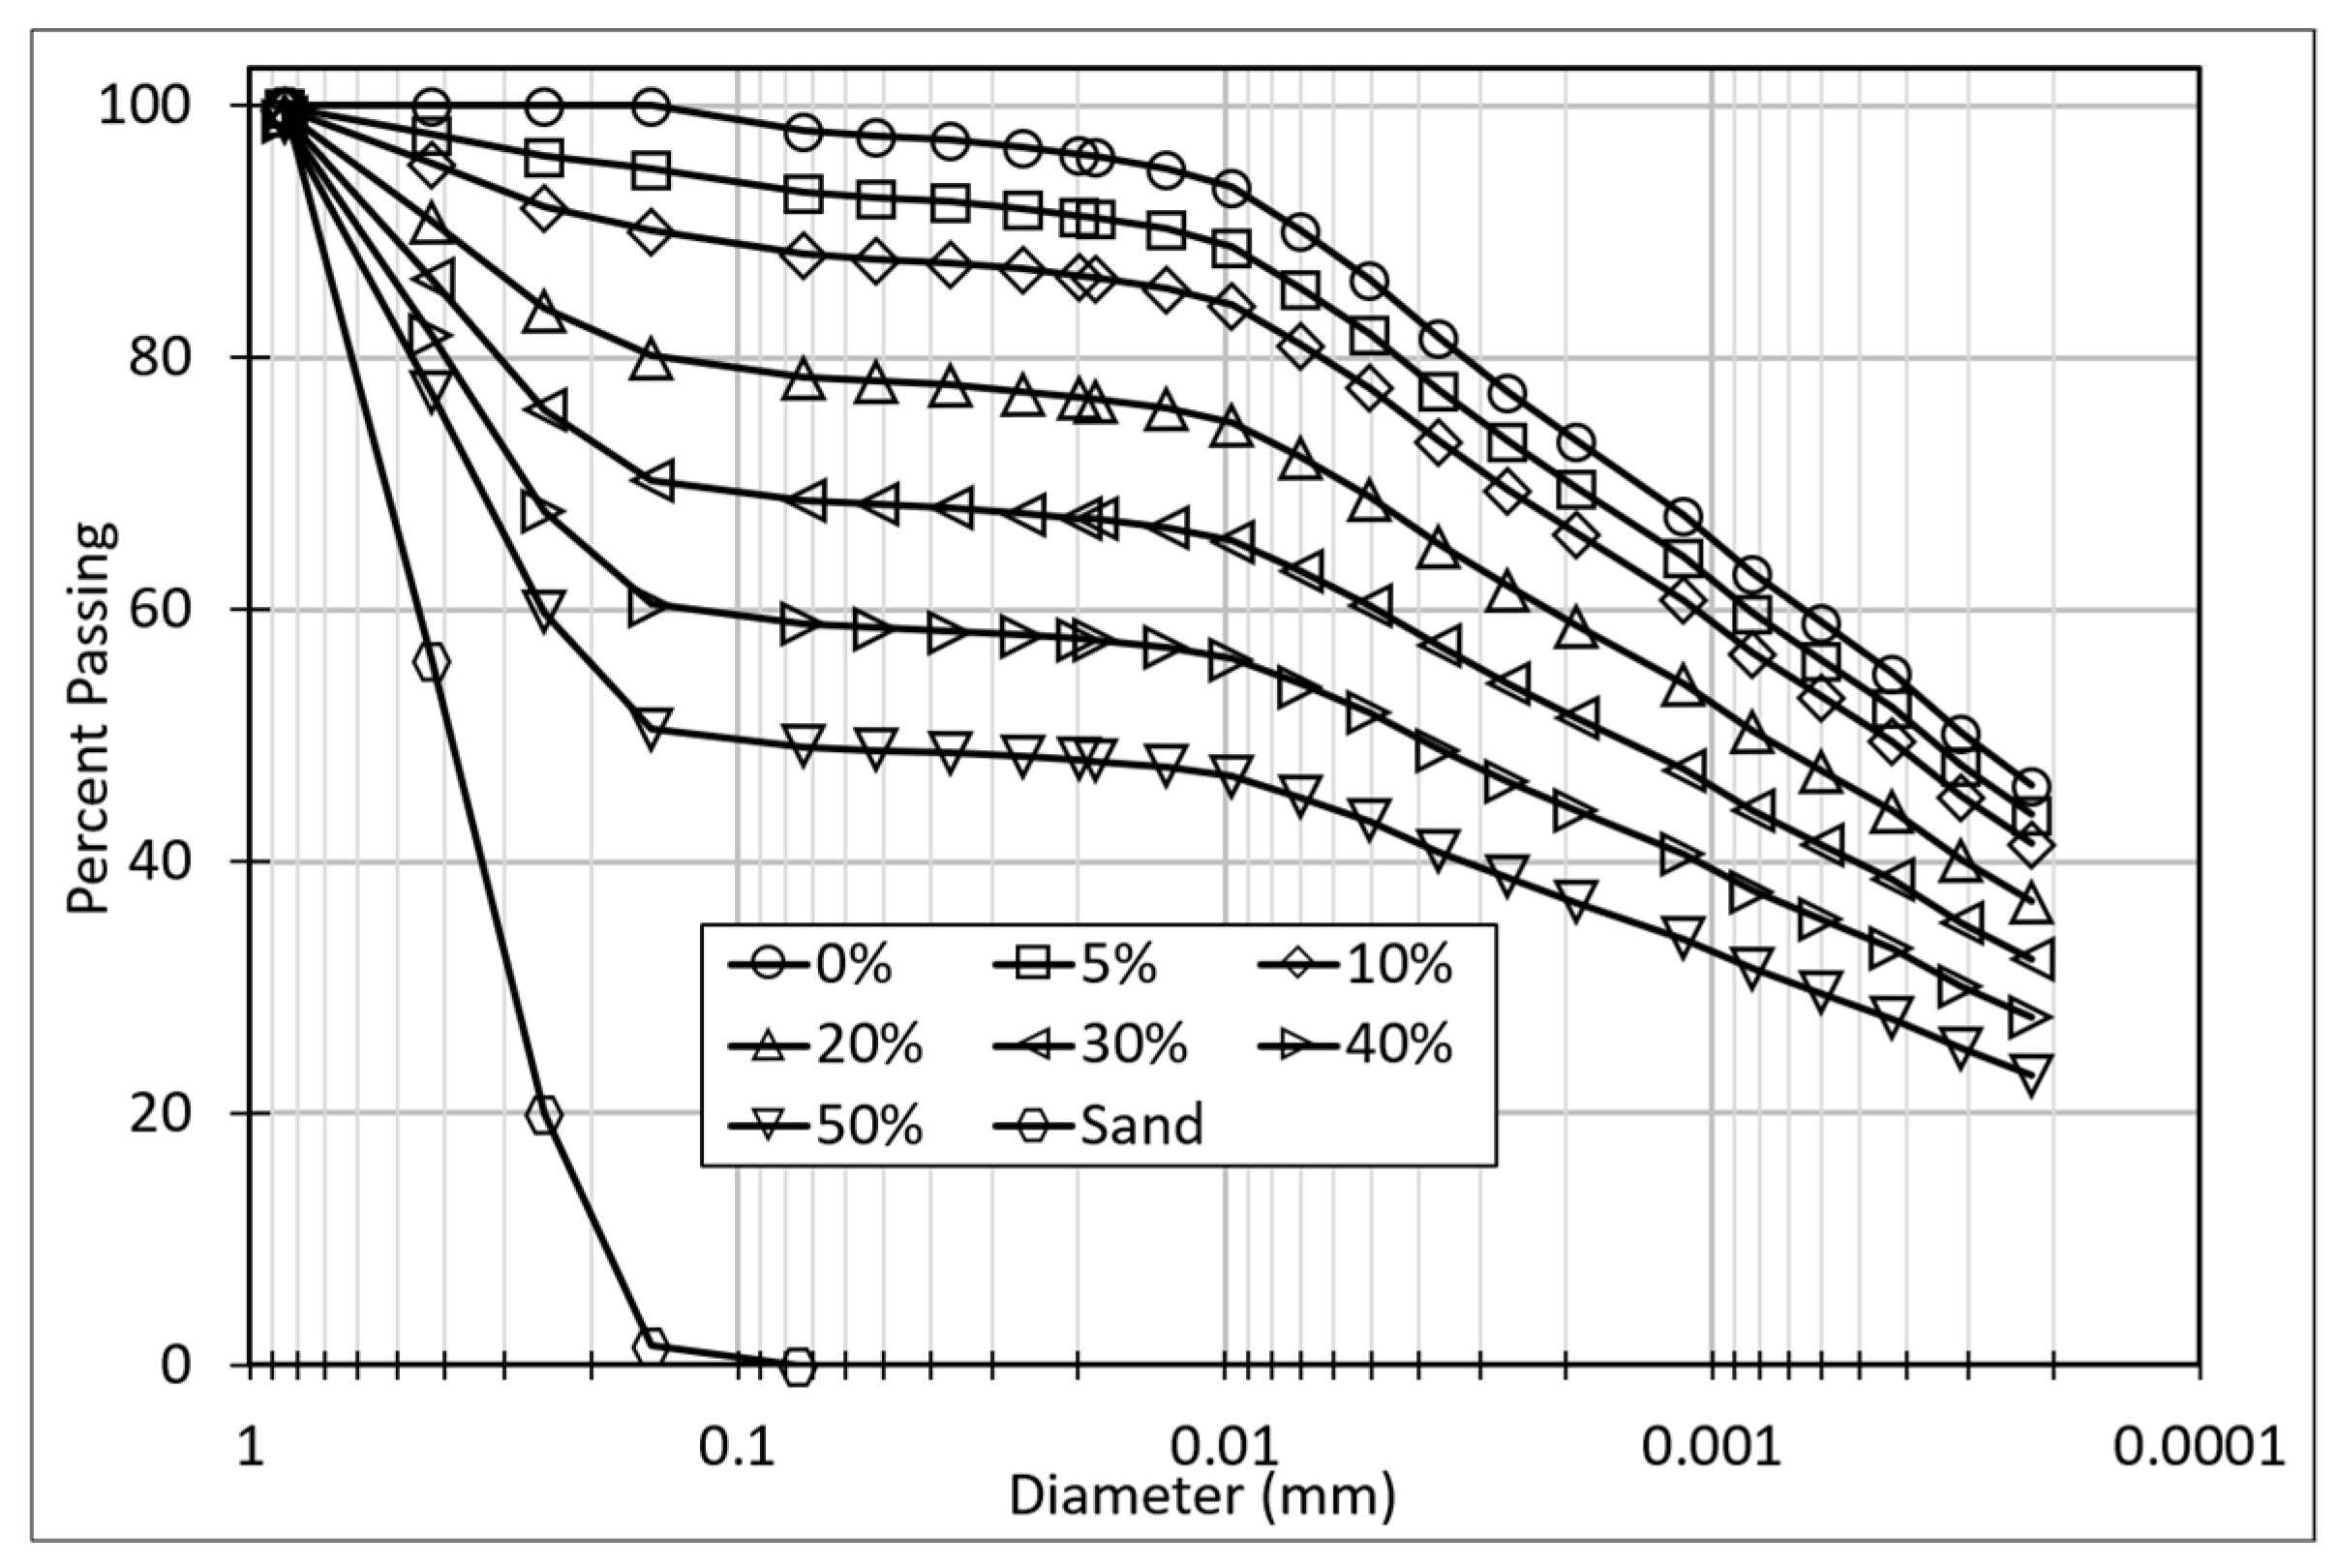
To prepare sand-clay mixtures, the soil was mixed with varying percentages of sand (10%, 20%, 30%, 40%, and 50%) based on the dry weight. Grain size distribution experiments were conducted according to ASTM D6913 [
39] and ASTM D7928-17 [
40], and the resulting granular gradient curves are shown in
Figure 1. The chemical composition of the clay is detailed in
Table 2.
The standard Proctor Method as specified in ASTM D698-12e2 [
41] was employed to ascertain the optimal moisture (
wopt) content and maximum dry unit weight (
of the mixtures, which serves as the basis for determining the initial dry unit weights. For each percentage of added sand, four initial dry unit weights and four initial degrees of saturation were chosen.
Table 3 illustrates the initial conditions for the prepared samples. Furthermore, the Atterberg limits of all mixtures were determined according to the guidelines outlined in ASTM D4318-17e1 [
42]. The outcomes of these experiments have been tabulated in
Table 4. For more details on the physical properties of the soils used in this study, refer to Alnmr and Ray [
43]. The AASHTO classification system [
44] classified pure clayey soil (without sand) as A-7-5, whereas the USCS (Unified Soil Classification System [
45]) [ASTM D2487-17e1] labeled it as CH. Illite was assumed to be the clay mineral because it was located at or above the A-line on Casagrande’s plasticity chart [
46].
2.3. SWCC Regions and Definitions
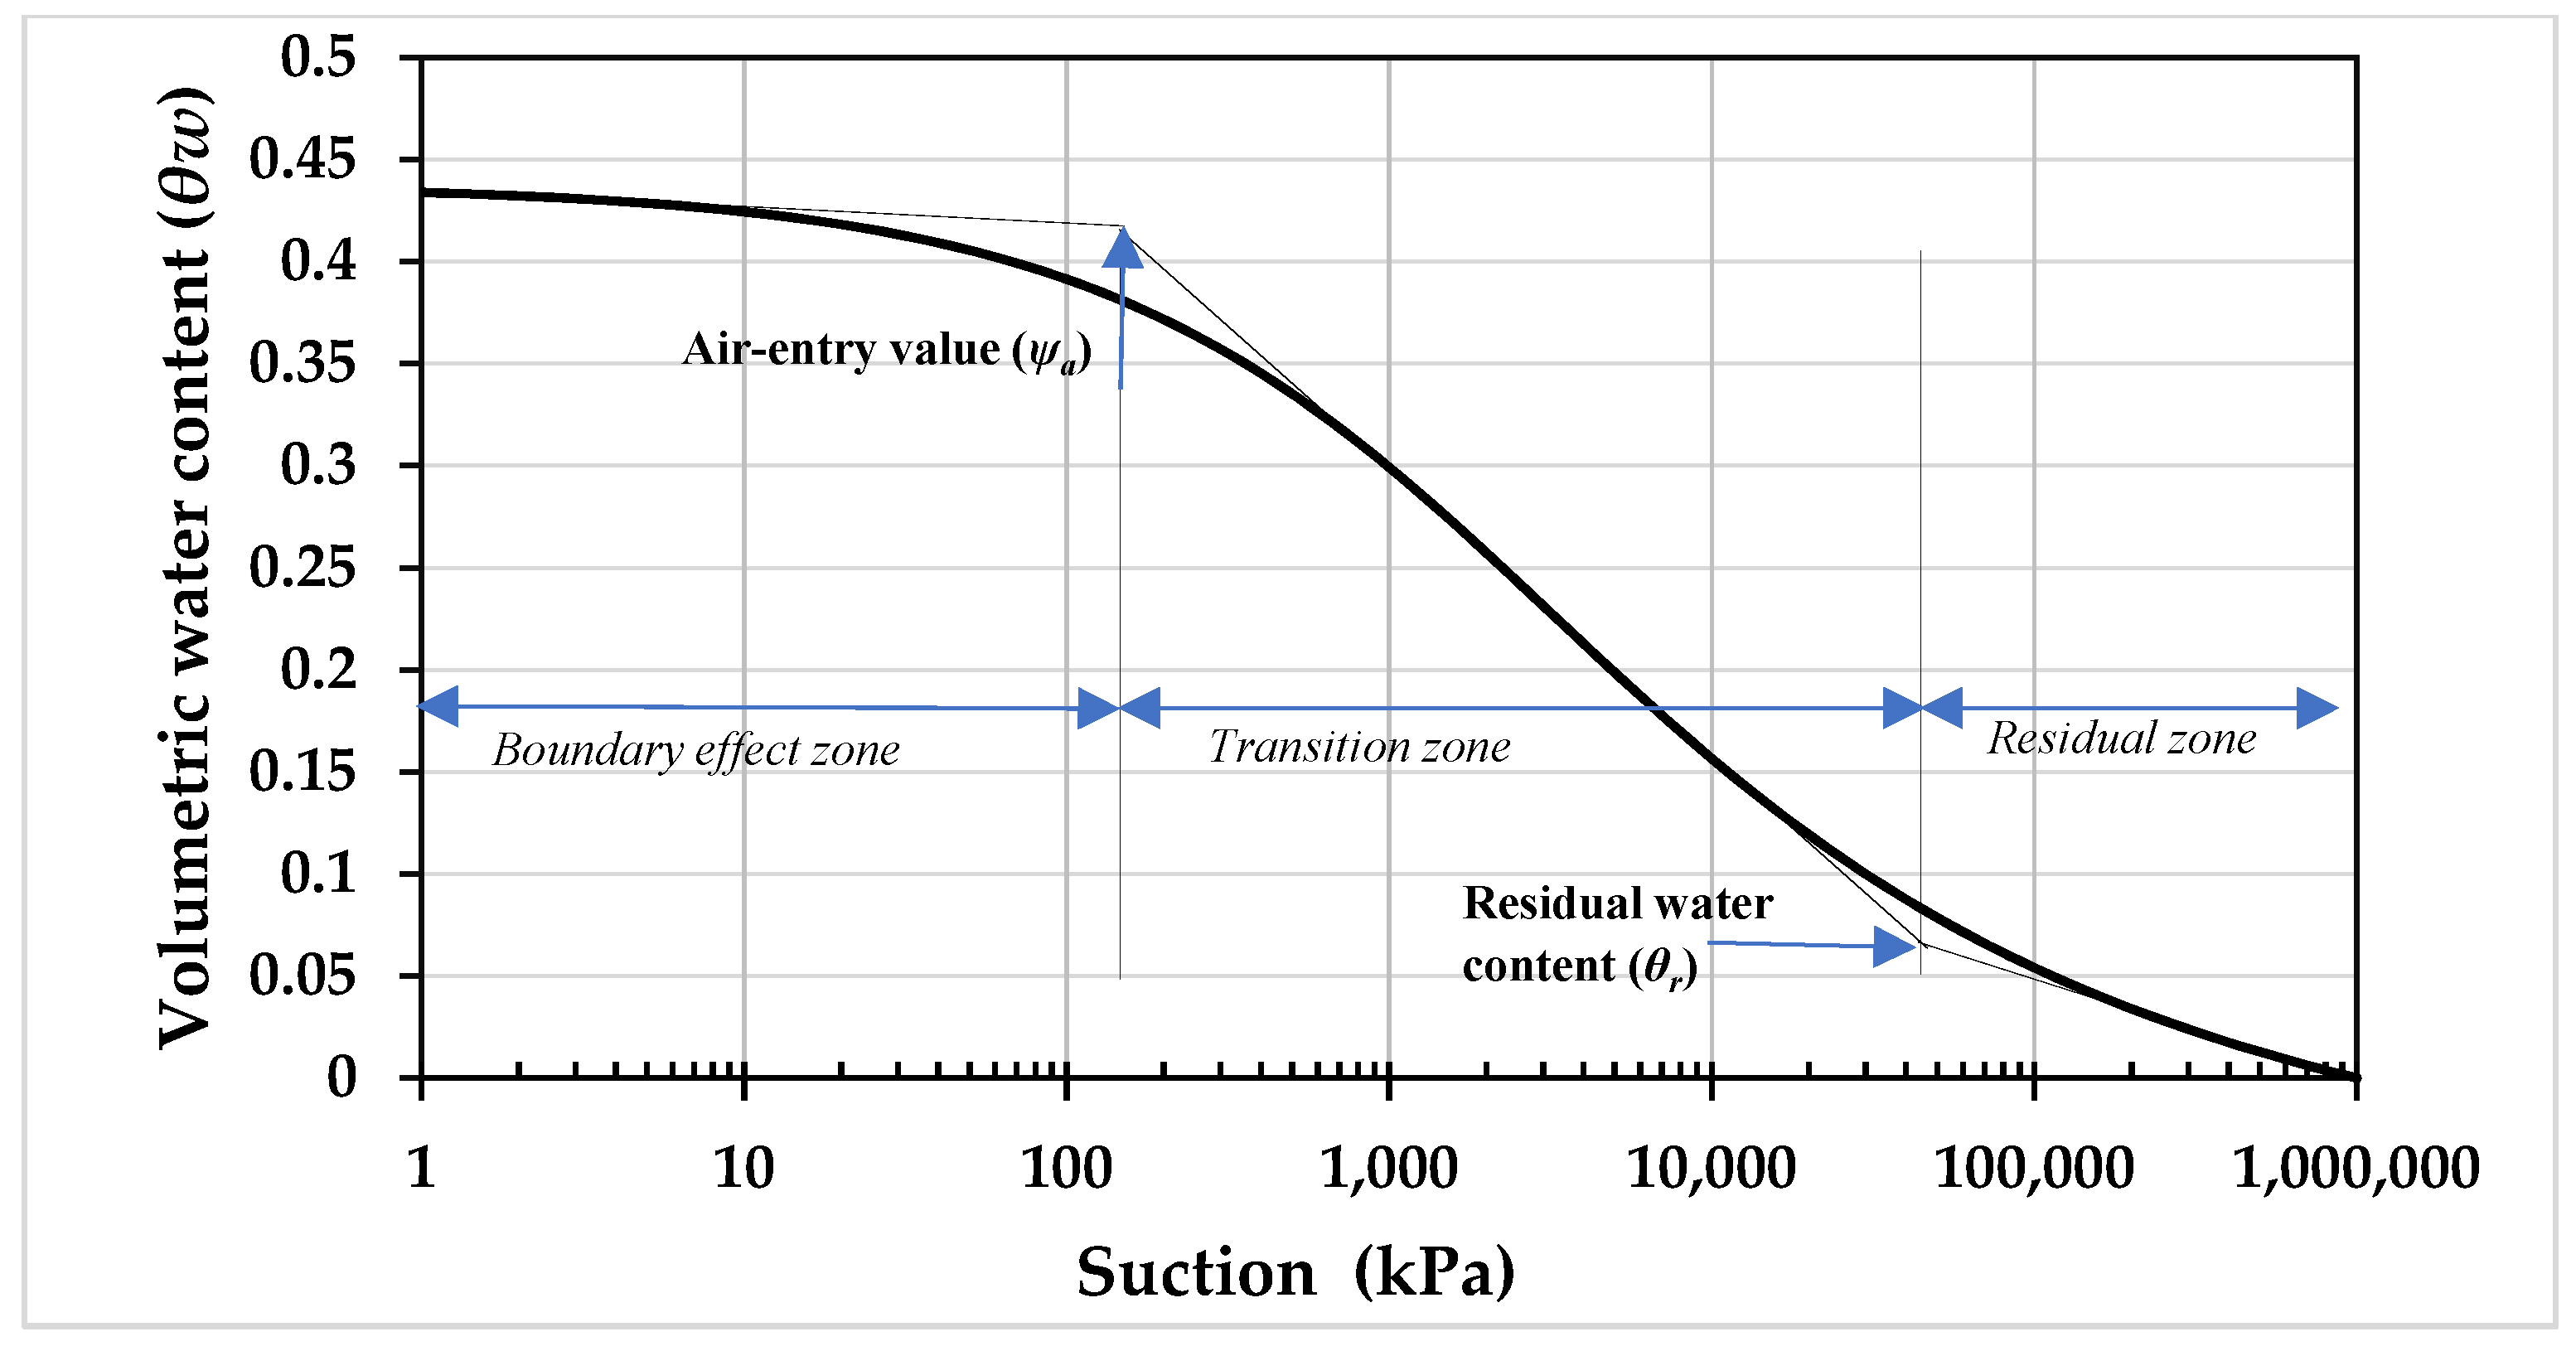
The soil-water characteristic curve (SWCC) depicts the correlation between soil suction and the level of saturation for a given soil sample (see
Figure 2) [
7]. Moisture content, w, or volumetric water content,
θw, are typically employed to quantify the water content in the soil, with
θw being the preferred method (calculated by dividing the volume of water,
Vw, in the soil by the total volume,
V;
θw =
Vw/
V). The terminology employed to describe the SWCC may differ across the literature, with several phrases such as soil moisture curve, water retention curve, soil-water retention curve, and soil-water characteristic being used interchangeably [
47]. Various graphic representations can be employed to display SWCC data, with soil suction being plotted on either the x- or y-axis, typically on a logarithmic or normal scale, as referenced in the literature. In this study, the x-axis (log scale) represents suction in kPa, and the y-axis represents volumetric water content,
θw, as illustrated in
Figure 2.
The following are the definitions of the SWCC regions as displayed in
Figure 2:
The air-entry value of soil is defined as the level of suction at which air initially enters the largest pores in the soil [
17].
The residual water content refers to the level of water content at which a significant alteration in suction is necessary to extract additional water from the soil [
17]. The suction value corresponding to the residual water content is termed as residual suction (
ψr).
The boundary effect zone pertains to the region within the suction range of 0 to
ψa, in which the soil remains predominantly saturated [
48].
The transition zone spans from
ψa to
ψr and is characterized by a significant decline in the moisture content of the soil with rising suction. This leads to a decrease in the amount of water present at the contacts between soil particles as the level of saturation continues to diminish [
48].
The residual zone commences at a suction value beyond
ψr and endures until 10
6 kPa. In this zone, significant elevations in suction produce a relatively minor impact on the degree of saturation (or water content). Due to the small size of the curved water-air interface, the amount of water lost in this region is limited [
48].
2.4. Experimental Principle
The pressure apparatus method is a commonly utilized technique for directly determining the volumetric water content corresponding to a specific suction stress, which is then used to establish the soil-water characteristic curve. This approach is advantageous due to its simplicity of operation and the favorable measurement range of pF = 1.8–4.2 or suction of 6.3–1585 kPa. Here, pF is used to express the soil suction stress, which represents the decimal logarithm of the soil water stress conveyed by the height of a water column in centimeters (i.e., pF = Log(h)).
To carry out this method, soil samples are initially formed and then introduced into the apparatus, where they are saturated. Once saturation is achieved, a predetermined amount of suction stress is applied to the soil to separate the water from it. The corresponding water content for each applied suction stress is subsequently measured after the sample reaches moisture stability. This process can take a week or longer to complete.
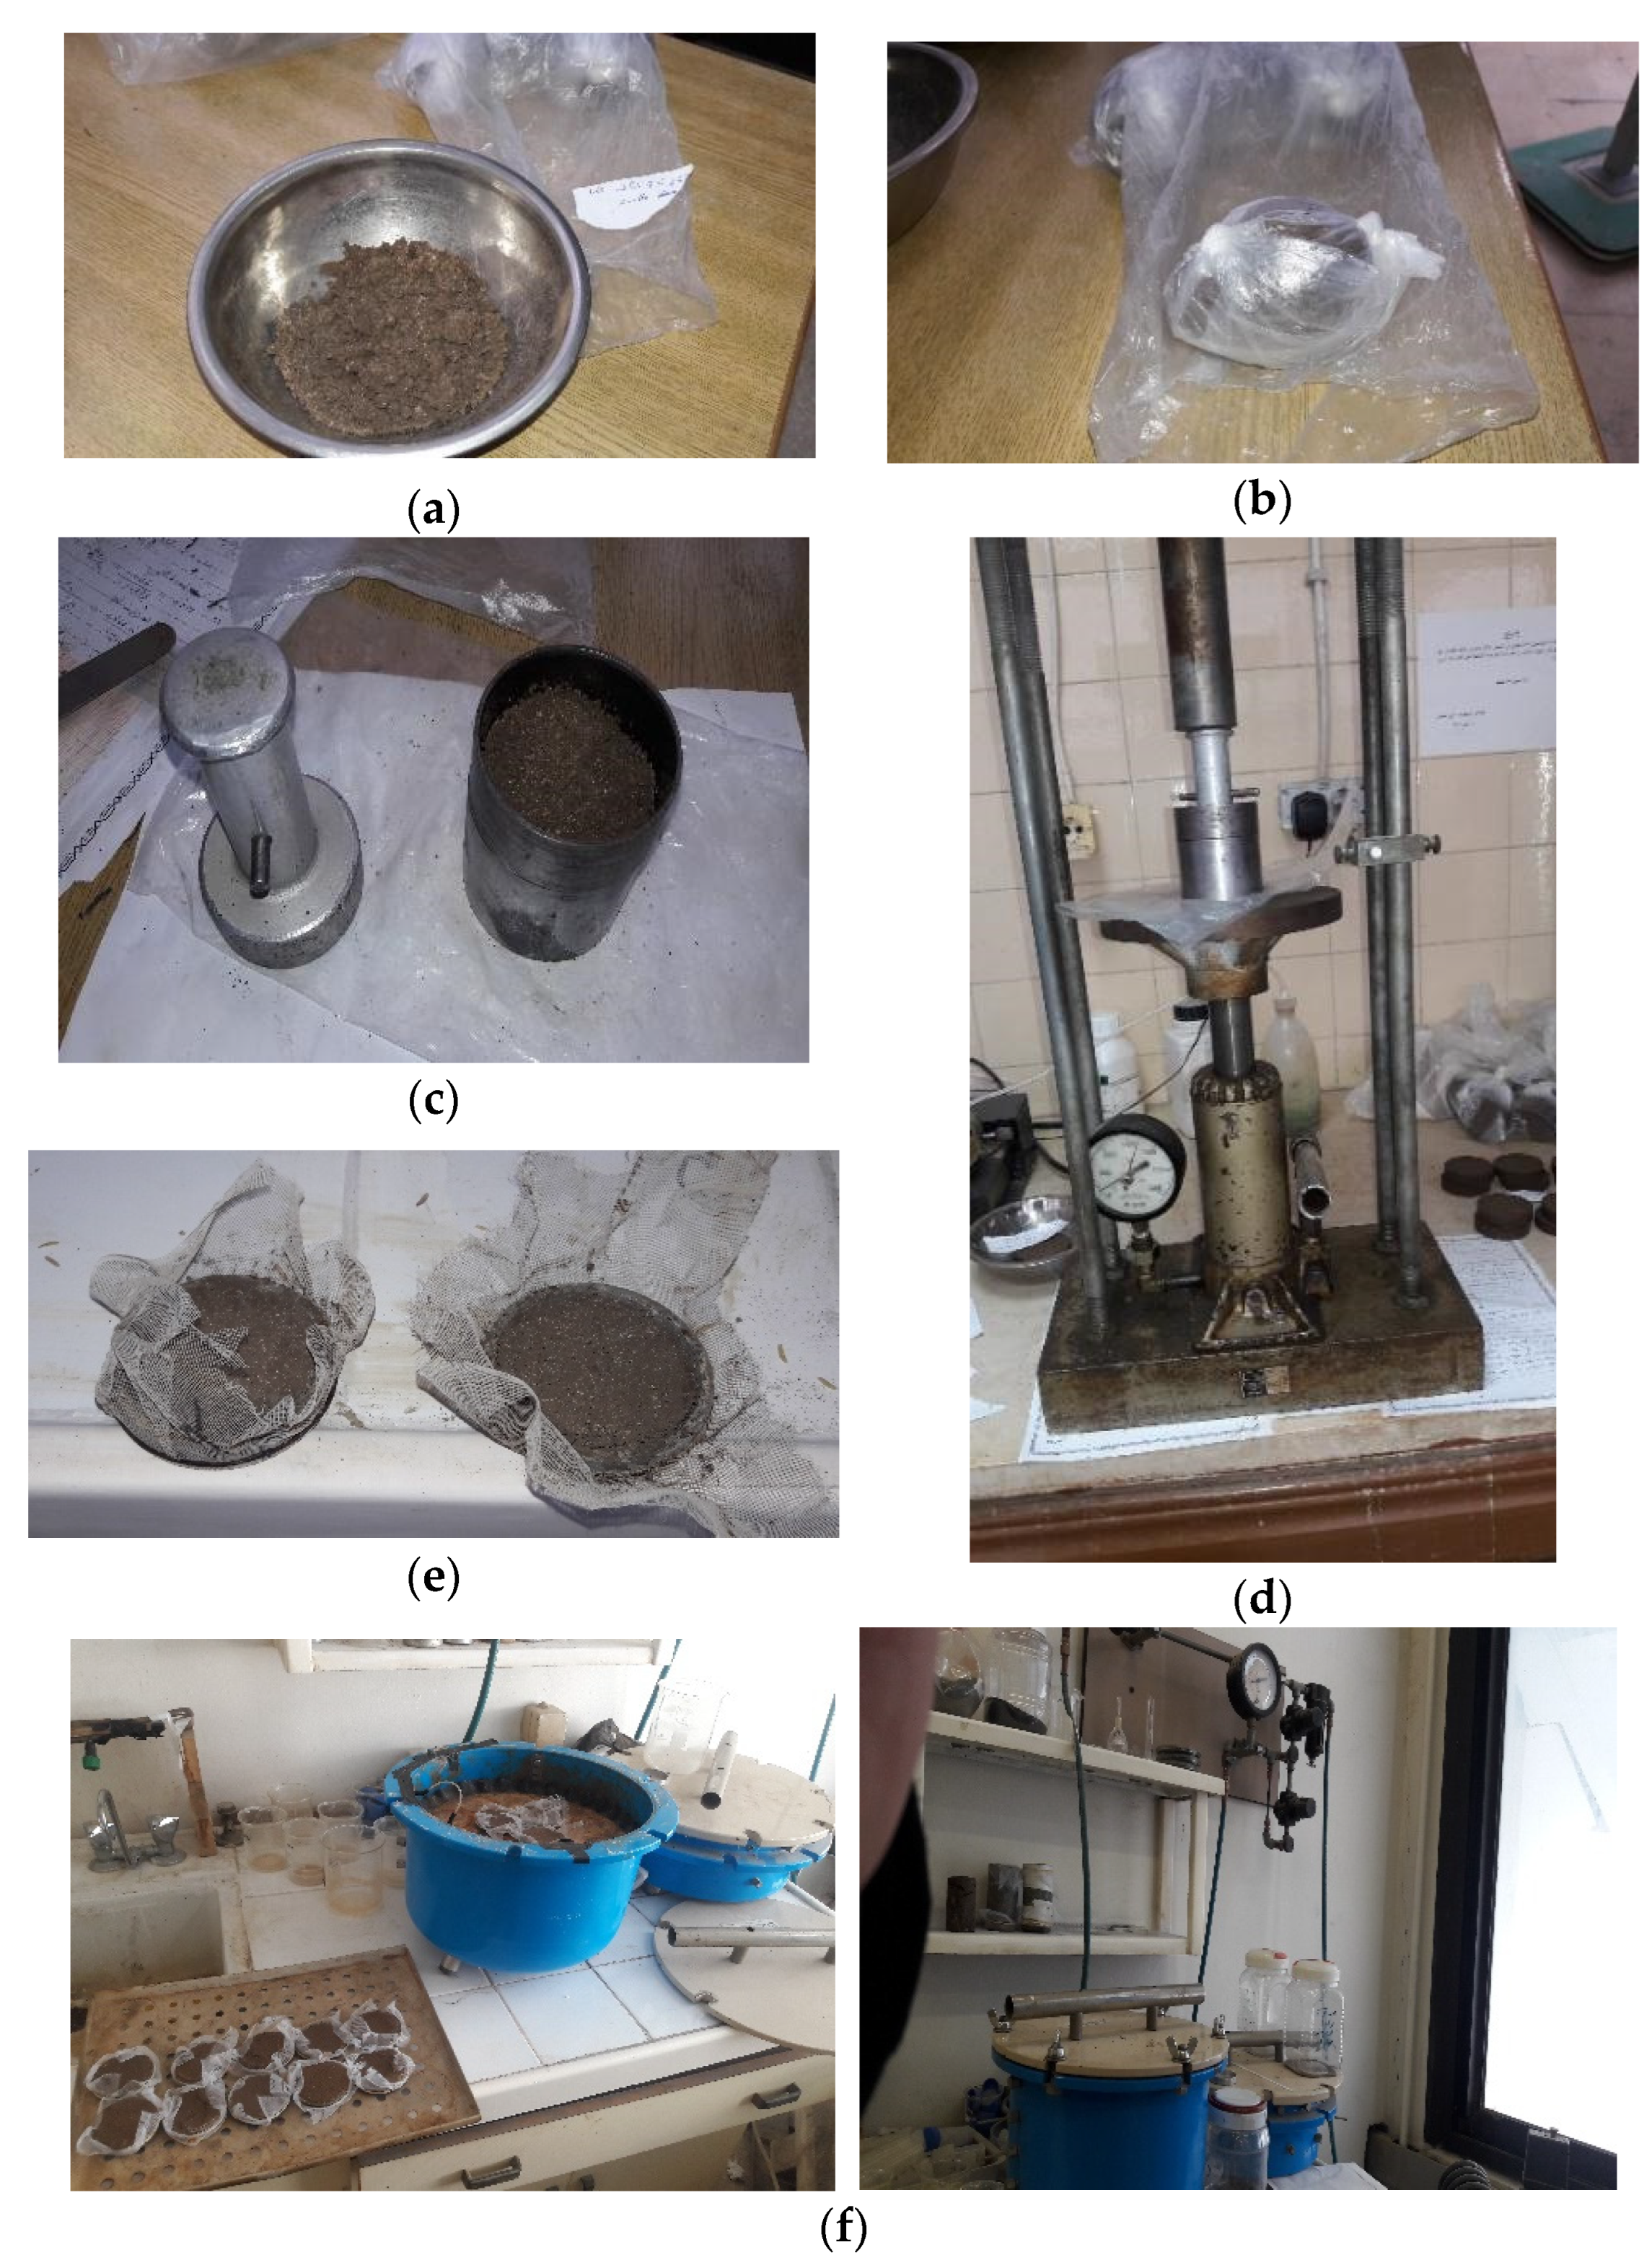
Figure 3f displays the pressure apparatus device used in this study.
When dealing with suction stress greater than 1585 kPa (pF > 4.2), the determination of maximum hygroscopicity Hy
(pF=5.25) corresponding to pF = 5.25 (17,783 kPa) is necessary. To determine this, samples are placed in a closed semi-saturated medium (94.3% humidity) utilizing 10% sulphuric acid concentration after being dried. The samples are left until their weight stabilizes and then they are weighed. After drying, the samples are weighed again, and the weight difference is used to calculate the moisture content. The volumetric water content is then calculated, and the maximum hygroscopicity is determined based on this value. To calculate the hygroscopicity that corresponds to a suction stress of pF = 6.13 (135,000 kPa), Equation (1) is used [
49]:
Empirical equations for the soil-water characteristic curve (SWCC) are obtained using the Fredlund Xing and Van Genuchten models. The mathematical expression for the Fredlund Xing model is presented in Equation (2) [
17], while the Van Genuchten model is shown in Equation (4) [
16]:
where
is a correction function (Equation (3)):
represents the suction value corresponding to the residual water content .
The fitting parameter ‘’ is primarily a unimodal function of the air entry value of the soil.
The fitting parameter ‘n’ is primarily a function of the rate at which water is extracted from the soil once the air entry value has been exceeded.
The fitting parameter ‘
m’ is primarily a function of the residual water content.
The symbols θr and θs represent the residual and saturated volumetric water content, respectively, which can be determined through testing.
The value of the fitting parameter ‘’ in the Van Genuchten model is inversely proportional to the air-entry value and the soil’s water holding capacity, while the opposite is true for the Fredlund Xing model—a higher value of ‘’ indicates a higher air-entry value and soil water holding capacity.
The fitting parameters ‘m’ and ‘n’ represent the residual volumetric water content and the slope of the SWCC, respectively:
For Van Genuchten
For Fredlung Xing where is the volumetric water content corresponding with air-entry value.
2.5. Specimen Preparation
Figure 3 depicts images of the modified sample preparation process employed in the laboratory. First, sand and clay soils were blended to create a homogeneous mixture (a). The mixture was then placed in a sealed plastic bag and isolated for 24 h for a uniform moisture distribution (b). The resultant mixture mass was then placed in a mold with dimensions matching the ring (c). A hydraulic jack applied static pressure to compress the specimen to the desired unit weight (d). The finished specimen (e) was placed in the pressure apparatus (f).
2.6. Experimental Procedures
First, the sand and clay samples were dried with a thermostatic drying chamber at a temperature range of 105–110 °C for a minimum of 24 h.
Second, the required percentage of sand was mixed with the clay in a dry state, and then the dry mixture was wetted to the prescribed initial moisture content. Cylindrical specimens of varying initial moisture content and initial dry unit weight were created using the mixture samples as illustrated in
Figure 3.
Third, prior to the application of suction, the test specimens were fully saturated via inundation of the bottom of the samples with distilled water for a week. This method, as per Fattah et al. [
13], was determined to be the optimal method for achieving saturation. The mass of each mixture was measured using a high-precision electronic scale prior to insertion into the device.
Fourth, the saturated samples were placed in the test device chamber, and suction stresses of pF = (1.8–2.5–3–3.6–4.2) were applied to expel the water from the soil sample.
Fifth, after reaching balance for each applied suction stress, the soil samples were immediately weighed using a high-precision electronic.
Sixth, the samples were subsequently dried for 24 h at 105 °C in an oven to obtain the mass of dried soil.
Seventh, the maximum hygroscopic, corresponding to the previously mentioned suction stress of 17,783 kPa, was calculated.
Lastly, Fredlung Xing [
17] and Van Genuchten [
16] models were used to obtaining the empirical equation of SWCC of the experimental results using the Solver tool in Excel. Volumetric water content was determined using Equation (5):
: the volumetric water content of soil sample when the suction value is
: the wet soil mass (g)
: the dry soil mass (g)
: the density of water (g/cm3)
: the dry density of soil (g/cm3)
3. Results and Discussion
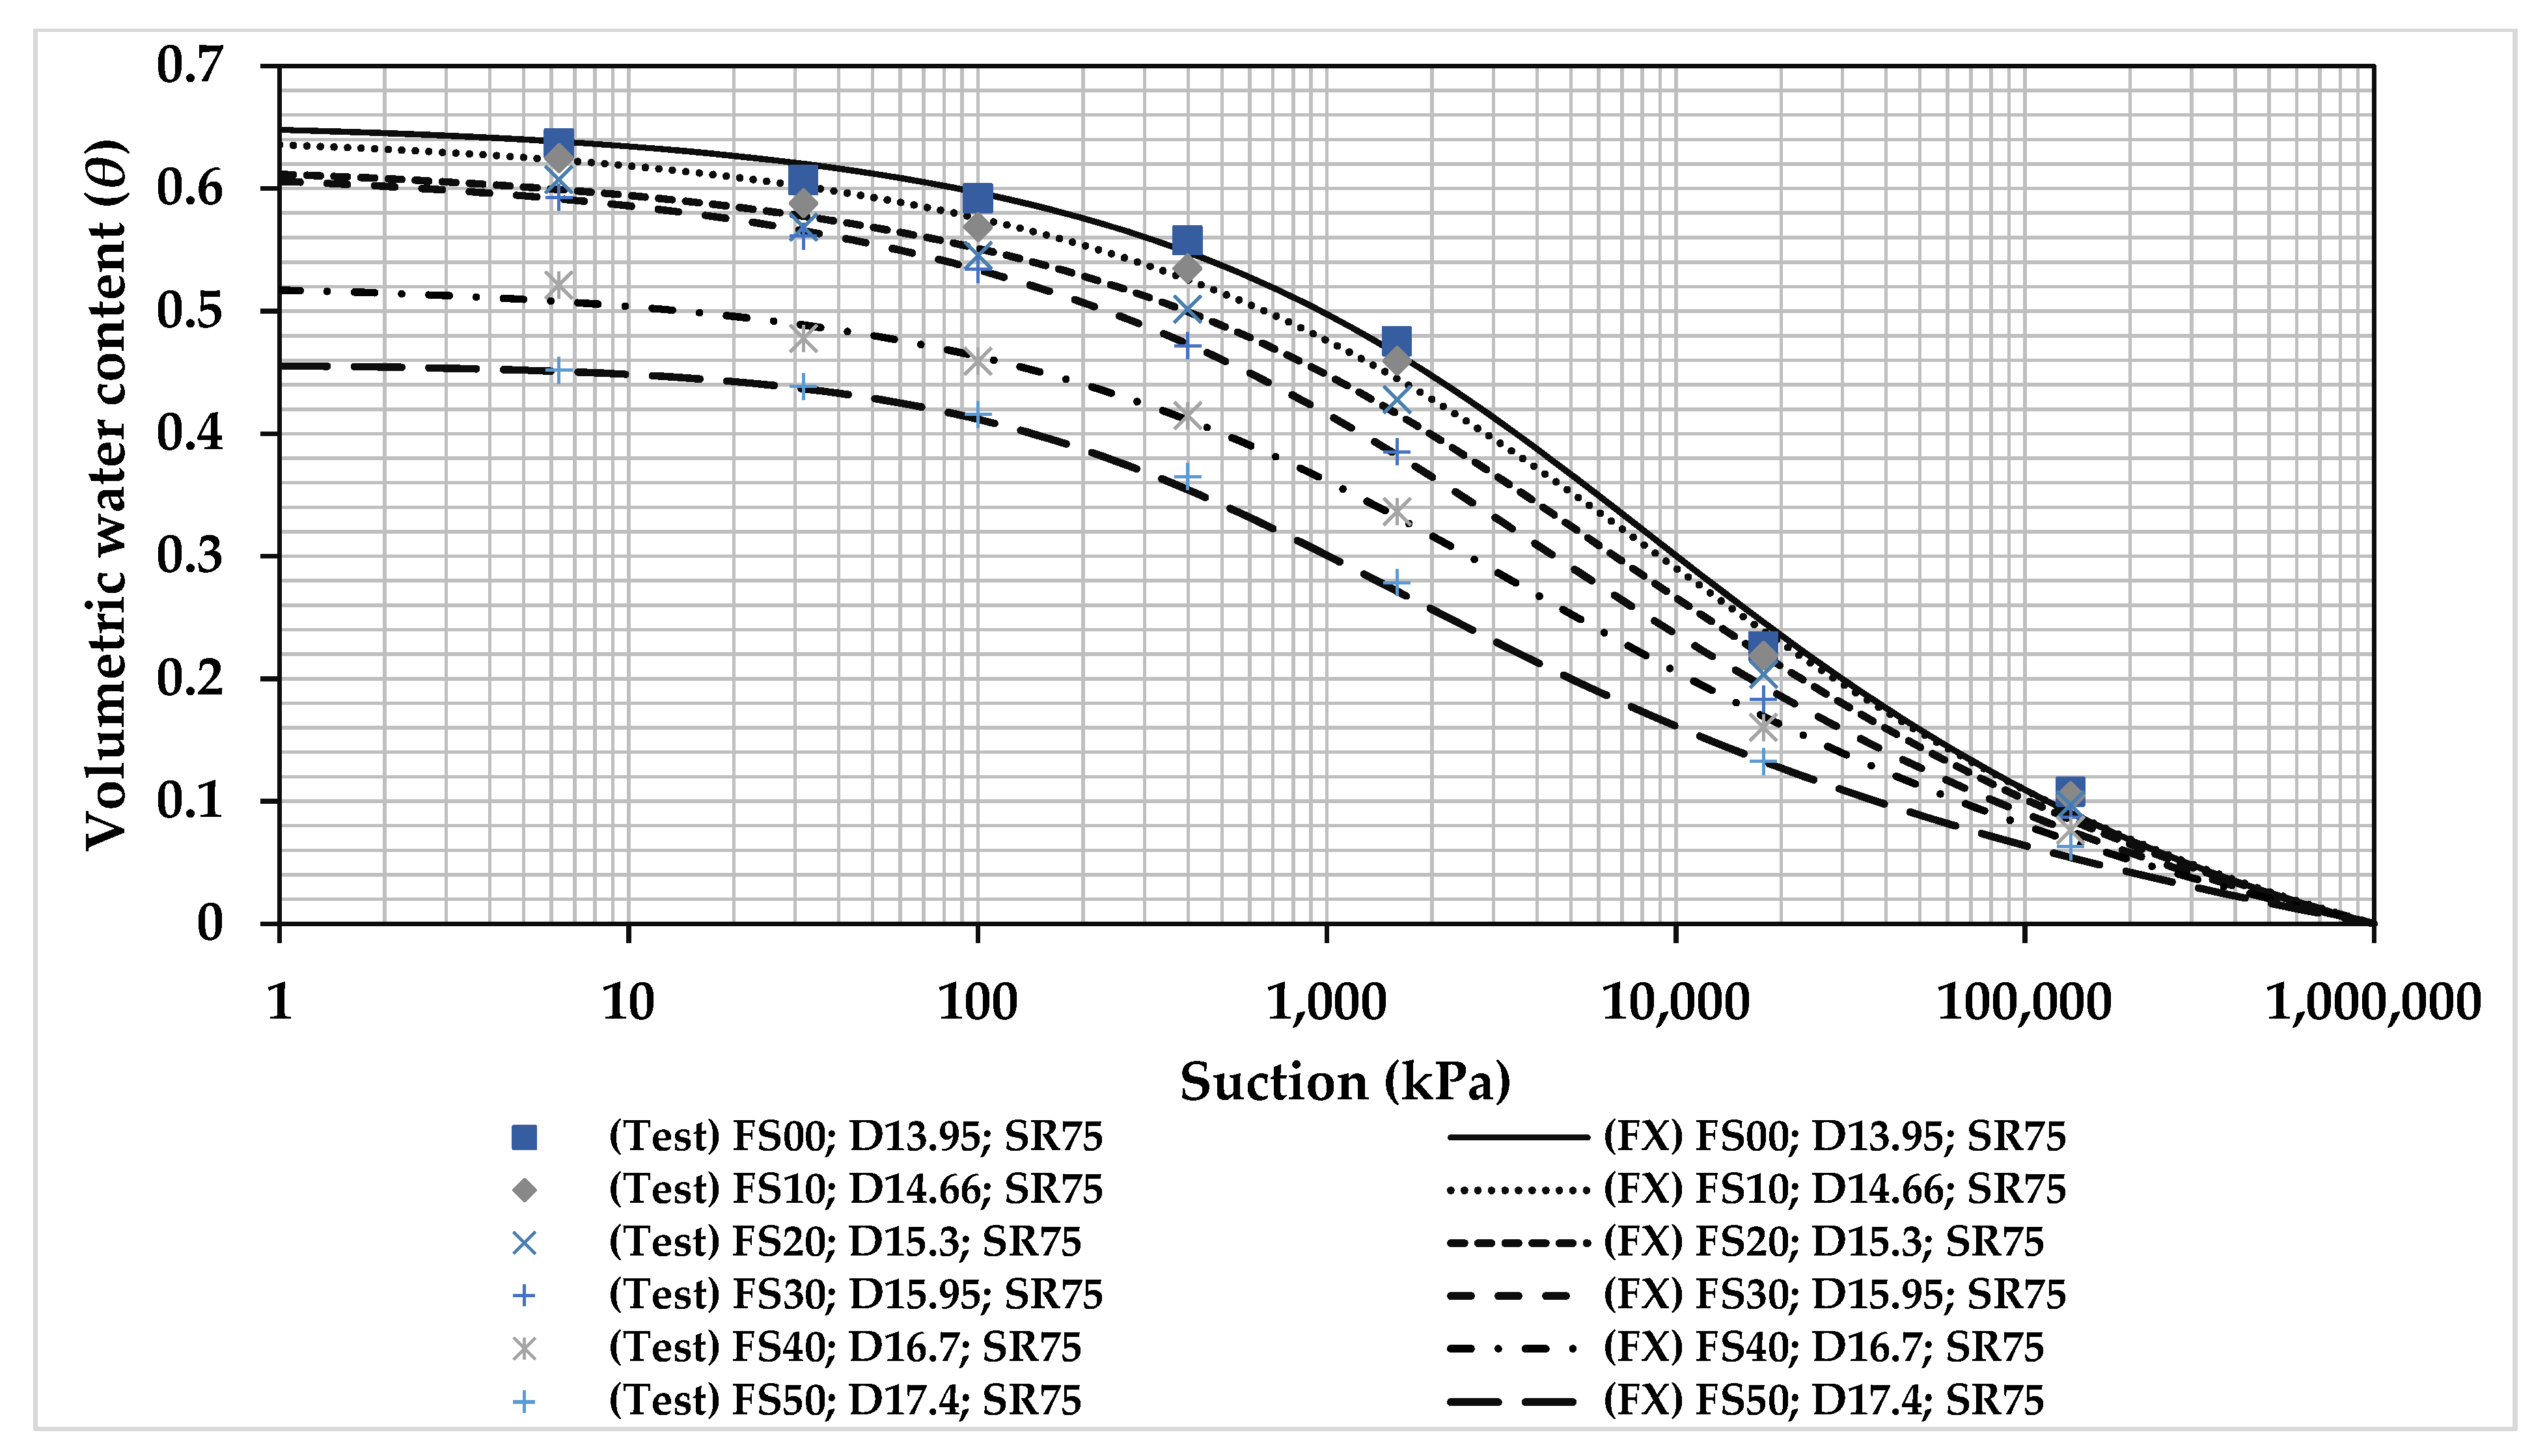
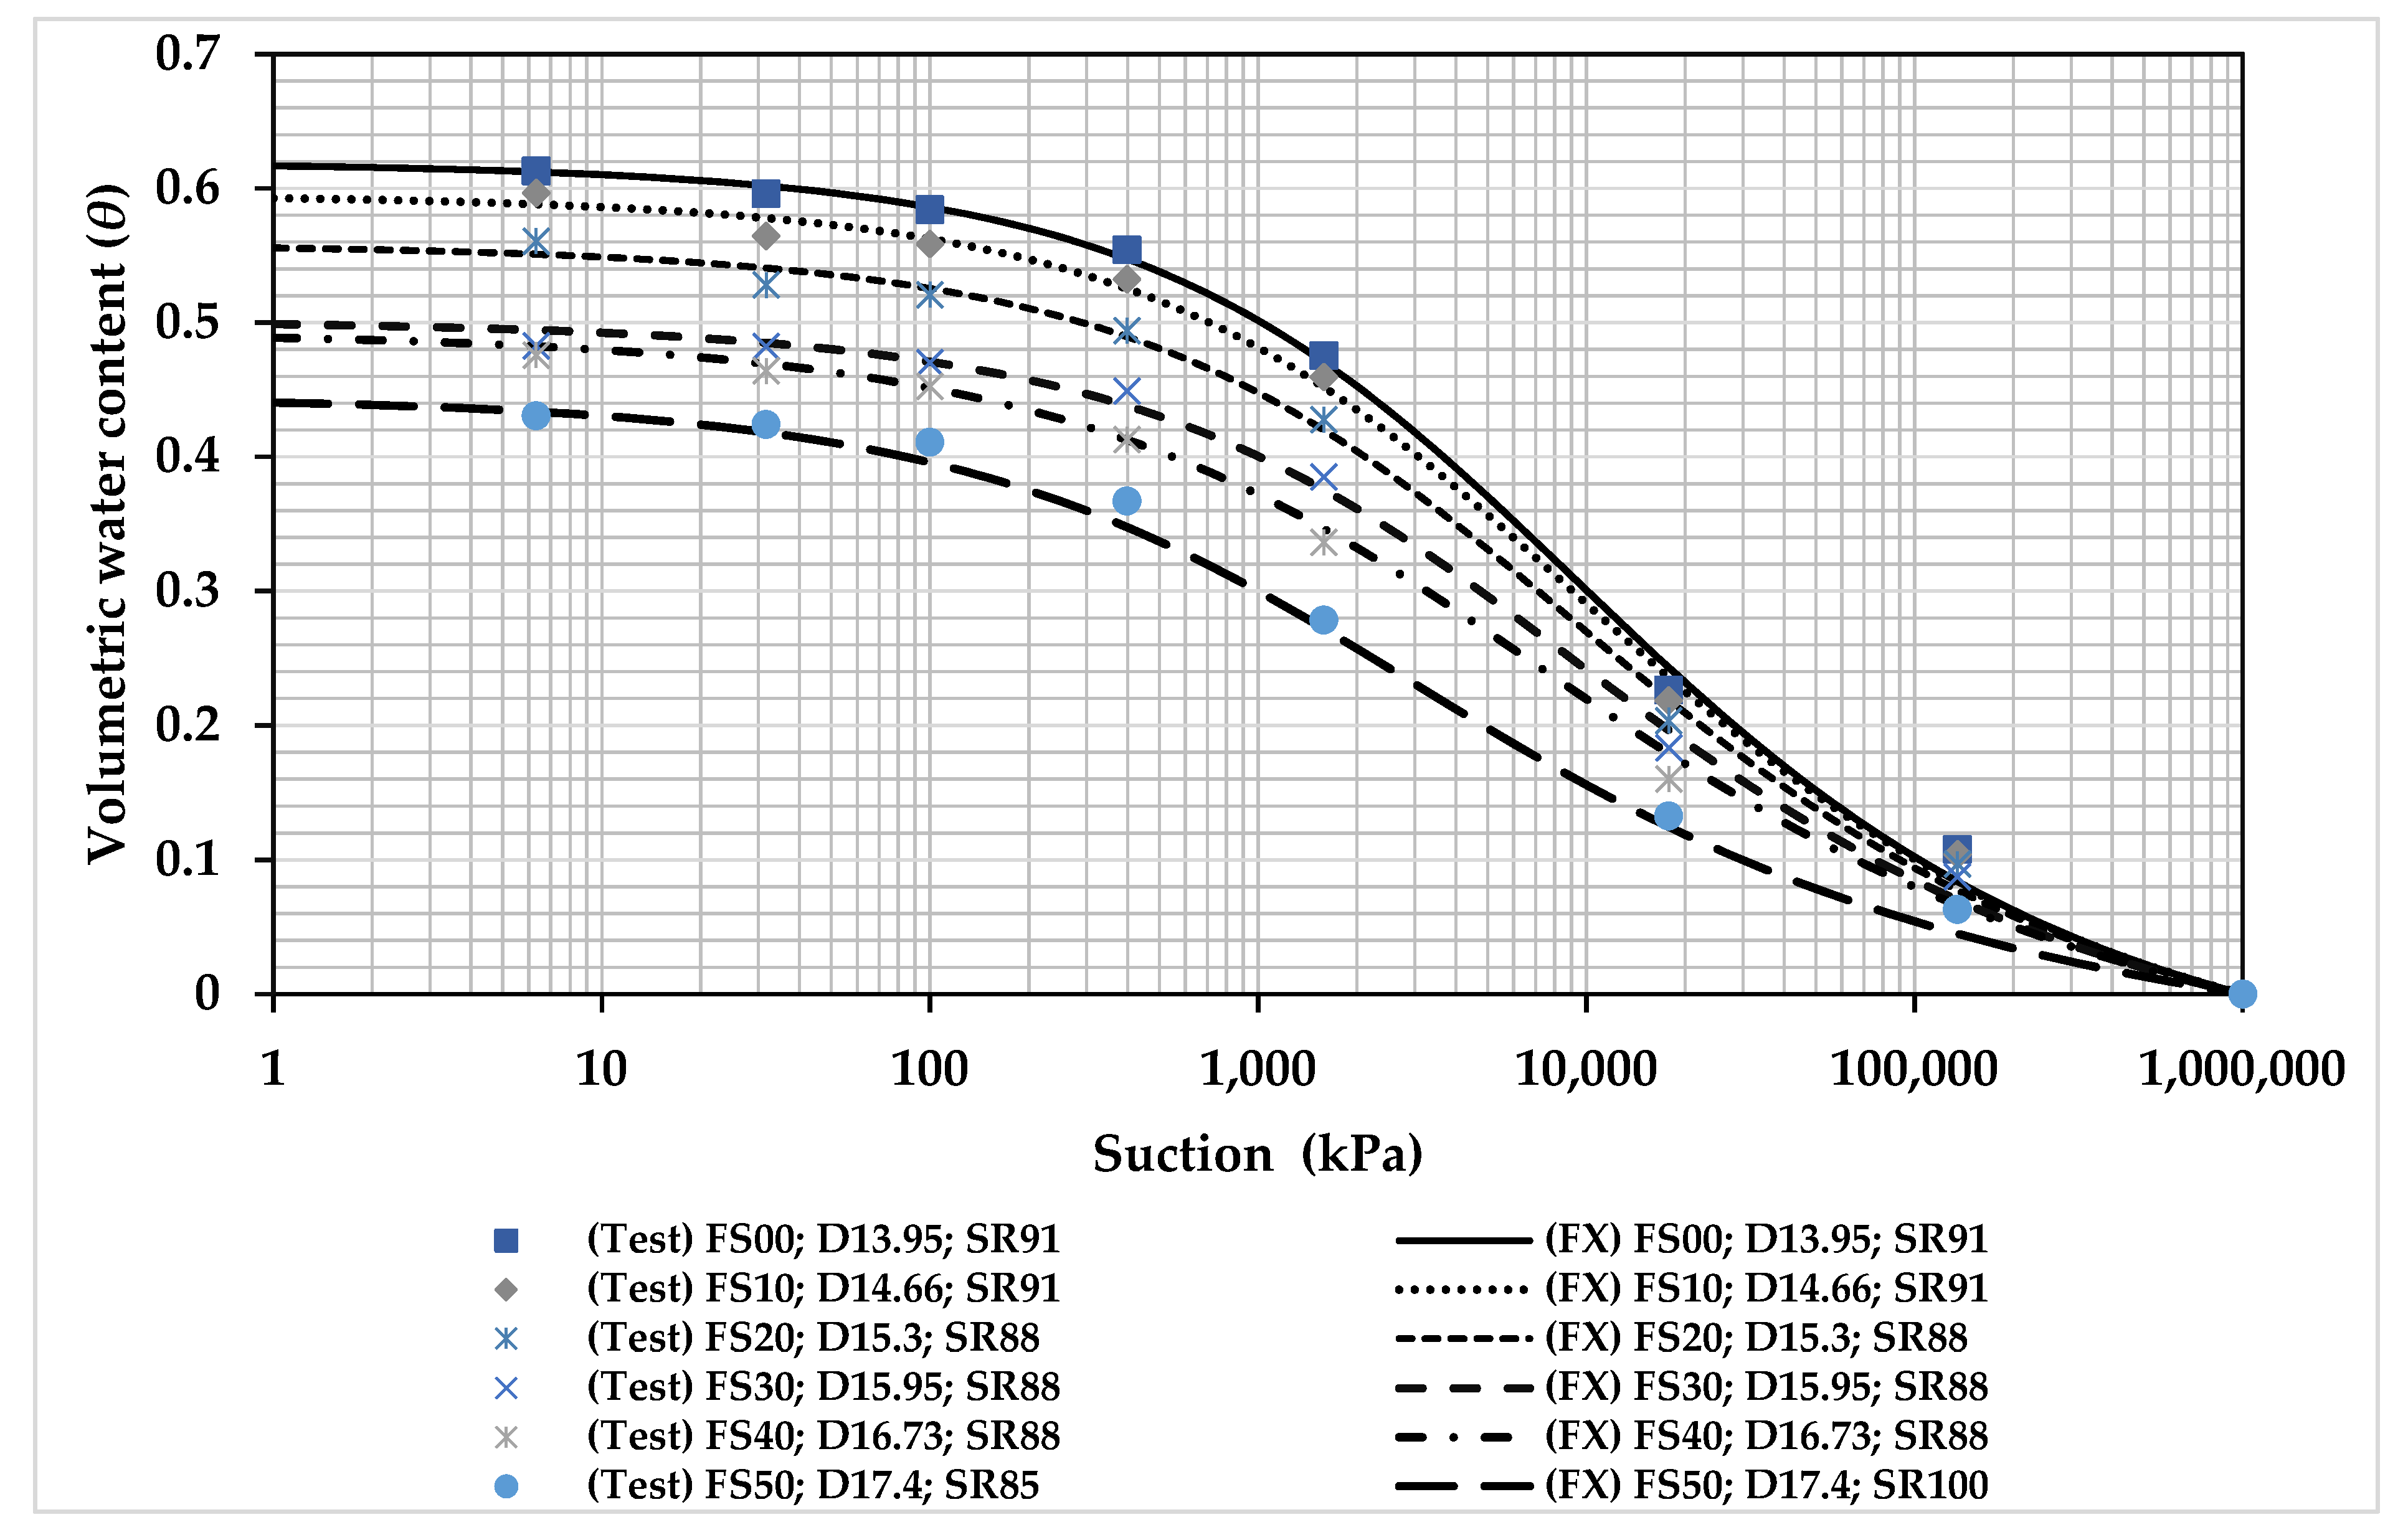
This section addresses both the results and discussion, beginning with an analysis of fitting parameters for the Fredlund Xing and Van Genuchten models. It then presents results on the influence of dry unit weight, degree of saturation, and sand content. The discussion explores these effects, with each figure accompanied by a legend identifying distinct initial conditions (e.g., ‘FS00’ for 0% sand content, ‘D15.3’ for 15.3 kN/m3 initial dry unit weight, and ‘SR75’ for 75% initial degree of saturation). The legends also differentiate between the best fit line generated by the Fredlund Xing (FX) model and the experimental data (Test).
3.1. Fitting Parameters of Fredlung Xing and Van Genuchten Models
The fitting parameters of the Fredlund Xing and Van Genuchten models were obtained using the Solver tool in Excel. The obtained parameters are presented in
Table A1,
Table A2,
Table A3 and
Table A4 found in
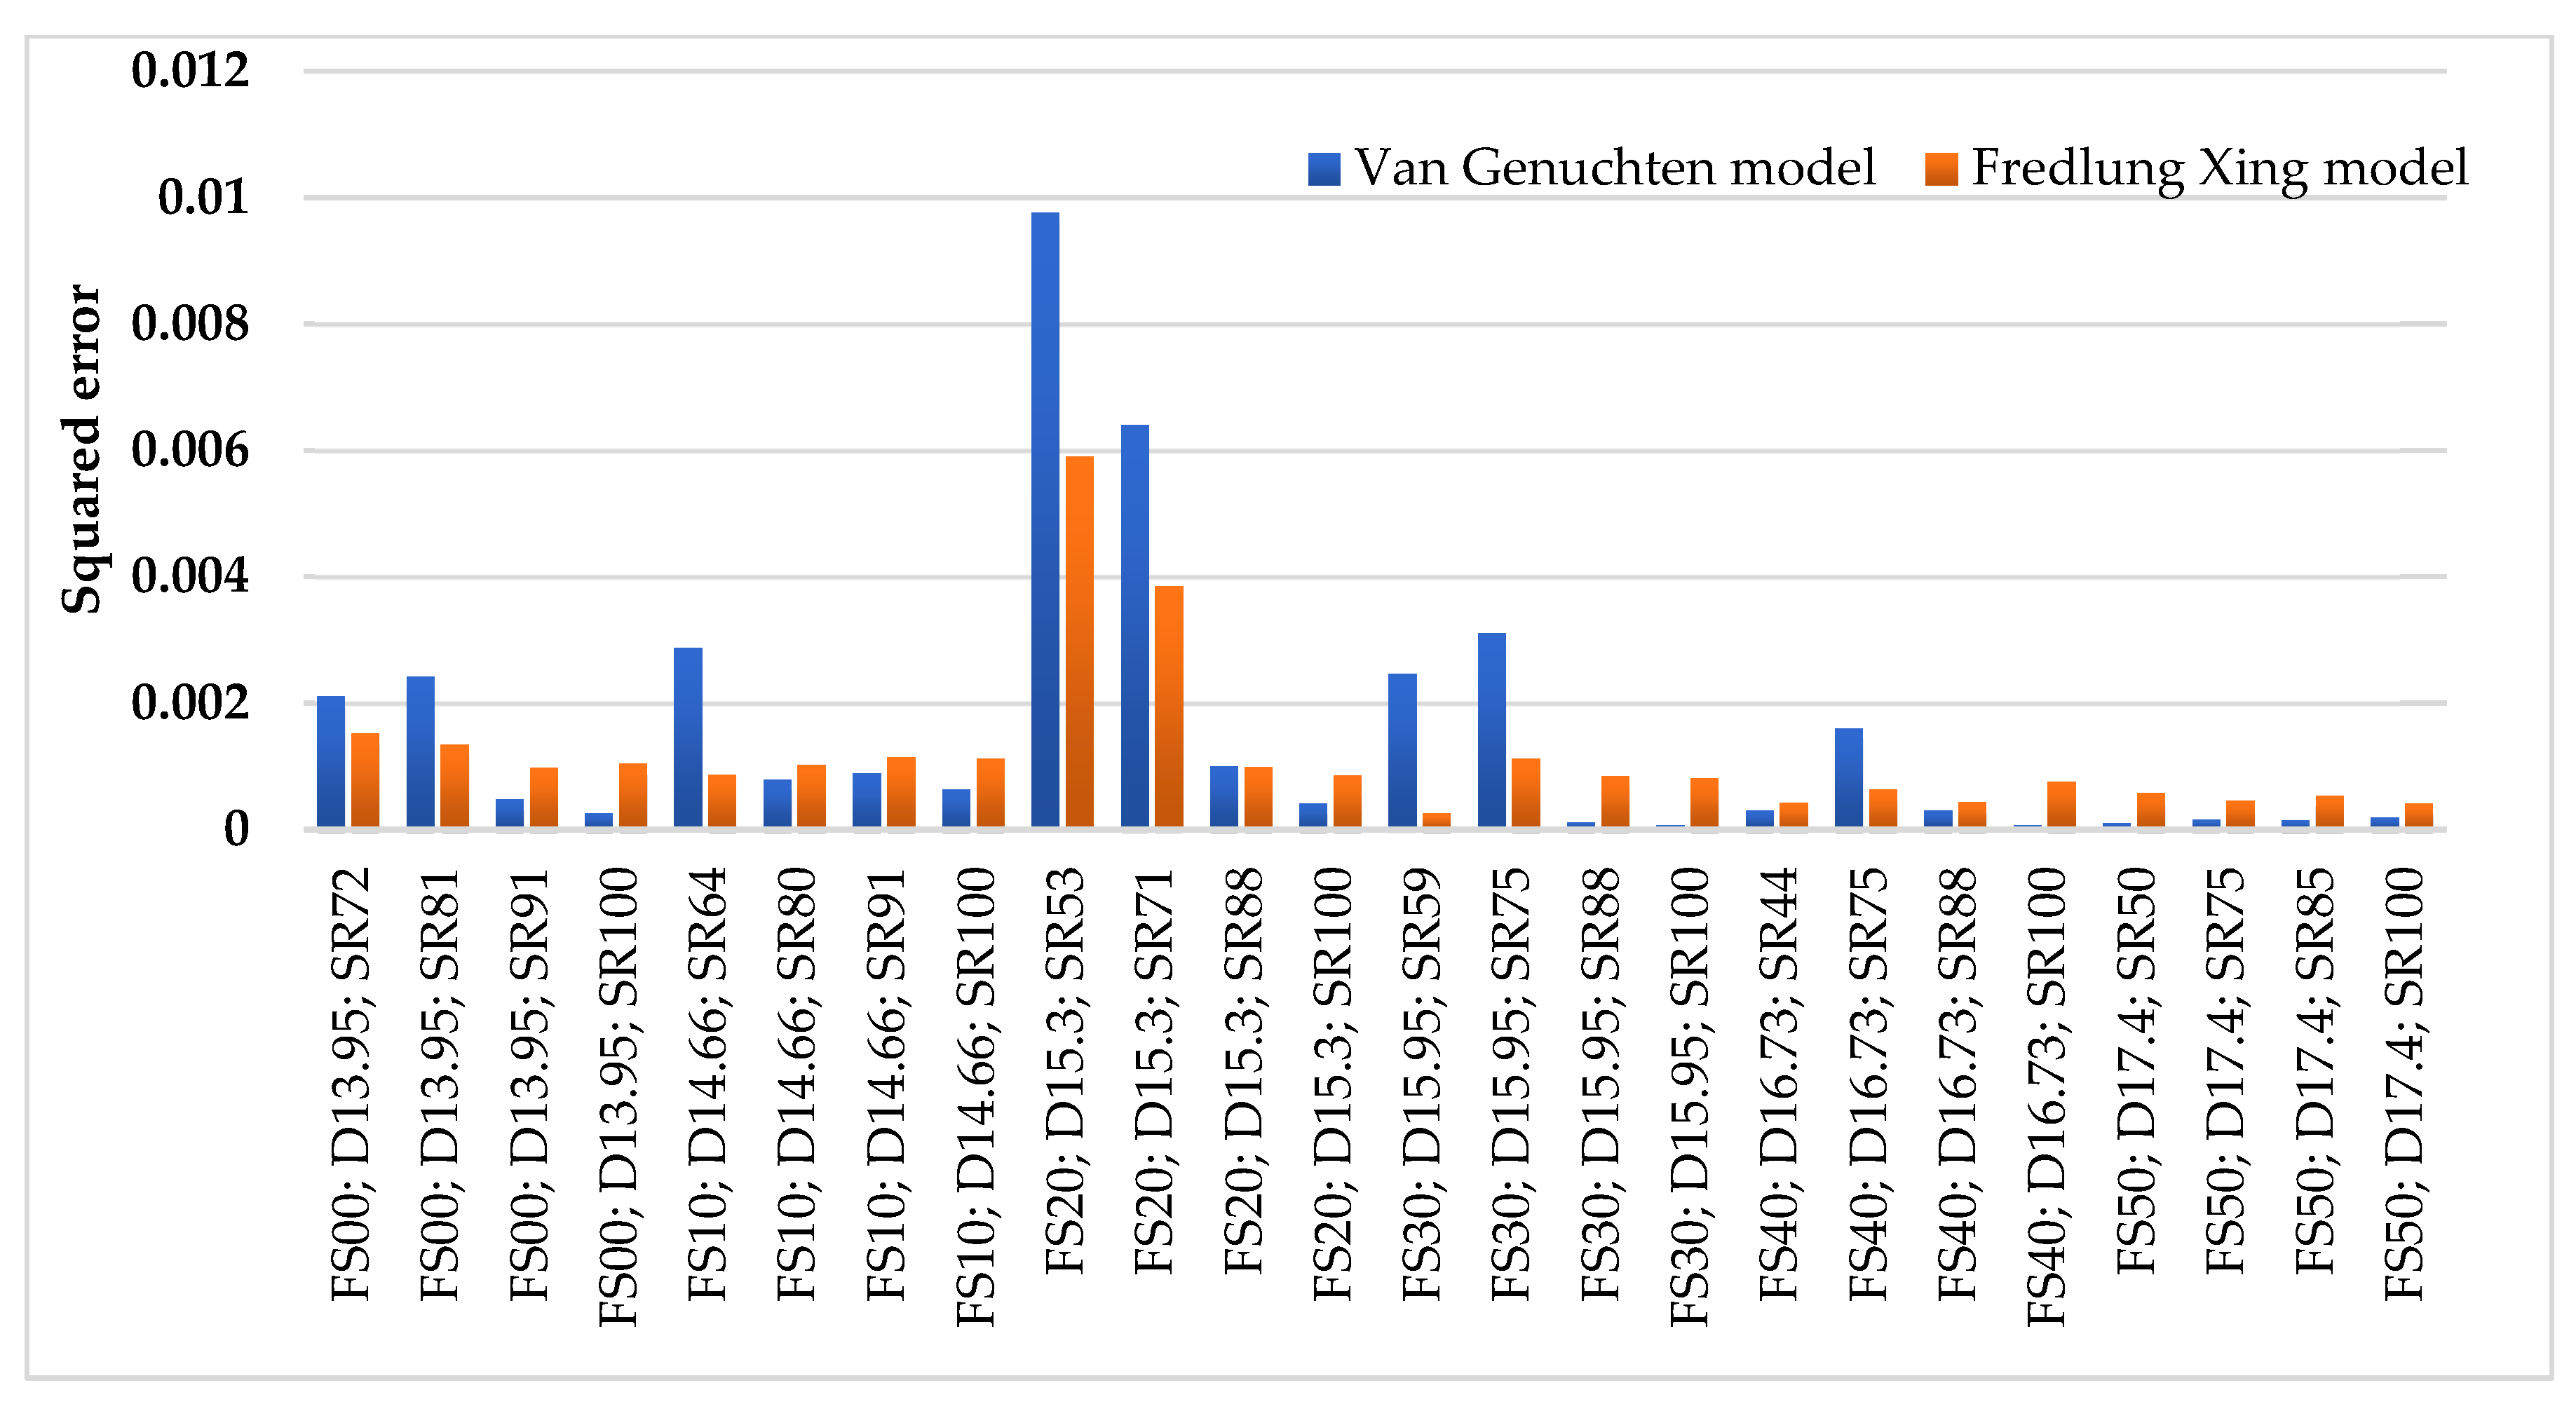
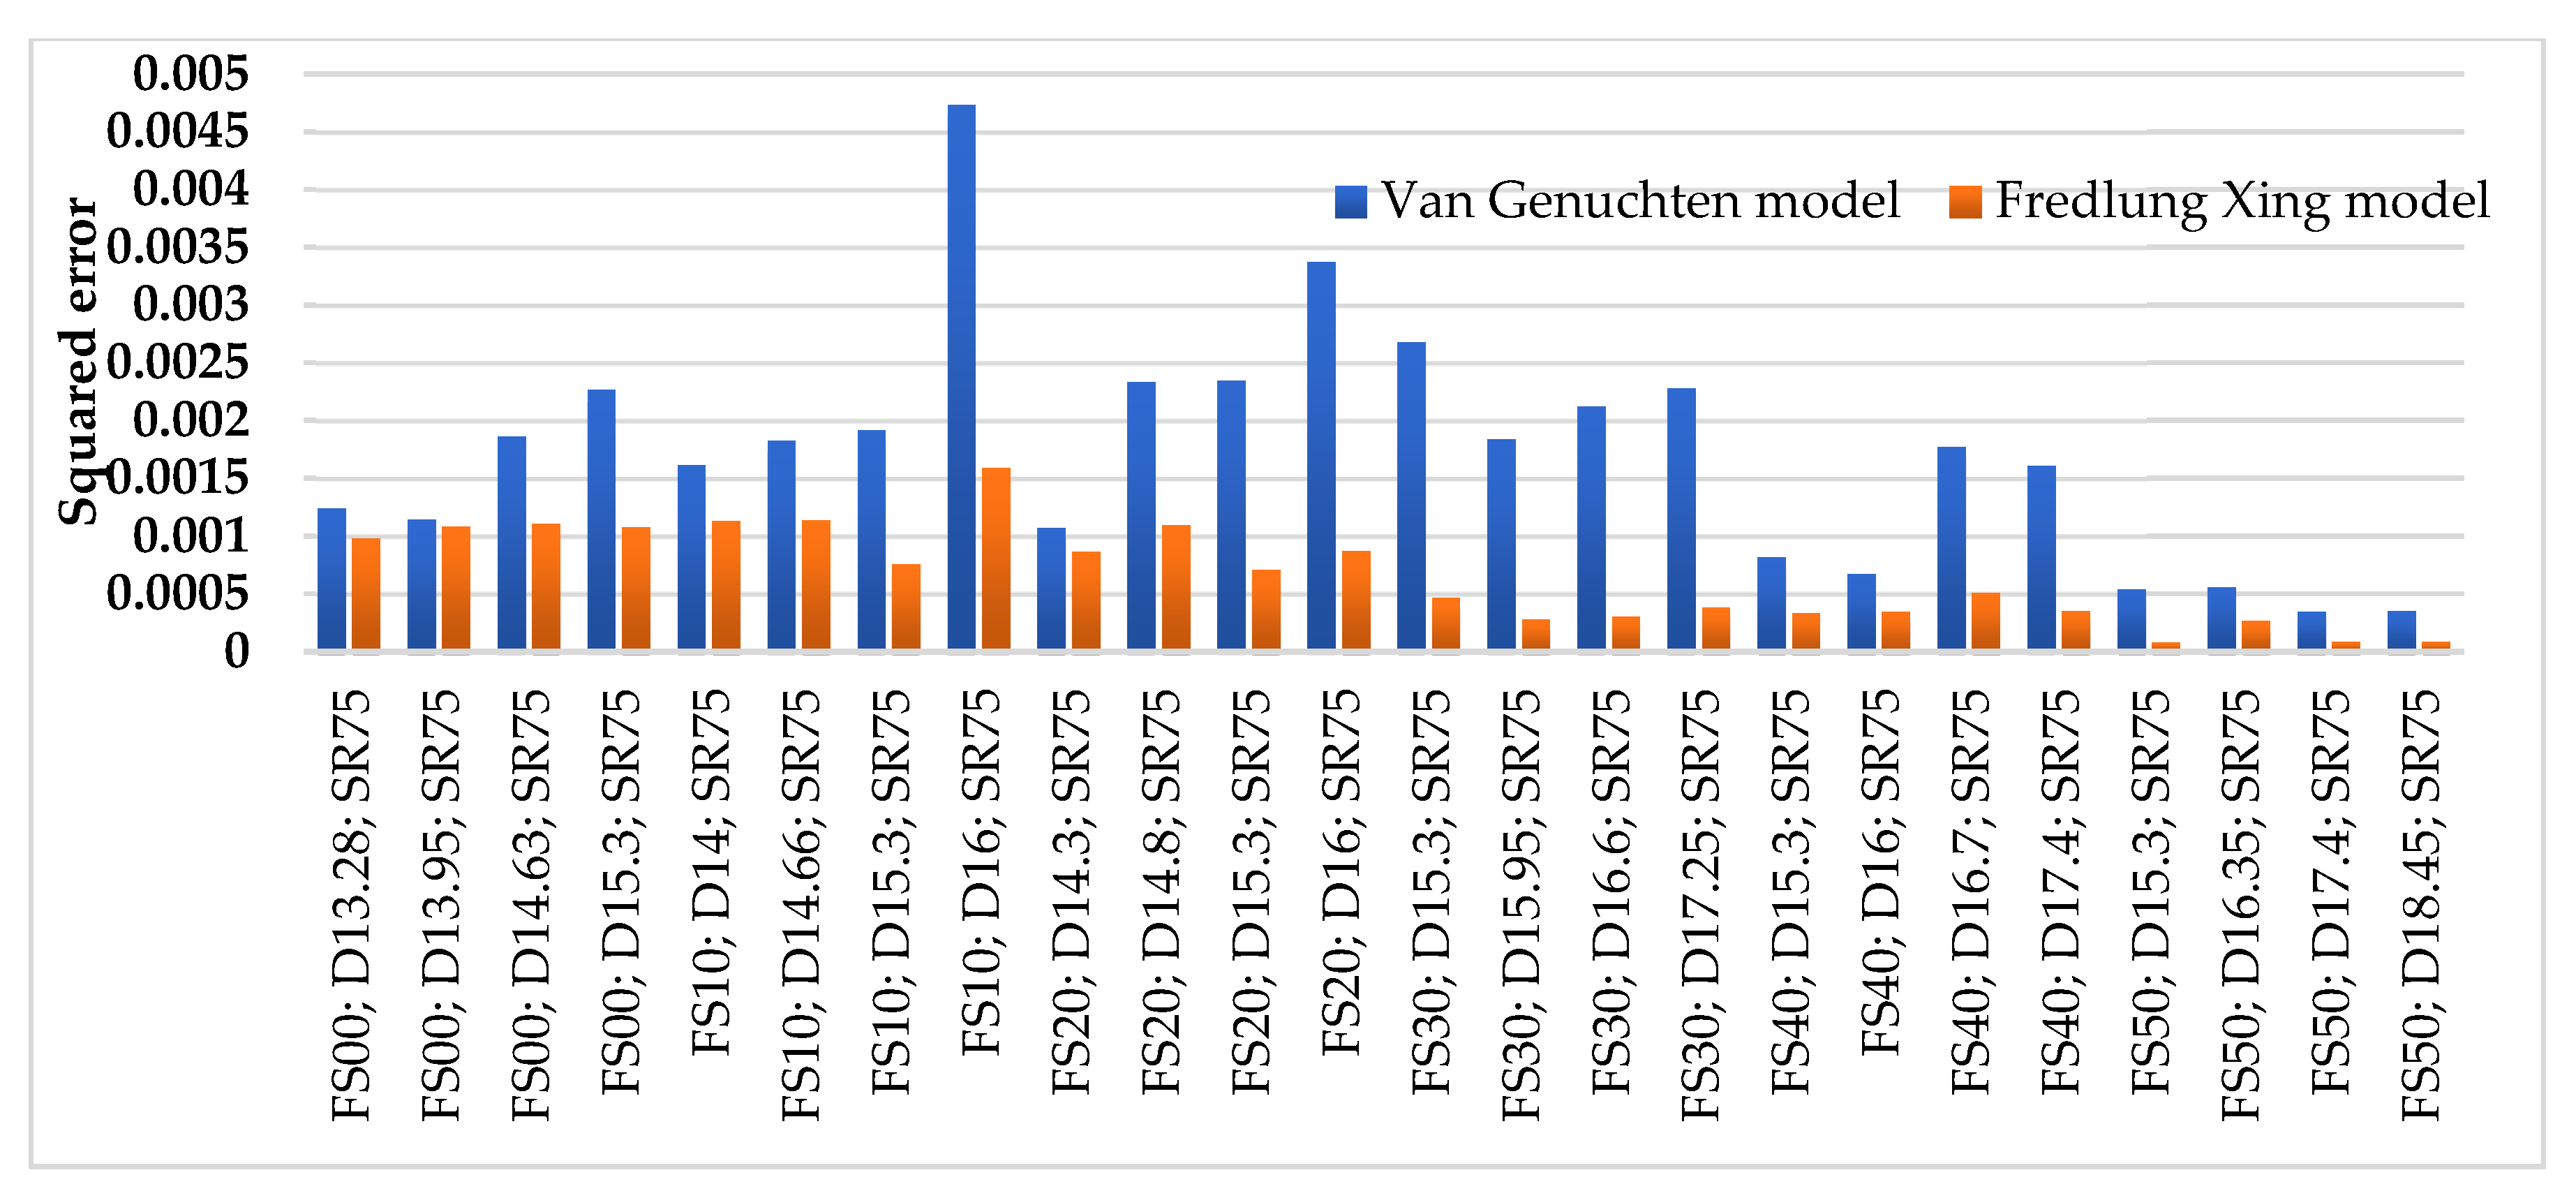
Appendix A, which also display the squared error values that reflect the fitting accuracy of the models.
Figure 4 and
Figure 5 show the squared error of both models for samples with different sand percentages, initial degrees of saturation, and initial dry densities. The Fredlund Xing model exhibits a superior fitting accuracy compared to the Van Genuchten model. However, for sand percentages above 30% or initial saturation degrees exceeding 85%, the Van Genuchten model shows good fitting accuracy and the squared error approaches that of the Fredlund Xing model.
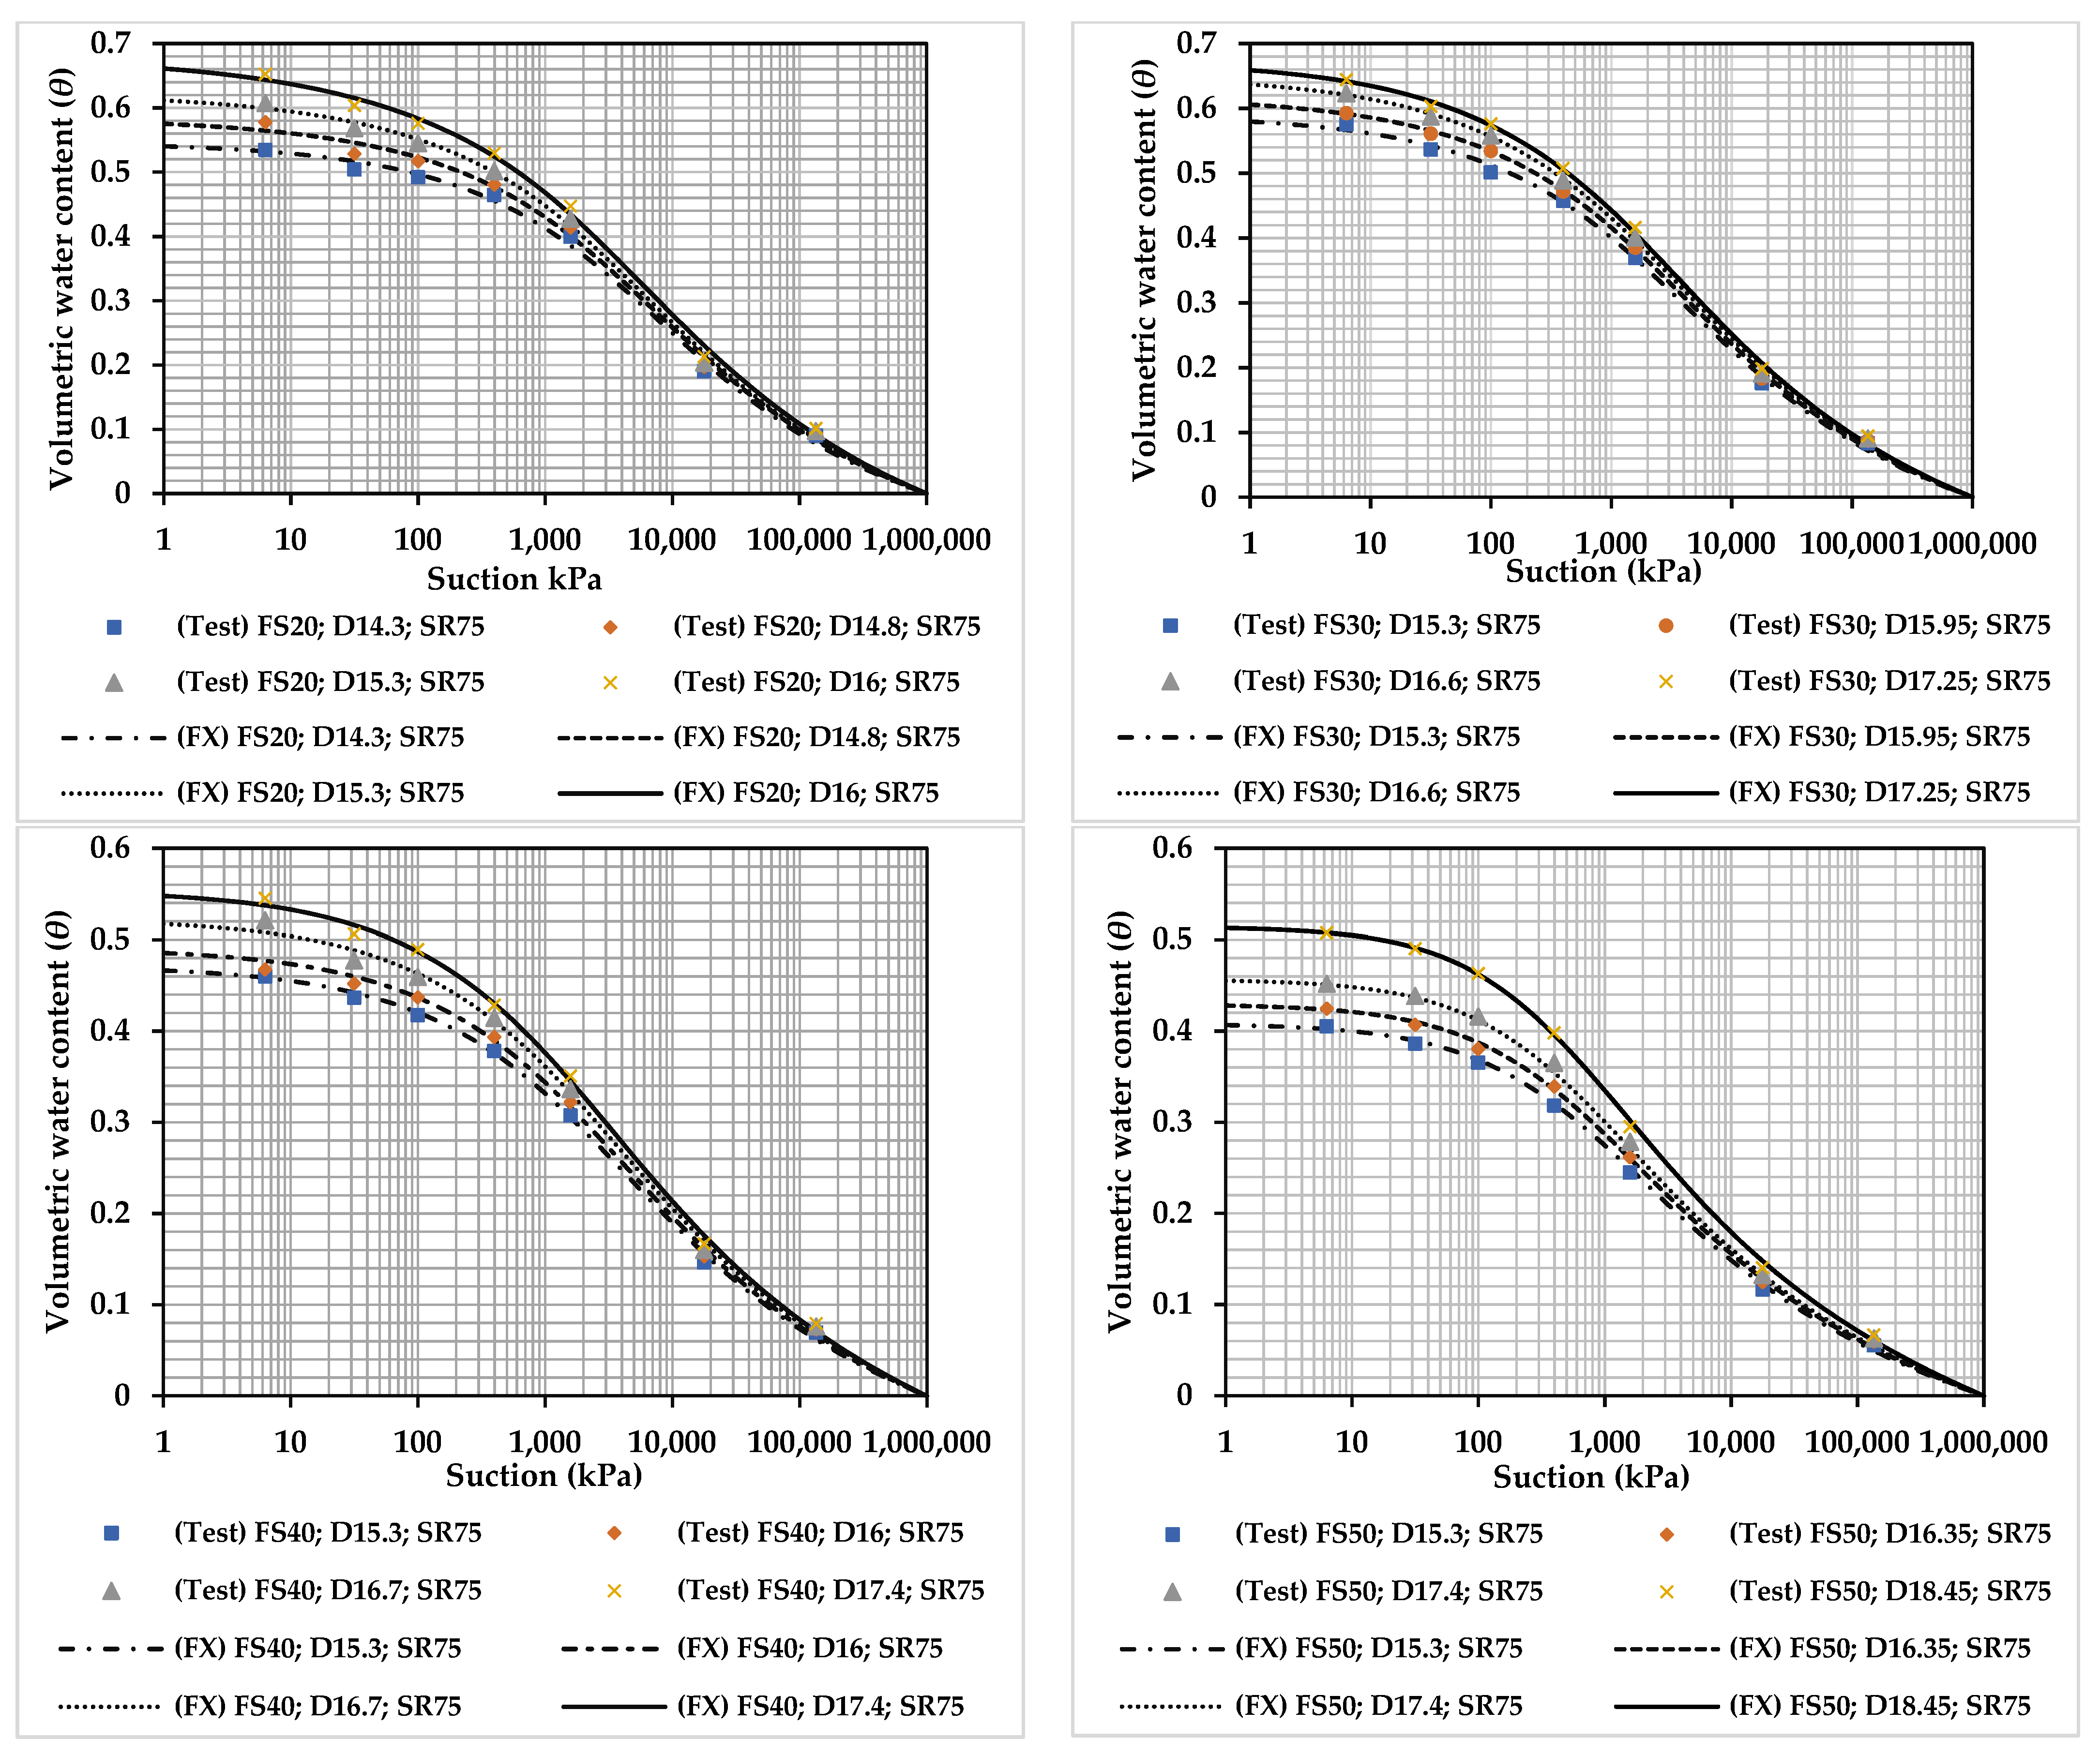
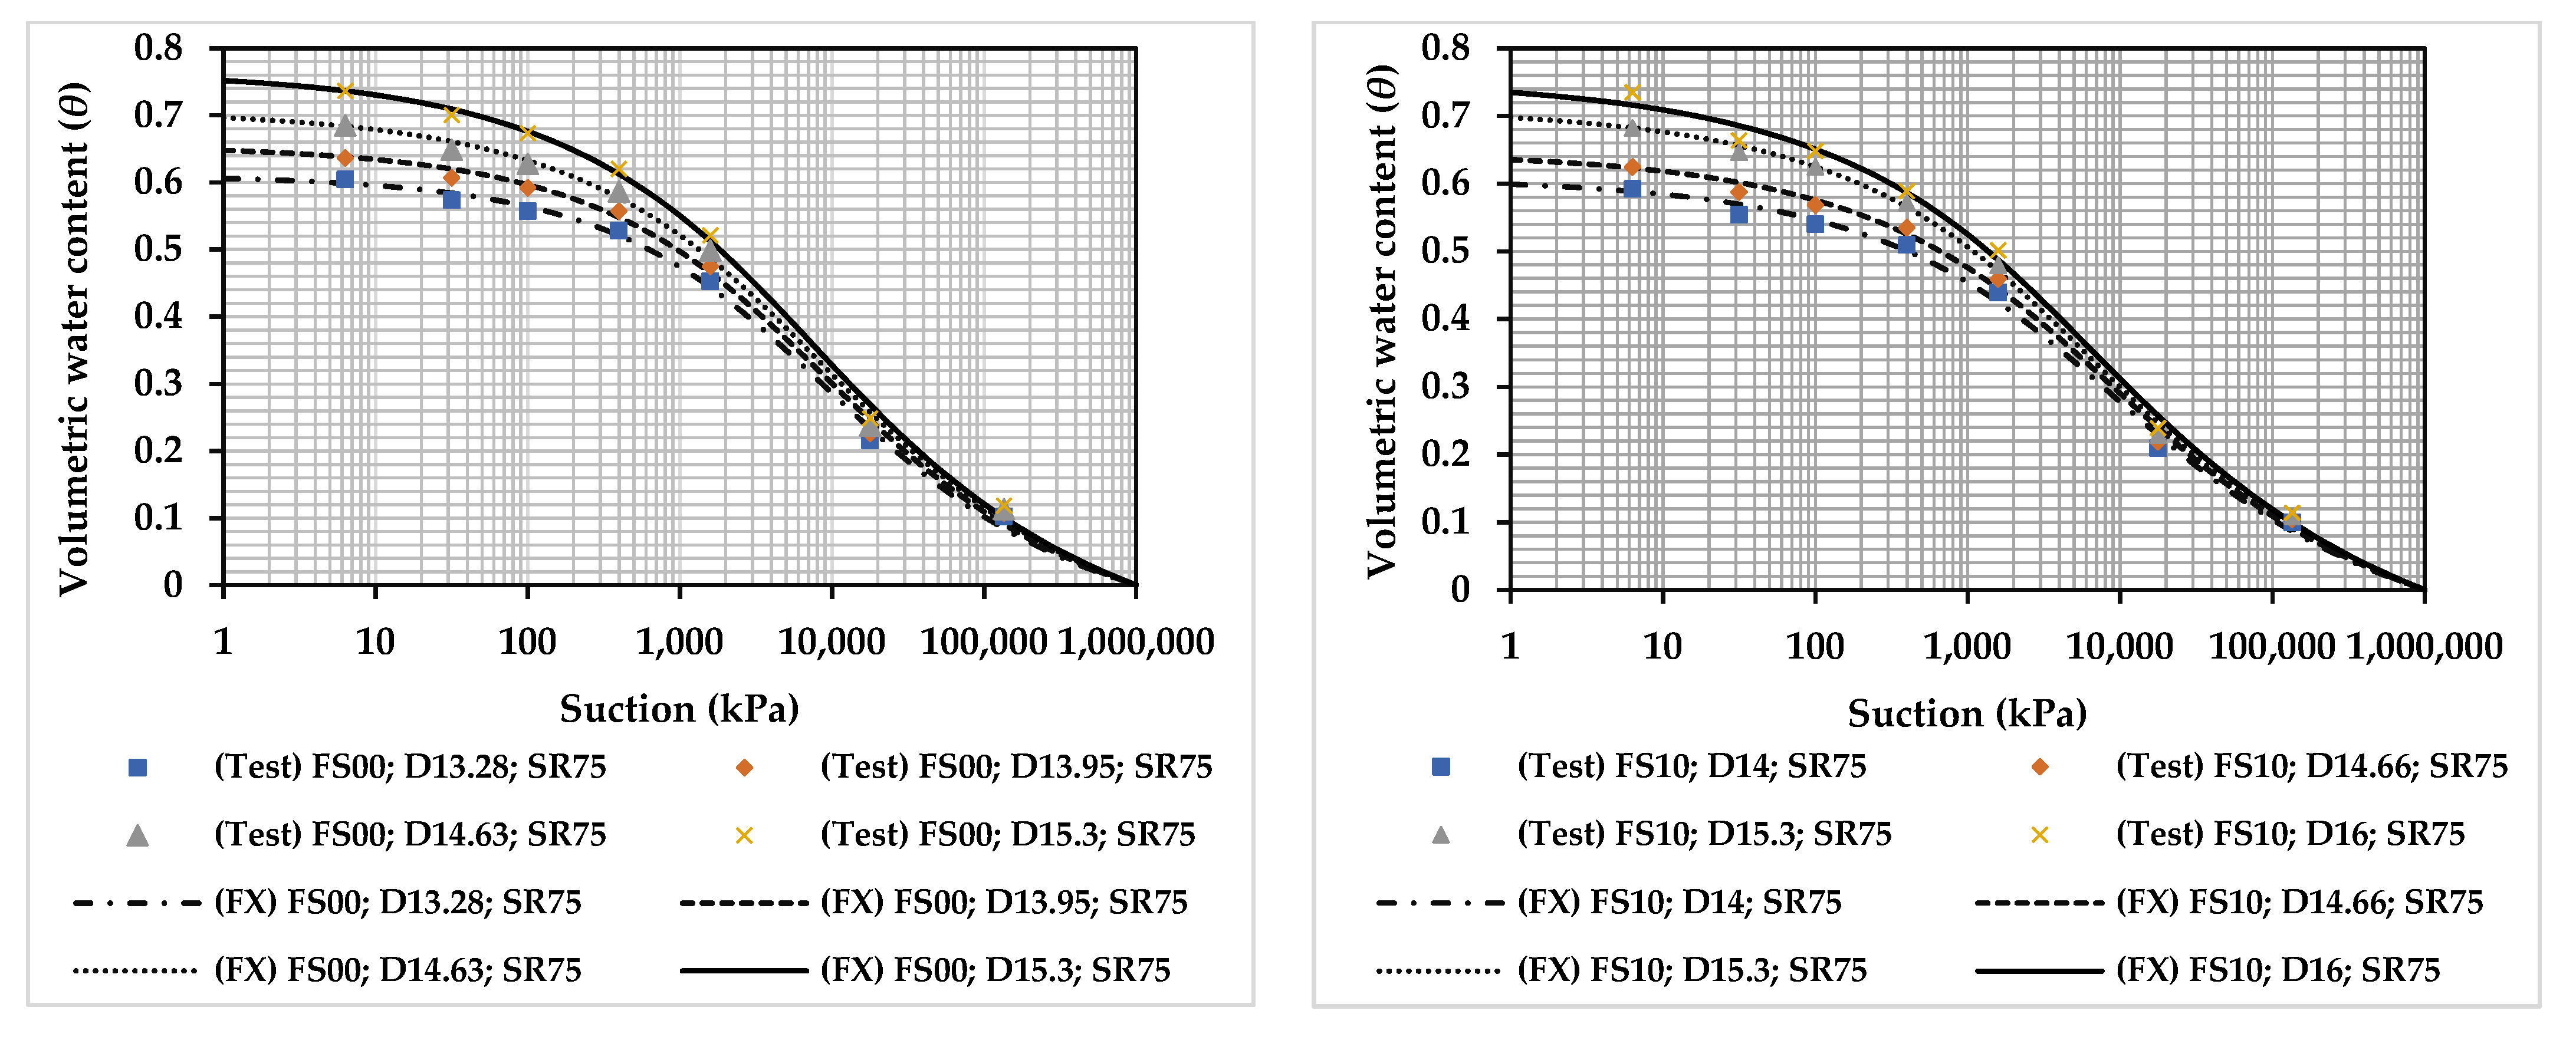
3.2. Effect of Initial Dry Unit Weight on SWCC
The effect of initial dry unit weight on soil water characteristic curves (SWCC) was investigated in this study. The initial degree of saturation was set at 75%, and different densities were taken for each percentage of added sand to evaluate the influence of the initial dry unit weight. The study found that increasing initial dry densities led to an increase in the soil’s water holding capacity (
θs) due to the soil’s swelling capacity. However, the water retention capacity decreased with increasing initial dry unit weight as a result of volumetric changes that occurred. The results were plotted in
Figure 6, where each percentage of added sand was represented by markers and the best-fit line by continued lines using Fredlund and Xing model.
Table A1 and
Table A2 within
Appendix A presented the fitting parameters and squared error for Fredlund Xing and Van Genuchten models at various initial dry densities and percentages of added sand. The study further showed that the Van Genuchten model’s
n and
m fitting parameters decreased with increasing initial dry unit weight due to a decrease in the void ratio. The Fredlund Xing model showed an increase in the n fitting parameter for high percentages of added sand (
FS > 30%), which could be attributed to the correction function at high suction values. Therefore, the Van Genuchten model was deemed better for interpreting
n and
m fitting parameters. However, the Fredlund and Xing model had a better fit with the experimental results compared to the Van Genuchten model.
Figure 6 exhibits a direct correlation between the initial dry unit weight of all percentages of added sand at the same degree of saturation and an increase in the volumetric water content and suction required to squeeze water. This finding aligns with previous research by Chi et al. [
25]. The observed relationship can be attributed to the Young-Laplace equation, which relates additional pore pressure, the curvature radius of the meniscus, and the surface tension of fluids, as demonstrated in Equation (6) [
50]. An increase in the initial dry unit weight of expansive soil results in a decrease in spacing distance between particles, which, in turn, reduces the curvature radius of the meniscus and increases matric suction.
where:
() represents the matric suction
denotes the average curvature radius of the meniscus
represents the surface tension of fluids.
Consequently, expansive soil exhibits a higher capability of swelling, which leads to greater volumetric deformation values and an elevated risk of damage associated with expansive soils.
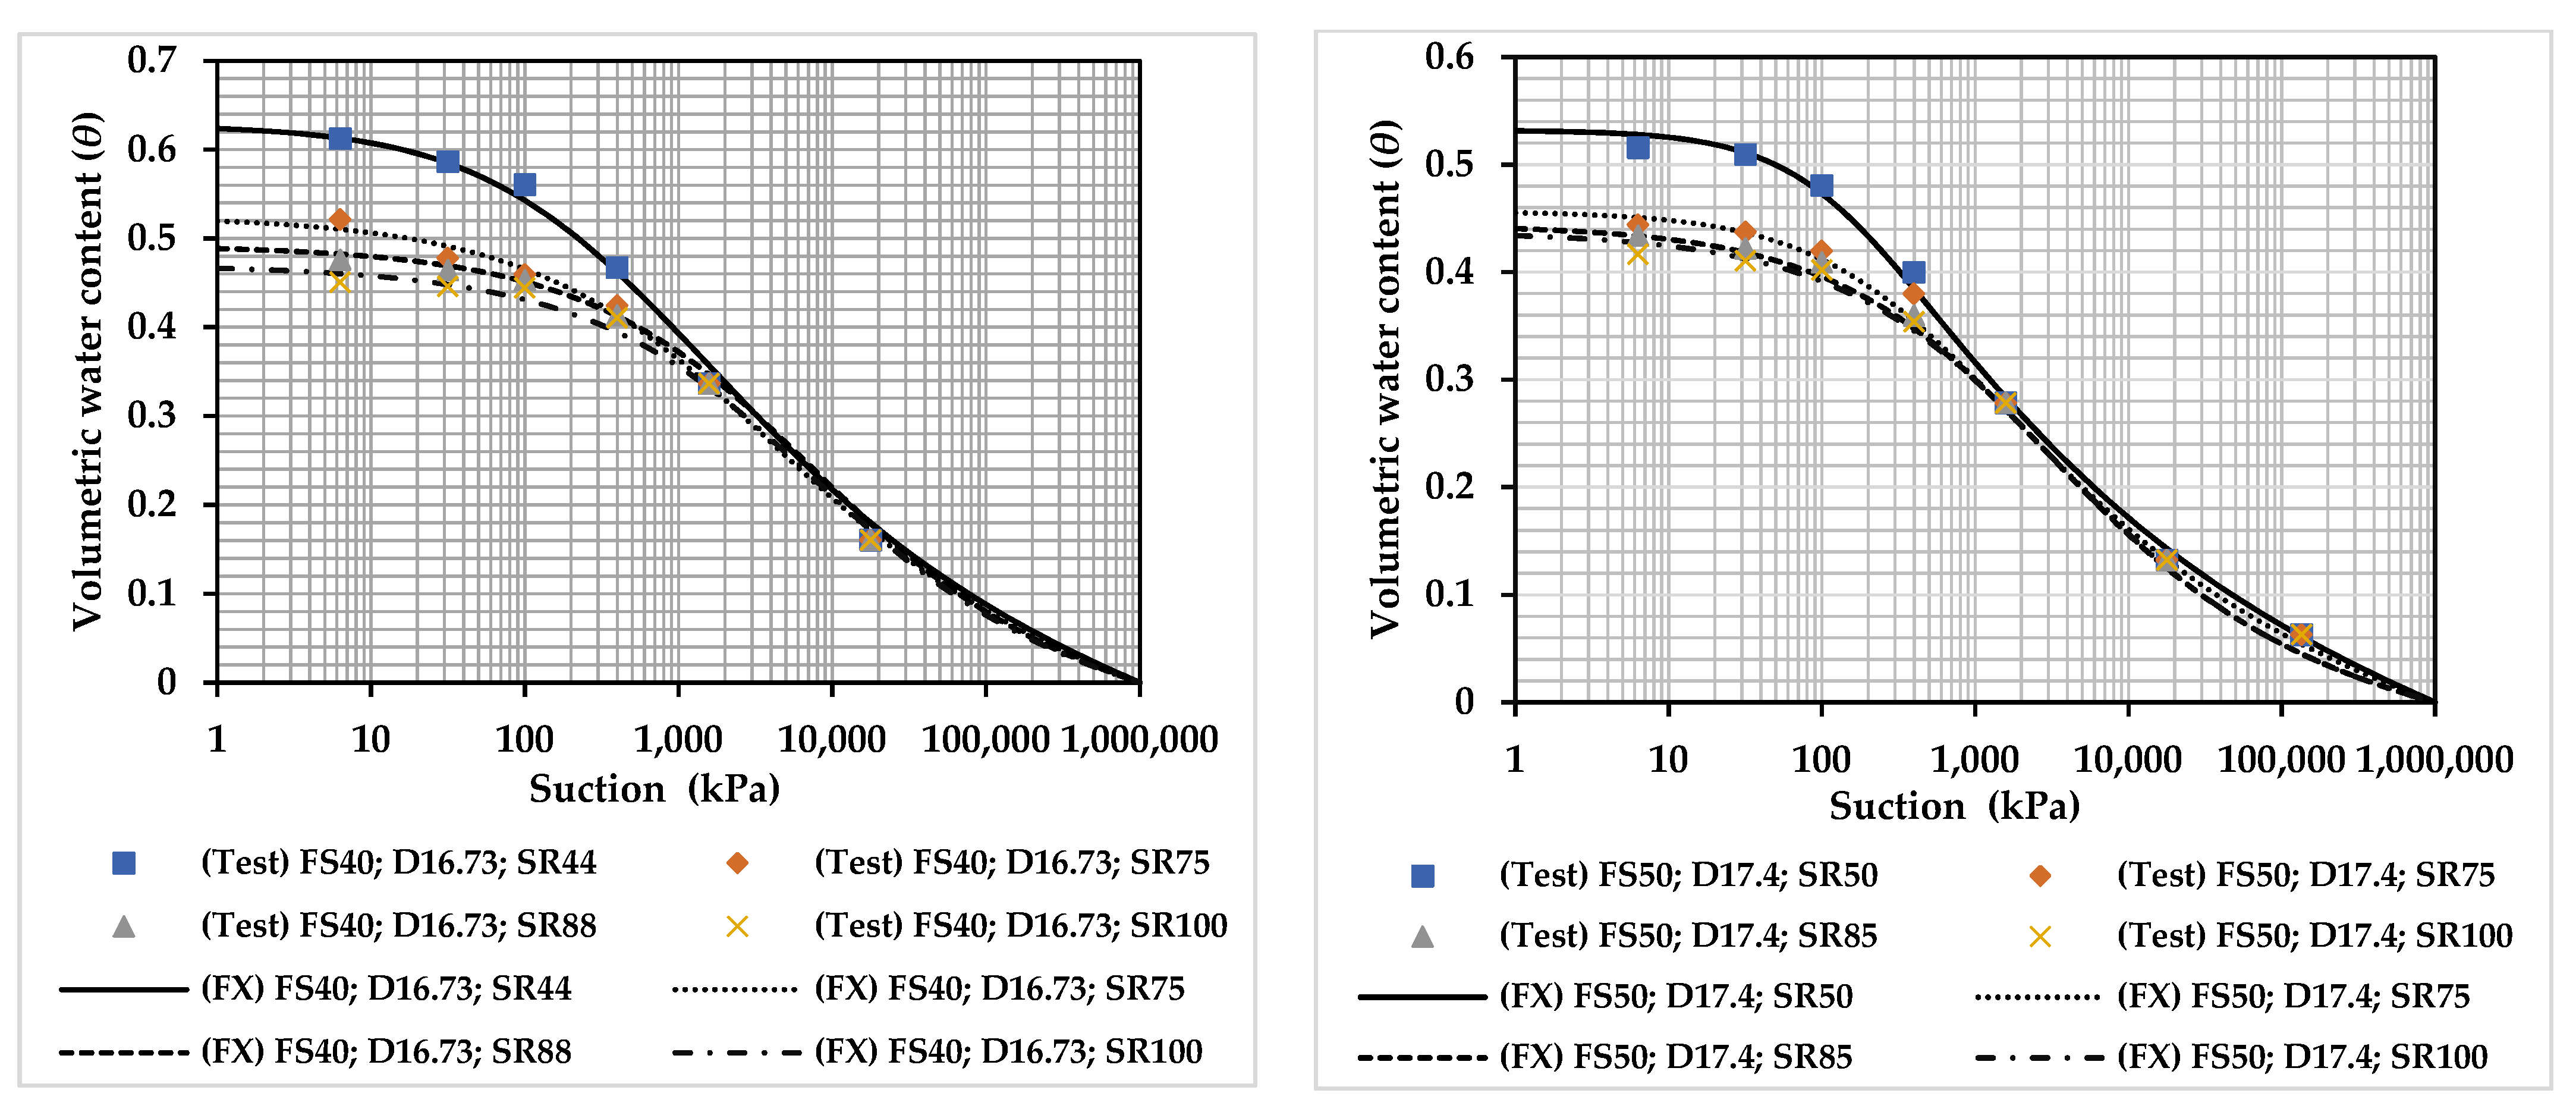
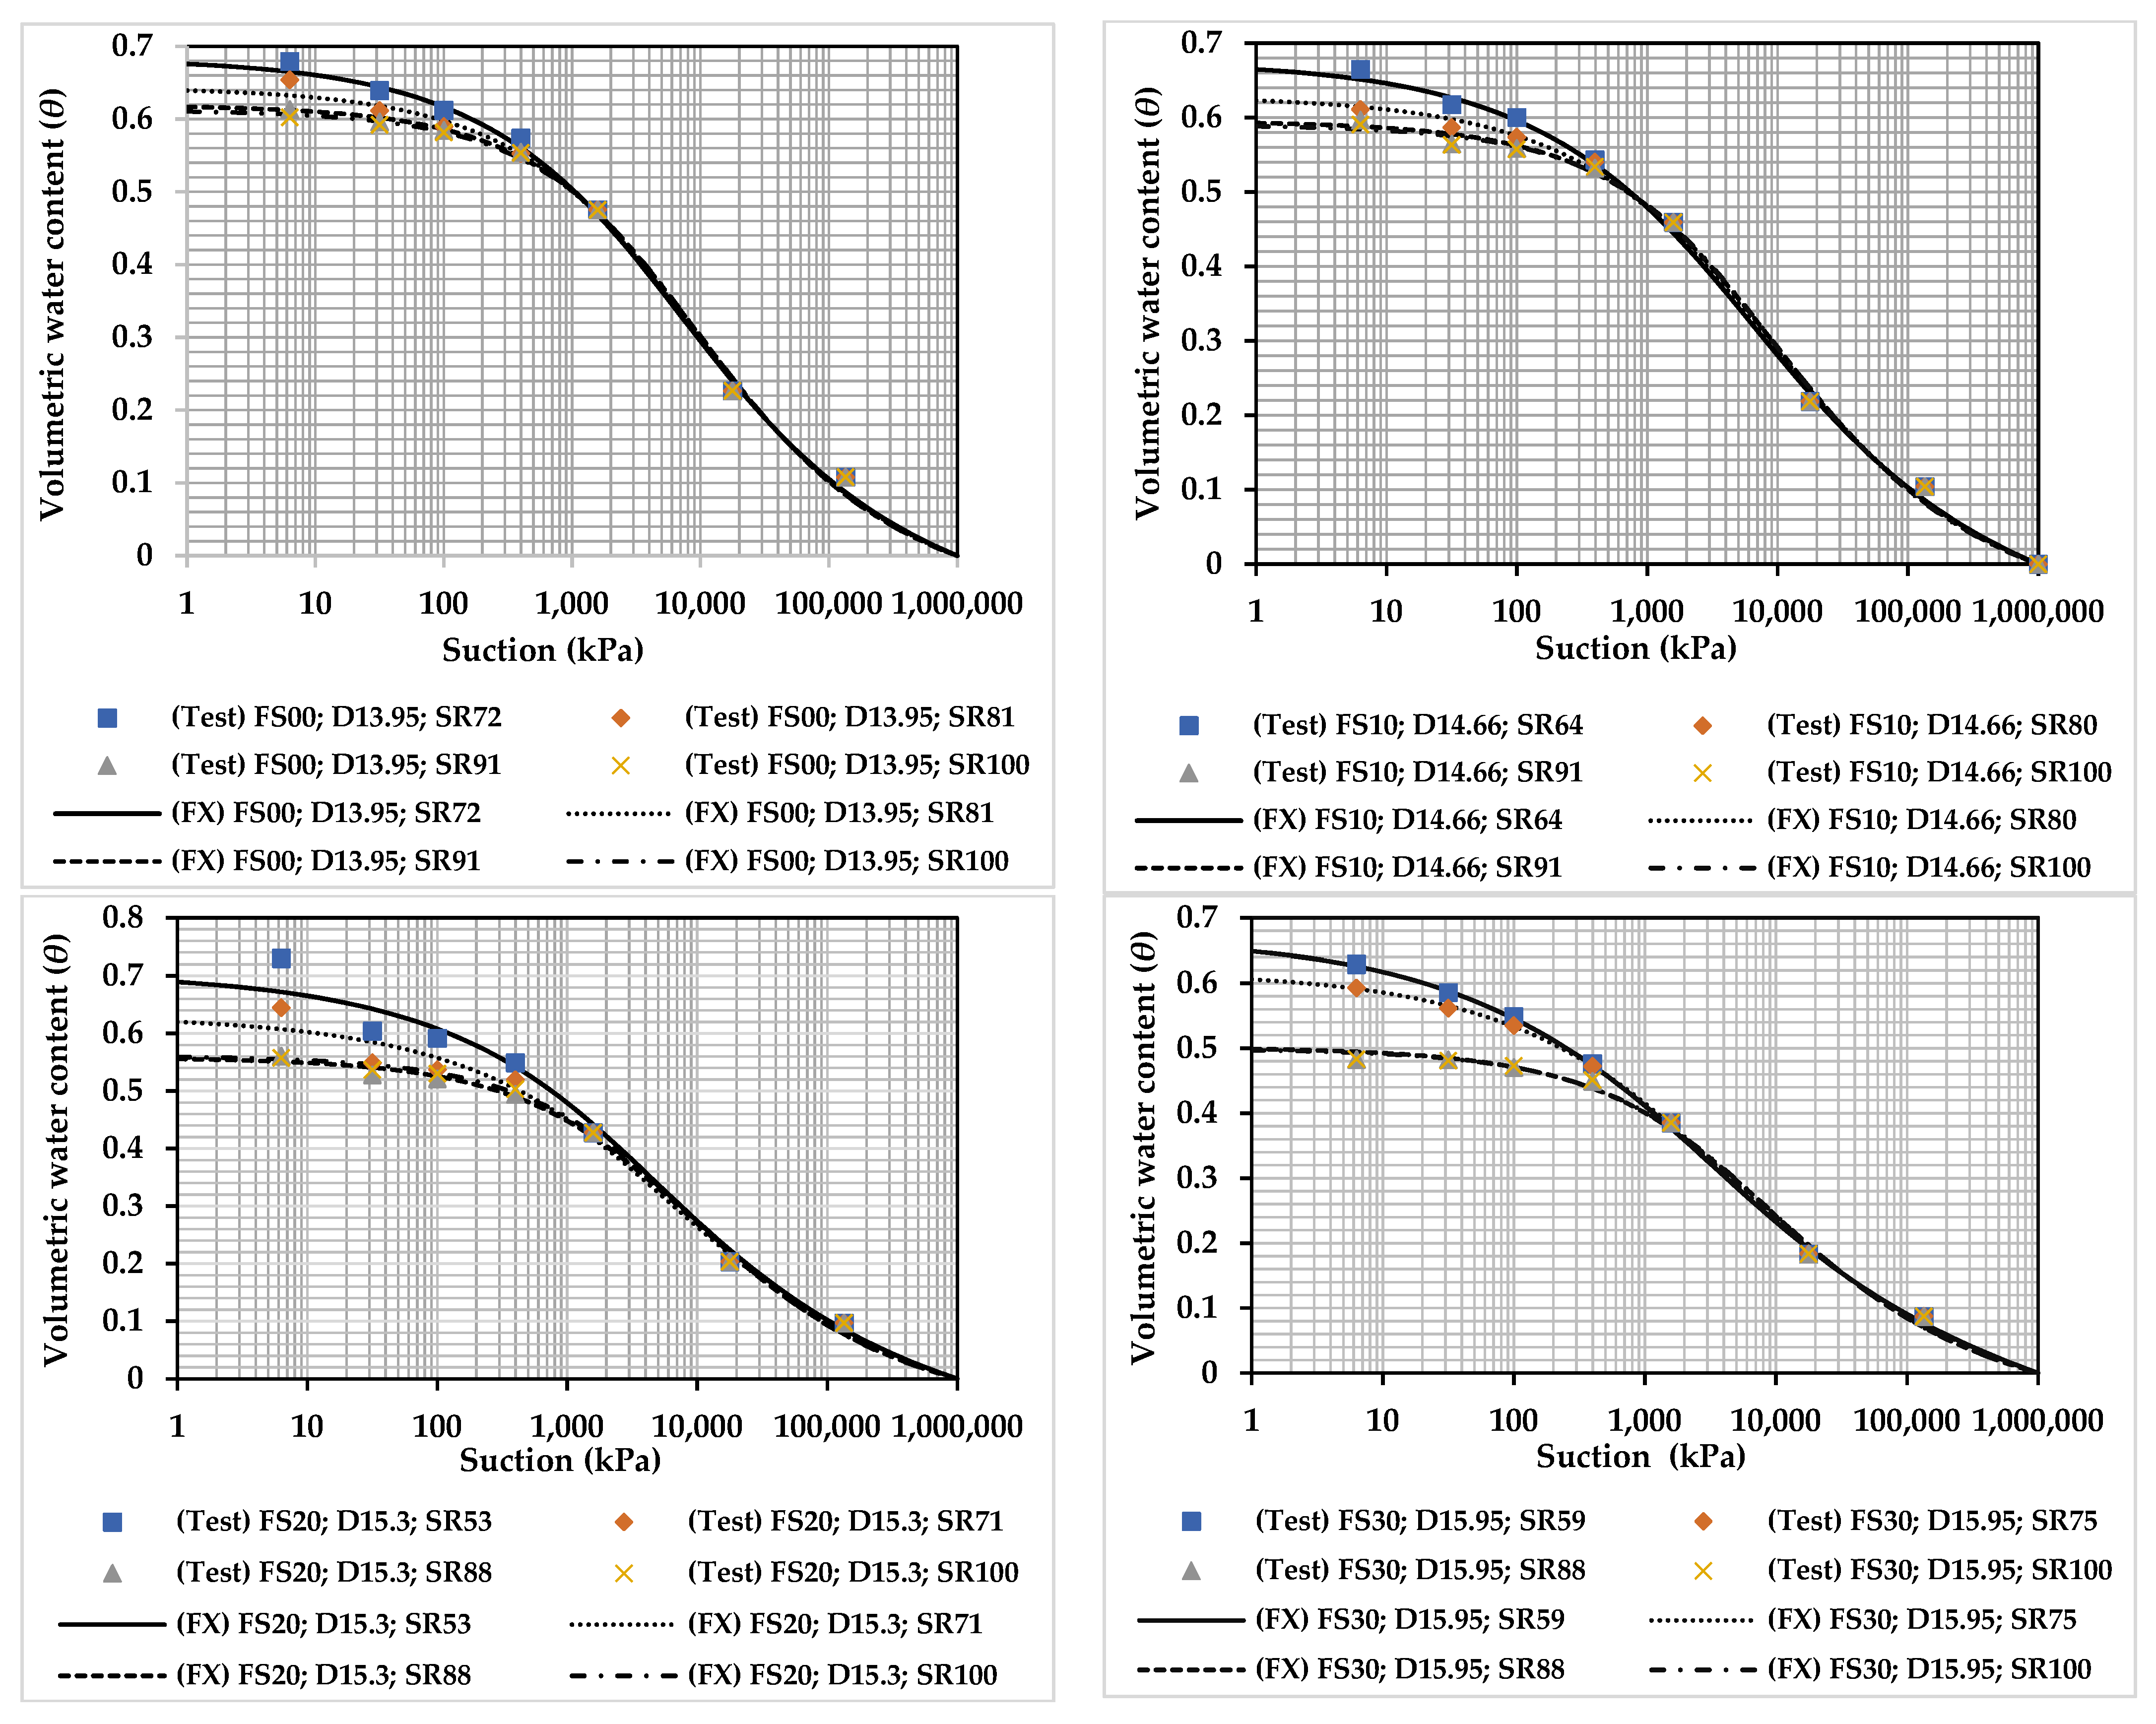
3.3. Effect of Initial Degree of Saturation on SWCC
The effect of the initial degree of saturation was examined for each percentage of added sand, where the maximum dry unit weight from the standard Proctor experiment was kept constant for each percentage of added sand.
Figure 7 displays the SWCC for samples with varying proportions of added sand at a fixed initial dry unit weight and varying degrees of saturation.
Table A3 and
Table A4 within
Appendix A depict the fitting parameters and squared error for the Fredlung Xing and Van Genuchten models for different percentages of added sand at varying initial degrees of saturation. As the initial degree of saturation increases, the expansive soil becomes less capable of swelling, leading to reduced water absorption. Nevertheless, as the initial degree of saturation increases, the soil’s water retention capacity increases due to reduced volumetric changes, as depicted in the α column. Because the volumetric changes diminish with an increasing initial degree of saturation at the same initial dry unit weight, the void ratio decreases following swelling, resulting in an increase in the
n and
m fitting parameters, as demonstrated in the
n and
m columns in the Van Genuchten model. However, this increase is slight, causing the curves to become nearly identical after a certain value of suction stress (around 250 kPa) for each percentage of added sand.
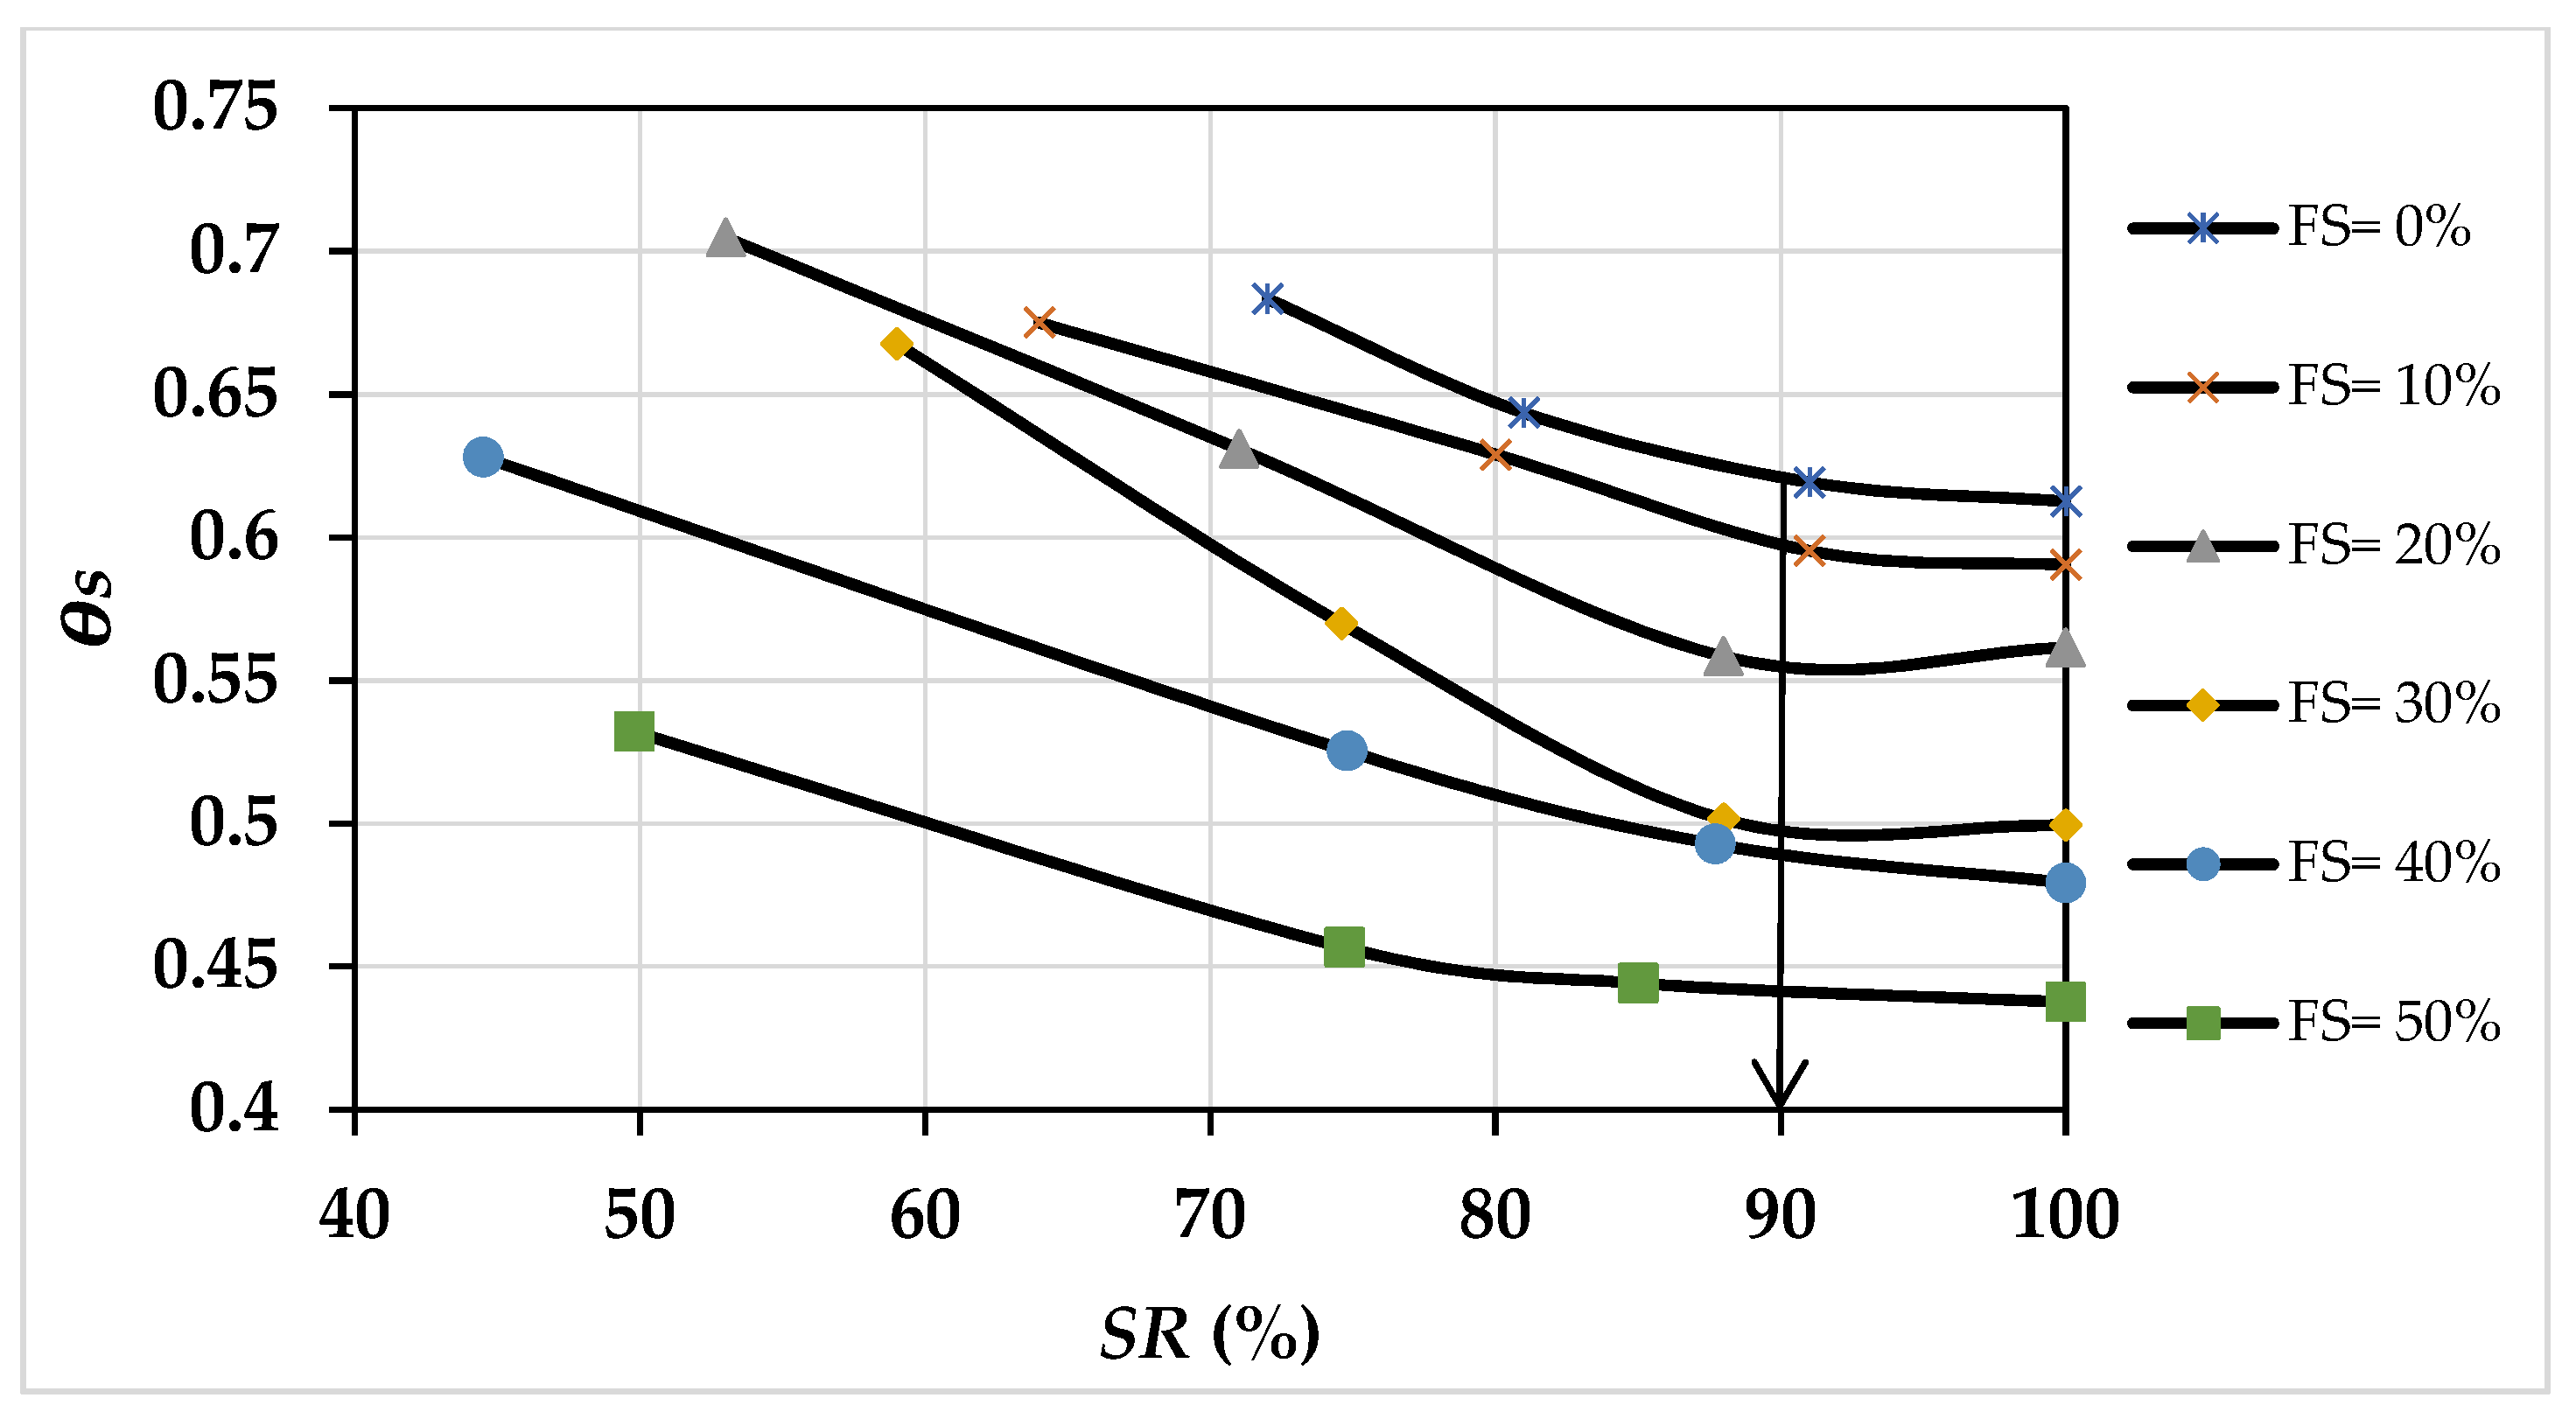
Figure 7 illustrates the impact of the initial degree of saturation on the SWCC for each percentage of added sand, with the maximum dry unit weight kept constant for each percentage of added sand. The results demonstrate that as the initial degree of saturation increases, the volumetric water content decreases, and once a saturation degree of 90% is reached, the volumetric water content becomes nearly constant (as shown in
Figure 8). The characteristic curves become identical beyond this initial saturation point, indicating a reduced water intake by the soil. This behaviour is attributed to the small volumetric changes in the expansive soil and the near fullness of the soil voids with water.
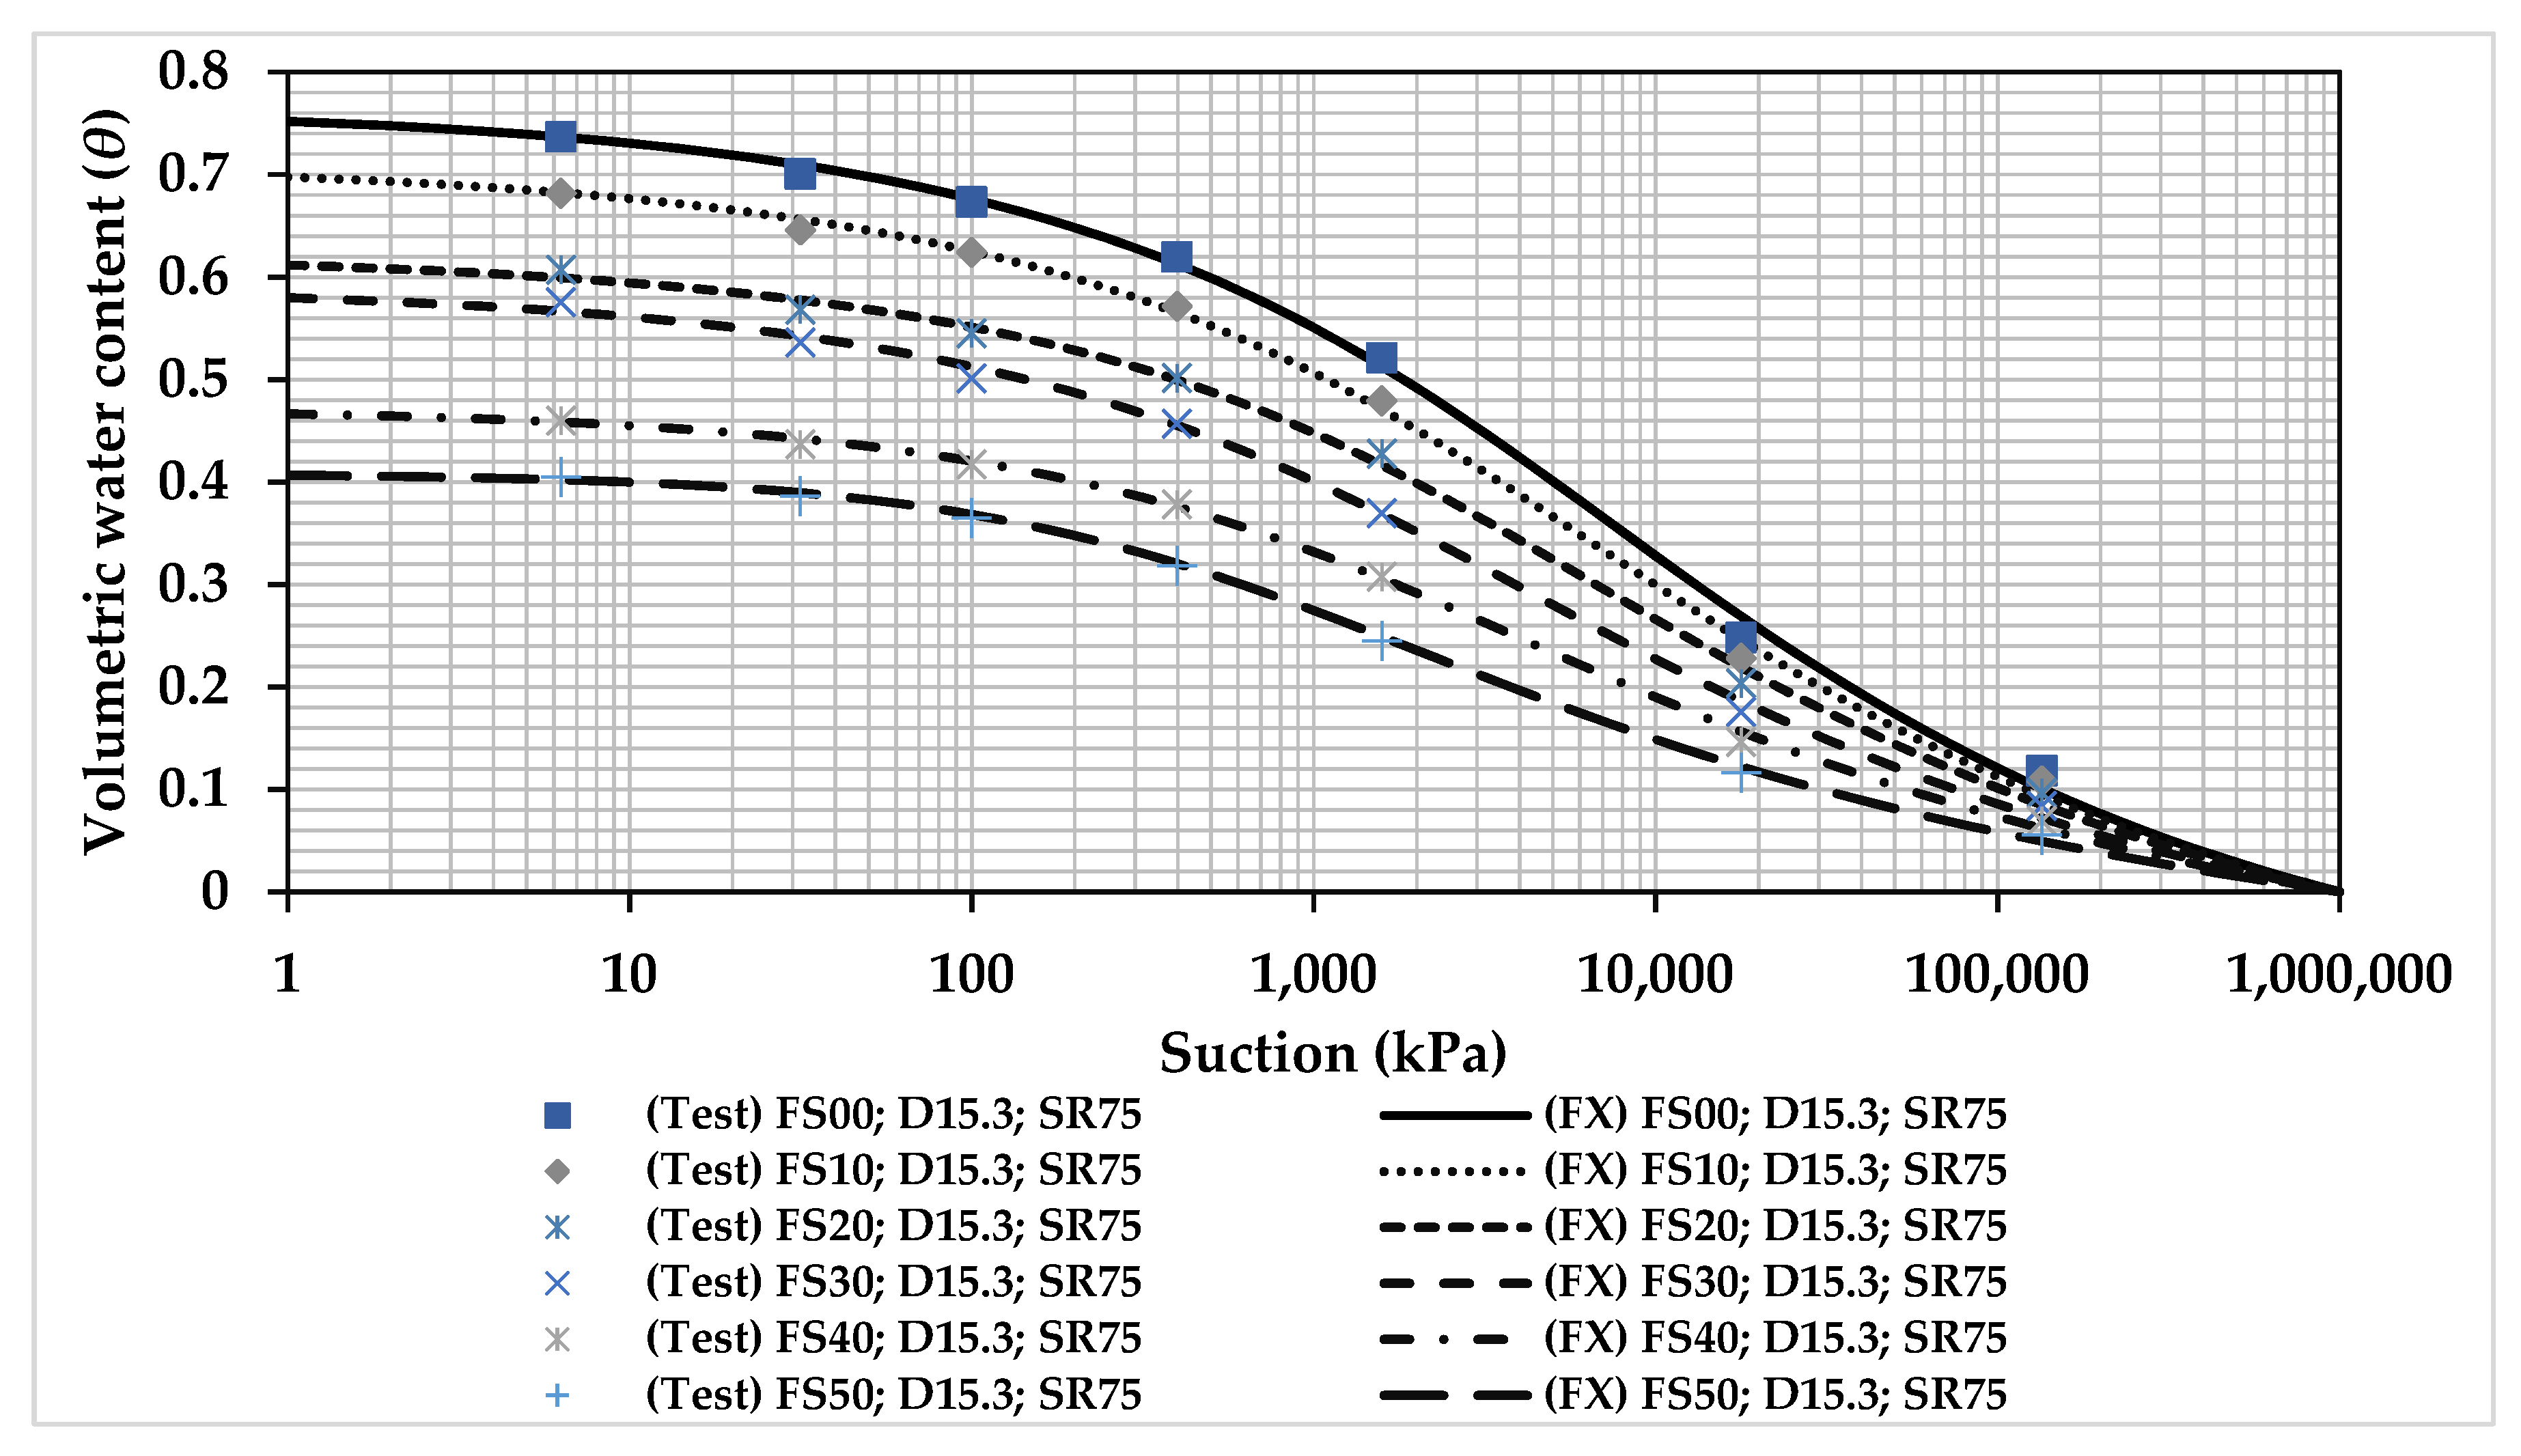
3.4. Effect of Percentage of Added Sand
Figure 9 displays the SWCC for mixture samples with various percentages of added sand at a constant initial dry unit weight and initial degree of saturation of 1.53 g/cm
3 and 75%, respectively.
Table A5 and
Table A6 within
Appendix A present the fitting parameters and squared error for the Fredlung Xing and Van Genuchten models. The results reveal that as the percentage of added sand increases, the volumetric water content and suction values decrease. This trend can be attributed to the increase in soil particle size caused by the addition of sand, as suggested by previous studies [
24,
29,
30]. It is well established that matric suction increases when soil particle size decreases. Moreover, sand replaces clay, which has a high suction capacity, resulting in a lower overall suction capacity for the mixture.
At a constant initial dry unit weight and initial degree of saturation, the impact of the percentage of sand on the fitting parameters m and n is negligible, as presented in
Table A6 of the Van Genuchten model. This can be attributed to the fact that the void ratio remains almost constant for all percentages of added sand under this condition. However, based on
Table A5 of the Fredlung Xing model, an increase in the percentage of added sand with the same initial dry unit weight and initial degree of saturation leads to an increase in the parameter n and a decrease in the parameter
m.
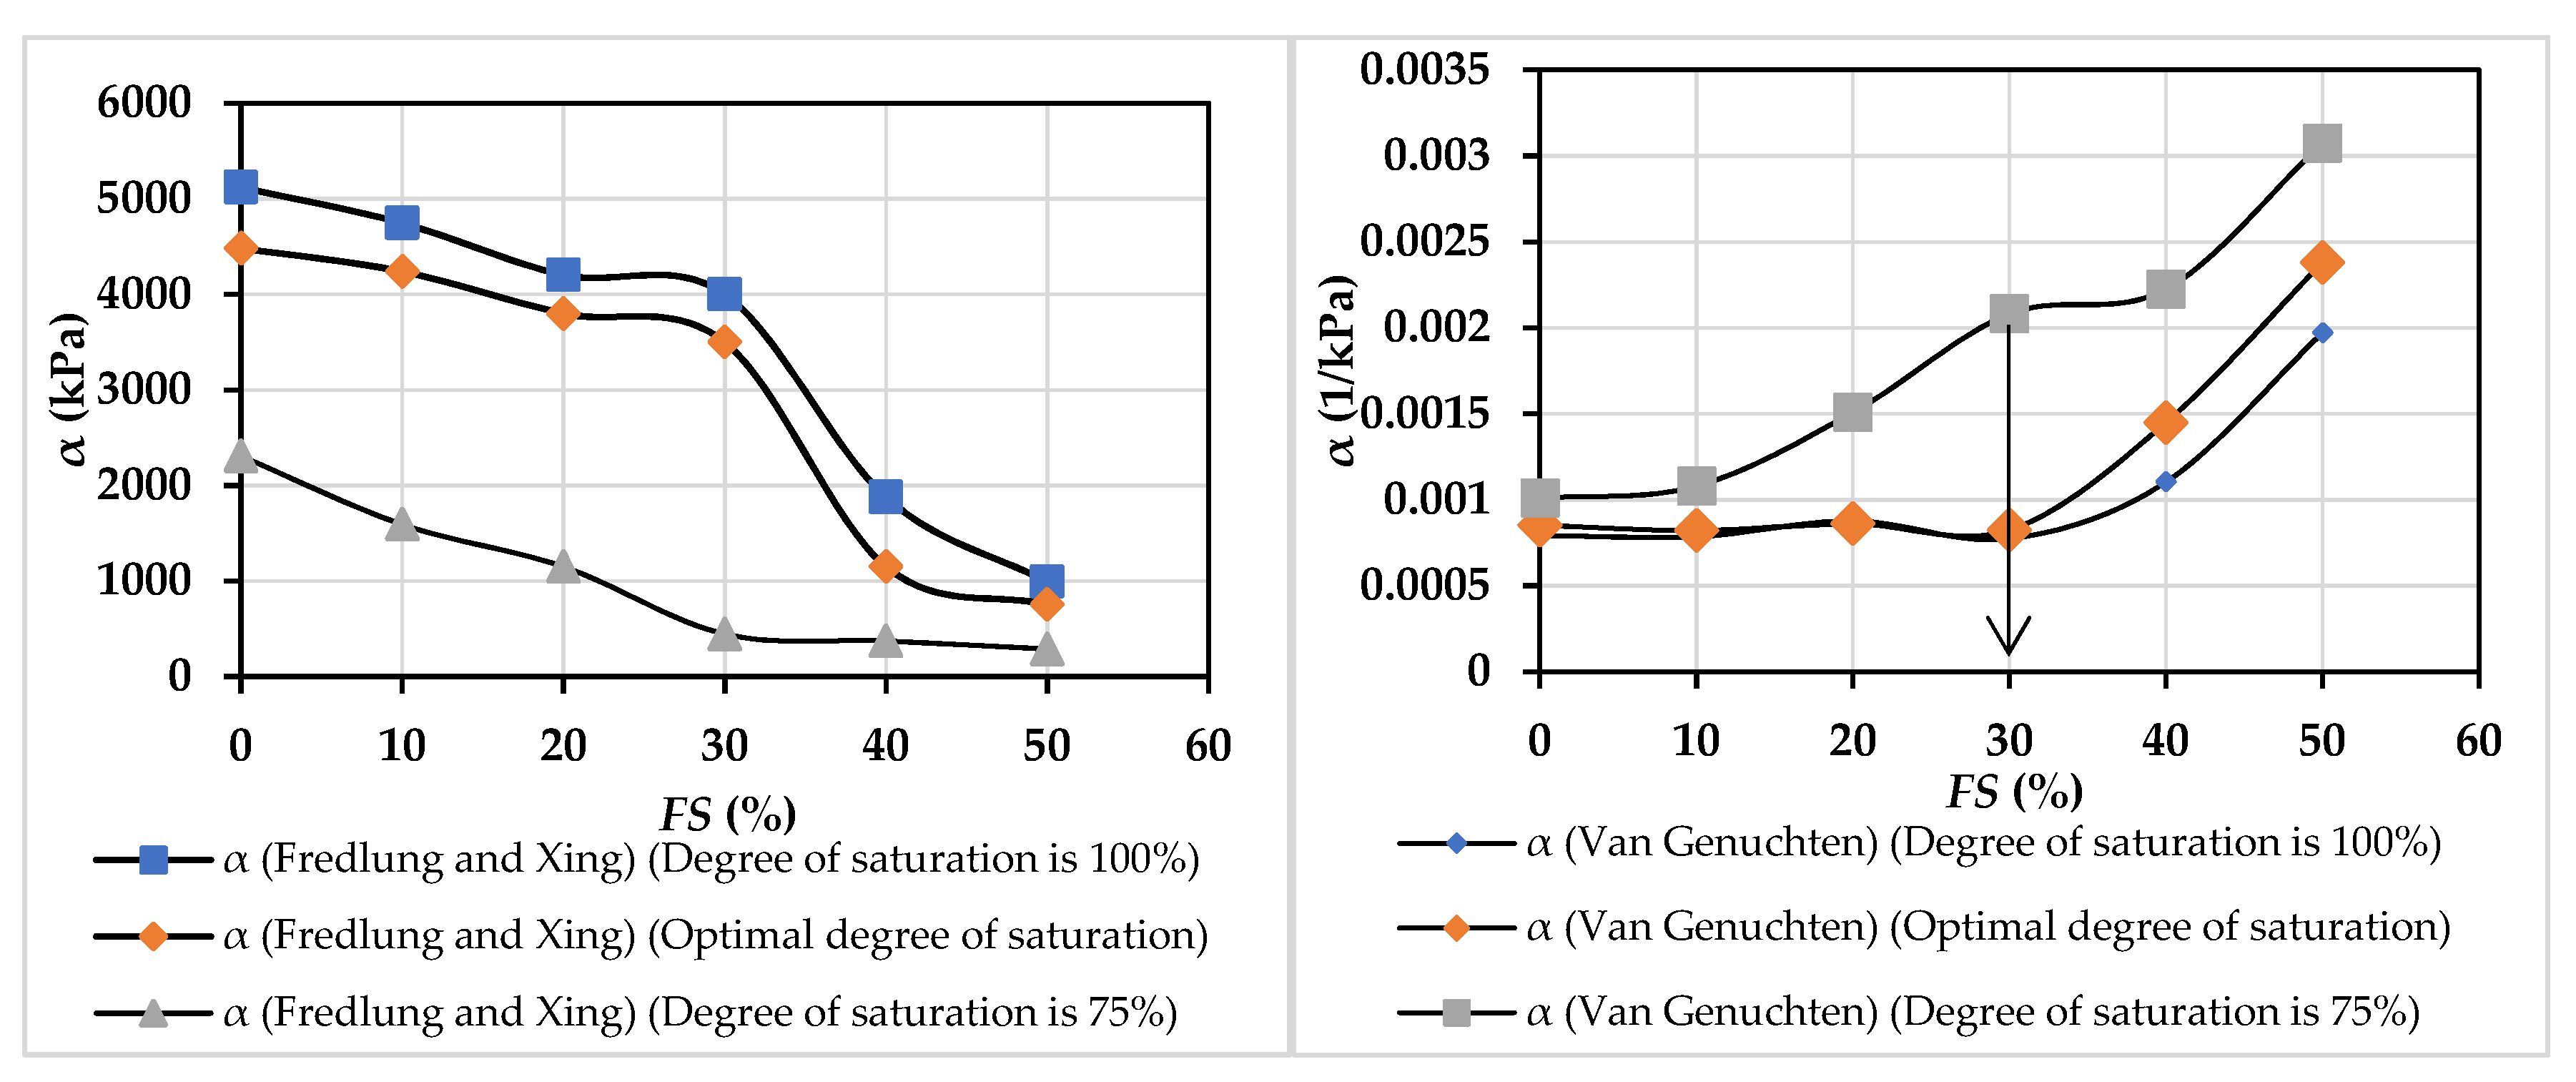
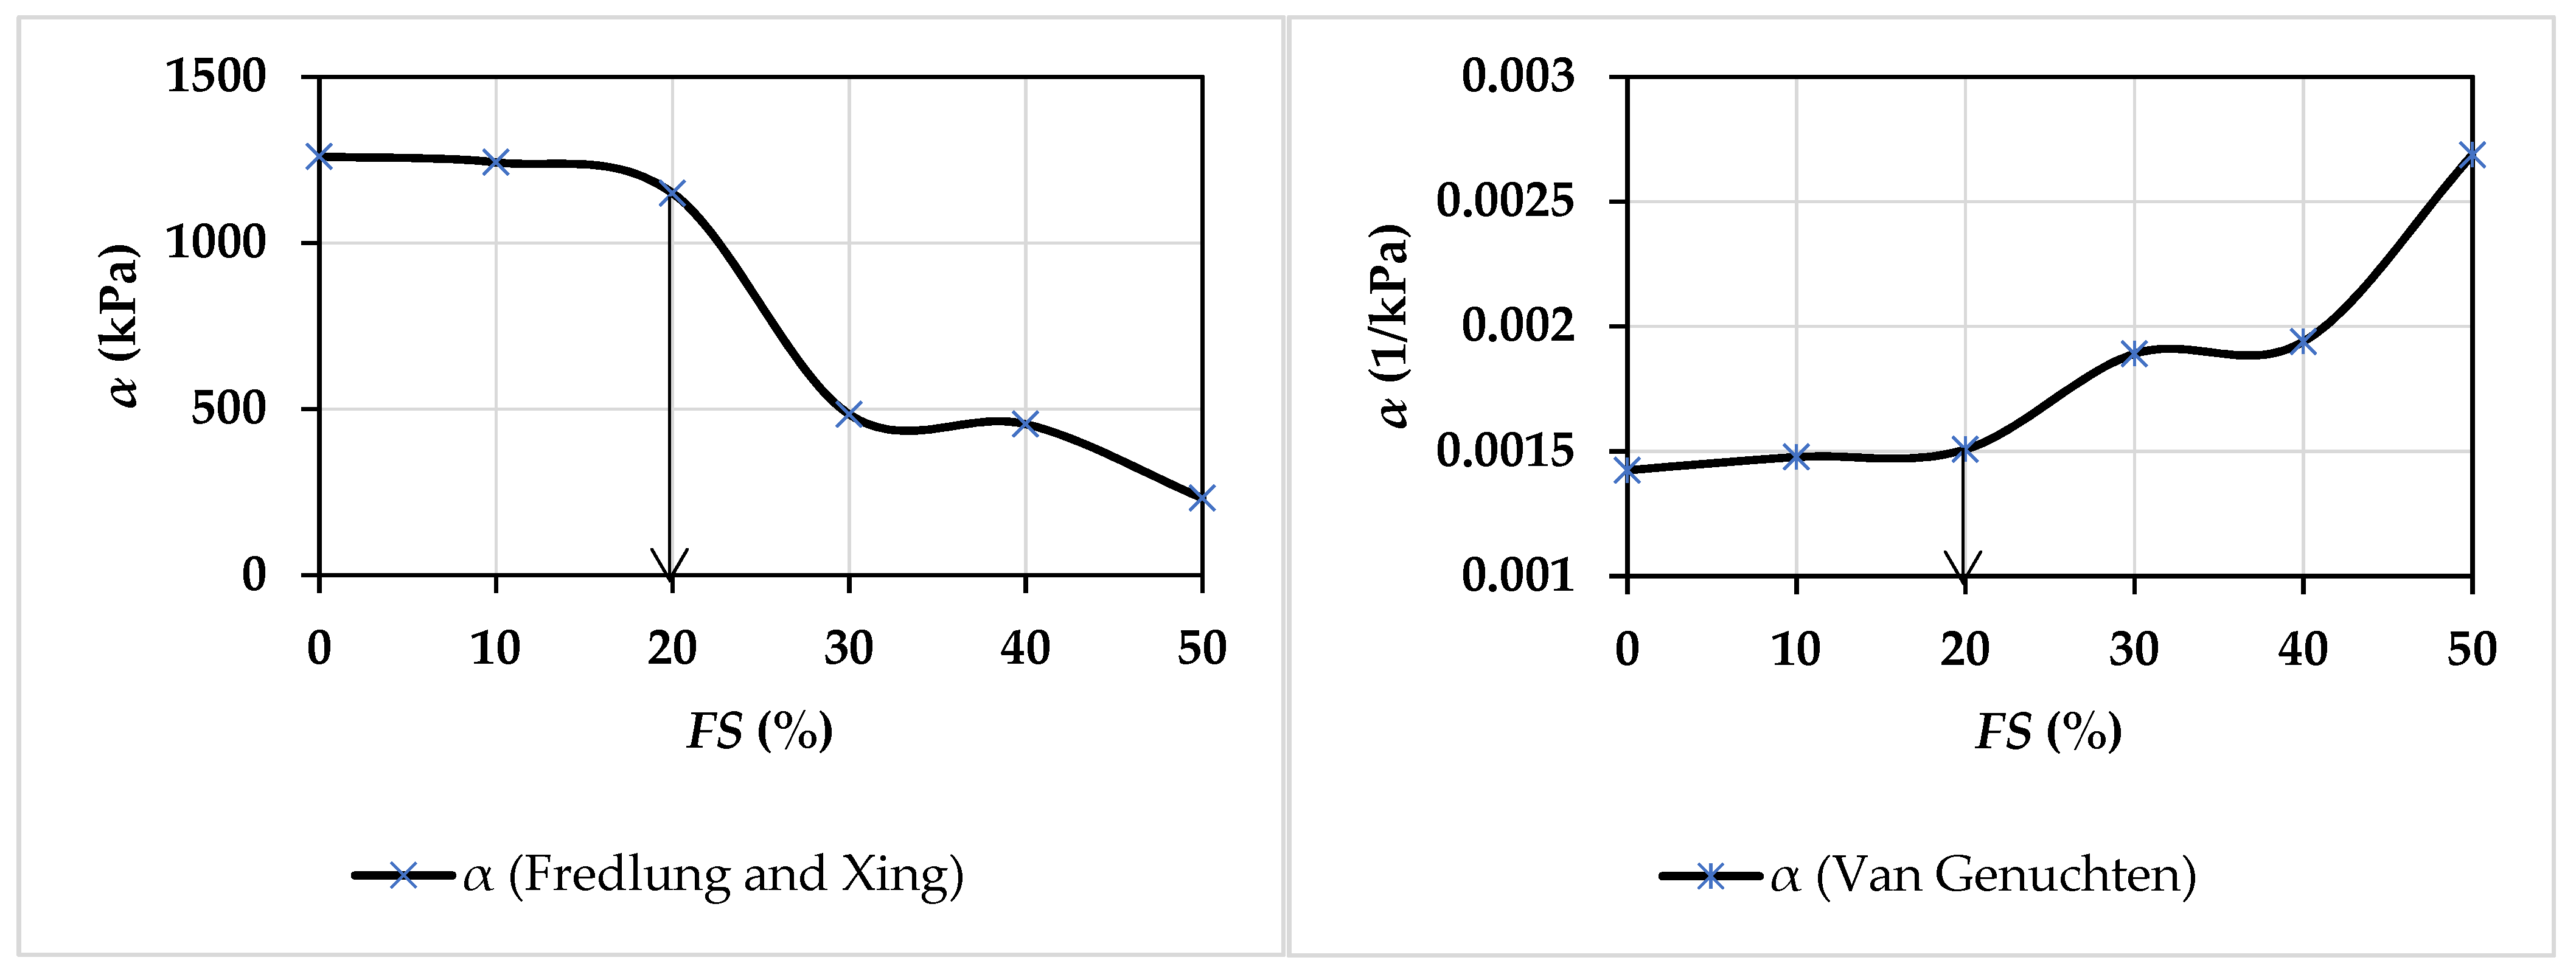
Figure 10 illustrates the correlation between the fitting parameter α and the percentage of added sand while keeping the initial dry unit weight and degree of saturation constant at 15.3 kN/m
3 and 75%, respectively. The results indicate that the water retention capacity decreases significantly after 20% of added sand, which implies that the addition of sand can improve the behaviour of expansive soil by reducing its volumetric change.
3.5. Effect of Maximum Dry Unit Weight of Standard Proctor on SWCC
To investigate the influence of Proctor dry unit weight on the characteristic curve of expansive soil with added sand at both ideal and fixed saturation degrees,
Table A7 and
Table A8 found in
Appendix A were generated to show the fitting parameters and squared error for the Fredlund Xing and Van Genuchten models for various percentages of added sand at the maximum dry unit weight of Proctor experiment for three initial degrees of saturation. The results indicate that as the percentage of added sand increases, the fitting parameters
n and
m decrease for all initial degrees of saturation due to a decrease in the initial void ratio at maximum dry unit weight.
Figure 11 and
Figure 12 depict the SWCCs for samples with varying percentages of added sand at optimum moisture and maximum dry unit weight from Proctor’s experiment, and with a fixed initial degree of saturation of 75% and maximum dry unit weight of Proctor’s experiment, respectively. The figures reveal a decrease in volumetric water content and suction values with increasing sand content due to the particle size effect, as previously reported. Comparison between the SWCCs computed at a constant dry unit weight (
Figure 9) and those computed at maximum dry unit weight (
Figure 11 and
Figure 12) shows that the width of the SWCCs package for the latter is smaller than that for the former, suggesting a decrease in spacing between the SWCCs due to the increase in dry unit weight as sand content increases, resulting in a decrease in meniscus curvature radius and an increase in suction.
In
Figure 13, it is demonstrated that the fitting parameter
α of Fredlung and Xing model decreases with decreasing initial degree of saturation and an increasing percentage of added sand. Moreover, it should be noted that the fitting parameter
α for the Fredlung Xing model decreases (increases for the Van Genuchten model) significantly after adding 30% of sand for the high initial degree of saturation, whereas for the low initial degree of saturation, α remains nearly constant after adding 30% of sand. Hence, it is recommended that the percentage of sand added to an expansive clay sample should be no less than 30% to achieve a low water retention capacity of expansive soils.
3.6. Interpreting the Influence of Initial Conditions on Expansive Soil’s SWCC
The study of expansive soil’s soil-water characteristic curve (SWCC) delves into the complex interactions between sand content, initial density, and initial degree of saturation, revealing subtle effects on different SWCC regions. The introduction of sand emerges as a critical factor, causing granular changes as shown in
Figure 1, which significantly affects SWCC regions [
28,
29,
30]. A gradual increase in sand content from 10% to 50% causes a significant reduction in water retention capacity, which is attributed to shifts in capillary forces, changes in pore structure, and changes in grain distribution. Simultaneously, varying initial density at a constant level of saturation produces noticeable results. Elevating initial density, particularly with a specific percentage of sand, significantly increases volumetric water content during saturation, which is especially noticeable in the boundary region, emphasizing the complex relationship between sand content, initial density, and moisture retention.
The dynamics of the soil-water characteristic curve (SWCC) are complex, and they are heavily influenced by the initial saturation level [
20]. A decrease in initial saturation leads to an increase in volumetric water content during saturation. The initial degree of saturation has a significant impact in the boundary region, illuminating the complex interactions that govern expansive soil behaviour. The volumetric water content and suction of mixtures with varying sand percentages differ significantly. As sand content increases, both volumetric water content and suction values decrease, affecting all SWCC regions due to grain distribution shifts (
Figure 1). When the initial density varies by the same sand percentage, the boundary region has the greatest influence. This highlights the critical importance of these parameters in accurately representing expansive soil responses within the SWCC context. Their interdependence is critical in expansive soil volume changes, influencing SWCCs and improving our understanding of expansive soil behaviour.
These findings highlight the critical importance of taking granular changes into account and using informed model selection to make accurate predictions of water retention in expansive soils. A thorough understanding of these complex dynamics is required for furthering expansive soil mechanics and making informed decisions in geotechnical engineering.
4. Conclusions
This research provides a novel contribution by examining the influences of sand content, initial degree of saturation, and dry unit weight on SWCC in expansive soils. This addresses a gap in existing studies, offering significant insights into the impact of these factors on SWCC in expansive soil. In the comparison of models, the Fredlund Xing model is a better fit than the Van Genuchten model. However, the Van Genuchten model performs well and becomes convergent to Fredlund Xing at sand percentages above 30% and initial saturation degrees above 85%. Examining the behaviour of volumetric water content and suction reveals that both increase with the initial dry unit weight of at all percentages of added sand at consistent degrees of saturation. Conversely, volumetric water content decreases with rising initial degrees of saturation, reaching identical characteristic curves after an initial saturation degree of 90%. Additionally, mixtures with varying percentages of added sand at the same initial dry unit weight and saturation degree experience a decrease in both volumetric water content and suction values as the percentage of added sand rises. After 20% of added sand, water retention capacity notably decreases, benefiting expansive soil by reducing volumetric change. Furthermore, the study uncovers that for a high initial degree of saturation, the value of α shows a slight change with an increase in the percentage of added sand up to 30%, beyond which a significant change occurs. Conversely, for a low initial degree of saturation, the opposite trend is observed. To achieve low water retention capacity of expansive soils, it is recommended that the percentage of sand added to the expansive clay should not be less than 30%.
Comprehending the Soil-Water Characteristic Curve (SWCC) in expansive soils, specifically in terms of sand content, initial degree of saturation, and initial dry unit weight, is important for geotechnical engineering and foundation design. In expansive soils, where volumetric changes caused by moisture variations can present significant challenges, a detailed SWCC analysis provides specific practical outcomes. Engineers can use this knowledge to create foundations that account for expansive soil behaviour, adjusting parameters such as sand content to reduce volume changes and the risk of foundation distress. The SWCC data guide construction practices in areas with expansive soils, directing the implementation of preventive measures to address swelling and shrinkage, ultimately improving the long-term stability and performance of structures in expansive soil regions.


