Abstract
Landslides not only cause great economic and human life losses but also seriously affect the safe operation of infrastructure such as highways. Rainfall is an important condition for inducing landslides, especially when a fault and weak interlayer exist on the slope, which can easily transform into a landslide and cause instability under the action of rainfall. To explore the effects of a soft interlayer, a fault, and extreme rainfall on slope stability, this paper takes the landslide on the right side of the G104 Jinglan Line in Shengzhou City, Shaoxing City, Zhejiang Province, China, as an example. The cause, failure mechanism, and characteristics of the landslide are analyzed through field investigation and borehole exploration in the landslide area. The slope is simulated by numerical analysis, and the stability of the landslide under natural conditions and extreme rainstorm conditions is calculated using the strength reduction method. The stability of the slope before and after treatment is compared, and the effectiveness of the treatment measures is verified by combining the field monitoring data. At the same time, the complex geological structure and rainfall are considered to have been the main factors leading to the G104 landslide. Near the fault, the weak interlayer of the landslide was easily disturbed, the deformation trend of the deep displacement was consistent with rainfall, and the axial force of the anti-slide piles at the weak interlayer was correspondingly large. For a wedge rock slope, “excavation unloading” and “prestressed anchor + prestressed anchor cable + anti-slide pile” are effective treatments. This paper reveals the effects of a weak interlayer, a fault, and strong rainfall on a rocky high slope, providing predictions of instability modes and time evolution patterns for similar complex geological slopes under rainfall infiltration conditions and providing references for their treatment measures.
1. Introduction
Landslides are a natural phenomenon in which the rock and soil bodies on a slope are affected by natural geological effects and human activities, and under the effect of gravity, they slide down the slope as a whole or dispersedly along a certain weak surface or weak zone. Among numerous geological disasters, rock landslides are widely distributed and occur frequently, causing significant losses to the national economy and people’s lives and property [1]. Plenty of conditions cause rock landslides, including internal factors such as geological structure and geological lithology and external factors such as precipitation. Under the influence of different geological processes, slopes will form a large number of complicated and different shapes of various discontinuities, such as faults, weak interlayers, and so on [2]. The existence of these discontinuous surfaces disrupts the continuity as well as the integrity of rock layers and affects the mechanical properties of rock masses, which in turn promotes the formation of landslides [3,4,5]. The lithology of a rock mass usually determines its resistance to weathering, physical and mechanical properties, and hydrological properties, which in turn affects the stability of the slope. For example, tuff is poorly resistant to weathering and the strength of the rock decreases with increasing exposure time, leading to reduced slope stability [6]. In addition, rainfall is one of the main factors inducing landslides [7,8]. According to the journal Landslides, 57 percent of landslides in the 2004–2009 literature were triggered by rainfall [9]. Due to the weakening effect caused by water, the strength of rocks is greatly decreased when saturated, and a host of slope instabilities occur during the rainy season [10,11]. Tuff, as an expansive soft rock, has high strength when it is not exposed to water, but when it is exposed to water, its disintegration resistance decreases, its expansion is significant, and its strength is greatly reduced. Therefore, it is particularly important to study the formation mechanisms and causes of tuff landslides with discontinuous surfaces under rainfall infiltration conditions and to evaluate the stability of slopes.
The existing research on the cause and failure mechanisms of landslides is mainly carried out through field investigation and field monitoring, model tests, and numerical analysis. In terms of field investigation and monitoring, Li et al. [12] analyzed the effects of excavation and rainfall on the damage mechanisms and formation process of soft rocky slopes by combining field investigation with surface displacement and deep displacement monitoring, and they found that slope deformation is divided into two phases, namely the slow creep period induced by excavation and the accelerated sliding period triggered by rainfall, and that sustained rainfall is the key factor triggering deep sliding. Yan et al. [13] analyzed the influence of highly weathered tuff on the formation mechanisms of landslides through drilling tests and monitoring of surface displacement and deep displacement, and they found that gradually weathered rock greatly reduces the stability of a slope. Based on UAV digital photogrammetry and GB-SAR monitoring, Liu et al. [14] analyzed the effects of rainfall, geological properties, and materials on the formation mechanism of rainfall-type landslides, and they found that the stepped topography determines its failure mode to be multiple sliding, and loose soil materials and highly weathered sandstone interlayers of mudstone lay the foundation for rainwater and groundwater seepage. Although some studies have revealed the influence of rainfall infiltration on slopes, monitoring and analysis of complex rock slopes with weak interlayers and faults under rainfall infiltration are relatively lacking.
In terms of model test research, Lo et al. [15] considered the influence of rainfall infiltration on the deformation and failure of wedge slopes through small-scale physical modeling tests and found that the half-wedge angle is a crucial factor of slope deformation and failure, and surface water infiltration has a significant impact on rock deformation and failure rate. Nian et al. [16] investigated the hydrological response as well as the damage mechanism of tilt-resistant strongly weathered fissured rocky slopes under rainfall conditions by physical modeling tests, and they found that rainwater penetrates into the joints along with the cracks, and the slope damage starts from the toe and gradually progresses to the middle and upper parts. Yang et al. [17] used a three-layer slope model to simulate rocky slopes with weak interlayers and investigated the dynamic response and stability of the slope under strong rainfall. They found that changes in pore water pressure and rainfall erosion are the two main dynamic factors leading to the gradual decrease in the shear capacity of the weak interlayer and that their angle of internal friction is a key parameter affecting the stability of the slope. Although there have been many experimental studies on the influence of rainfall infiltration on rock slopes, there is a lack of experimental studies on wedge slopes consisting of weak interlayers and faults under rainfall infiltration conditions.
From the aspect of numerical analysis, the existing research methods mainly include the finite element method (FEM), finite difference method (FDM), discrete element method (DEM), and discontinuous deformation analysis method (DDA). In recent years, many scholars have simulated and analyzed slopes by numerical simulation. Using FLAC3D software, Gao et al. [18] established a model to analyze the influence of frame anchor cable and vertical load on the stability of weak sandwich rock slopes. It was found that the frame anchor cable support has a significant supporting effect on the slope, and the vertical load on the slope has a significant influence on the safety factor of the slope. Li Y et al. [19] analyzed the influence of the fault and weak layer on slope stability through COMSOL and FESRM simulation calculations and found that the influence of the weak layer on slope stability is greater than that of the internal fault. Du et al. [20] established a series of numerical models for landslide stabilization of pile-cable-frame beams by using the three-dimensional finite element method and studied slope stability, pile internal force, and anchor cable axial force using the strength reduction method. It was found that the combination of pile-cable-frame beams is a more effective support structure for improving slope stability than cable-frame beams. Although the effects of various supports on slope stability have been simulated, there is a lack of research on the treatment measures of complex wedge rock landslides composed of weak interlayers and faults.
In this paper, a stability study of the landslide on the right side of the G104 Jinglan Line was carried out. The overall workflow is shown in Figure 1. Firstly, the geological information of the slope and the mechanical properties of the rock body were determined through on-site investigation and borehole tests, and the causes of the landslide were analyzed. On this basis, the management scheme of “excavation unloading” and “prestressed anchor + prestressed anchor cable + anti-slide pile” was determined. Then, the effect of rainfall on complex geologic rocky slopes was studied by monitoring the deep displacement, rainfall, axial force of anti-slip piles, and pre-stressing of pre-stressing anchor cables. Finally, considering the influence of rainfall infiltration on the slope, the finite difference software FLAC3D was used to simulate the G104 landslide. The safety coefficients of the slope under natural and extreme rainstorm conditions were calculated based on the intensity discount method, and the stability of the slope before and after the treatment was compared, which was combined with the monitoring data to verify the effectiveness of the landslide management measures. The results of the study can provide a reference for the prediction of the instability mode and deformation evolution pattern of rocky slopes with similar complex geological conditions under extreme rainfall conditions, as well as management schemes of rocky high slope projects under complex geological conditions.
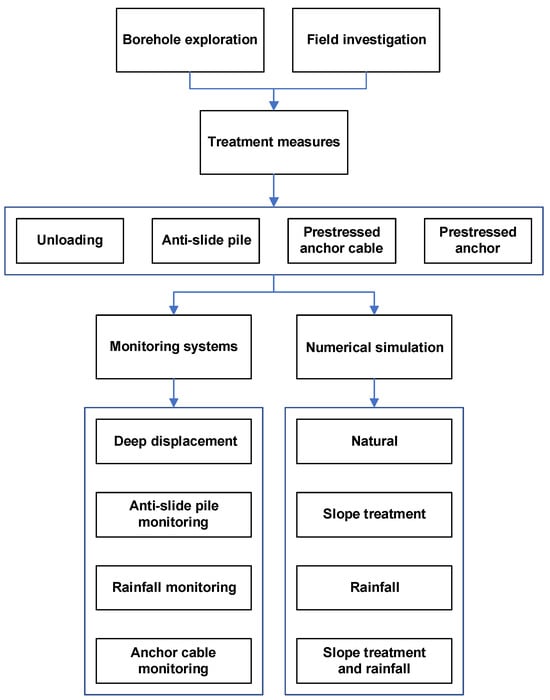
Figure 1.
The overall workflow.
2. Study Area
2.1. Location of Study Site
The landslide on the right side of G104 Jinglan Line is located on the north side of Sanjutan Village, Pukou Street, Shengzhou City, Shaoxing City, Zhejiang Province (29°39′43″ N, 120°49′19″ E), with the station number range K1610 + 850~K1611 + 100 (Figure 2). The natural terrain of the landslide features a slope angle ranging from 25 to 30°, and the section with an elevation of 70 to 90 m resembles a gentle platform, with a terrain slope angle of 8 to 10°. Factory buildings and villages are more common at the foot of the slope around the mountain. The rock body of the slope is significantly influenced by tectonic structures, with developed joint fissures and small fracture structures.
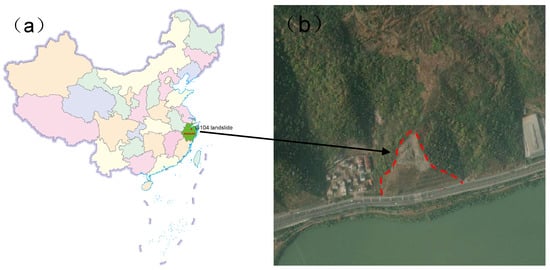
Figure 2.
Study area and landslide: (a) location of the study area; (b) photo of the slope.
The study area has a subtropical monsoon climate, characterized by warm and humid conditions and four distinct seasons. The multi-year average temperature is 16.4 °C, with an extreme minimum of −10.1 °C and an extreme maximum of 40 °C. The multi-year average relative humidity is 82% and the average rainfall is 1304.8 mm. However, the distribution is uneven, being mainly concentrated in spring rains and plum rains in August and from March to June. The typhoon season occurs in September, and annual evaporation ranges from 800 to 1000 mm. Precipitation appears to be the main trigger of landslides, with continuous rainfall and rain and snow weather having a significant impact on slope stability.
Groundwater in this region is controlled by atmospheric precipitation and can be divided into loose rock pore water and weathered bedrock fracture water. Loose rock pore water is found in the Quaternary residual slope accumulation sub-clay, which is thinly distributed due to terrain constraints, with limited water permeability. It has the characteristics of local recharge and drainage, mainly influenced by seasonal rainfall. Weathered bedrock fracture water is present in the weathered fractures of the tuff, using the well-developed weathering fractures and small fissures of the tuff as an effective storage and migration channel for groundwater. A field investigation revealed minor groundwater seepage in the central and lower parts of the retaining wall at pile K1610 + 967. As the top of the retaining wall was partially exposed to the landslide shear outlet, it is hypothesized that groundwater seeped along the sliding surface to the retaining wall (Figure 3).
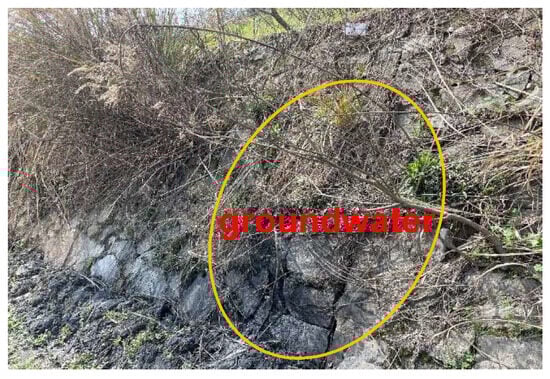
Figure 3.
A small amount of groundwater seeps from the retaining wall.
2.2. Engineering Geological Properties
A total of 12 boreholes were drilled to obtain the slope profile (Figure 4). Six boreholes were positioned within the sliding area of the landslide, with three each along the Level Two and Level Four platforms. In addition, six boreholes were positioned in the non-sliding area, one at the back edge of the slope, one on the top terrace of the slope, and four on the platform of the un-sliding area. A typical section is shown in Figure 5. According to the investigation data, the lithology of the slope is predominantly Quaternary residual slope deposits with gravelly sub-clay and Jurassic tuff, occasionally interbedded with sedimentary rocks. The surface of the Jurassic tuff is light and dark grey, characterized by a relatively hard rock quality, and the rock body has developed fractures influenced by the geological structure. The landslide is predominantly composed of strongly weathered, highly fragmented tuff, with a structural surface rich in ferromanganese and susceptible to softening by water. At the base of the extensive road cut, there is an intermediate layer of sedimentary rock consisting mainly of dark grey carbonaceous mudstone and shale, interspersed with coal lithologies. This layer is black-grey, soft, easily weathered, thinly bedded, and has a gentle dip. The rock layer is subject to distortion and deformation due to structural influences.
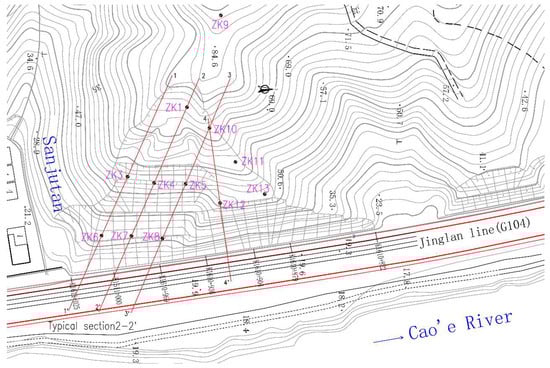
Figure 4.
Plan view of slope drilling location.
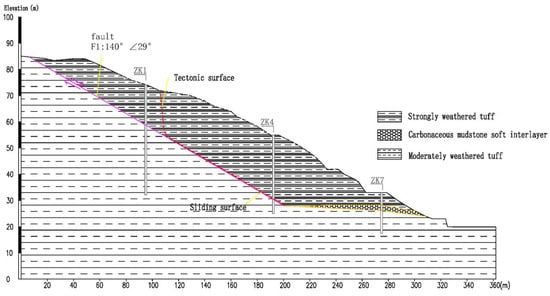
Figure 5.
Schematic diagram of a typical engineering geological section.
The slope includes severe deformation area I and no deformation area II. A fault F1 (dip direction: 140°, dip angle: 29°) is developed along the original cut-off ditch of the slope, extending diagonally from the top of the retaining wall to the top of the slope (Figure 6). Influenced by the F1 fault, the upper plate of the fault is composed of strongly weathered tuff characterized by extremely fractured rock quality, extensive fractures, highly weathered fracture surfaces, and localized mud deposition. The lower plate is of hard rock quality with a reasonably complete rock body. Apart from the F1 fault, the dip has three sets of developed structural planes (Table 1): (1) dip direction: 68°, dip angle: 39°; (2) dip direction: 169°, dip angle: 50° (trailing edge tectonic plane); (3) dip direction: 68°, dip angle: 88° (trailing edge tectonic plane). A stereographic projection shows that the combination of structural planes adversely affects slope stability, with the fault having the greatest influence, resulting in a bedding landslide (Figure 7). The fault acts as the sliding surface of the landslide and represents the primary structural plane affecting landslide stability. At the base of the slope is a weak interlayer of carbonaceous mudstone and coal beds, which is a relatively weak interlayer. Under the combination of the carbonaceous mudstone weak interlayer, fault F1, and the middle and back margin tectonic plane, a wedge shape along the slope is formed.
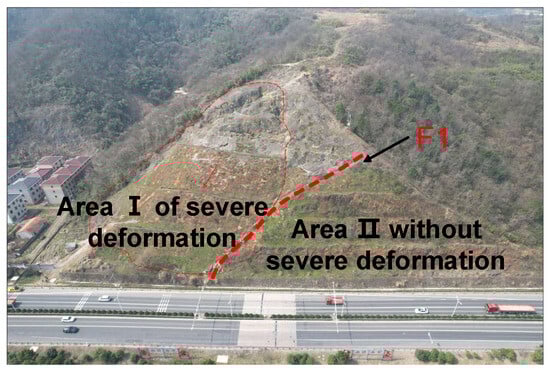
Figure 6.
Landslide deformation area.

Table 1.
Dip direction and dip angle.
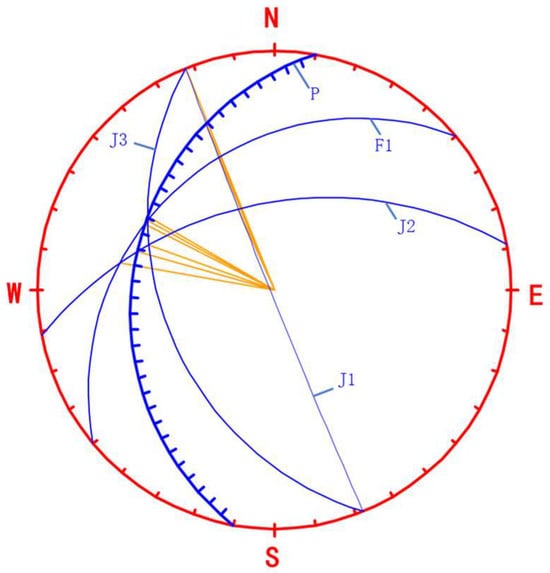
Figure 7.
Equatorial projection.
To determine the physical and mechanical parameters of the rock and soil samples, laboratory tests were carried out on drilled samples, including dynamic penetration tests on gravel soil, pebbles, and strongly weathered rock. A total of 5 groups of soil samples and 30 groups of rock samples were subjected to laboratory testing. Conventional soil tests were carried out on the drilled samples, some slip body and slip zone soils were subjected to saturation direct shear tests, and direct shear tests on reshaped samples and repeated direct shear tests were performed. The laboratory also assessed the saturated uniaxial compressive strength, natural compressive strength, and dry compressive strength of the rock samples. The various rock parameters are detailed in Table 2.
Table 2.
Physical and mechanical parameters of rock and soil mass.
2.3. Deformation Characteristics of the Landslide
In February 2022, the high slope of the motorway underwent severe deformation due to prolonged rain and freezing snow conditions, resulting in the opening of longitudinal cracks on several slope platforms and the initial formation of an armchair landslide hazard. The perimeter of the landslide is well-defined and has a skip-shaped planform with a main slip direction of approximately 120°. The landslide is approximately 130 m long diagonally, approximately 60 m wide at the leading edge, 15–20 m wide at the trailing edge, and approximately 6–20 m thick. The estimated potential volume of the landslide is about 1.0 × 10⁵ m3, classifying it as a medium-sized rocky landslide.
The landslide has numerous slope cracks and deformations in drainage channels. These can be categorized into different areas, namely the shear exit area, right crack area, back edge area, mid-slope tensile crack area, and left crack area. The deformation area is shown in Figure 8. In the shear exit area, pronounced extrusion deformation is observed at the leading edge. The shear exit extends from the slope foot to the first retaining wall. The left shear exit is located in the middle of the secondary slope and gradually extends to the right side to the top of the primary retaining wall. In addition, the middle and right shear exits are located at the middle of the top of the primary retaining wall, and bulging cracks were found at the front of the landslide. (Figure 8b). In the right crack zone, the fracture ascends along the cut-off trench of the slope, diverging from the non-deformed zone II at the four-stage platform. As it progresses upwards, the fracture reaches the back edge of the slope. Subsequently, the slope cut-off trench shows extensive damage and deformation below the four-stage platform, resulting in downward sliding. The fracture is located above the F1 fault. In the right crack area, there is a tensile fracture area in the middle and upper part of the landslide (Figure 8c). A tension crack has developed at the back edge of the landslide, with a downward displacement of 1.0 to 2.0 m and a width of 30 to 50 cm. The maximum width of the transverse crack is approximately 2.0 m. The trailing edge has assumed an armchair configuration and the sliding mass manifests a triangular shape (Figure 8d). Within the mid-slope tensile crack zone, a large number of plume cracks are distributed across the central slope of the landslide. Transverse tension cracks are evident at the periphery of the platforms at each level, accompanied by localized longitudinal cracks of varying lengths within the slope (Figure 8e). In the left crack region, two locally identified longitudinal cracks cross the slope, measuring 10 to 15 m in length. There are also small cracks of 1 to 2 cm in width, but no prominent large cracks (Figure 8f).
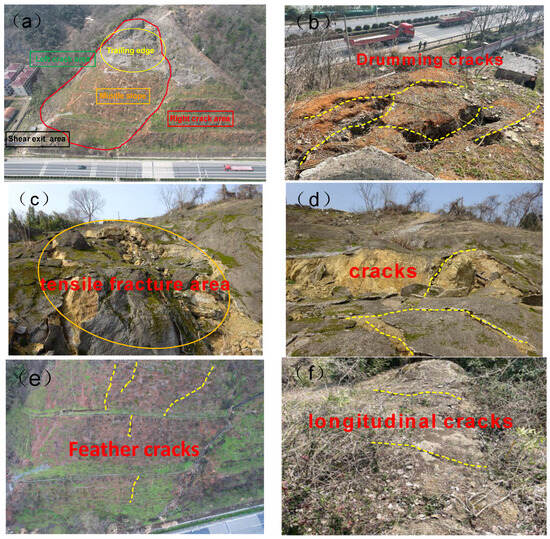
Figure 8.
Slope deformation diagrams: (a) panoramic view of landslide deformation; (b) shear exit area; (c) right crack area; (d) back edge area; (e) mid-slope tensile crack area; (f) left crack area.
2.4. Slope Treatment Measure
The initial slope was a grade six slope with slope ratios of 1:0.25, 1:1.0, 1:1.0, 1:1.25, 1:1.25, and 1:1.25, respectively. To mitigate the thrust exerted by the primary sliding section in the middle and upper regions of the landslide, excavation started from the third stage platform and proceeded in four stages (Figure 9). The first level of excavation had a slope height of 8 m, a slope ratio of 1:1.50, and a platform width of 6 m at the top of the slope. The next excavation level maintained a slope height of 8 m, a slope ratio of 1:1.50, and a platform width of 4 m at the top of the slope. The third level, also 8 m high, had a slope ratio of 1:1.50 and a platform width of 3 m at the top. The fourth level was excavated to its apex and had a slope ratio of 1:0.50. The total excavation volume was approximately 12,000 m3 (Table 3).
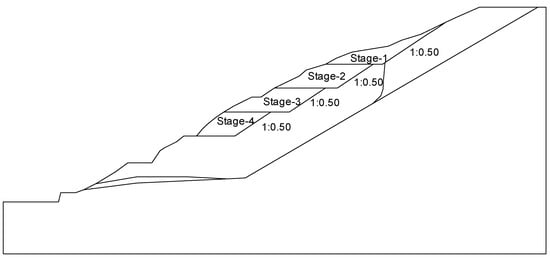
Figure 9.
Excavation and unloading solution.
Table 3.
Slope conditions after excavation.
The reinforcement scheme of “prestressed anchor + prestressed anchor cable + anti-slide pile” was adopted for the landslide, as shown in Figure 10. The slopes of the fourth to seventh levels were reinforced using pre-stressed anchor cables, each 25 m long, with a horizontal spacing of 4 m and a vertical spacing of 3 m. A total of 12 rows of anchor cables made from 6Φs15.2 stranded wire contributed to this reinforcement. The slope of the third stage was reinforced with 12 m-long 32 mm-diameter pre-stressed anchors, spaced horizontally at 4 m and vertically at 3 m, with three rows of anchors used systematically. A row of circular anti-slip piles with a diameter of 2 m, a pile length of 16 m, and a pile center distance of 5 m was installed on the inner side of the second stage platform, with a total of 15 piles (Figure 11).
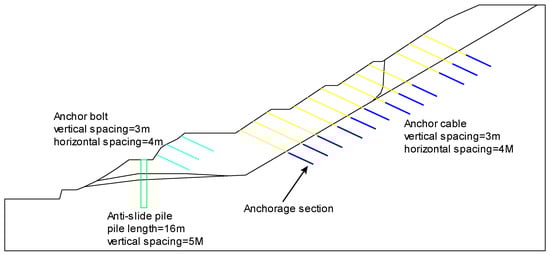
Figure 10.
Slope reinforcement scheme.
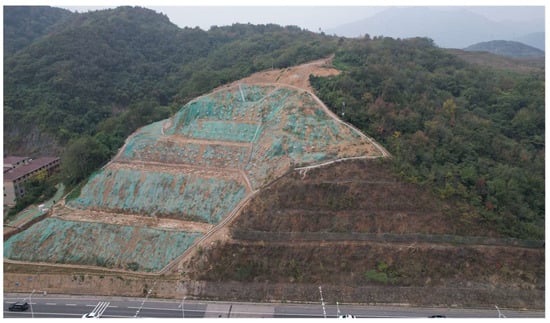
Figure 11.
Photo of the slope after reinforcement.
3. Monitoring Systems and Analysis
Field monitoring of the study area commenced in March 2022. The installed monitoring system consisted of two deep horizontal displacement monitors (CX1 and CX2) located on the second and seventh level platforms, five anchor cable monitors (MS1-MS5) located on the fifth and sixth level slopes, a rebar stress monitor (Z12) located on the second level platform, and a meteorological monitoring station (P) located on the seventh level platform to track real-time rainfall on the slope. The detailed arrangement of the monitoring instruments in the study area is shown in Figure 12.
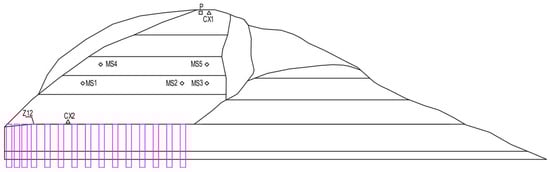
Figure 12.
Detailed layout of monitoring instruments.
3.1. Deep Displacement
In the process of landslide mitigation, automated equipment was strategically positioned at the top of the landslide and above the soft interlayer to enable automated monitoring of deep horizontal displacement. Two pre-installed fixed inclinometers were employed to gauge the horizontal displacements of the slope, with an accuracy of 0.25 mm/m. The manufacturer is Shanghai Geostar Sensing Technology Co., Ltd., located in Shanghai, China.
To monitor the fault, CX1 conducted displacement measurements at hole depths of 0.5 m, 2.5 m, 4.5 m, 6.5 m, and 8.5 m, spanning from 13 April 2022 to 14 July 2022 (Figure 13a). Deep displacement was influenced by on-site excavation construction and rainfall. Notably, significant sudden changes in displacement occurred on 10 May, 5 June, and 20 June 2022, primarily attributed to increased rainfall. The infiltration of rainfall into the fault resulted in their softening, rendering the slip zones saturated. Consequently, the slopes experienced decreased stability, leading to larger deformations, with deeper displacements exhibiting a corresponding increase. The displacement at the 8.5 m hole depth underwent the most significant change, reaching 5.43 mm on 19 June 2022. As this hole depth was close to the fault governing slope sliding, its displacement was considerably influenced by the fault. Subsequently, to further assess the impact of the fault and enhance monitoring, hole depths were adjusted to 0.5 m, 2.5 m, 4.5 m, 8.5 m, and 14 m from 4 August 2022 to 31 May 2022 (Figure 13b). Following 2 days of heavy rain on 29 and 30 November 2022, noticeable changes occurred at each measurement point. Displacements at the 4.5 m and 8.5 m points continued to increase, while those at the 0.5 m and 2.5 m points significantly decreased. The 14.5 m depth, situated at the bottom of the fault in the medium-weathered tuff, experienced minimal overall change. The lower part, composed of weathered tuff rock, exhibited robust mechanical properties, was less susceptible to rainfall, and demonstrated greater stability.
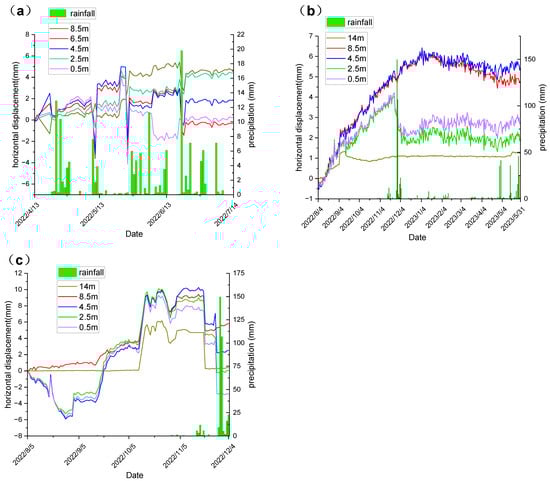
Figure 13.
Deep displacement deformation time course curve: (a) inclinometer hole 1 from 13 April 2022 to 14 July 2022; (b) inclinometer hole 1 from 4 August 2022 to 31 May 2023; (c) inclinometer hole 2.
To monitor the weak interlayer, CX2 conducted measurements at hole depths of 0.5 m, 2.5 m, 4.5 m, and 8.5 m from 4 August 2022 to 4 December 2022 (Figure 13c). The maximum relative displacement occurred at 4.5 m and reached 10.26 mm on 16 November. This heightened displacement was attributed to the proximity of the weak interlayer at 4.5 m, rendering it more susceptible. Following continuous rainfall from 15 to 19 December 2022, the displacement at each point experienced a sudden decline. Subsequently, after 28 November, due to 2 consecutive days of heavy rain, the displacement at each point continued to decline abruptly. Surface water infiltration into the weak interlayer softened it, saturating the weak interlayer zone and diminishing its resistance to shear, resulting in larger displacements.
3.2. Anti-Slide Pile Monitoring
The internal force within the anti-slide pile structure was monitored using a vibrating wire reinforcement stress meter and the results were accurate to 1 kN. The manufacturer is Jiangsu Saiwei Geological Mapping Co., Ltd., located in Xuzhou, Jiangsu, China. The steel bar meter was affixed to the primary reinforcement bar through veneer welding, and the vertical placement of the monitoring element aligned with the design specifications, maintaining a distance of 2.0 m.
The structural internal force of the anti-slide pile is calculated by the frequency of the steel bar meter:
Among them, it is assumed that the strain coordination between the concrete and reinforcement of the anti-slide pile is . Hence, the force formula for an anti-slide pile is:
where is the force of the steel bar; is the calibration coefficient of the steel stress meter; is the current frequency reading of the steel stress meter; is the initial frequency reading of the steel stress meter; is the stress of the steel bar; is the stress of the concrete; is the force of the concrete; is the cross-sectional area of the steel bar; is the cross-sectional area of the concrete; and is the force of the anti-slide pile.
At the third stage platform, the Z12 anti-slide pile was selected for internal force monitoring, and seven sensors were arranged along the direction of each pile from top to bottom for internal force monitoring (Figure 14).
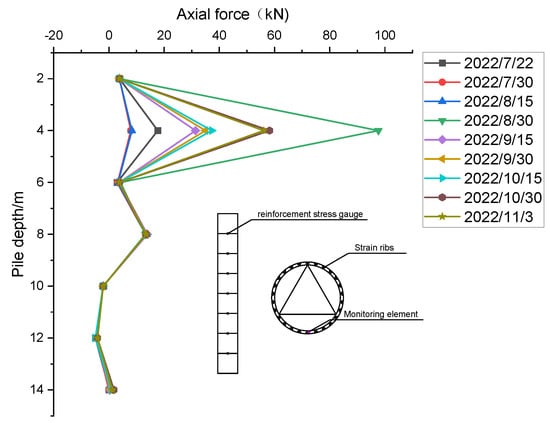
Figure 14.
Curve of anti-slide pile force with depths.
The axial force within the pile body demonstrated overall stability, with no apparent abnormal mutations or consistent increases or decreases, except at points 12–2, where some fluctuations occurred. Given the presence of a weak interlayer at a depth of 4 m within the pile body, this section was particularly susceptible to changes in axial force. Throughout the monitoring period, the anti-slide pile experienced a maximum tensile force of 97.66 kN at a depth of 4 m, while the maximum compressive force reached −4.89 kN at 12 m. The stress levels within individual piles ranged from −6.08 MPa to 121.42 MPa, and the reinforcing bar did not reach the elastoplastic or plastic state; it remained in the elastic state. This observation indicated that the anti-slide pile did not fail, and the slope remained in stable condition.
3.3. Anchor Cable Monitoring
The monitoring of anchor cables employed a vibrating wire anchor cable dynamometer with a measurement range of 0 to 200 T, a sensitivity of < 0.5% F.S, and a temperature range of −20 to 80 °C. The manufacturer is Shanghai Geostar Sensing Technology Co., Ltd., located in Shanghai, China. The prestressed anchor cable could give full play to the bearing capacity of the rock mass and improve the stability of the slope. The monitoring results of the prestressed anchor cable could verify whether the anchor cable played a strengthening role. After the anchor cable tensioning was complete, the prestressing force of all anchor cables was lost to varying degrees (Figure 15). The anchorage force of MS5 was rapidly lost within 5 days, fluctuated greatly from 11 days to 15 days, and gradually stabilized after 15 days; the prestress loss reached 111.51 kN, and the loss rate was 15.73% (Table 4). The prestress of the other anchor cables slowly decreased, and the measured values did not change greatly. Vegetation spraying on the slope surface influenced the data during this period. The overall variation in anchor cable axial force meter readings remained within the early-warning control value, affirming that the slope was predominantly stable.
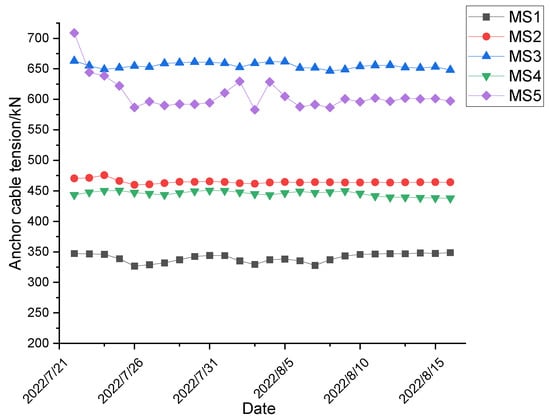
Figure 15.
Cable tension variation diagram.
Table 4.
Prestressing losses.
4. Numerical Simulation
4.1. Model Description
To study the stability of the slope, the finite difference method was used to numerically simulate the slope, and the safety factor was determined through the strength reduction method. The finite difference method was performed using the software FLAC3D developed by Itasca. FLAC3D adopts the fast Lagrange method, which has a good simulation effect for complex geotechnical problems and is an effective tool for analyzing geotechnical problems [21,22]. The strength reduction method involved the systematic reduction of rock and soil strength parameters and to make the slope reach an unstable state. The safety coefficient was then determined by the ratio of the actual shear strength of the rock and soil mass to the reduced shear strength at the critical failure point [23,24,25], as given by:
where and represent the unreduced cohesion and internal friction angle, respectively; and represent the reduced cohesion and internal friction angle, respectively; is the reduction coefficient; and is the shear strength.
The rock layer of the landslide is mainly composed of soft interlayers of moderately weathered tuff, strongly weathered tuff, and carbonaceous mudstone soft interlayer. The Mohr–Coulomb model was used to describe the mechanical behavior of three kinds of rock and soil. The comprehensive determination of simulation parameters was based on field investigations, laboratory experiments, and the engineering analogy method. The bulk modulus and shear modulus of rock mass can be obtained by Equations (8) and (9) [26]. The physical parameters of rock and soil are shown in Table 5.
Table 5.
Physical and mechanical parameters of rock and soil mass.
The discontinuous structural plane of the landslide comprises the fault and structural planes, with the stiffness of the latter determined using empirical Equations (10) and (11) [27]. Mechanical parameters for the structural plane are shown in Table 6. To simulate the fault and tectonic planes in FLAC3D, the non-thickness contact element was employed, and the Interface command was utilized to establish the contact plane.
Table 6.
Mechanical parameters of structural plane.
The typical profile 2-2 was selected for modeling based on FLAC3D. To account for boundary effects, specific dimensions were considered: the distance from the slope foot to one side of the boundary was set to 1.5 times the slope height, the slope top to the other side of the boundary was set to 2.5 times the slope height, and the maximum height of the critical boundary above and below the model was greater than or equal to 2 times the slope height, ensuring optimal calculation accuracy [28]. Consequently, the model dimensions were established as 396 m (length) × 125 m (height) × 18 m (width). The model was configured with a fixed constraint at the bottom, normal constraints on the four sides, and a free boundary at the upper part (Figure 16). The anti-slip piles were modeled using a pile structural unit, while both prestressed anchors and prestressed anchor cables were simulated using a cable structural unit. The corresponding support parameters for these elements are provided in Table 7 and Table 8.
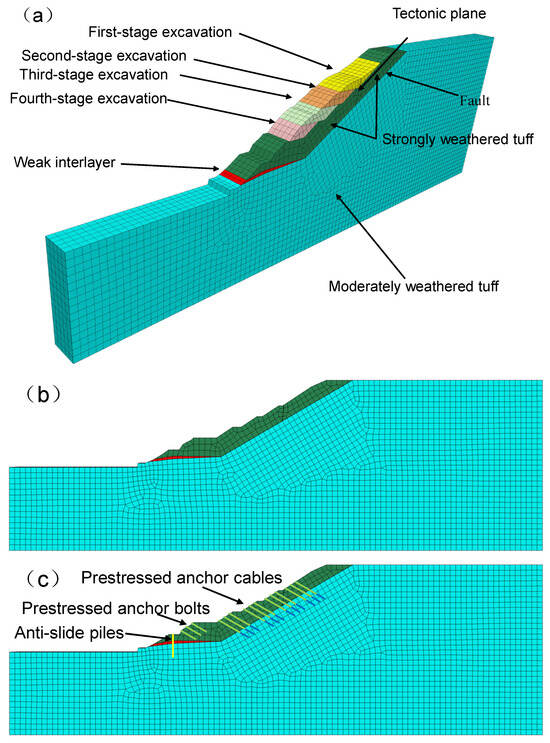
Figure 16.
Calculation model: (a) original slope; (b) excavation; (c) support.
Table 7.
Structural parameters of anti-slide pile.
Table 8.
Structural parameters of prestressed anchor bolt and prestressed anchor cable.
Four working conditions were fully considered in the numerical simulation: (1) natural condition; (2) rainstorm condition; (3) slope treatment condition; (4) combination of rainstorm and treatment conditions.
4.2. Analysis of Numerical Simulation Results
4.2.1. Natural Conditions
The safety factor of the slope was 0.979 in the natural state, which was an unstable state and consistent with the field deformation (Figure 17). The rock properties were notably deficient, particularly the pronounced weathering of the tuff in the upper section, accompanied by crack development and the presence of weak charcoal mudstone interlayers at the slope base. The rock mass was fragmented, exhibiting soft qualities and an overall diminished strength. The interaction of the fault and the trailing edge of the tectonic surface formed a cutting combination, resulting in the formation of a wedge at the high side of the slope and contributing to the main thrust zone of the landslide. However, the collective strength of the rock and soil failed to withstand the downward force imposed by the slope’s weight, leading to deformation and damage.
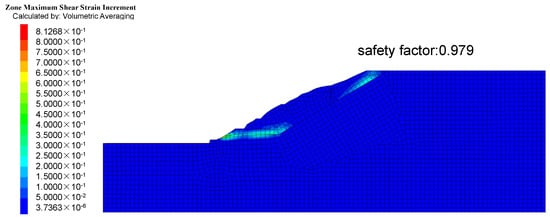
Figure 17.
Maximum shear strain case under natural conditions.
4.2.2. Rainfall Conditions
Under the conditions of heavy rainfall, the slope stability was 0.893, which was an unstable state and more prone to collapse (Figure 18). As the slope was located at the ridge, the catchment area of the slope was small and cracks in the rock mass at the back edge developed, thus precipitation seeped down from the back edge of the slope. The carbonaceous mudstone soft interlayer exposed at the slope’s base served as a partial water barrier. Groundwater permeated the slope along the contact surface between the upper strongly weathered layer and the underlying moderately weathered bedrock, flowing from topographic highs to lows. As the slope body accumulated more weight and approached saturation, the rock mass’s strength decreased. Concurrently, the weak interlayer, the structural plane at the back edge, and the fault underwent softening, leading to a progressive decline in mechanical properties. This resulted in decreases in the and values for the rock mass and each structural plane, ultimately reaching saturated parameters. With the rise in groundwater level, pore water pressure and dynamic water pressure greatly increased, increasing the sliding force and resulting in landslide deformation and failure. Tuff tends to soften and disintegrate upon contact with water, while high water content causes rocks to expand. Under rainstorm conditions, these factors contributed to significant reductions in the mechanical properties of the rock mass, posing a considerable threat to the slope’s stability.
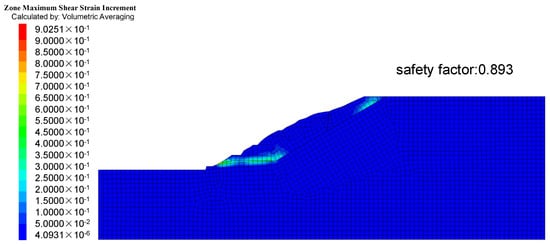
Figure 18.
Maximum shear strain case under rainfall conditions.
4.2.3. Slope Treatment Conditions
Through systematic excavation stages, the slope’s stability experienced progressive enhancement. Upon completion of all excavation in the fourth step, the ultimate safety factor of the slope in its natural state reached 1.152 (Figure 19). The excavation process diminished the self-weight load of the slide, leading to a reduction in the downward sliding force. The stress level of the slope was significantly ameliorated compared to its natural state, highlighting the substantial impact of excavation and unloading on the management of the G104 landslide.
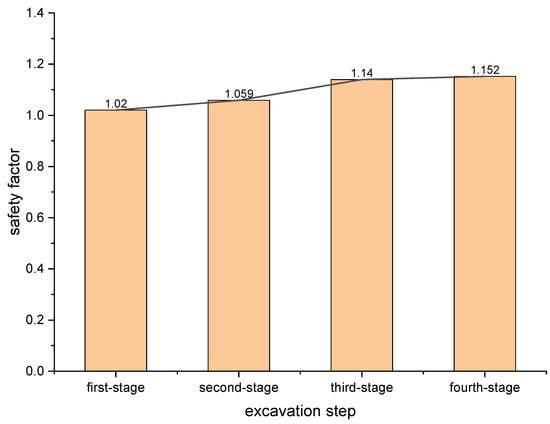
Figure 19.
Safety factors for each step of excavation under natural conditions.
After excavation, the slope was supported by “anti-slip pile + prestressed anchor + prestressed anchor cable,” further improving the stability of the slope, and the coefficient of safety reached 1.324 under natural working conditions (Figure 20). This indicated that the support method of “anti-slip pile + prestressed anchor rod + prestressed anchor cable” had a good governing effect on wedge-shaped landslide composed of faults, trailing edge structural planes, and weak interlayers. The anti-slip effect of anti-slip piles was mainly to balance the landslide thrust by using the anchoring effect and passive resistance of the stable ground. The weak interlayer of the slope foot was easy to settle and deform, and anti-slide piles were used to strengthen the weak interlayer. The anchoring section of the prestressed anchor cable was anchored into the weathered tuff, and the sliding body and the stable bedrock were combined, thus changing the stress state of the rock mass of the slope and improving the integrity and strength of the unstable rock mass of the slope.
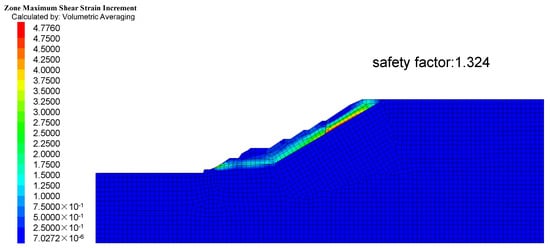
Figure 20.
Maximum shear strain case under slope treatment conditions.
4.2.4. Combination of Slope Treatment and Rainstorm Conditions
Under rainstorm conditions, the stability of the excavation slope was gradually improved, and the safety factor after excavation finally reached 0.998, which was greatly improved compared with the original rainstorm conditions, but it was still not in a stable state (Figure 21). After support, the safety factor was improved to 1.191, and the slope was in a stable state (Figure 22).
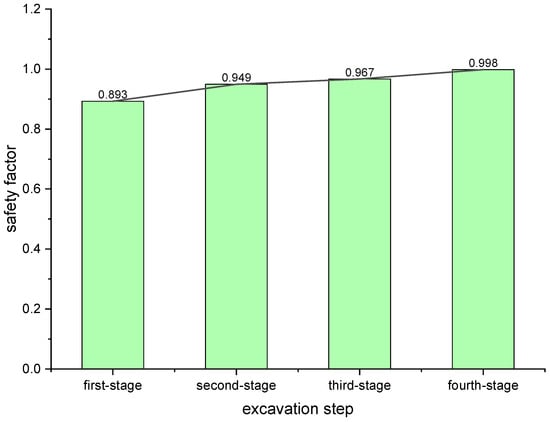
Figure 21.
Safety factors for each step of excavation under rainstorm conditions.
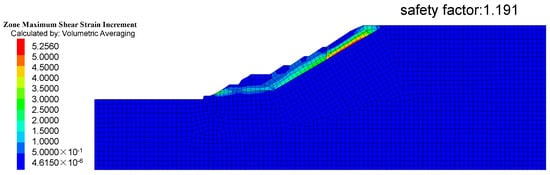
Figure 22.
Maximum shear strain case under the combination of slope treatment and rainstorm conditions.
5. Discussion
The existence of weak layers greatly affects the stability of slopes, and after rainfall, slopes are prone to landslides along the sliding surface of weak inclusions. Wang et al. analyzed the deformation of rock masses by monitoring the deep displacement of the slope and determined the location of weak layers on the slope [29]. The deep displacement curves of inclined holes ZK4, ZK7, ZK5, and ZK6 are shown in Figure 23, and the positions of weak interlayers are shown in Figure 24. From Figure 23a, it can be seen that the overall displacement had no obvious sudden changes in displacement, which showed that the whole depth of the oblique measurement was inside the slide, and the depth of the oblique hole had not yet reached the location of the key stratum controlling slope sliding, and the displacement was only affected by the movement of the slide. From Figure 23b, it can be seen that when the hole was located at a depth of about 42 m, the displacement value of each measurement had a sudden change compared with the initial value, indicating that the displacement of the rock body there had a large change, and it was the key stratum controlling slope sliding. From Figure 23c, it can be seen that when the monitoring depth was about 21 m, each measured displacement value had a sudden change, indicating that this location was the key stratum to control slope sliding. From Figure 23d, it can be seen that when the monitoring depth was about 3.0 m, the relative displacement value of each curve had a sudden change, and the rock mass had large destabilizing activity, which was the key stratum to control slope sliding.
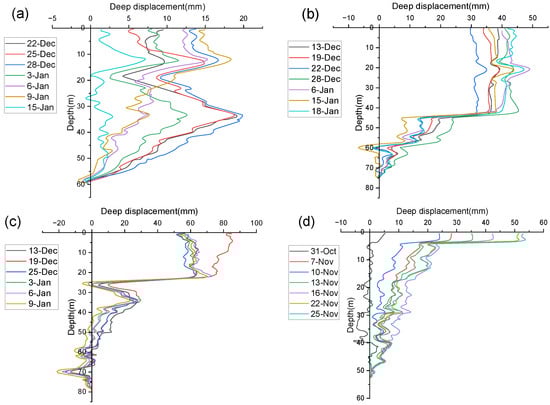
Figure 23.
The deep displacement of each hole: (a) ZK4, (b) ZK7, (c) ZK5, (d) ZK6.
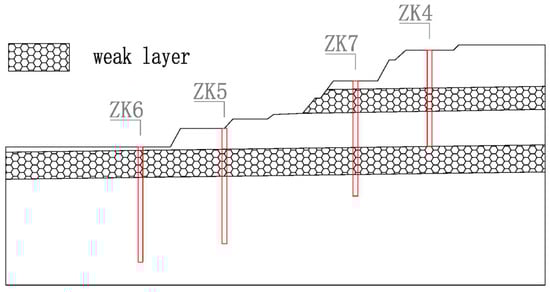
Figure 24.
The weak layer location.
The study by Wang et al. [29] had some similarities with this paper. Close to the weak interlayer, the deep displacements abruptly increased, and the weak layer affected the sliding and stability of the slope. The difference lies in the combination analysis of deep displacement and rainfall in this study, and it was found that rainfall will increase the influence of the weak interlayer and the fault on the slope. In the vicinity of the weak interlayer and the fault, which themselves had large deep displacements and were susceptible to disturbance, the displacement changes became more pronounced under the influence of rainfall infiltration.
6. Conclusions
In this paper, the stability of landslides was investigated through field investigation, drilling exploration, monitoring data, and numerical simulation, and the effects of rainfall infiltration and complex geological conditions consisting of a weak interlayer, a fault, and the tectonic plane on the slope were systematically analyzed, leading to the following main conclusions:
- (1)
- The sliding body of the slope was mainly composed of strongly weathered tuff, and the strength of the rock mass is low. The wedge form was composed of the fault, the back edge tectonic plane, and the weak interlayer, which provided favorable geological conditions for the landslide. Under the action of continuous rainfall freezing in February 2022, a large number of tension cracks appeared in the slope, and rainfall played a leading role. This landslide was mainly caused by rainfall and the complex geological structure.
- (2)
- The deformation trend of landslide deep displacement was consistent with the rainfall trend. Rainfall seeped into the weak interlayer and the fault along the joints and cracks of the rock mass and softened them, the slip zone and weak interlayer were in a water-saturated state, the vicinity of the fault and the weak interlayer were easily disturbed, and the displacement became larger. The axial force of the anti-slide pile was the largest at 4 m, which was affected by rainfall and had great change, while the axial force of the other six points was small and had little change. Near the weak interlayer at a distance of 4 m, the mechanical performance of the weak interlayer was poor, and the anti-slip pile bore a large force, preventing significant deformation of the weak interlayer. After rainfall, rainwater seeped into the weak interlayer, its shear resistance became worse, and the axial force of the anti-slide pile correspondingly increased. The prestress value of the prestressed anchor cable changed slightly and did not exceed the pre-warning control value, indicating that the slope was in a stable state.
- (3)
- The stability of the slope was calculated by numerical simulation, and the original slope was in an unstable state, which was consistent with the field investigation. With gradual excavation of the slope, the stability was gradually improved. After excavation, the slope was basically in a stable state under natural conditions. After the support of “prestressed anchor + prestressed anchor cable + anti-slide pile” was applied, the stability of the slope was significantly improved under natural conditions and rainstorm conditions. The numerical simulation and monitoring data jointly verified that the treatment measures of “excavation unloading” and “prestressed anchor + prestressed anchor cable + anti-slide pile” are effective and ideal.
The results of this paper contribute to the understanding of the landslide formation mechanisms under complex geological conditions and rainfall infiltration. The landslide treatment measures proposed in this paper can provide a reference for the design and implementation of similar rocky slope projects under complex geological conditions.
Author Contributions
Conceptualization, Y.Z. (Yizhou Zhuang) and X.H.; investigation, X.H. and W.H.; data curation, X.H. and W.H.; methodology, Y.Z. (Yijun Zhu) and D.S.; software, X.H.; writing—original draft, X.H.; writing—review and editing, D.S., Y.Z. (Yizhou Zhuang), and Y.Z. (Yijun Zhu) All authors have read and agreed to the published version of the manuscript.
Funding
This research received no external funding.
Data Availability Statement
Data are contained within the article.
Conflicts of Interest
Author Yijun Zhu is employed by Zhejiang Institute of Communication Co., Ltd. The remaining authors declare that the research was conducted in the absence of any commercial or financial relationships that could be construed as a potential conflict of interest.
References
- Fang, K.; Tang, H.; Li, C.; Su, X.; An, P.; Sun, S. Centrifuge modelling of landslides and landslide hazard mitigation: A review. Geosci. Front. 2023, 14, 101493. [Google Scholar] [CrossRef]
- Dong, M.L.; Zhang, F.; Yu, C.; Lv, J.; Zhou, H.; Li, Y.; Zhong, Y. Influence of a Dominant Fault on the Deformation and Failure Mode of Anti-dip Layered Rock Slopes. KSCE J. Civ. Eng. 2022, 26, 3430–3439. [Google Scholar] [CrossRef]
- Bao, M.; Chen, Z.; Nian, G.; Zhang, L.; Zhou, Z. Fractional Catastrophe Model considering the Rheological Properties of Slope Faults. Lithosphere 2021, 2021, 1125720. [Google Scholar] [CrossRef]
- Sun, H.Y.; Pan, P.; Lü, Q.; Wei, Z.-L.; Xie, W.; Zhan, W. A case study of a rainfall-induced landslide involving weak interlayer and its treatment using the siphon drainage method. Bull. Eng. Geol. Environ. 2019, 78, 4063–4074. [Google Scholar] [CrossRef]
- Xu, J.J.; Tang, X.; Wang, Z.; Feng, Y.; Bian, K. Investigating the softening of weak interlayers during landslides using nanoindentation experiments and simulations. Eng. Geol. 2020, 277, 105801. [Google Scholar] [CrossRef]
- Zuo, C.; Liu, D.; Ding, S.; Chen, J. Micro-characteristics of strength reduction of tuff residual soil with different moisture. KSCE J. Civ. Eng. 2016, 20, 639–646. [Google Scholar] [CrossRef]
- Wilkinson, P.L.; Anderson, M.G.; Lloyd, D.M. An integrated hydrological model for rain-induced landslide prediction. Earth Surf. Process. Landf. 2002, 27, 1285–1297. [Google Scholar] [CrossRef]
- Zhang, J.; Luo, Y.; Zhou, Z.; Victor, C.; Duan, M. Research on the rainfall-induced regional slope failures along the Yangtze River of Anhui, China. Landslides 2021, 18, 1801–1821. [Google Scholar] [CrossRef]
- Sassa, K.; Tsuchiya, S.; Ugai, K.; Wakai, A.; Uchimura, T. Landslides: A review of achievements in the first 5 years (2004–2009). Landslides 2009, 6, 275–286. [Google Scholar] [CrossRef]
- Yi, X.; Feng, W.; Bai, H.; Shen, H.; Li, H. Catastrophic landslide triggered by persistent rainfall in Sichuan, China: August 21, 2020, Zhonghaicun landslide. Landslides 2021, 18, 2907–2921. [Google Scholar] [CrossRef]
- Pan, Y.; Wu, G.; Zhao, Z.; He, L. Analysis of rock slope stability under rainfall conditions considering the water-induced weakening of rock. Comput. Geotech. 2020, 128, 103806. [Google Scholar] [CrossRef]
- Li, Q.; Wang, Y.M.; Zhang, K.B.; Yu, H.; Tao, Z.Y. Field investigation and numerical study of a siltstone slope instability induced by excavation and rainfall. Landslides 2020, 17, 1485–1499. [Google Scholar] [CrossRef]
- Yan, X.Y.; Xu, B.; Zhang, L.; Wang, W.; Yan, C. Mechanism analysis of a landslide in highly weathered volcanic rocks of Niushoushan Hill in Nanjing. Environ. Earth Sci. 2019, 78, 676. [Google Scholar] [CrossRef]
- Liu, B.; He, K.; Han, M.; Hu, X.; Ma, G.; Wu, M. Application of UAV and GB-SAR in Mechanism Research and Monitoring of Zhonghaicun Landslide in Southwest China. Remote Sens. 2021, 13, 1653. [Google Scholar] [CrossRef]
- Lo, C.M.; Lai, Y.S.; Chu, C.H. Investigation of Rainfall-Induced Failure Processes and Characteristics of Wedge Slopes Using Physical Models. Water 2023, 15, 1108. [Google Scholar] [CrossRef]
- Nian, G.Q.; Chen, Z.; Zhu, T.; Zhang, L.; Zhou, Z. Experimental study on the failure of fractured rock slopes with anti-dip and strong weathering characteristics under rainfall conditions. Landslides 2023, 21, 165–182. [Google Scholar] [CrossRef]
- Yang, Y.C.; Xing, H.-G.; Yang, X.-G.; Chen, M.-L.; Zhou, J.-W. Experimental study on the dynamic response and stability of bedding rock slopes with weak interlayers under heavy rainfall. Environ. Earth Sci. 2018, 77, 433. [Google Scholar] [CrossRef]
- Gao, M.L.; Gao, H.; Zhao, Q.; Chang, Z.; Miao, C. Study on Stability of Anchored Slope under Static Load with Weak Interlayer. Sustainability 2022, 14, 10542. [Google Scholar] [CrossRef]
- Li, Y.; Yu, L.; Song, W.; Yang, T. Three-Dimensional Analysis of Complex Rock Slope Stability Affected by Fault and Weak Layer Based on FESRM. Adv. Civ. Eng. 2019, 2019, 6380815. [Google Scholar] [CrossRef]
- Du, C.C.; Chen, J.; Chen, S.; Peng, M.; Shi, Z. Numerical analysis of a slope stabilized with piles and anchor cable frame beams. Environ. Earth Sci. 2023, 82, 100. [Google Scholar] [CrossRef]
- Cheng, Y.M.; Lansivaara, T.; Wei, W.B. Two-dimensional slope stability analysis by limit equilibrium and strength reduction methods: Reply. Comput. Geotech. 2008, 35, 309–311. [Google Scholar] [CrossRef]
- Nian, T.K.; Chen, G.Q.; Luan, M.T.; Yang, Q.; Zheng, D.F. Limit analysis of the stability of slopes reinforced with piles against landslide in nonhomogeneous and anisotropic soils. Can. Geotech. J. 2008, 45, 1092–1103. [Google Scholar] [CrossRef]
- Zienkiewicz, O.C.; Humpheson, C.; Lewis, R.W. Associated and non-associated visco-plasticity and plasticity in soil mechanics. Géotechnique 1975, 25, 671–689. [Google Scholar] [CrossRef]
- Donald, I.B.; Chen, Z. Slope stability analysis by the upper bound approach: Fundamentals and methods. Can. Geotech. J. 1997, 34, 853–862. [Google Scholar] [CrossRef]
- Cheng, Y.M.; Lansivaara, T.; Wei, W.B. Two-dimensional slope stability analysis by limit equilibrium and strength reduction methods. Comput. Geotech. 2007, 34, 137–150. [Google Scholar] [CrossRef]
- Gere, J.M.; Goodno, B.J. Mechanics of Materials; Cengage Learning: Singapore, 2012. [Google Scholar]
- Itasca Consulting Group. FLAC (Fast Lagrangian Analysis of Continua); ITASCA Consulting Group Manuals: Minneapolis, MN, USA, 2011. [Google Scholar]
- Zhang, L.-y.; Zheng, Y.R.; Zhao, S.; Shi, W. The feasibility study of strength-reduction method with FEM for calculating safety factors of soil slope stability. J. Hydraul. Eng. 2003, 1, 21–26. [Google Scholar]
- Wang, T.; Zhao, H.; Liu, Y.; Liu, S.; Liu, R. Formation mechanism and control measures of sliding surface about bedding slope containing weak interlayer. KSCE J. Civ. Eng. 2020, 24, 2372–2381. [Google Scholar] [CrossRef]
Disclaimer/Publisher’s Note: The statements, opinions and data contained in all publications are solely those of the individual author(s) and contributor(s) and not of MDPI and/or the editor(s). MDPI and/or the editor(s) disclaim responsibility for any injury to people or property resulting from any ideas, methods, instructions or products referred to in the content. |
© 2024 by the authors. Licensee MDPI, Basel, Switzerland. This article is an open access article distributed under the terms and conditions of the Creative Commons Attribution (CC BY) license (https://creativecommons.org/licenses/by/4.0/).