Article

The Variation in the Water Level of Lake Baikal and Its Relationship with the Inflow and Outflow

by
Valery N. Sinyukovich
1,
Aleksandr G. Georgiadi
2,
Pavel Y. Groisman
3,4,*,
Oleg O. Borodin
5 and
Ilya A. Aslamov
1
1
Limnological Institute, Siberian Branch of the Russian Academy of Sciences, 664033 Irkutsk, Russia
2
Institute of Geography, Russian Academy of Sciences, 119017 Moscow, Russia
3
Cooperative Institute for Satellite Earth System Studies, North Carolina State University, Asheville, NC 28801, USA
4
Hydrology Science and Services Corporation, Asheville, NC 28804, USA
5
Water Problems Institute, Russian Academy of Sciences, 119333 Moscow, Russia
*
Author to whom correspondence should be addressed.
Water 2024, 16(4), 560; https://doi.org/10.3390/w16040560
Submission received: 29 December 2023 / Revised: 5 February 2024 / Accepted: 6 February 2024 / Published: 12 February 2024
(This article belongs to the Section Hydrology)

Abstract

:
Lake Baikal is the largest freshwater lake in the world, accounting for about 20% of the world’s fresh surface water. The lake’s outflow to the ocean occurs only via the Angara River, which has several hydroelectric power plants (HPPs) along its watercourse. The first such HPP, Irkutsk HPP, was built in 1956 and is located 60 km from the Angara River’s source. After two years, the backwater from this HPP expanded to the lake shores and began raising the Baikal Lake level. Currently, there is a dynamic balance between the new lake level, the lake inflow from its tributaries, and the Angara River discharge through the Irkutsk HPP. However, both the Angara River discharge and the Baikal Lake level were distorted by the HPP construction. Thus, to understand the changes to the lake basin over the past century, we first needed to estimate naturalized lake levels that would be if no HPP was ever built. This was an important task that allowed (a) the actual impact of global changes on the regional hydrological processes to be estimated and (b) better management of the HPP itself to be provided through future changes. With these objectives in mind, we accumulated multi-year data on the observed levels of Lake Baikal, and components of its water budget (discharge of main tributaries and the Angara River, precipitation, and evaporation). Thereafter, we assessed the temporal patterns and degree of coupling of multi-year and intra-annual changes in the lake’s monthly, seasonal, and annual characteristics. The reconstruction of the average monthly levels of Lake Baikal and the Angara River water discharge after the construction of the Irkutsk HPP was based on the relationship of the fluctuations with the components of the Lake water budget before regulation. As a result, 123-year time series of “conditionally natural” levels of Lake Baikal and the Angara River discharge were reconstructed and statistically analyzed. Our results indicated high inertia in the fluctuations in the lake level. Additionally, we found a century-long tendency of increases in the lake level of about 15 cm per 100 years, and we quantified the low-frequency changes in Lake Baikal’s water levels, the discharge of the Angara River, and the main lake tributaries. An assessment of the impact of the Irkutsk HPP on the multi-year and intra-annual changes in the Lake Baikal water level and the Angara River discharge showed that the restrictions on the discharge through the HPP and the legislative limitations of the Lake Baikal level regime have considerably limited the fluctuations in the lake level. These fluctuations can lead to regulation violations and adverse regimes during low-water or high-water periods.

1. Introduction

The seasonal and long-term fluctuations in the water level of Lake Baikal are determined by the ratios of the main components of its water budget. The main inflow component of the lake water budget is the river runoff from its catchment area, while the Angara River is the main outflow component.
A reduced inflow (if it occurs) or increased evaporation from the lake surface because of warming will cause a decrease in the lake level, worsening its ecological problems. Global warming has increased the threat of the eutrophication of the world’s water resources in the 21st century [1], and this has been accompanied by the drying up of many water bodies, especially saline lakes [2,3,4,5,6,7,8,9,10,11]. For example, Lake Urmia in Iran has almost completely dried up [2,12,13]. According to a recent study [14], 53% of the world’s lakes, including those in humid regions, have experienced desiccation. Lakes and reservoirs serve not only as indicators of climate change, but also as regulators of the global climate [15]. Furthermore, due to changes in the topography of the lakebed, some lakes have experienced a decrease in their water level [16].
Anthropogenic and climatic factors have led to dramatic variations in the Caspian Sea [5,17] and the desiccation of the Aral Sea [18]. However, the regulation of the Angara River that affected the entire Lake Baikal basin has made it difficult to document the century-long natural hydrological changes in this large watershed that covers the area that encompasses south of Eastern Siberia and north of Central Mongolia. Here, the occurrence of a significant air temperature rise and permafrost retreat were known [19,20], but even the sign of the water balance changes in the basin remained uncertain. This balance is now affected by both climatic change (the effect of which is not yet well known) and anthropogenic regional impacts (which might inadvertently bring further ecosystem damage). Thus, there are reasons for concern about the future of the Lake Baikal ecosystem.
The response of the water level fluctuations to modern climate change is expected to become more prominent due to the increase in the surface air temperature in this region. By the end of the 20th century, this increase was twice as high as the Earth’s global temperature rise at 1.9 °C [21,22]. In Irkutsk, for example, the air temperature has increased by 2.5 °C since 1960, while the average global temperature has risen only by 1.2 °C since the beginning of the 20th century [23]. This increase was accompanied by the restructuring of various hydrological processes in Lake Baikal itself and its basin [21,24,25,26].
The impact of household activities on the level regime of Lake Baikal is primarily related to the regulation of runoff from the lake by the Irkutsk HPP. The influence of other anthropogenic factors is insignificant and the discharge from the Lake Baikal basin tributaries is not regulated by dams. It is used on a modest scale for water consumption by the local population. Therefore, the observed changes in the surface water inflow to the lake are largely climate-dependent.
Changing climatic conditions and hydropower regulation have created uncertainties in the water level fluctuations in Lake Baikal and have reduced the efficiency of water resource management. This situation is further complicated by the planned construction of hydropower plants in the Selenga River basin in Mongolia.
Significant attention has been paid to the problem of long-term changes in the lake levels [27,28,29]. Furthermore, an important component of multi-year changes is the long-lasting phases of increased/decreased values of various components of the water cycle [30,31,32]. As far as is known, this aspect of the time series has not yet been applied to studies of the Lake Baikal basin.
The main objective of this study was to identify the specific patterns of seasonal and long-term variation in the water level of Lake Baikal, the correlations with the corresponding changes in the outflow of the Angara River, and the total water discharge of the three main tributaries into the lake.
This study also provides an assessment of the long-term changes in the level of Lake Baikal and the outflow of the Angara River caused by the transformation of the lake water regime due to the construction of the Irkutsk HPP. It shows other long-term changes that were revealed after the HPP impact was accounted for and “removed” from consideration by “naturalizing” the time series of the lake level and the Angara outflow.

2. Materials and Methods

2.1. Object of Study

Lake Baikal in southeastern Siberia contains about 23,000 km3 of water, comprising 20% of the world’s fresh surface water. The lake water features low levels of mineralization and suspended organic matter. The water surface area of the lake is 31,500 km2, and the basin area is 540,000 km2. The catchment area of Lake Baikal includes territory in both Russia and Mongolia (Figure 1). More than 300 rivers flow into the lake, and the Angara is the only outflow river.
About two-thirds of the surface inflow to the lake comes from three main tributaries: the Selenga, the Upper Angara, and the Barguzin Rivers. The largest of these is the Selenga River; its basin is home to most of the population in the lake’s catchment area, and the Selenga basin has the most developed industry and agriculture.
After the construction of the Irkutsk hydroelectric power plant (Irkutsk HPP) on the Angara River 60 km from Lake Baikal, the water level in the river rose by an average of 0.8 m [33,34] and is now artificially regulated. The filling of the Irkutsk reservoir began in 1956. In the autumn of 1958, the backflow water from the dam reached Lake Baikal. The regulated levels of Lake Baikal during prolonged low-water and high-water periods resulted in anomalously high and low levels. This situation complicated the use of the lake’s water resources for hydropower, the water supply, and navigation, and had negative effects on the Lake Baikal ecosystem. The lowered level of Lake Baikal and the warming of the coastal zone may have contributed to the mass development of the green filamentous algae Spirogyra and endemic sponge disease in the lake [35,36].
To reduce the negative impact of water level disturbances on the Lake Baikal ecosystem, the government of the Russian Federation established normative values of water level fluctuations in 2001 in the range of one meter [37], whereas under natural conditions, these fluctuations can reach 2.02 m [33,38]. However, since 2001, the level of Lake Baikal has repeatedly exceeded the established limits, probably due to both climate instability and insufficiently effective regulation.
Long-term fluctuations in the Lake Baikal level were not like the variations in the lake levels in the northern zone. For example, between 1980 and 2008, while most lakes experienced a decrease in their water levels, Lake Baikal’s water level increased [28].
Simultaneous human and climate impacts on the lake levels create difficulties in regulating the use of the lake’s water resources and negatively affect the lake’s ecology. A good example of addressing these problems for Lake Baikal is Lake Ontario, which is regulated by a hydroelectric power plant built on the St. Lawrence River in 1960. An optimal regulation regime for the level of Lake Ontario was not developed until 50 years after this HPP construction. Presently, this regime considers different water conditions and the interests of a variety of water users [39].

2.2. Input Data

An assessment of the patterns in the long-term and intra-annual variability in the Lake Baikal water level was carried out using instrumental observation data on the mean monthly and annual levels from the Federal Service for Hydrometeorology and Environmental Monitoring (Roshydromet). Lake level observations began in 1869 but were nonuniform in the early period due to irregular measurements and the relocation of hydrological stations. In our study, we used homogeneous data for the 1898–2020 period without missing observations. For the period with the natural level regime (i.e., prior to the HPP construction), the observations were taken from the Baikal station located near the source of the Angara River (Figure 1); for the regulated period, the level values at the eight most representative lake level gauge stations were averaged, considering the adjacent water surface areas. The level values were given in Pacific height system (PHS) units, a local system of normal heights. In the Lake Baikal region, this is about 0.5 m higher than in the Baltic height system.
We also calculated the “conditionally natural” water levels of the lake, i.e., the levels that would not be distorted by the regulating influence of the Irkutsk HPP. To determine these values, we used data on the main components of the water budget of Lake Baikal: the surface water inflow, the outflow from the lake along the Angara River, precipitation on the lake’s surface, and evaporation. We utilized the monthly water discharge of the main tributaries of Lake Baikal: the Selenga, the Upper Angara, and the Barguzin Rivers, as well as the water discharge of the Angara River (Figure 1, Table 1). Before the construction of the Irkutsk HPP, measurements were carried out at the Pashki gauging station, and afterwards, they were carried out at the Irkutsk HPP. Since the basin areas of the two gauging stations differed by only 0.17%, we took their data as uniform. The seasonal averages of the water discharges and level values were used along with the monthly and annual means. In accordance with the intra-annual fluctuations in the lake level, the warm season was defined as lasting from May to October, and the cold season was defined as the period from November to April of the following year. The data on the water budget components for 1956–2020 were obtained from Roshydromet. For the period of 1898–1955, these data were taken from the works of Afanasiev [40,41].

2.3. Methods of Adjusting the Regulated Levels of Lake Baikal and the Angara Runoff to Natural Conditions

The evaluation and elimination of the technogenic disturbances in the water level dynamics is important because it will enable us to determine the most probable pattern of the water level regime that would be observed under natural conditions in the absence of backwater from the Irkutsk HPP. If the influence of the Irkutsk HPP was excluded, the Lake Baikal level without regulation would change according to the ratio of its water budget components, depending on the current climatic conditions. For Lake Baikal, the following components are the main contributors to its budget. The river inflow is the most significant factor, accounting for 80–88% of the inflow part of the lake’s water budget [42]. Precipitation on the lake surface provides another 12–20% of the inflow. The outflow from the lake (73–86% of the discharge part of the budget) occurs through the Angara River. Evaporation from the lake water surface accounts for 14–27% of the discharge. Such components of the budget as groundwater inflow and condensation are insignificant. Therefore, they were ignored in the calculations of Lake Baikal’s inflow and outflow components.
Most of the components discussed above indirectly reflect the impact of climate change. Hence, river runoff and precipitation characterize the change in the total humidification in the lake basin. And evaporation from the water surface is calculated by taking into account the temperature, air humidity, and wind speed. Direct wind distortions of the Lake Baikal level, in turn, do not affect the lake’s monthly average values, as they are of a short-term nature and occur without changing the lake volume.
The reconstruction of the monthly water levels of Lake Baikal was based on the water budget components, which were expressed by their equivalent level height. A computational scheme [38,42] implemented month-by-month calculations of the level changes according to the following equation:
Hк = Ho + Rin + PrRoutE − Δ,
where Ho and Hk are the lake levels at the beginning and end of each time step; Rin and Pr are the river water inflow to the lake and the precipitation; and Rout and E are the river water outflow from the lake and evaporation. To improve the accuracy, the computational scheme was supplemented with the value of the imbalance (Δ) [42], which was generally positive, reaching 3.4% of the inflow in some months, or 8 cm of the level.
To determine the natural values of Rout, a polynomial approximation of the relationship between the measured Angara River discharge (at Pashki) and the lake levels at the Baikal station for 1950–1957 was taken from [42]. This approximation was characterized by a high correlation (R2 = 0.96) and the lowest calculation error (on average, equal to 2.2 cm) compared to the respective non-linear [43,44] and linear dependencies [45].
Using the reconstruction scheme, the monthly values of the water budget components were used to calculate the monthly values of the lake level since 1959. At each stage of the calculations, for each new level value, the Rout value corresponding to the average monthly discharge of the Angara River under natural conditions was determined using polynomial regression.
In contrast to previous analyses [34,38,42], the reconstruction of levels was extended to 2020, and the conditionally natural levels since 1898 (instead of 1960) were analyzed using a combination of reconstructed data and the data observed before the regulation of the Angara River. Similarly, a set of natural and conditionally natural Angara River discharges for 1898–2020 was formed.
In addition, for control purposes, we developed another reconstruction scheme for the annual averaging scale based on multiple linear regression with the lake water budget components. For this purpose, the relationships between the annual levels and different combinations of water budget components were investigated for natural conditions (1901–1958). The relationship equations were in the following form:
H = f(P1, Pj, … Pm), 1 ≤ jm,
where H (m, PHS) is the annual lake level and f is a linear combination of m predictors Pj (km3/year), with the coefficients estimated using the least-squares method. In total, we tested eight forms of such equations with different predictor variables (Table 2). Considering that the level is quite closely related to the inflow in previous years [26], we also analyzed the dependence of long-term level fluctuations on the inflow of two years—the current inflow (Rin i) and the previous one (Rin i−1). For each of the k-variants of the relationship, we evaluated the accuracy of the indicators of the corresponding regression equations using correlation coefficients and standard errors (s) in absolute values and fractions of a standard deviation (σ). The results of the assessment are also presented in Table 2.
The obtained data indicated that, for the natural levels of Lake Baikal, the dependence of the inter-annual water level fluctuations on the volume of surface inflow could be used for practical calculations, as the error in the level determination was much lower than the critical limit (0.674σ). For the variation in the inflow over two years (k = 2), this error decreased to 0.23σ.
The roles of precipitation and evaporation in the formation of the lake level regime were lesser (see Table 2 for k equal to 3 and 4). The accuracy of the regression equation accounting for all three of the considered components of the water budget (k = 5) noticeably decreased in comparison to the regression on the inflow of two years, and practically did not differ from the regression on the inflow values of current years. A similar result was obtained when these three components of the water budget were replaced by one, namely the useful inflow (Rin′ = Rin + PrE, k = 6). In this way, to simplify such calculations, the roles of precipitation and evaporation in the formation of inter-annual level fluctuations can be indirectly included through the useful inflow.
The correlation between the outflow from Lake Baikal through the Angara River source and the lake level (k = 7) was much higher and approached a functional relationship. Since the outflow was a consequence rather than a predictor in this case, this dependence was not suitable for level reconstruction. However, it was useful in diagnosing and describing the fluctuations in the lake level. When both the inflow and outflow were considered (k = 8), the error in the level calculation was reduced to 0.19σ, or 3 cm as an absolute value.
As a result, among all the equations, we used the dependence on the annual inflow of two years (k = 2), with an average calculation error of about 3.5 cm, to reconstruct the annual levels.

2.4. Methods for Analyzing Multi-Year Changes

The time steps between long phases (10–15 years or more) of increased and decreased annual and seasonal water flow were determined using cumulative deviation curves, which are quite widely used for these purposes [46,47,48,49,50,51,52,53]. Cumulative deviation curves (CDCs) represent the cumulative sum of the deviations in a certain characteristic (variable) from its long-term annual average value, calculated for the entire observation period. Often, the deviations are normalized to the coefficient of variation so that the temporal variability in dissimilar characteristics can be compared. Normalized CDCs were calculated using the following formulas:
C D C τ = 1 C v i = 1 τ K i 1
K i = E i / E m
C v = σ E m
σ = 1 n 1 i = 1 n E i E m 2
where CDCτ is the coordinate value of the cumulative deviation curve at time τ; Ei is the value of the i-th term of the series (i = 1, 2 … n); n is the number of terms in the time series; Em is the long-term annual mean of the time series; Ki is the modular coefficient of the i-th term of the time series; Cv is the coefficient of variation of the time series; and σ is the standard deviation of the time series.
In most of the cases considered, the shift points between long-term phases could be determined from the extreme (minimum or maximum) CDC values. These points provide a graphical representation of the transition between the different long-term phases of averages for each of the hydrological characteristics. Estimates of the shift points for contrasting phases were determined earlier for other rivers [30,31,32] by using CDCs and criteria for the uniformity of the mean values in the time series using Student’s t-test [53] and the Mann–Whitney–Pettitt (MWP) test [54]. The results of identifying the shift points of the contrast phases determined using the above set of methods, as a rule, coincided [30,31,32].
To assess the impact of the Irkutsk HPP, the estimated characteristics of water levels and discharge observed under the anthropogenic-transformed regime for 1960–2020 were compared with the corresponding parameters, both during the natural water regime of the lake and after the regulation based on reconstructed data.

3. Results and Discussion

3.1. Reconstruction of Multi-Year Time Series for the Water Level of Lake Baikal and Outflow from the Lake through the Angara River

3.1.1. Reconstructed Monthly and Annual Lake Levels

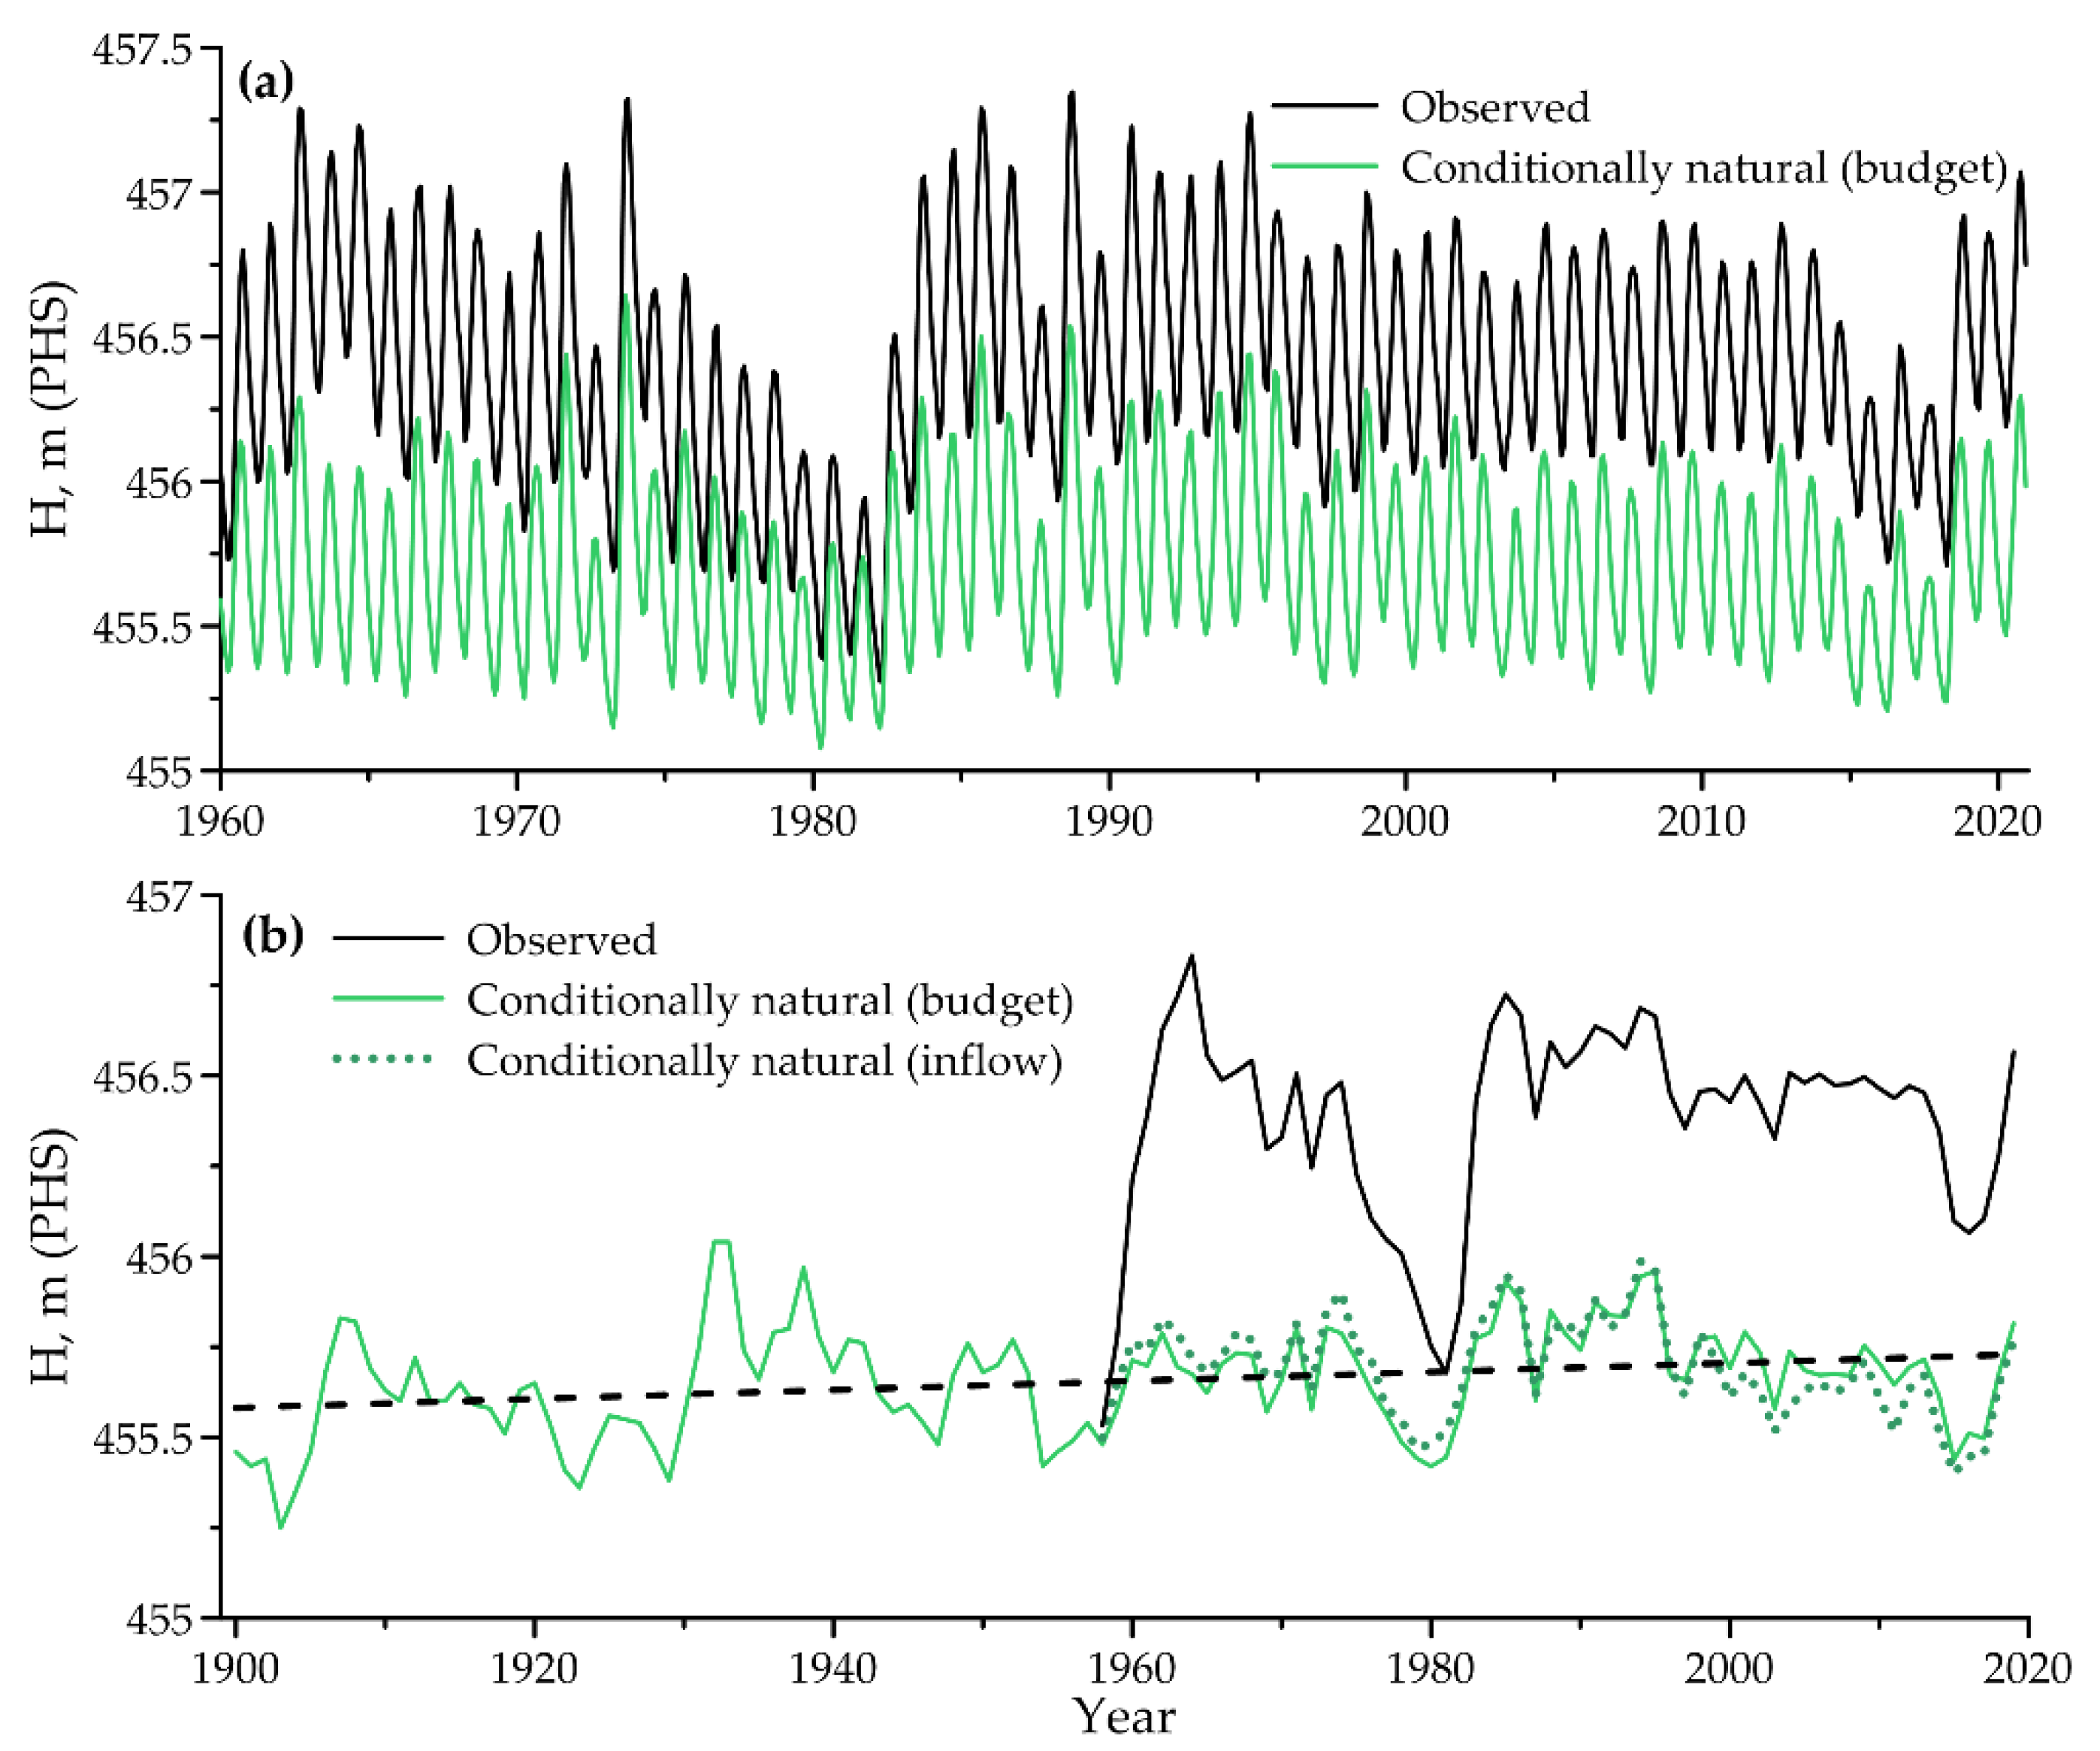
The naturalized (conditionally natural) monthly average levels of Lake Baikal for the period of 1959–2020 (Figure 2a), calculated according to the water budget reconstruction scheme, were used to characterize the most probable pattern of the lake level regime if the influence of the Irkutsk HPP was excluded.
The average level for all the years of the regulated regime, according to the recovery data, was 455.70 m, while the level according to the observed data was 456.40 m. The difference between the two, 0.7 m, characterizes the average level rise due to backwater from the Irkutsk HPP. The lowest reconstructed level was 455.08 m, which occurred in April 1980. The highest level reached was 456.64 m and was recorded in September 1973.
Since 1960, the range in fluctuations for conditionally natural levels has been 1.56 m. However, the observed levels experienced significantly greater fluctuations with a range of 2.04 m. The expansion of the amplitude of fluctuations in the regulated levels reflects the specifics of hydropower regulation, with more intensive water accumulation in autumn and deeper drawdown in spring. For the long-term dynamics of the reconstructed levels, the low standing periods during 1976–1981 and 2014–2017 were weaker than the observed values, although still noticeable.
The average annual levels (Figure 2b) were first calculated based on the monthly average, conditionally natural levels (Figure 2a). Among the monthly reconstructed values, the lowest level (455.42 m) occurred in 1980. The highest level (456.64 m) did not occur in 1973, as in the case of the monthly values, but rather in 1995. The obtained data were in good agreement with the results of the level reconstruction using the annual total water inflow of the three main tributaries of Baikal Lake for two (current and previous) years (Figure 2b). Verification of the results of both schemes, performed for 1949–1958, showed a high accuracy for the average annual level determination according to the water budget scheme of reconstruction. The reconstruction error was 1.9 cm compared to 4.3 cm for the calculations based on the river inflow for two years. Therefore, for the further analysis of the multi-year variability in the conditionally natural levels of Lake Baikal, we used the monthly level values based on the water budget reconstruction.
The naturalization of the water levels of Lake Baikal for the period after regulation allowed a homogeneous time series to be obtained of the undisturbed lake water levels for the entire period of instrumental observations (1898–2020). The analysis of the combined data enhanced the reliability of individual parameter estimates of the variation in the monthly, seasonal, and annual levels of Lake Baikal, especially the long-term variation.

3.1.2. Water Discharge of the Angara River

Based on a significant regression dependence between the mean monthly discharge of the Angara River at the Pashki site and the natural levels of Lake Baikal (see Section 2.4), a more-than-120-year time series of the conditionally natural mean monthly river discharge was obtained (Figure 3). This time series was used to investigate the specific patterns of multi-year changes in the mean seasonal and mean annual discharge of this river flowing out of Lake Baikal.

3.2. Characterization of Multi-Year Level Fluctuations for 1898–2020 by Natural and Conditionally Natural Values

Using the combined data, 123-year lake level time series were obtained for each month and calendar year, and the warm and cold seasons. The important statistical characteristics of the multi-year level variability calculated using these time series are presented in Table 3. The seriality characteristics and transition probabilities were estimated from sub-series representing elevated and reduced states relative to the median level values.
The time series were preliminary analyzed for deviations from the mean values exceeding ± 3σ (Z-score test). Such anomalies were not found in the annual and seasonal (warm- and cold-season) series, which is obviously explained by the significant averaging of the monthly data. In some series of monthly level values, individual cases of anomalous deviations were noted. Such data were not excluded from further calculations, as there were no reasons to consider them incorrect.
The multi-year fluctuations in the three studied series were generally in good agreement. The most significant amplitude of level fluctuations and a higher total variability were characteristic of the warm and cold seasons, respectively (σ = 0.17). This result was confirmed by the lower internal correlation of lake levels for the seasons in contrast to the annual values.
The presence of a significantly positive autocorrelation with 95% confidence indicates that the tendency of grouping of elements in the studied level time series had a non-random origin. This was also indicated by the probabilities of changes in increased and decreased levels, with a high frequency of transitions in years with the same sign. For warm seasons and calendar years, the change from elevated to increased values was the most probable (p = 0.77).
In addition, each of the time series showed a positive trend, with an intensity of about 15 cm per 100 years. Despite its small size, this trend was statistically significant (α = 0.05). It is worth noting that the extreme levels for all three time series were observed in the first half of the studied period. The lowest values were found in 1903, and the highest in 1932.

3.3. Patterns of Multi-Year Changes in Conditionally Natural Annual and Seasonal Levels of Lake Baikal

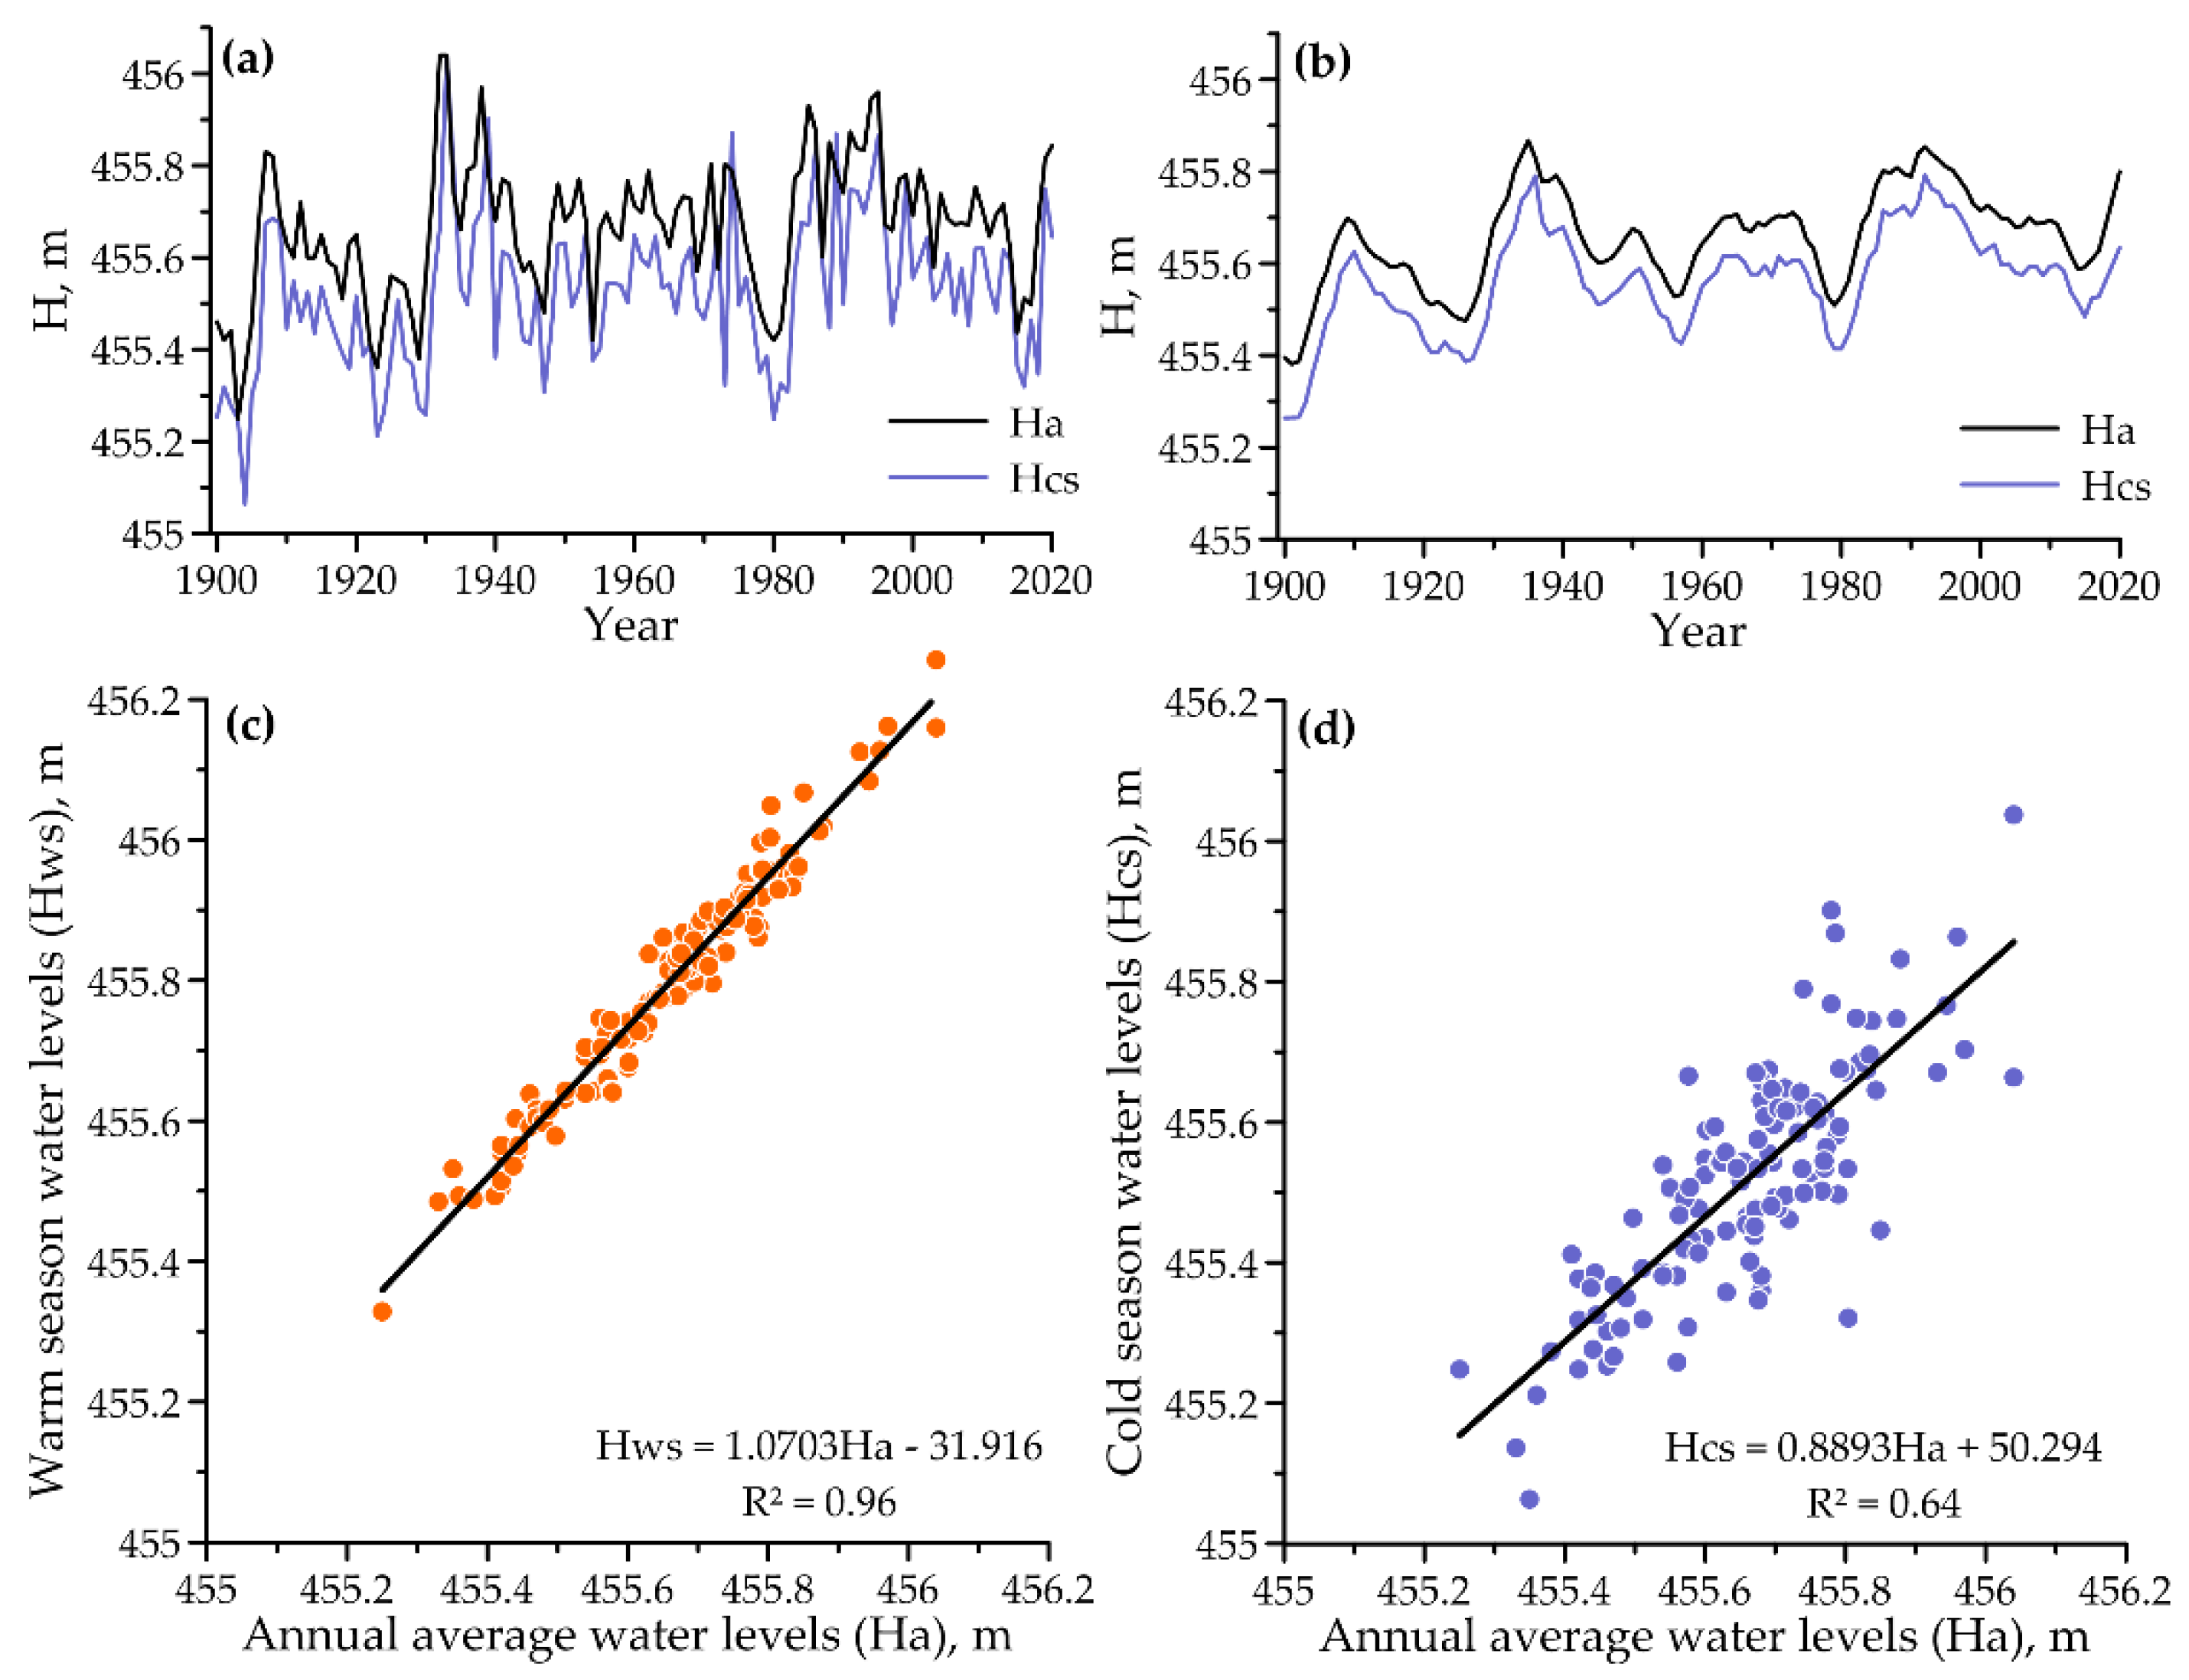
Throughout the entire observation series, there were four short (3–6-year) periods during which there was a sharp increase in the annual lake levels, three rather long periods with a decreasing tendency, and one period without noticeable unidirectional changes (Table 4 and Figure 4a,b).
The multi-year variability in the mean annual and warm-period levels was nearly synchronous (Figure 4c). The degree of synchrony of variation in the cold-period levels with the annual levels was slightly lower (Figure 4d).

3.4. Perennial Variation in Annual and Seasonal Water Discharge of the Angara River and the Three Main Tributaries of Lake Baikal

3.4.1. Multi-Year Variability

The character of perennial variation in the conditionally natural mean monthly, annual, and seasonal water discharges of the Angara River reflected the variation in the corresponding conditionally natural levels of Lake Baikal water due to the strong correlation between the two series.
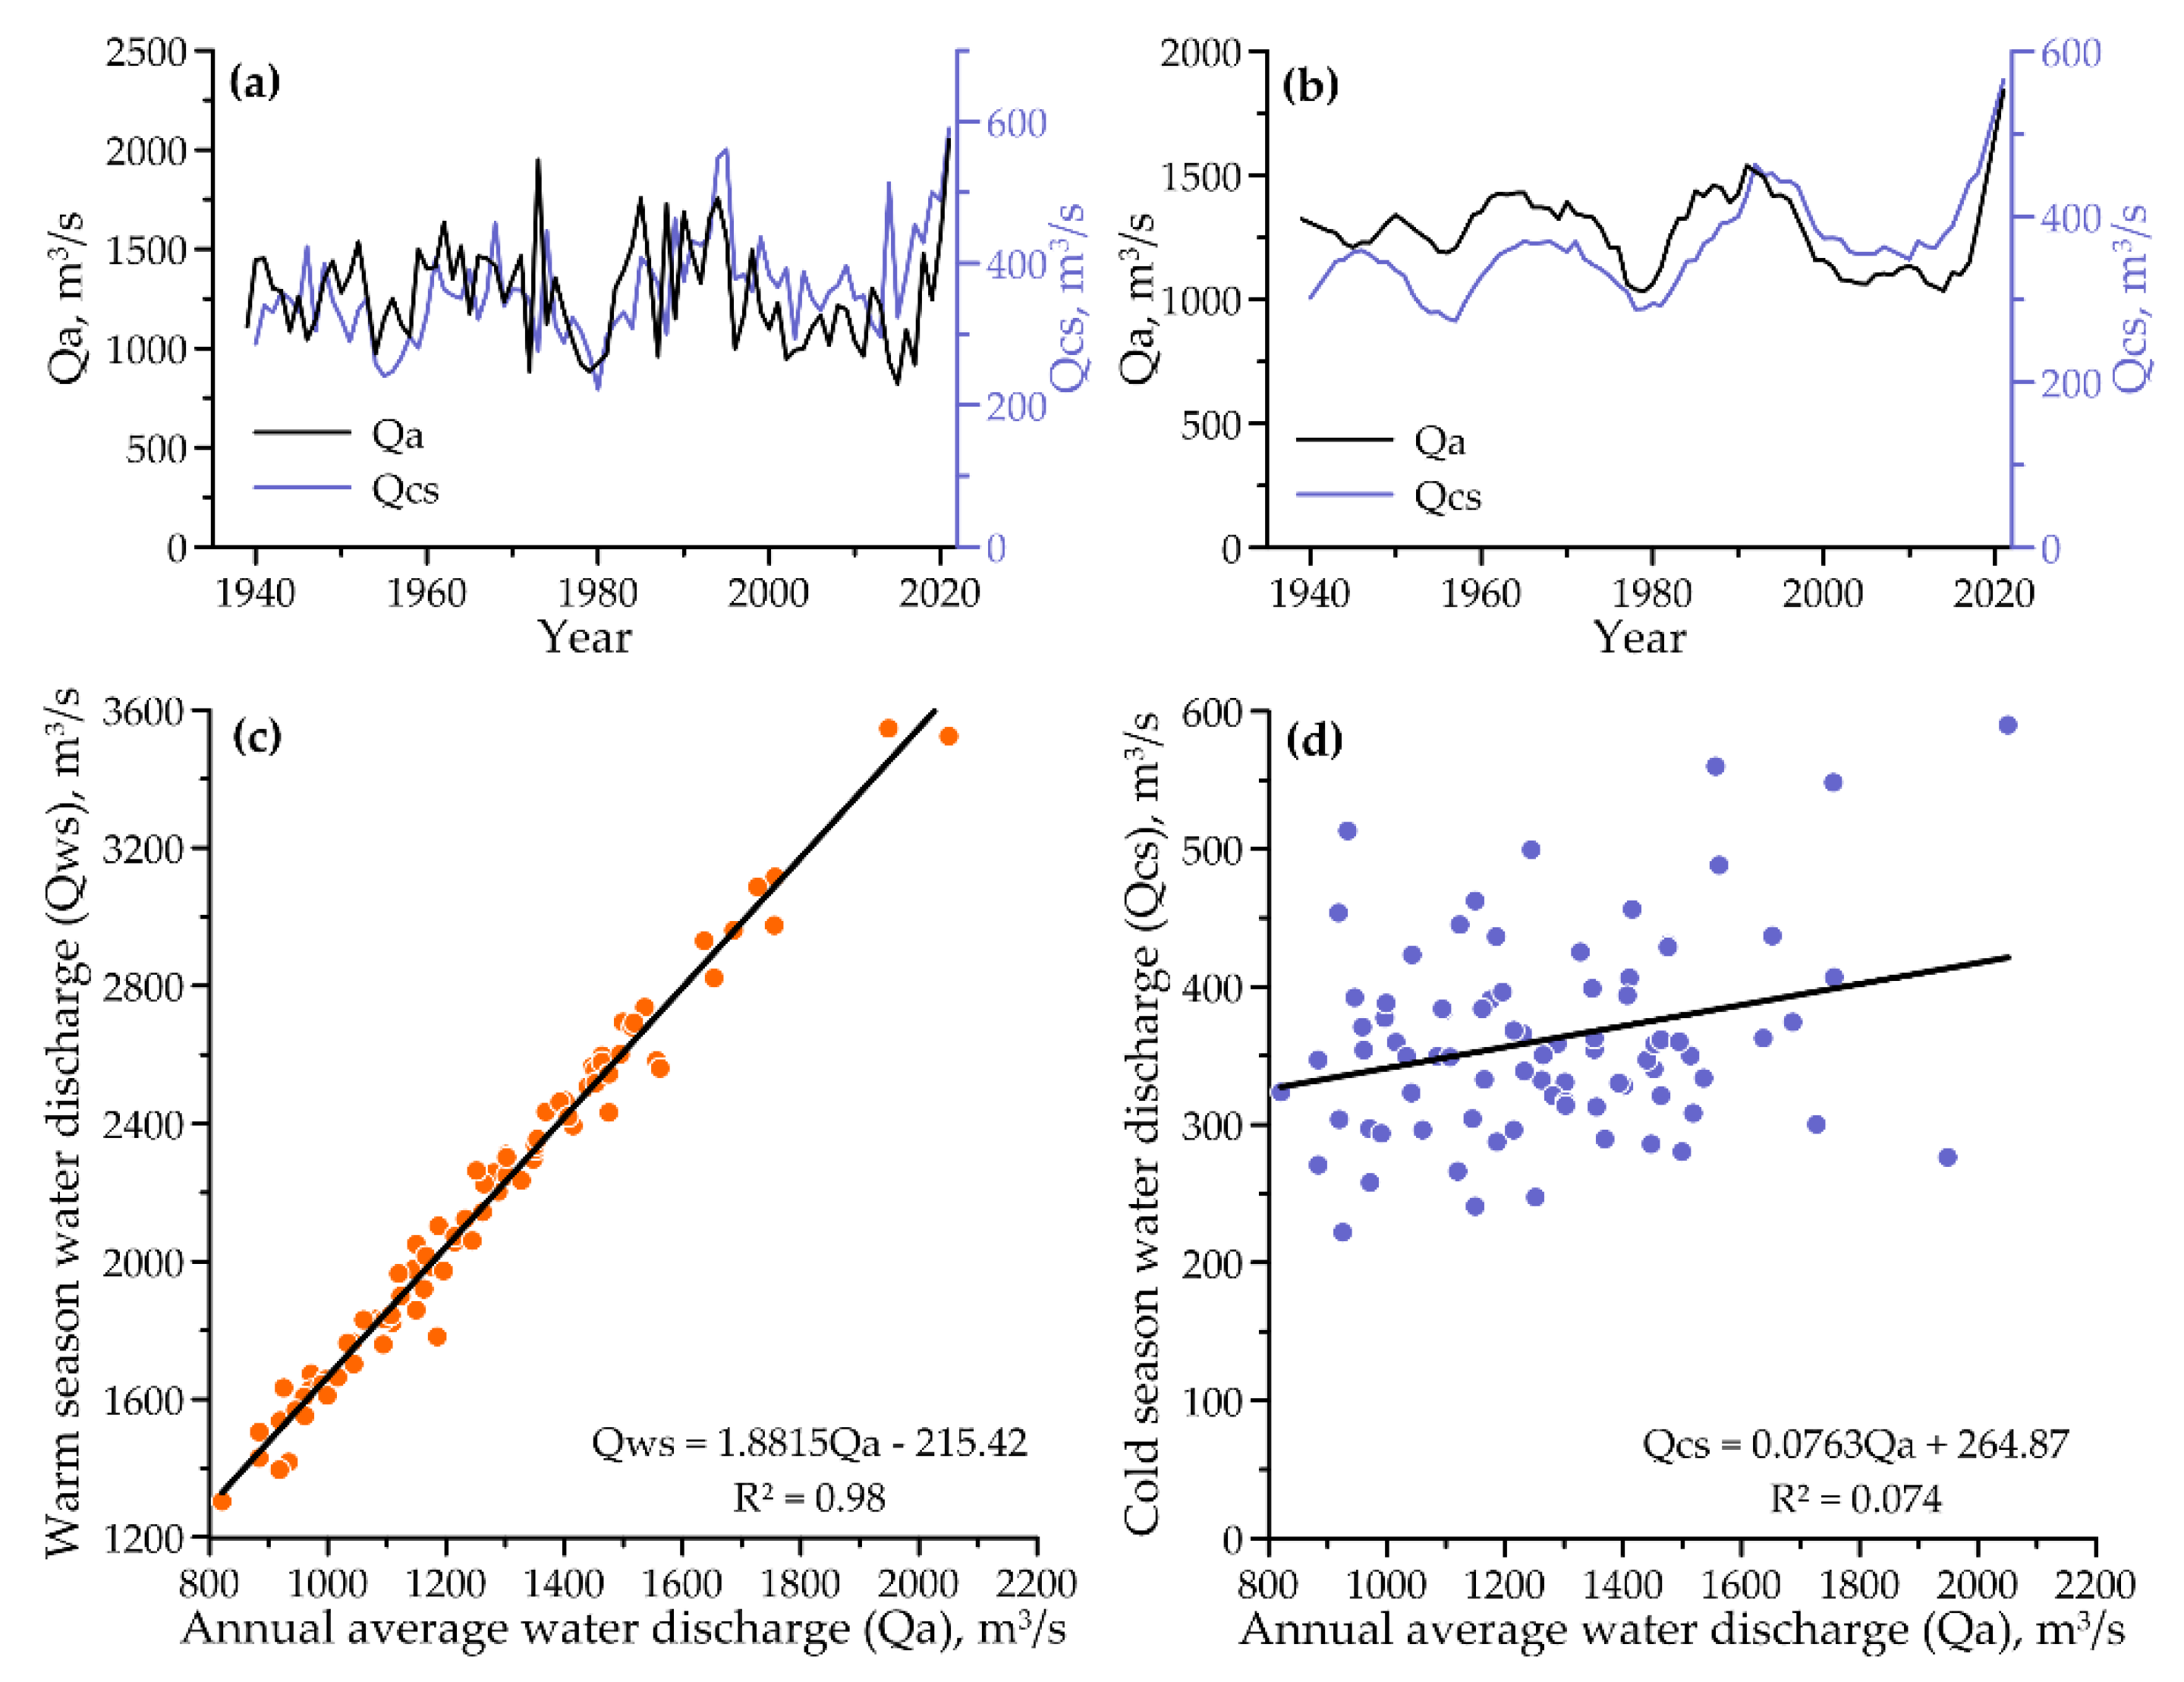
The degree of synchrony of the inter-annual variation, annually and during the warm season, in the mean total water discharge of the Selenga, Barguzin, and Upper Angara Rivers was also very high, as they were highly correlated (Figure 5c). This contrasted with the low correlations between changes in the annual (or warm-season) mean discharge and the cold-season mean discharge (Figure 5a,b,d). However, even in this case, the inter-annual fluctuations in the annual and cold-season water discharge showed quite synchronous changes, except for the beginning of the observation period, when there were asynchronous changes for about fifteen years (Figure 5b).

3.4.2. Long-Term Phases of Annual and Seasonal Water Discharge of the Angara River and Total Water Discharge of the Three Main Tributaries of Lake Baikal

The presence of long-term phases (periods) of increased or decreased annual and seasonal discharge has been investigated for rivers in different regions of Russia [31,32,33]. The duration of such phases varies from 10 years to many decades. The identified contrasting phases are characterized by significant differences (as a rule, statistically significant), not only in the seasonal water discharge, but also in the annual water discharge.
In the Angara River, the sequence of the contrasting phases of the annual and seasonal discharge and their calendar boundaries nearly coincided. The sequences and limits of the contrasting phases of the total water discharge, averaged for an entire year and for the warm season, also coincided for the three Lake Baikal tributaries. However, the phases (although rather short) of the average cold-season water discharge at these rivers during 15 years at the beginning of the observation period and in 2003–2013 were opposite to the phases of water discharge averaged over the year and for the warm season (Figure 6). The duration of the contrasting phases (equal to or exceeding 10 years) varied for the Angara River from 11 to 32 years, and for the total inflow of the three rivers, it varied from 9–10 to 21 years (Appendix A). The Angara water discharge in the high-water phase exceeded the volume in the low-water period by 20–21%, and the total water discharge of the three inflow rivers showed differences between the high- and low-water periods of up to 24–32%. For these rivers, a phase (1961–1974) was identified for their total cold-season discharge, during which the total volume was close to the multi-year average calculated for the entire observation period. Short periods (i.e., significantly less than 10 years) of increased or decreased discharge (and the Lake Baikal levels) were not included in this analysis.

3.5. Coupling of Long-Term Phases of Changes in the Lake Baikal Water Level and Discharge of the Angara River and the Lake Baikal Tributaries

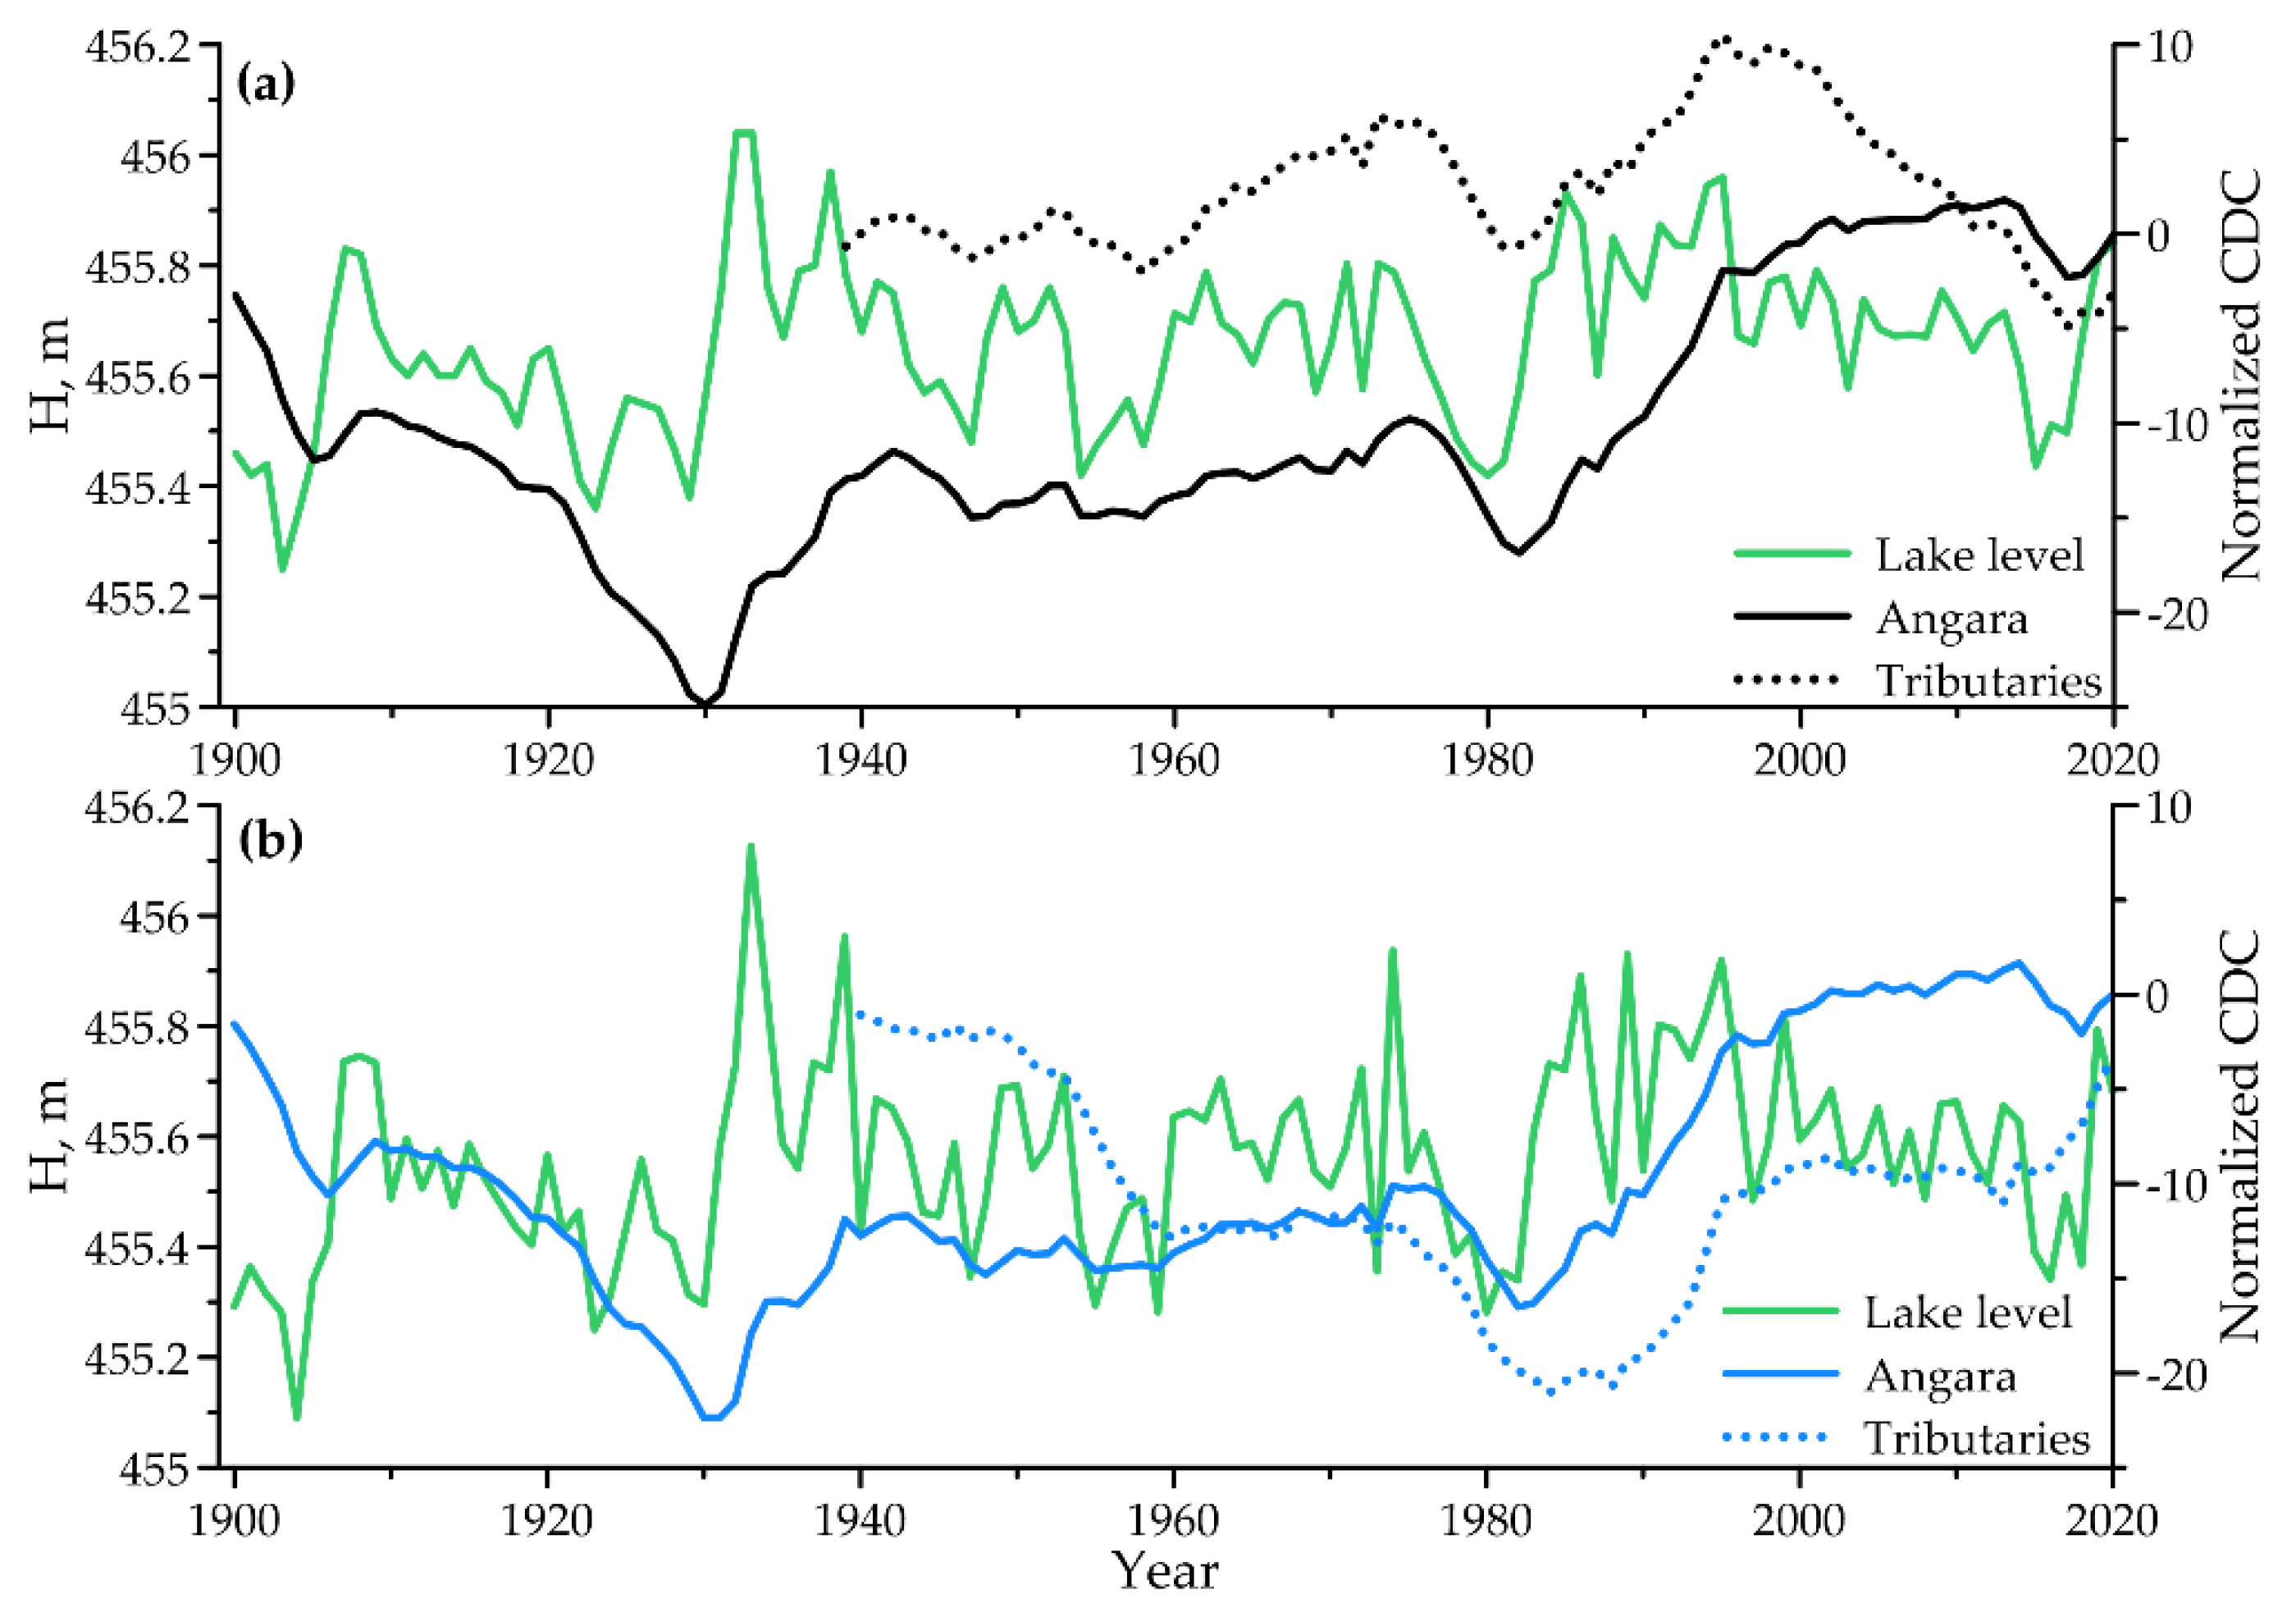
The multi-year inter-annual variation in the mean monthly, seasonal, and annual water levels in Lake Baikal was characterized by a high degree of synchrony with the variation in the corresponding Angara water discharge at Pashki and with the total water discharge of the three main tributaries of Lake Baikal (see Section 3.4.1 and Section 3.4.2). Also, changes in the Lake Baikal water levels were closely related to the long-term phases of decreased or increased water discharges of the above-mentioned rivers (Figure 7).
Long-lasting phases of increased (above the mean multi-year volume calculated for the entire observation period) water discharge, averaged over the year and for the cold season of the rivers under consideration, coincided with prolonged periods of a water level rise in Lake Baikal, and vice versa (Figure 7a,b and Appendix A).
During the phases of decreased average annual, warm-season, and cold-season water discharge of the Angara River and for the total of the three tributary rivers, the Baikal levels were 20–21 cm lower than the levels observed during the phases of increased water discharge of these rivers (Appendix A).

3.6. The Influence of Lake Baikal on Multi-Year Changes in the Intra-Annual Structure of the Angara River Runoff

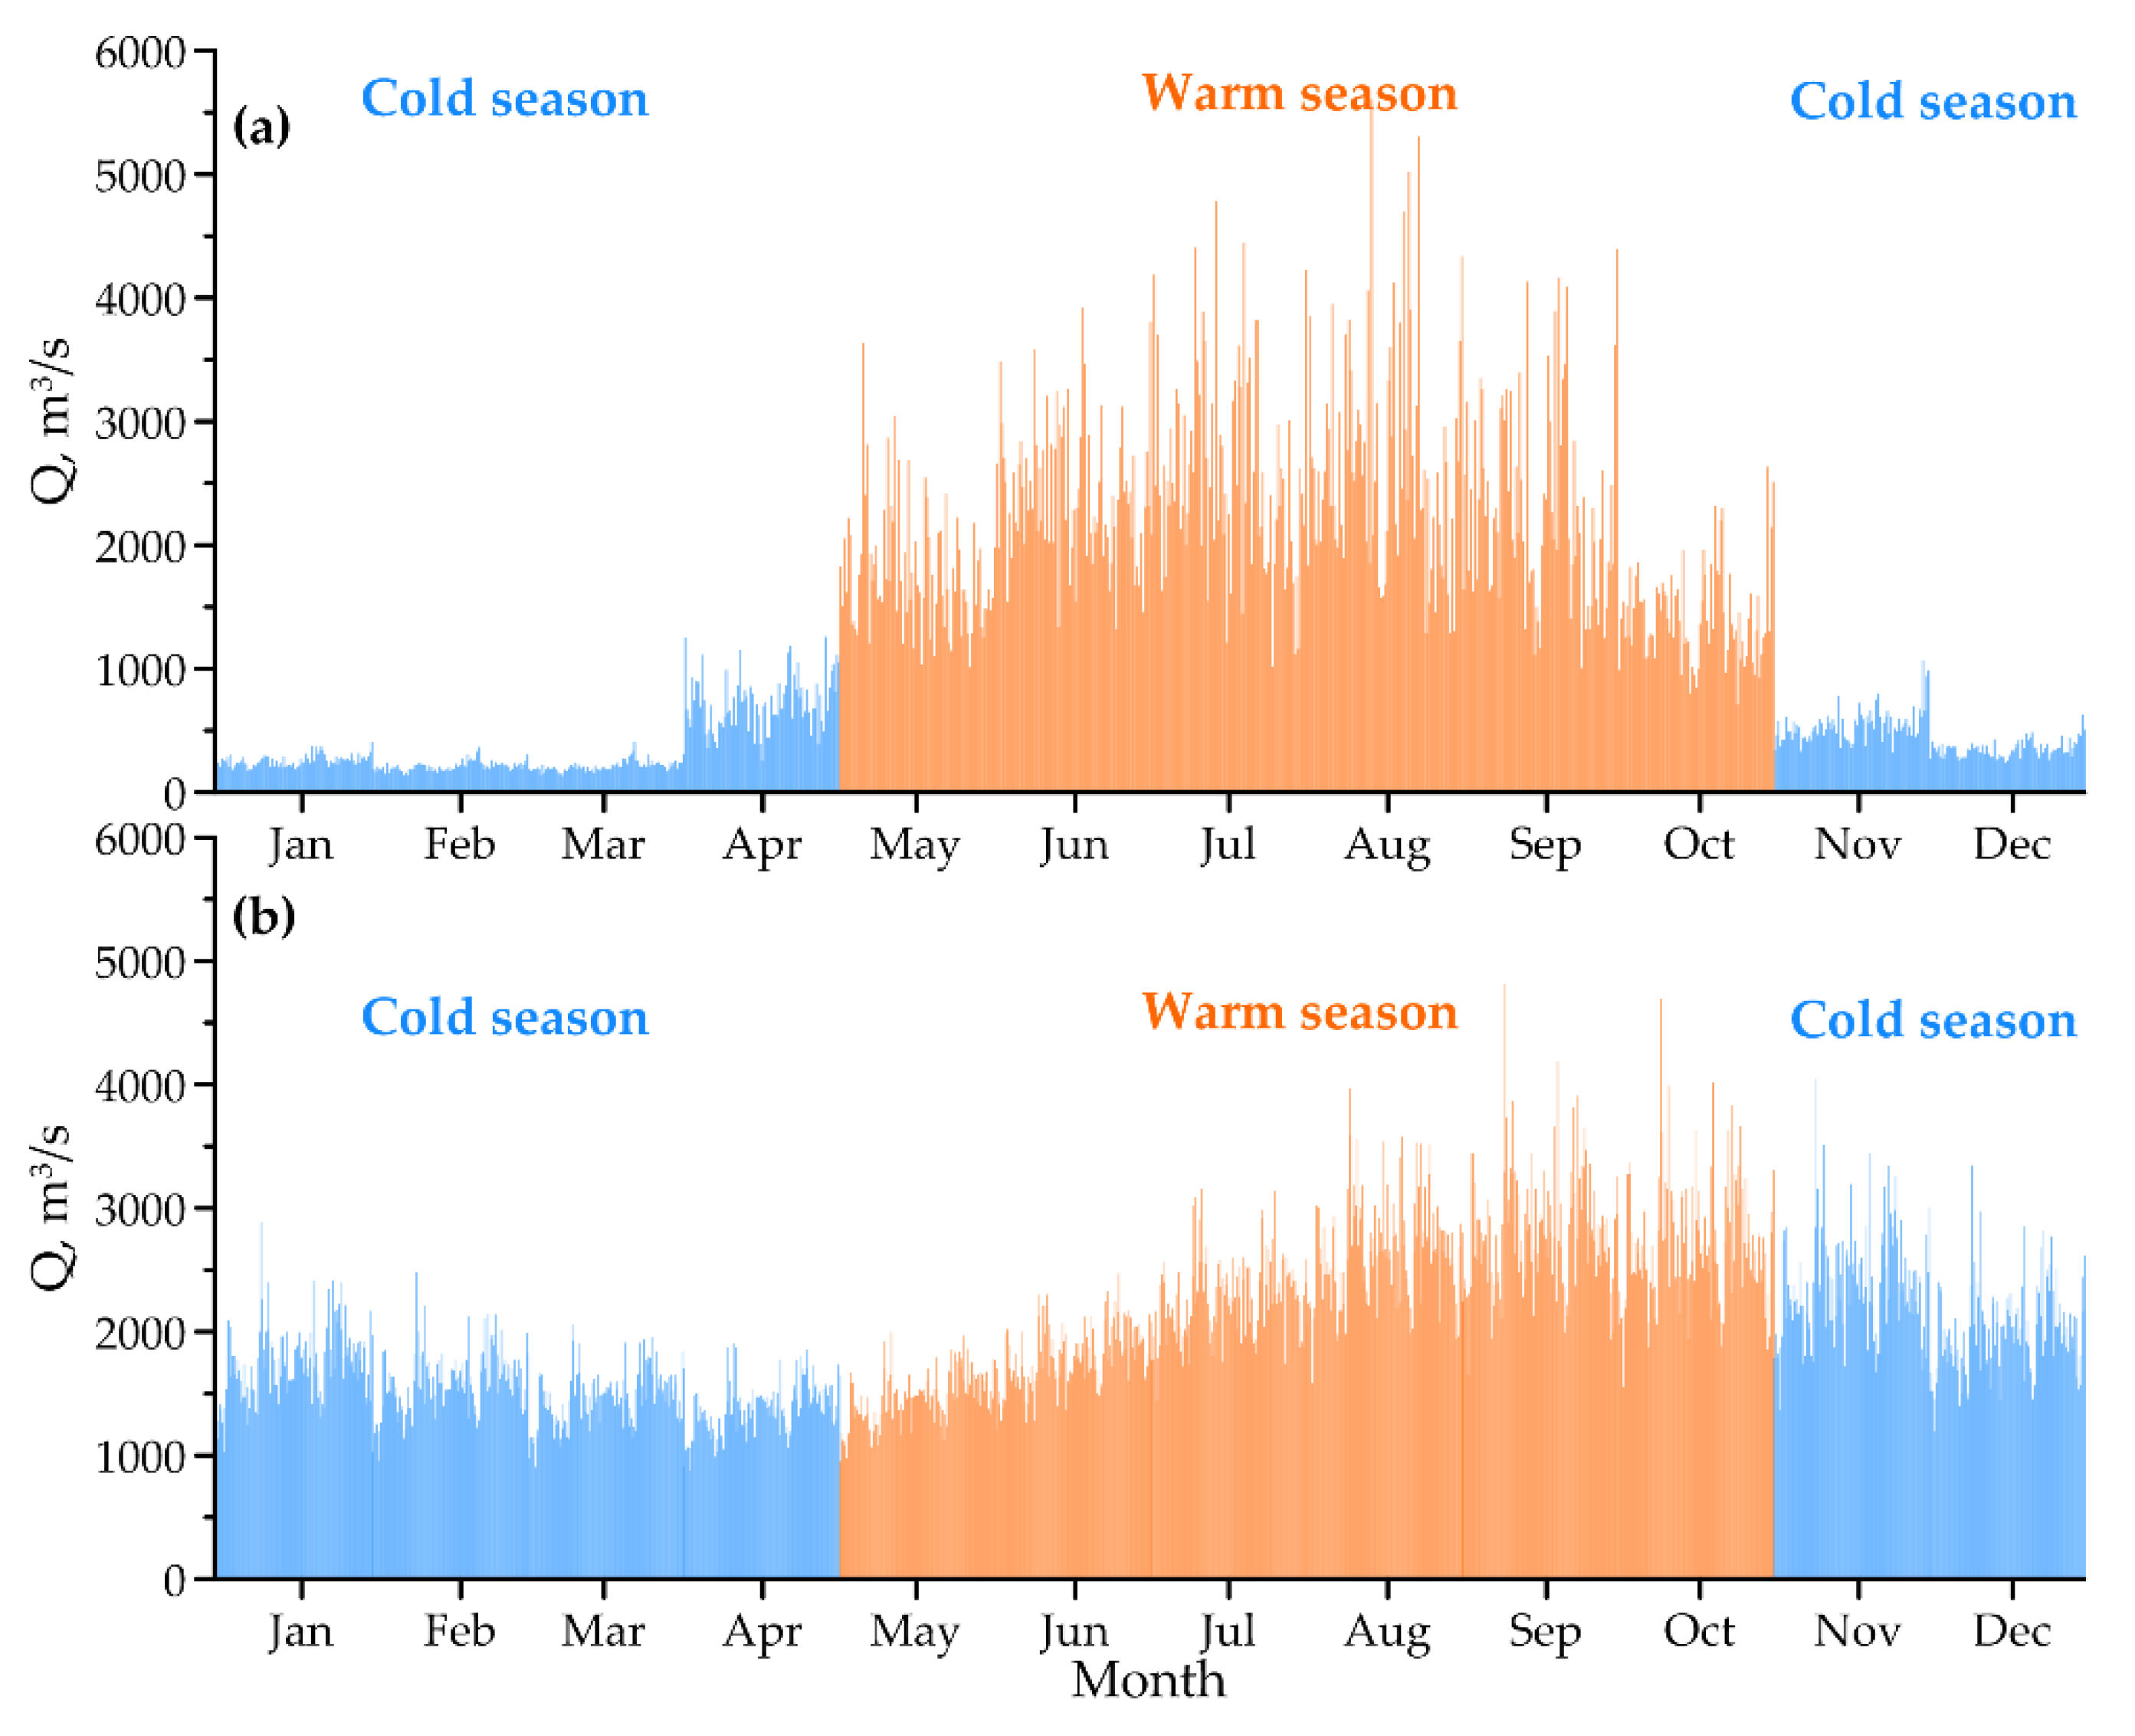
A comparison of the intra-annual distribution of the total average monthly water discharge of the three main tributaries of Lake Baikal and the Angara River showed that the lake significantly affected the total volume (Figure 8). At the same time, when averaging the water discharge for the entire observation period, the share of each of the cold-season months (from November to April) for the tributary rivers was 2–3.6% of the annual runoff (and for the entire cold season, it was 15.4%), while for the Angara River, the share was 5.6–9.6% (and 43.1% for the entire season). For the warm season, these percentages were 74.6% and 56.9%, respectively.
Lake Baikal affected the characteristics of inter-annual variation in the total mean annual and mean seasonal discharge volumes of the three tributary rivers into the Angara River by increasing the synchrony of their multi-year variation (see Section 3.4). The influence of Lake Baikal caused alterations in the character of the prolonged contrasting phases of the total cold-season water discharge so that the limits and sequences of the change periods became (on the Angara River) the same as for the mean annual and mean warm-season water discharge (see Section 3.5).

3.7. Impact of the Irkutsk HPP on the Intra-Annual Distribution of the Level of Lake Baikal and the Angara Discharge

The water level of Lake Baikal after the construction of the Irkutsk HPP has not always complied with the regulation requirements. In cases of high levels, the lake’s coastal areas have flooded, but in cases of an accelerated drop in the level by increasing the discharge through the Irkutsk HPP, there has been a threat of the flooding of objects in the lower reaches of the HPP. The built-up part of the Angara River floodplain near Irkutsk is subject to flooding at water discharge rates of more than 2800 m3/s [33,55,56]. The area of flooding in the lower reaches at a discharge rate of 3000 m3/s is 2728 ha, and at the maximum rate of 6000 m3/s, this increases to 12,620 ha. Thus, during high-water periods, the flow containment by the Irkutsk HPP leads to the level of Lake Baikal exceeding the upper limit of 457 m and flooding its coastline in the zone of variable backwater.
In contrast, during low-water periods, there is an increased risk of the level being below the recommended lower limit of 456 m due to the existing restrictions on the minimum discharge through the Irkutsk HPP. For stable water supply conditions for downstream towns (Angarsk, Usolie-Sibirskoye, and Cheremkhovo), the discharge rate should be at least 1300 m3/s [57]. Furthermore, to secure downstream navigation, these rates should be more than 1500–1700 m3/s [43]. Without a significant reduction in the water level of Lake Baikal, it will not be possible to meet these conditions with a low inflow of surface water.
These restrictions violate the established regulation regimes and have caused unplanned changes in the natural levels of Lake Baikal, thereby preventing the optimal use of its water resources. As a result, the observed regulated levels in Lake Baikal frequently do not comply with the prescribed regulatory rules due to existing technical and regulatory restrictions. One such restriction is the limitation of the minimum and maximum water discharge through the Irkutsk HPP, both in terms of preventing the flooding of territories in the lower reaches and providing a water supply to downstream towns. The other constraint is related to the changing water management regulations to meet ecological requirements, which guarantee compliance only in situations with a near-average water availability.

3.7.1. The Water Levels of Lake Baikal

The seasonal variation in the lake level after regulation changed insignificantly (Figure 9b), but the increase in the winter months was more pronounced than in the summer months. Some of these differences may have been caused by climate change, and thus, a more objective assessment of the changes in the lake level regime could be obtained by comparing the observed post-regulation levels with their conditionally natural values (Table 5 and Figure 10). Compared to the reconstructed levels, the increase in the total variation in fluctuations and the expansion of the range of fluctuations were more prominent for the regulated levels. The total increase in the water level over 1960–2020, averaging 0.7 m, was slightly less than the rise relative to the average level in natural conditions. This characterizes the period of the regulated regime of the lake as being more humid.
The difference between the regulated and the conditionally natural levels of Lake Baikal serves as a clear indicator of the degree of anthropogenic transformation of the level regime of the lake. These differences changed significantly during the period of 1960–2020 (Figure 10a), annually as well as within individual years.
In 1960, the difference had already reached 0.75 m, and in 1963, this exceeded 1 m for the first time. In the following two years, the excess of the actual levels over the reconstructed levels was also greater than 1 m, with a maximum of 1.22 m in January 1965. It should be noted that no differences greater than 1 m have been recorded since that time. Thereafter, the differences in the levels gradually decreased, and in the low-water period of 1976–1981, they were about 0.5 m, with a minimum of 0.14 m in August 1981. In the 1984–2015 period, the excess of the regulated levels over the conditionally natural levels largely varied in the range of 0.7–0.9 m, and in the summer period of low-water years 2016 and 2018, it dropped below 0.5 m. From the beginning of the 21st century until 2015, some stability of the differences was facilitated by the Angara River runoff [38] and “soft” low water conditions in Lake Baikal that have lasted since 1996.
The pattern of the average differences (Figure 10b) shows that the influence of regulation is stronger in winter. In the summer months, the average difference between the observed and reconstructed levels was about 60 cm, and in the winter months, it was about 80 cm. It is worth noting that, in low-water years, the difference between the observed and conditionally natural levels decreased, but it varied significantly by month.
The possible changes in the level of Lake Baikal due to other potential anthropogenic factors are quite small. The main one is a reduction in the river water inflow to the lake due to water consumption by irrigated agriculture and regional industry. Since the beginning of the XXI century, in the Russian part of the lake basin, water withdrawal for domestic use from surface sources has amounted to 0.5–0.7 km3 per year, with irrecoverable losses of 0.1 km3 per year [58]. The water consumption in Mongolia during this period was 0.1–0.6 km3 per year [59], with losses of 50–60%. The total annual reduction in river runoff in the Baikal basin due to water use for economic needs does not exceed 0.5 km3. This value is approximately 1% of the total surface water inflow to the lake and cannot have a significant impact on its water level regime.

3.7.2. Angara Water Discharge at the Irkutsk HPP and at Pashki

The Irkutsk HPP significantly altered both the mean seasonal and mean monthly discharge of the Angara River at Pashki. There was a decrease in the mean warm-season discharge (a difference of more than 20%), while the mean cold-season discharge increased slightly. On the monthly time scale, the decreases in the water discharge in August, September, and October exceeded 30%, while the increases in March and April were about 20%.
The impact of the Irkutsk HPP on the Angara runoff is comparable to the differences in the Angara River runoff during the long phases of its increased and decreased values (Appendix A).
To continue such studies in the future, it is necessary to improve the methods of calculating the water budget components of Lake Baikal (e.g., to employ the modern Global Precipitation Mission product [60,61] for precipitation estimates over the lake surface) and engage satellite altimetry for its level measurements.

4. Conclusions

The inter-annual and seasonal fluctuations in the level of Lake Baikal are formed under the influences of climate variation and the regulation of runoff from the lake at the Irkutsk HPP. Compared to natural conditions, the level after regulation increased by 0.8 m on average, preserving the main features of the intra-annual variability.
An analysis of the relationship between the Lake Baikal level fluctuations and components of its water budget prior to regulation enabled us to reconstruct the natural levels of Lake Baikal and the outflow of the Angara River under natural conditions. As a result, we obtained a homogeneous time series of undisturbed mean monthly lake levels for the entire period of instrumental observations (1898–2020). The analyses of these variations revealed several long-term phases of the lake level’s increase/decrease states and a small, but statistically significant, century-long increasing trend (by 15 cm/100 yr). Although all unidirectional large-scale climatic changes are associated with external (or anthropogenic) forcings, we cannot attribute the revealed trend to any of them. However, given that Lake Baikal stores 20% of all the fresh surface water, this newly found increasing trend should receive further attention.
The character of multiannual changes in the “conditionally natural” mean monthly, annual, and seasonal water discharge of the Angara River closely reflect the changes in the corresponding conditionally natural levels of Lake Baikal. We identified long-term (10–15 years or more) phases of decreased/increased annual and seasonal water discharge by the Angara River. In addition, the total water discharge of the three Baikal tributaries, averaged over the year and the warm season, coincided with the sequences and boundaries of contrasting phases, both among the tributaries and with the corresponding Angara River water discharges. The duration of long-term contrasting phases varied on the Angara River from 11 to 32 years, while on the three inflow rivers, it varied from 9–10 to 21 years.
The Angara River water discharge in the high-water phase exceeded the value in the low-water period by 20–21%, and for the three inflow rivers, these differences were 24–32%. During the phases of decreased average annual water discharge in the Angara River, the water levels of Lake Baikal were 20-21 cm lower than during the phases of increased water discharge.
The Irkutsk HPP significantly transformed both the average seasonal (up to 23%) and monthly (more than 30%) water discharge of the Angara River compared to natural conditions.
To maintain an optimal water level regime for Lake Baikal, it will be necessary to eliminate the existing disadvantages of regulation and establish the principles of water level regulation for different conditions of water availability, considering the changing climatic conditions. Examples of solving similar problems (e.g., for Lake Ontario) allow us to expect a positive water management solution for Lake Baikal as well.

Author Contributions

V.N.S. and A.G.G. developed the research concept, analyzed the results of the calculations, and made the main contributions to the preparation of the manuscript; P.Y.G. and I.A.A. participated in writing several sections of the manuscript; O.O.B. and I.A.A. were involved in data collection and calculations, and participated in the analysis of the calculation results; P.Y.G. and I.A.A. were involved in the preparation of the manuscript and its English version. All authors were involved in the critical review and revision of the manuscript and have approved the final version. All authors have read and agreed to the published version of the manuscript.

Funding

The article is based on the results of studies that were carried out under the State Assignment of the Limnological Institute SB RAS (0279-2021-0004) and the Governmental Order of the Institute of Geography, Russian Academy of Sciences, state assignment FMWS-2024-0007 (1021051703468-8).

Data Availability Statement

The data generated and/or analyzed during the current study are not publicly available for legal/ethical reasons but are available from the first author upon reasonable request.

Acknowledgments

The work of P.G. was partially supported by the U.S. NSF Grant # 2020404 “Belmont Forum Collaborative Research: Coastal OceAn SusTainability in Changing Climate” and # 2127343 “NNA Collaborative Research: Frozen Commons: Change, Resilience and Sustainability in the Arctic” and by NOAA through the Cooperative Institute for Satellite Earth System Studies under Cooperative Agreement NA19NES4320002.

Conflicts of Interest

Author Pavel Y. Groisman was employed by the company Hydrology Science and Services Corporation. The remaining authors declare that the research was conducted in the absence of any commercial or financial relationships that could be construed as a potential conflict of interest.

Appendix A

Table A1. Characteristics of long-term contrasting phases of conditionally natural annual and seasonal water discharge (m3/s) of the Angara River at Pashki, total water discharge (m3/s) of the three main tributaries of Lake Baikal, and the water level of the Lake (m).
Long PhaseRiver Water Discharge/Baikal Lake Water Level, Averaged for:
Whole Year
(January–December)
Warm Season
(May–October)
Cold Season (November–April)
Three river tributaries of Baikal Lake (Selenga, Barguzin, and Upper Angara)
D1973–1981/1150
1995–2016/1123
1973–1981/1997
1995–2016/1863
1940–1960/318
1975–1984/297
2003–2012/350
Daverage11371930322
I1958–1972/13531958–1972/23531985–2002/412
1982–1994/14701982–1994/25402013–2020/442
Iaverage14122447427
Iaverage–Daverage, m3/s275517105
Iaverage–Daverage, in % relative to Daverage24/226/832/5
Phase when mean water discharge is close to discharge for the entire period of observations--1961–1974/367
Mean water discharge for the entire period of observations12722178362
Angara River at Pashki and/or at the Irkutsk HPP
D1899–1929/17901899–1929/20391900–1929/1552
I1930–1942/22861930–1942/26081930–1942/1948
1949–1975/20631949–1975/23321949–1975/1797
1983–2014/21691983–2014/24331983–2014/1911
Iaverage217324581885
Iaverage–D, m3/s383419333
Iaverage–D, in % relative to D21/420/521/5
Mean water discharge for the entire period of observations201022711749
Baikal Lake
D1899–1929/455.541899–1929/455.681900–1929/40
I1930–1942/455.801930–1942/455.961930–1942/455.63
1949–1975/455.691949–1975/455.831949–1975/455.55
1983–2014/455.751983–2014/455.891983–2014/455.62
Iaverage455.75455.89455.60
Iaverage–D, m20.5521.4320.36
Mean water level for the 1898–2020 period 455.66455.80455.52
Notes: I—increased river water discharges or Baikal water level, and D—decreased river water discharges or Baikal water level.

References

  1. Sinha, E.; Michalak, A.M.; Balaji, V. Eutrophication will increase during the 21st century as a result of precipitation changes. Science 2017, 357, 405–408. [Google Scholar] [CrossRef]
  2. Zoljoodi, M.; Didevarasl, A. Water-Level Fluctuations of Urmia Lake: Relationship with the Long-Term Changes of Meteorological Variables (Solutions for Water-Crisis Management in Urmia Lake Basin). Atmos. Clim. Sci. 2014, 4, 358–368. [Google Scholar] [CrossRef]
  3. Tao, S.; Fang, J.; Zhao, X.; Zhao, S.; Shen, H.; Hu, H.; Tang, Z.; Wang, Z.; Guo, Q. Rapid loss of lakes on the Mongolian Plateau. Proc. Natl. Acad. Sci. USA 2015, 112, 2281–2286. [Google Scholar] [CrossRef]
  4. Filatov, N.N.; Viruchalkina, T.Y.; Dianskiy, N.A.; Nazarova, L.E.; Sinukovich, V.N. Variability in the level of the largest lakes of Russia. Dokl. Earth Sci. 2016, 467, 393–397. [Google Scholar] [CrossRef]
  5. Chen, J.L.; Pekker, T.; Wilson, C.R.; Tapley, B.D.; Kostianoy, A.G.; Cretaux, J.; Safarov, E.S. Long-term Caspian Sea level change. Geophys. Res. Lett. 2017, 44, 6993–7001. [Google Scholar] [CrossRef]
  6. Wurtsbaugh, W.A.; Miller, C.; Null, S.E.; DeRose, R.J.; Wilcock, P.; Hahnenberger, M.; Howe, F.; Moore, J. Decline of the world’s saline lakes. Nat. Geosci. 2017, 10, 816–821. [Google Scholar] [CrossRef]
  7. Dorjsuren, B.; Yan, D.; Wang, H.; Chonokhuu, S.; Enkhbold, A.; Davaasuren, D.; Girma, A.; Abiyu, A.; Jing, L.; Gedefaw, M. Observed trends of climate and land cover changes in Lake Baikal basin. Environ. Earth Sci. 2018, 77, 725. [Google Scholar] [CrossRef]
  8. Dorjsuren, B.; Yan, D.; Wang, H.; Chonokhuu, S.; Enkhbold, A.; Xu, Y.; Girma, A.; Gedefaw, M.; Abiyu, A. Observed Trends of Climate and River Discharge in Mongolia’s Selenga Sub-Basin of the Lake Baikal Basin. Water 2018, 10, 1436. [Google Scholar] [CrossRef]
  9. Zou, Z.; Xiao, X.; Dong, J.; Qin, Y.; Doughty, R.B.; Menarguez, M.A.; Zhang, G.; Wang, J. Divergent trends of open-surface water body area in the contiguous United States from 1984 to 2016. Proc. Natl. Acad. Sci. USA 2018, 115, 3810–3815. [Google Scholar] [CrossRef]
  10. Zhao, G.; Li, Y.; Zhou, L.; Gao, H. Evaporative water loss of 1.42 million global lakes. Nat. Commun. 2022, 13, 3686. [Google Scholar] [CrossRef]
  11. Foroumandi, E.; Sameh, V.; Kantoush, A. Investigating the main reasons for the tragedy of large saline lakes: Drought, climate change, or anthropogenic activities? A call to action. J. Arid Environ. 2022, 196, 104652. [Google Scholar] [CrossRef]
  12. Chaudhari, S.; Felfelani, F.; Shin, S.; Pokhrel, Y. Climate and anthropogenic contributions to the desiccation of the second largest saline lake in the twentieth century. J. Hydrol. 2018, 560, 342–353. [Google Scholar] [CrossRef]
  13. Foroumandi, E.; Nourani, V.; Sharghi, E. Climate change or regional human impacts? Remote sensing tools, artificial neural networks, and wavelet approaches aim to solve the problem. Hydrol. Res. 2021, 52, 176–195. [Google Scholar] [CrossRef]
  14. Fangfang, Y.; Livneh, B.; Rajagopalan, B.; Wang, J.; Crétaux, J.-F.; Wada, Y.; Berge-Nguyen, M. Satellites reveal widespread decline in global lake water storage. Science 2023, 380, 743–749. [Google Scholar] [CrossRef]
  15. Williamson, C.E.; Saros, J.E.; Vincent, W.F.; Smol, J.P. Lakes and reservoirs as sentinels, integrators, and regulators of climate change. Limnol. Oceanogr. 2009, 54, 2273–2282. [Google Scholar] [CrossRef]
  16. Ye, X.; Liu, F.; Zhang, Z.; Xu, C. Quantifying the Impact of Compounding Influencing Factors to the Water Level Decline of China’s Largest Freshwater Lake. J. Water Resour. Plan. Manag. 2020, 146, 05020006. [Google Scholar] [CrossRef]
  17. Shiklomanov, I.A. Hydrological Aspects of the Caspian Sea Problem; Hydrometeoizdat: Leningrad, Russia, 1976; 73p. (In Russian) [Google Scholar]
  18. Micklin, P.; Aladin, N.V.; Plotnikov, I. The Aral Sea: The Devastation and Partial Rehabilitation of a Great Lake, 2014th ed.; Springer Earth System Sciences Book; Springer: Berlin/Heidelberg, Germany, 2014; Volume 10178. [Google Scholar]
  19. Moore, M.V.; Hampton, S.E.; Izmesteva, L.R.; Silow, E.A.; Peshkova, E.V.; Pavlov, B.K. Climate Change and the World’s “Sacred Sea”—Lake Baikal, Siberia. BioScience 2009, 59, 405–417. [Google Scholar] [CrossRef]
  20. Groisman, P.Y.; Shugart, H.H.; Kicklighter, D.; Henebry, G.; Tchebakova, N.; Maksyutov, S.; Monier, E.; Gutman, G.; Gulev, S.; Qi, J.; et al. Northern Eurasia Future Initiative (NEFI): Facing the challenges and pathways of global change in the twenty-first century. Prog. Earth Planet. Sci. 2017, 4, 41. [Google Scholar] [CrossRef]
  21. Shimaraev, M.N.; Kuimova, L.N.; Sinyukovich, V.N.; Zechanovcki, V.V. Climate and hydrological processes in Lake Baikal in the 20th century. Russ. Meteorol. Hydrol. 2002, 3, 52–58. [Google Scholar]
  22. Shimaraev, M.N.; Starygina, L.N. Zonal atmospheric circulation, climate, and hydrological processes at Baikal Lake (1968–2007). Geogr. Nat. Resour. 2010, 3, 245–250. [Google Scholar] [CrossRef]
  23. Third Assessment Report of Climate Change and Its Impacts on the Territory of the Russian Federation; High Technology Publ., Roshydromet: St. Peterburg, Russia, 2022; p. 676. (In Russian)
  24. Kouraev, A.V.; Semovski, S.V.; Shimaraev, M.N.; Mognard, N.M.; Legresy, B.; Remy, F. The ice regime of Lake Baikal from historical and satellite data: Relation to air temperature, dynamical, and other factors. Limnol. Oceanogr. 2007, 52, 1268–1286. [Google Scholar] [CrossRef]
  25. Goldman, C.R.; Kumagai, M.; Robats, R.D. (Eds.) Climatic Change and Warming of Inland Waters: Impacts and Mitigation for Ecosystems and Societies; John Wiley & Sons, Ltd. Publications: Hoboken, NJ, USA, 2013; p. 472. [Google Scholar] [CrossRef]
  26. Sinyukovich, V.N.; Sizova, L.N.; Shimaraev, M.N.; Kurbatova, N.N. Characteristics of current changes in water inflow into Lake. Geogr. Nat. Resour. 2013, 4, 350–355. [Google Scholar] [CrossRef]
  27. Tundisi, J.G.; Tundisi, T.M. Limnology; CRC Press: Boca Raton, FL, USA, 2011; p. 888. [Google Scholar] [CrossRef]
  28. Vuglinsky, V.S.; Kuznetsova, M.R. The World’s Largest Lakes Water Level Changes in the Context of Global Warming. Nat. Resour. 2019, 10, 29–46. [Google Scholar] [CrossRef]
  29. International Data Centre on Hydrology of Lakes and Reservoirs. Available online: http://www.hydrolare.net (accessed on 15 December 2023).
  30. Georgiadi, A.G.; Kashutina, E.A.; Milyukova, I.P. Long-term changes of water flow, water temperature and heat flux of the largest Siberian rivers. Polarforschung 2018, 87, 167–176. [Google Scholar] [CrossRef]
  31. Georgiadi, A.G.; Groisman, P.Y. Long-term changes of water flow, water temperature and heat flux of two largest arctic rivers of European Russia, Northern Dvina and Pechora. Environ. Res. Lett. 2022, 17, 085002. [Google Scholar] [CrossRef]
  32. Georgiadi, A.G.; Groisman, P.Y. Extreme Low Flow during Long-Lasting Phases of River Runoff in the Central Part of the East European Plain. Water 2023, 15, 2146. [Google Scholar] [CrossRef]
  33. Nikitin, V.M.; Bychkov, I.V.; Abasov, N.V.; Osipchuk, E.N. Level regime of Lake Baikal: Problems and contradictions. Geogr. Nat. Resour. 2019, 4, 74–83. [Google Scholar] [CrossRef]
  34. Sinyukovich, V.N.; Chernyshov, M.S. Water regime of Lake Baikal under conditions of climate change and anthropogenic influence. Quat. Int. 2019, 524, 93–101. [Google Scholar] [CrossRef]
  35. Timoshkin, O.A.; Malnik, V.V.; Sakirko, M.V.; Boedeker, K. Environmental crisis at Lake Baikal: Scientists diagnose. Sci. First Hand 2014, 5, 75–91. [Google Scholar]
  36. Timoshkin, O.A.; Samsonov, D.P.; Yamamuro, M.; Moore, M.V.; Belykh, O.I.; Malnik, V.V.; Sakirko, M.V.; Shirokaya, A.A.; Bondarenko, N.A.; Domysheva, V.M.; et al. Rapid ecological change in the coastal zone of Lake Baikal (East Siberia): Is the site of the world’s greatest freshwater biodiversity in danger? J. Great Lakes Res. 2016, 42, 487–497. [Google Scholar] [CrossRef]
  37. Russian Government. About Limit Values of Water Level in Lake Baikal at Implementation of Economic and Other Activity: The Order of the Government of the Russian Federation 26.03.2001. № 234; Collection of Legislation of the Russian Federation; Russian Government: Moscow, Russia, 2001; Volume 14, p. 1366. (In Russian)
  38. Sinyukovich, V.N. Recovery of the natural level regime of Lake Baikal after construction of the Irkutsk hydroelectric power plant. Russ. Meteorol. Hydrol. 2005, 7, 47–51. [Google Scholar]
  39. International Lake Ontario–St. Lawrence River Study Board. Options for Managing Lake Ontario and St. Lawrence River Water Levels and Flows: Final Report to the International Joint Commission. Available online: https://ijc.org/en/loslrb (accessed on 15 December 2023).
  40. Afanasiev, A.N. Water Budget of Lake Baikal. In Studies of the Hydrological Regime of Lake Baikal; Publ. of the Academy of Sciences of the USSR, Moscow-Leningrad Publ. House of the Academy of Sciences of the USSR: Moscow, Russia, 1960; pp. 155–241. (In Russian) [Google Scholar]
  41. Afanasiev, A.N. Fluctuations of Hydrometeorological Regime in USSR Territory; Nauka: Moscow, Russia, 1967; p. 230. (In Russian) [Google Scholar]
  42. Sinyukovich, V.N.; Chernyshov, M.S. Current Problems of the Water Level Control in Lake Baikal. Bull. Irkutsk. State Univ. Ser. Earth Sci. 2018, 24, 99–110. (In Russian) [Google Scholar] [CrossRef]
  43. Irkutsk Hydroelectric Power Station on the Angara River; Technical Project. V. 1. Natural Conditions; The Moscow Branch of the Institute Gidroenergoproekt: Moscow, Russia, 1951; p. 220. (In Russian)
  44. Russian Government. Rules for the Use of Water Resources of the Irkutsk Reservoir and Lake Baikal; Publ. of the Moscow University of Environmental Engineering: Moscow, Russia, 2013; p. 168. (In Russian)
  45. Frolov, A.V.; Vyruchalkina, T.Y. Dynamic-stochastical modeling of long-term fluctuations in Lake Baykal levels and Angara River runoff. Water Res. 2017, 44, 380–389. [Google Scholar] [CrossRef]
  46. Andreyanov, V.G. Cyclical fluctuations of annual runoff and their accounting in hydrological calculations problems of runoff calculations. Proc. State Hydrol. Inst. 1959, 68, 3–50. (In Russian) [Google Scholar]
  47. Kundzewicz, Z.W.; Robson, A.J. Change detection in hydrological records—A review of the methodology/Revue méthodologique de la détection de changements dans les chroniques hydrologiques. Hydrol. Sci. J. 2004, 49, 7–19. [Google Scholar] [CrossRef]
  48. Shi, X.; Qin, T.; Nie, H.; Weng, B.; He, S. Changes in Major Global River Discharges Directed into the Ocean. Int. J. Environ. Res. Public Health 2019, 16, 1469. [Google Scholar] [CrossRef]
  49. Garcia, N.O.; Mechoso, C.R. Variability in the discharge of South American rivers and in climate/Variabilité des débits de rivières d’Amérique du Sud et du climat. Hydrol. Sci. J. 2005, 50, 478. [Google Scholar] [CrossRef]
  50. Zhang, Z.; Chen, X.; Xu Chong-Yu Yuan, L.; Yong, B.; Yan, S. Evaluating the non-stationary relationship between Precipitation and Streamflow in Nine Major Basins of China during the past 50 years. J. Hydrol. 2011, 409, 81–93. [Google Scholar] [CrossRef]
  51. Chiew, F.; Siriwardena, L. Trend/Change Detection Software. CRC for Catchment Hydrology, Australia. 2005. Available online: https://toolkit.ewater.org.au/Tools/TREND/documentation (accessed on 5 February 2024).
  52. Zhou, C.; van Nooijen, R.; Kolechkina, A.; Markus Hrachowitz, M. Comparative analysis of nonparametric change-point detectors commonly used in hydrology. Hydrol. Sci. J. 2019, 64, 1690–1710. [Google Scholar] [CrossRef]
  53. Stepanek, P.A. Clim-Software for Time Series Analysis. Department of Geography Fakulty of Sciences Masaric University Brno. 2008. Available online: https://en.freedownloadmanager.org/Windows-PC/AnClim.html (accessed on 5 February 2024).
  54. Pettitt, A.N. A non-parametric approach to the change-point problem. J. R. Statist. Soc. 1979, 28, 126–135. [Google Scholar] [CrossRef]
  55. Saveliev, V.A. Modern Problems and the Future of Hydropower in Siberia; Novosibirsk Science Publisher: Novosibirsk, Russia, 2000; p. 200. (In Russian) [Google Scholar]
  56. Abasov, N.V.; Bolgov, M.V.; Nikitin, V.M.; Osipchuk, E.N. Level regime regulation in Lake Baikal. Water Res. 2017, 44, 537–546. [Google Scholar] [CrossRef]
  57. Ministry of Land Reclamation and Water Resources of the Russian Federation. The Basic Rules for the Use of Water Resources in the Reservoir of the Angarsk Cascade of Hydroelectric Power Stations (Irkutsk, Bratsk and Ust-Ilimsk); RV-269-87: Approved by the order of the Minister of Land Reclamation and Water Resources of the RSFSR 30.11.1987; Minvodhoz of the Russian Federation: Moscow, Russia, 1988; 65p. (In Russian)
  58. Rybalsky, N.G.; Omelianenko, V.A. (Eds.) Water Resources and Water Management of Russia in 2018 (Statistical Handbook); NIA Priroda: Moscow, Russia, 2019; 274p. (In Russian) [Google Scholar]
  59. Mongolian Statistical Yearbook 2018. Mongolian Statistical Information Service, Ulaan Baatar, Mongolia, 2019; 612p. Available online: https://www.nso.mn/en (accessed on 5 February 2024).
  60. Adler, R.F.; Gu, G.; Sapiano, M.; Wang, J.-J.; Huffman, G.J. Global Precipitation: Means, Variations and Trends During the Satellite Era (1979–2014). Surv. Geophys. 2017, 38, 679–699. [Google Scholar] [CrossRef]
  61. Janney, D. Monitoring Freshwater Resources from Space. Earth Sci. 2021, 38, 16–18, 21-3 Fall TES WEB. [Google Scholar]
Figure 1. Lake Baikal basin. River-gauging stations: 1—Angara at Irkutsk HPP, 2—Angara at Pashki, 3—Selenga at Mostovoy, 4—Barguzin at Barguzin town, 5—Upper Angara at Upper Zaimka; and 6—lake level station at Baikal.
Water 16 00560 g001
Figure 2. Observed and conditionally natural water levels of Lake Baikal, calculated from the water budget and from two years’ inflow: (a) average monthly levels; (b) average annual levels. The straight dashed line is the trend line.
Water 16 00560 g002
Figure 3. Multi-year variation in the average annual (Qa), warm (Qws), and cold (Qcs) seasons of the conditionally natural water discharge of the Angara River.
Water 16 00560 g003
Figure 4. Multi-year variation in the conditionally natural levels of Lake Baikal: (a) annual (Ha) and cold-season (Hcs) averages; (b) their 3-year moving averages; (c) the correlation between the annual and warm-season levels; and (d) the correlation between the annual and cold-season levels.
Water 16 00560 g004
Figure 5. Multi-year variability in conditionally natural total water discharge of three main Baikal tributary rivers: (a) annual (Qa) and cold-season (Qcs) averages; (b) their 3-year moving averages; (c) correlation between annual and warm-season discharges; and (d) correlation between annual and cold-season discharges.
Water 16 00560 g005
Figure 6. Long-term phases (in the form of normalized cumulative deviation curves, CDCs) of water discharge for the Angara River and for three main Lake Baikal tributaries, averaged over the entire year, the warm season, and the cold season.
Water 16 00560 g006
Figure 7. Multi-year changes in the conditionally natural water level of Lake Baikal and water discharges (in the form of normalized cumulative deviation curves, CDCs) of the Angara River and the three tributaries of Lake Baikal, averaged over (a) the entire year and (b) the cold season.
Water 16 00560 g007
Figure 8. Intra-annual distribution of conditionally natural mean monthly water discharge, Q m3/s: (a) total of the three tributary rivers of Lake Baikal and (b) the Angara River at Pashki. Each month represents data for the entire observation period.
Water 16 00560 g008
Figure 9. (a) Mean annual levels of Lake Baikal for the period of instrumental observations; (b) averaged intra-annual variation in the level for (1) 1898–1958 and (2) 1960–2020.
Water 16 00560 g009
Figure 10. (a) Annual and monthly excess of regulated levels over conditionally natural levels; (b) monthly reconstructed and observed lake levels, averaged over the 1960–2020 period. Numbers in circles show the differences in cm.
Water 16 00560 g010
Table 1. Basic information on the data used in the study.
Lake, RiverGauge StationBasin Area, km2Period of ObservationsLong-Term Conditionally Natural Annual Means
Baikal LakeBaikal540,000
31,500 *
1898–2020Level: 455.66 m, PHS
Volume: 23,000 km3
Angara River **Pashki
Irkutsk HPP
572,000
573,000
1898–1958
1959–2021
Discharge: 2010 m3/s
Selenga RiverMostovoy440,0001936–2021Discharge: 888 m3/s
Barguzin RiverBarguzin19,8001934–2021Discharge: 123 m3/s
Upper Angara RiverUpper Zaimka20,6001939–2021Discharge: 268 m3/s
Notes: *—water surface area of the lake; **—time series of Angara River water discharges are attributed to both mentioned gauge stations.
Table 2. Regression equations for lake level calculation via water budget components.
Equation Number (k)PredictorsResulting EquationCorrelation Coefficients, cms/σ
1Rin i0.0126Rin i + 454.890.868.40.52
2Rin i, Rin i−10.00911Rin i + 0.0077Rin i−1 + 454.650.973.60.23
3Pri0.0426Pri + 455.220.5112.50.78
4Ei0.026Ei + 455.370.2215.90.98
5Rin i, Pri, Ei0.0133Rin i − 0.0063Pri + 0.0097Ei + 453.830.868.40.51
6Rin0.0111Rini + 454.980.848.80.54
7Rout i0.0154 Rout i + 454.690.983.20.20
8Rin i, Rout i0.0081Rin i + 0.0082Rout i + 454.600.983.00.19
Table 3. Internal parameters of natural and conditionally natural levels (1898–2020).
ParametersCalendar YearWarm SeasonCold Season
Highest level, m456.04456.26456.04
Lowest level, m455.25455.33455.06
Amplitude, m0.790.930.98
Average value, m455.65455.79455.52
Standard deviation, m0.150.170.17
Total number of sub-series323048
Longest sub-series, years181515
Average length of sub-series, years3.844.102.54
Probability of changing an increased value to an increased value0.770.770.63
Probability of changing an increased value to a decreased value0.230.230.37
Probability of changing a decreased value to a decreased value0.720.750.61
Probability of changing a decreased value to an increased value0.280.250.39
Correlation coefficient of adjacent values0.720.590.49
Table 4. Characteristic periods of multi-year changes in the conditionally natural annual water level of Lake Baikal for the period of 1899–2020.
Direction of Changes in LevelPeriod, Years/Change in Level, cm
Increase1903–1907/581929–1932/661980–1985/522016–2020/40
Decrease1908–1929/471933–1947/461986–2015/49
No noticeable changes1948–1979
Table 5. Statistical characteristics of variation in average monthly regulated and conditionally natural levels (1960–2020).
CharacteristicsConditionally NaturalRegulated
Highest level, m PHS456.64457.35
Minimum level, m PHS455.08455.31
Average level, m PHS455.70456.40
Fluctuations range, m1.562.04
Annual amplitude of fluctuations, m:
 Average0.740.82
 Maximum1.491.62
 Minimum0.350.35
Mean standard deviation, m0.300.39
Correlation coefficient of adjacent months0.890.91
Disclaimer/Publisher’s Note: The statements, opinions and data contained in all publications are solely those of the individual author(s) and contributor(s) and not of MDPI and/or the editor(s). MDPI and/or the editor(s) disclaim responsibility for any injury to people or property resulting from any ideas, methods, instructions or products referred to in the content.